1. Introduction
Additive manufacturing (AM) is the current state-of-the-art in manufacturing and has revolutionized many industries. Key advantages of AM include significant economic benefits due to a reduction in the waste material produced during manufacturing, lower production time, elimination of complex tools, and lower energy cost and feasibility of complicated and advanced designs that are not feasible with traditional manufacturing [
1,
2,
3]. Additive processes, as opposed to subtractive processes, involve the building of parts layer by layer [
4,
5,
6]. The AM technique that is investigated in this study is stereolithography. The underlying principle of this technique is photopolymerization, wherein a liquid photopolymer resin gets converted to a solid polymer when exposed to ultraviolet laser radiation [
7]. Analogous to other AM techniques, the final part is formed by successive layer addition [
8]. Each layer of the resin material is cured, which refers to the process of hardening of material due to the crosslinking of polymer chains, and the curing process continues for the next layer [
9,
10]. The overlap of the cured layers results in the final part. This technique produces 3D objects with excellent surface finish, and very low stair-stepping effect, which makes it suitable in various biomedical and aerospace applications. For example, aeroelastic airfoils, cabin accessories, seatbacks, and entry doors are some aerospace products that can be produced using SLA [
8]. Biodegradable and biocompatible polymers can be used for the production of scaffolds and many other medical applications like surgical tools, hearing aids, and dental appliances [
10,
11,
12]. An intrinsic property of AM is mechanical anisotropy, which results in varied mechanical properties in different orientations since parts are built by layer addition [
3]. This anisotropic behavior could be desirable or undesirable given design and application needs. The outcome of this project is to determine the level of mechanical anisotropy and evaluate the effectiveness of SLA for repeatability of manufacturing parts with as low anisotropy as possible. Having a lower anisotropy would ensure that properties of the manufactured product are uniform along different directions [
2]. Consequently, the quality of products produced using SLA can be significantly improved by controlling parameters appropriately for the type of application, and this could also potentially lower the cost of production in the long run. As a result, SLA can grow and consequently be used in more industries and wider applications.
In addition to anisotropy, surface finish plays a very important role, especially in sensitive applications such as in the aerospace industry. Surface roughness is an important parameter that defines the wear of the part when the parts are dynamically loaded in contact with other parts. Furthermore, roughness determines the fatigue life of the parts under dynamic mechanical or thermo-mechanical cyclic load [
13].
Anisotropy has been the subject of evaluation for additively manufactured parts for many years [
1,
2,
3,
14]. In particular, in the area of polymers, Dulieu-Barton and Fulton analyzed the influence of different experimental parameters such as environmental variations, post-cure time, and batch variations on the mechanical properties of specimens manufactured by SLA [
14]. They found that if layers are transverse to the axis of loading, the highest values for tensile strength and Young’s modulus were achieved. Furthermore, cure time and controlling the humidity and temperature of the curing environment were found to be critical parameters. They observed that the anisotropy can be minimized to as much as 3% if the part is kept in a controlled environment and properties are not influenced by the post-cure time. Melchels et al. also examined the fundamentals of stereolithography, the unique features of this technique relative to other additive manufacturing techniques, and its numerous applications in the field of biomedical engineering [
15].
Cuesta et al. analyzed the impact of different experimental parameters such as resin type, layer height, part orientation, and cleaning operations in the micro-SLA process, which refers to SLA for small scale production in the medical, dental, and jewelry fields [
16]. They concluded that it was imperative to judiciously control the different printing parameters to improve the micro-SLA process. Lan et al. established the design criteria for suitable fabrication orientations using SLA, considering the surface quality, build time, and support structures [
17]. They discovered that sloped surfaces manufactured by SLA produce parts with stepped surface texture, which can be reduced by orientating features either vertically or horizontally. They proposed two criteria to evaluate the surface quality. The first one maximized the area of non-stepped surfaces and the second one minimized the area of the worst quality.
Quintana et al. studied the influence of build orientation parameters on the mechanical properties of SLA manufactured parts, designed by ASTM D-638 type 1 configuration using a statistical design of experiments (DOE) [
18]. Their DOE tested three independent factors which were axis, layout, and position. They observed that axis and position did not have a significant influence on the UTS or E values from a statistical analysis of the experimental data. However, the layout, either flat or edge, had a statistically significant impact on the UTS and E values, and the differences were around 3.53% for the UTS values and 4.59% for the E values. They concluded that the SLA parts cannot be considered as isotropic from a statistical viewpoint, although the differences appear to be negligible. Puebla et al. investigated the effect of aging, preconditioning, and build orientation on the mechanical properties of SLA manufactured parts, designed by ASTM D-638 type 1 configuration, using a design of experiments (DOE) and random tensile testing of the samples [
19]. They observed that the samples that had been aged the least (4 days) and preconditioned based on ASTM recommended standards had the lowest values of UTS. Furthermore, the samples with an orientation of flat, wherein the layers were oriented along the thickness of the samples, recorded the lowest UTS and E values, and were statistically different from samples with orientations of edge or vertical. The samples with vertical orientation, wherein the layers were oriented along the length of the sample, generated the highest values of UTS and E. They concluded that conventionally manufactured SLA specimens cannot be classified as isotropic since the different orientations of the layers generated statistically different mechanical properties.
Saleh et al. evaluated the mechanical properties of two rapid prototyping (RP) techniques, stereolithography (SLA), and laser sintering (LS) [
20]. They observed that SLA samples were isotropic by performing tensile, flexure, and impact tests for different build orientations of flat, edge, and upright. On the other hand, they discovered that LS samples were anisotropic. Hague et al. evaluated the mechanical properties of two state of the art stereolithography (SLA) resins for purposes of end-use parts, Accura SI40 and SL7560, and investigated the degree of anisotropy [
21]. They observed that parts fabricated by both SL7560 and Accura SI40 can be classified as isotropic and therefore, different build orientations such as edge, flat, or upright, do not significantly impact mechanical properties.
SLA, although in existence for the last couple of decades, is still relatively new and not sufficiently explored to fully comprehend the influence of experimental parameters such as angular orientations on the mechanical properties. Although the degree of mechanical anisotropy for SLA parts has been evaluated by other researchers, contradictory conclusions have been drawn [
7,
18,
19,
20,
21]. In this project, a thorough effort was made to determine the level of mechanical anisotropy and evaluate the effectiveness of SLA for repeatability of manufacturing parts with as low anisotropy as possible. Since this manufacturing technique already possesses several key advantages over conventional methods, exploring how variations in experimental parameters impact the mechanical properties, can help in further improving products by tailoring experiments to get superior mechanical properties. The current project aims to remove any ambiguity and unequivocally establish the isotropic or anisotropic nature of SLA parts. Additionally, since adequate research has not been conducted on the influence of angular orientations around different principal axes on the mechanical properties, this current project strives to thoroughly investigate the influence of angular orientations on the mechanical properties of SLA parts through a thorough design of experiments, mechanical testing, and comprehensive statistical analysis. The influence of these different build parameters is extended beyond the standard mechanical properties such as UTS, E, and percentage elongation, to physical characteristics such as surface roughness.
5. Data Analysis and Discussion
Although the graphs represent visual representation of the data, they do not offer much insight into the significance of the various measurements. Since the objective of this project is to determine the level of anisotropy that exists in the parts manufactured by SLA, it is necessary to qualitatively analyze the measurements taken for the different orientations. The analysis of variance (ANOVA) method was performed to investigate the influence of the different independent variables on the different response variables [
27,
28,
29]. The fundamental principle behind ANOVA is hypothesis testing. By comparing the dependent variable’s means at each of the different factor levels, ANOVA can determine the significance of the factors. Similar to other statistical tests that use hypothesis testing, ANOVA tests both the null and the alternate hypothesis. The means of all the factor levels are the same in the null hypothesis, while at least one factor level’s mean is different in the alternate hypothesis. As the name implies, ANOVA uses variances to check if the means are different. ANOVA will determine whether one can reject the null hypothesis, which implies that one accepts the alternate hypothesis. Rejecting the null hypothesis implies that the independent variable is significant and that it influences the dependent variable statistically. Given the combination of the factors and elimination of duplicates, the Taguchi design of experiments, which employs a fractionated orthogonal array [
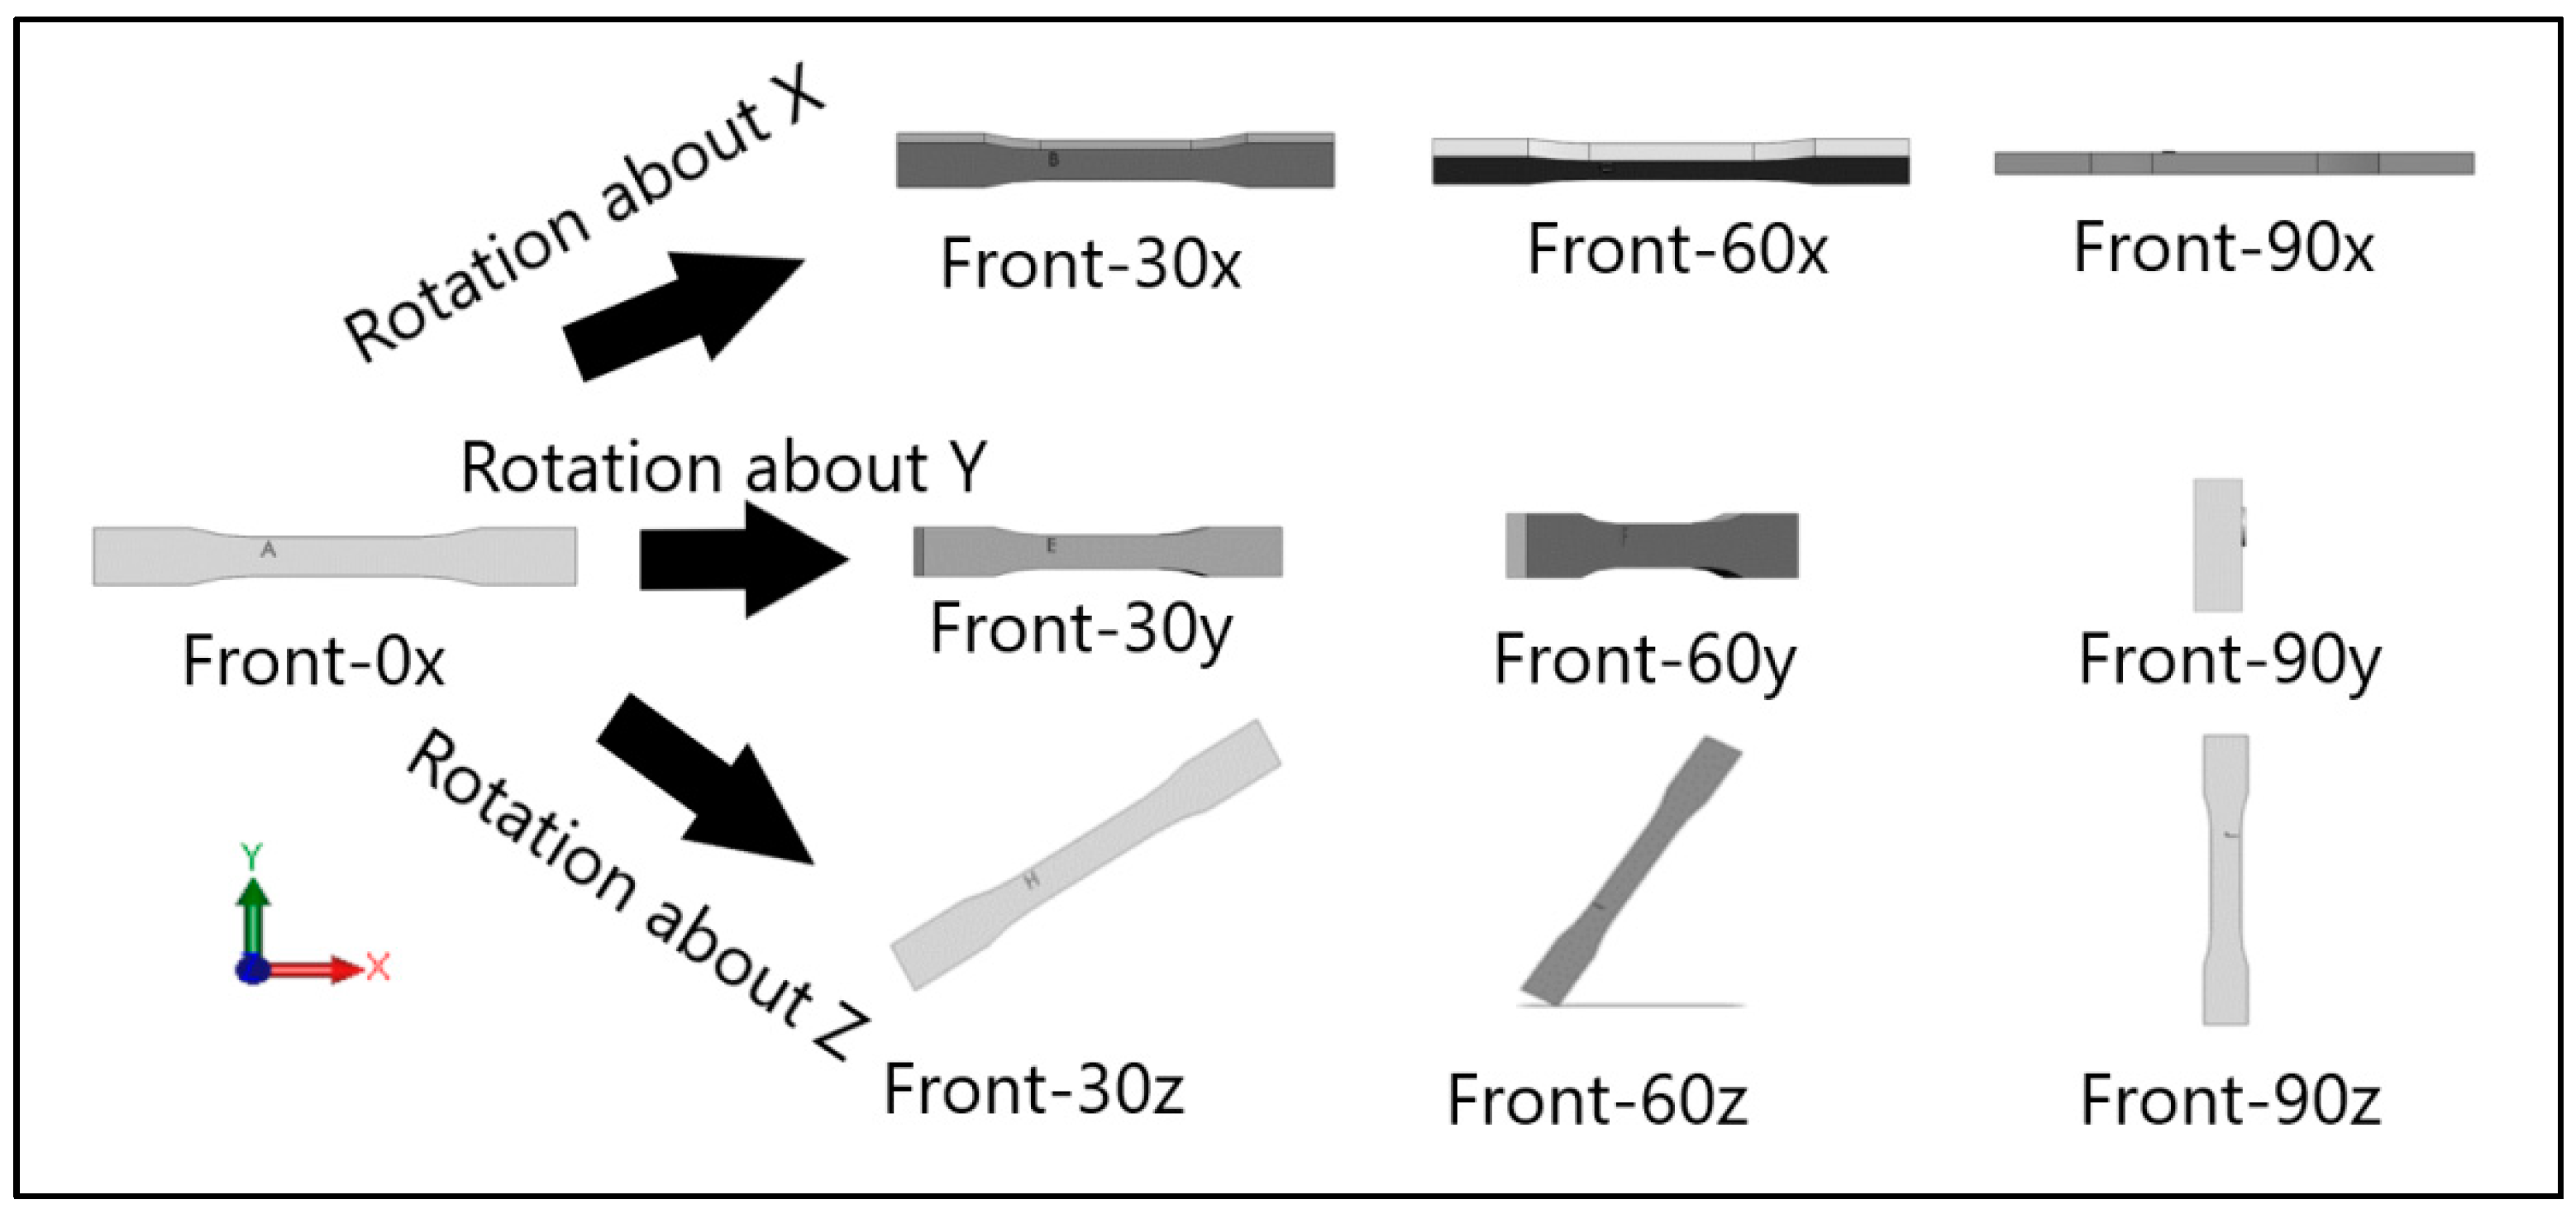
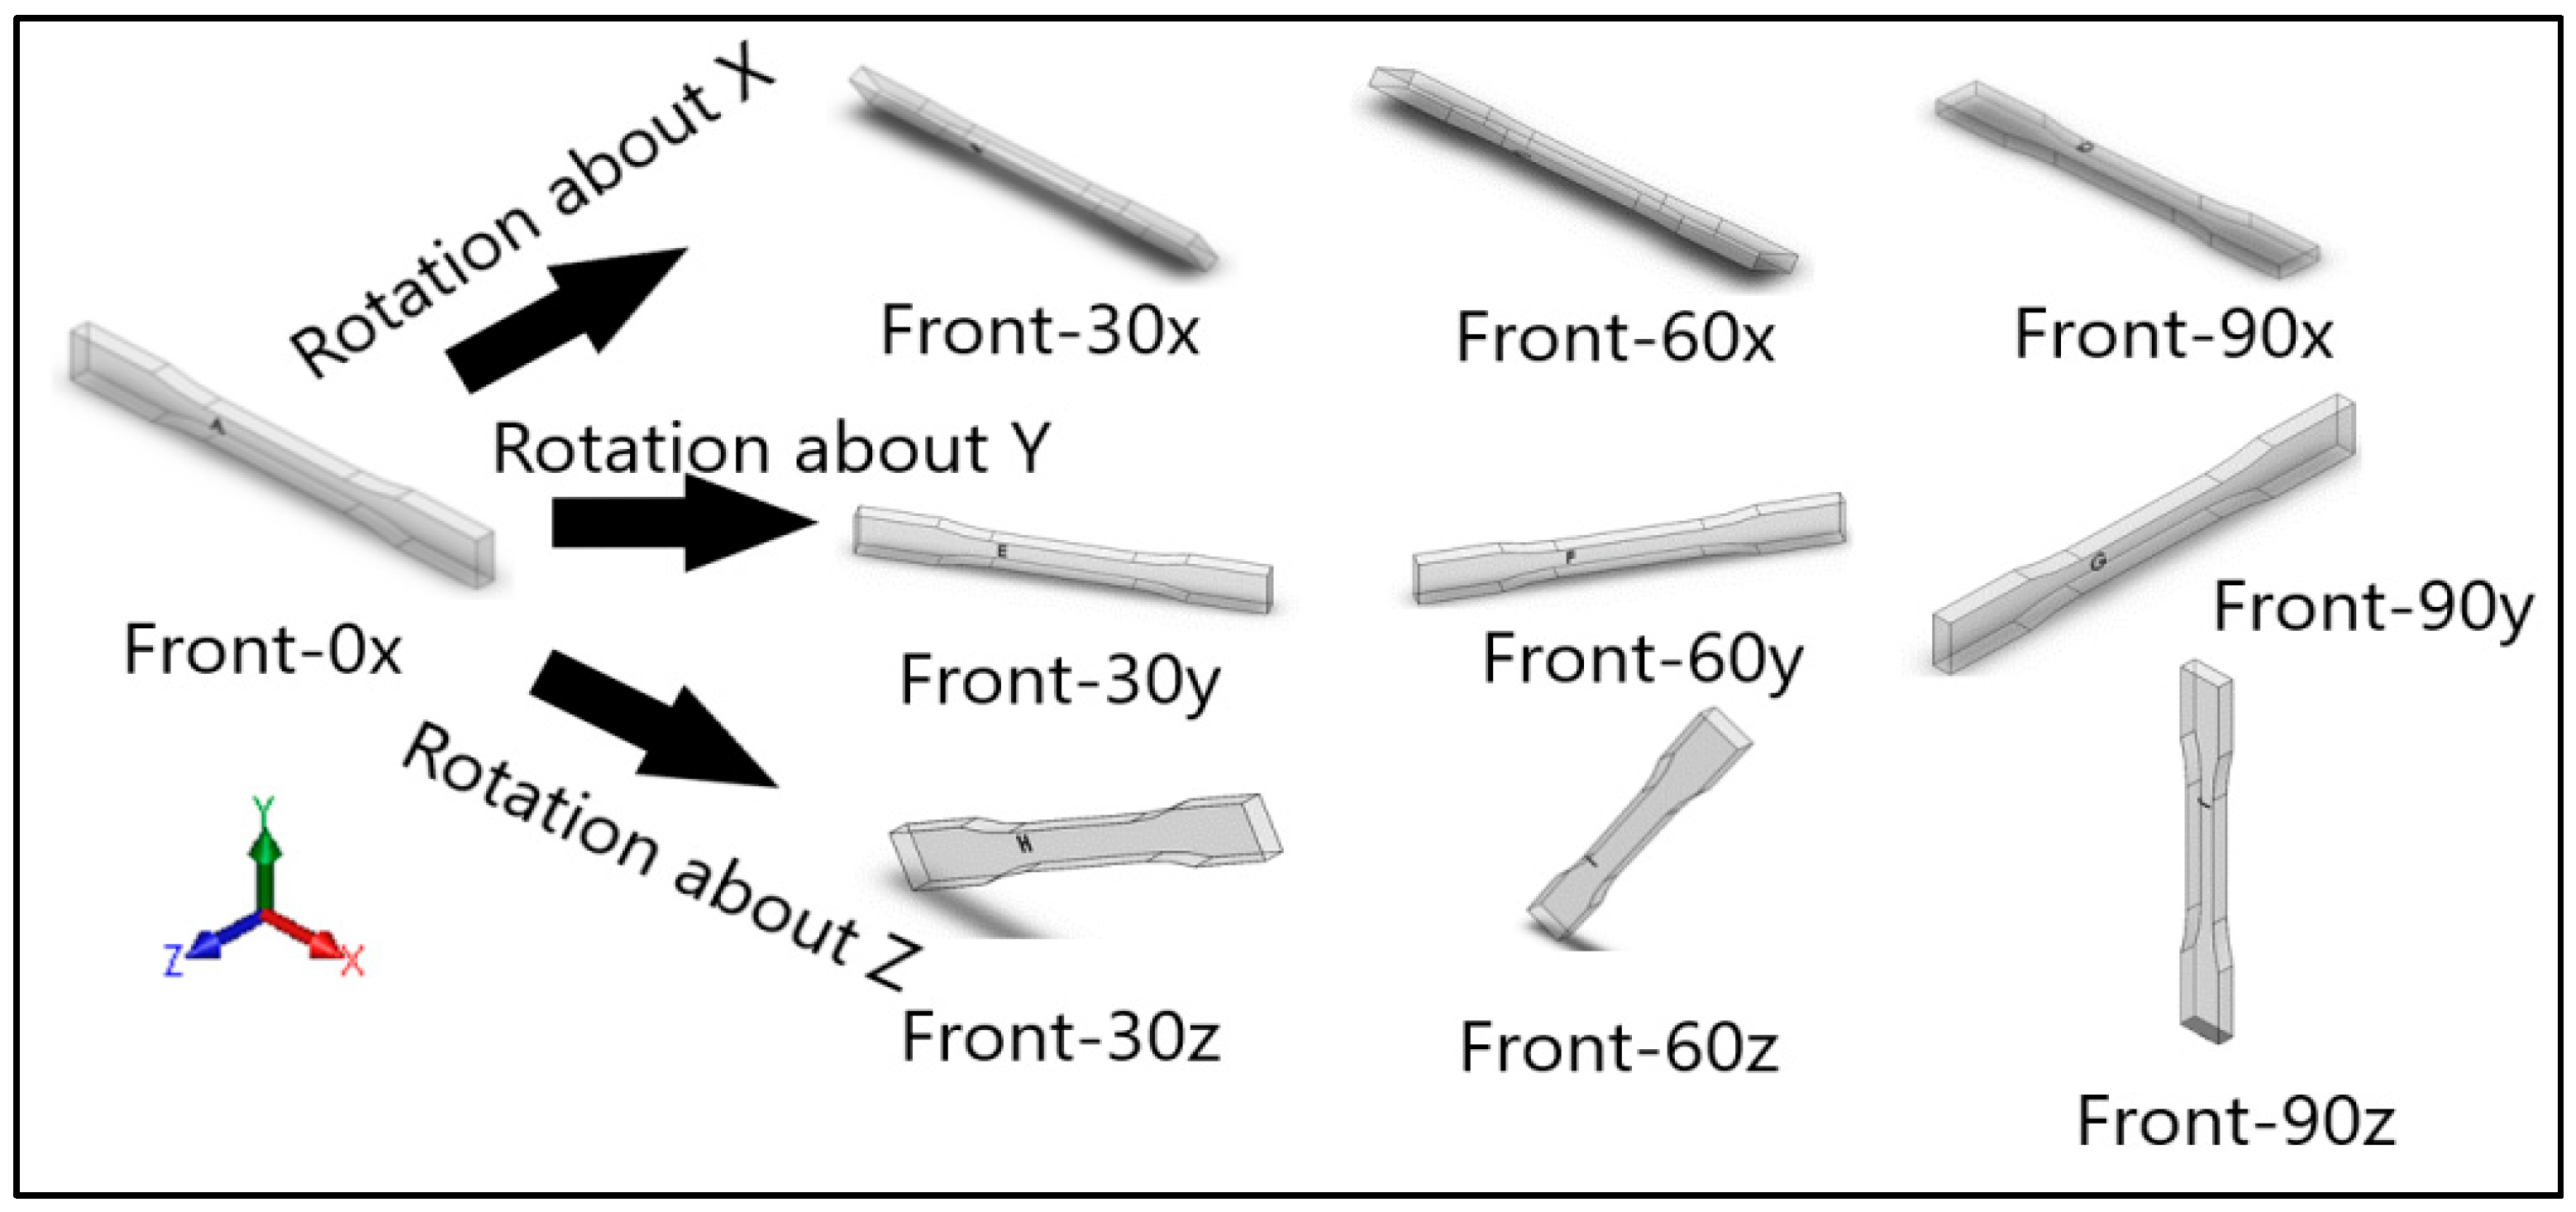
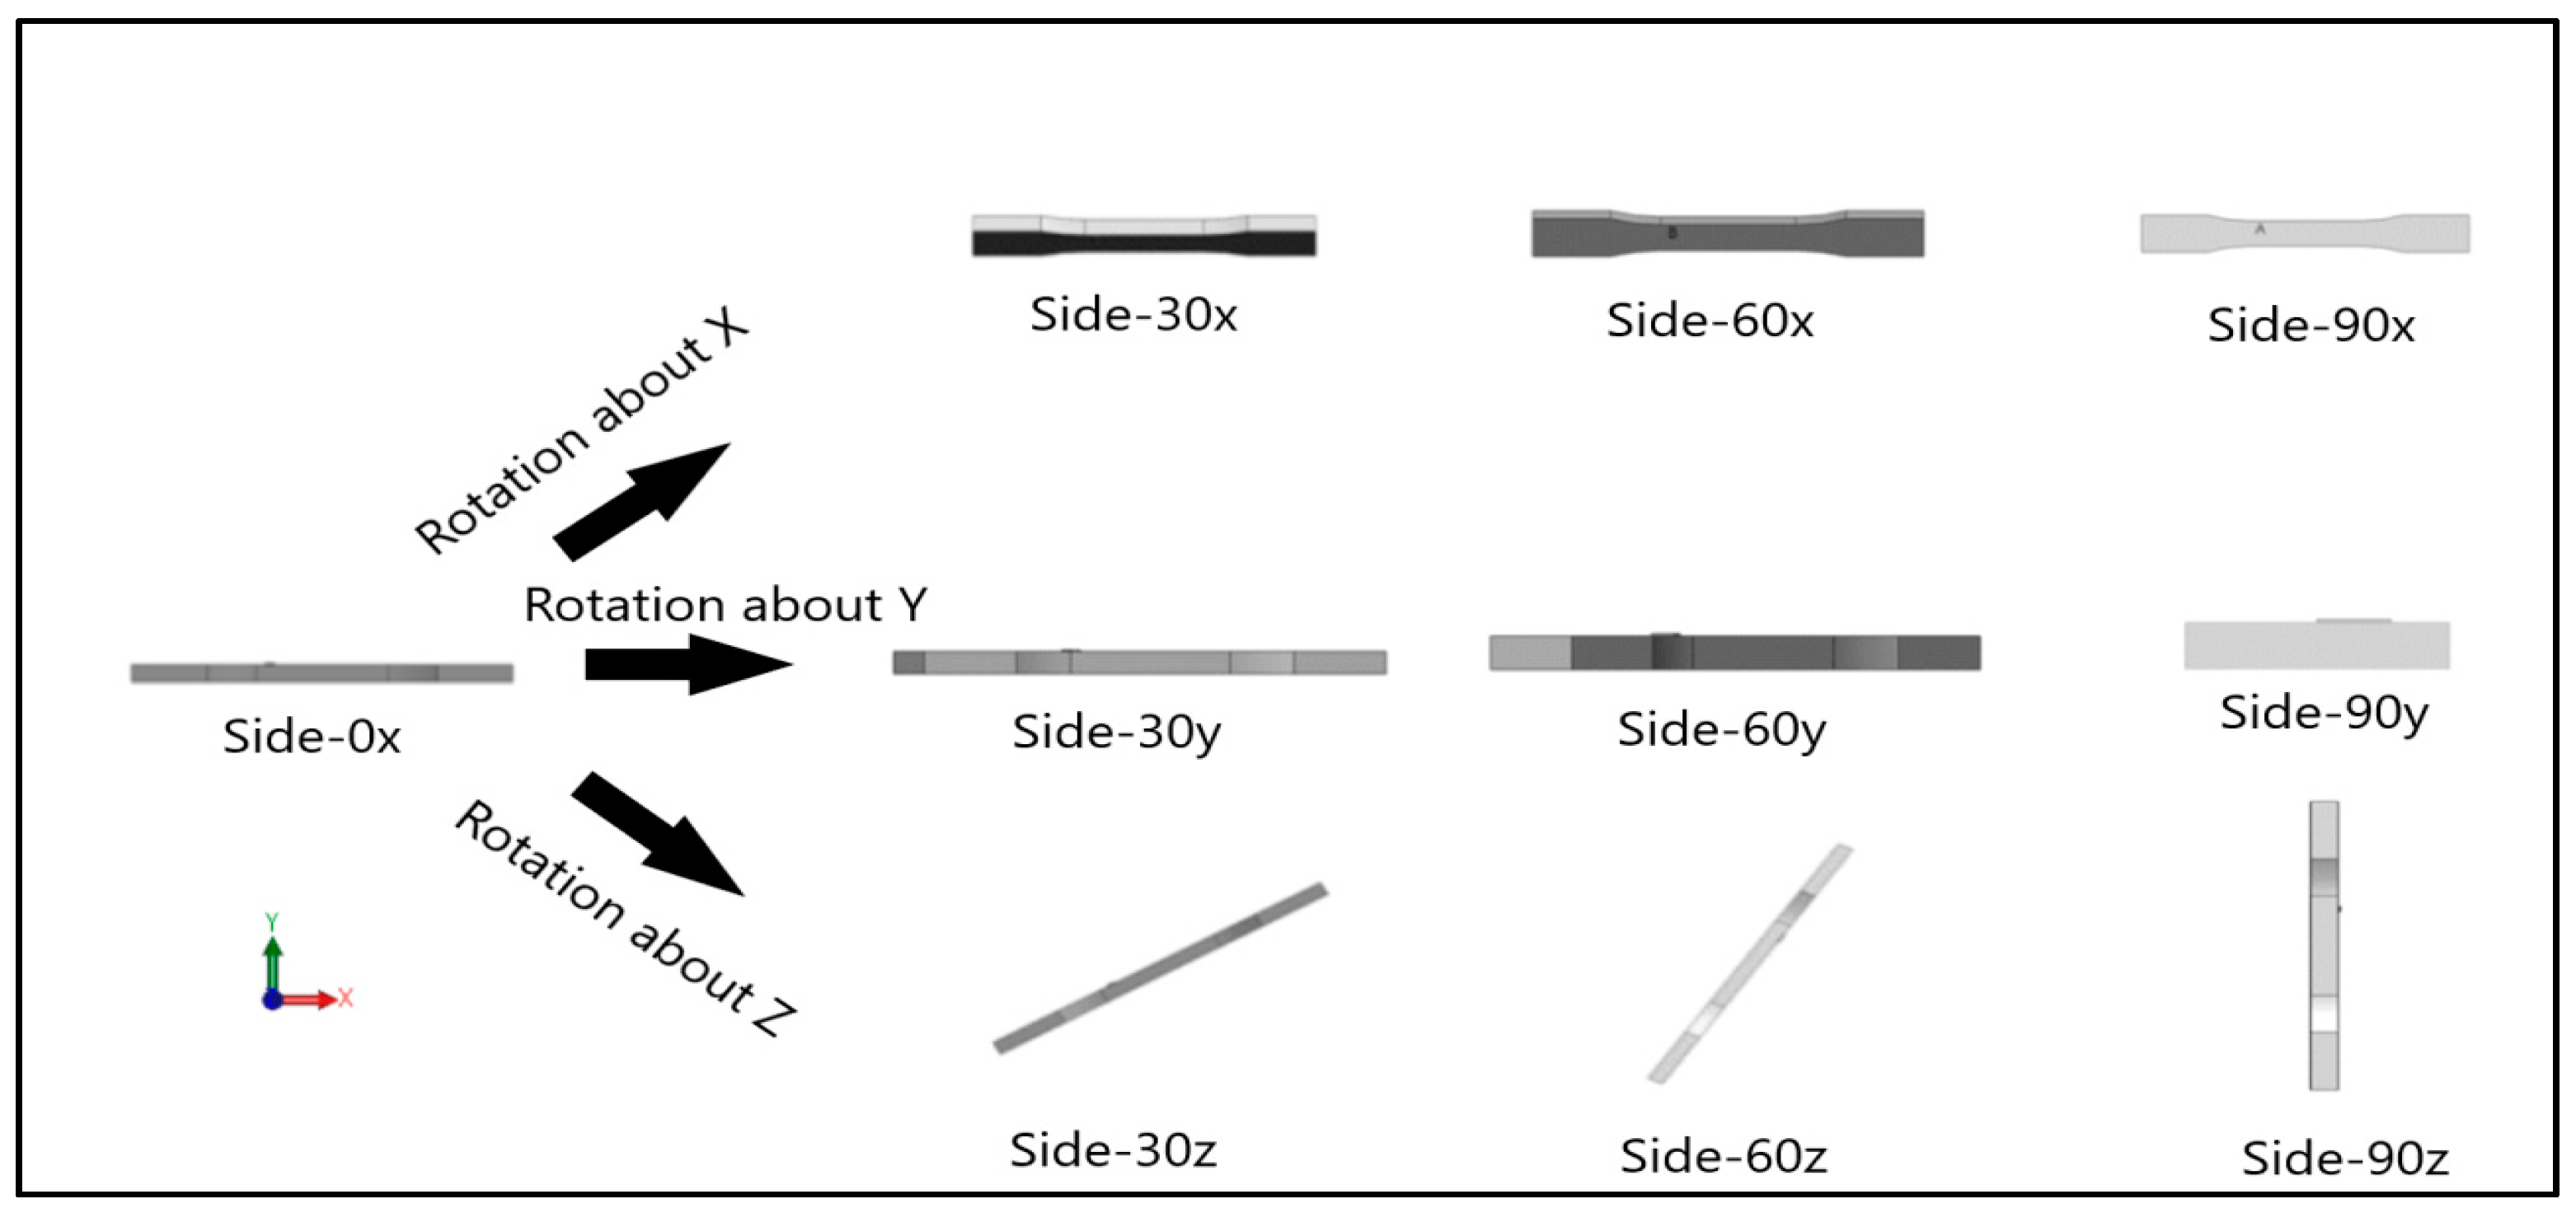
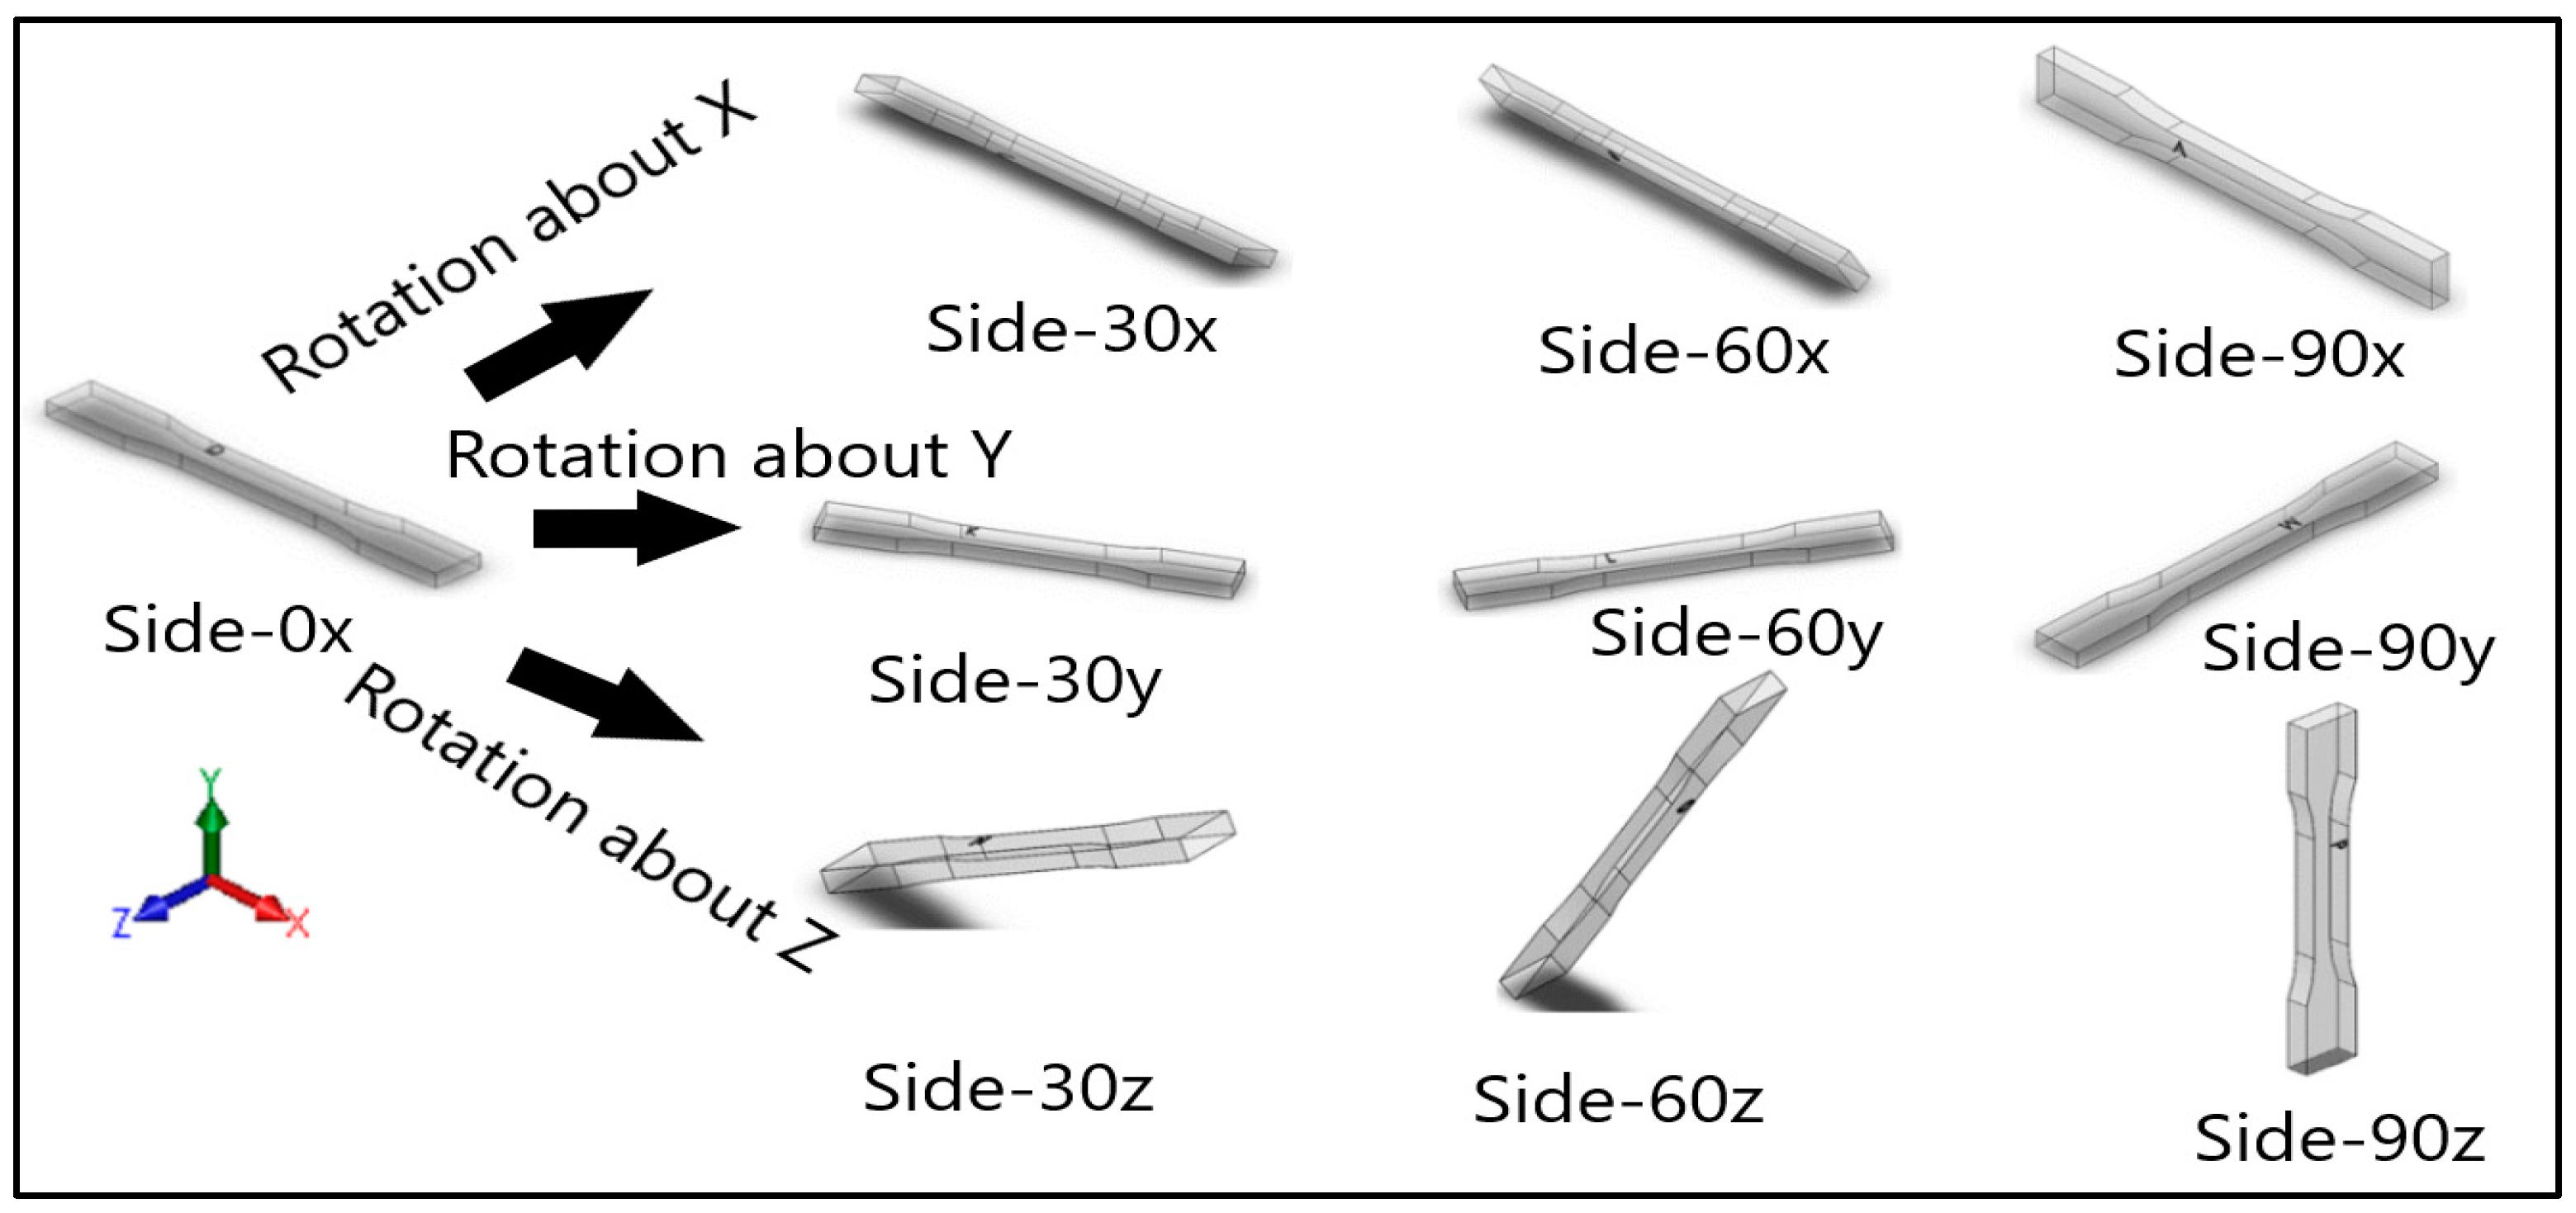
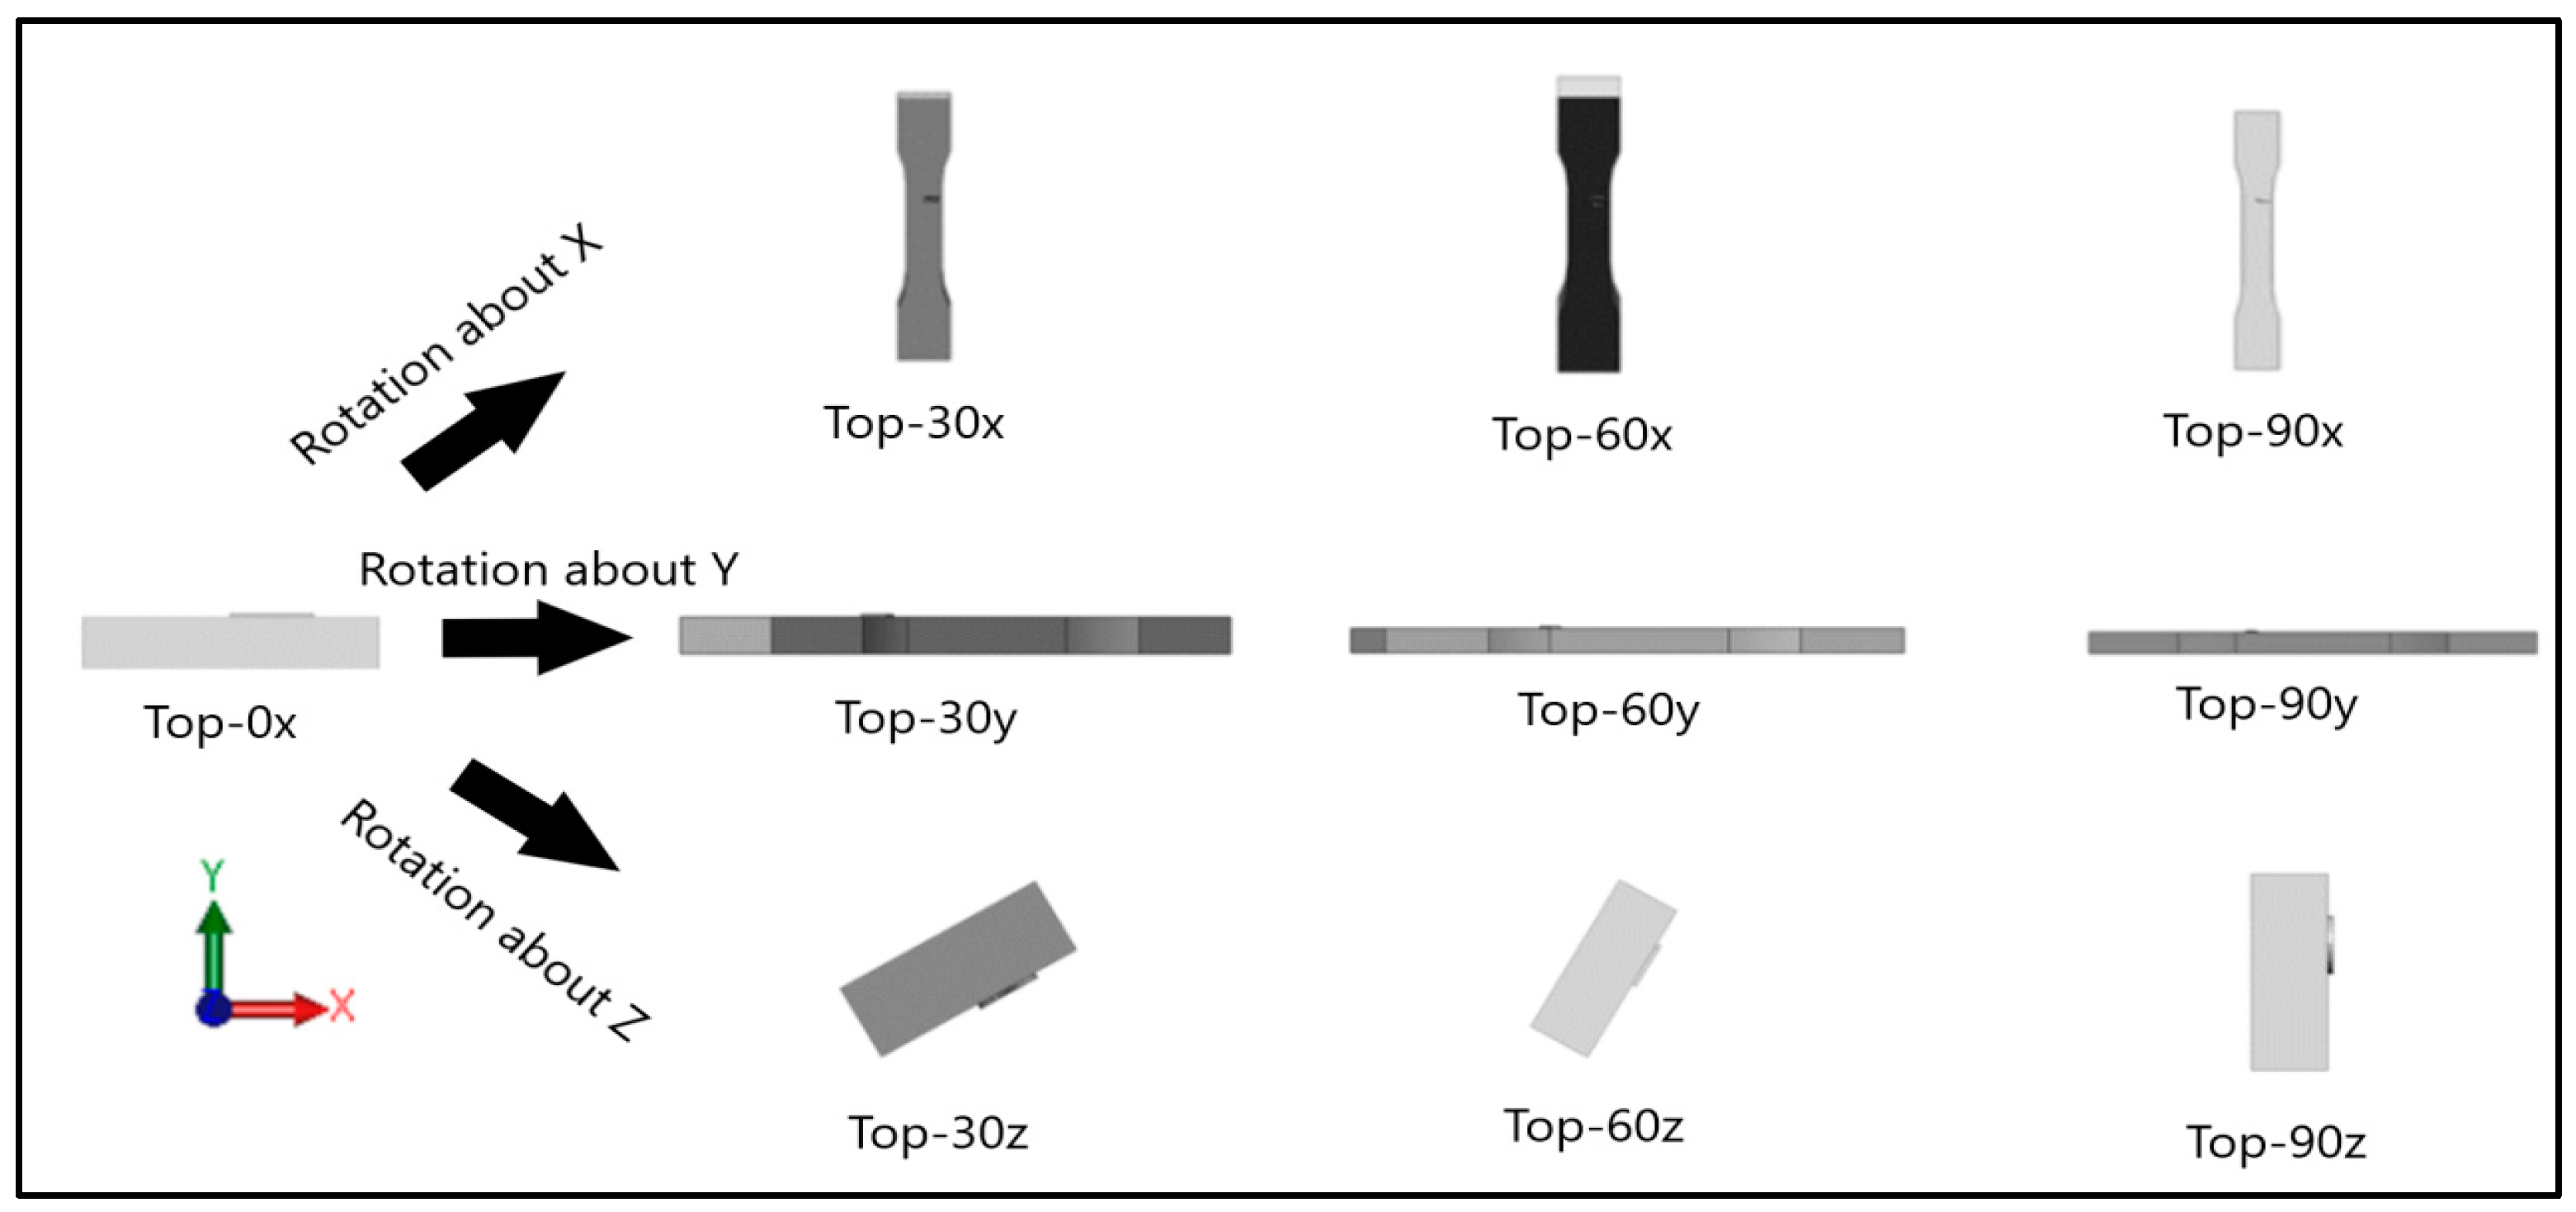
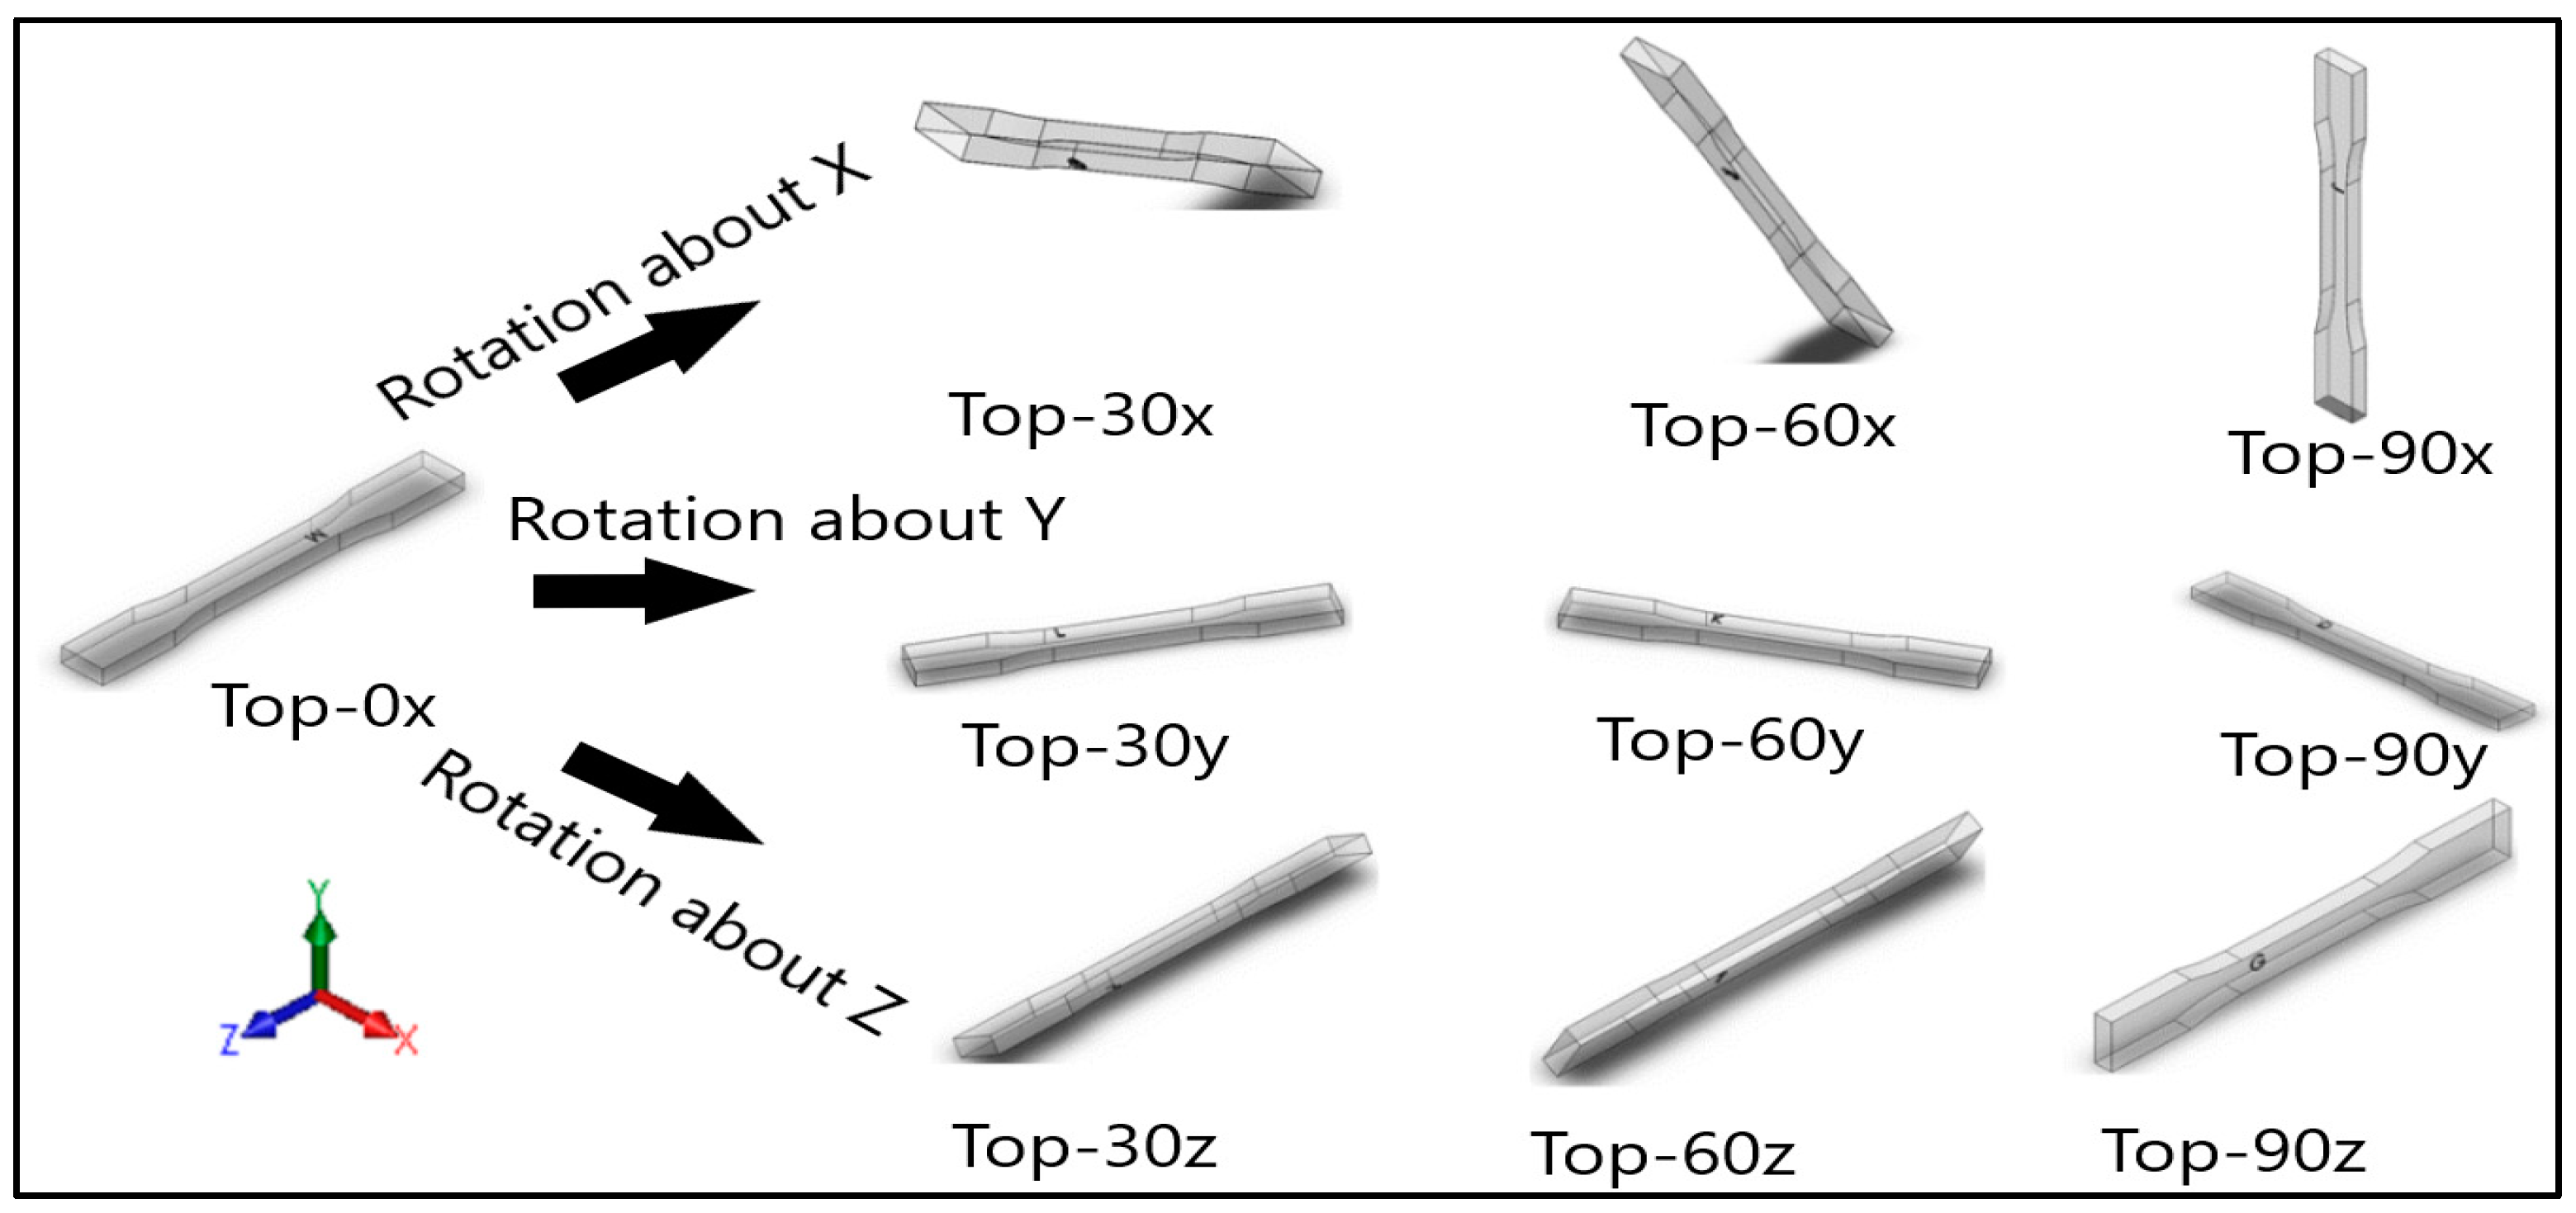
30], is used to conduct ANOVA. Since the Taguchi method uses an orthogonal array, the resulting array is balanced, since the factor levels are weighted equally. Therefore, the Taguchi DOE allows the main effects to be investigated independently of the interaction effects. The term main effect implies that there is an impact of different levels of a factor on the response variable. In this method, the analysis was set up such that there are three independent variables with three levels or groups each. If the design of experiments was set up in this manner, then it would require only nine runs to analyze the influence of the different factors on the response variable. The three independent variables are build orientation, axis, and angular orientation. Build orientation refers to the way the layers are arranged. Consequently, there are three levels for this factor: front, side, and top. As mentioned previously, in the front samples, the layers are stacked along the thickness, while in the side samples, the layers are stacked along the width, and in the top samples, the layers are stacked in the longitudinal direction of the samples. The other two factors represent the rotation of the samples by 30°, 60°, and 90° around all the three principal axes, x, y, and z, respectively. The design of experiments through this method is set up in
Table 3. The dependent variables investigated are mechanical properties such as UTS, E, percent elongation, and Ra, respectively. The first three columns of
Table 3 represent the various levels of the independent variables and the next four columns represent the response variables corresponding to the different factor levels. Before performing the ANOVA, it is necessary to state the null and alternate hypotheses. The null hypothesis that is suitable for this DOE would state that the means of the respective mechanical properties are the same for different levels of the respective independent variables. The alternate hypothesis, as the name implies, would state the means of the respective mechanical properties are not the same for different levels of the respective independent variables.
The results obtained through the Taguchi analysis include ANOVA for the mechanical properties. The different terms used in
Table 4 include SS, which refers to the sum of squares; df, which refers to degrees of freedom; and F, which is the F ratio (ratio of means between groups and within groups). Between-group variability denotes the variation of the means of different groups while within-group variability refers to the variation within a group that is considered independently of the other groups. The key result from ANOVA is the ratio of between-group variance and within-group-variance that is referred to as the F ratio. If the between-group variance is much higher than the within-group variance, the means are not equal. The F ratio that is calculated is compared with a term denoted as the F critical. F critical refers to the value of the F statistic from the F distribution corresponding to the confidence level specified. If the F ratio is higher than F critical, then the data are significant. The other term that can be used to determine statistical significance is the
p-value. The
p-value is the probability that the results obtained are as extreme as the sample data, assuming the validity of the null hypothesis. The
p-value is compared with the alpha value to determine if the null hypothesis can be rejected. If the
p-value is lower than the alpha value, then the data are significant. The alpha value is taken as 0.05 as that is the standard value used in most applications and refers to a 95% confidence. As seen in
Table 4, the
p-value for all three independent variables is greater than the alpha value. This implies that the null hypothesis for each of the independent variables cannot be rejected. Therefore, changing the three independent variables does not have a statistically significant impact on the UTS.
As seen in
Table 5, the
p-value for the build orientation and angular orientation is greater than the alpha value. This implies that the null hypothesis for these independent variables cannot be rejected. However, since the
p-value is lower than alpha for axis, the null hypothesis for the axis can be rejected. Therefore, changing the build orientation or angular orientation does not have a statistically significant impact on the E but changing the axis does statistically influence the E.
As seen in
Table 6, the
p-value for all three independent variables is greater than the alpha value. This implies that the null hypothesis for each of the independent variables cannot be rejected. Therefore, changing the three independent variables does not have a statistically significant impact on the percentage elongation.
As seen in
Table 7, the
p-value for the build orientation is greater than the alpha value. This implies that the null hypothesis for this independent variable cannot be rejected. However, since the
p-value is lower than alpha for both the axis and angular orientation, the null hypothesis for them can be rejected. Therefore, changing the build orientation does not have a statistically significant impact on the Ra, but changing the axis or angle does statistically influence the Ra. The results were then graphed in the form of main effects plots, as seen in
Figure 14, to visually understand the impact of changing each of the three main factors on the response. The main effects plot should be interpreted by the slope of the line such that a steeper slope indicates a higher main effect of the factor. For example, in
Figure 14a, when the level of the axis factor is changed from x to y, the resulting UTS is greatly impacted, as indicated by the high slope of the main effects line. Conversely, from
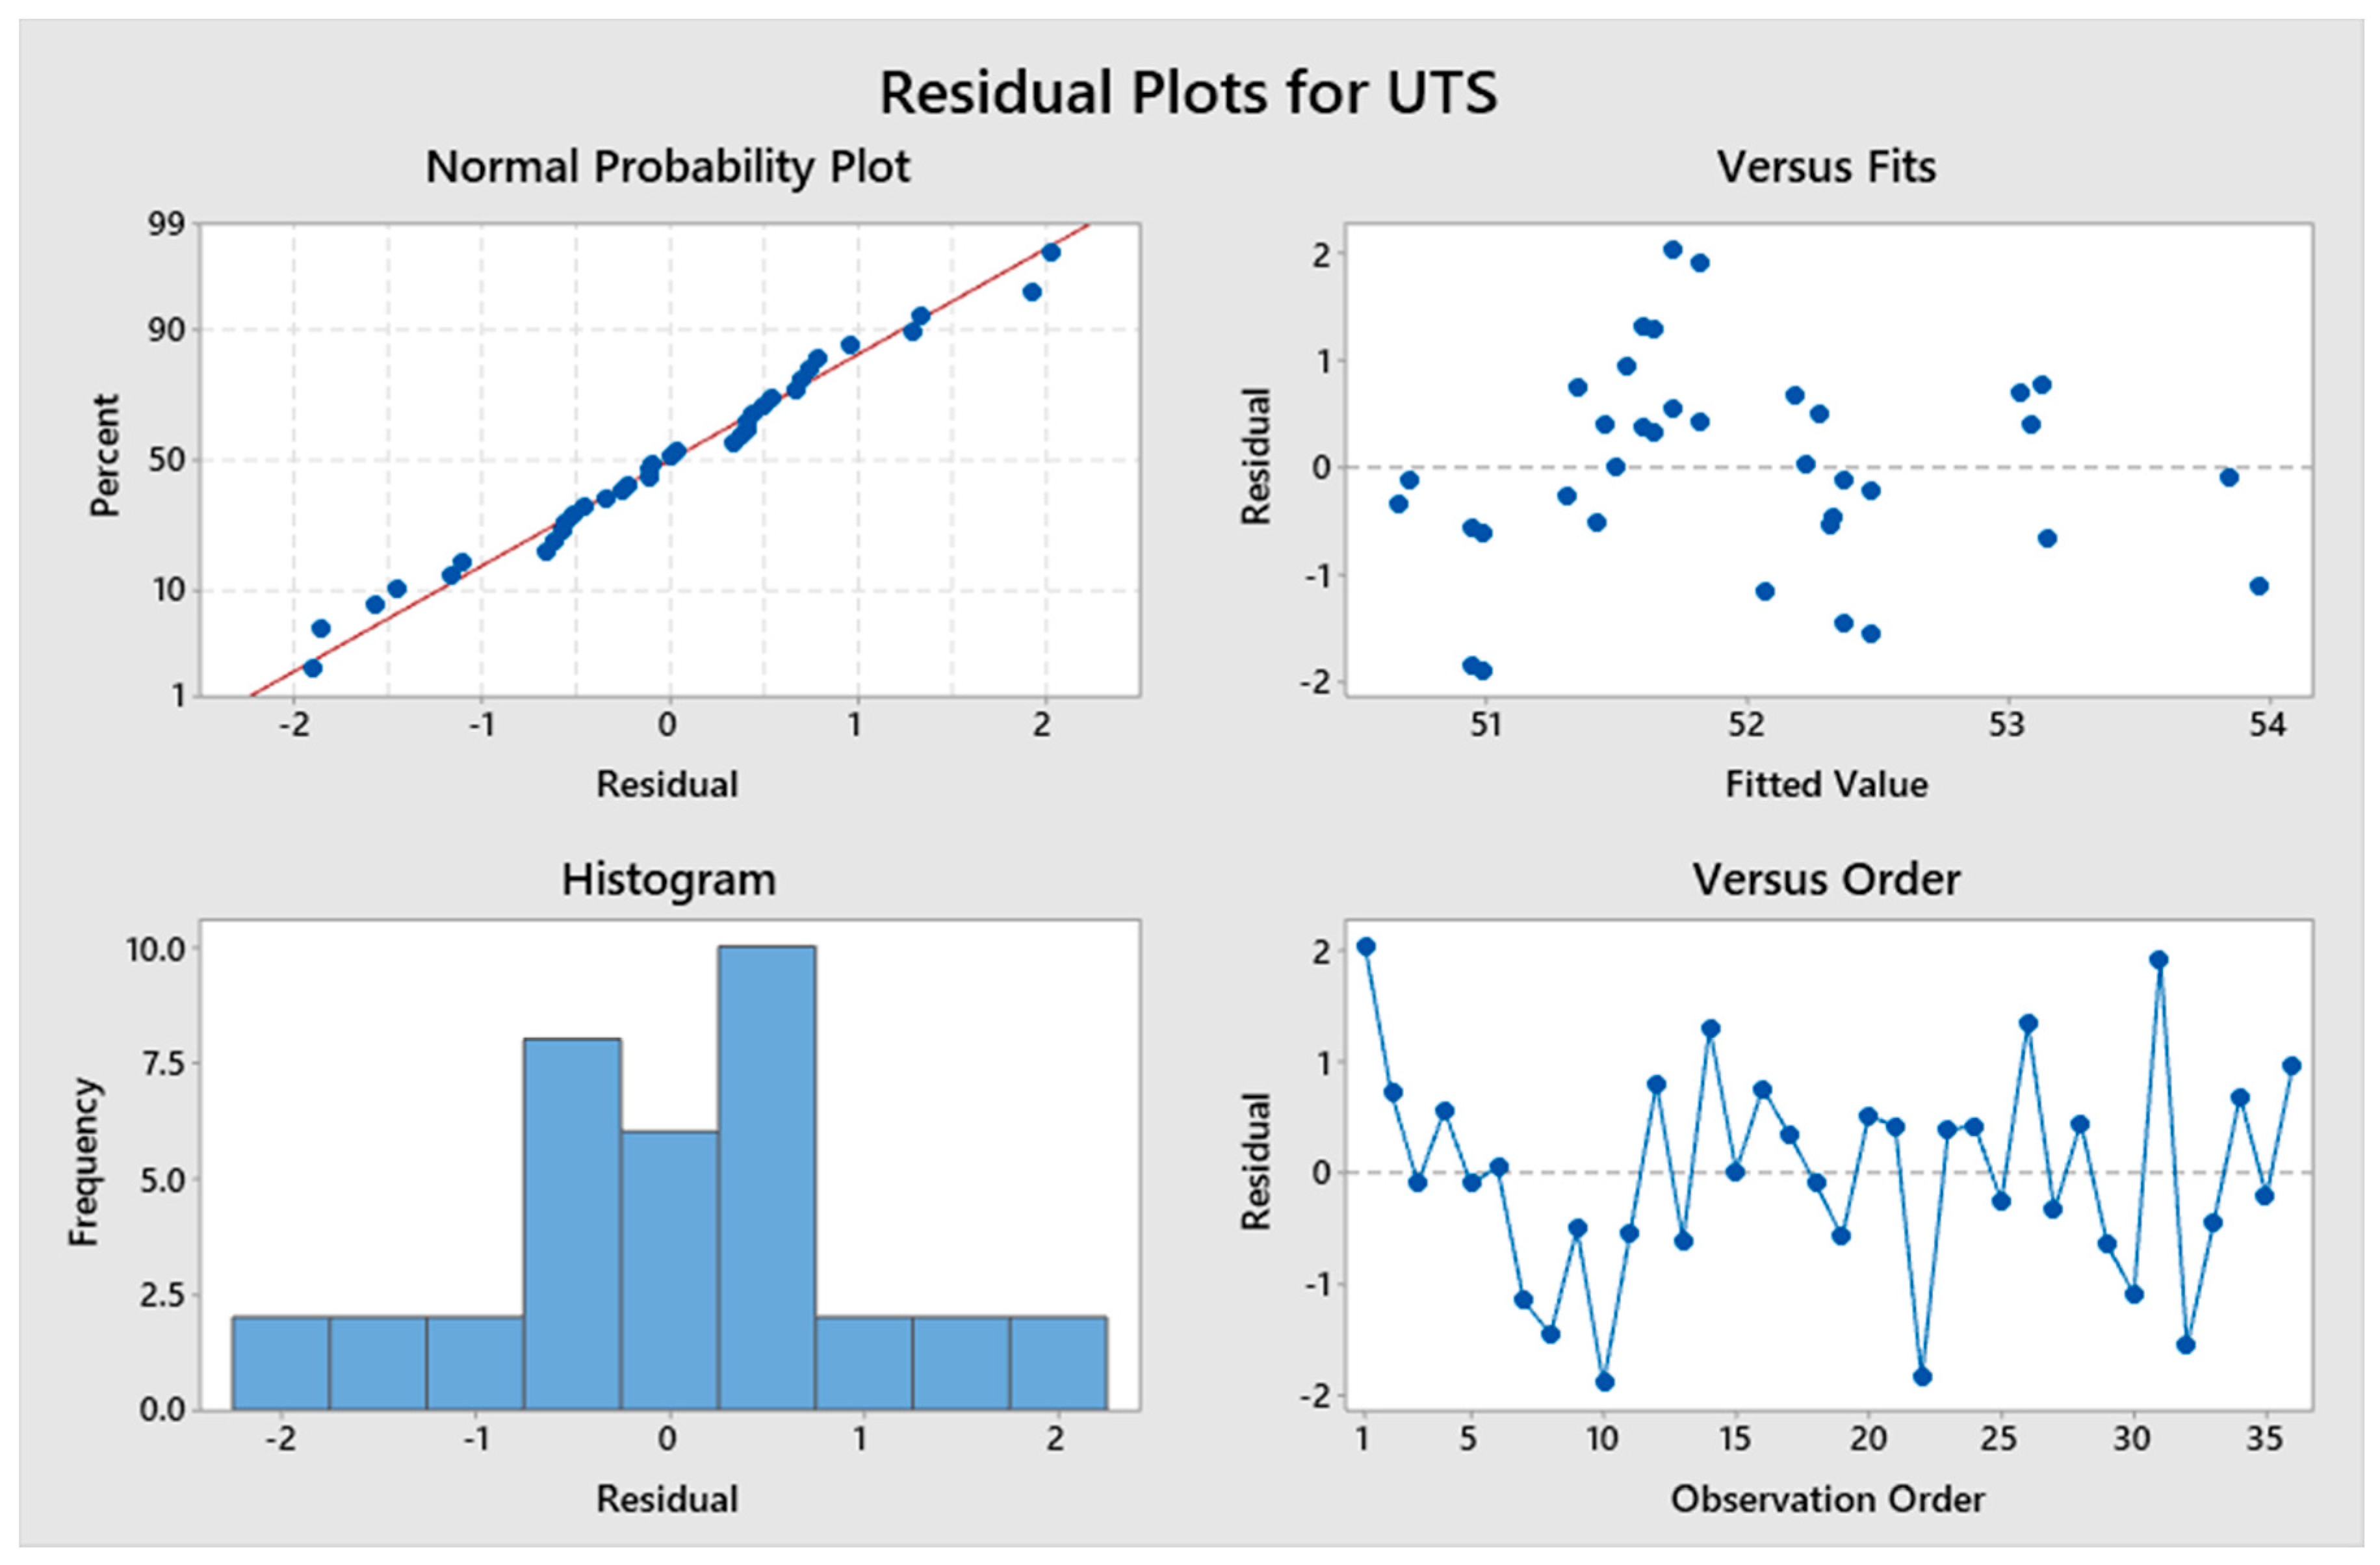
Figure 14c, it can be observed that changing the angular orientation from 30° to 60° does not have an impact on the percentage elongation, as indicated by the nearly horizontal line. These graphs validate the ANOVA results obtained through the Taguchi analysis. The last component of the statistical analysis was the residual mean plots, as seen in
Figure 15, which indicate the statistical adequacy of the model. Even though all the residual plots are not shown here because of space constraints, they verified that the chosen statistical models for the different mechanical properties were adequate. For example, the normal probability plots for UTS had data points very close to the straight line, which implies the model fits the data well.
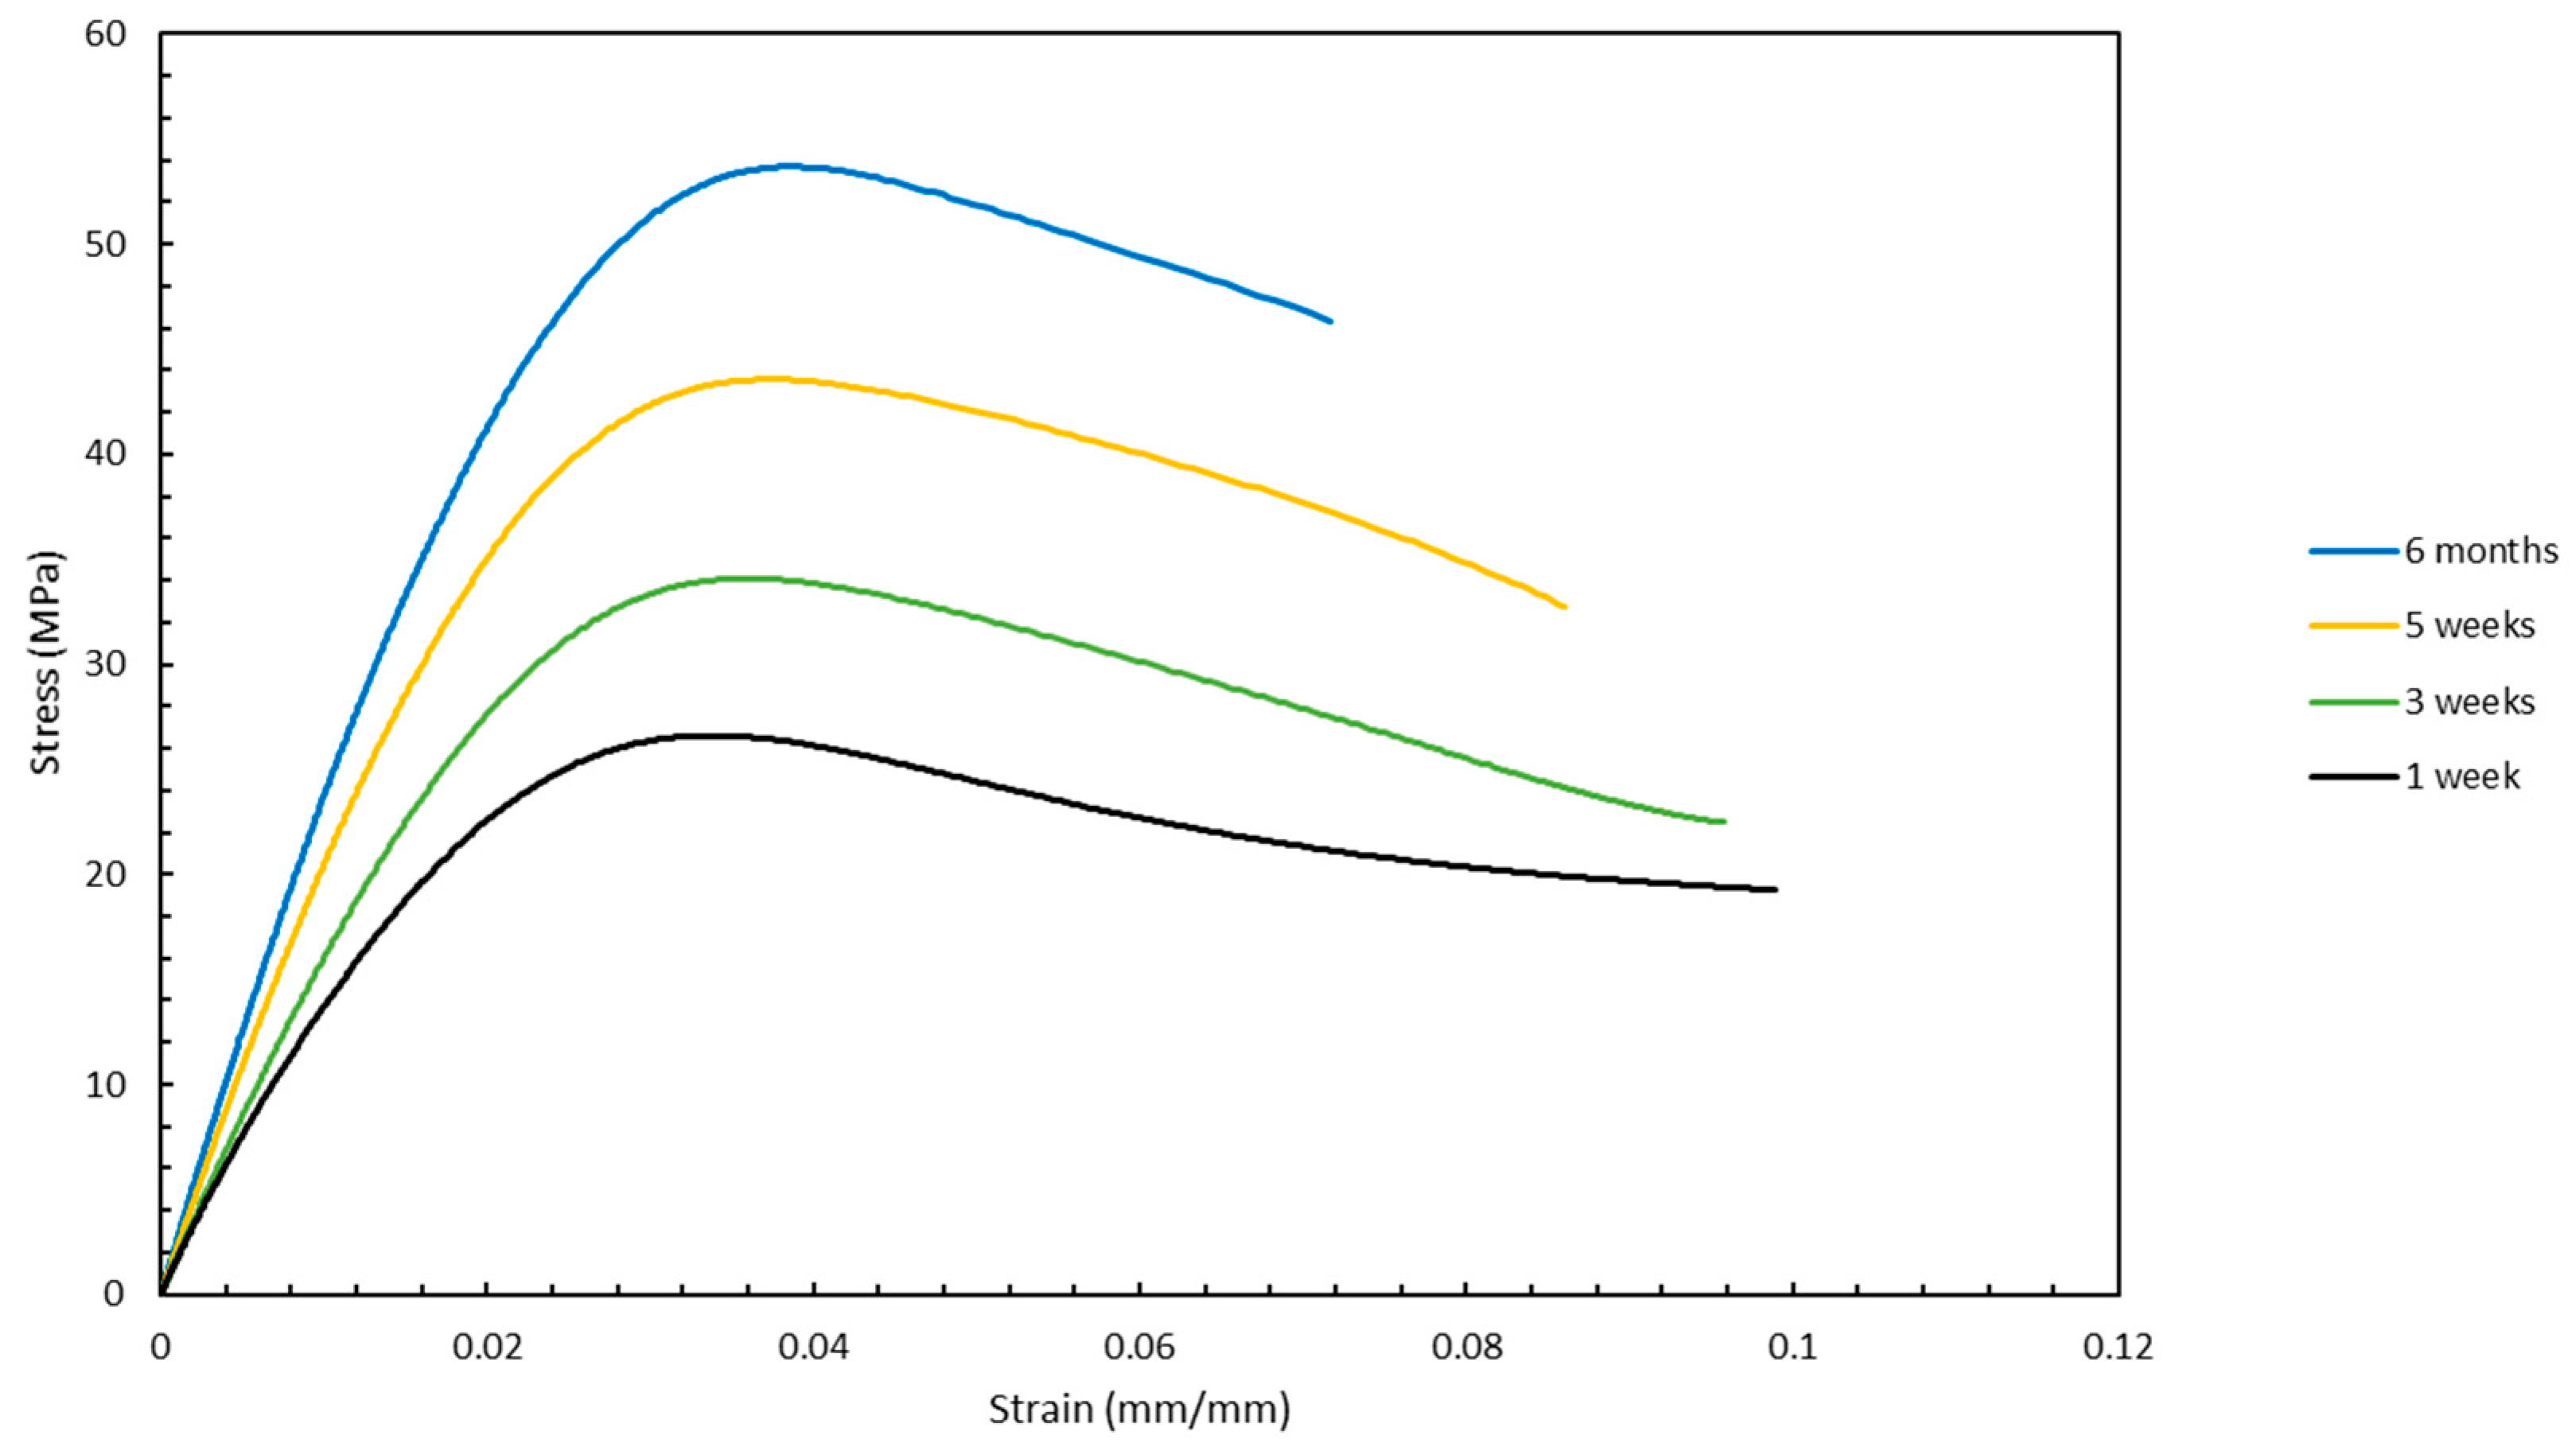
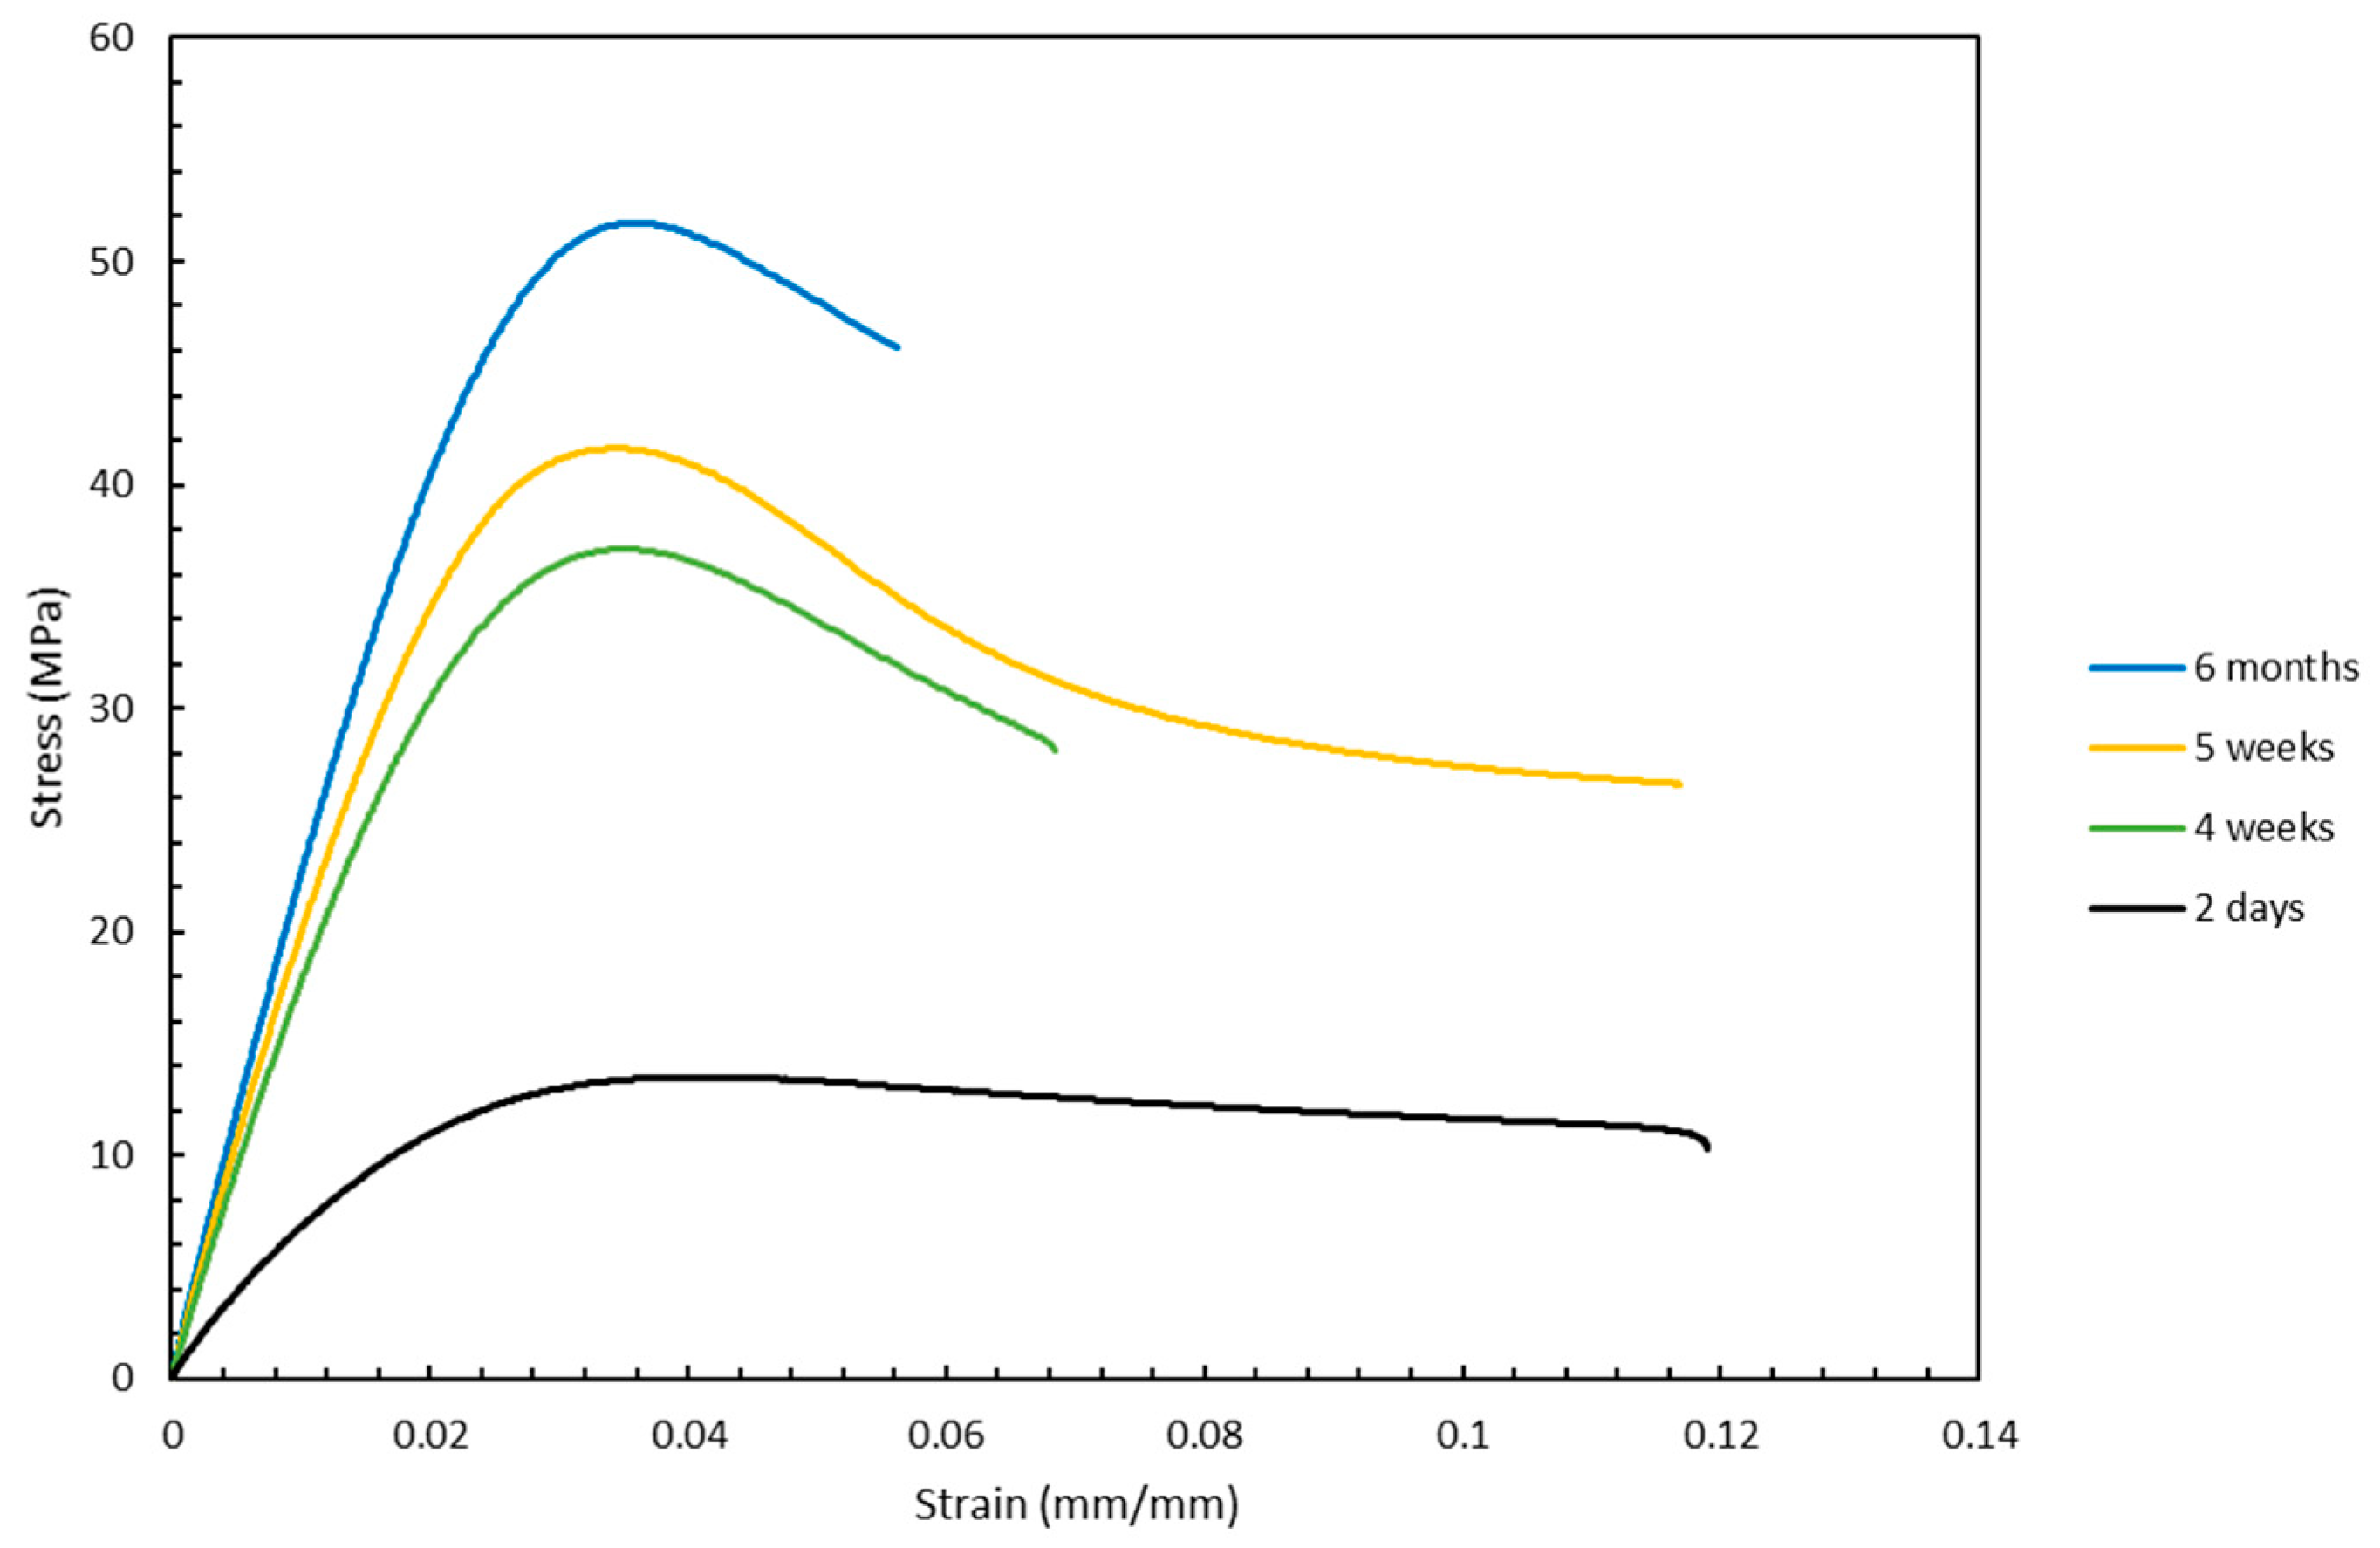
Finally, another factor that was tested besides the orientations was the influence of the aging duration of the samples on the mechanical properties. As seen from the stress vs. strain curves in
Figure 16 and
Figure 17, the mechanical properties for the samples that were aged the most were superior to those that were aged the least. As seen in
Figure 16, the UTS increased from approximately 24 to 54 MPa when the sample with an orientation of front-0x was aged from one week to six months. This indicates that aging has a significant influence on the mechanical properties of samples fabricated by stereolithography. Although these two figures show the effect of aging on mechanical properties only for front built samples that were rotated 0° around the x-axis and 60° around the z-axis, this trend is representative of the data that were collected for the other orientations as well.
The Taguchi design of experiments was derived based on the orthogonal array that resulted in fewest trials based on the given combinations of the factors. In the Taguchi method, three independent factors with three levels each and their impact on the response variables were investigated. Although the main effects plot and
p-values determined that the different independent variables did not have a statistical impact on the mechanical properties, the effect of interaction between the different independent variables was not accounted for in the Taguchi method. Moreover, since the Taguchi design of experiments is highly fractionated, the interaction effect that can be determined through statistical analysis can be misleading. Therefore, to investigate the impact of one independent factor at a time on the response variable, another statistical method called one-way ANOVA was employed. One-way ANOVA is a statistical method where the influence of one independent variable with different levels on one dependent variable can be determined. Since each factor is analyzed independently, the interaction effect need not be considered an error. Based on the levels of a factor, the design of experiments setup for the one-way ANOVA will be different. The two independent variables that are investigated are the build orientations and angular orientations. The design of experiments setup and the ANOVA procedure are similar for the different dependent variables that are investigated such as UTS, E, percentage elongation, and Ra. For each of the dependent variables, the ANOVA results of the
p-value, and confidence intervals established through the pooled standard deviation are presented.
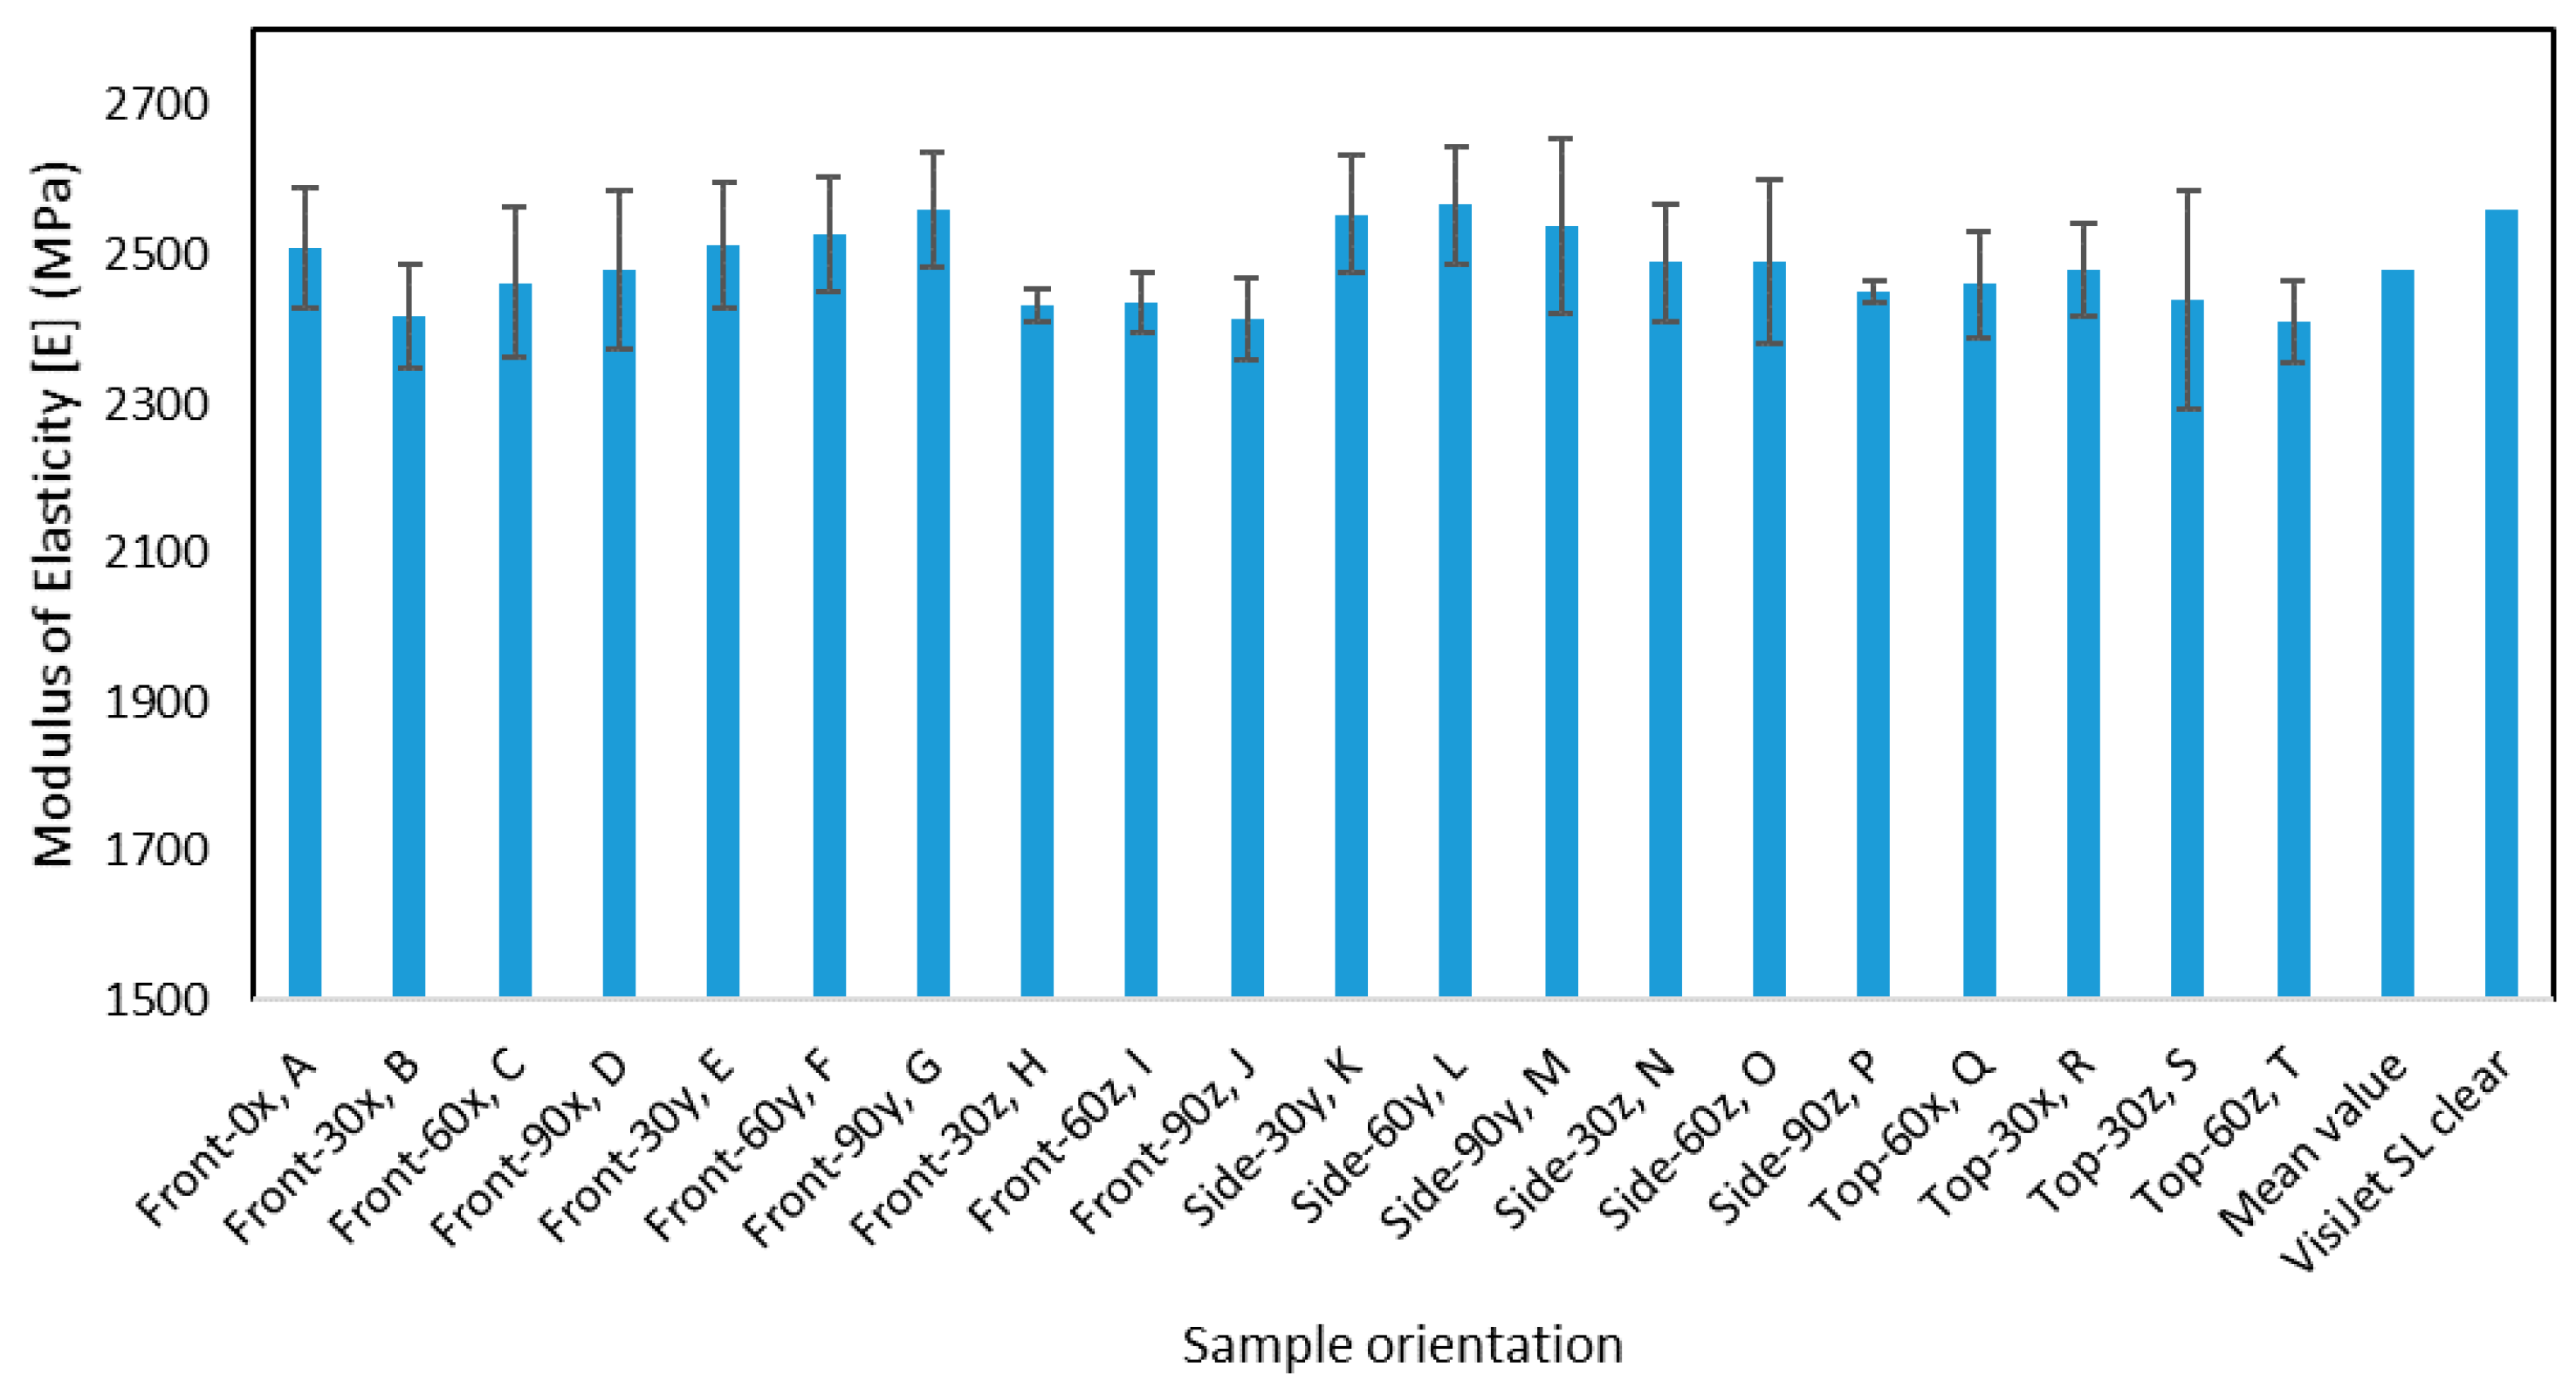
Table 8 represents the DOE setup for analyzing the dependent variable of E as a function of the independent variable of angular orientations. Each column entry represents the E for the different angular orientations.
Similar to the Taguchi DOE, the null hypothesis for this DOE would state that the means of the response variable, E, are the same for different levels of the angular orientation. The ANOVA results obtained are shown in
Table 9, where the
p-value of 0.618 is higher than the alpha value, which implies that the null hypothesis cannot be rejected. Therefore, angular orientation does not have a statistical impact on the modulus of elasticity.
Table 10 represents the number of observations, mean, standard deviation, and 95% confidence interval for E for each level of the angular orientation.
Table 11 represents the DOE setup for analyzing the dependent variable of E as a function of the independent variable of build orientations. Each column entry represents the E for the different build orientations.
The ANOVA results obtained are shown in
Table 12, where the
p-value of 0.683 is higher than the alpha value, which implies that the null hypothesis cannot be rejected. Therefore, build orientation does not have a statistical impact on the modulus of elasticity.
Table 13 represents the number of observations, mean, standard deviation, and 95% confidence interval for E for each level of the build orientation.
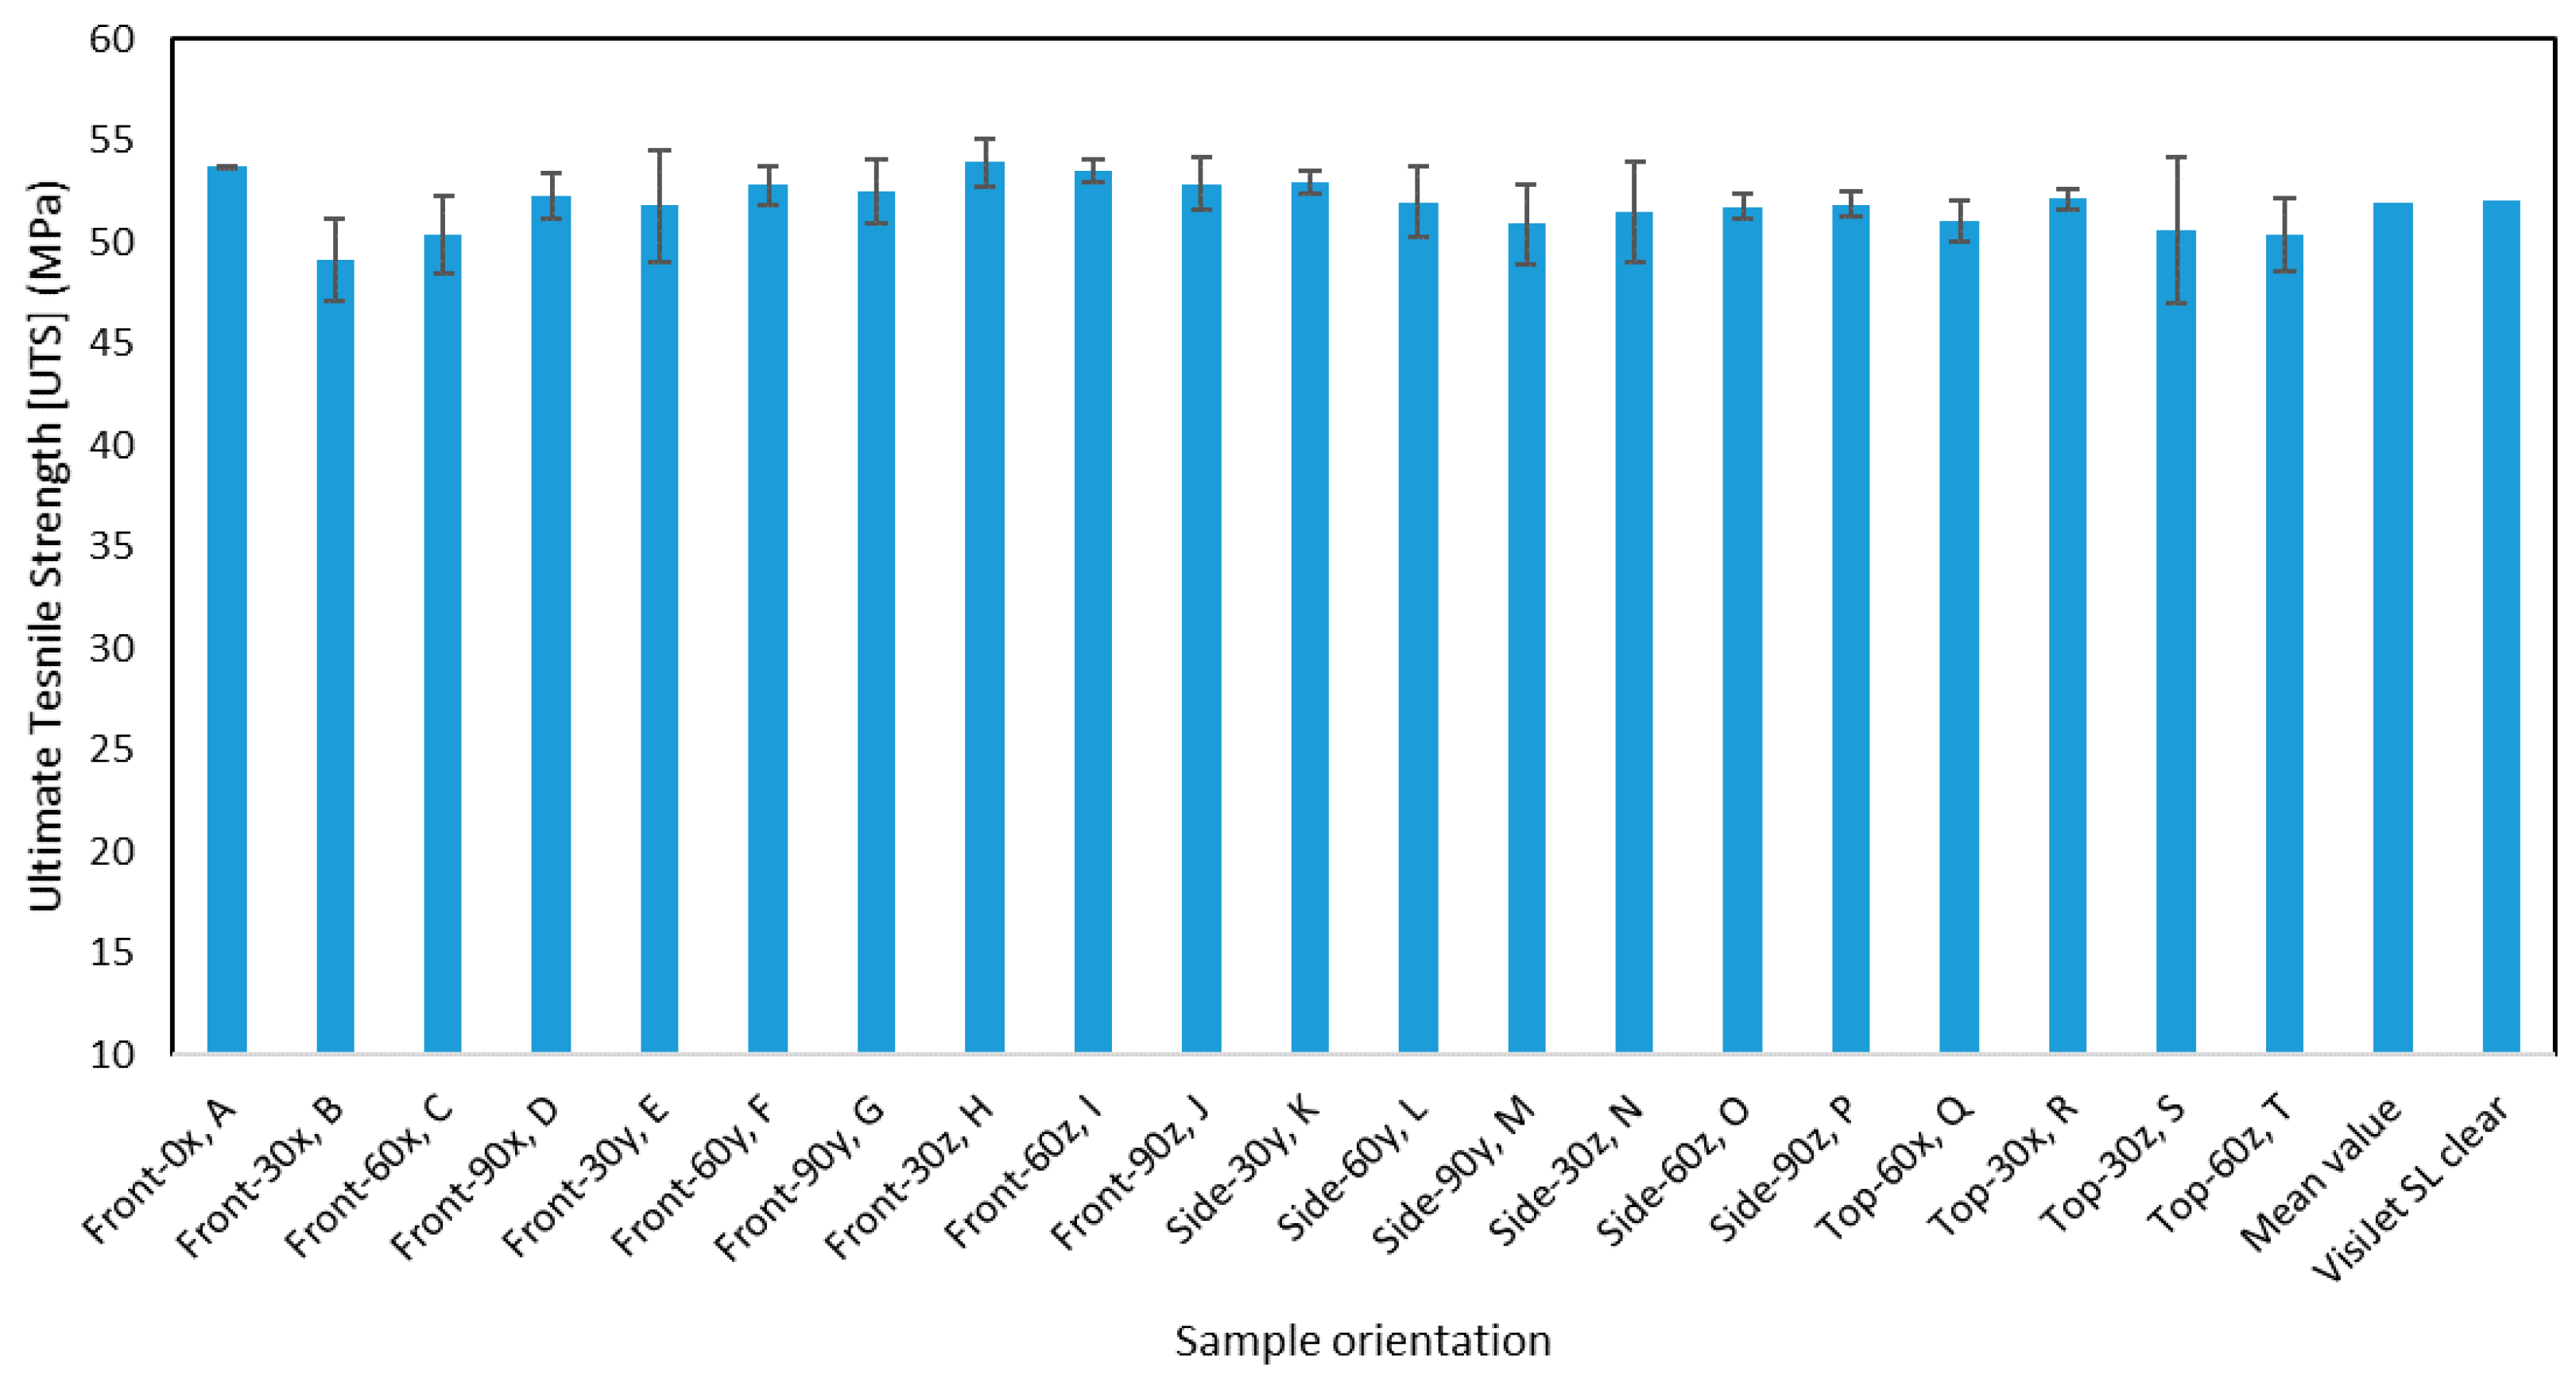
Table 14 represents the DOE setup for analyzing the dependent variable of UTS as a function of the independent variable of angular orientations. Each column entry represents the UTS for the angular orientations.
The ANOVA results obtained are shown in
Table 15. As seen in
Table 15, the
p-value of 0.305 is higher than the alpha value, which implies that the null hypothesis cannot be rejected. Therefore, angular orientation does not have a statistical impact on the ultimate tensile strength.
Table 16 represents the number of observations, mean, standard deviation, and 95% confidence interval for UTS for each level of the angular orientation.
Table 17 represents the DOE setup for analyzing the dependent variable of UTS as a function of the independent variable of build orientations. Each column entry represents the UTS for the build orientations.
The ANOVA results obtained are shown in
Table 18. As seen in
Table 18, the
p-value of 0.162 is higher than the alpha value, which implies that the null hypothesis cannot be rejected. Therefore, build orientation does not have a statistical impact on the ultimate tensile strength.
Table 19 represents the number of observations, mean, standard deviation, and 95% confidence interval for UTS for each level of the build orientation.
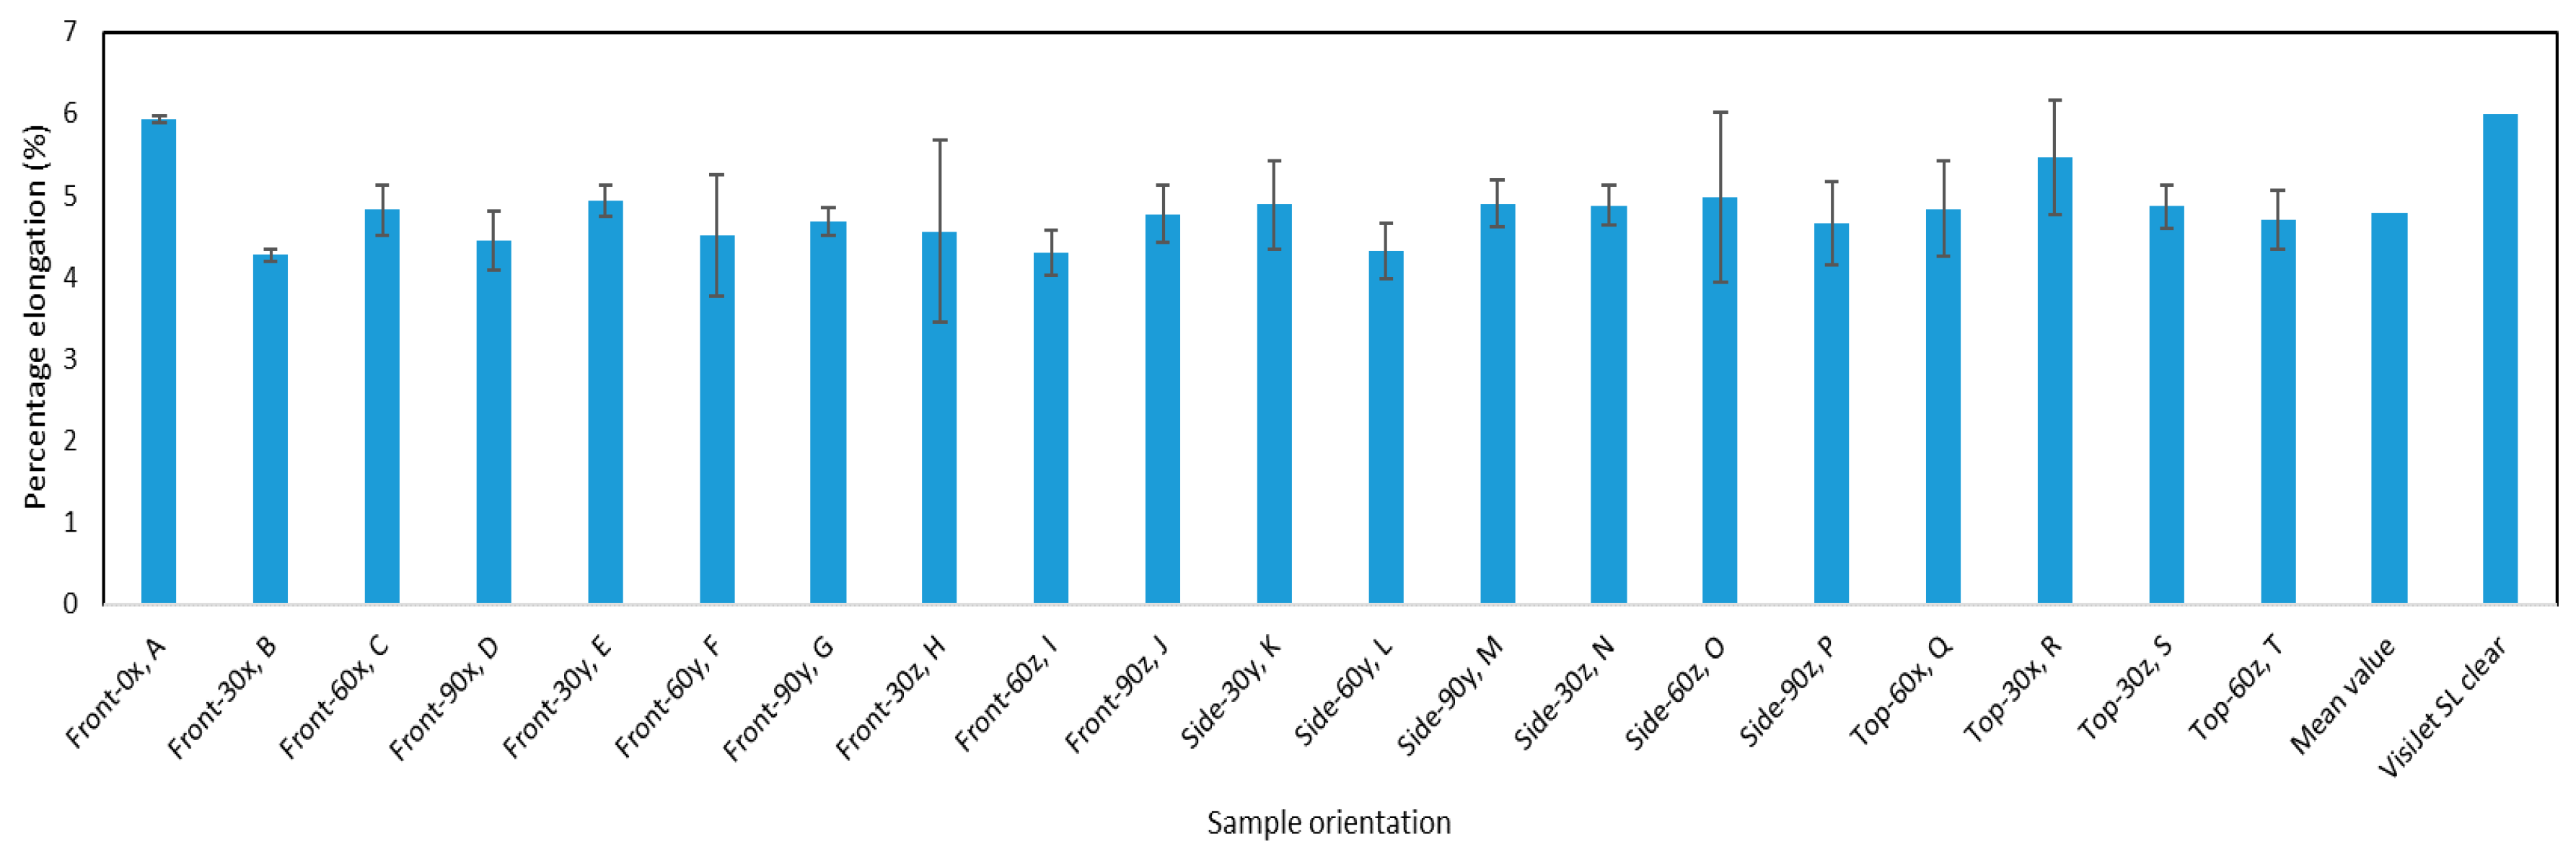
Table 20 represents the DOE setup for analyzing the dependent variable of percentage elongation as a function of the independent variable of angular orientations. Each column entry represents the percentage elongation for the angular orientations.
The ANOVA results obtained are shown in
Table 21. As seen in
Table 21, the
p-value of 0.199 is higher than the alpha value, which implies that the null hypothesis cannot be rejected. Therefore, angular orientation does not have a statistical impact on the percentage elongation.
Table 22 represents the number of observations, mean, standard deviation, and 95% confidence interval for percentage elongation for each level of the angular orientation.
Table 23 represents the DOE setup for analyzing the dependent variable of percentage elongation as a function of the independent variable of build orientations. Each column entry represents the percentage elongation for the build orientations.
The ANOVA results obtained are shown in
Table 24. As seen in
Table 24, the
p-value of 0.665 is higher than the alpha value, which implies that the null hypothesis cannot be rejected. Therefore, build orientation does not have a statistical impact on the percentage elongation.
Table 25 represents the number of observations, mean, standard deviation, and 95% confidence interval for the percentage elongation for each level of the build orientation.
Table 26 represents the DOE setup for analyzing the dependent variable of surface roughness as a function of the independent variable of build orientations. Each column entry represents the mean surface roughness for the build orientations.
The ANOVA results obtained are shown in
Table 27. As seen in
Table 27, the
p-value of 0.942 is higher than the alpha value, which implies that the null hypothesis cannot be rejected. Therefore, build orientation does not have a statistical impact on the surface roughness.
Table 28 represents the number of observations, mean, standard deviation, and 95% confidence interval for Ra for each level of the build orientation.
Table 29 represents the DOE setup for analyzing the dependent variable of surface roughness as a function of the independent variable of angular orientations. Each column entry represents the mean surface roughness for the angular orientations.
The ANOVA results obtained are shown in
Table 30. As seen in
Table 30, the
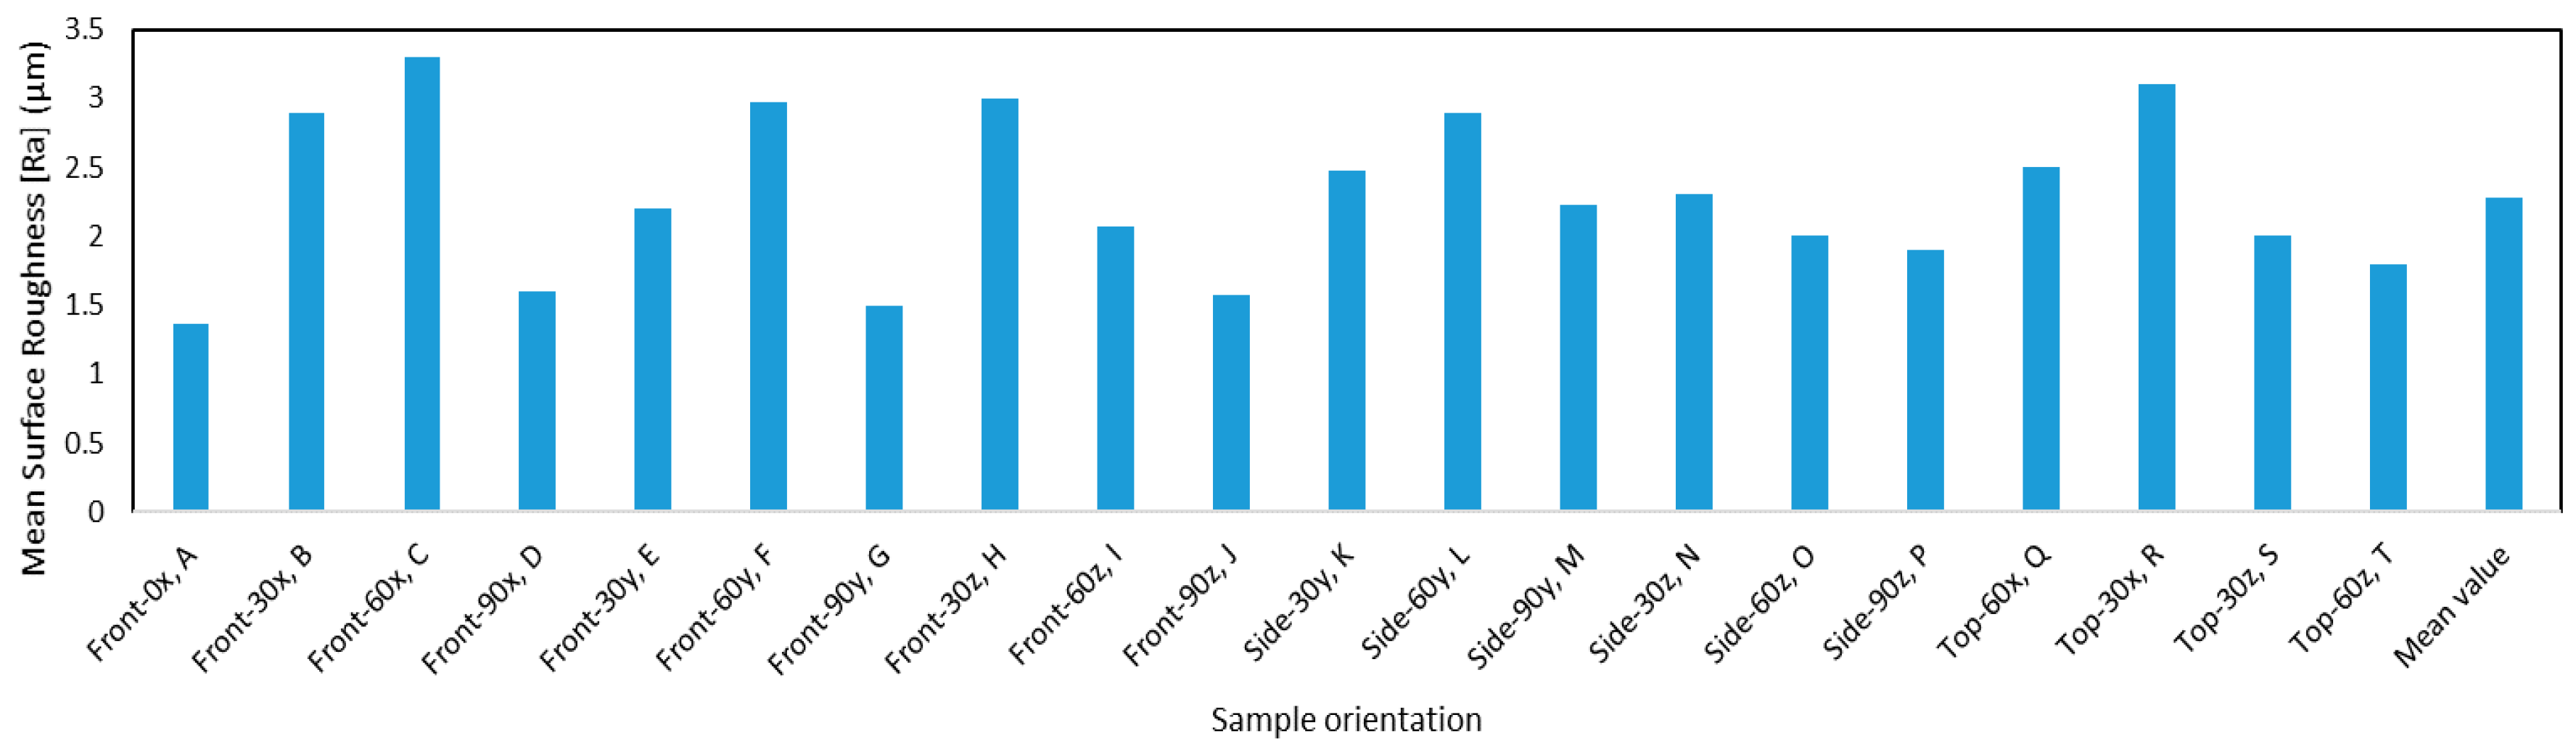
p-value of 0.000 is lower than the alpha value, which implies that the null hypothesis can be rejected. Therefore, build orientation does have a statistical impact on the surface roughness. Although a statistical significance was observed between the angular orientation and the surface roughness, it may occur due to the staircase effect, since layers that are parallel to the build direction were observed to have higher roughness. The surface where layers are parallel to the build direction is seen to have higher roughness compared to the surface with layers perpendicular to the build direction. The reason behind this increased surface roughness might be due to the staircase effect, with the angular orientation of the samples on the build table. However, from a qualitative perspective, the obtained surface roughness values are insignificant in terms of the quality of SLA printed parts as opposed to the other AM polymer parts.
Table 31 represents the number of observations, mean, standard deviation, and 95% confidence interval for Ra for each level of the angular orientation.
The difference in the results obtained through the one-way ANOVA from the previous Taguchi methods results is that in the Taguchi methods, the variance considers three independent variables and uses a highly fractionated array instead of a full factorial one. However, the results that are obtained through both methods are the same and they validate each other. Taguchi DOE was selected due to the efficient setup with the fewest possible trials considering the different levels of the independent variables. To consider the possibility of interaction effects, one-way ANOVA was also performed. The results from both the statistical methods are similar and validate that the independent variables of build and angular orientations do not have a statistical impact on the different mechanical properties. Although some variation may be seen in the bar charts, the variation is not statistically significant and occurs due to possible sources of error such as human error involved in calibrating the test experiment and a difference in the aging of the samples. The level of mechanical anisotropy in SLA printed parts was investigated using two statistical methods. The one-way ANOVA and the Taguchi analysis both yielded similar results for all the different mechanical properties such as UTS, E, and percentage elongation. Since a large number of specimens were tested in this study, the one-way ANOVA is more comprehensive than the Taguchi analysis to investigate the anisotropy of these properties. The one-way ANOVA used a full factorial DOE to analyze the variance and determine the statistical significance of the independent variables on the dependent variables. A full factorial DOE is a comprehensive setup to analyze both the main effects and interaction effects of the independent variables. The one-way ANOVA confirmed that changing the build orientation or the angular orientation does not have a statistically significant influence on the UTS, E, and percentage elongation. These results were then substantiated through the Taguchi analysis and the main effects plots. Since the results obtained by the Taguchi method were similar and validated the results obtained by one-way ANOVA, the Taguchi method is more efficient due to the minimum number of trials.


