Influence of Arc Power on Keyhole-Induced Porosity in Laser + GMAW Hybrid Welding of Aluminum Alloy: Numerical and Experimental Studies

Abstract
:1. Introduction
2. Experimental Methods
2.1. Welding Experimentation
2.2. X-Ray Non-Destructive Testing
3. Mathematical Modeling
3.1. Governing Equations
3.2. Heat Source Model
3.3. Boundary Conditions
Weld Pool Free Surface
4. Results and Discussions
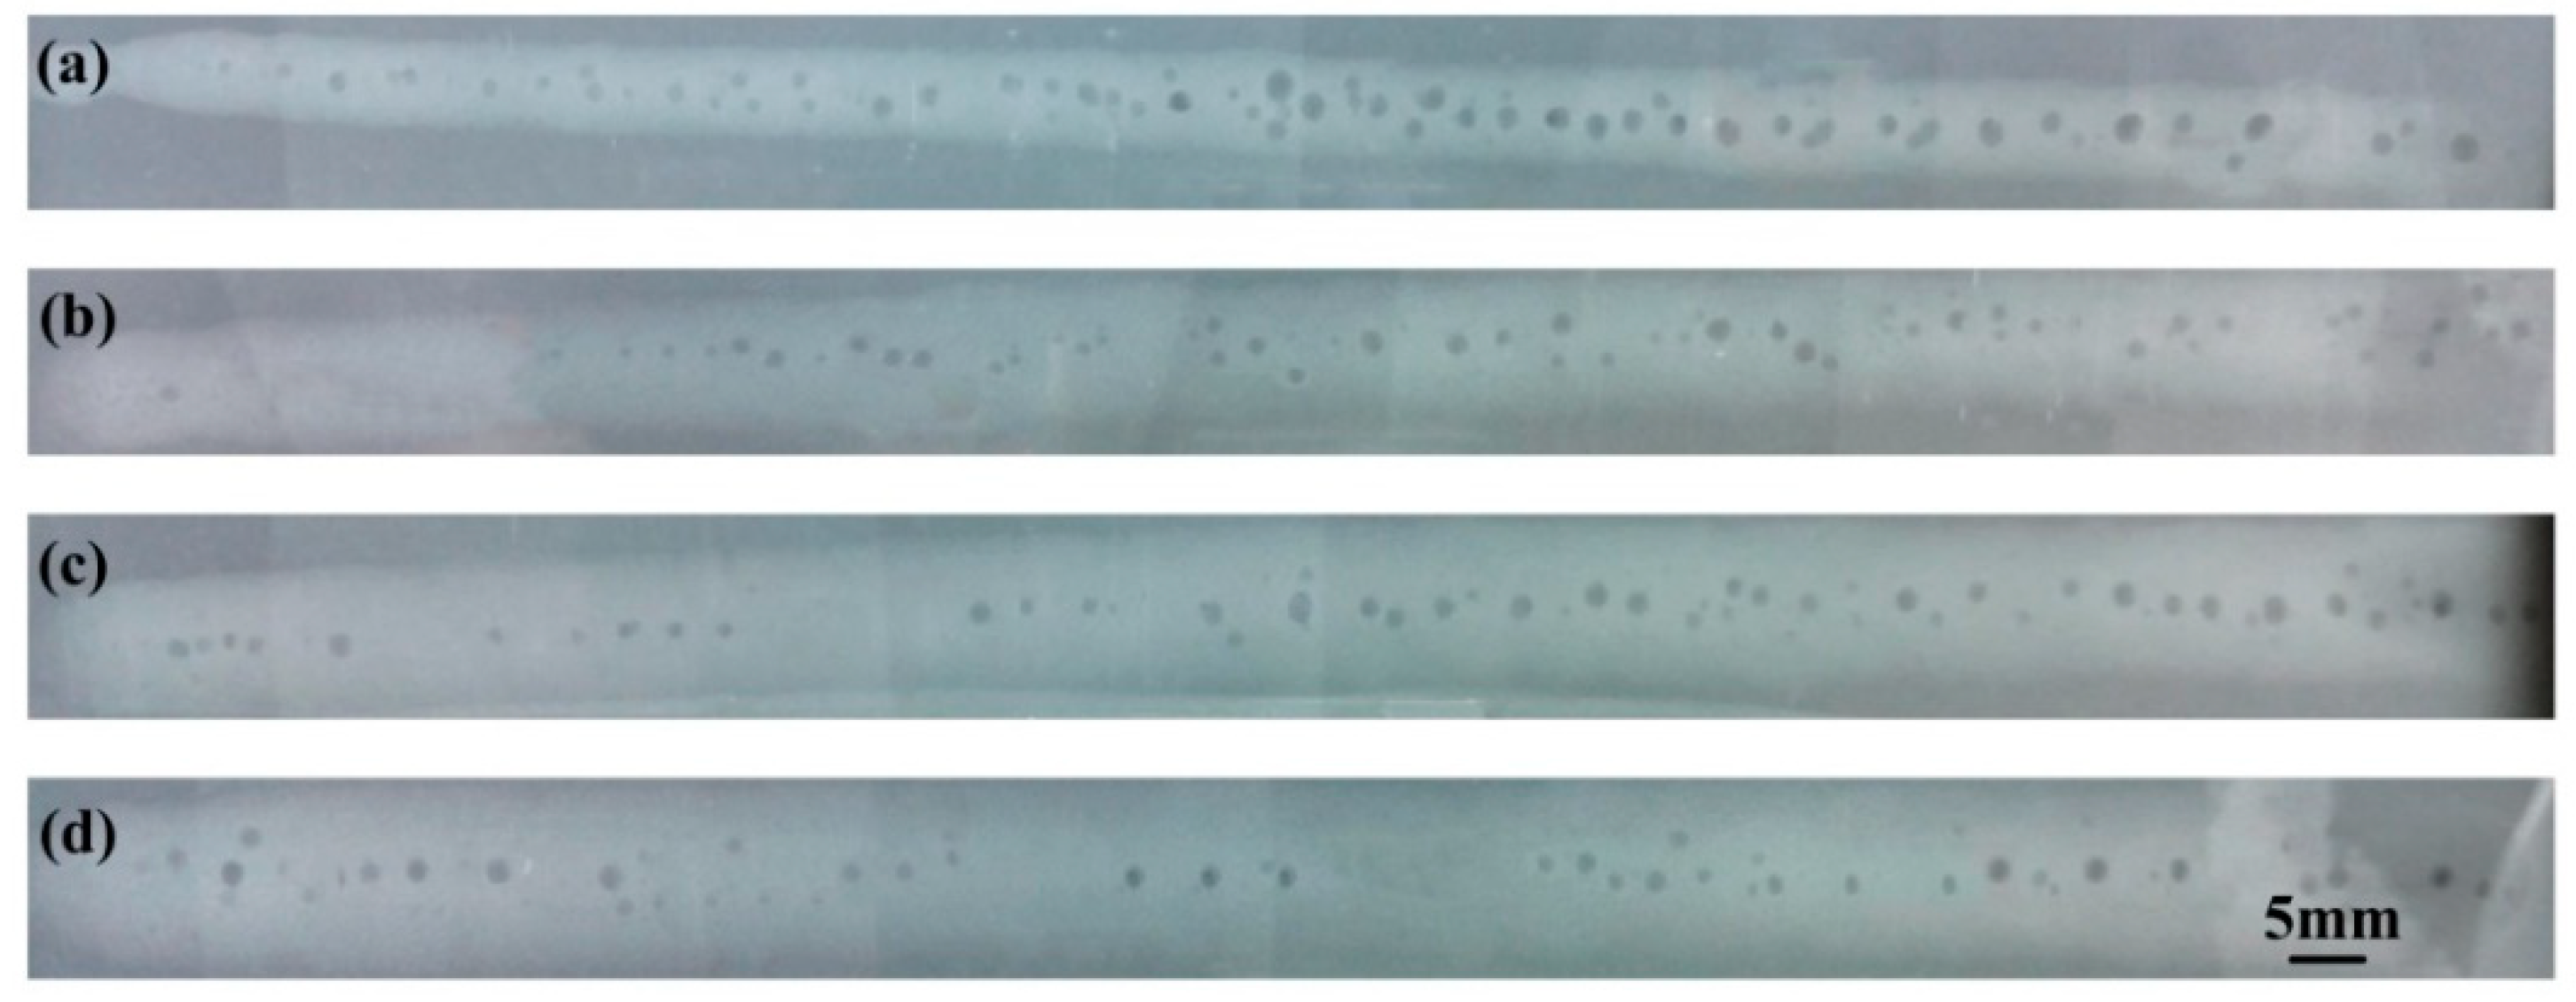
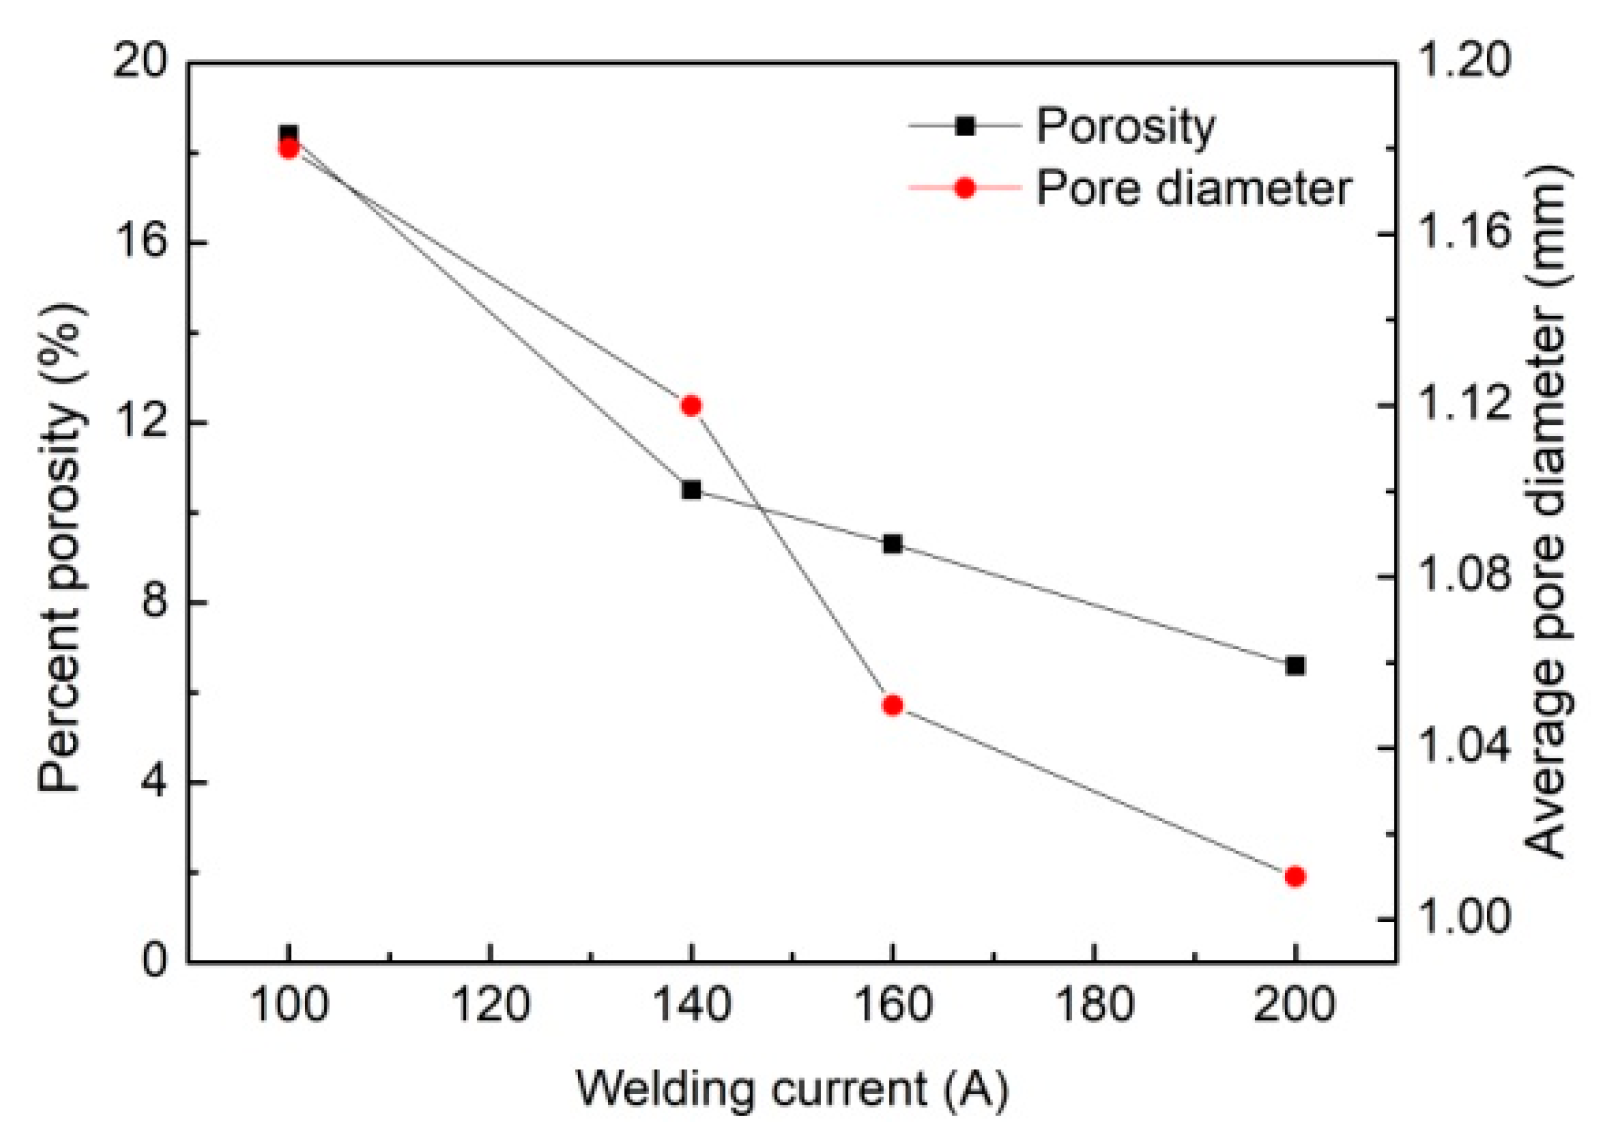
4.1. Experimental Results
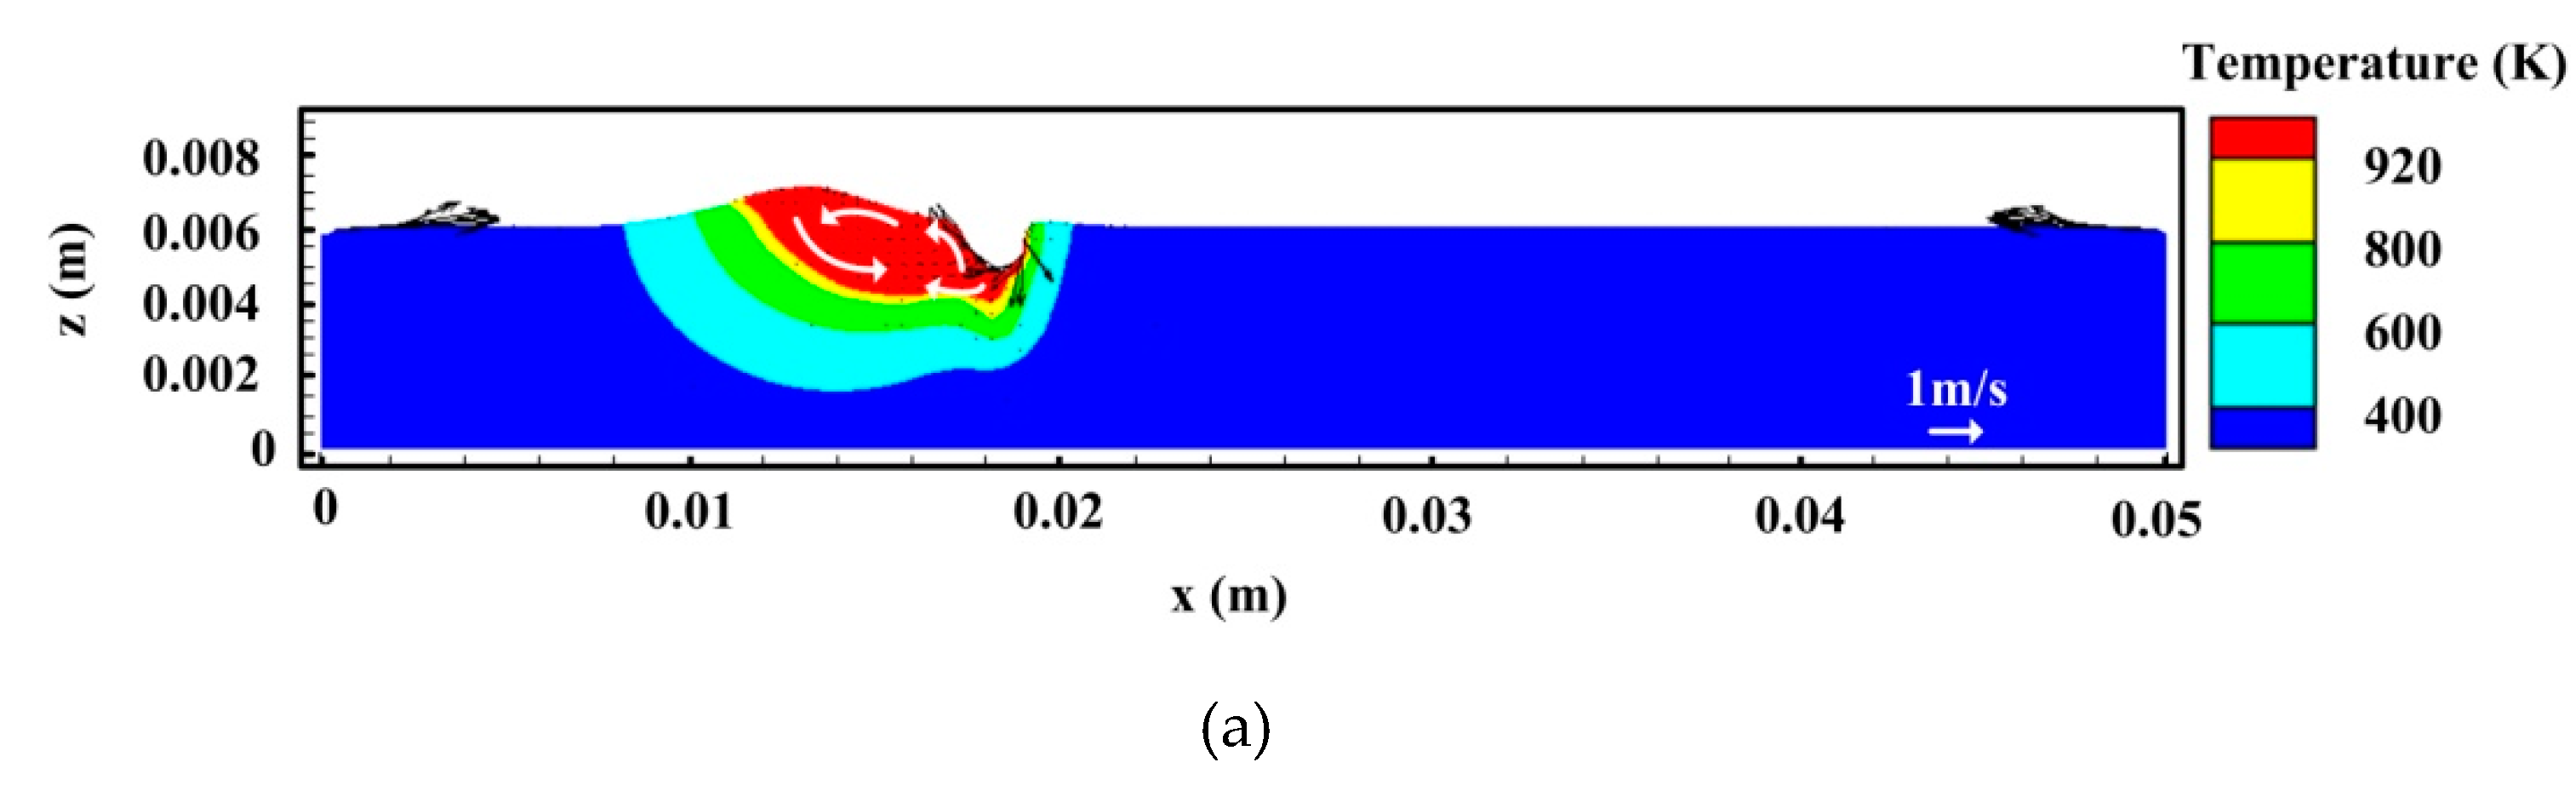
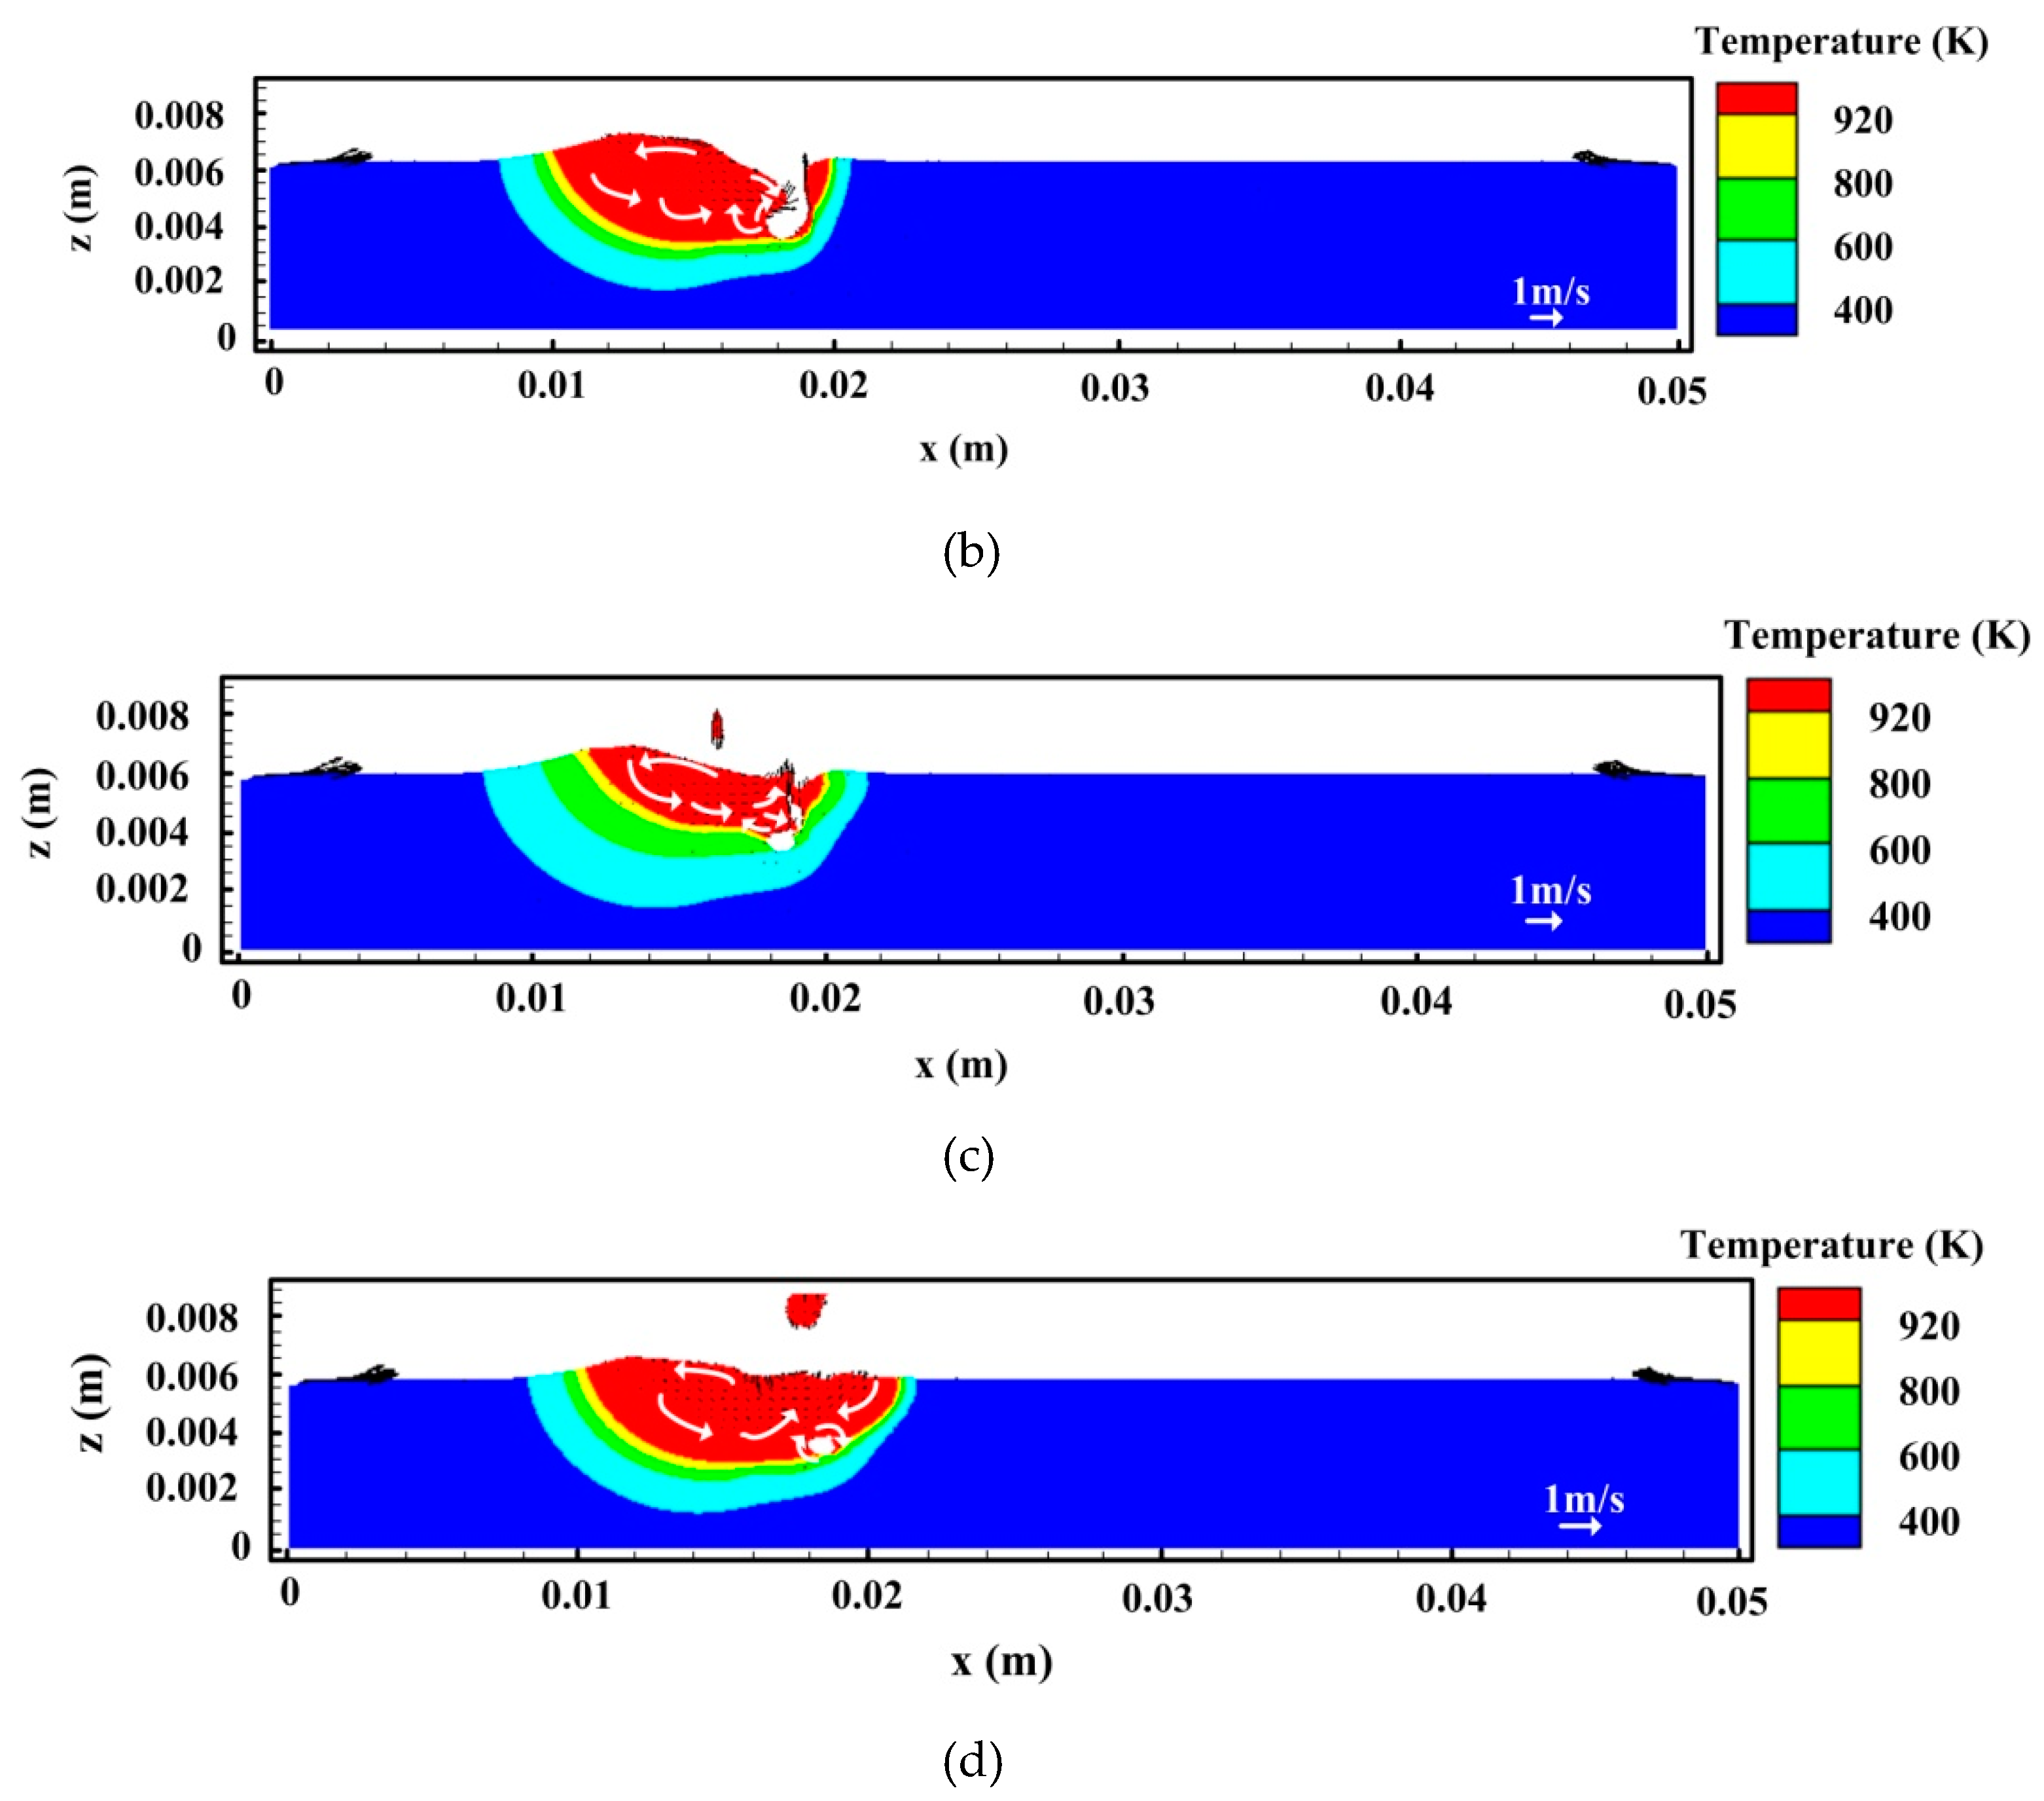
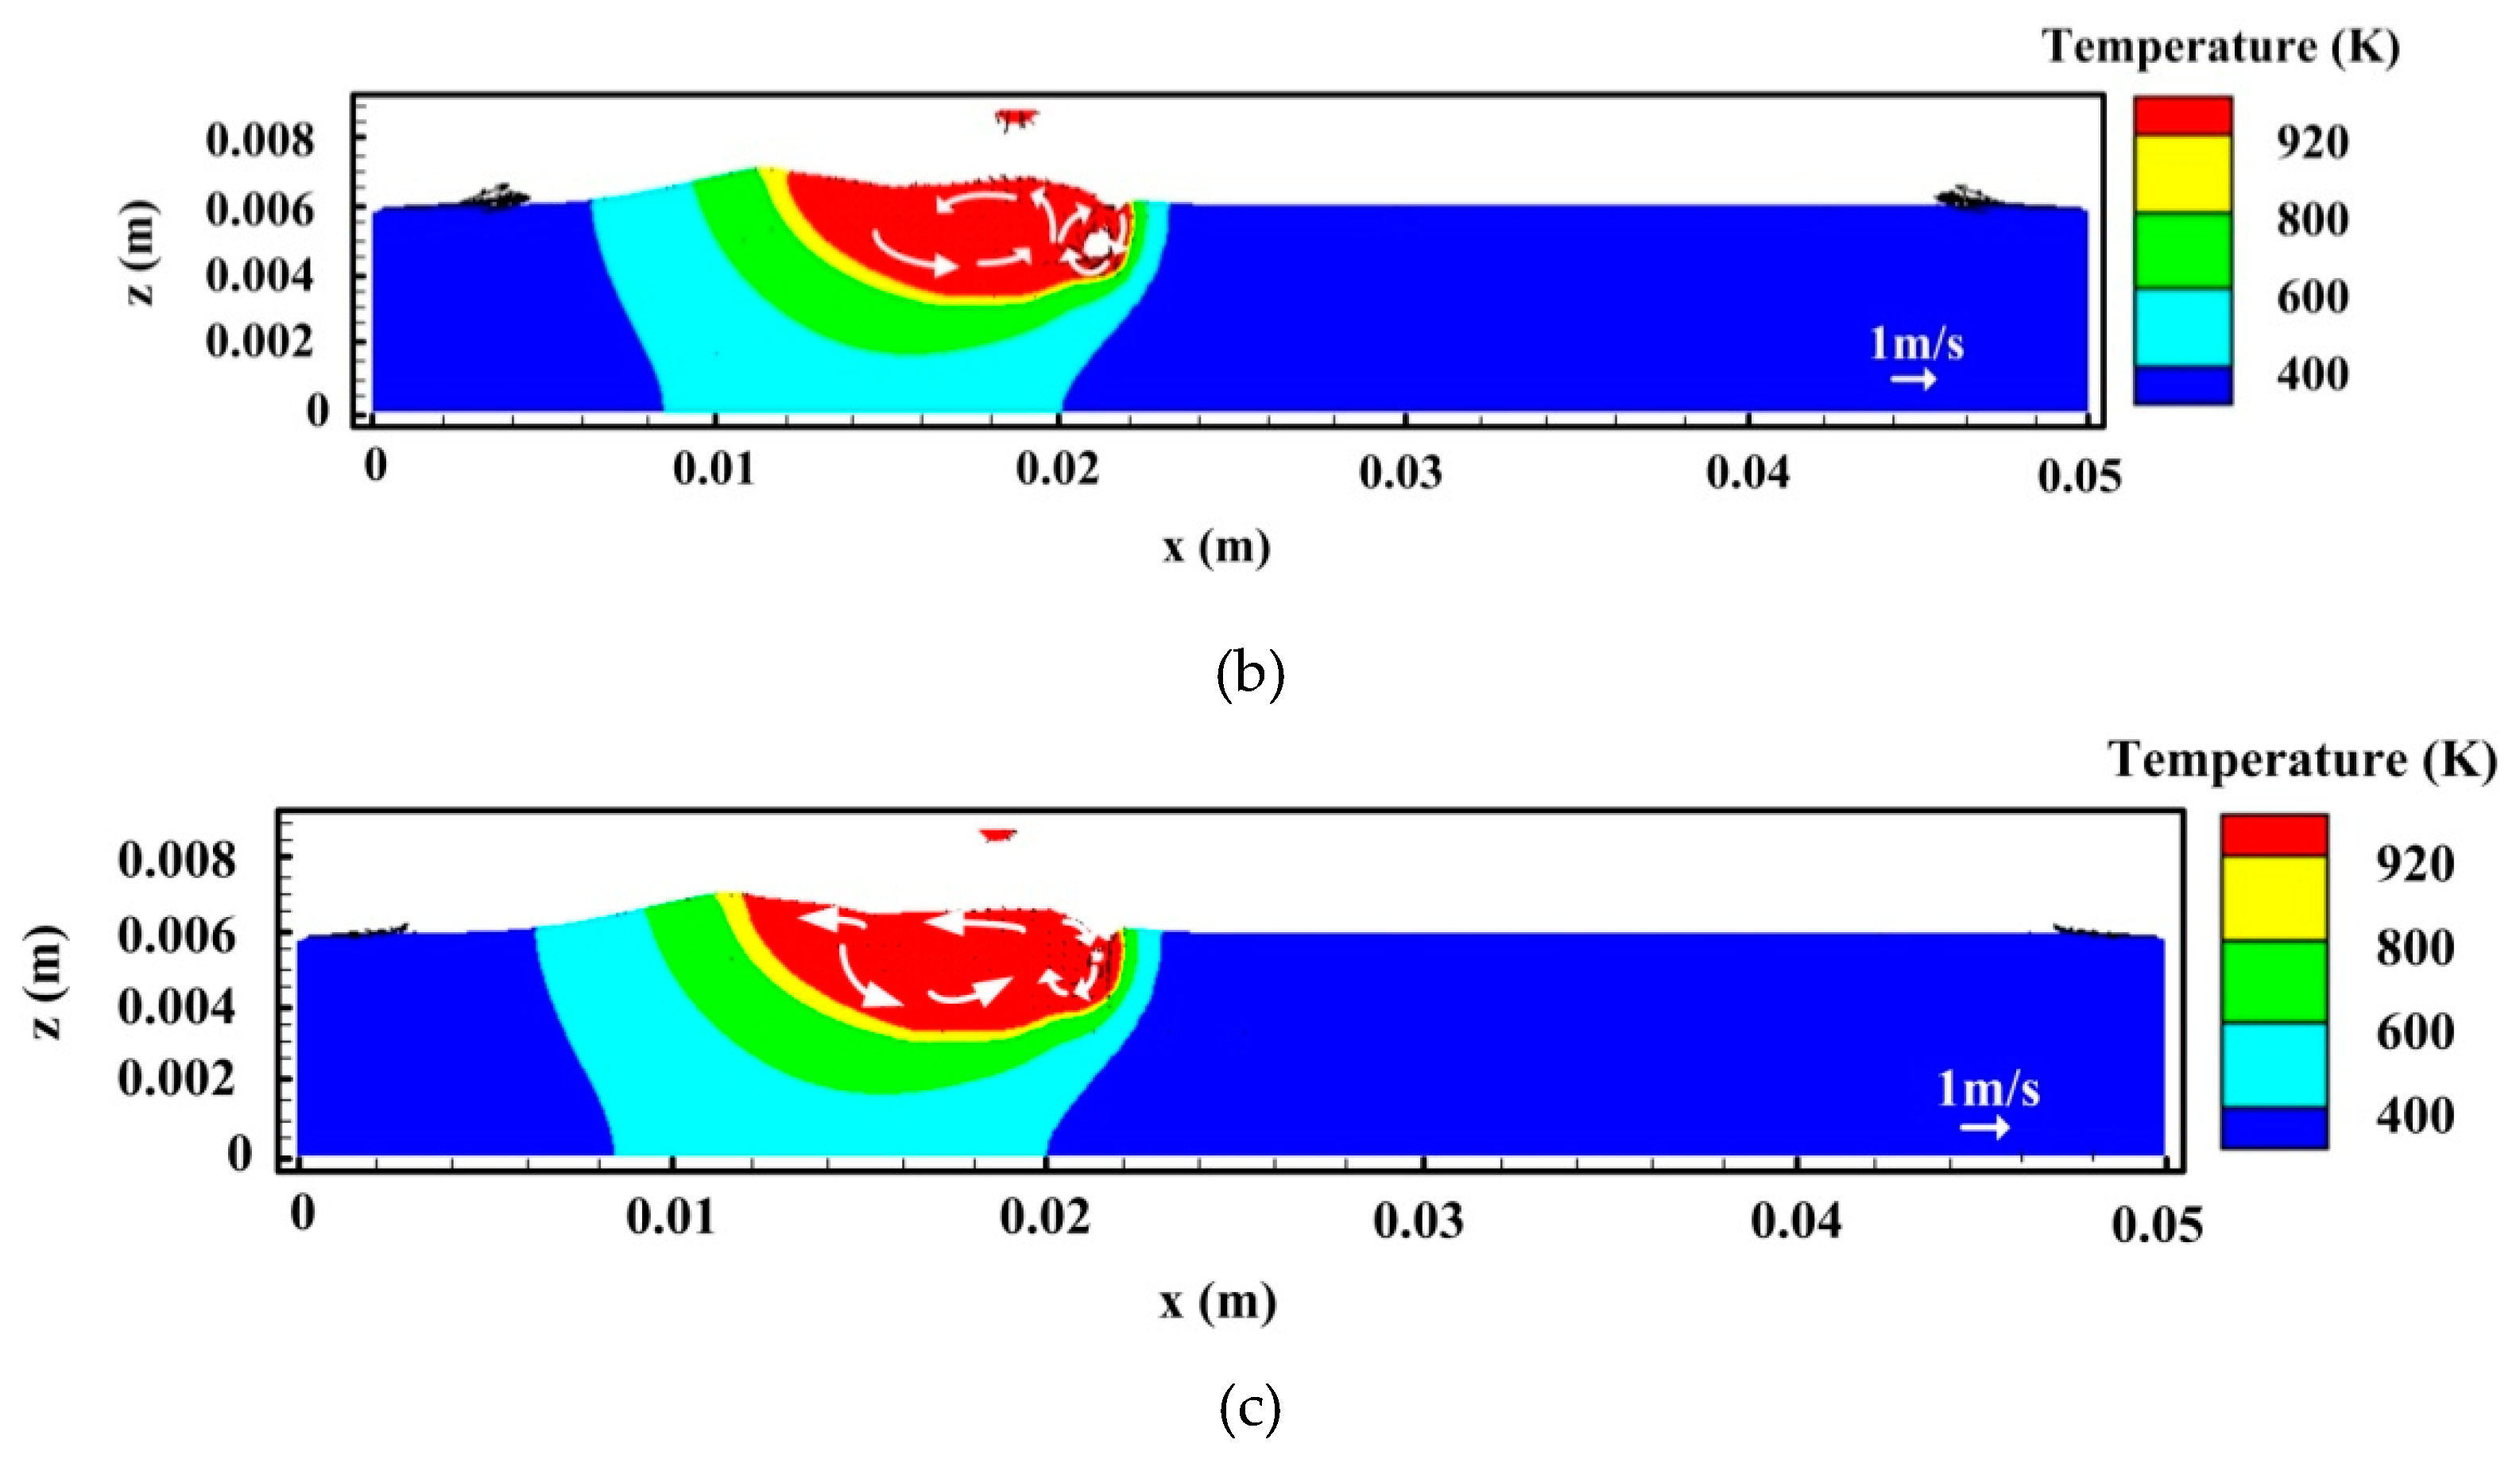
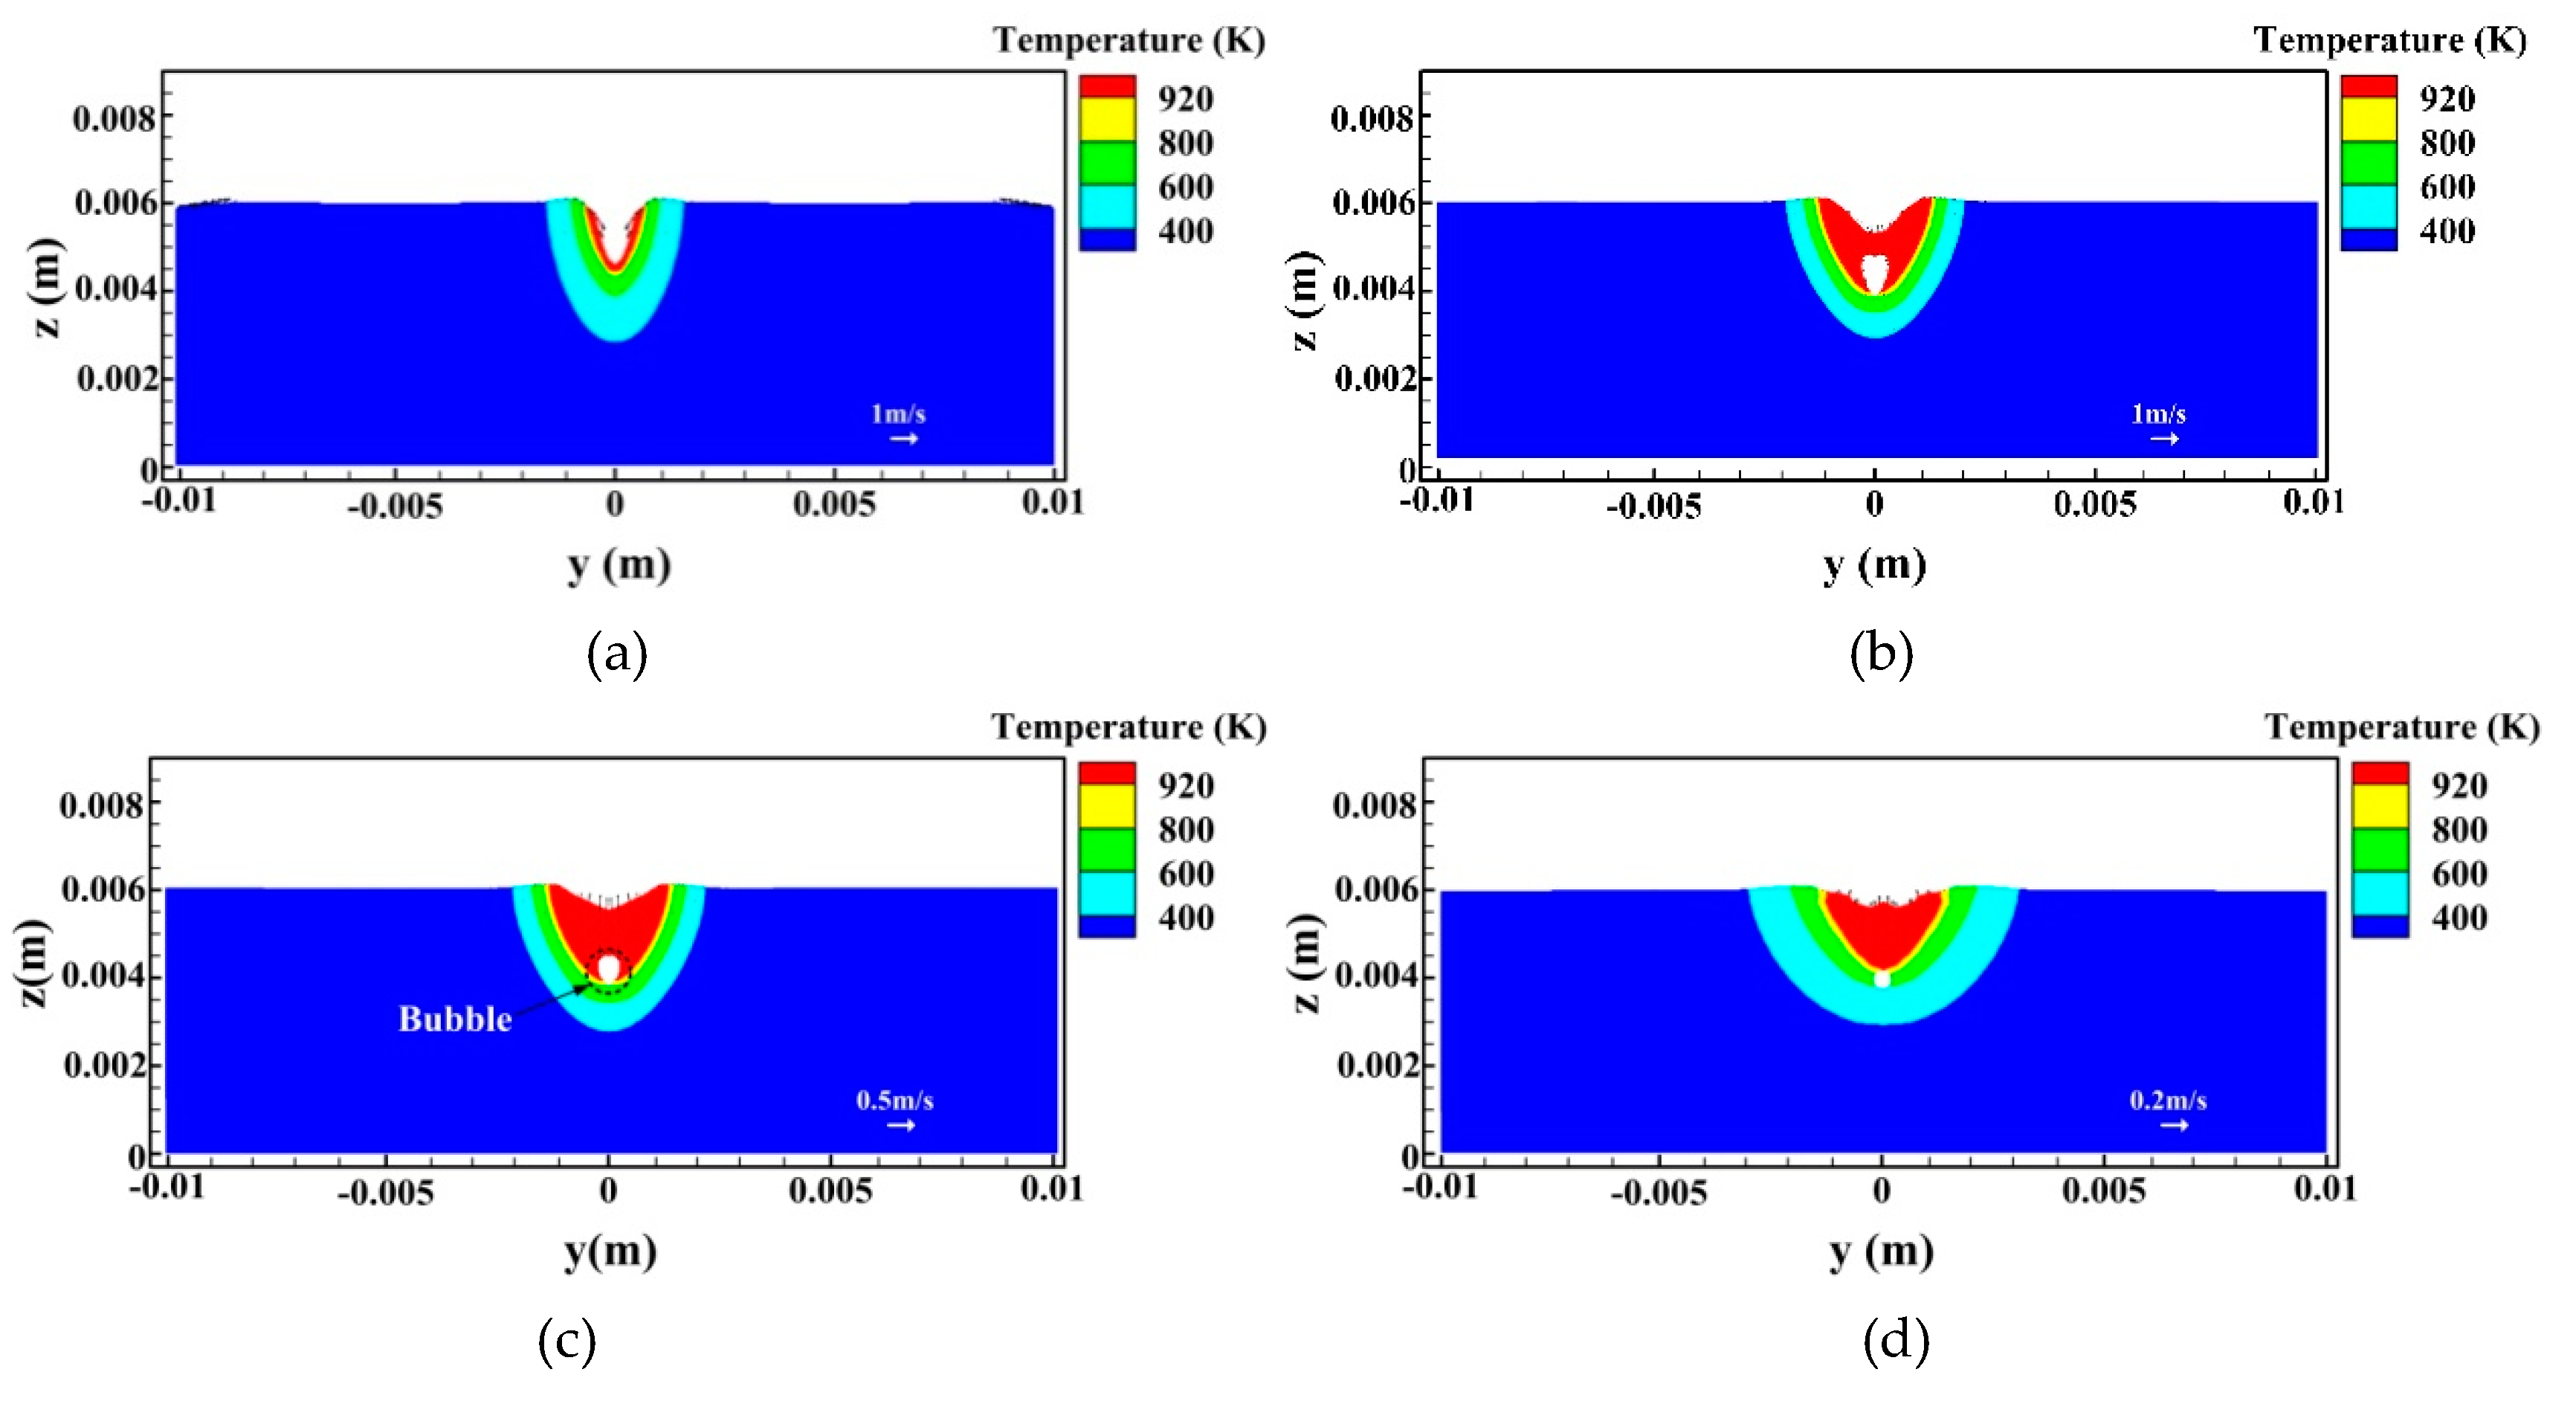
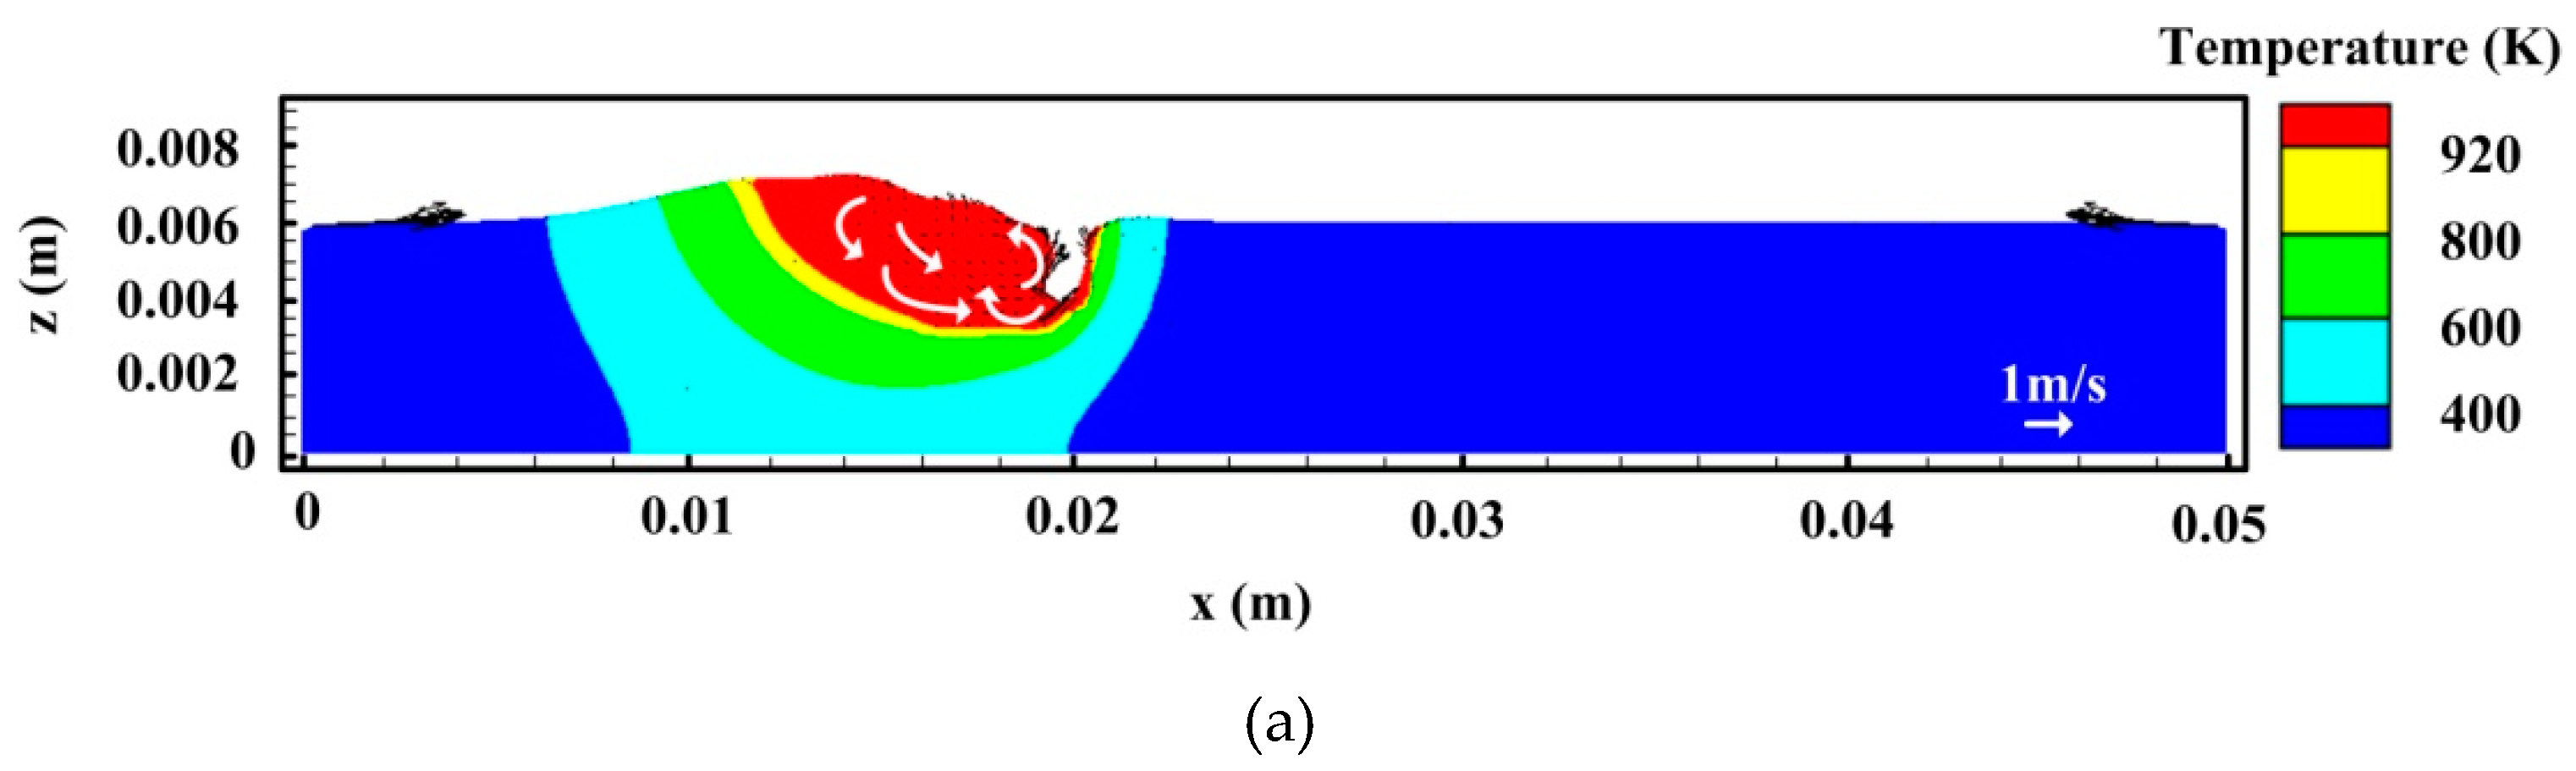
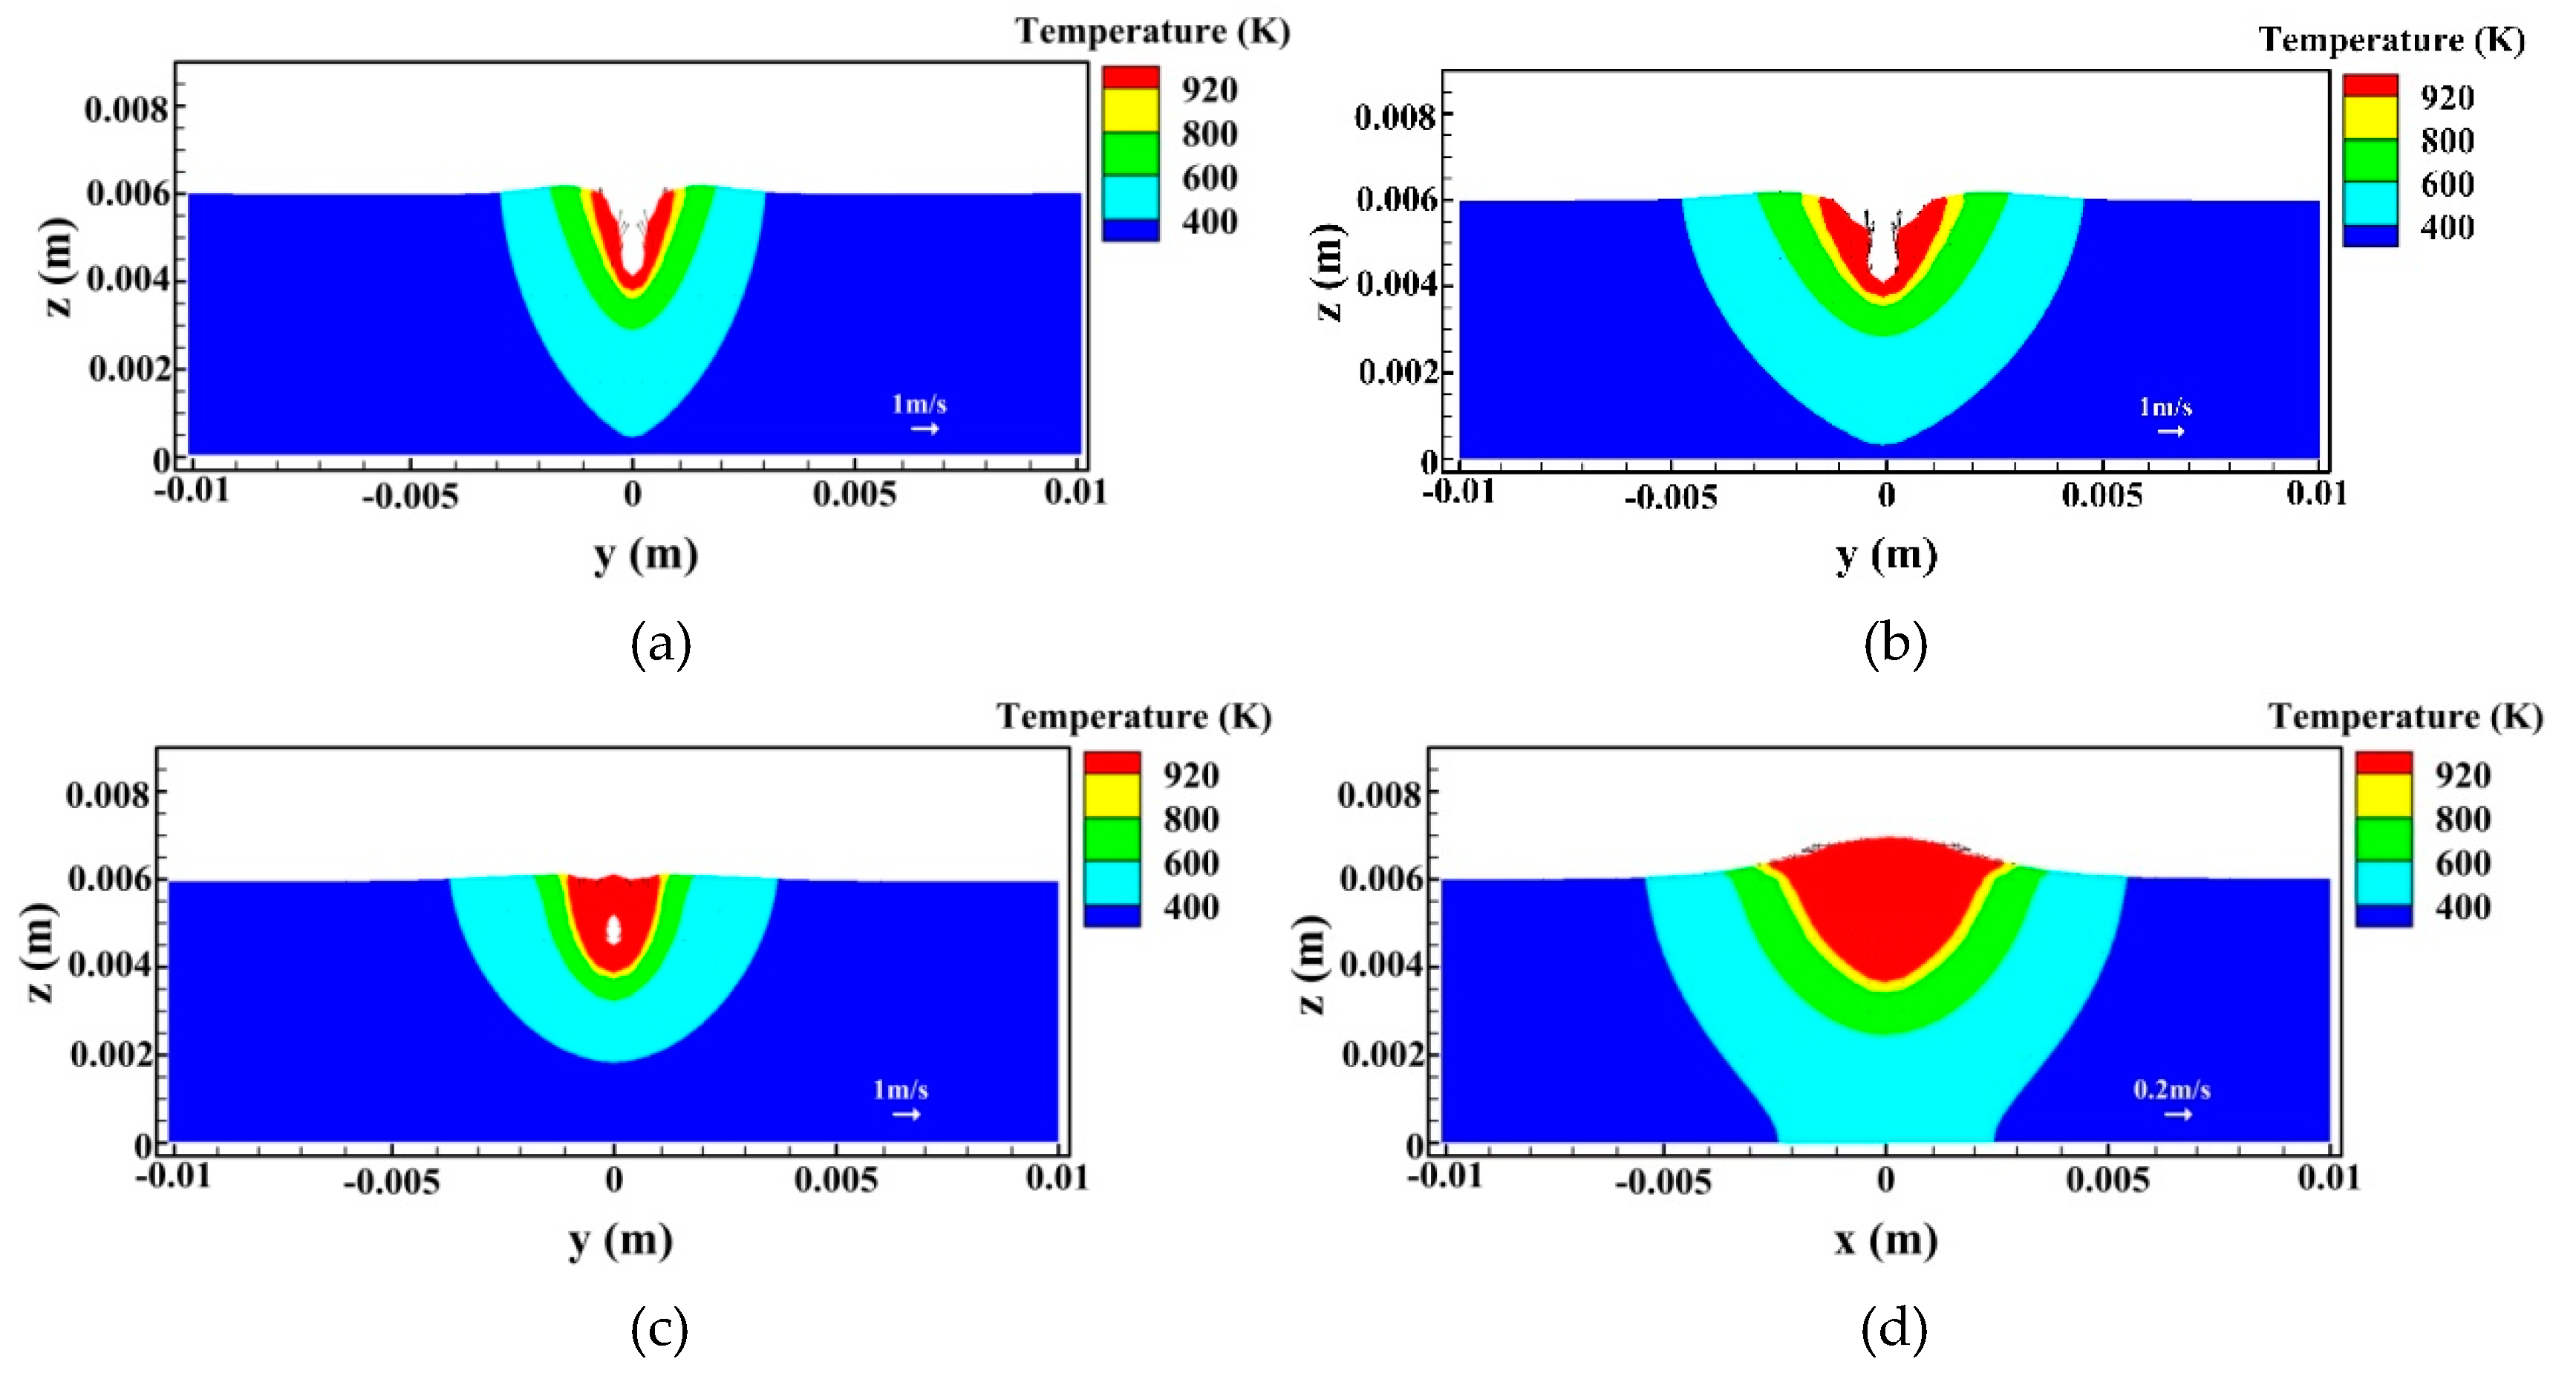
4.2. Fluid Flow Analysis
4.3. Comparisons of Experimental and Simulation Results
5. Conclusions
Author Contributions
Funding
Acknowledgments
Conflicts of Interest
References
- Wang, X.; Lu, F.; Wang, H.P.; Cui, H.; Tang, X.; Wang, Y. Mechanical constraint intensity effects on solidification cracking during laser welding of aluminum alloys. J. Mater. Process. Technol. 2015, 218, 62–70. [Google Scholar] [CrossRef]
- Ola, O.T.; Doern, F.E. Keyhole-induced porosity in laser-arc hybrid welded aluminum alloy. Int. J. Adv. Manuf. Technol. 2015, 80, 3–10. [Google Scholar] [CrossRef]
- Cui, L.; Peng, Z.B.; Yuan, X.K.; He, D.Y.; Chen, L. EBSD investigation of microtexture of weld metal and base metal in laser-welded Al-Li alloys. Materials 2018, 11, 2357. [Google Scholar] [CrossRef]
- Mahrle, A.; Beyer, E. Hybrid laser beam welding-classification, characteristics, and applications. J. Laser. Appl. 2006, 18, 169–180. [Google Scholar] [CrossRef]
- Zhang, C.; Li, G.; Gao, M.; Zeng, X.Y. Microstructure and mechanical properties of narrow gap laser-arc hybrid welded 40 mm thick mild steel. Materials 2018, 10, 106. [Google Scholar] [CrossRef] [PubMed]
- Ascari, A.; Fortunato, A.; Orazi, L.; Campana, G. The influence of process parameters on porosity formation in hybrid LASER-GMA welding of AA6082 aluminum alloy. Opt. Laser. Technol. 2012, 44, 1485–1490. [Google Scholar] [CrossRef]
- Huang, L.J.; Hua, X.M.; Wu, D.S.; Fang, L. Experimental Investigation and Numerical Study on the Elimination of Porosity in Aluminum Alloy Laser Welding and Laser–GMA Welding. J. Mater. Eng. Perform. 2017, 26, 2912–2918. [Google Scholar] [CrossRef]
- Katayama, S.; Uchiumi, S.; Mizutani, M.; Wang, J.; Fuji, K. Penetration and porosity prevention mechanism in YAG laser-MIG hybrid welding. Weld. Inter. 2007, 21, 25–31. [Google Scholar] [CrossRef]
- Bunaziv, I.; Akeselsen, O.M.; Salminen, A.; Unt, A. Fiber laser-MIG hybrid welding of 5mm 5083 aluminum alloy. J. Mater. Process. Technol. 2016, 233, 107–144. [Google Scholar] [CrossRef]
- Zhang, C.; Gao, M.; Wang, D.Z.; Zhen, J.; Zeng, X.Y. Relationship between pool characteristic and weld porosity in laser Arc hybrid welding of AA6082 aluminum alloy. J. Mater. Process. Technol. 2017, 240, 217–222. [Google Scholar] [CrossRef]
- Ribic, B.; Rai, R.; DebRoy, T. Numerical simulation of heat transfer and fluid flow in GTA/Laser hybrid welding. Sci. Technol. Weld. Join. 2008, 13, 683–693. [Google Scholar] [CrossRef]
- Xu, G.X.; Zhang, W.W.; Liu, P.; Du, B.S. Numerical analysis of fluid flow in laser+GMAW hybrid welding. Acta Metall. Sin. 2015, 51, 713–723. [Google Scholar]
- Huang, L.J.; Hua, X.M.; Wu, D.S.; Fang, L.; Cai, Y.; Ye, Y.X. Effect of magnesium content on keyhole-induced porosity formation and distribution in aluminum alloys laser welding. J. Manuf. Technol. 2018, 33, 43–53. [Google Scholar] [CrossRef]
- Xu, G.X.; Pan, H.C.; Liu, P.; Li, P.F.; Hu, Q.X.; Du, B.S. Finite element analysis of residual stress in hybrid laser-arc welding for butt joint of 12 mm-thick steel plate. Weld. World 2018, 63, 289–300. [Google Scholar] [CrossRef]
- Cho, W.D.; Na, S.J.; Cho, M.H.; Lee, J.S. A study on V-groove GMAW for various welding positions. J. Mater. Process. Technol. 2013, 213, 1640–1652. [Google Scholar] [CrossRef]
- Cho, J.H.; Na, S.J. Three dimensional analysis of molten pool in GMA-laser hybrid welding. Weld. J. 2009, 88, 35–43. [Google Scholar]
- Kik, T.; Górka, J. Numerical simulation of laser and hybrid S700MC T-joint welding. Materials 2019, 12, 516. [Google Scholar] [CrossRef] [PubMed]
- Xu, G.X.; Li, P.F.; Cao, Q.N.; Hu, Q.X.; Gu, X.Y.; Du, B.S. Modelling of fluid flow phenomenon in laser+GMAW hybrid welding of aluminum alloy considering three phase coupling and arc plasma shear stress. Opt. Laser Technol. 2018, 100, 244–255. [Google Scholar] [CrossRef]
- Zhou, J.; Tsai, H. Porosity formation and prevention in pulsed laser welding. J. Heat Tranf. 2007, 129, 1104–1204. [Google Scholar] [CrossRef]
- Zhao, H.Y.; Niu, W.H.; Zhang, B.; Lei, Y.P.; Kodama, M.; Ishide, T. Modelling of keyhole dynamics and porosity formation considering the adaptive keyhole shape and three-phase coupling during deep-penetration laser welding. J. Phys. D Appl. Phys. 2011, 44, 485302. [Google Scholar] [CrossRef]
- Cho, W.I.; Na, S.J.; Cho, M.H. Numerical study of alloying element distribution in CO2 laser-GMA hybrid welding. Comput. Mater. Sci. 2010, 49, 792–800. [Google Scholar] [CrossRef]
- Li, X.B.; Lu, F.G.; Cui, H.C.; Tang, X.H. Numerical modeling on the formation process of keyhole-induced porosity for laser welding steel with T-joint. Int. J. Adv. Manuf. Technol. 2014, 72, 241–254. [Google Scholar] [CrossRef]
- Xu, G.X.; Cao, Q.N.; Hu, Q.X.; Zhang, W.W.; Liu, P.; Du, B.S. Modelling of bead hump formation in high speed gas metal arc welding. Sci. Tecnol. Weld. Join. 2016, 21, 700–710. [Google Scholar] [CrossRef]
- Zhang, Z.Z.; Wu, C.S. Effect of fluid flow in the weld pool on the numerical simulation accuracy of the thermal field in hybrid welding. J. Manuf. Process. 2015, 20, 215–223. [Google Scholar] [CrossRef]
- Goldak, J.; Chakravarti, A.; Bibby, M. A new finite element model for welding heat sources. Metall. Trans. B 2018, 15, 229–305. [Google Scholar] [CrossRef]
- Kim, C.H.; Zhang, W.; Debroy, T. Modeling of temperature field and solidified surface profile during gas–metal arc fillet welding. J. Appl. Phys. 2003, 94, 2667–2679. [Google Scholar] [CrossRef]
- Murphy, A.B.; Arundell, C.J. Transport coefficients of argon, nitrogen, oxygen, argon-nitrogen, and argon-oxygen plasma. Plasma Chem. Plasma Process. 1994, 14, 451–488. [Google Scholar] [CrossRef]
- Pang, S.Y.; Chen, W.D.; Zhou, J.X.; Liao, D.M. Self-consistent modeling of keyhole and weld pool dynamics in tandem dual beam laser welding of aluminum alloy. J. Mater. Process. Technol. 2015, 27, 131–143. [Google Scholar] [CrossRef]
- Pang, S.; Chen, L.; Zhou, J.; Yin, Y.; Chen, T. A three-dimensional sharp interface model for self-consistent keyhole and weld pool dynamics in deep penetration laser welding. J. Phys. D Appl. Phys. 2011, 44, 025301. [Google Scholar] [CrossRef]


| No. | Welding Current (A) | Laser Power (kW) | Welding Speed (m/min) |
|---|---|---|---|
| 1 | 100 | 2 | 1.2 |
| 2 | 140 | 2 | 1.2 |
| 3 | 160 | 2 | 1.2 |
| 4 | 200 | 2 | 1.2 |
| Name | Value |
|---|---|
| Density of the aluminum alloy, ρ | 2700 kg/m3 |
| Dynamic viscosity of the liquid phase, μ | 0.001 kg/(m3·s) |
| Thermal conductivity of the solid phase, ks | 220 W/(m·K) |
| Thermal conductivity of the liquid phase, kl | 150 W/(m·K) |
| Specific heat of the liquid phase, cpl | 1200 J/(kg·K) |
| Specific heat of the solid phase, cps | 900 J/(kg·K) |
| Latent heat of fusion, Lm | 3.95 × 10⁵ J/kg |
| Latent heat of evaporation, Lb | 1.07 × 10⁷ J/kg |
| Thermal expansion, β | 2.36 × 10⁻⁵ /K |
| Solidus temperature, Ts | 858 K |
| Liquidus temperature, Tl | 923 K |
| Ambient temperature, T0 | 293 K |
| Permeability of steel, μm | 1.26 × 10⁻⁶ H/m |
| Surface radiation emissivity, ε | 0.4 |
| Boltzmann constant, kb | 5.57 × 10⁻⁸ W/(m2·K4) |
| Coefficient in Equation (14), kp | 0.5 |
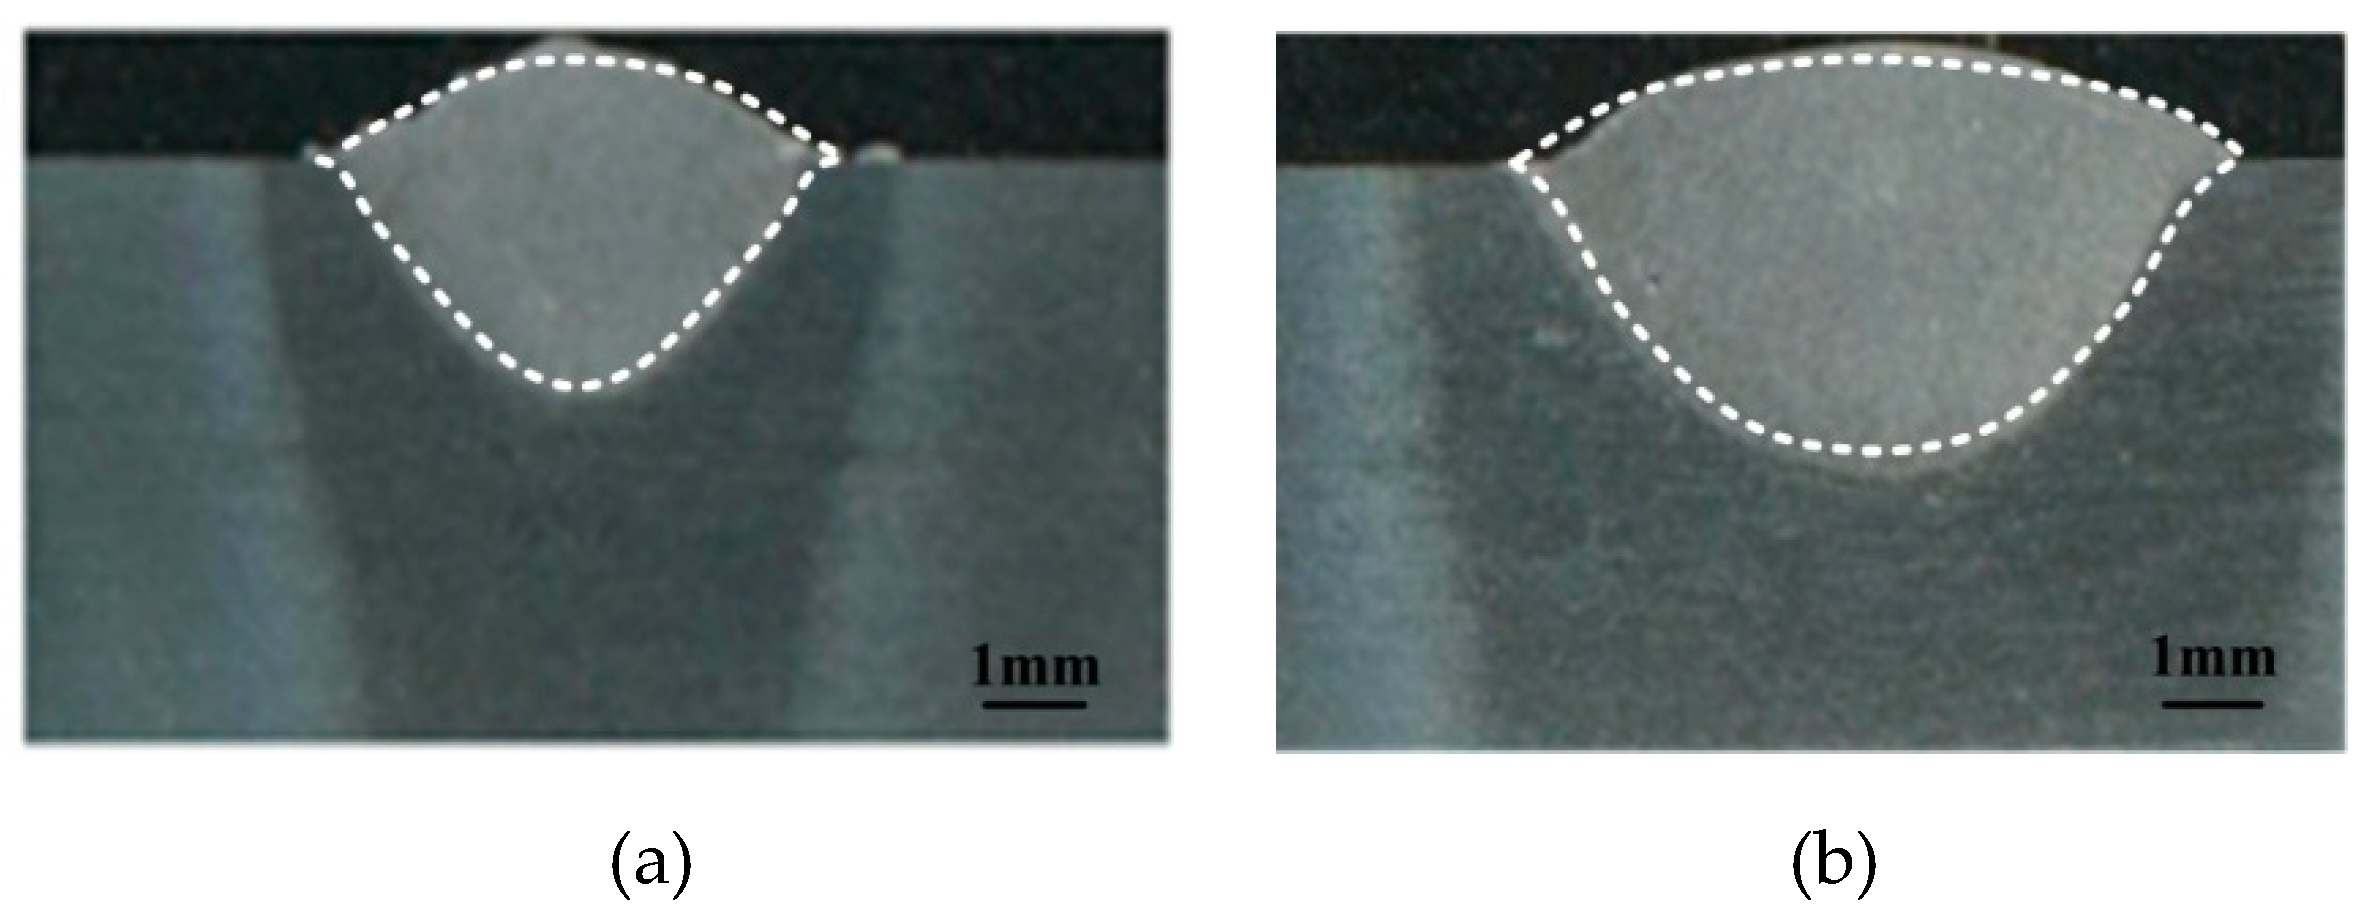
| Welding Current (A) | Weld Penetration Depth (mm) | Weld Width (mm) | ||
|---|---|---|---|---|
| Measured | Calculated | Measured | Calculated | |
| 160 | 2.4 | 2.2 | 6.65 | 5.9 |
| 200 | 3.2 | 3.0 | 7.52 | 7.23 |
© 2019 by the authors. Licensee MDPI, Basel, Switzerland. This article is an open access article distributed under the terms and conditions of the Creative Commons Attribution (CC BY) license (http://creativecommons.org/licenses/by/4.0/).
Share and Cite
Xu, G.; Li, P.; Li, L.; Hu, Q.; Zhu, J.; Gu, X.; Du, B. Influence of Arc Power on Keyhole-Induced Porosity in Laser + GMAW Hybrid Welding of Aluminum Alloy: Numerical and Experimental Studies. Materials 2019, 12, 1328. https://doi.org/10.3390/ma12081328
Xu G, Li P, Li L, Hu Q, Zhu J, Gu X, Du B. Influence of Arc Power on Keyhole-Induced Porosity in Laser + GMAW Hybrid Welding of Aluminum Alloy: Numerical and Experimental Studies. Materials. 2019; 12(8):1328. https://doi.org/10.3390/ma12081328
Chicago/Turabian StyleXu, Guoxiang, Pengfei Li, Lin Li, Qingxian Hu, Jie Zhu, Xiaoyan Gu, and Baoshuai Du. 2019. "Influence of Arc Power on Keyhole-Induced Porosity in Laser + GMAW Hybrid Welding of Aluminum Alloy: Numerical and Experimental Studies" Materials 12, no. 8: 1328. https://doi.org/10.3390/ma12081328
APA StyleXu, G., Li, P., Li, L., Hu, Q., Zhu, J., Gu, X., & Du, B. (2019). Influence of Arc Power on Keyhole-Induced Porosity in Laser + GMAW Hybrid Welding of Aluminum Alloy: Numerical and Experimental Studies. Materials, 12(8), 1328. https://doi.org/10.3390/ma12081328