Ambient Cured Fly Ash Geopolymer Coatings for Concrete


Abstract
1. Introduction
2. Theory
2.1. Geopolymer Fabrication
- Low cost: as fly ash is a by-product of coal combustion, it is cheap and available in large volumes around the world [30]. While there is a looming shortage of fly ash for use as a concrete additive [52], the availability for geopolymer coatings (a low volume application) is still high, as one billion tons of fly ash are still produced annually worldwide in coal-fired steam power plants [53].
- The mass ratio, L/A;
- The mass ratio, SH/SS;
- The molarity of the SH (which typically ranges from 8–14 M).
2.2. Factors Affecting Geopolymer Coatings on Concrete Substrates
2.2.1. Shrinkage and Curing
2.2.2. Adhesion, Workability and Setting Time
- High surface tension: this plays a key role in the ability of the materials to bind and stay bound to substrates. A reduction in surface tension may, in some cases, be required to ensure good adhesion [67]. With respect to geopolymer microstructure formation, the water to solid ratio can significantly affect the process of geopolymerization, and hence the properties of coatings, such as their workability and adhesion [5].
- Thixotropic Bingham plastic fluid behavior: most geopolymers show history-dependent rheological behavior, and can be kept in fluid form if subjected to constant shearing [13,68,69]. Their rheological behavior can also be tuned by altering the molar concentration of the sodium hydroxide and the ratio of silicate to hydroxide solutions [70].
- Setting times that are strongly dependent on chemical composition: the setting time of geopolymers can range from minutes to hours and depends on geopolymer composition. Setting times can be reduced by lowering Si/Al ratios, or by increasing calcium (Ca) content [61]. For systems with high Si/Al ratios, polymerisation is more likely to occur among silicate species; however, when Si/Al ratios are lowered, polymerisation is more likely to occur between aluminate and silicate species. As condensation among silicate species is slower than that between aluminate and silicate species, setting is delayed with higher Si/Al ratios [71].
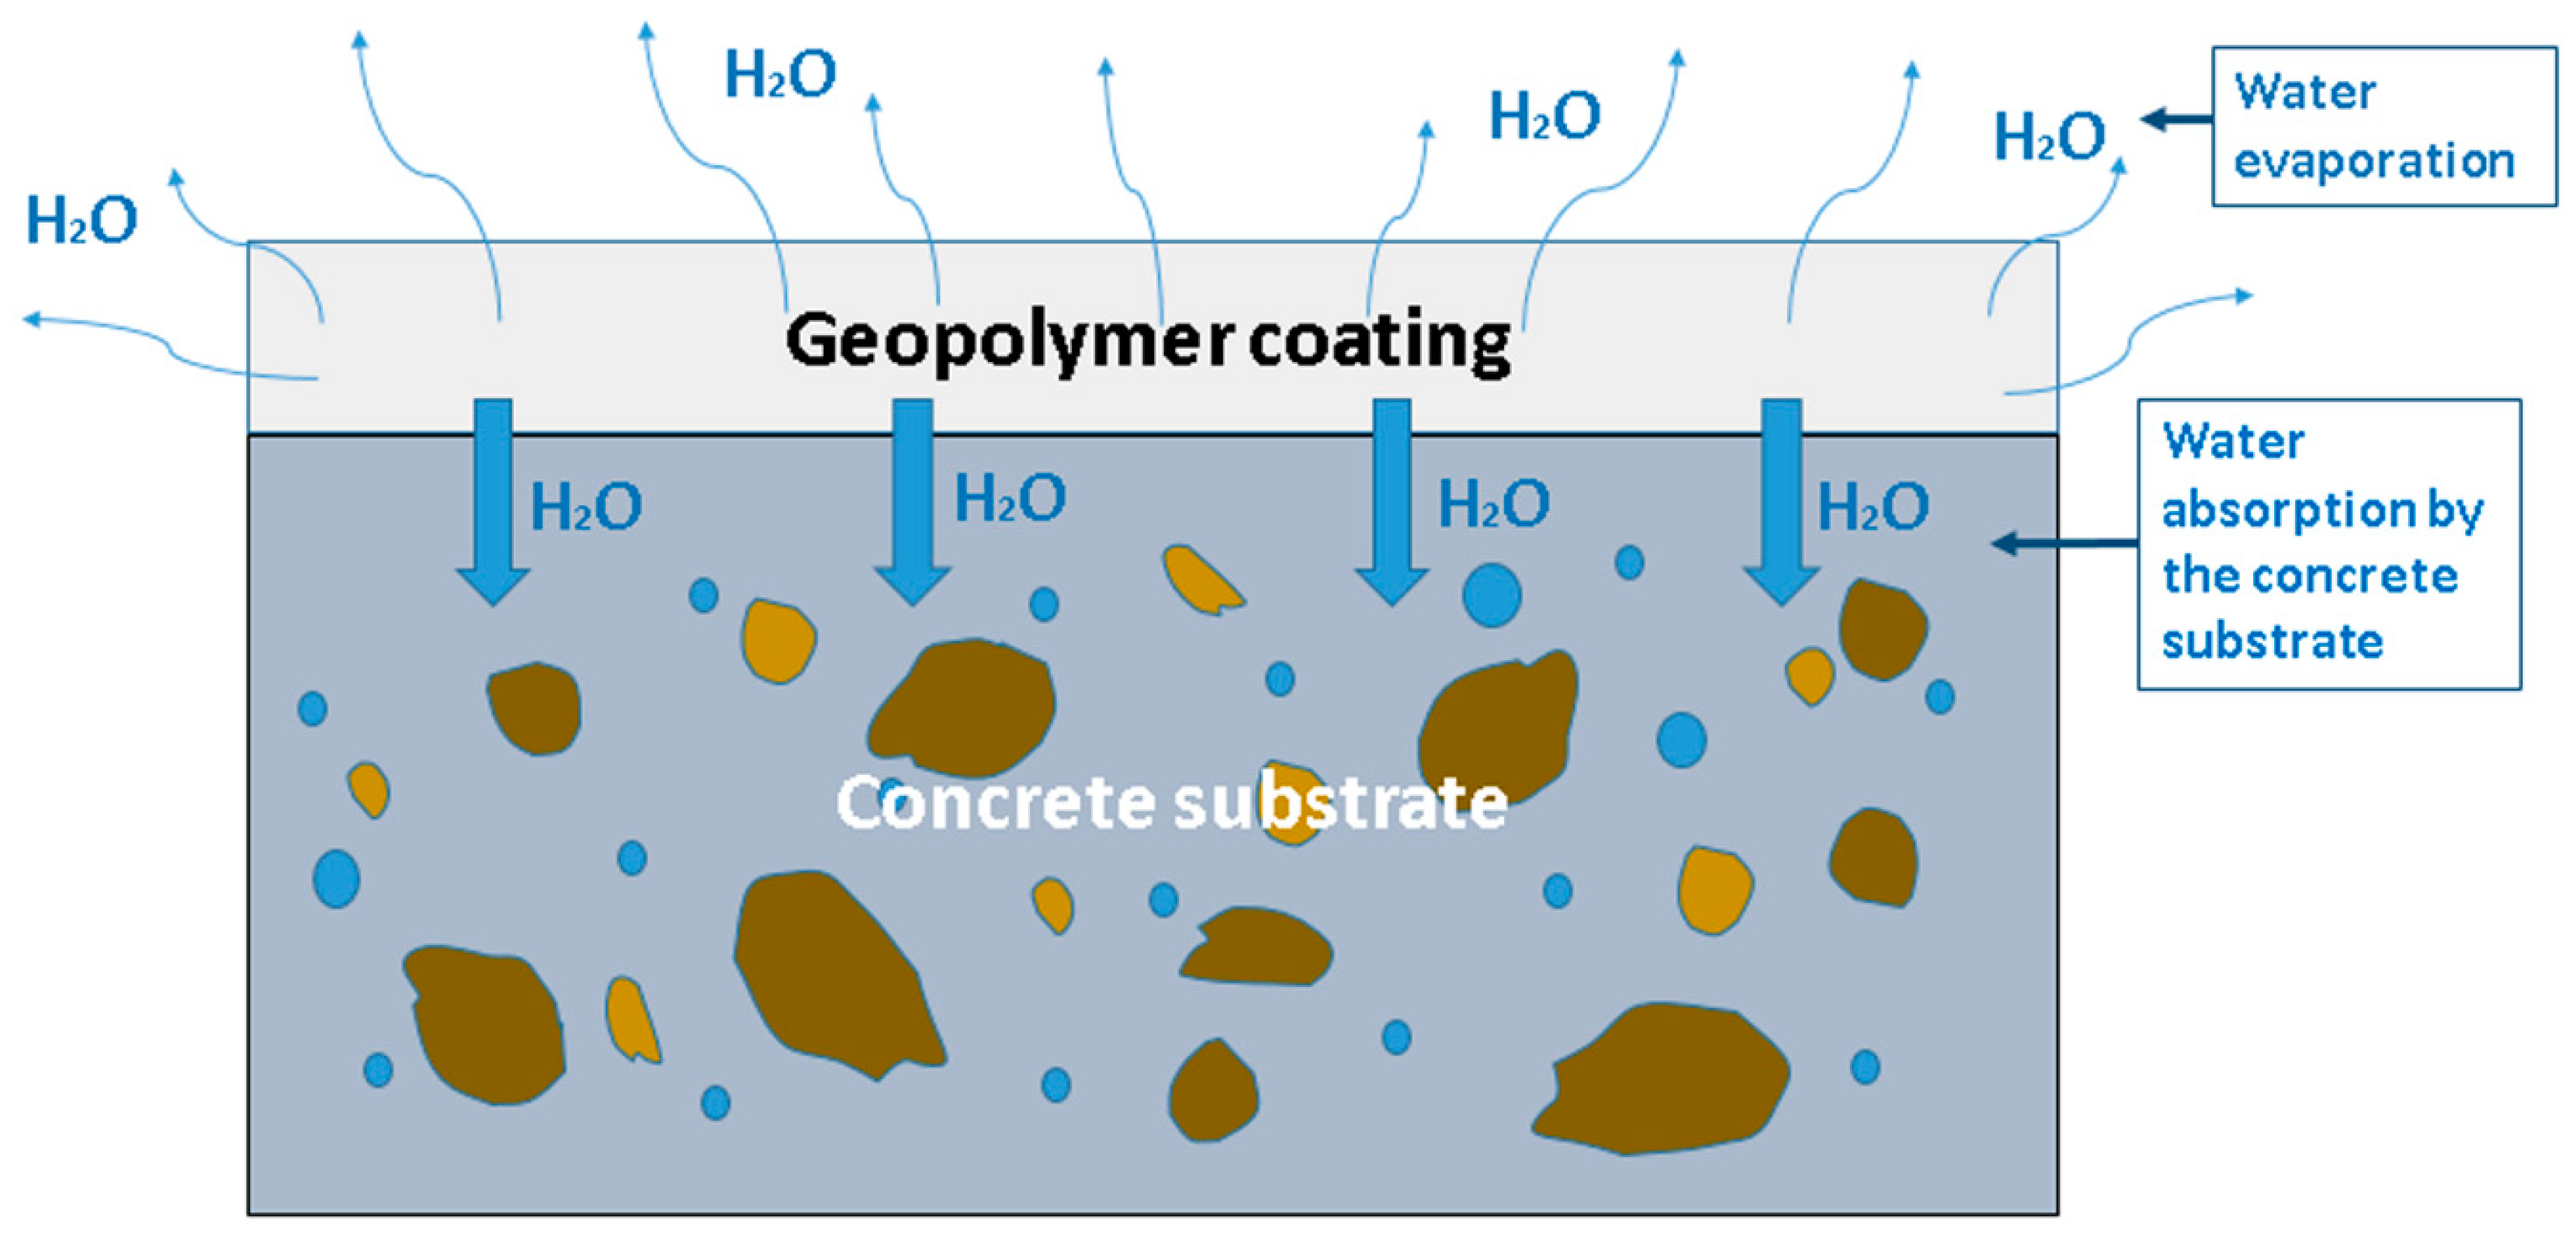
2.2.3. The Concrete Substrate
2.2.4. Efflorescence
3. Materials and Methods
3.1. Materials
3.2. Methodology
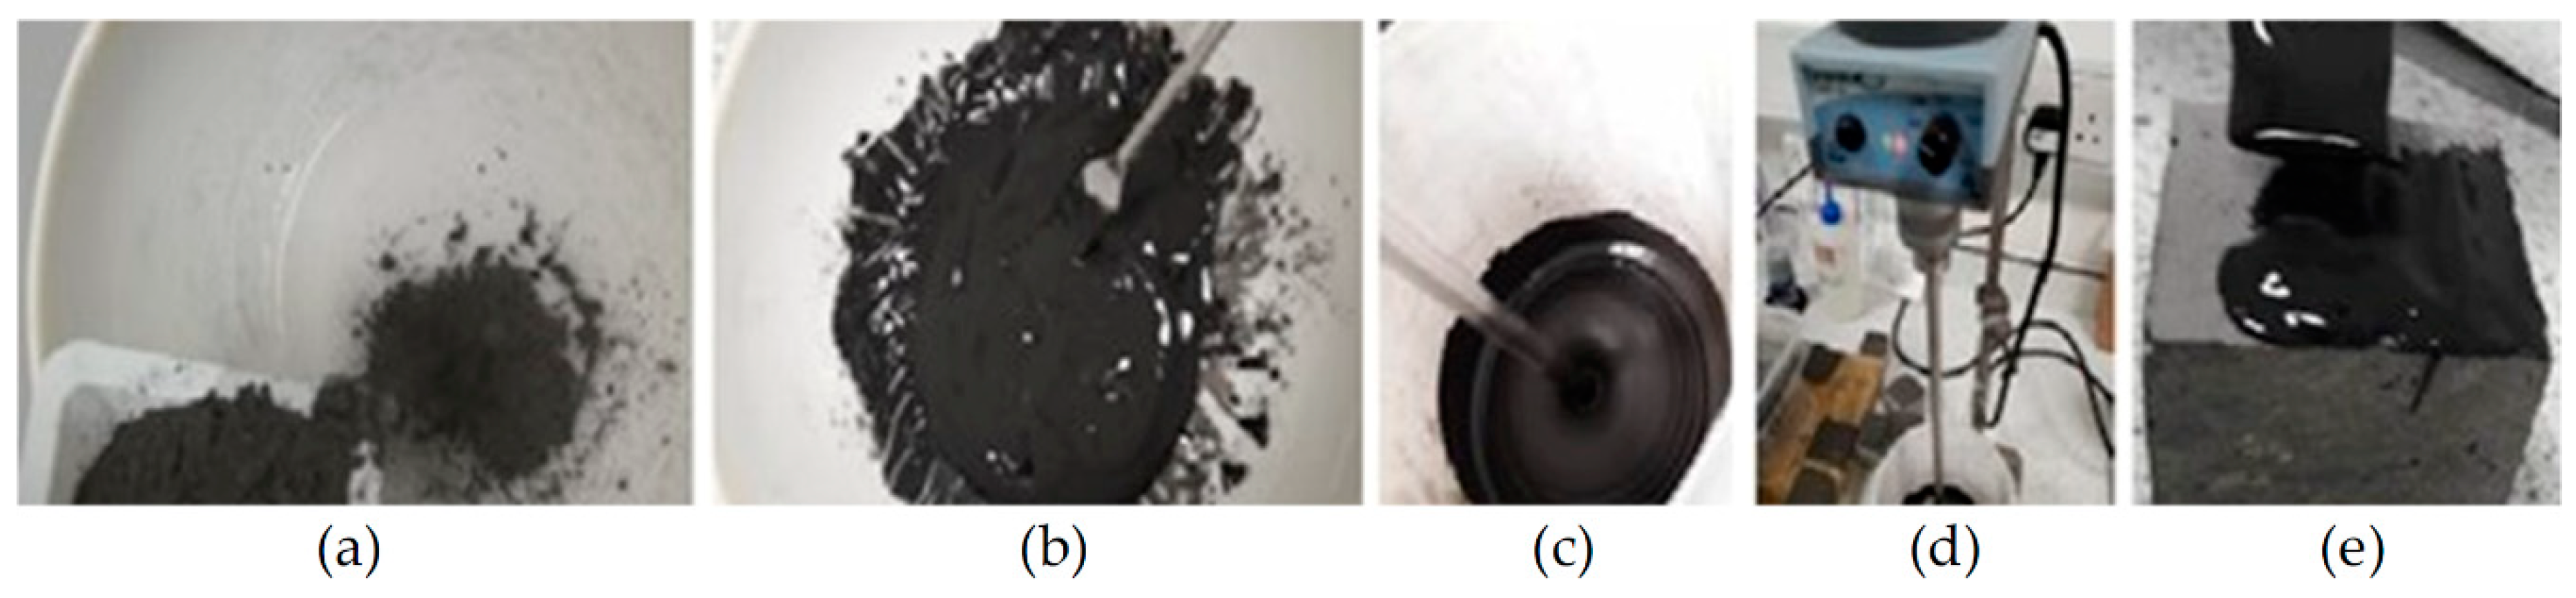
3.2.1. Geopolymer Synthesis
3.2.2. Application to Substrate
- Newly cast, or “young” concrete samples, left to cure for 1–5 months;
- Intermediate-aged concrete samples, 5–12 months of curing;
- Old concrete samples, over 1 year of curing.
3.2.3. Concrete Substrate Roughness
3.2.4. Curing Conditions for Geopolymers
3.2.5. Analysis Methods
3.2.5.1. Vicat Needle Test
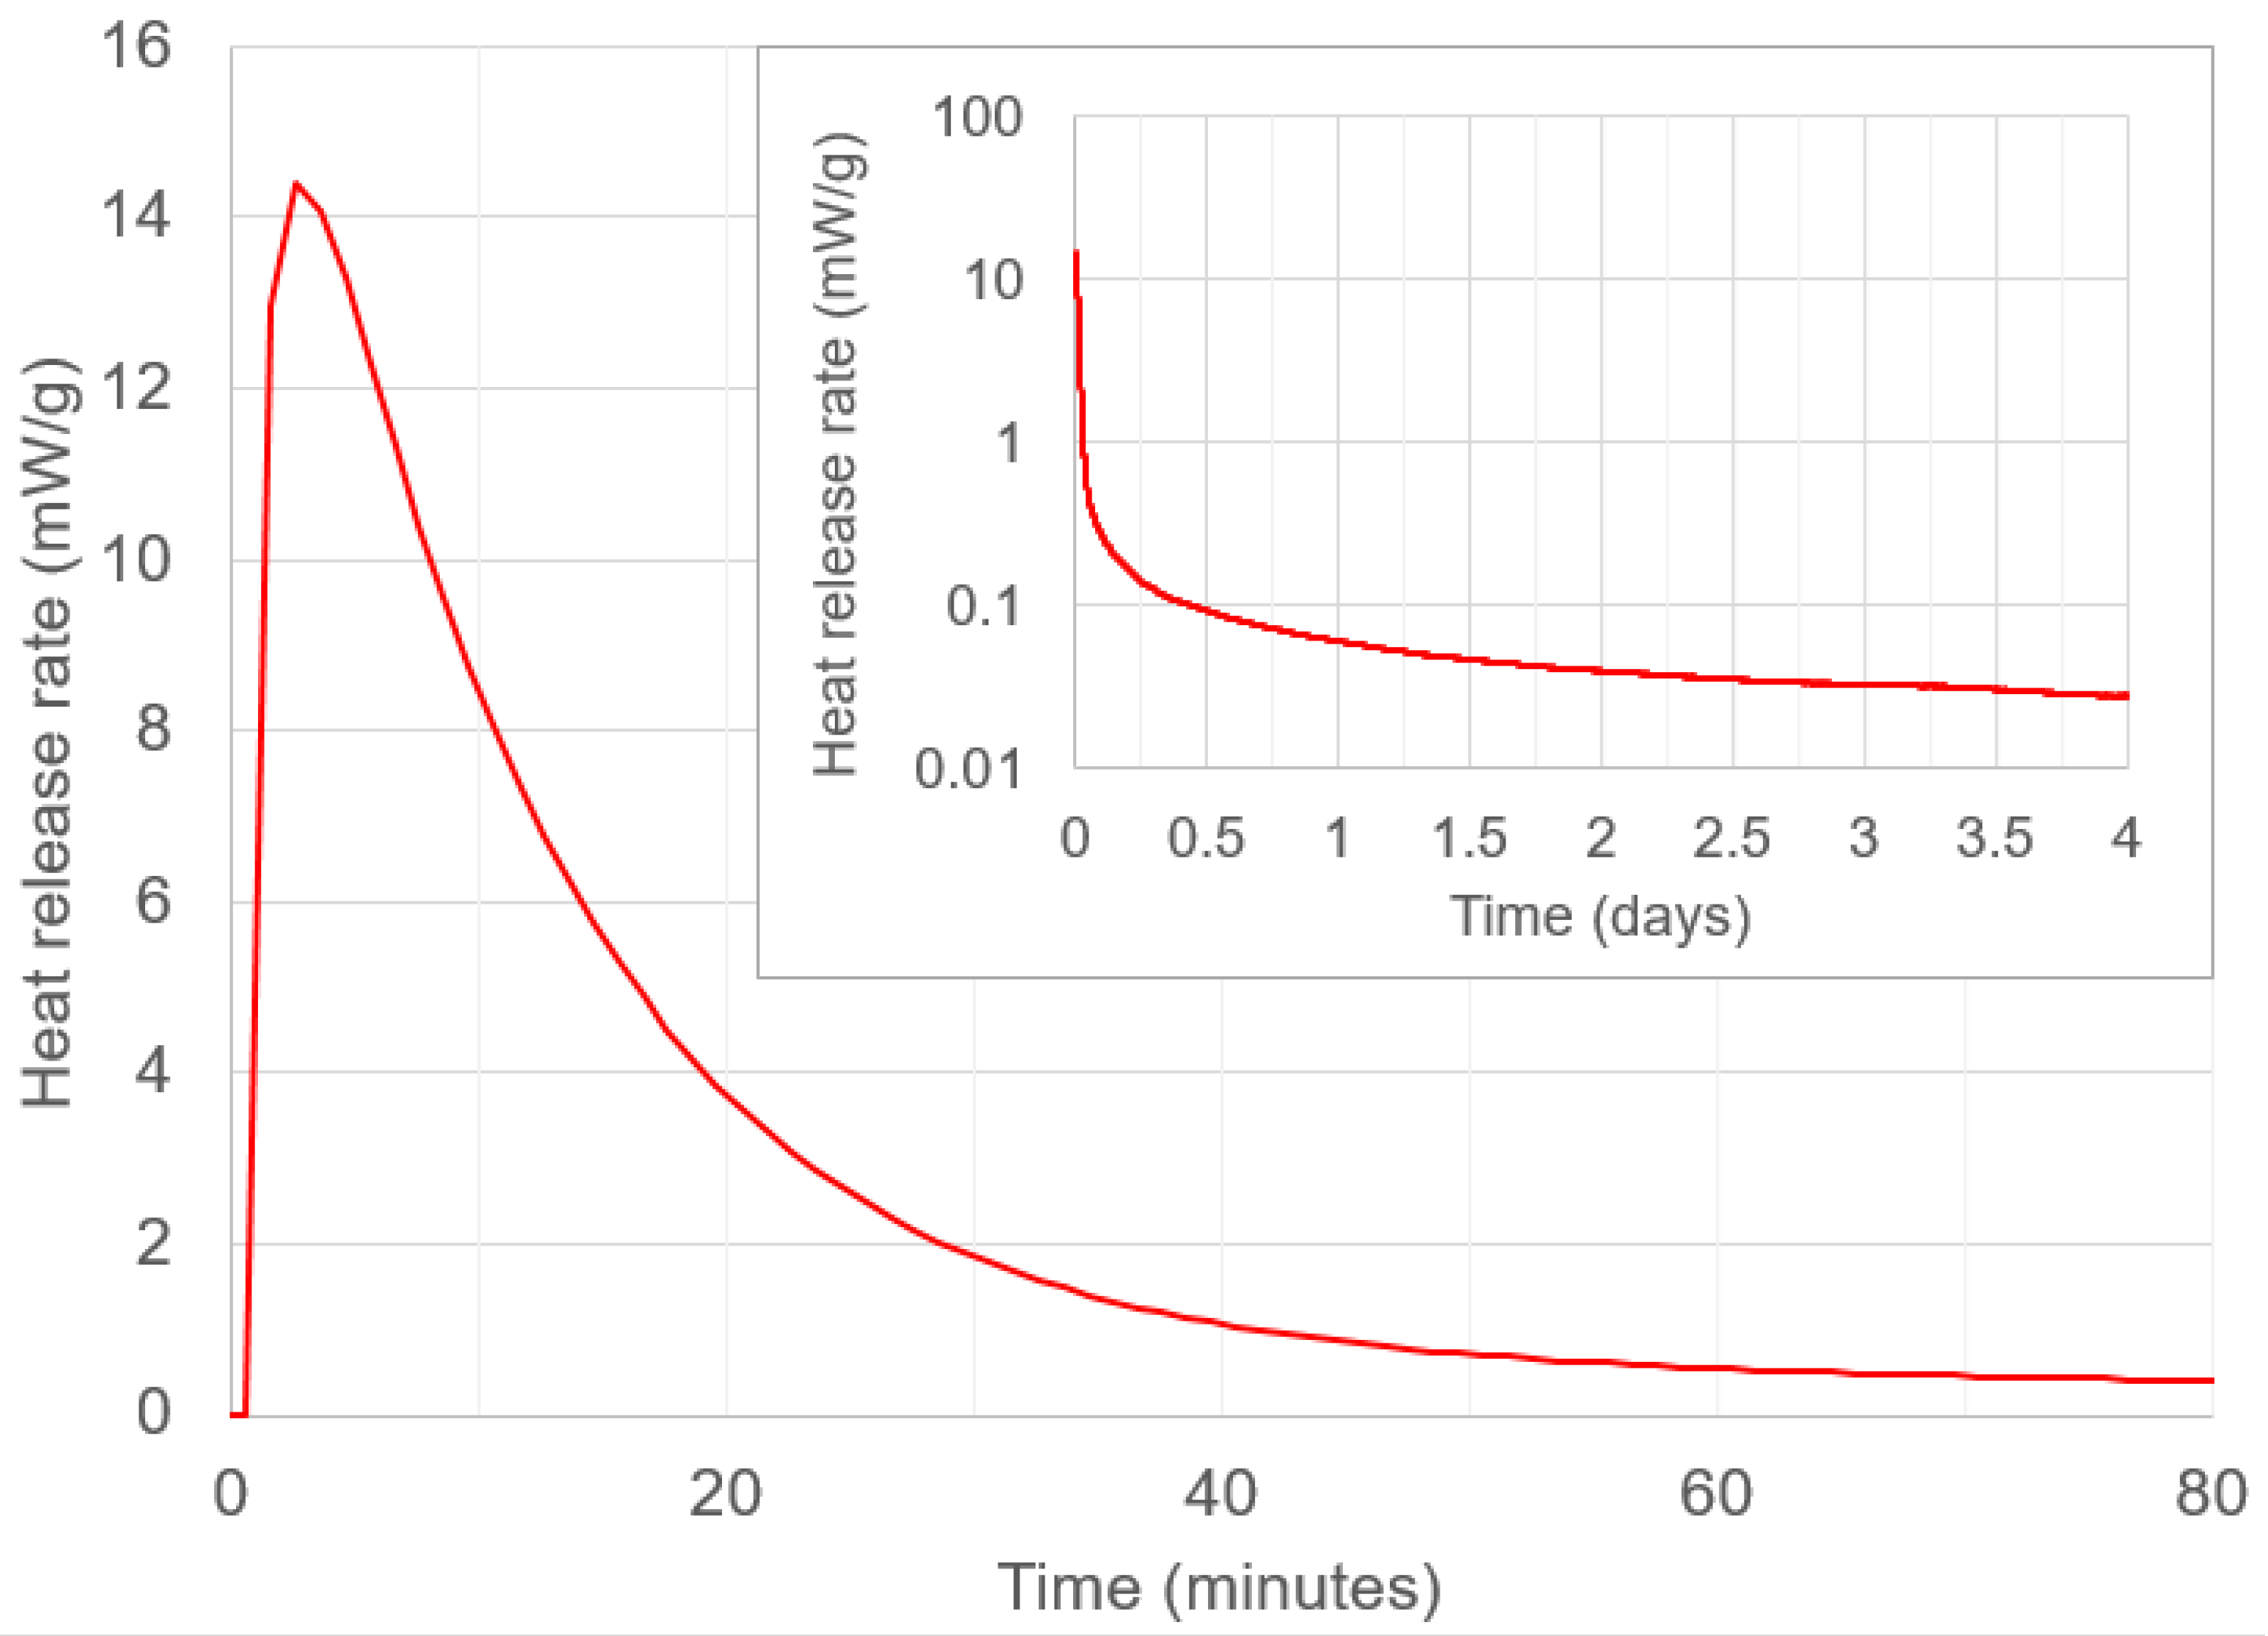
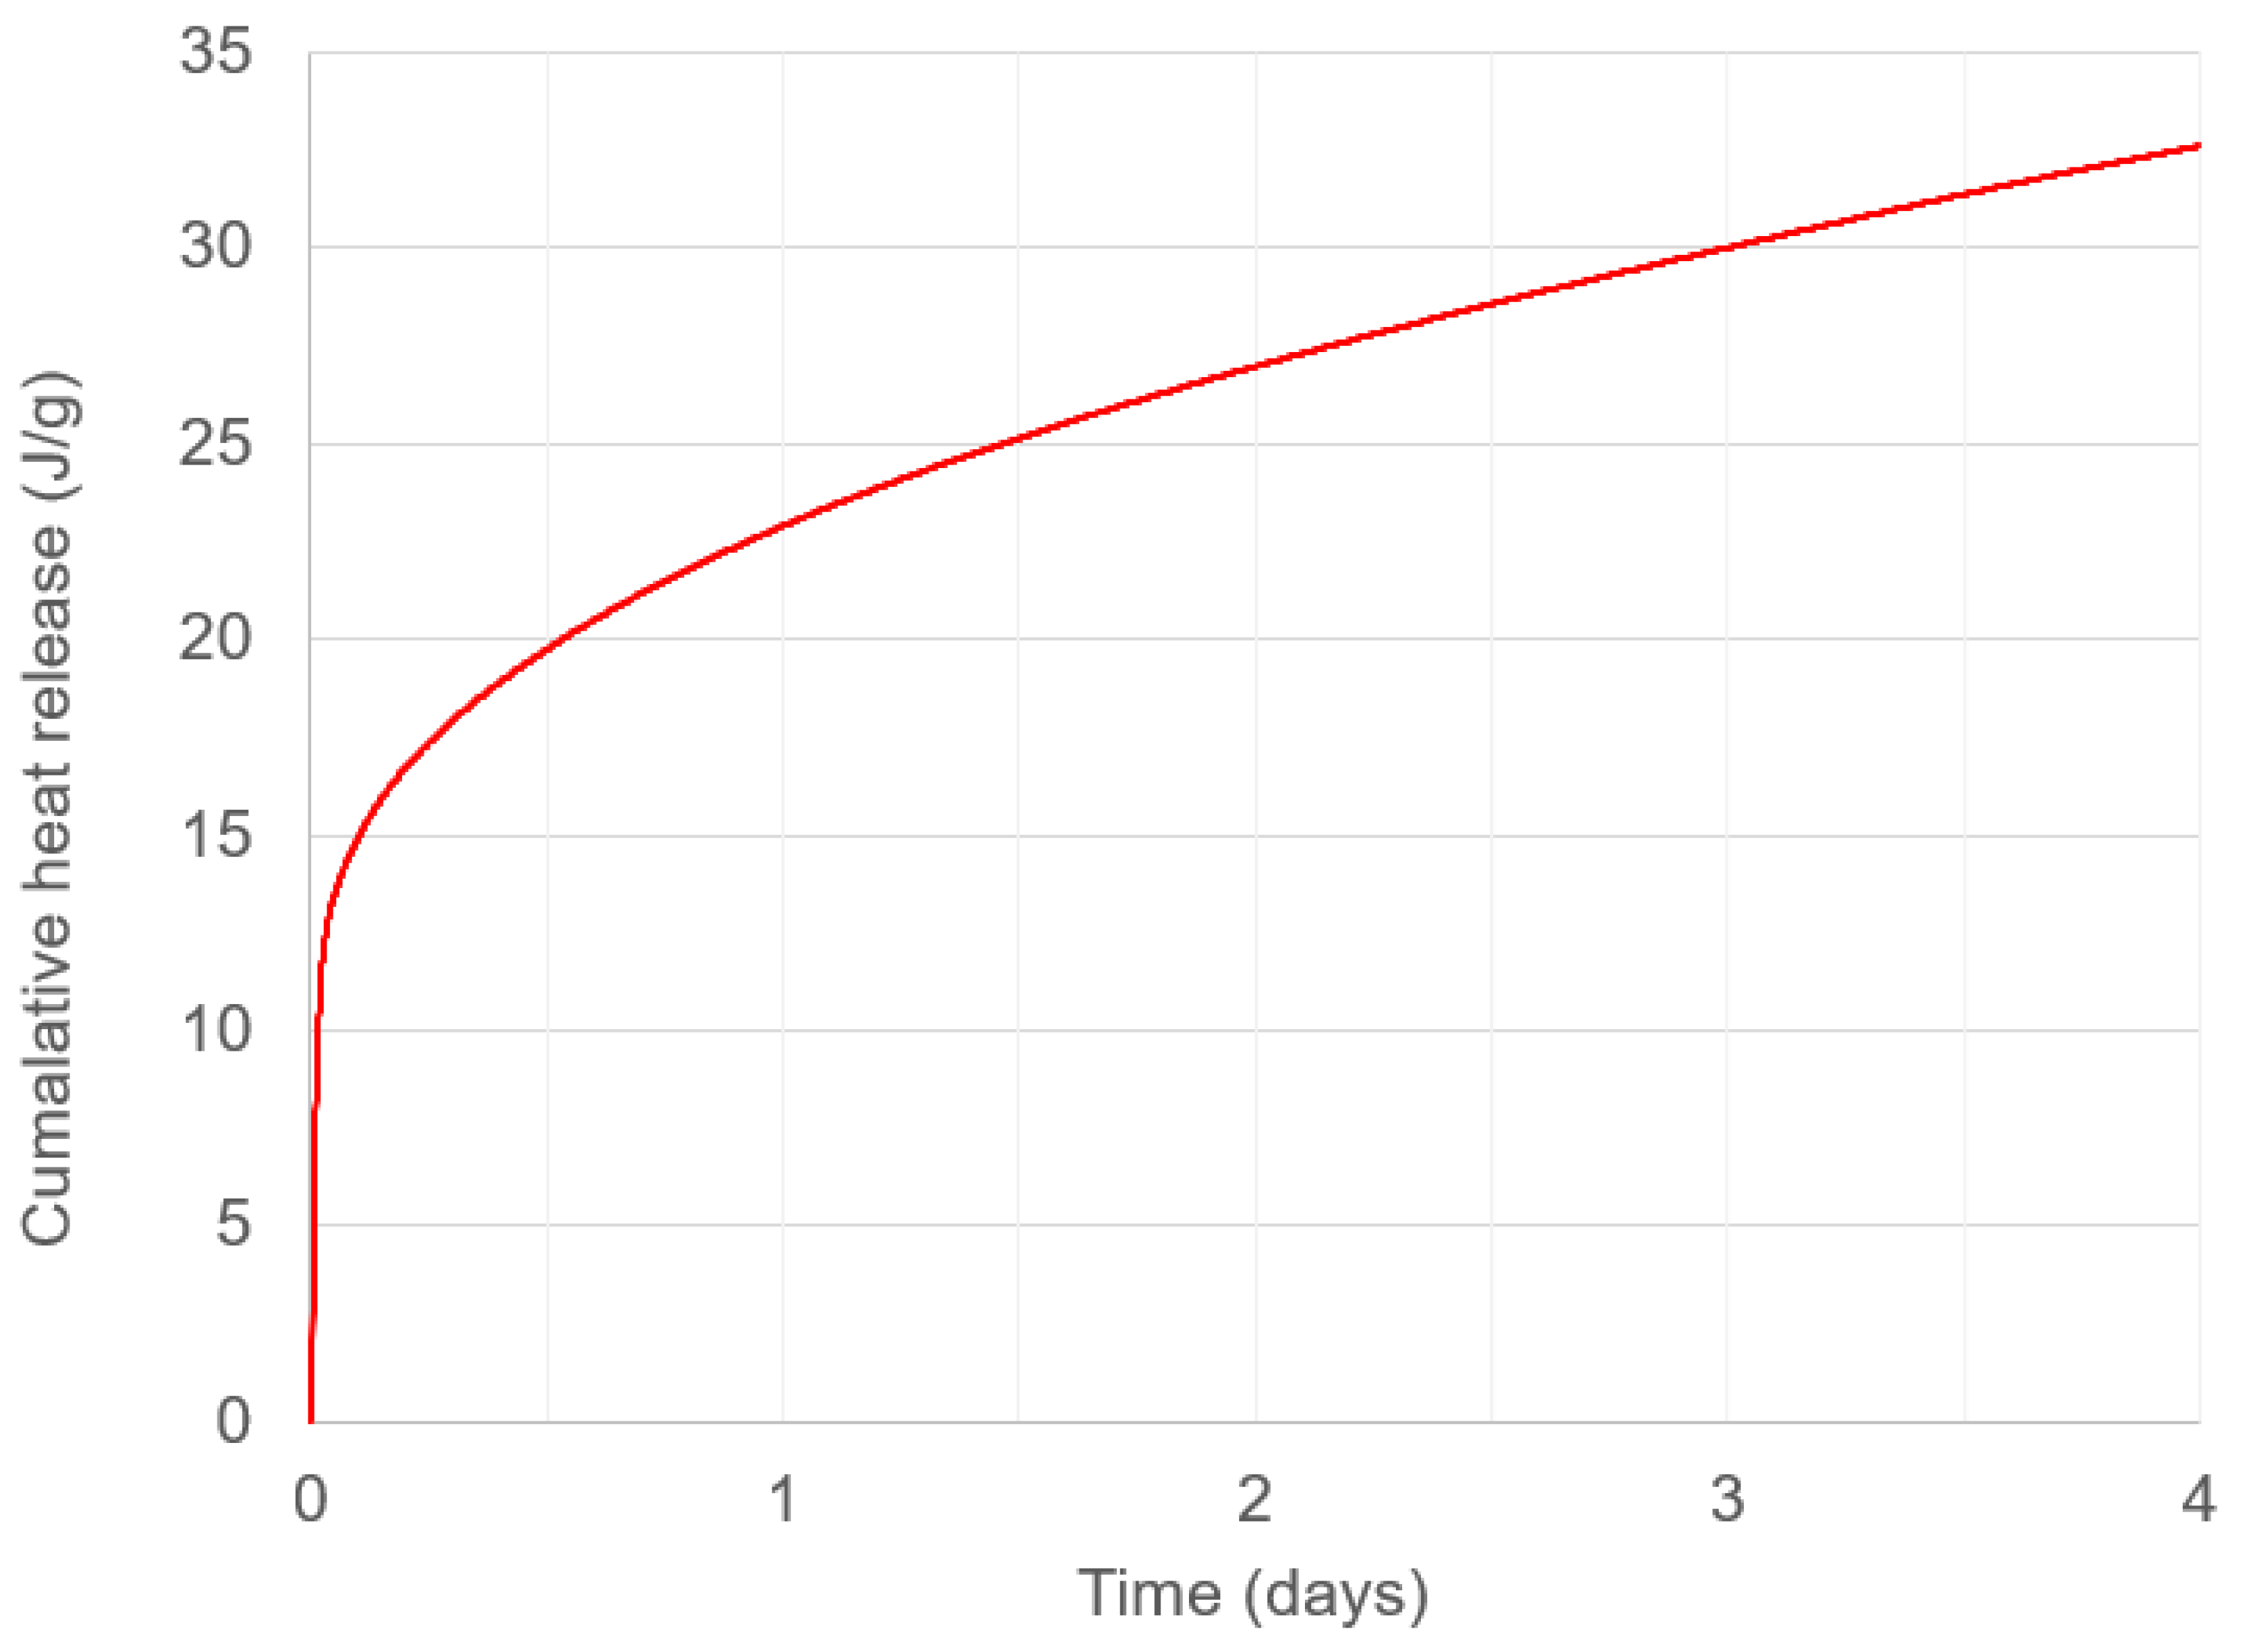
3.2.5.2. Isothermal Calorimetry
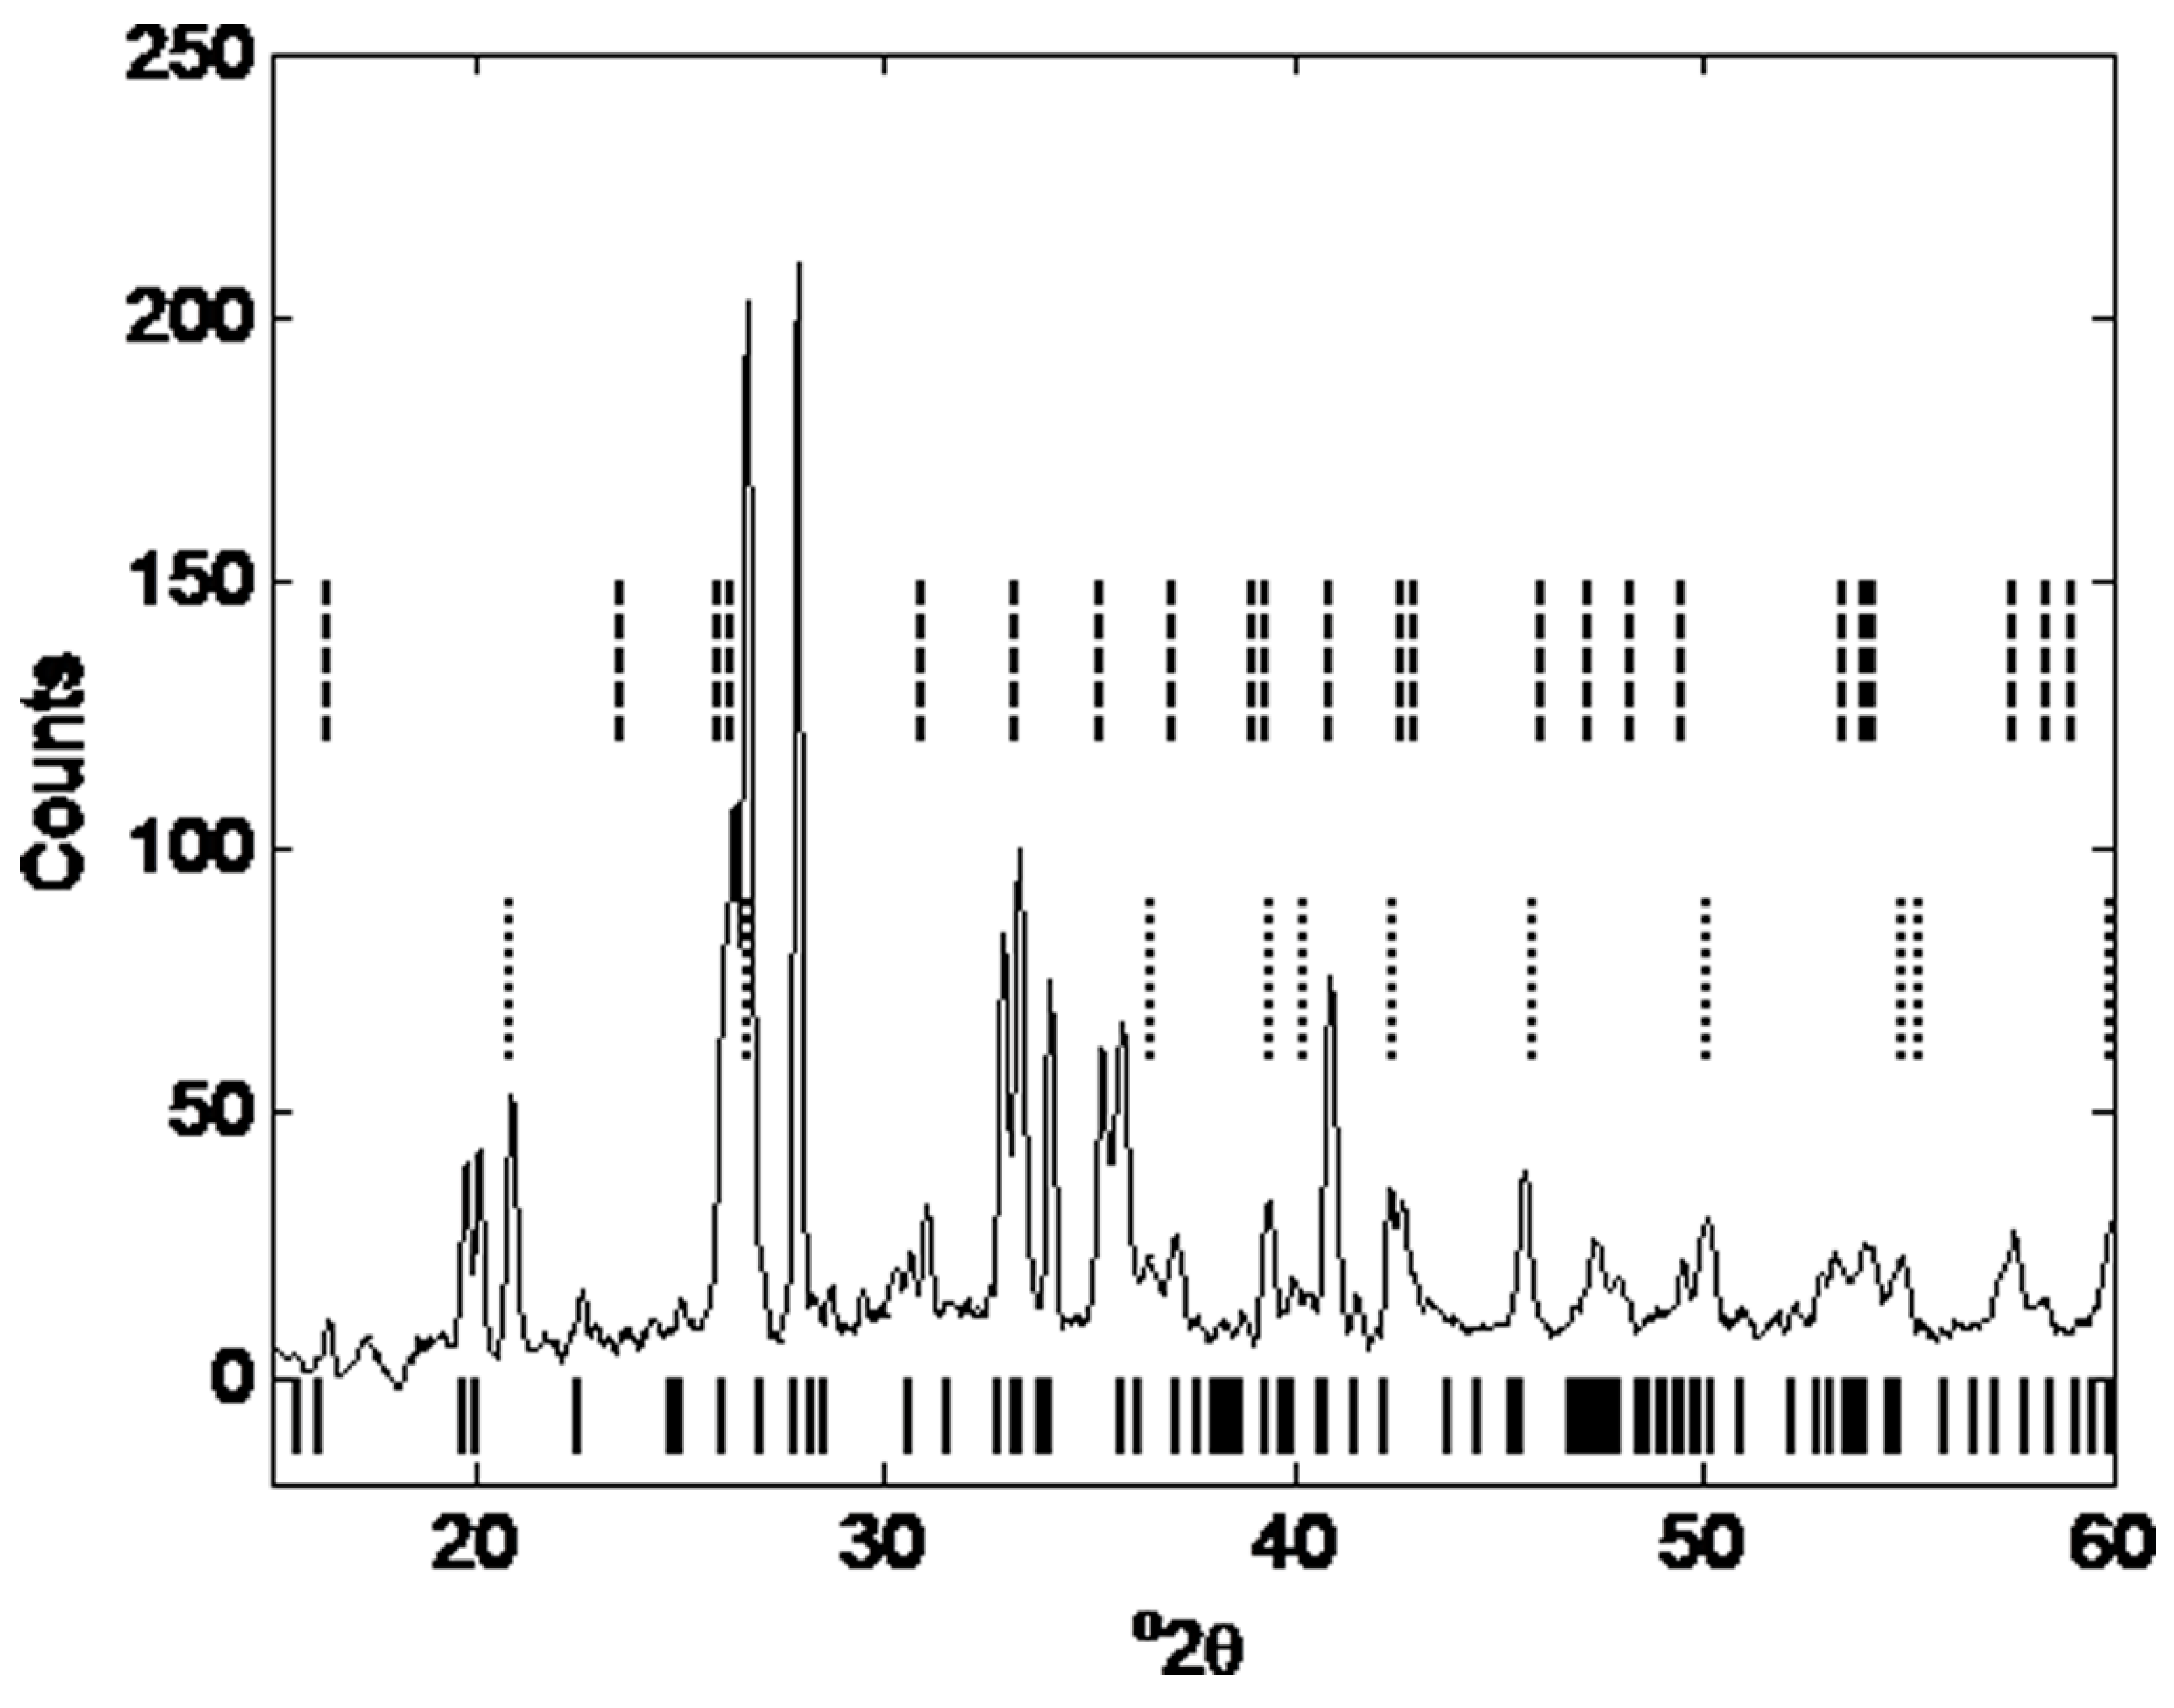
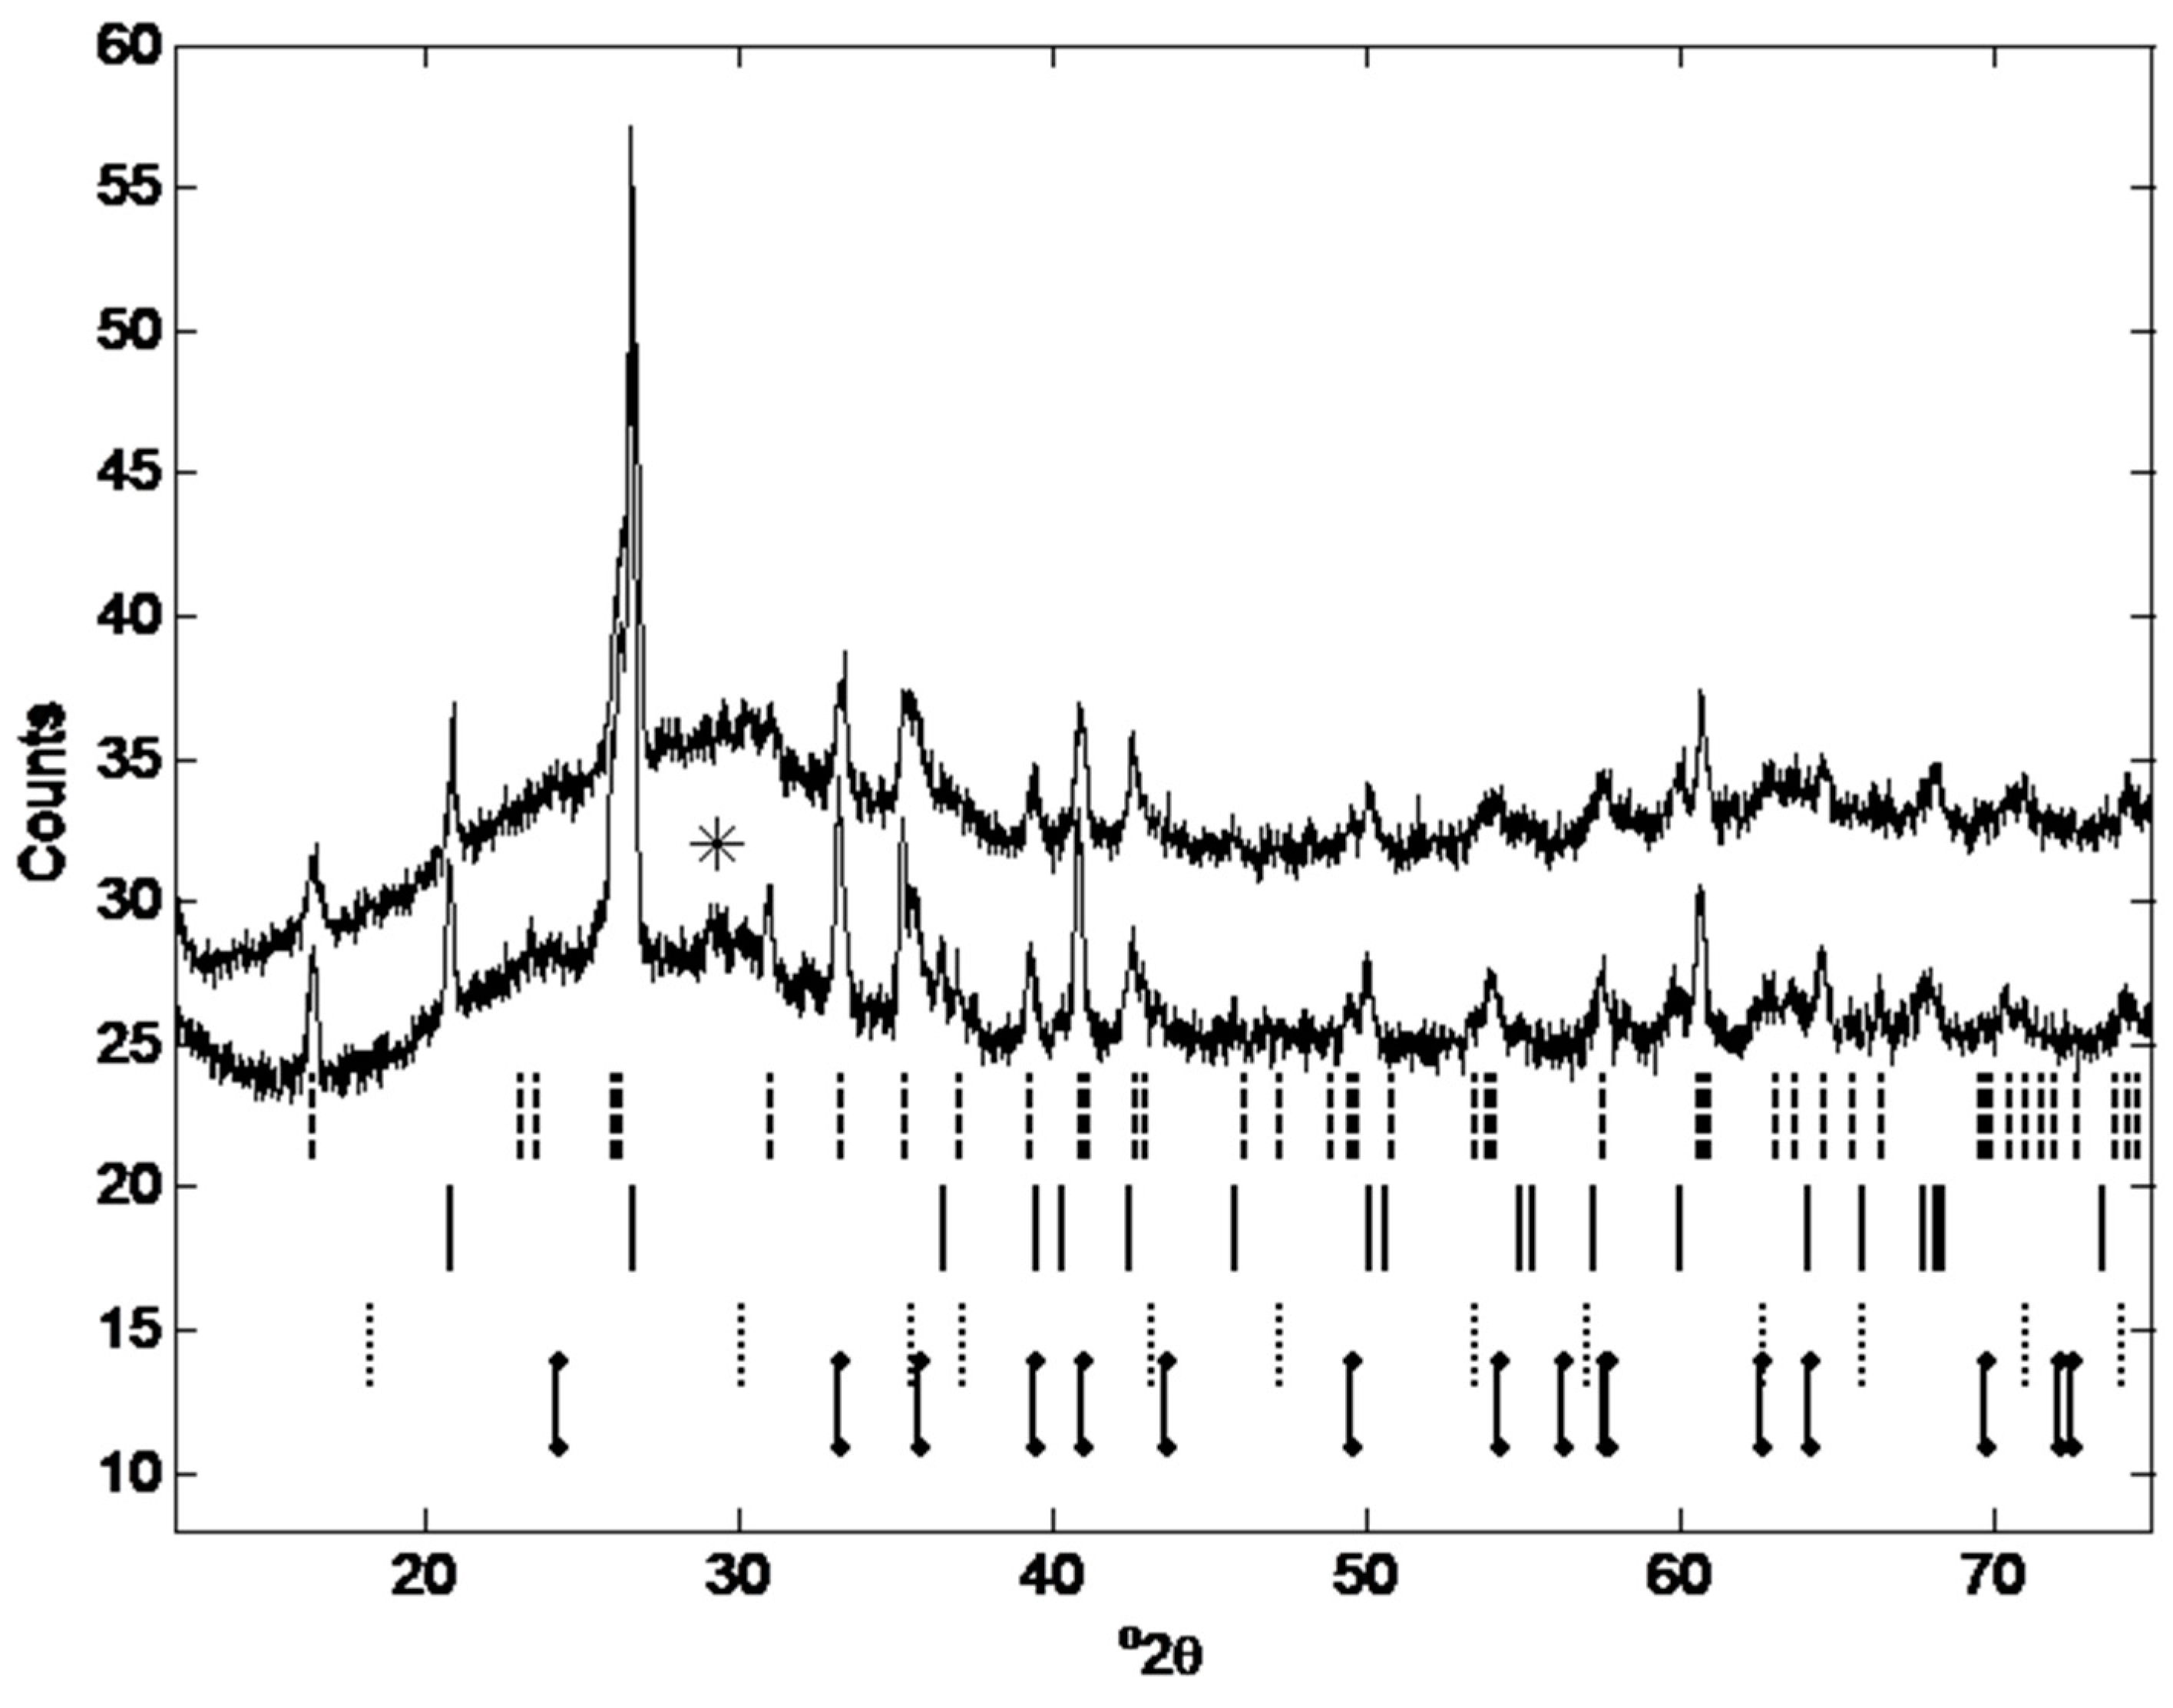
3.2.5.3. X-Ray Diffraction Analysis
3.2.5.4. Compressive Strength
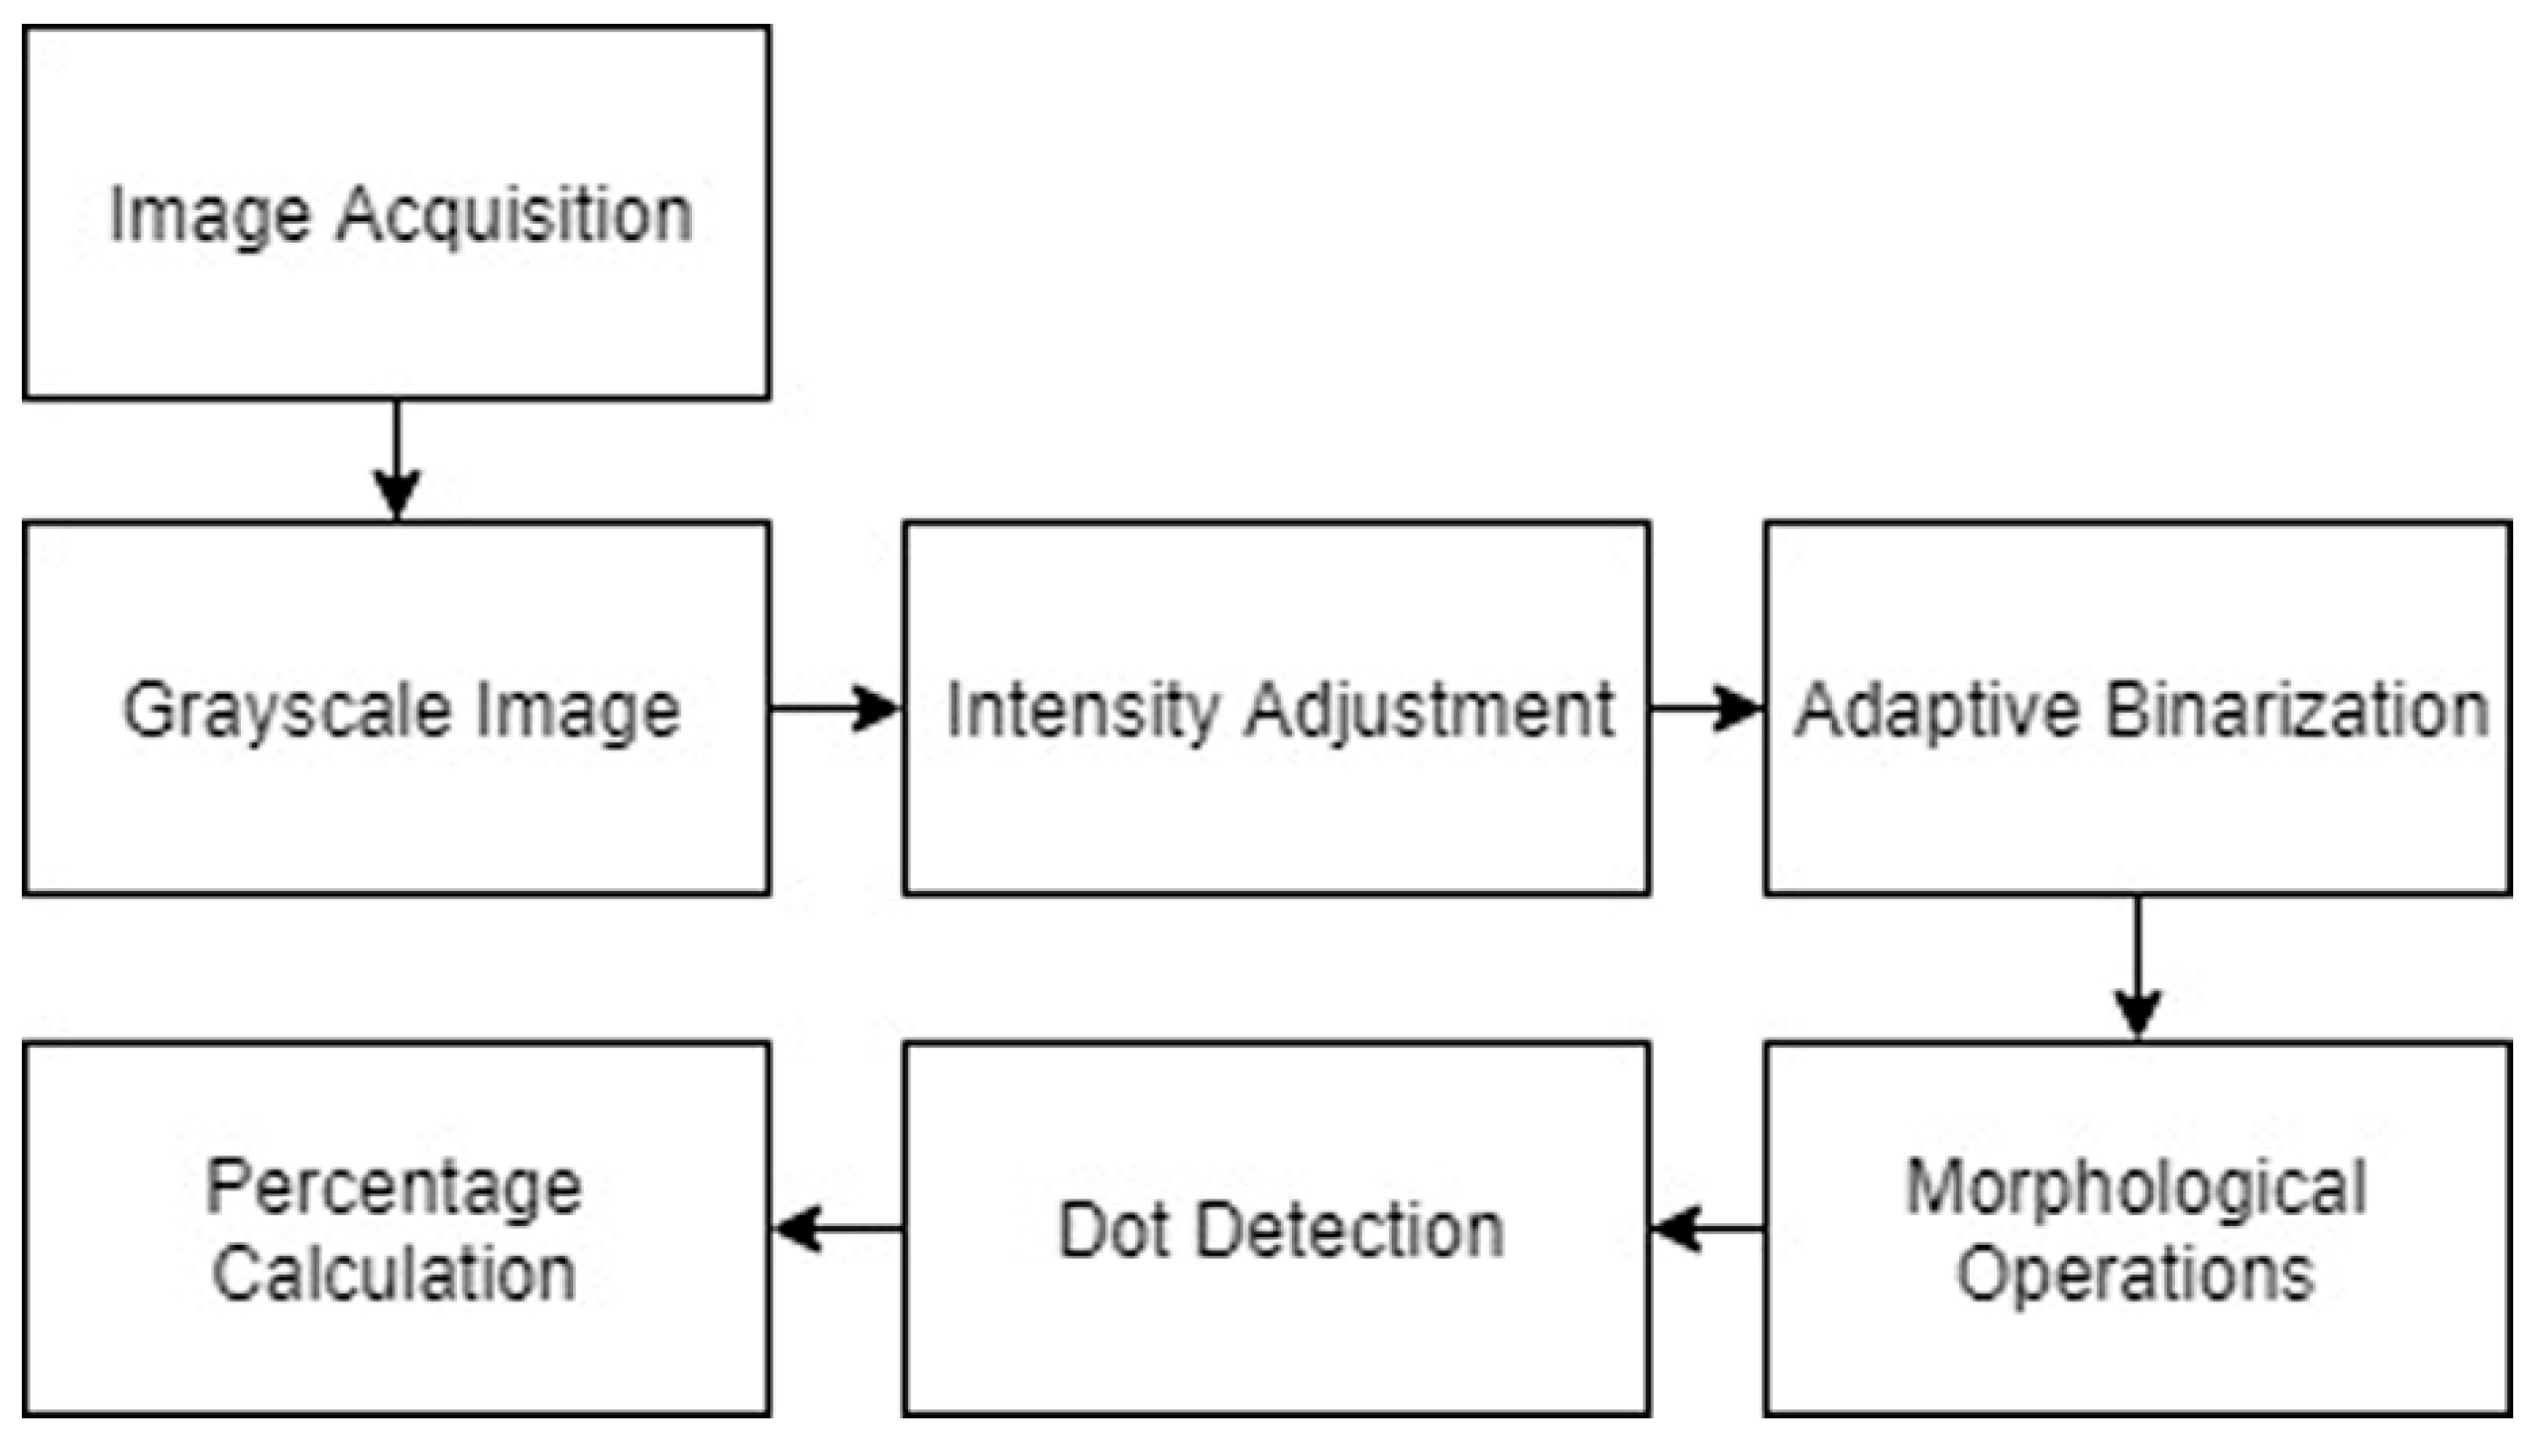
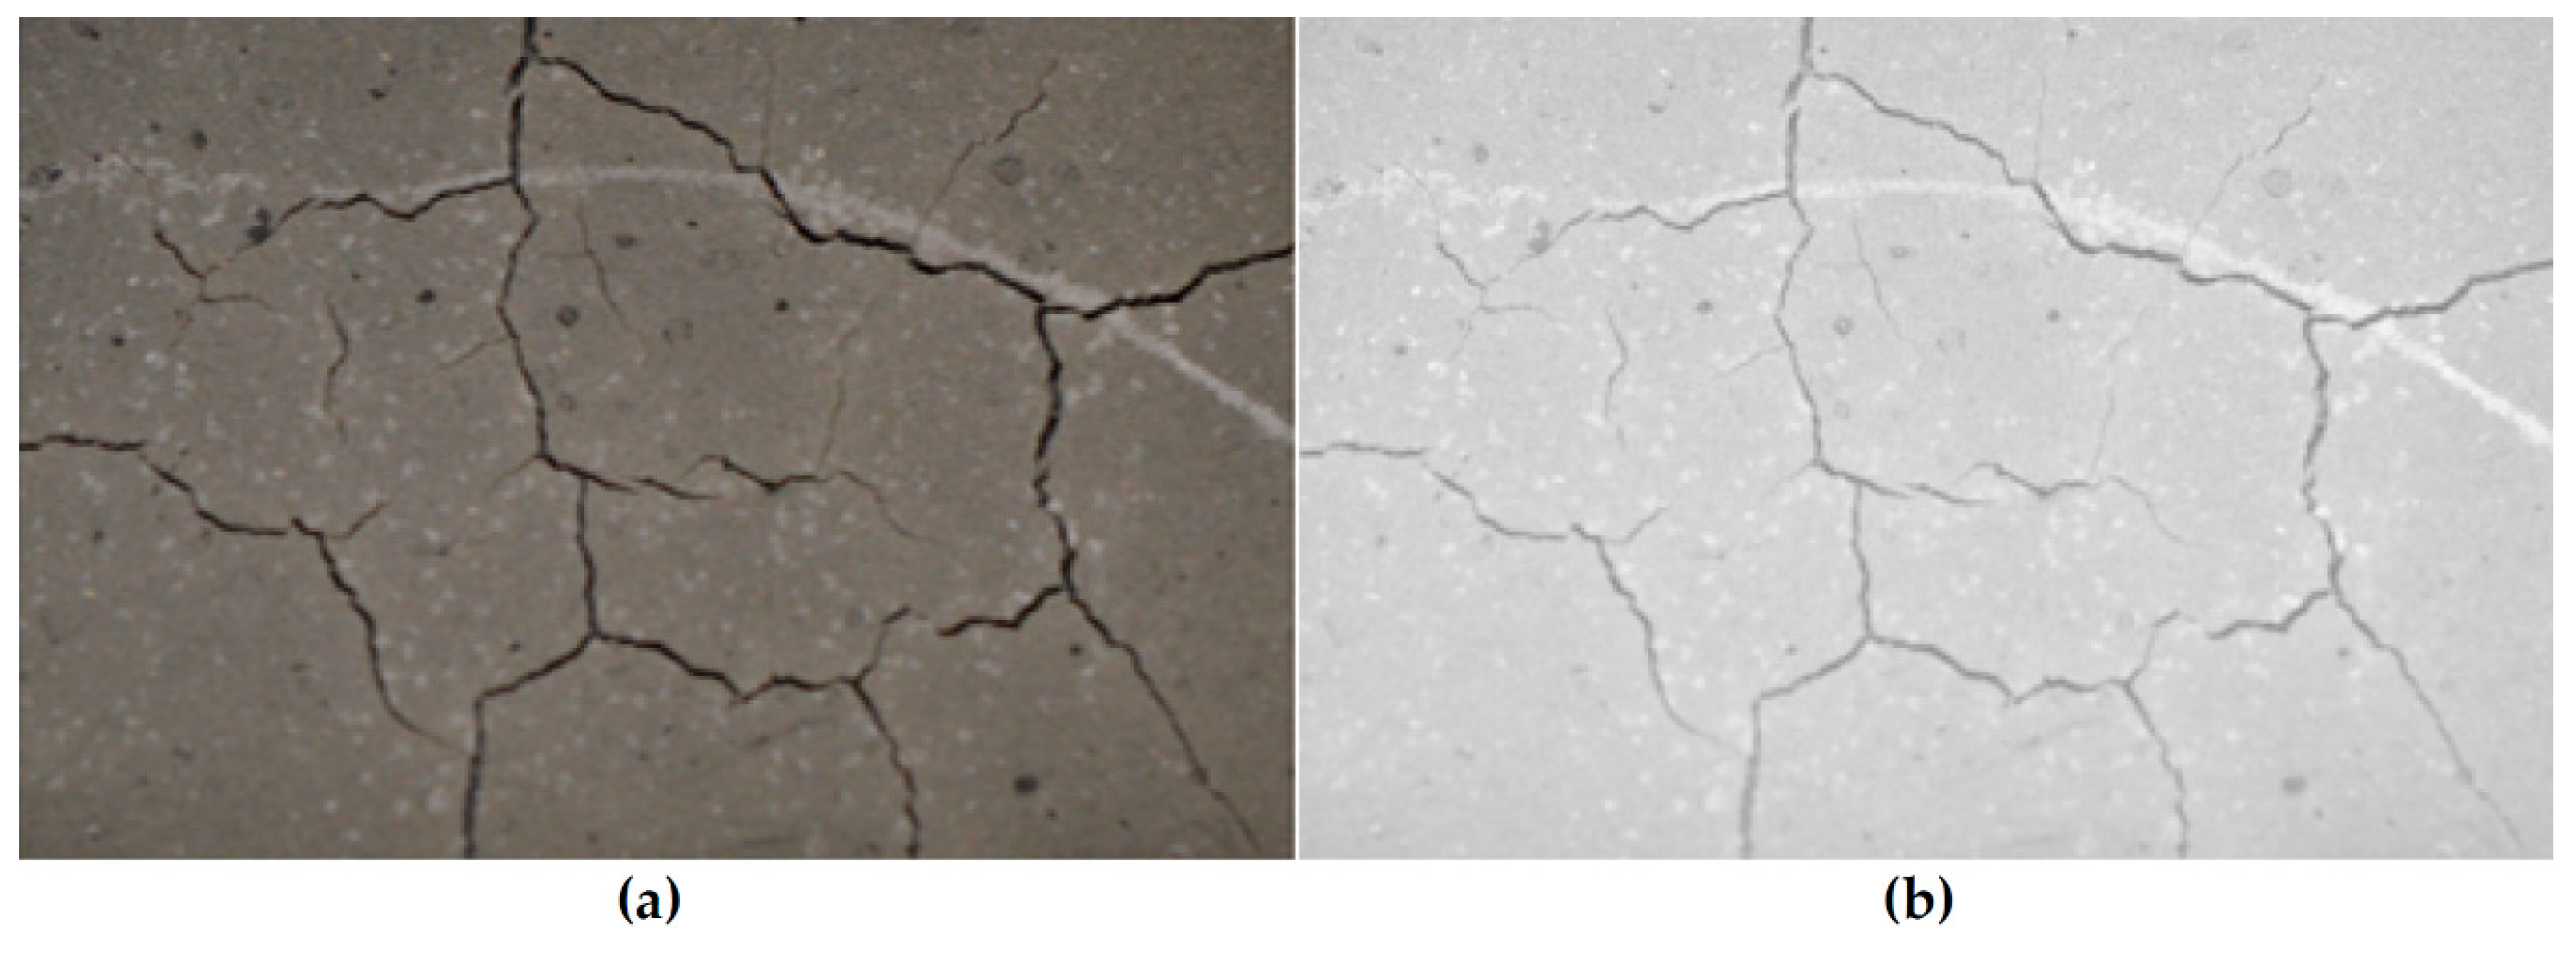
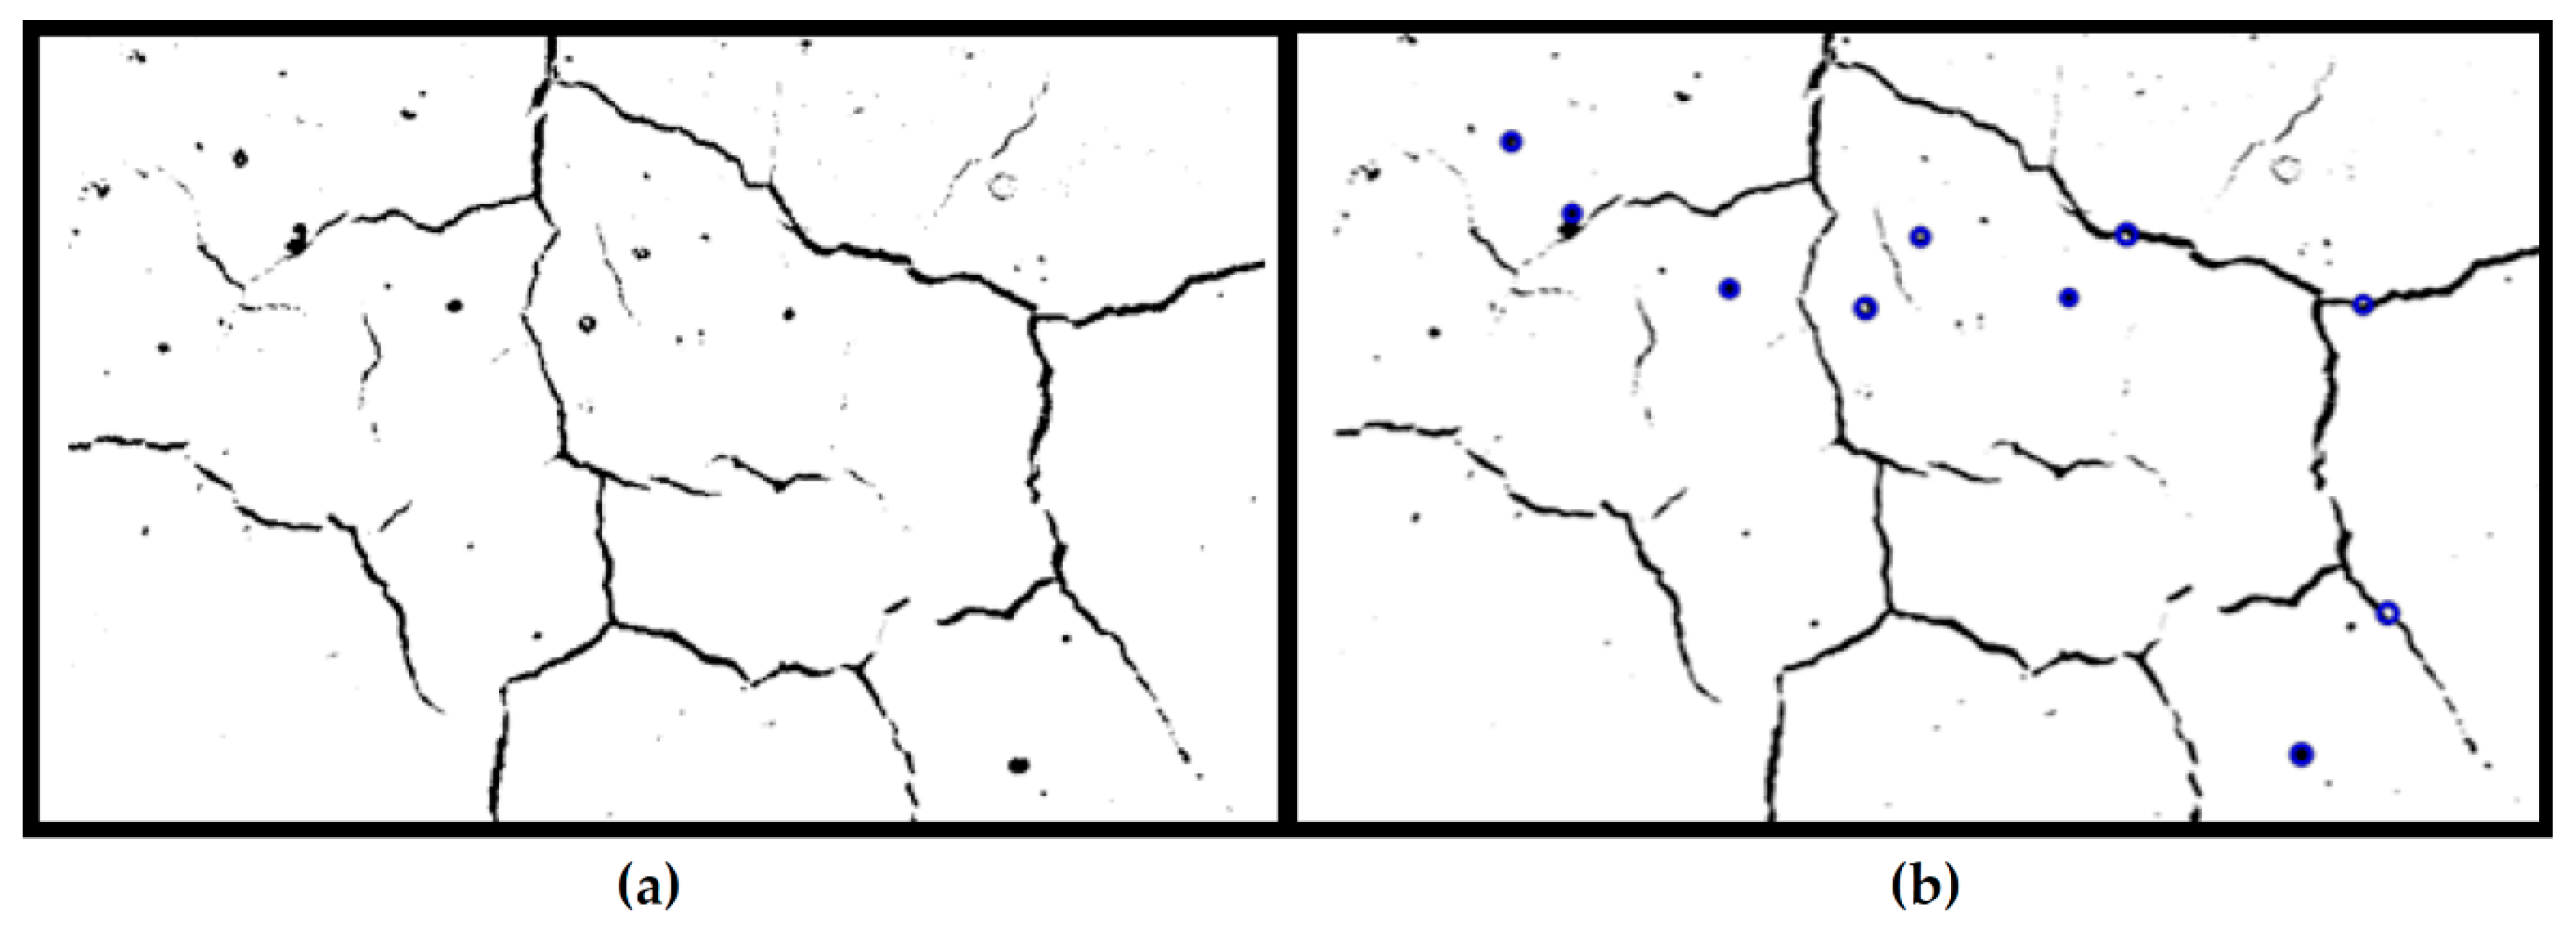
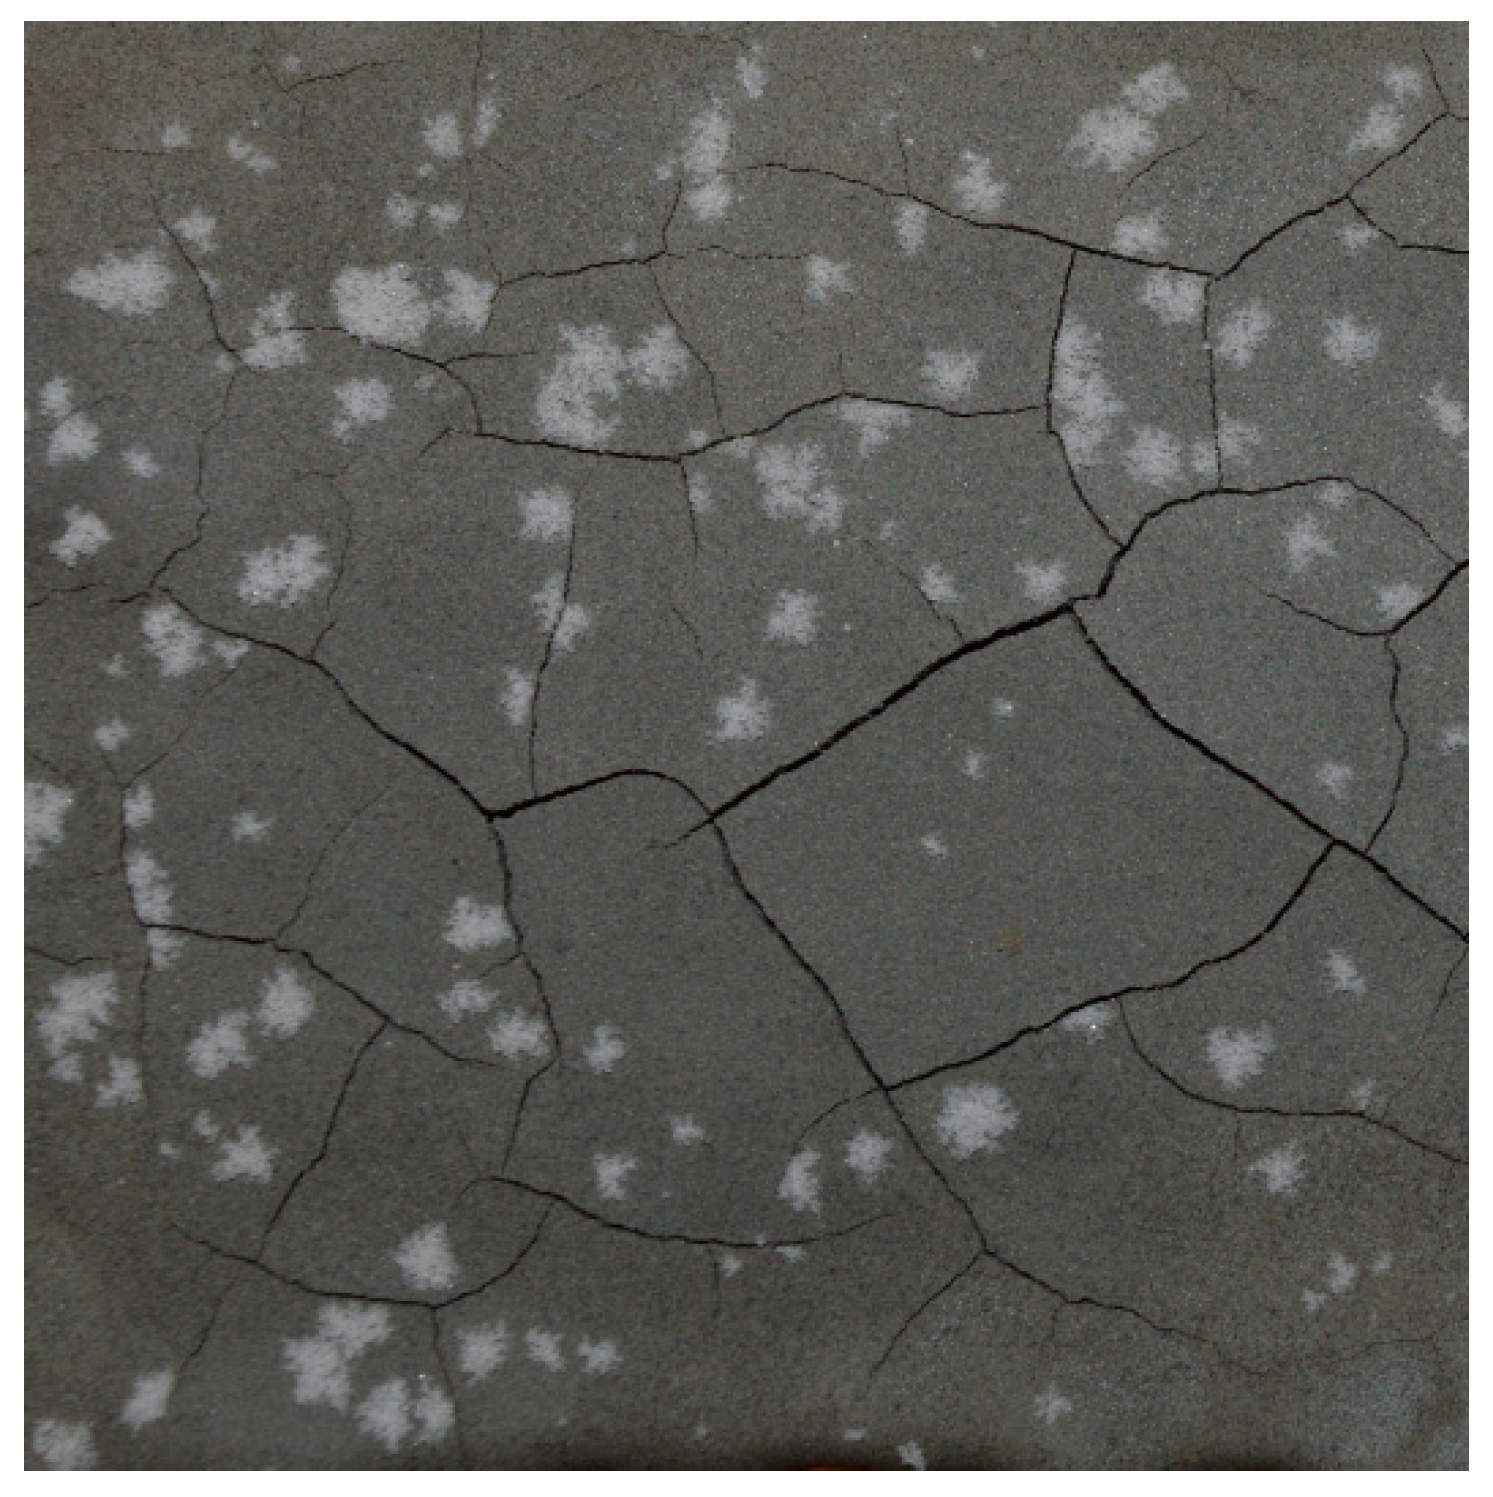
3.2.5.5. Visual Inspection and Quantification of Cracks
4. Results and Discussion
4.1. Compressive Strength
4.2. Coating Thickness
4.3. Setting and Mixing Time
4.4. Concrete Age
4.5. Efflorescence
5. Further Discussion and Future Work
- Coating thickness: coatings with thickness < 1 mm showed no cracks, regardless of mixing times and RH levels between 50% and 95%. Coatings with higher thickness showed cracks, the extent of which was dependent on the mixing time;
- Mixing time: for our mix, the optimal mixing time was 1 h, to allow the main extent of geopolymerisation reactions to occur without loss of water or thermal stress, and to ensure that only few fly ash particles were unreacted. Optimizing mixing time can allow geopolymer coatings to overcome water loss induced cracking and to show a homogeneous surface without voids and bubbles.
- Age of concrete: the results showed that coating integrity did not depend on concrete age. This is an important consideration if geopolymer coatings and linings are to be applied to newly cast concrete structures, and not only to old structures which need repair.
- Efflorescence: for low-temperature, but humid curing conditions (above 70% RH), efflorescence was likely, as excess alkaline solution crystallized on the surface of the coating. Efflorescence was less likely for relative humidities at or below 50%.
5.1. The Role of Coating Thickness
5.2. Thermal Expansion and Bond Strength
5.3. Characterisation of the True SiO2/Al2O3 Ratio
6. Conclusions
Author Contributions
Funding
Conflicts of Interest
References
- Gobakis, K.; Kolokotsa, D.; Maravelaki-Kalaitzaki, N.; Perdikatsis, V.; Santamouris, M. Development and analysis of advanced inorganic coatings for buildings and urban structures. Energy Build. 2015, 89, 196–205. [Google Scholar] [CrossRef]
- Yang, J.; Xu, L.-L.; Wang, L.; Zhang, Z.-B.; Liu, F. Study on new inorganic coating for outdoor. J. Nanjing Univ. Technol. (Nat. Sci. Ed.) 2008, 1, 016. [Google Scholar]
- Moon, H.Y.; Shin, D.G.; Choi, D.S. Evaluation of the durability of mortar and concrete applied with inorganic coating material and surface treatment system. Constr. Build. Mater. 2007, 21, 362–369. [Google Scholar] [CrossRef]
- Batis, G.; Pantazopoulou, P.; Routoulas, A. Synergistic effect of corrosion inhibitor and inorganic coating on reinforcement corrosion. Anti-Corros. Methods Mater. 2001, 48, 107–116. [Google Scholar] [CrossRef]
- Mu, S.; Liu, J.; Lin, W.; Wang, Y.; Liu, J.; Shi, L.; Jiang, Q. Property and microstructure of aluminosilicate inorganic coating for concrete: Role of water to solid ratio. Constr. Build. Mater. 2017, 148, 846–856. [Google Scholar] [CrossRef]
- Duxson, P.; Fernández-Jiménez, A.; Provis, J.L.; Lukey, G.C.; Palomo, A.; van Deventer, J.S. Geopolymer technology: The current state of the art. J. Mater. Sci. 2007, 42, 2917–2933. [Google Scholar] [CrossRef]
- Zhang, Z.; Yao, X.; Zhu, H. Potential application of geopolymers as protection coatings for marine concrete: II. Microstructure and anticorrosion mechanism. Appl. Clay Sci. 2010, 49, 7–12. [Google Scholar] [CrossRef]
- Zhang, Z.; Yao, X.; Wang, H. Potential application of geopolymers as protection coatings for marine concrete III. Field experiment. Appl. Clay Sci. 2012, 67, 57–60. [Google Scholar] [CrossRef]
- Pacheco-Torgal, F.; de Aguiar, J.B.; Ding, Y.; Tahri, W.; Baklouti, S. Performance of alkali-activated mortars for the repair and strengthening of OPC concrete. In Handbook of Alkali-Activated Cements, Mortars and Concretes; Elsevier: Amsterdam, The Netherlands, 2015; pp. 627–641. [Google Scholar]
- Pinto, A.T.; Vieira, E. Repairing of Damaged Stone in Monuments and Stone Buildings; Geopolymer Institute: Saint-Quentin, France, 2005; pp. 173–176. [Google Scholar]
- Yodsudjai, W. Application of fly ash-based geopolymer for structural member and repair materials. In Advances in Science and Technology; Trans Tech Publications: Zürich, Switzerland, 2014; pp. 74–83. [Google Scholar]
- Bakharev, T. Geopolymeric materials prepared using Class F fly ash and elevated temperature curing. Cem. Concr. Res. 2005, 35, 1224–1232. [Google Scholar] [CrossRef]
- Criado, M.; Palomo, A.; Fernández-Jiménez, A.; Banfill, P. Alkali activated fly ash: Effect of admixtures on paste rheology. Rheol. Acta 2009, 48, 447–455. [Google Scholar] [CrossRef]
- Temuujin, J.; Williams, R.; Van Riessen, A. Effect of mechanical activation of fly ash on the properties of geopolymer cured at ambient temperature. J. Mater. Process. Technol. 2009, 209, 5276–5280. [Google Scholar] [CrossRef]
- Temuujin, J.; Minjigmaa, A.; Rickard, W.; Lee, M.; Williams, I.; Van Riessen, A. Fly ash based geopolymer thin coatings on metal substrates and its thermal evaluation. J. Hazard. Mater. 2010, 180, 748–752. [Google Scholar] [CrossRef] [PubMed]
- Temuujin, J.; Minjigmaa, A.; Rickard, W.; Lee, M.; Williams, I.; Van Riessen, A. Preparation of metakaolin based geopolymer coatings on metal substrates as thermal barriers. Appl. Clay Sci. 2009, 46, 265–270. [Google Scholar] [CrossRef]
- Temuujin, J.; Rickard, W.; Lee, M.; van Riessen, A. Preparation and thermal properties of fire resistant metakaolin-based geopolymer-type coatings. J. Non-Cryst. Solids 2011, 357, 1399–1404. [Google Scholar] [CrossRef]
- Zarina, Y.; Al Bakri Abdullah, M.M.; Kamarudin, H.; Khairul Nizar, I.; Abd Razak, R. Reviews on the geopolymer materials for coating application. In Advanced Materials Research; Trans Tech Publications: Zürich, Switzerland, 2013; pp. 958–962. [Google Scholar]
- Zhu, H.; Liang, G.; Xu, J.; Wu, Q.; Du, J. Surface-modification of fly ash and its effect on strength and freezing resistance of slag based geopolymer. Constr. Build. Mater. 2019, 199, 574–580. [Google Scholar] [CrossRef]
- Babaee, M.; Castel, A. Chloride diffusivity, chloride threshold, and corrosion initiation in reinforced alkali-activated mortars: Role of calcium, alkali, and silicate content. Cem. Concr. Res. 2018, 111, 56–71. [Google Scholar] [CrossRef]
- Osio-Norgaard, J.; Gevaudan, J.P.; Srubar III, W.V. A review of chloride transport in alkali-activated cement paste, mortar, and concrete. Constr. Build. Mater. 2018, 186, 191–206. [Google Scholar] [CrossRef]
- Yoon, H.; Park, S.M.; Lee, H.-K. Effect of MgO on chloride penetration resistance of alkali-activated binder. Constr. Build. Mater. 2018, 178, 584–592. [Google Scholar] [CrossRef]
- Bernal, S.A.; Rodríguez, E.D.; de Gutiérrez, R.M.; Gordillo, M.; Provis, J.L. Mechanical and thermal characterisation of geopolymers based on silicate-activated metakaolin/slag blends. J. Mater. Sci. 2011, 46, 5477–5486. [Google Scholar] [CrossRef]
- Saafi, M.; Piukovics, G.; Ye, J. Hybrid graphene/geopolymeric cement as a superionic conductor for structural health monitoring applications. Smart Mater. Struct. 2016, 25, 105018. [Google Scholar] [CrossRef]
- Biondi, L.; Perry, M.; Vlachakis, C.; Hamilton, A. Smart cements: Repairs and sensors for concrete assets. In Sensors and Smart Structures Technologies for Civil, Mechanical, and Aerospace Systems; International Society for Optics and Photonics: Bellingham, WA, USA, 2018; p. 105982U. [Google Scholar]
- Vlachakis, C.; Biondi, L.; Perry, M. 3D printed smart repairs for civil infrastructure. In Proceedings of the 9th European Workshop on Structural Health Monitoring, Manchester, UK, 10–13 July 2018. [Google Scholar]
- Perry, M.; Saafi, M.; Fusiek, G.; Niewczas, P. Geopolymeric thermal conductivity sensors for surface-mounting onto concrete structures. In Proceedings of the 9th International Concrete Conference 2016: Environment, Efficiency and Economic Challenges for Concrete, Dundee, UK, 4–6 July 2016. [Google Scholar]
- Perry, M.; Saafi, M.; Fusiek, G.; Niewczas, P. Hybrid optical-fibre/geopolymer sensors for structural health monitoring of concrete structures. Smart Mater. Struct. 2015, 24, 045011. [Google Scholar] [CrossRef]
- Zhang, Z.; Wang, H.; Provis, J.L.; Reid, A. Efflorescence: A critical challenge for geopolymer applications? In Proceedings of the Concrete Institute of Australia’s Biennial National Conference, Gold Coast, Australia, 16–18 October 2013; pp. 1–10. [Google Scholar]
- Zhang, Z.; Provis, J.L.; Reid, A.; Wang, H. Fly ash-based geopolymers: The relationship between composition, pore structure and efflorescence. Cem. Concr. Res. 2014, 64, 30–41. [Google Scholar] [CrossRef]
- Somna, K.; Jaturapitakkul, C.; Kajitvichyanukul, P.; Chindaprasirt, P. NaOH-activated ground fly ash geopolymer cured at ambient temperature. Fuel 2011, 90, 2118–2124. [Google Scholar] [CrossRef]
- Xie, J.; Kayali, O. Effect of initial water content and curing moisture conditions on the development of fly ash-based geopolymers in heat and ambient temperature. Constr. Build. Mater. 2014, 67, 20–28. [Google Scholar] [CrossRef]
- Davidovits, J. Geopolymer Chemistry and Applications; Geopolymer Institute: Saint-Quentin, France, 2008. [Google Scholar]
- Panias, D.; Giannopoulou, I.P.; Perraki, T. Effect of synthesis parameters on the mechanical properties of fly ash-based geopolymers. Colloids Surf. A 2007, 301, 246–254. [Google Scholar] [CrossRef]
- Wattanachai, P.; Suwan, T. Strength of Geopolymer Cement Curing at Ambient Temperature by Non-Oven Curing Approaches: An Overview. In IOP Conference Series: Materials Science and Engineering; IOP Publishing: Bristol, UK, 2017; p. 012014. [Google Scholar]
- Fang, G.; Bahrami, H.; Zhang, M. Mechanisms of autogenous shrinkage of alkali-activated fly ash-slag pastes cured at ambient temperature within 24 h. Constr. Build. Mater. 2018, 171, 377–387. [Google Scholar] [CrossRef]
- Bignozzi, M.C.; Manzi, S.; Natali, M.E.; Rickard, W.D.; Van Riessen, A. Room temperature alkali activation of fly ash: The effect of Na2O/SiO2 ratio. Constr. Build. Mater. 2014, 69, 262–270. [Google Scholar] [CrossRef]
- Hsu, S.; Chi, M.; Huang, R. Effect of fineness and replacement ratio of ground fly ash on properties of blended cement mortar. Constr. Build. Mater. 2018, 176, 250–258. [Google Scholar] [CrossRef]
- Fanghui, H.; Qiang, W.; Jingjing, F. The differences among the roles of ground fly ash in the paste, mortar and concrete. Constr. Build. Mater. 2015, 93, 172–179. [Google Scholar] [CrossRef]
- Mucsi, G.; Kumar, S.; Csőke, B.; Kumar, R.; Molnár, Z.; Rácz, Á.; Mádai, F.; Debreczeni, Á. Control of geopolymer properties by grinding of land filled fly ash. Int. J. Miner. Process. 2015, 143, 50–58. [Google Scholar] [CrossRef]
- Puertas, F.; Martínez-Ramírez, S.; Alonso, S.; Vazquez, T. Alkali-activated fly ash/slag cements: Strength behaviour and hydration products. Cem. Concr. Res. 2000, 30, 1625–1632. [Google Scholar] [CrossRef]
- Bernal, S.A.; Provis, J.L.; Walkley, B.; San Nicolas, R.; Gehman, J.D.; Brice, D.G.; Kilcullen, A.R.; Duxson, P.; van Deventer, J.S. Gel nanostructure in alkali-activated binders based on slag and fly ash, and effects of accelerated carbonation. Cem. Concr. Res. 2013, 53, 127–144. [Google Scholar] [CrossRef]
- Nath, P.; Sarker, P.K. Effect of GGBFS on setting, workability and early strength properties of fly ash geopolymer concrete cured in ambient condition. Constr. Build. Mater. 2014, 66, 163–171. [Google Scholar] [CrossRef]
- Deb, P.S.; Nath, P.; Sarker, P.K. The effects of ground granulated blast-furnace slag blending with fly ash and activator content on the workability and strength properties of geopolymer concrete cured at ambient temperature. Mater. Des. (1980–2015) 2014, 62, 32–39. [Google Scholar] [CrossRef]
- Fang, G.; Ho, W.K.; Tu, W.; Zhang, M. Workability and mechanical properties of alkali-activated fly ash-slag concrete cured at ambient temperature. Constr. Build. Mater. 2018, 172, 476–487. [Google Scholar] [CrossRef]
- Deb, P.S.; Nath, P.; Sarker, P.K. Drying shrinkage of slag blended fly ash geopolymer concrete cured at room temperature. Procedia Eng. 2015, 125, 594–600. [Google Scholar] [CrossRef]
- Oderji, S.Y.; Chen, B.; Jaffar, S.T.A. Effects of relative humidity on the properties of fly ash-based geopolymers. Constr. Build. Mater. 2017, 153, 268–273. [Google Scholar] [CrossRef]
- Hu, S.; Wang, H.; Zhang, G.; Ding, Q. Bonding and abrasion resistance of geopolymeric repair material made with steel slag. Cem. Concr. Compos. 2008, 30, 239–244. [Google Scholar] [CrossRef]
- Provis, J.L.; Van Deventer, J.S.J. Geopolymers: Structures, Processing, Properties and Industrial Applications; Elsevier: Amsterdam, The Netherlands, 2009. [Google Scholar]
- Davidovits, J. The need to create a new technical language for the transfer of basic scientific information. Transf. Exploit. Sci. Tech. Inf. EUR 1982, 7716, 316–320. [Google Scholar]
- Davidovits, J. Geopolymers: Inorganic polymeric new materials. J. Therm. Anal. Calorim. 1991, 37, 1633–1656. [Google Scholar] [CrossRef]
- Diaz-Loya, I.; Juenger, M.; Seraj, S.; Minkara, R. Extending supplementary cementitious material resources: Reclaimed and remediated fly ash and natural pozzolans. Cem. Concr. Compos. 2017. [Google Scholar] [CrossRef]
- Rashad, A.M. A comprehensive overview about the influence of different admixtures and additives on the properties of alkali-activated fly ash. Mater. Des. 2014, 53, 1005–1025. [Google Scholar] [CrossRef]
- Turner, L.K.; Collins, F.G. Carbon dioxide equivalent (CO2-e) emissions: A comparison between geopolymer and OPC cement concrete. Constr. Build. Mater. 2013, 43, 125–130. [Google Scholar] [CrossRef]
- Hanjitsuwan, S.; Hunpratub, S.; Thongbai, P.; Maensiri, S.; Sata, V.; Chindaprasirt, P. Effects of NaOH concentrations on physical and electrical properties of high calcium fly ash geopolymer paste. Cem. Concr. Compos. 2014, 45, 9–14. [Google Scholar] [CrossRef]
- Diaz, E.; Allouche, E.; Eklund, S. Factors affecting the suitability of fly ash as source material for geopolymers. Fuel 2010, 89, 992–996. [Google Scholar] [CrossRef]
- Kramar, S.; Šajna, A.; Ducman, V. Assessment of alkali activated mortars based on different precursors with regard to their suitability for concrete repair. Constr. Build. Mater. 2016, 124, 937–944. [Google Scholar] [CrossRef]
- Raupach, M. Concrete repair according to the new European standard EN 1504. Concr. Repair Rehabil. Retrofit. 2006, 6–8. [Google Scholar] [CrossRef]
- Raupach, M.; Büttner, T. Concrete Repair to EN 1504: Diagnosis, Design, Principles and Practice; CRC Press: Boca Raton, FL, USA, 2014. [Google Scholar]
- Huseien, G.F.; Mirza, J.; Ismail, M.; Ghoshal, S.; Hussein, A.A. Geopolymer mortars as sustainable repair material: A comprehensive review. Renew. Sustain. Energy Rev. 2017, 80, 54–74. [Google Scholar] [CrossRef]
- Struble, L.; Kim, E.; Gómez-Zamorano, L. Overview of Geopolymer Cement. In Geopolymer Binder Systems; ASTM International: West Conshohocken, PA, USA, 2013. [Google Scholar]
- Lura, P.; Jensen, O.M.; van Breugel, K. Autogenous shrinkage in high-performance cement paste: An evaluation of basic mechanisms. Cem. Concr. Res. 2003, 33, 223–232. [Google Scholar] [CrossRef]
- Vijayakumar, R.M. Evaluating Shrinkage of Fly Ash-Slag Geopolymers. Master’s Thesis, University of Illinois at Urbana-Champaign, Champaign, IL, USA, 2013. [Google Scholar]
- Nedeljković, M.; Luković, M.; van Breugel, K.; Hordijk, D.; Ye, G. Development and application of an environmentally friendly ductile alkali-activated composite. J. Clean. Prod. 2018, 180, 524–538. [Google Scholar] [CrossRef]
- Zhou, J.; Ye, G.; van Breugel, K. Cement hydration and microstructure in concrete repairs with cementitious repair materials. Constr. Build. Mater. 2016, 112, 765–772. [Google Scholar] [CrossRef]
- Zheng, Y.C. Shrinkage Behaviour of Geopolymer. Master’s Thesis, The University of Melbourne, Melbourne, Australia, 2009. [Google Scholar]
- Montes, C.; Allouche, E. Rheological Behavior of Fly-Ash-Based Geopolymers. In Geopolymer Binder Systems; ASTM International: Sydney, Australia, 2013. [Google Scholar]
- Palomo, A.; Banfill, P.; Fernández-Jiménez, A.; Swift, D. Properties of alkali-activated fly ashes determined from rheological measurements. Adv. Cem. Res. 2005, 17, 143–151. [Google Scholar] [CrossRef]
- Palacios, M.; Banfill, P.F.; Puertas, F. Rheology and setting of alkali-activated slag pastes and mortars: Effect of organic admixture. ACI Mater. J. 2008, 105, 140. [Google Scholar]
- Laskar, A.I.; Bhattacharjee, R. Rheology of Fly-Ash-Based Geopolymer Concrete. ACI Mater. J. 2011, 108, 536–542. [Google Scholar]
- Suraneni, P.; Puligilla, S.; Kim, E.H.; Chen, X.; Struble, L.J.; Mondal, P. Monitoring setting of geopolymers. Adv. Civ. Eng. Mater. 2014, 3, 177–192. [Google Scholar] [CrossRef]
- Julio, E.N.; Branco, F.A.; Silva, V.D. Concrete-to-concrete bond strength. Influence of the roughness of the substrate surface. Constr. Build. Mater. 2004, 18, 675–681. [Google Scholar] [CrossRef]
- Beushausen, H.; Alexander, M. Bond strength development between concretes of different ages. Mag. Concr. Res. 2008, 60, 65–74. [Google Scholar] [CrossRef]
- Espeche, A.D.; León, J. Estimation of bond strength envelopes for old-to-new concrete interfaces based on a cylinder splitting test. Constr. Build. Mater. 2011, 25, 1222–1235. [Google Scholar] [CrossRef]
- Courard, L.; Lenaers, J.-F.; Michel, F.; Garbacz, A. Saturation level of the superficial zone of concrete and adhesion of repair systems. Constr. Build. Mater. 2011, 25, 2488–2494. [Google Scholar] [CrossRef]
- Courard, L.; Piotrowski, T.; Garbacz, A. Near-to-surface properties affecting bond strength in concrete repair. Cem. Concr. Compos. 2014, 46, 73–80. [Google Scholar] [CrossRef]
- Mohammadi, M.; Moghtadaei, R.M.; Samani, N.A. Influence of silica fume and metakaolin with two different types of interfacial adhesives on the bond strength of repaired concrete. Constr. Build. Mater. 2014, 51, 141–150. [Google Scholar] [CrossRef]
- Qian, J.; You, C.; Wang, Q.; Wang, H.; Jia, X. A method for assessing bond performance of cement-based repair materials. Constr. Build. Mater. 2014, 68, 307–313. [Google Scholar] [CrossRef]
- Pacheco-Torgal, F.; Abdollahnejad, Z.; Miraldo, S.; Baklouti, S.; Ding, Y. An overview on the potential of geopolymers for concrete infrastructure rehabilitation. Constr. Build. Mater. 2012, 36, 1053–1058. [Google Scholar] [CrossRef]
- Morgan, D. Compatibility of concrete repair materials and systems. Constr. Build. Mater. 1996, 10, 57–67. [Google Scholar] [CrossRef]
- Zanotti, C.; Borges, P.H.; Bhutta, A.; Banthia, N. Bond strength between concrete substrate and metakaolin geopolymer repair mortar: Effect of curing regime and PVA fiber reinforcement. Cem. Concr. Compos. 2017, 80, 307–316. [Google Scholar] [CrossRef]
- Emberson, N.; Mays, G. Significance of property mismatch in the patch repair of structural concrete Part 1: Properties of repair systems. Mag. Concr. Res. 1990, 42, 147–160. [Google Scholar] [CrossRef]
- Emberson, N.; Mays, G. Significance of property mismatch in the patch repair of structural concrete Part 2: Axially loaded reinforced concrete members. Mag. Concr. Res. 1990, 42, 161–170. [Google Scholar] [CrossRef]
- Emmons, R. Concrete Repair and Maintenance Illustrated. Problem Analysis. Repair Strategy. Techniques; R.S. Means Co.: Rockland, MA, USA, 1993. [Google Scholar]
- Szklorzová, H.; Bílek, V. Influence of alkali ions in the activator on the performance of alkali-activated mortars. In Proceedings of the 3rd International Symposium on Non-traditional Cement and Concrete, Brno, Czech Republic, 10–12 June 2008. [Google Scholar]
- Nedeljković, M.; Li, Z.; Ye, G. Setting, strength, and autogenous shrinkage of alkali-activated fly ash and slag pastes: Effect of slag content. Materials 2018, 11, 2121. [Google Scholar] [CrossRef]
- Courard, L. Adhesion of repair systems to concrete: Influence of interfacial topography and transport phenomena. Mag. Concr. Res. 2005, 57, 273–282. [Google Scholar] [CrossRef]
- Pellegrino, C.; da Porto, F.; Modena, C. Rehabilitation of reinforced concrete axially loaded elements with polymer-modified cementicious mortar. Constr. Build. Mater. 2009, 23, 3129–3137. [Google Scholar] [CrossRef]
- Zuhua, Z.; Xiao, Y.; Huajun, Z.; Yue, C. Role of water in the synthesis of calcined kaolin-based geopolymer. Appl. Clay Sci. 2009, 43, 218–223. [Google Scholar] [CrossRef]
- Bentz, D.P.; Snyder, K.A.; Stutzman, P.E. Hydration of Portland cement: The effects of curing conditions. In Proceedings of the 10th International Congress on the Chemistry of Cement, Gothenburg, Sweden, 2–6 June 1997. [Google Scholar]
- Garbacz, A.; Courard, L.; Bissonnette, B. A surface engineering approach applicable to concrete repair engineering. Bull. Pol. Acad. Sci. Tech. Sci. 2013, 61, 73–84. [Google Scholar] [CrossRef]
- EN, B. Methods of Testing Cement. Determination of Setting Time and Soundness; BS EN 196 Part; British Standards Institute: London, UK, 2005; Volume 3. [Google Scholar]
- Williams, R.P.; Van Riessen, A. Determination of the reactive component of fly ashes for geopolymer production using XRF and XRD. Fuel 2010, 89, 3683–3692. [Google Scholar] [CrossRef]
- Bradley, D.; Roth, G. Adaptive thresholding using the integral image. J. Graph. Tools 2007, 12, 13–21. [Google Scholar] [CrossRef]
- Seul, M.; Sammon, M.J.; O’Gorman, L. Practical Algorithms for Image Analysis Description. In Examples, and Code; Cambridge University Press: Cambridge, UK, 2000; ISBN 521660653. [Google Scholar]
- Ioannou, D.; Huda, W.; Laine, A.F. Circle recognition through a 2D Hough transform and radius histogramming. Image Vaision Comput. 1999, 17, 15–26. [Google Scholar] [CrossRef]
- Perry, M.; Fusiek, G.; Niewczas, P.; Rubert, T.; McAlorum, J. Wireless Concrete Strength Monitoring of Wind Turbine Foundations. Sensors 2017, 17, 2928. [Google Scholar] [CrossRef] [PubMed]
- Piasta, W.; Zarzycki, B. The effect of cement paste volume and w/c ratio on shrinkage strain, water absorption and compressive strength of high performance concrete. Constr. Build. Mater. 2017, 140, 395–402. [Google Scholar] [CrossRef]
- Bissonnette, B.T.; Pierre, P.; Pigeon, M. Influence of key parameters on drying shrinkage of cementitious materials. Cem. Concr. Res. 1999, 29, 1655–1662. [Google Scholar] [CrossRef]
- Ma, G.; Wang, L. A critical review of preparation design and workability measurement of concrete material for largescale 3D printing. Front. Struct. Civ. Eng. 2018, 12, 382–400. [Google Scholar] [CrossRef]
- Criado, M.; Aperador, W.; Sobrados, I. Microstructural and mechanical properties of alkali activated Colombian raw materials. Materials 2016, 9, 158. [Google Scholar] [CrossRef]
- García-Lodeiro, I.; Palomo, A.; Fernández-Jiménez, A.; Macphee, D. Compatibility studies between NASH and CASH gels. Study in the ternary diagram Na2O–CaO–Al2O3–SiO2–H2O. Cem. Concr. Res. 2011, 41, 923–931. [Google Scholar] [CrossRef]
- Phoo-ngernkham, T.; Chindaprasirt, P.; Sata, V.; Hanjitsuwan, S.; Hatanaka, S. The effect of adding nano-SiO2 and nano-Al2O3 on properties of high calcium fly ash geopolymer cured at ambient temperature. Mater. Des. 2014, 55, 58–65. [Google Scholar] [CrossRef]
- Scarlett, N.V.; Madsen, I.C. Effect of microabsorption on the determination of amorphous content via powder X-ray diffraction. Powder Diffr. 2018, 33, 26–37. [Google Scholar] [CrossRef]
- Sun, Z.; Vollpracht, A. Isothermal calorimetry and in-situ XRD study of the NaOH activated fly ash, metakaolin and slag. Cem. Concr. Res. 2018, 103, 110–122. [Google Scholar] [CrossRef]
- Criado, M.; Fernández-Jiménez, A.; De La Torre, A.; Aranda, M.; Palomo, A. An XRD study of the effect of the SiO2/Na2O ratio on the alkali activation of fly ash. Cem. Concr. Res. 2007, 37, 671–679. [Google Scholar] [CrossRef]
- Haha, M.B.; De Weerdt, K.; Lothenbach, B. Quantification of the degree of reaction of fly ash. Cem. Concr. Res. 2010, 40, 1620–1629. [Google Scholar] [CrossRef]
- Ma, Y.; Hu, J.; Ye, G. The pore structure and permeability of alkali activated fly ash. Fuel 2013, 104, 771–780. [Google Scholar] [CrossRef]
- Park, D.; Ahn, J.; Oh, S.; Song, H.; Noguchi, T. Drying effect of polymer-modified cement for patch-repaired mortar on constraint stress. Constr. Build. Mater. 2009, 23, 434–447. [Google Scholar] [CrossRef]
- Baeza, F.; Galao, O.; Zornoza, E.; Garcés, P. Multifunctional cement composites strain and damage sensors applied on reinforced concrete (RC) structural elements. Materials 2013, 6, 841–855. [Google Scholar] [CrossRef]
- Wang, W.; Dai, H.; Wu, S. Mechanical behavior and electrical property of CFRC-strengthened RC beams under fatigue and monotonic loading. Mater. Sci. Eng. A 2008, 479, 191–196. [Google Scholar] [CrossRef]
- Van Riessen, A.; Rickard, W.; Williams, R.; Van Riessen, G. Methods for geopolymer formulation development and microstructural analysis. J. Ceram. Sci. Technol. 2017, 8, 421–431. [Google Scholar]


| Source | West Burton Power Station, Lincolnshire, England (UK) |
|---|---|
| Supplier | CEMEX |
| SiO2 | 52.70 |
| Al2O3 | 21.70 |
| Fe2O3 | 7.10 |
| CaO | 4.10 |
| Loss on ignition | 4.20 |
| Na2O | 1.10 |
| K2O | 2.50 |
| SO3 | 0.90 |
| MgO | 1.80 |
| Total phosphate | 0.58 |
| Free CaO | 0.10 |
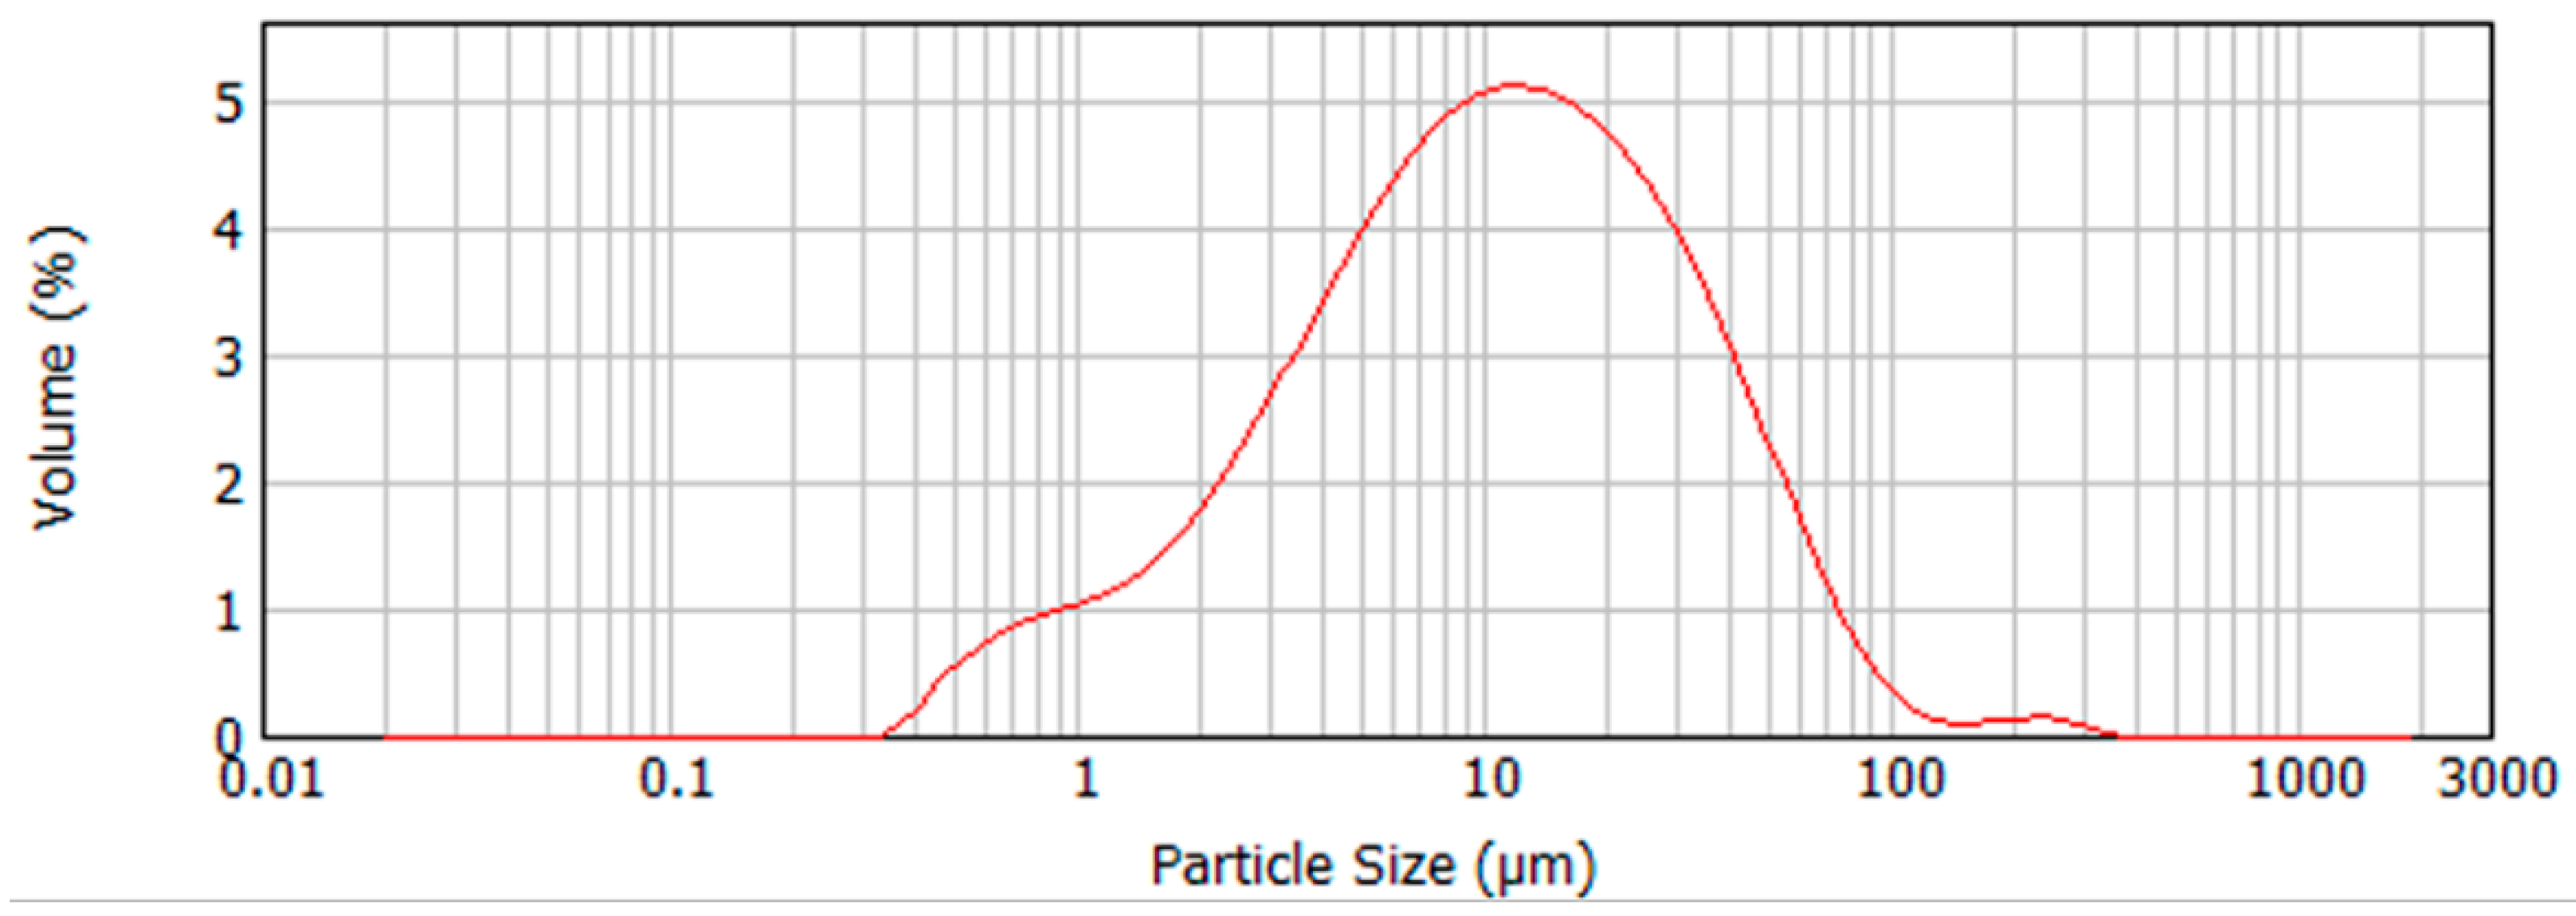
| Median particle size, μm | 10.6 |
| Age of Concrete | Young | Intermediate | Old |
|---|---|---|---|
| Surface roughness (mm) | 0.097 | 0.053 | 0.091 |
| Batch | Curing Conditions | Temperature °C | Curing Time (days) | Average RH % |
|---|---|---|---|---|
| 1 | Laboratory bench | 20 ± 2 | 28 | 50 |
| 2 | Environmental chamber | 20 ± 1 | 28 | 95 |
| Phase Content | Mullite [%] | Quartz [%] | Magnetite [%] | Hematite [%] | Amorphous content [%] | Gypsum [%] | Rwp | |
|---|---|---|---|---|---|---|---|---|
| Sample | ||||||||
| Fly ash (a) | 13.74 | 2.30 | 1.24 | 0.67 | 80.02 | 1.97 | 3.9 | |
| Geopolymer (a) | 9.18 | 2.09 | 0.89 | 0.39 | 86.15 | 1.30 | 3.0 | |
| Fly ash (b) | 15.68 | 3.48 | 1.25 | 1.34 | 76.65 | 1.36 | 2.4 | |
| Geopolymer (b) | 12.13 | 2.75 | 1.05 | 0.80 | 82.12 | 1.20 | 2.2 | |
© 2019 by the authors. Licensee MDPI, Basel, Switzerland. This article is an open access article distributed under the terms and conditions of the Creative Commons Attribution (CC BY) license (http://creativecommons.org/licenses/by/4.0/).
Share and Cite
Biondi, L.; Perry, M.; Vlachakis, C.; Wu, Z.; Hamilton, A.; McAlorum, J. Ambient Cured Fly Ash Geopolymer Coatings for Concrete. Materials 2019, 12, 923. https://doi.org/10.3390/ma12060923
Biondi L, Perry M, Vlachakis C, Wu Z, Hamilton A, McAlorum J. Ambient Cured Fly Ash Geopolymer Coatings for Concrete. Materials. 2019; 12(6):923. https://doi.org/10.3390/ma12060923
Chicago/Turabian StyleBiondi, L., M. Perry, C. Vlachakis, Z. Wu, A. Hamilton, and J. McAlorum. 2019. "Ambient Cured Fly Ash Geopolymer Coatings for Concrete" Materials 12, no. 6: 923. https://doi.org/10.3390/ma12060923
APA StyleBiondi, L., Perry, M., Vlachakis, C., Wu, Z., Hamilton, A., & McAlorum, J. (2019). Ambient Cured Fly Ash Geopolymer Coatings for Concrete. Materials, 12(6), 923. https://doi.org/10.3390/ma12060923