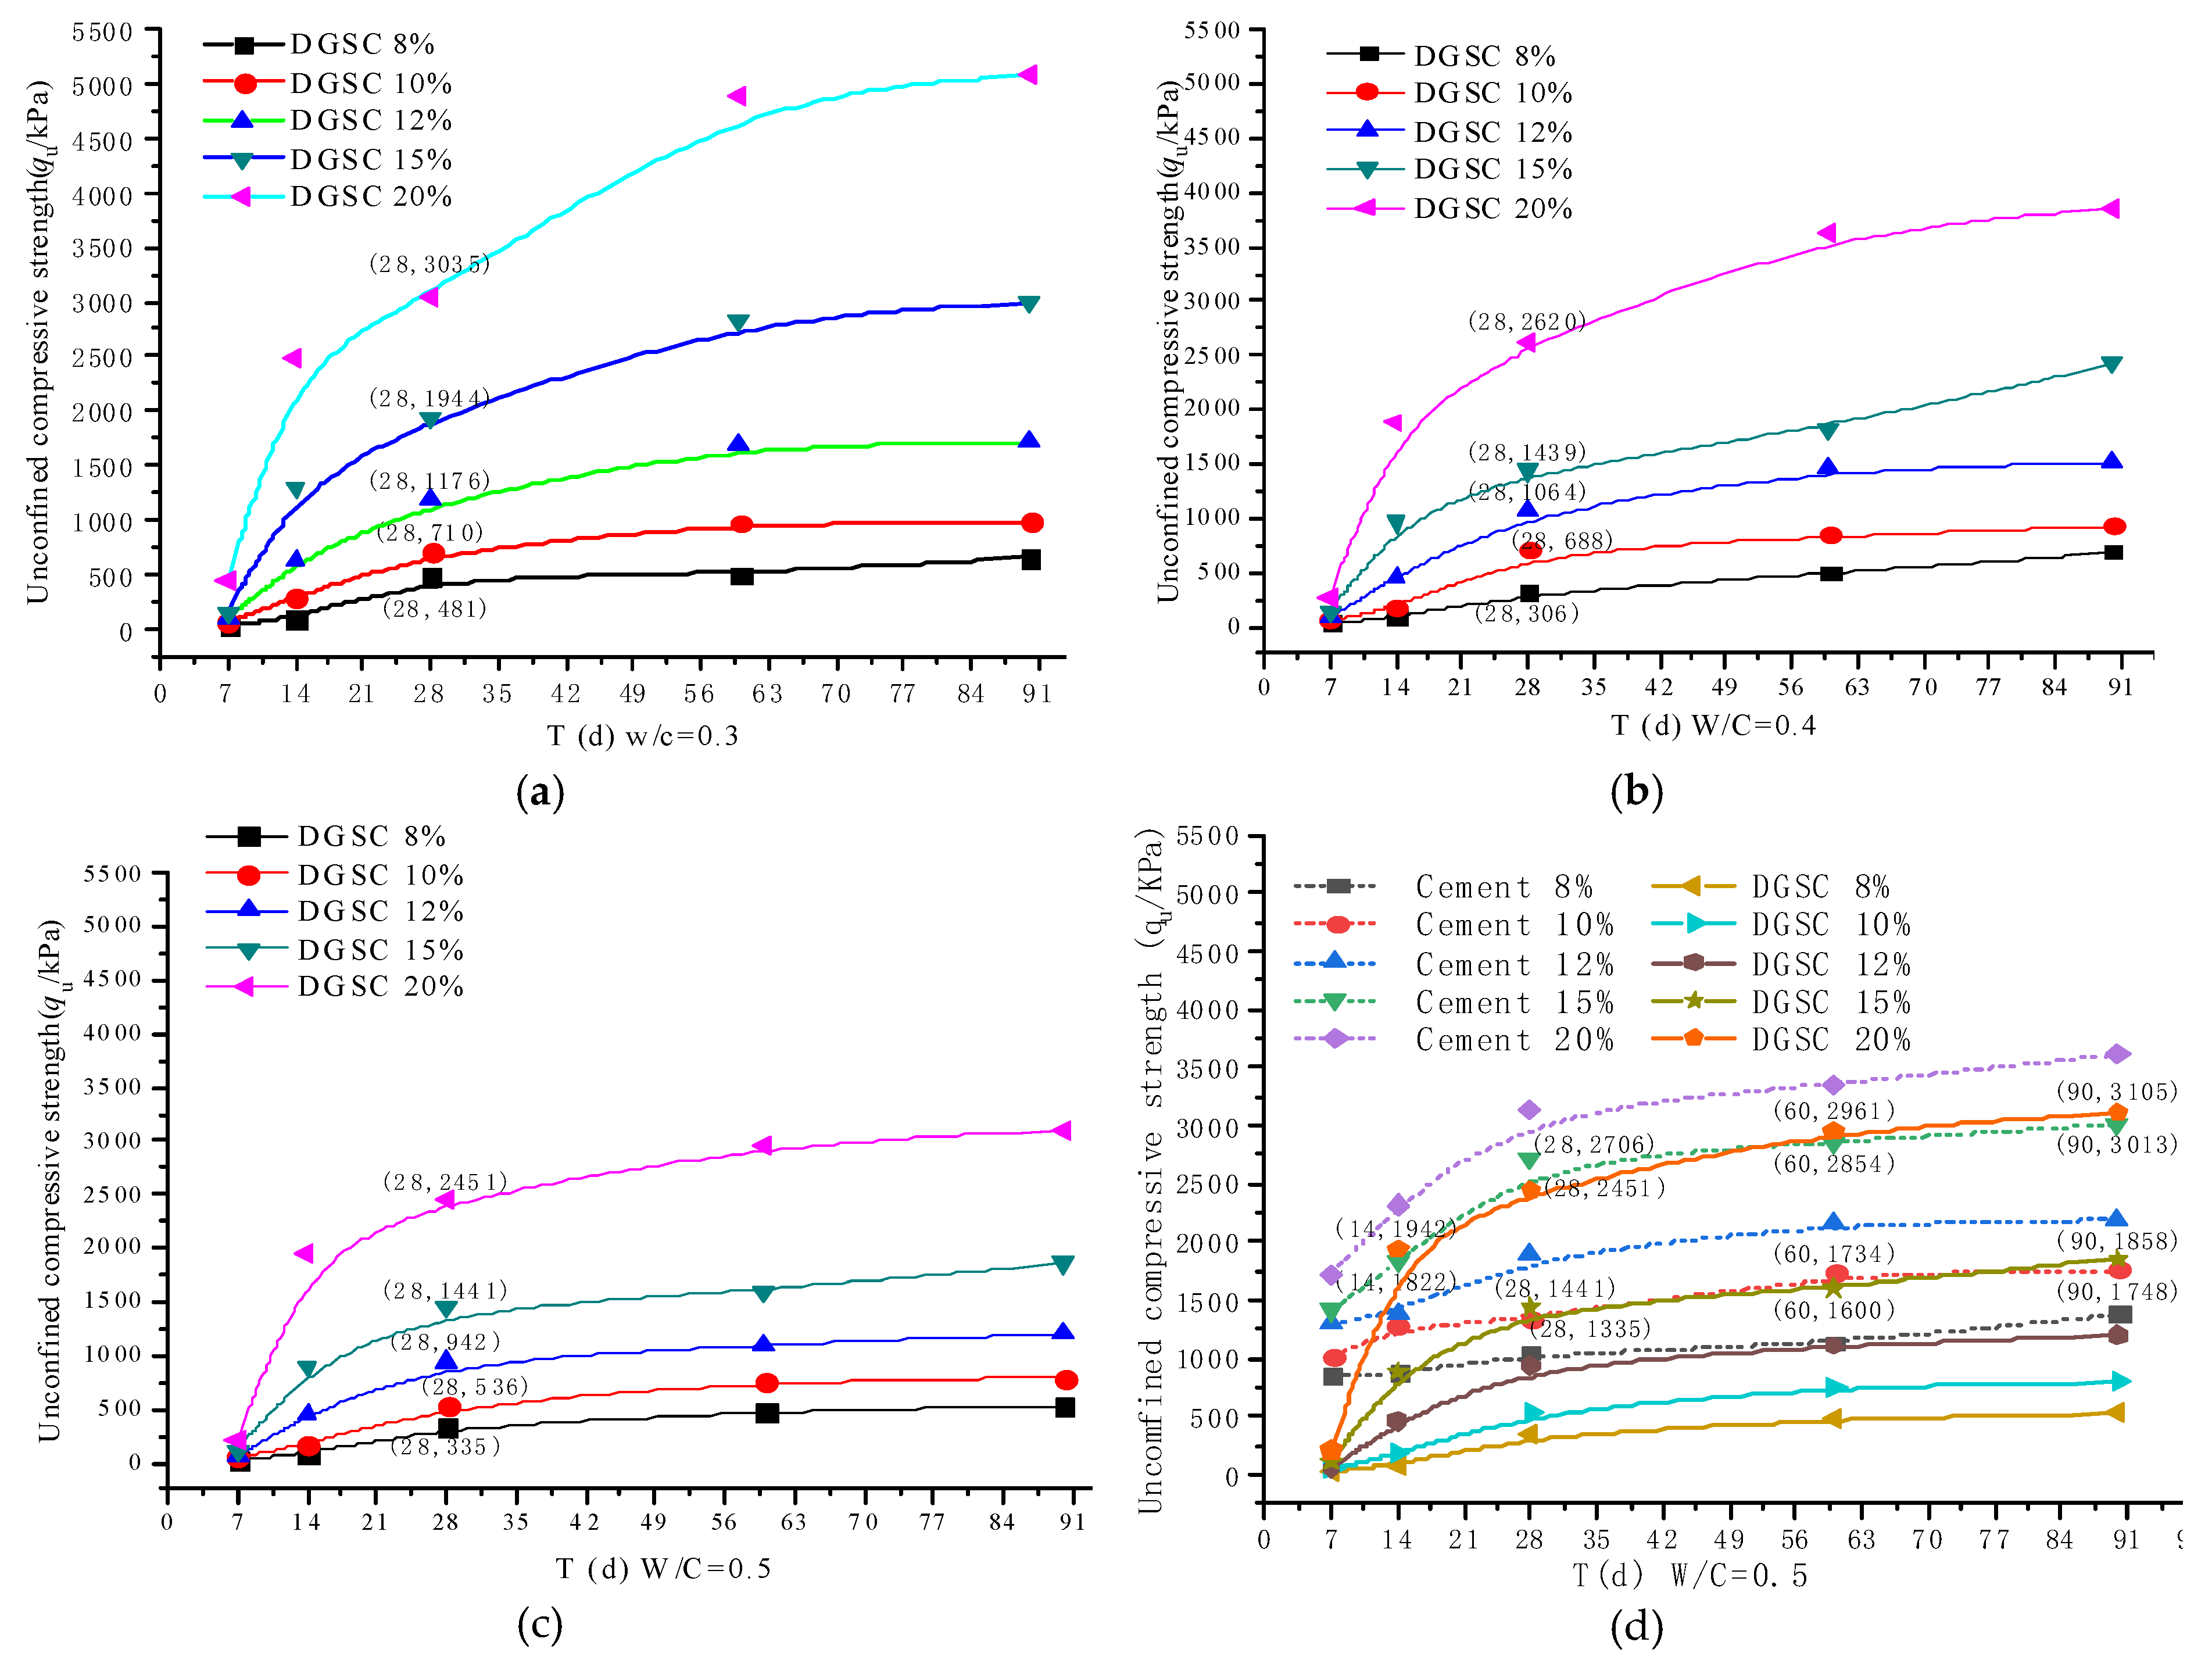
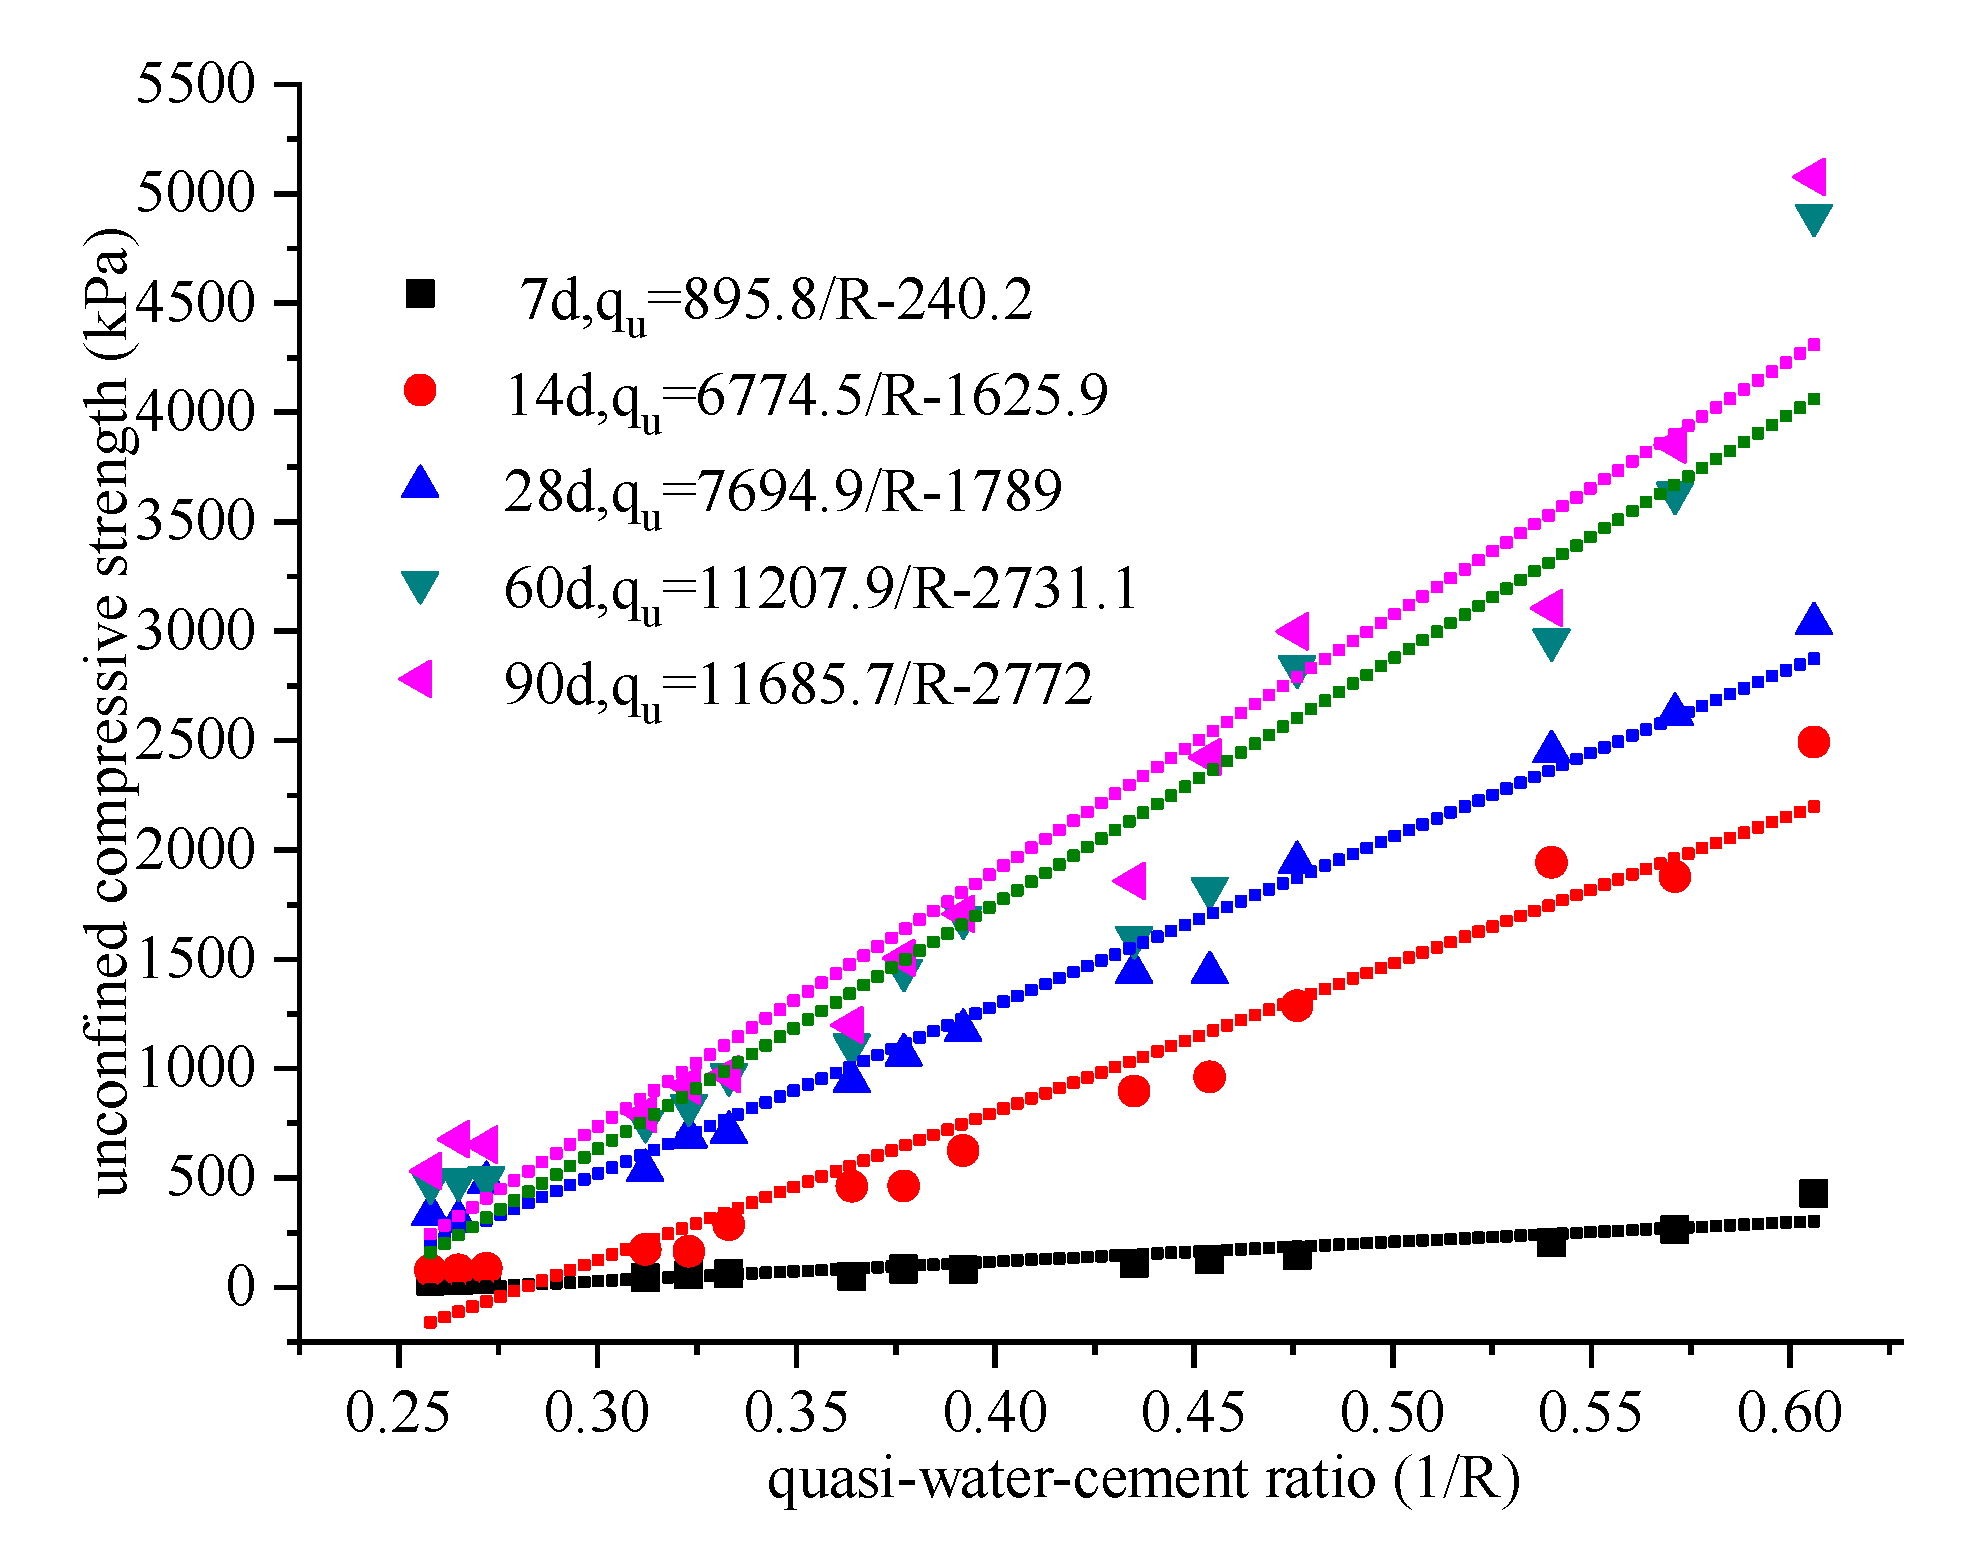
3.1. Change Law of the Unconfined Compressive Strength of Solidified Soil with Time
Figure 4 shows the curve of the unconfined compressive strength as a function of age for solidified clays with different mix ratios and different water-cement ratios. This figure shows that the laws of the unconfined compressive strengths of DGSC-solidified soil and cement-solidified soil are consistent and increase with the curing period. The early strength of DGSC-solidified soil is lower than that of cement-solidified soil and the curing effect of DGSC before 7 days is not obvious. After the 7-day curing period, the unconfined compressive strength of DGSC-solidified soil clearly increases; after the 28-day curing period, the intensity continues to increase strongly with increasing time, while the rate of increase gradually decreases. This figure also indicates that the higher the curing agent content is, the faster the increase in the unconfined compressive strength.
Table 7 shows the effect of different water-binder ratios on the unconfined compressive strength of solidified soil for the same DGSC content. When the water-binder ratios are 0.3, 0.4 and 0.5, the 28-day unconfined compressive strengths for a 15% DGSC content are 1944 kPa, 1439 kPa and 1441 kPa, respectively. The greater the water-binder ratio is, the lower the unconfined compressive strength of the corresponding solidified soil. In the later curing period of solidified soil (after 60 days), the strength of the solidified soil with a 15% DGSC content and water-binder ratio of 0.3 is 2836 kPa, which is comparable to that with a water-cement ratio of 0.5.
When the water-binder ratio of DGSC-solidified soil is 0.3 (as shown in
Figure 4a), the 28-day unconfined compressive strength for the DGSC contents of 8%, 10%, 12%, 15% and 20% are 481 kPa, 710 kPa, 1176 kPa, 1944 kPa and 3035 kPa, respectively. Increasing the binder content can improve the strength of solidified soil (
Figure 4b,c). When the water-binder ratios are 0.3, 0.4 and 0.5, the 28-day unconfined compressive strength at 20% DGSC content is 3035 kPa, 2620 kPa and 2451 kPa, respectively. Additionally, the increase in the water-cement ratio is inversely proportional to the increase in strength.
When the water-binder ratio of solidified soil is 0.5 (as shown in
Figure 4d), after the 14-day curing period (28-day, 60-day, and 90-day curing periods), the unconfined compressive strengths of the 20% DGSC content solidified soil are 1942 kPa, 2706 kPa, 2961 kPa and 3105 kPa, respectively. Again, the unconfined compressive strengths of the corresponding 15% cement-solidified soil are 1822 kPa, 2451 kPa, 2854 kPa and 3013 kPa, respectively. The strengths of the solidified soil during the same curing period for the first two abovementioned cases are similar. After the 28-day curing period, the unconfined compressive strength of the 15% DGSC content solidified soil is similar to that with 10% cement content. When the water-binder ratio and the curing conditions are the same, after the 28-day curing period, the content of DGSC is greater than that at 5% cement content, so the solidification effect of DGSC is comparable to that of cement. During the curing period (7–14 days),
Figure 4 clearly shows that the slope of the curve of the DGSC-solidified soil is significantly higher than that of the cement-solidified soil and after the 28-day curing period, not only the strength of the solidified soil increases but also the rates of increase in the strengths of the DGSC-solidified soil and cement-solidified soil become more similar. However, before 28 days, the strength of DGSC-solidified soil is still lower than that of cement-solidified soil.
The results show that during the 7-day curing period, the hydration reaction of the cement-solidified soil was intense and the strength increased rapidly; after the 7-day curing period, the hydration reaction continued but the material content with high hydration activity was decreased slowly, so the rate of increase in the strength declined accordingly. During the 7-day curing period, because of the slow dissolution of hydration components, the unfavorable chemical composition and the soil structure clearly influenced the strength of the solidified soil and the strength of the DGSC-solidified soil increased very slowly. After the 7-day curing period, the hydration components of the desulfurization gypsum, steel slag and ground granulated blast furnace slag in the curing agent were dissolved fully and the hydration reaction was accelerated; then, the strength of the DGSC-solidified soil increased rapidly. Again, after the 28-day curing time, the material content with high hydration activity in the DGSC-solidified soil decreased slowly, so the rate of increase in strength also declined accordingly.
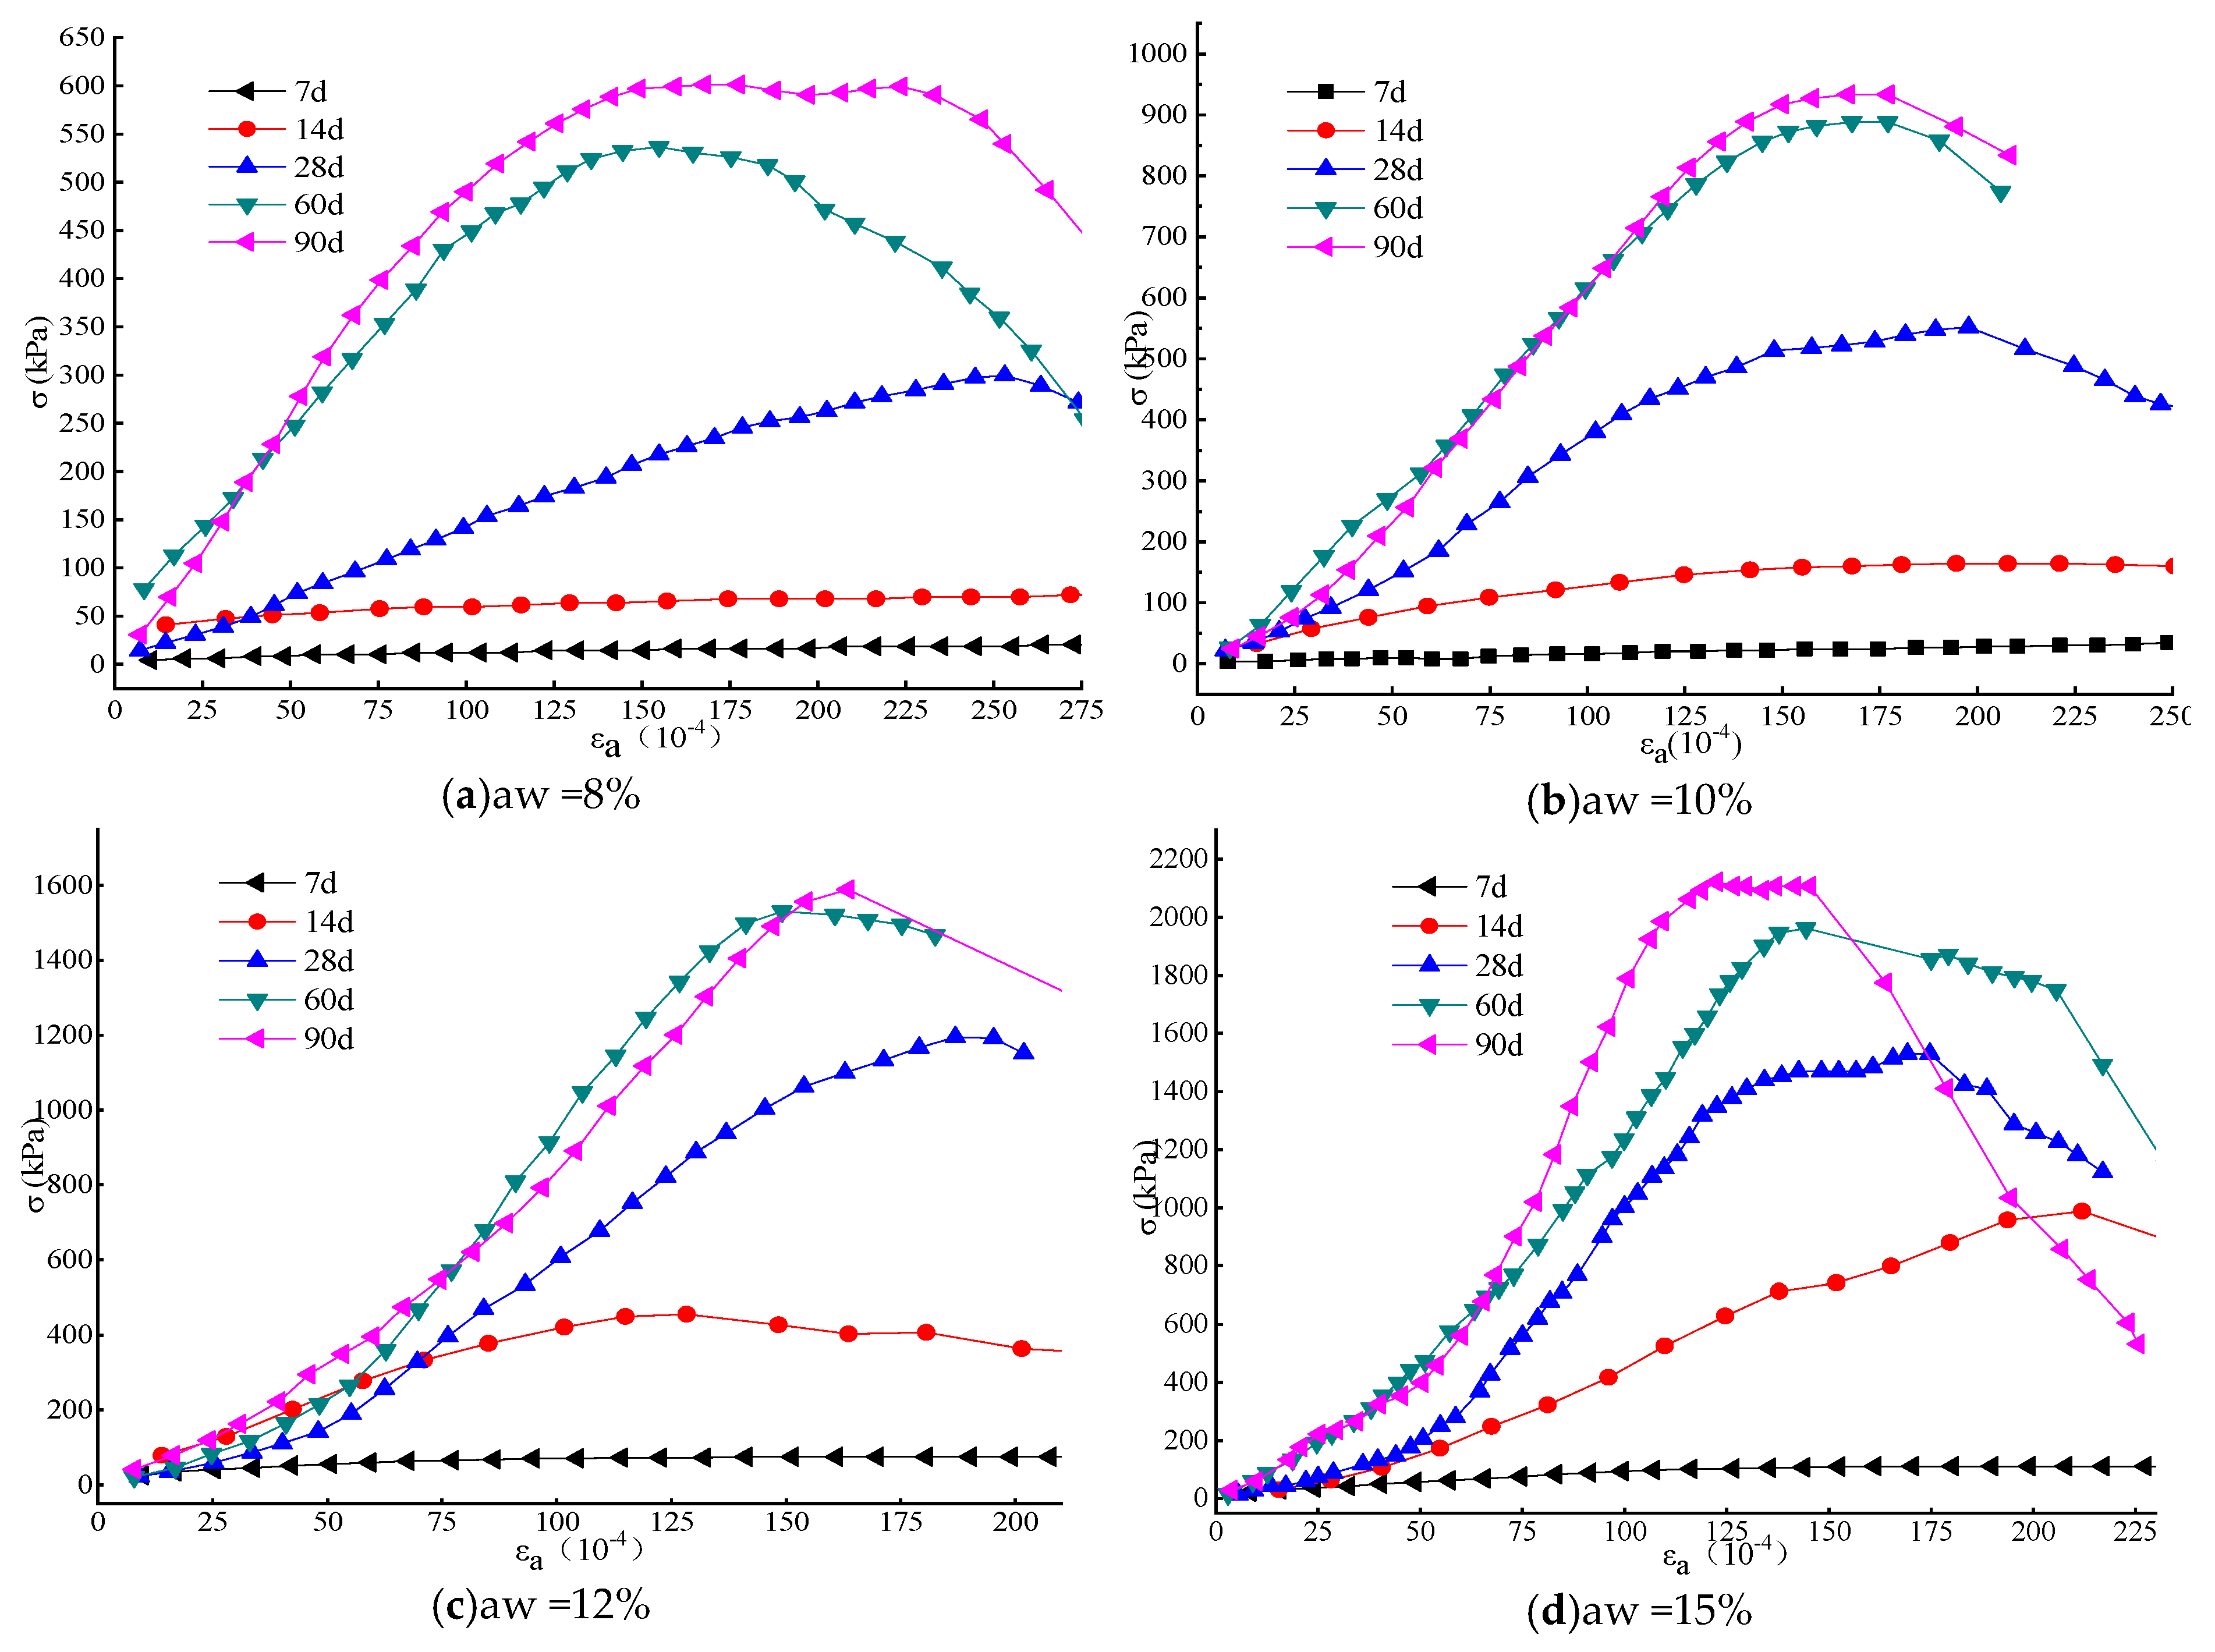
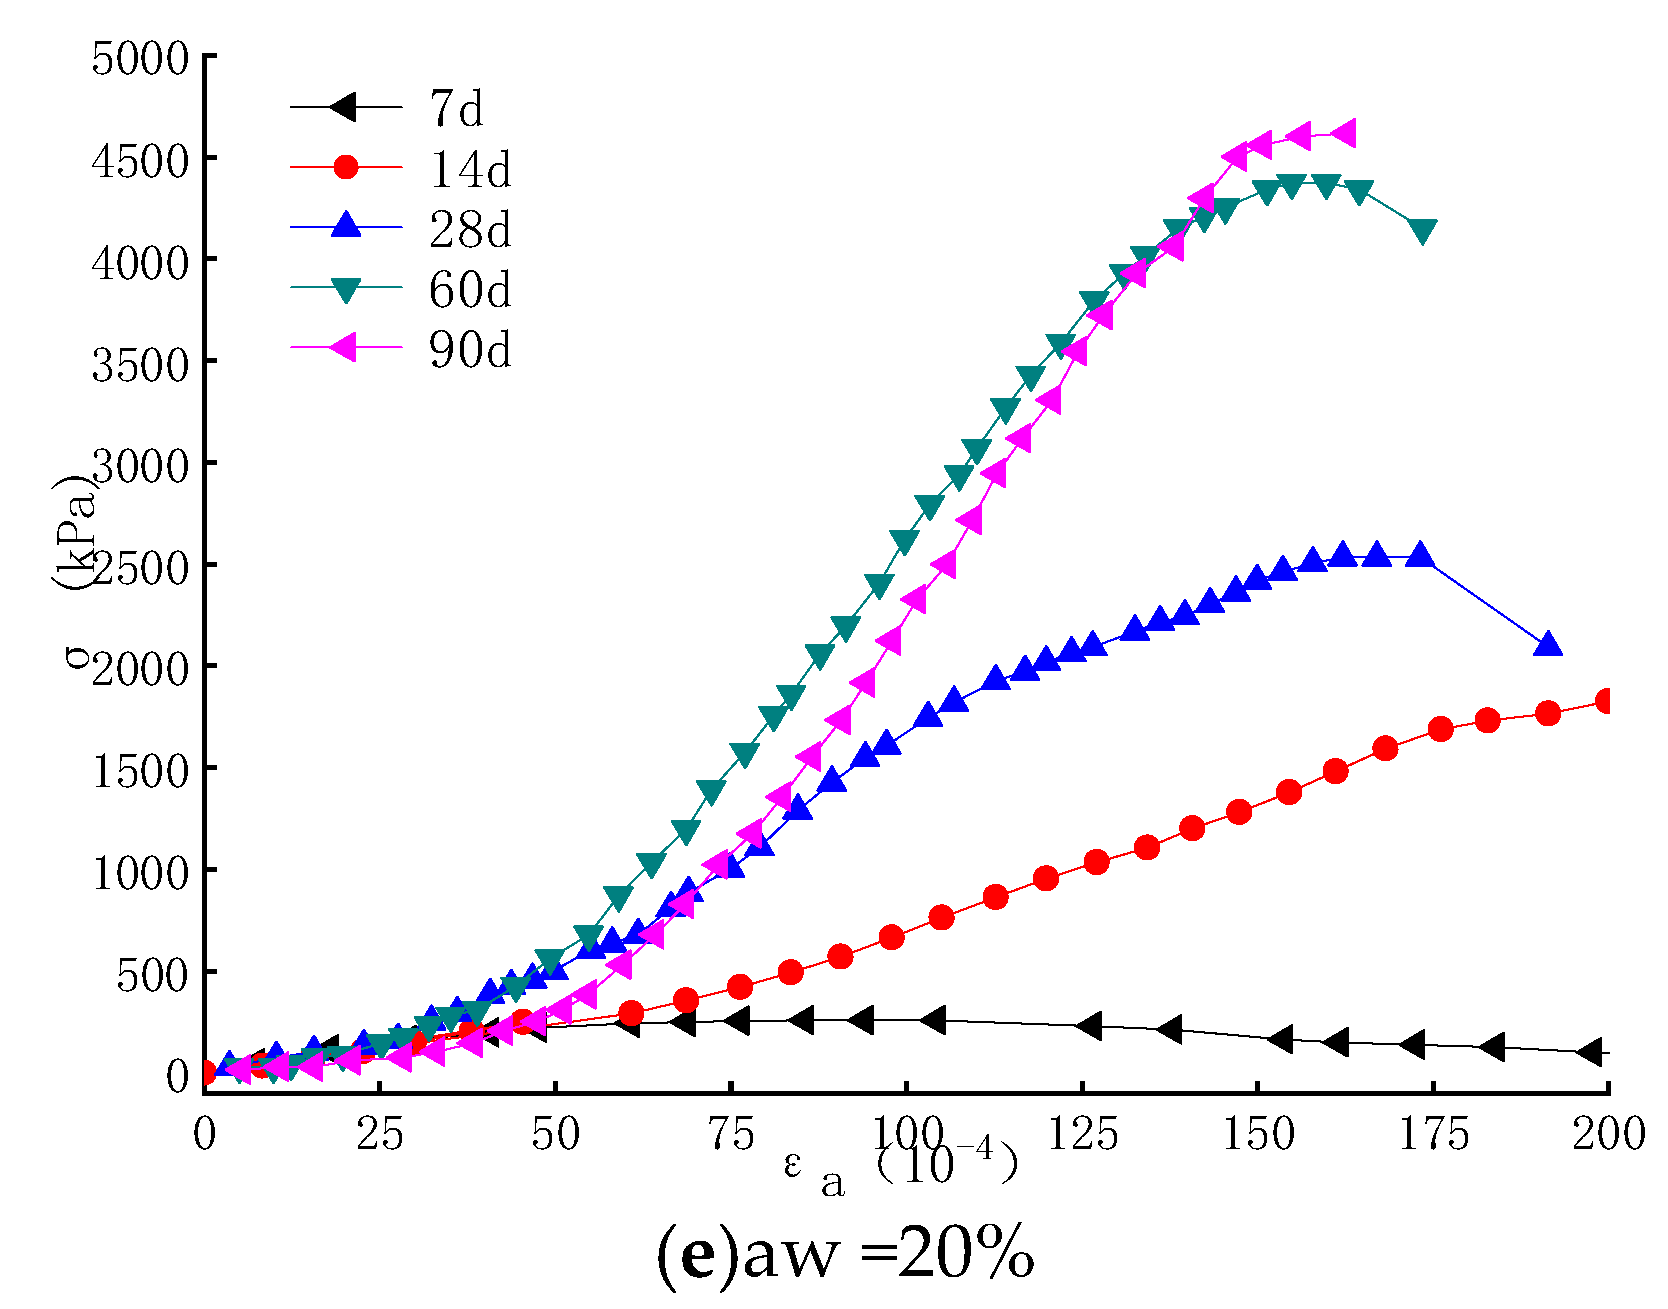
3.2. Stress-Strain Relationship of DGSC-Solidified Soil
Figure 5 shows the stress-strain relationship for solidified soils with different curing agent contents and curing periods.
Figure 5a shows that the stress-strain curves for curing times of 7 days and 14 days at 8% DGSC content are parallel. As the axial strain ε
a increases, no significant turning point appears. This result shows that for the solidified soil with an 8% DGSC content, the early stress increase is not obvious but the deformation is large and the resulting deformation is unrecoverable plastic deformation. At the same time, for the 7-day, 60-day and 90-day curing periods, the curves are significantly elevated and an inflection point appears. At 28 days, the inflection point of the curve indicates a shift to a more linear elasticity relationship within a certain strain range.
For the solidified soil with a 10% DGSC content, as shown in
Figure 5b, its stress-strain curve is similar to that of the 8% content at 7 days but slightly elevated at 14 days. This result shows that with the increase in the curing agent content, the early initial modulus E0 of the sample increases slightly. The 28-daycurve has an earlier shift than the inversion point at 8%. In the same strain range, the stress clearly increases and the initial modulus E0 increases significantly. For the curves of 60 days and 90 days, the soil behavior gradually changes to brittle failure after reaching the ultimate strength.
For the solidified soil with a DGSC content greater than or equal to 12%,
Figure 5c–e shows that the staged stress-strain relationship of the DGSC-solidified soil is reached after the 14-daycuring period. The first stage is the initial stage of loading and the curve is approximately linear; the second stage of the curve is the non-linear rising stage and the stress gradually increases and reaches the peak value; the third stage of the curve is the descending stage, that is, the failure stage of the specimen.
Figure 5b–e shows that the more DGSC curing agent is used, the more obvious the inflection point between the first stage and the second stage.
Through the analysis of the experimental results, the early strength of the DGSC-solidified soil is relatively low, the stress-strain curve is relatively flat, there is no obvious inflection point and the soil deformation is in the plastic state; with time, the stress-strain characteristics of the solidified soil change, the failure strain gradually decreases and the non-linear rising stage and the stress decreasing stage of the stress-strain curve are more obvious after reaching the limit. With the increase in the mix ratio, after the 28-day curing period, the soil behavior shifts from plastic failure to brittle failure.
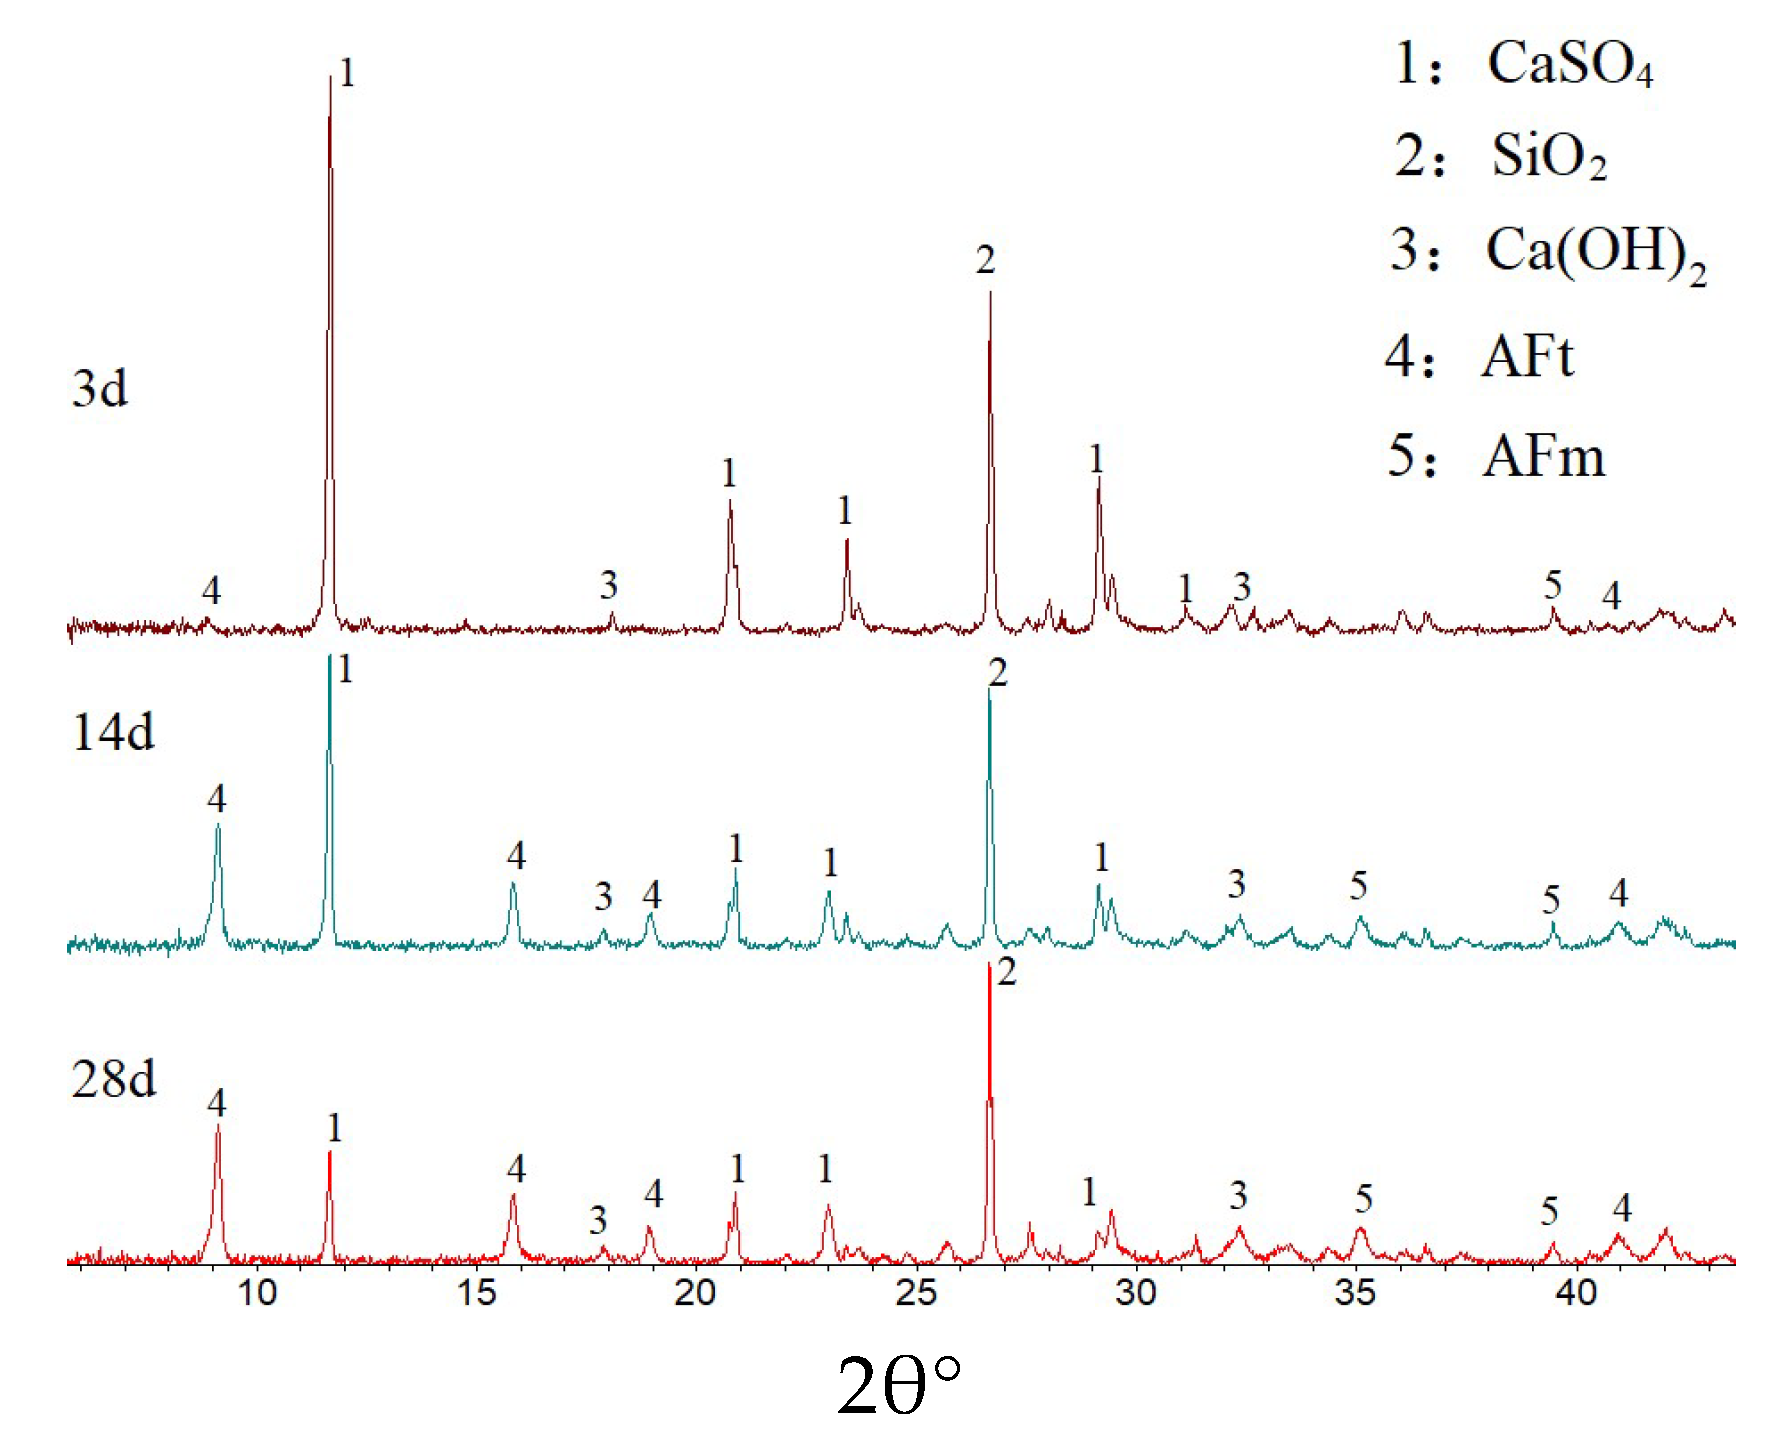
3.3. DGSC Curing Mechanism Analysis
The XRD analysis results of the hydration products of the samples at different hydration times are shown in
Figure 6. The hydration products are mainly ettringite and residual dihydrate gypsum. As the time of hydration is prolonged, the intensity of the diffraction peak of ettringite increases and the intensity of the diffraction peaks of dihydrate gypsum decreases. This result shows that during hydration, desulfurized gypsum is gradually consumed, the content of hardened gypsum gradually decreases and increasingly more hydrated ettringite is produced.
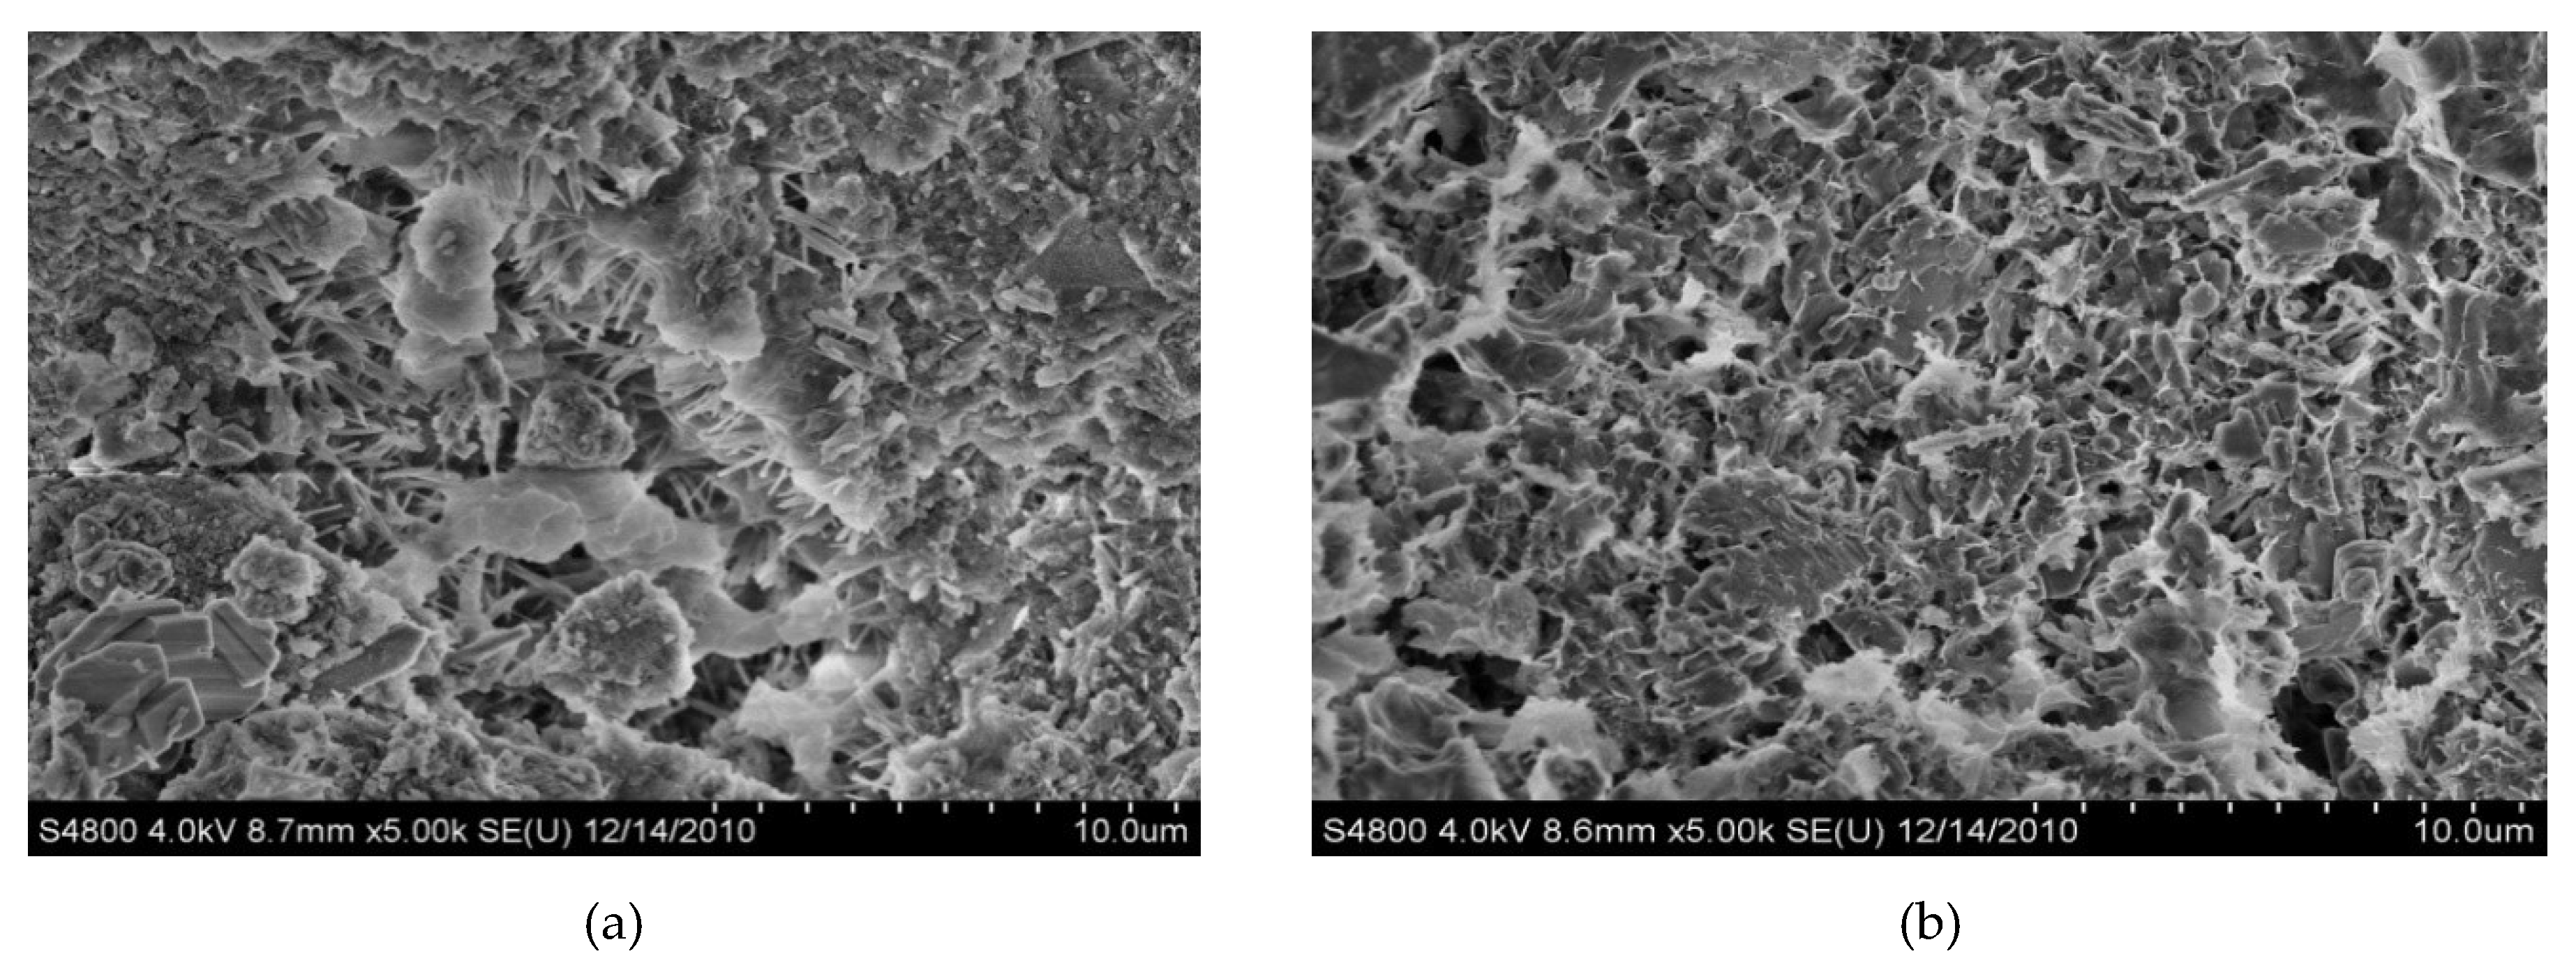
The SEM measurement results of the sample hydration products are shown in
Figure 7 Corresponding to the results of the XRD measurements, the hydration products are mainly needle-like ettringite and pore-filling C-S-H gel in the ettringite. With the extension of the hydration time, hydration continues and an increasing amount of hydration products are produced, making the internal structure of the slurry dense.
At 3 days,
Figure 7a shows that after DGSC hydration, a large amount of sheet-like and needle-like substances was produced. According to the morphological characteristics of the hydration product, this hexagonal plate-like crystal can be confirmed as Ca(OH)
2. An analysis of the structure in the figure suggests that a large number of acicular, fibrous, coarse acicular and rod-like hydration products are produced in the paste sample block. In general, the needle-like or fibrous C-S-H gels are at tapulgite, having thick needles or rods with straight ends, no bifurcation and uniform thickness.
At 28 days,
Figure 7b shows that as the time increases, the fibrous hydration products increase significantly and interdigitate and the lamellar and flaky crystal surfaces are mostly covered by these hydration products.
A comprehensive macroscopic XRD and microscopic SEM analysis shows that in the DGSC system, after the mixture is mixed with water, calcium hydroxide and other mineral phases in the steel slag are successively dissolved under the action of the activator.
The alkalinity of the system rapidly increases and the calcium-rich furnace slag begins to dissolve. In the furnace slag, active calcium oxide, alumina, silica and other components are dissolved and the sulfate in the desulfurized gypsum forms ettringite crystals.
The late increase in strength of the cementitious materials mainly depends on the formation of a large number of C-S-H gels. During hydration, C-S-H gel are produced and fill the pores of the needle-like ettringite so that the slurry is continuously densified and the remaining desulfurized gypsum is finally encapsulated by the hydration product, which functions as micro-aggregate filling. The desulfurized gypsum generates a large amount of needle-like ettringite on the surface of the hydration process, greatly improving the affinity of the desulfurized gypsum and the hydration product interface, tightly binding the desulfurized gypsum and the hydration product.


