Preparation and Characteristics of Ethylene Bis(Stearamide)-Based Graphene-Modified Asphalt


Abstract
1. Introduction
2. Experimental Method and Performance Evaluation
2.1. Materials
2.2. Equipment and Characterization
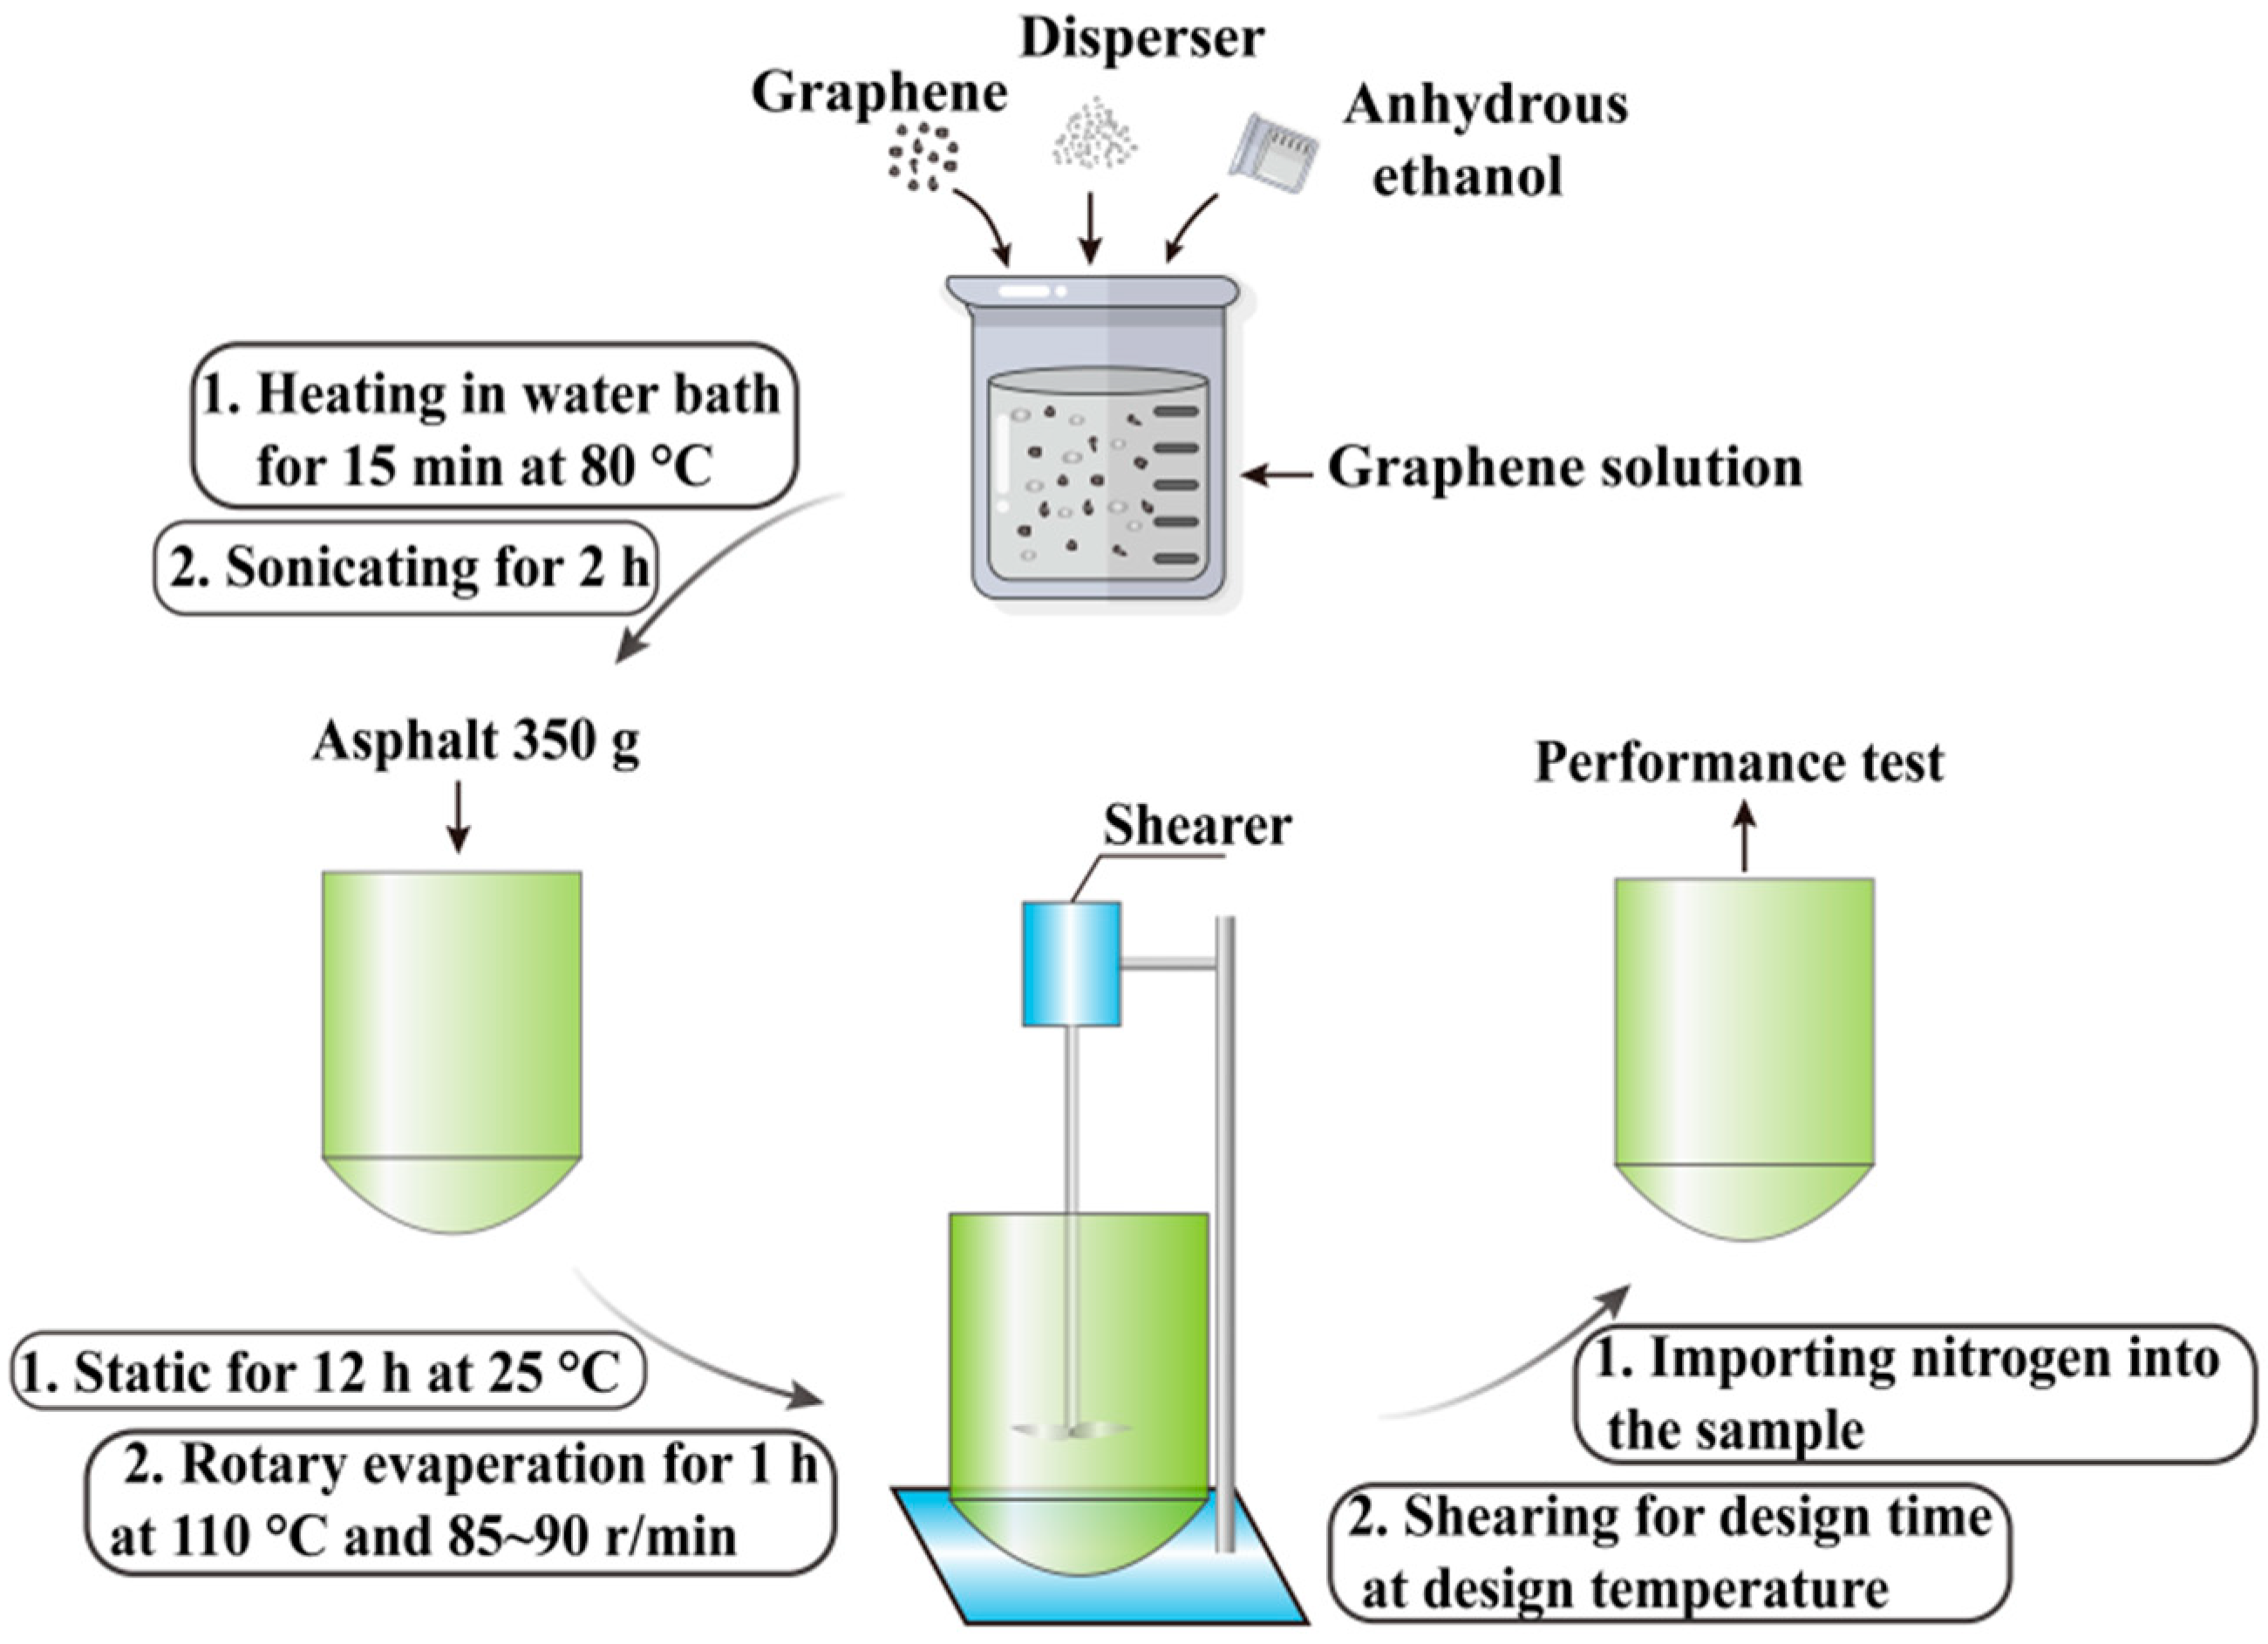
2.3. GMA Preparation
2.4. Experimental Design
2.5. Performance Evaluation and Microanalysis
3. Results and Discussion
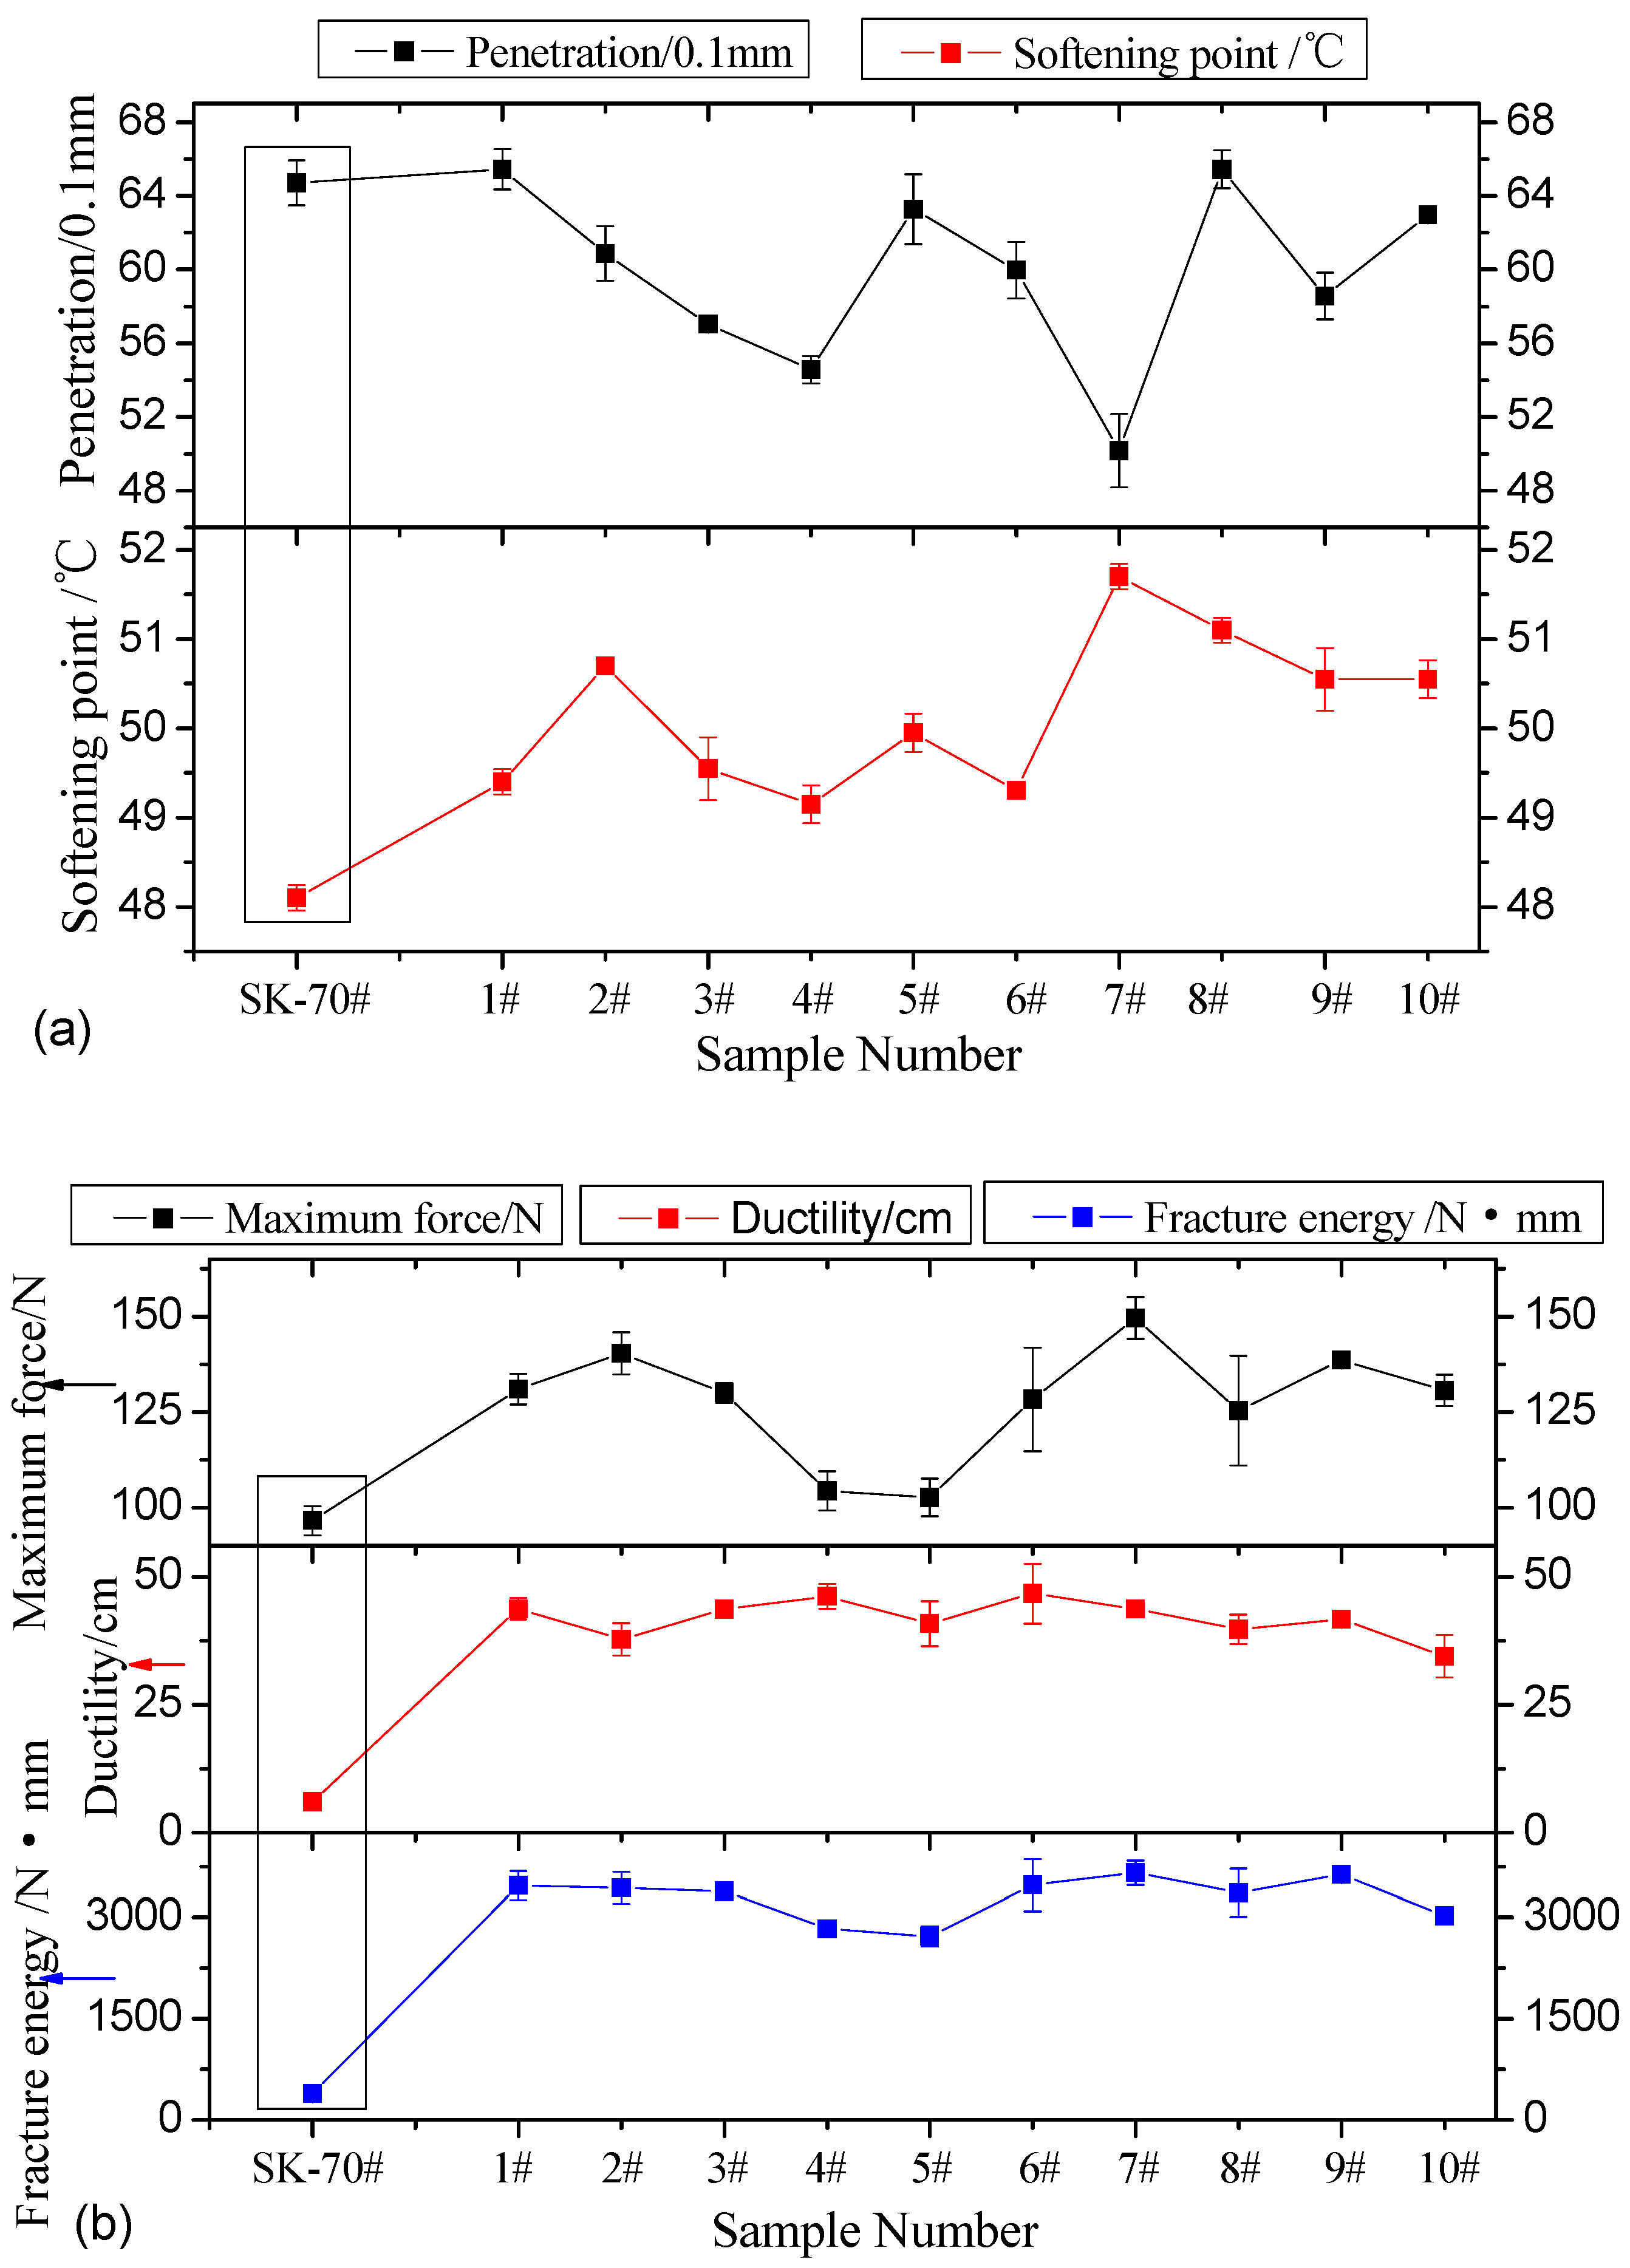
3.1. Indices Data Analysis
3.2. DSR Test
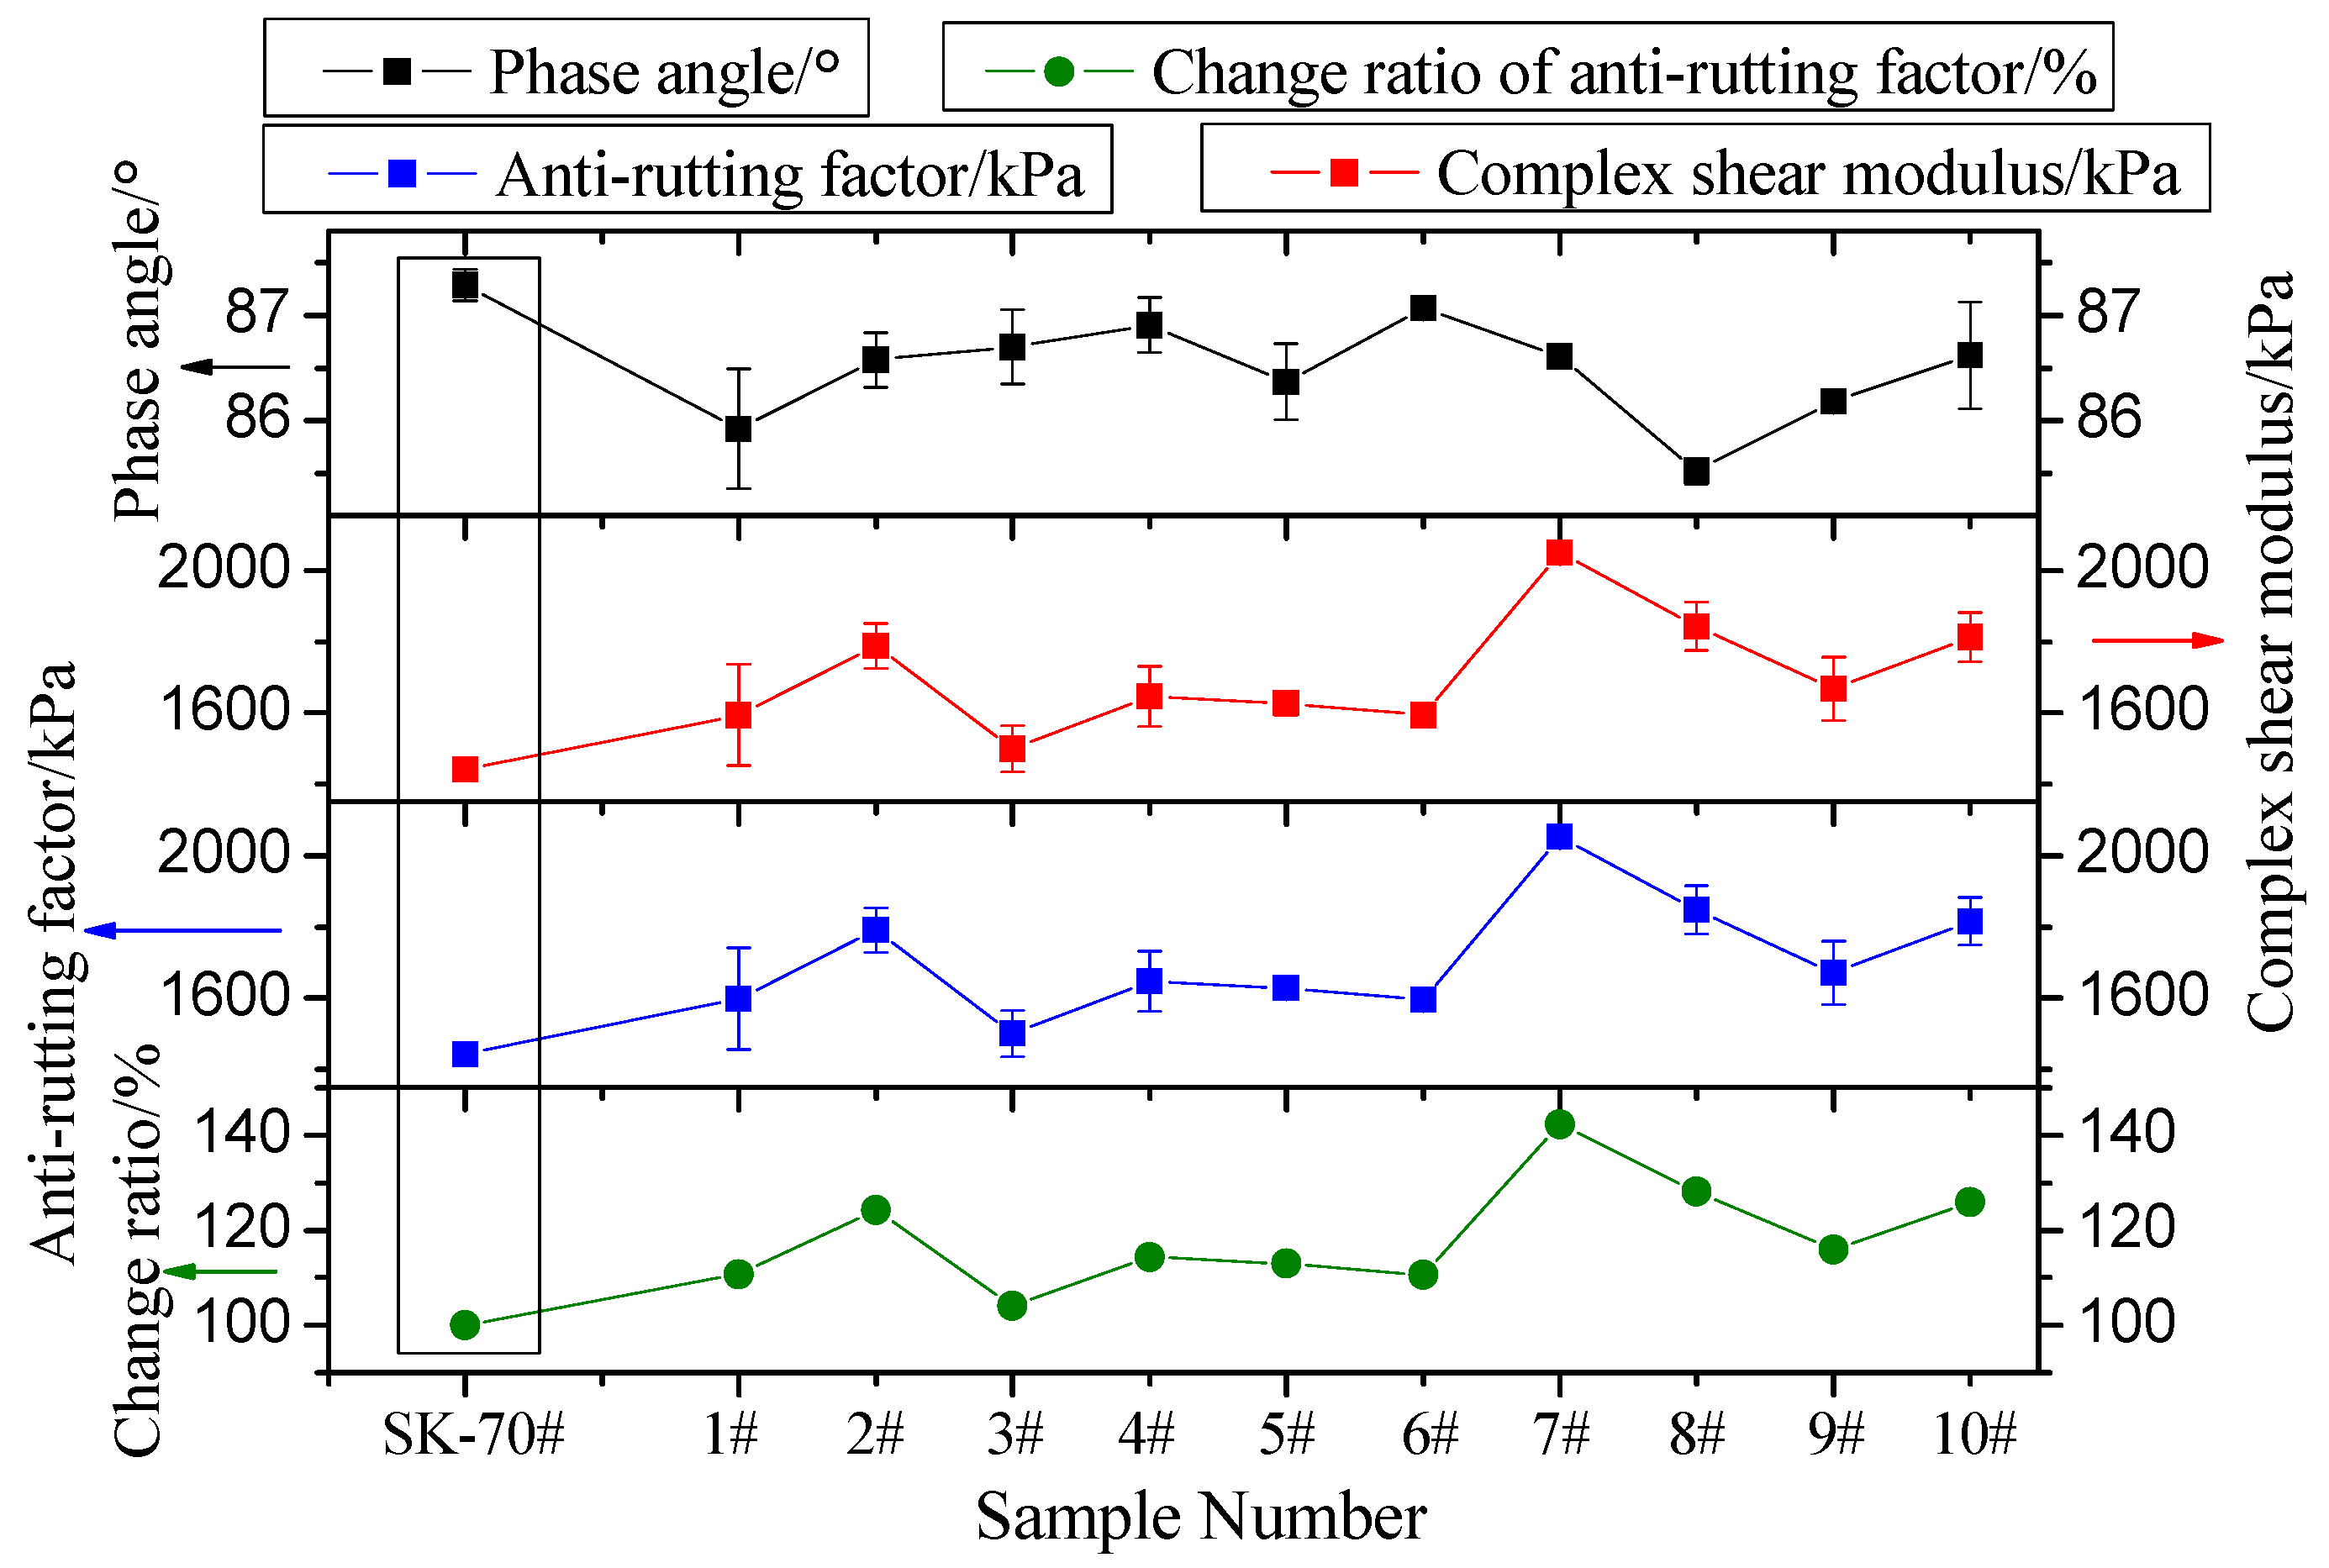
3.2.1. SHRP-PG Test
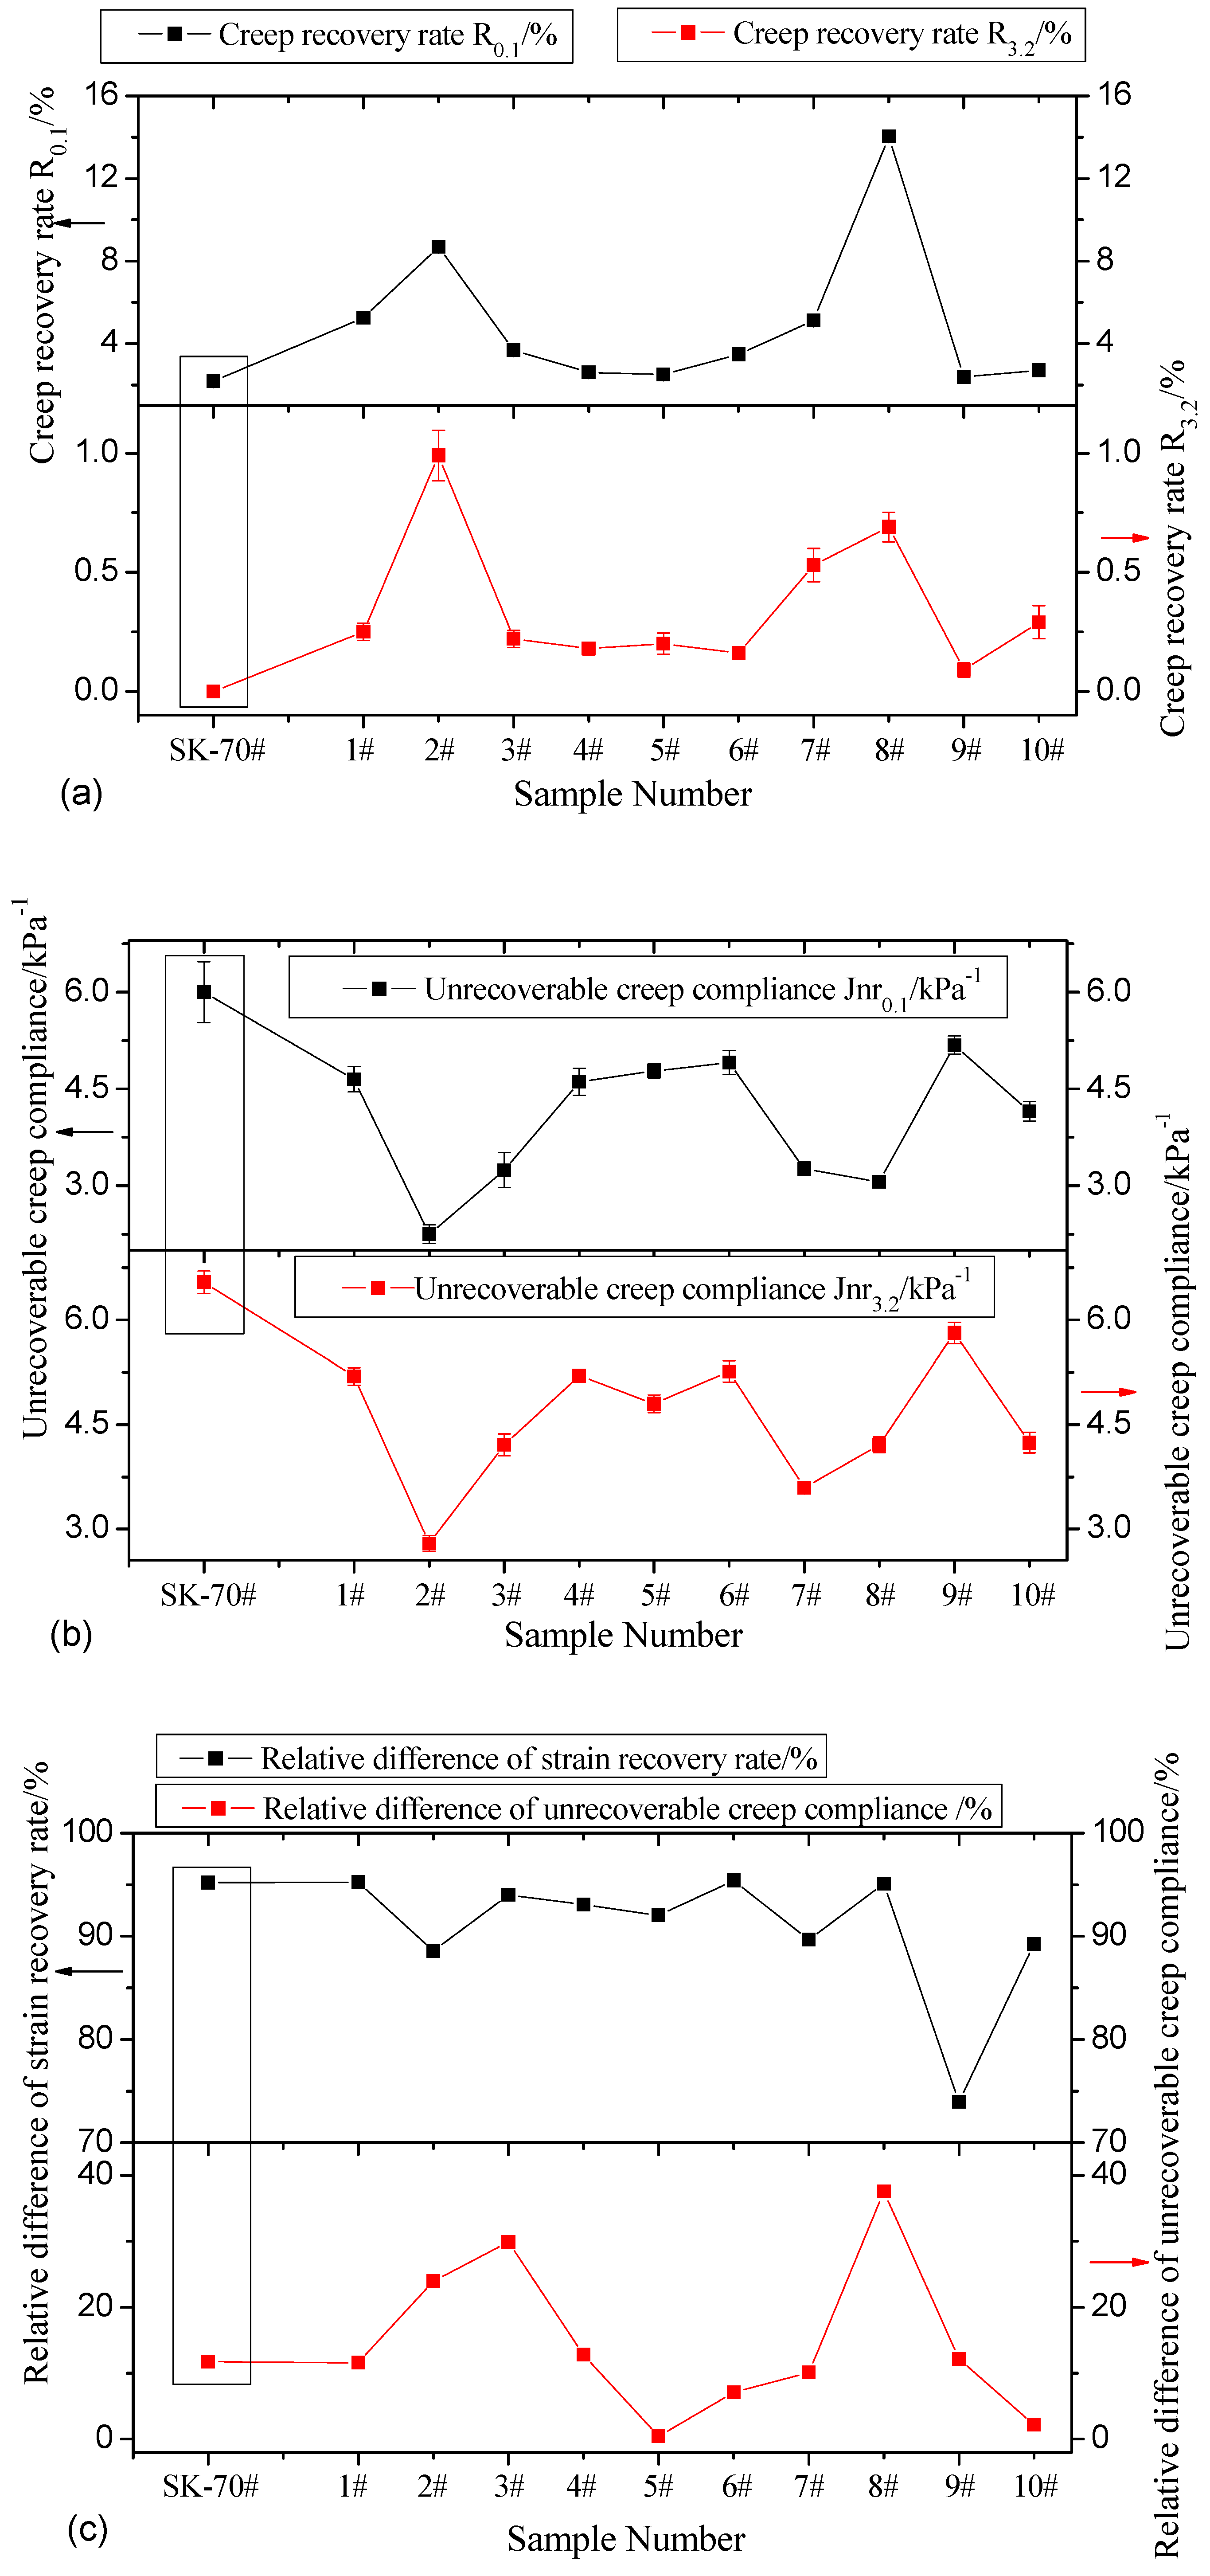
3.2.2. Multistress Creep Recovery (MSCR) Test
3.3. Determining the Optimum Mixing Ratio
3.4. Textural Characterization
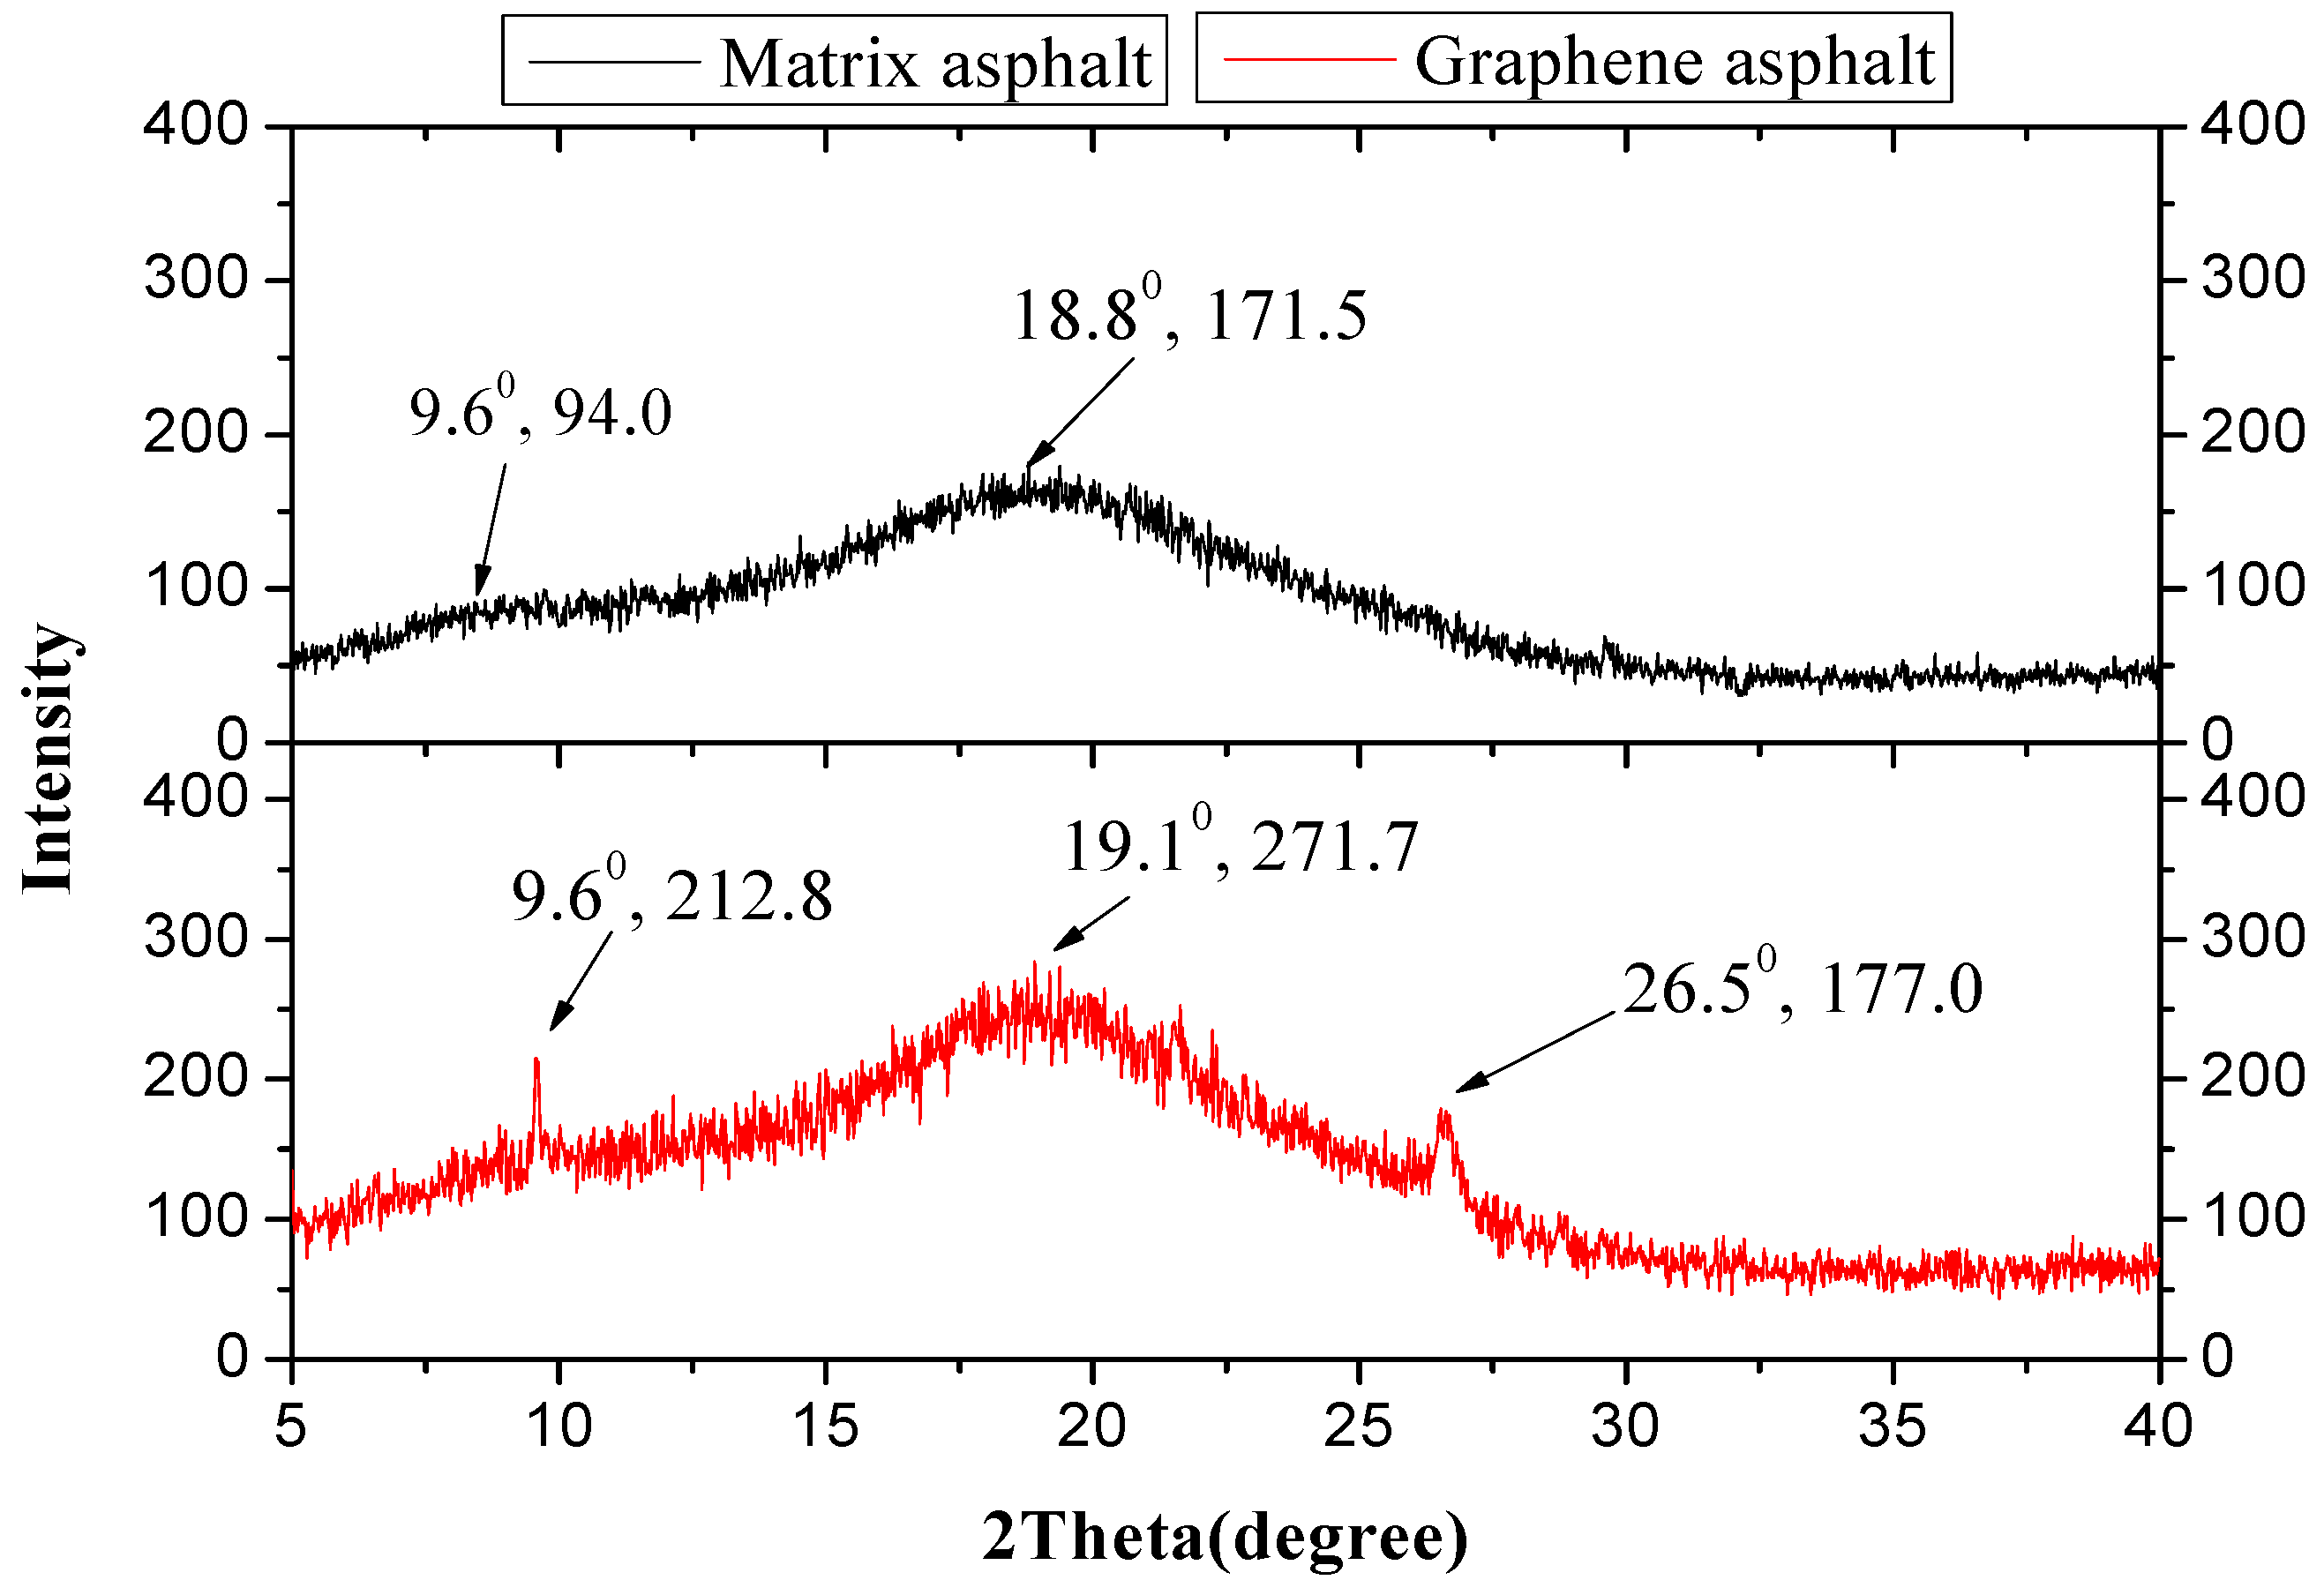
3.4.1. XRD Test
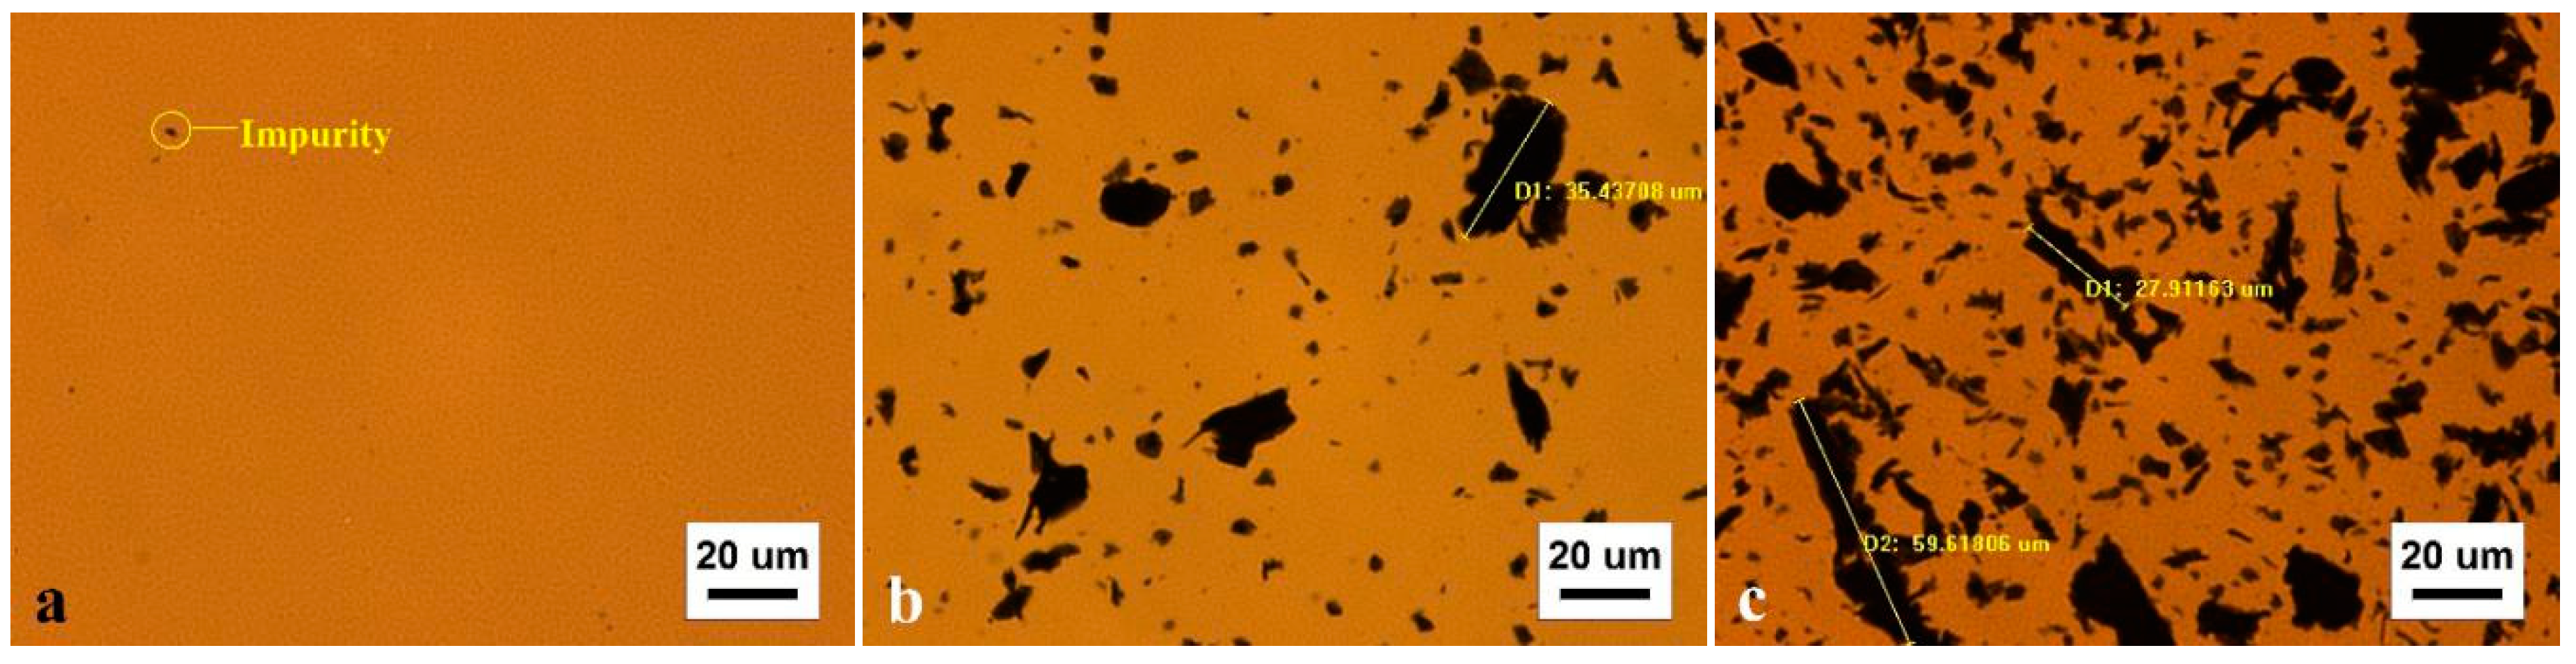
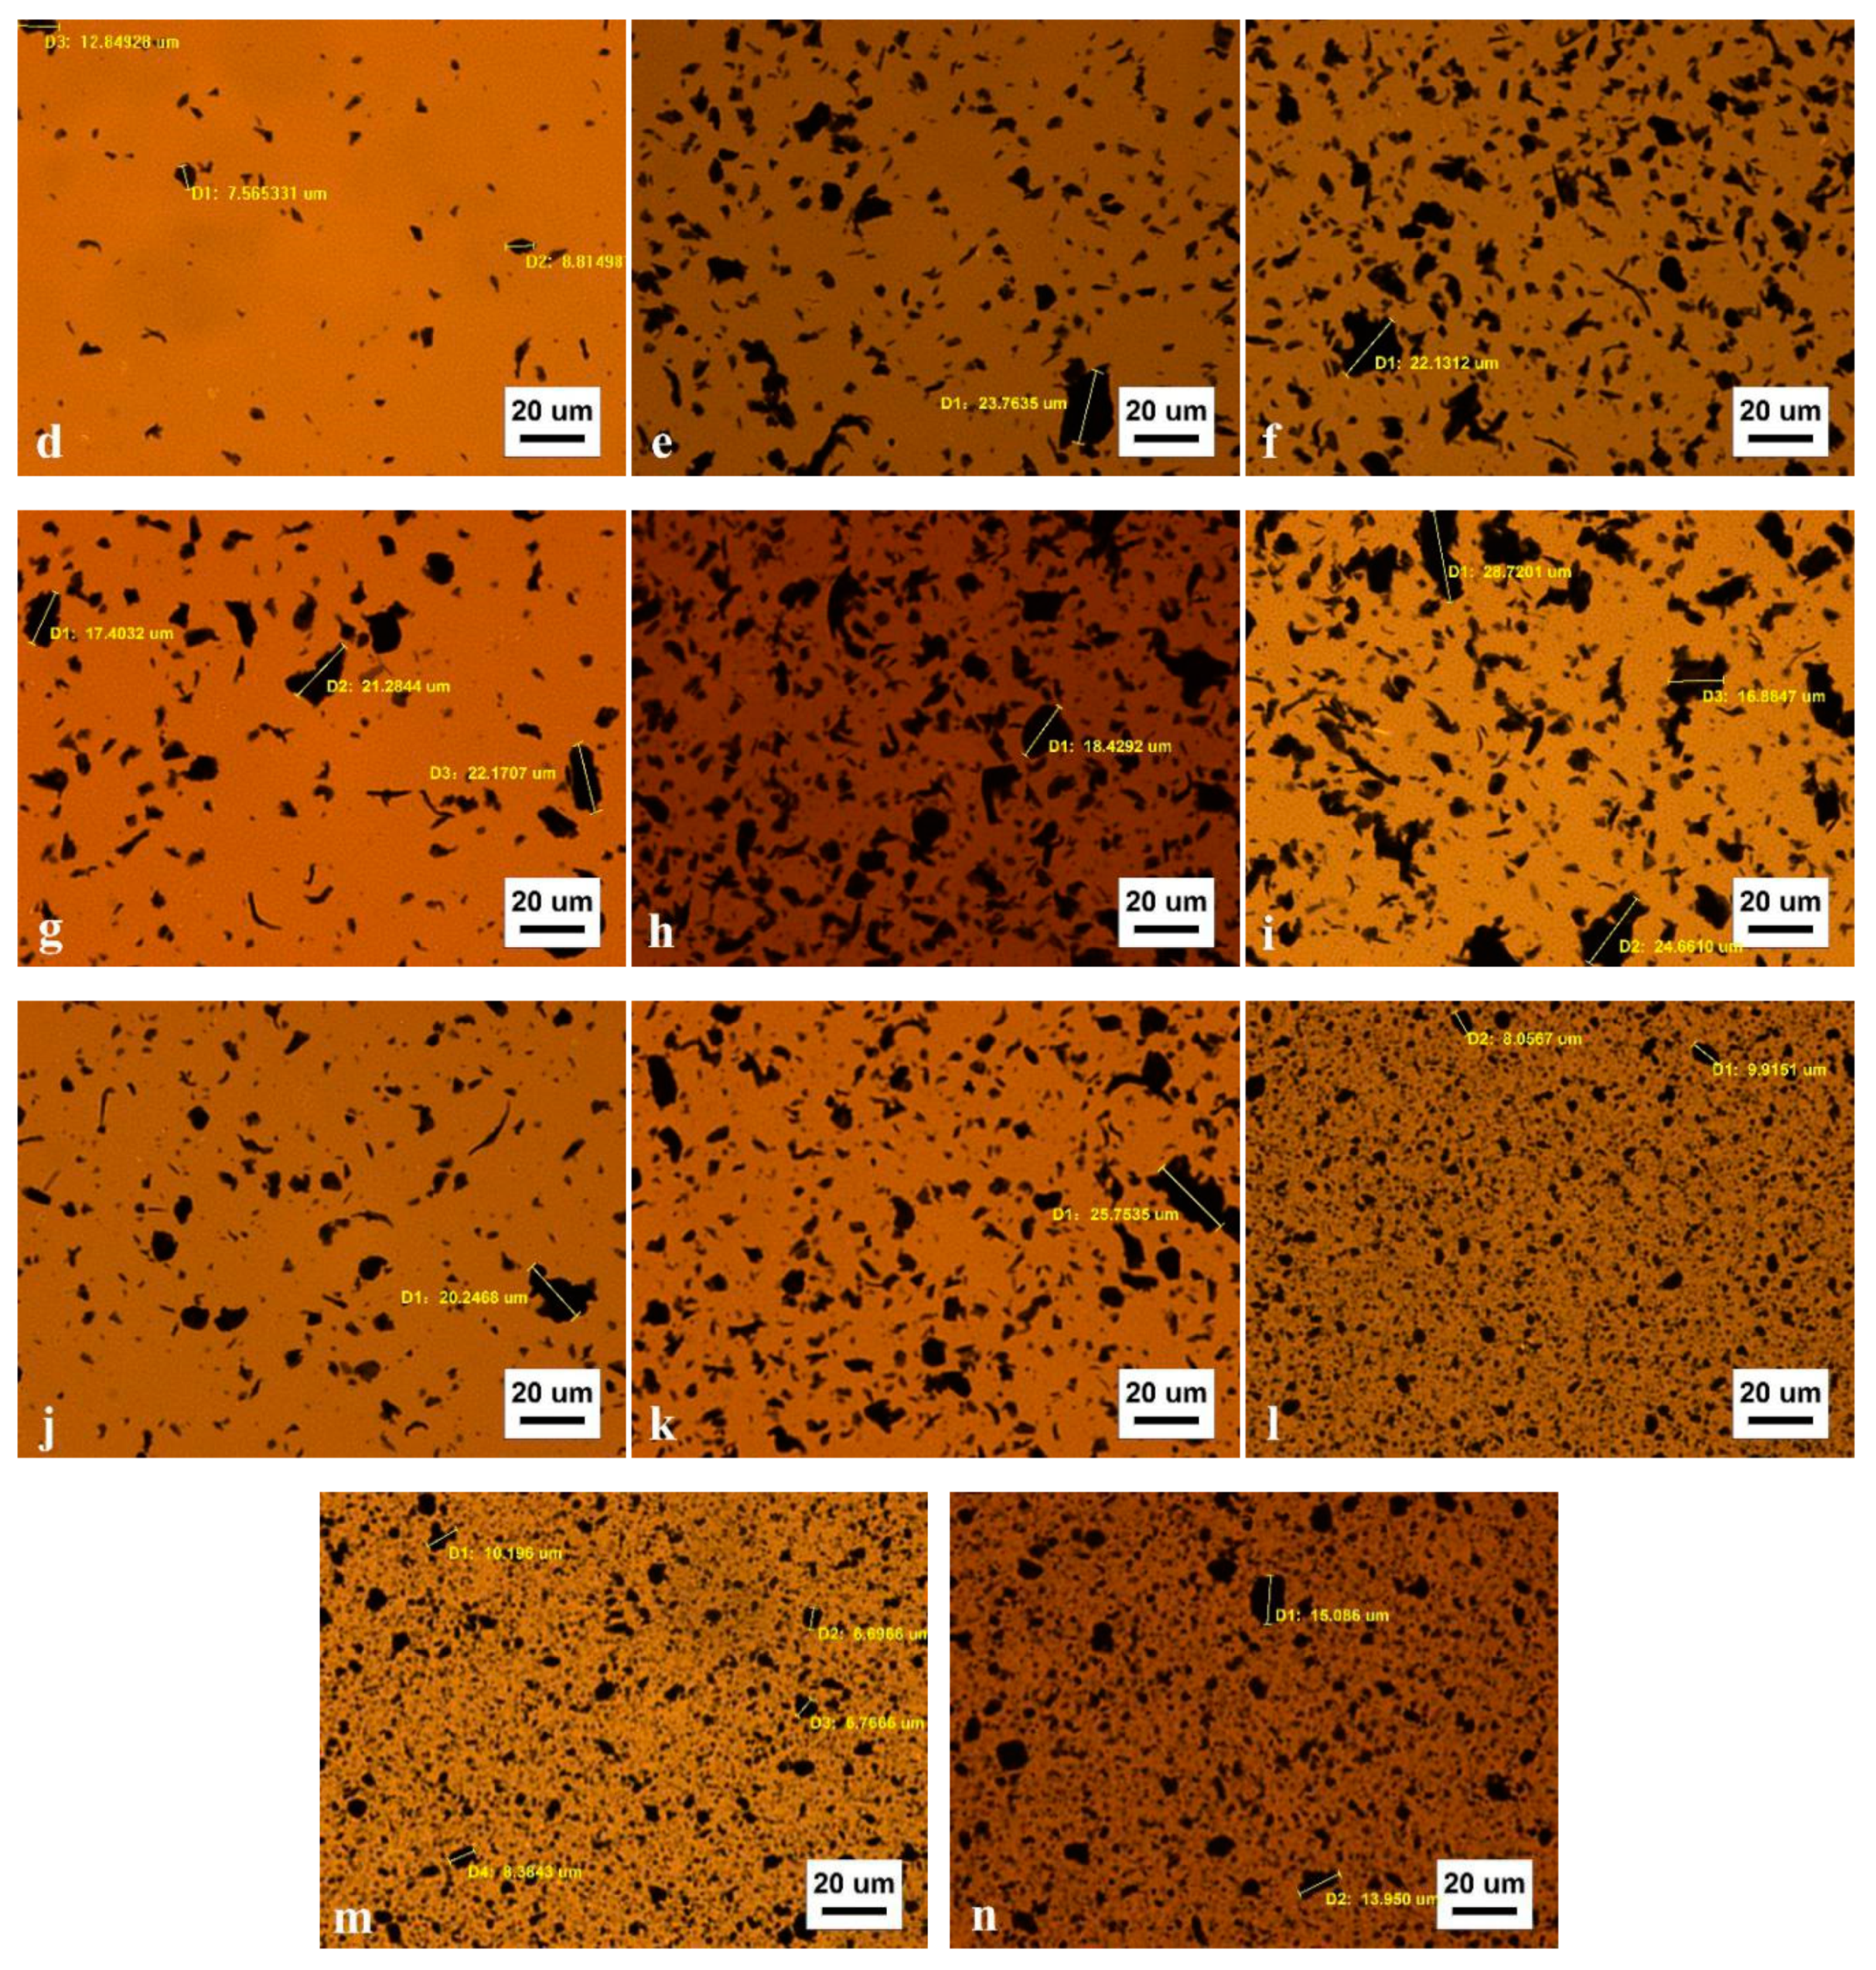
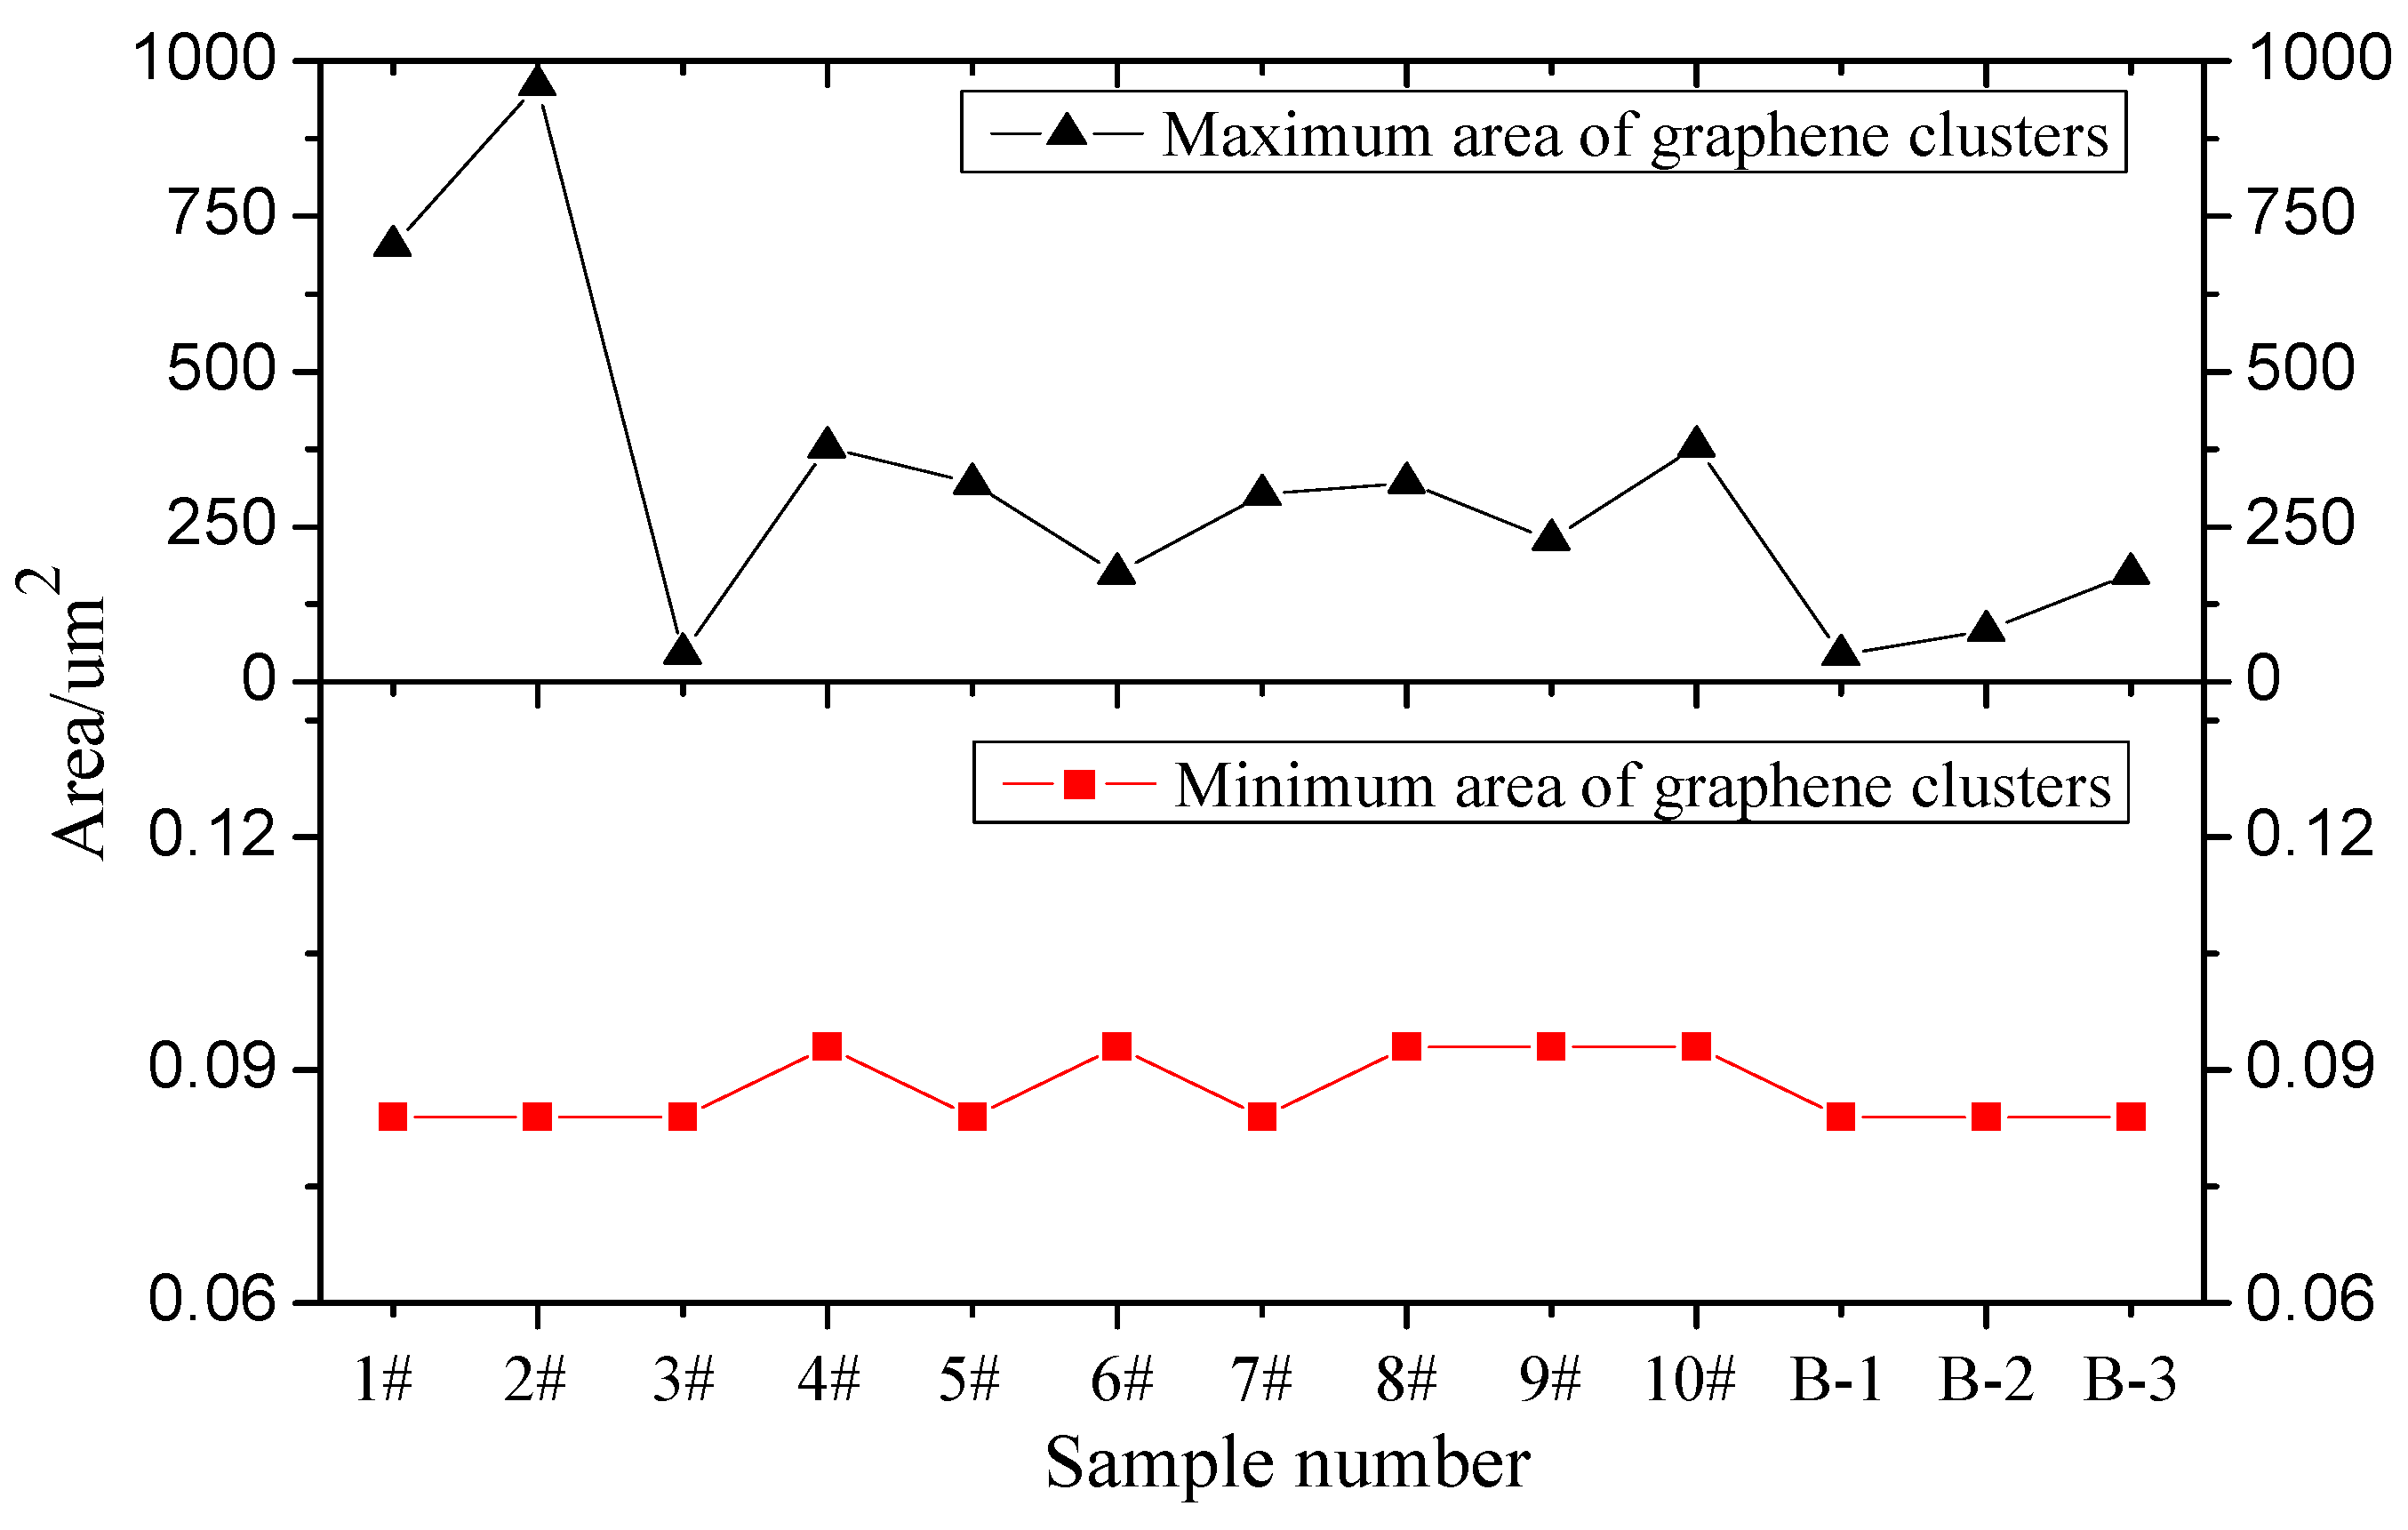
3.4.2. Microscope Test
4. Conclusions
- (1)
- A method for calculating the optimal parameters of GMA and a process to prepare GMA were proposed. For EBS-based GMA, the optimal parameters are as follows: the graphene proportion is 20‰; the EBS proportion is 1%; the high-speed shear rate is 6000 r.p.m.; the shear time is 180 min; the shear temperature is 140 °C. The prepared GMA had a significantly improved softening point, low temperature fracture energy, antirutting factor, and creep recovery rate.
- (2)
- The prepared GMA had a softening point of 58.6 °C, a low-temperature ductility force of 168.0 N, low-temperature ductility of 42.54 mm, low-temperature fracture energy of 2099 N·mm, and a 0.1 kPa creep recovery rate of 20.24%. Compared with SK-70# matrix asphalt, the performance of GMA was significantly improved.
- (3)
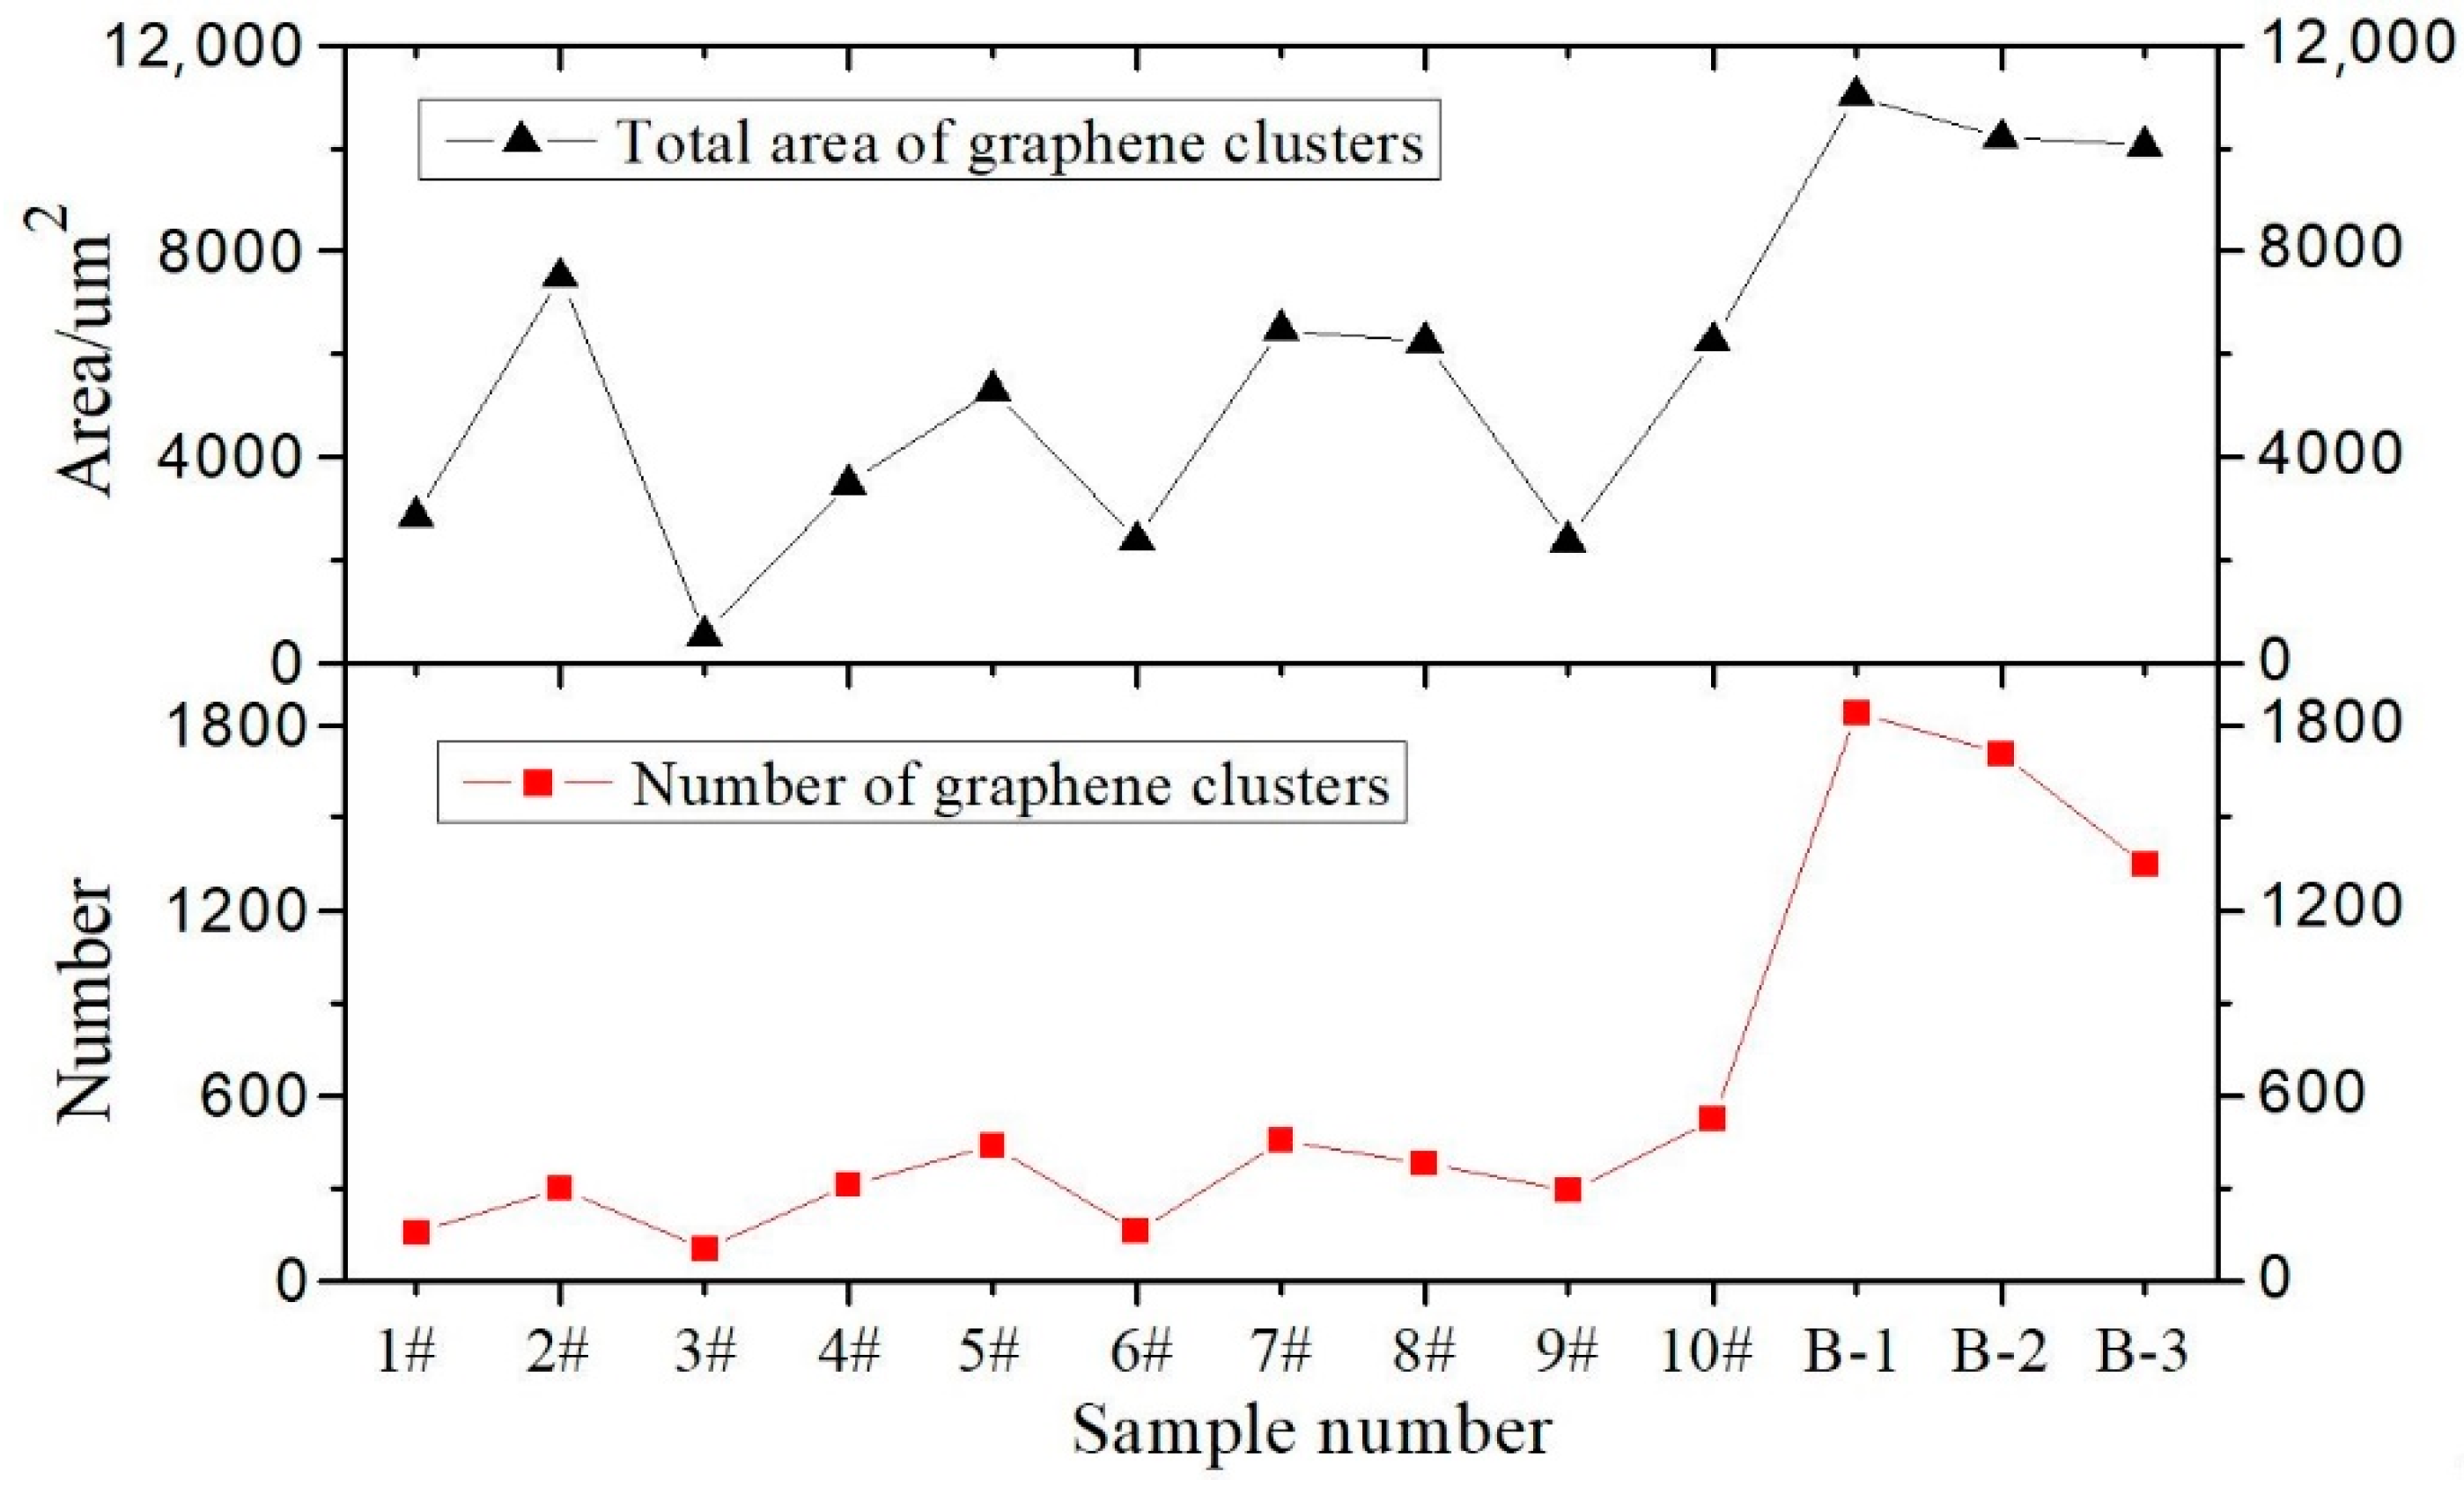
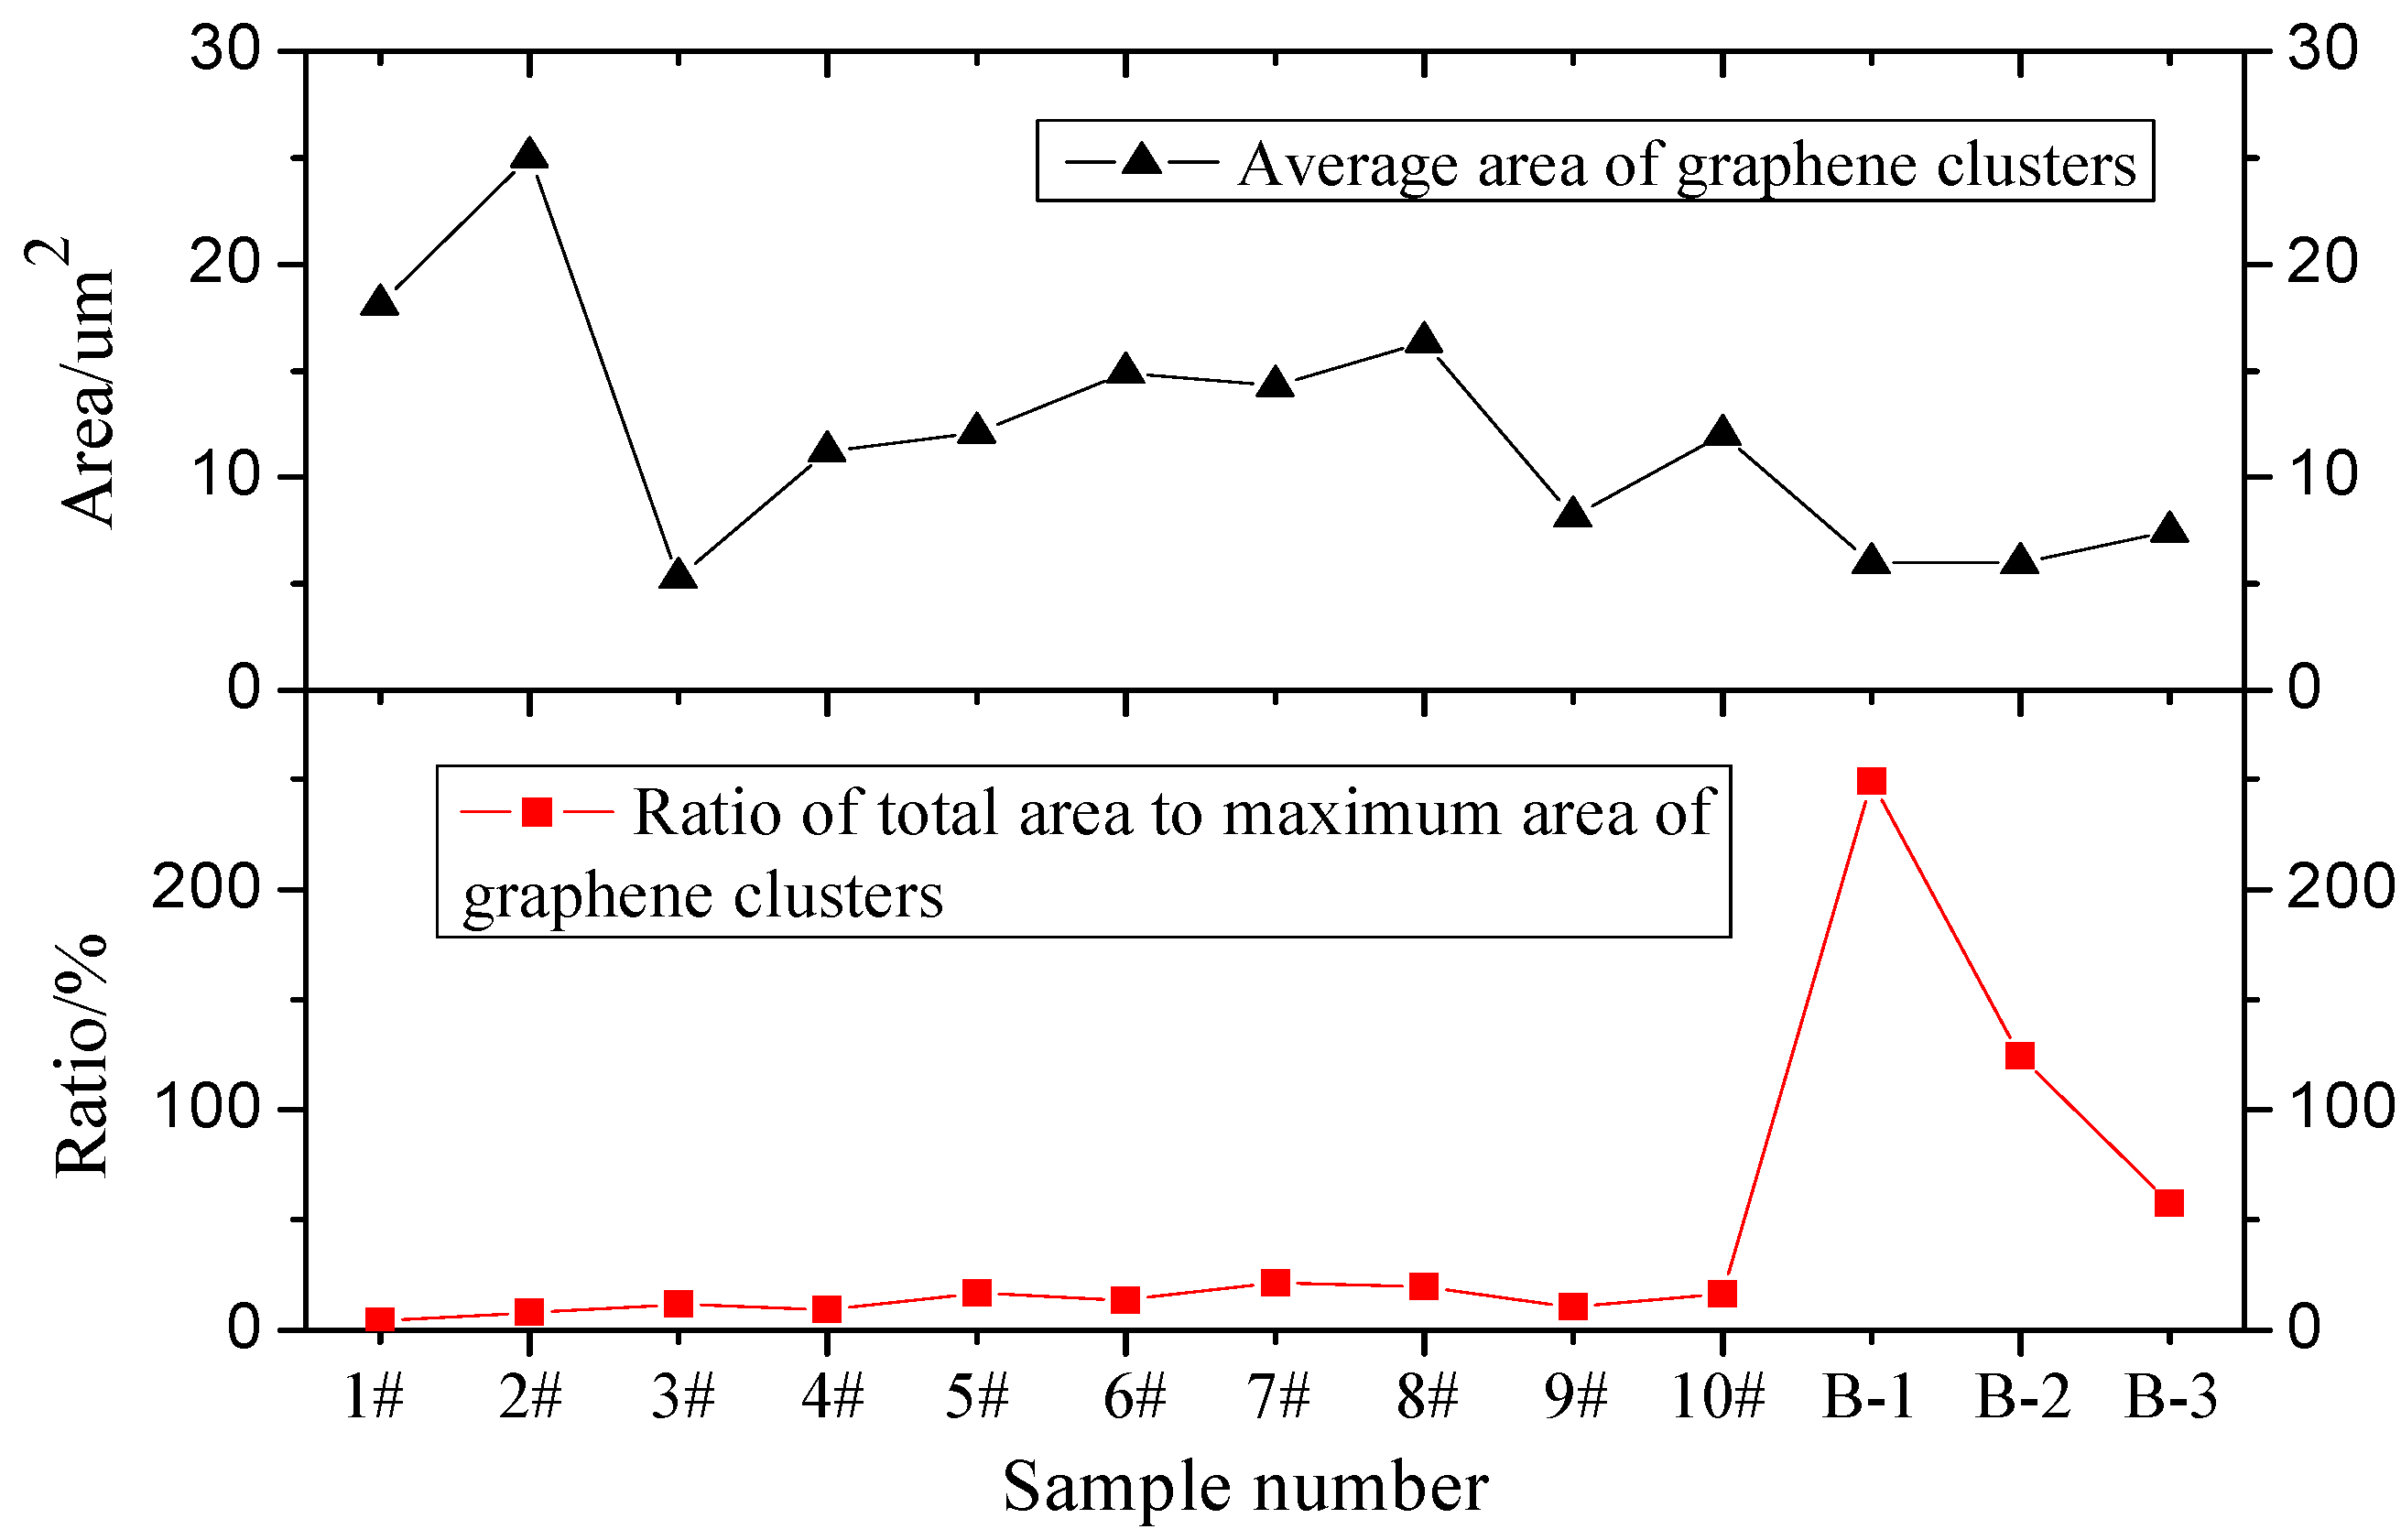
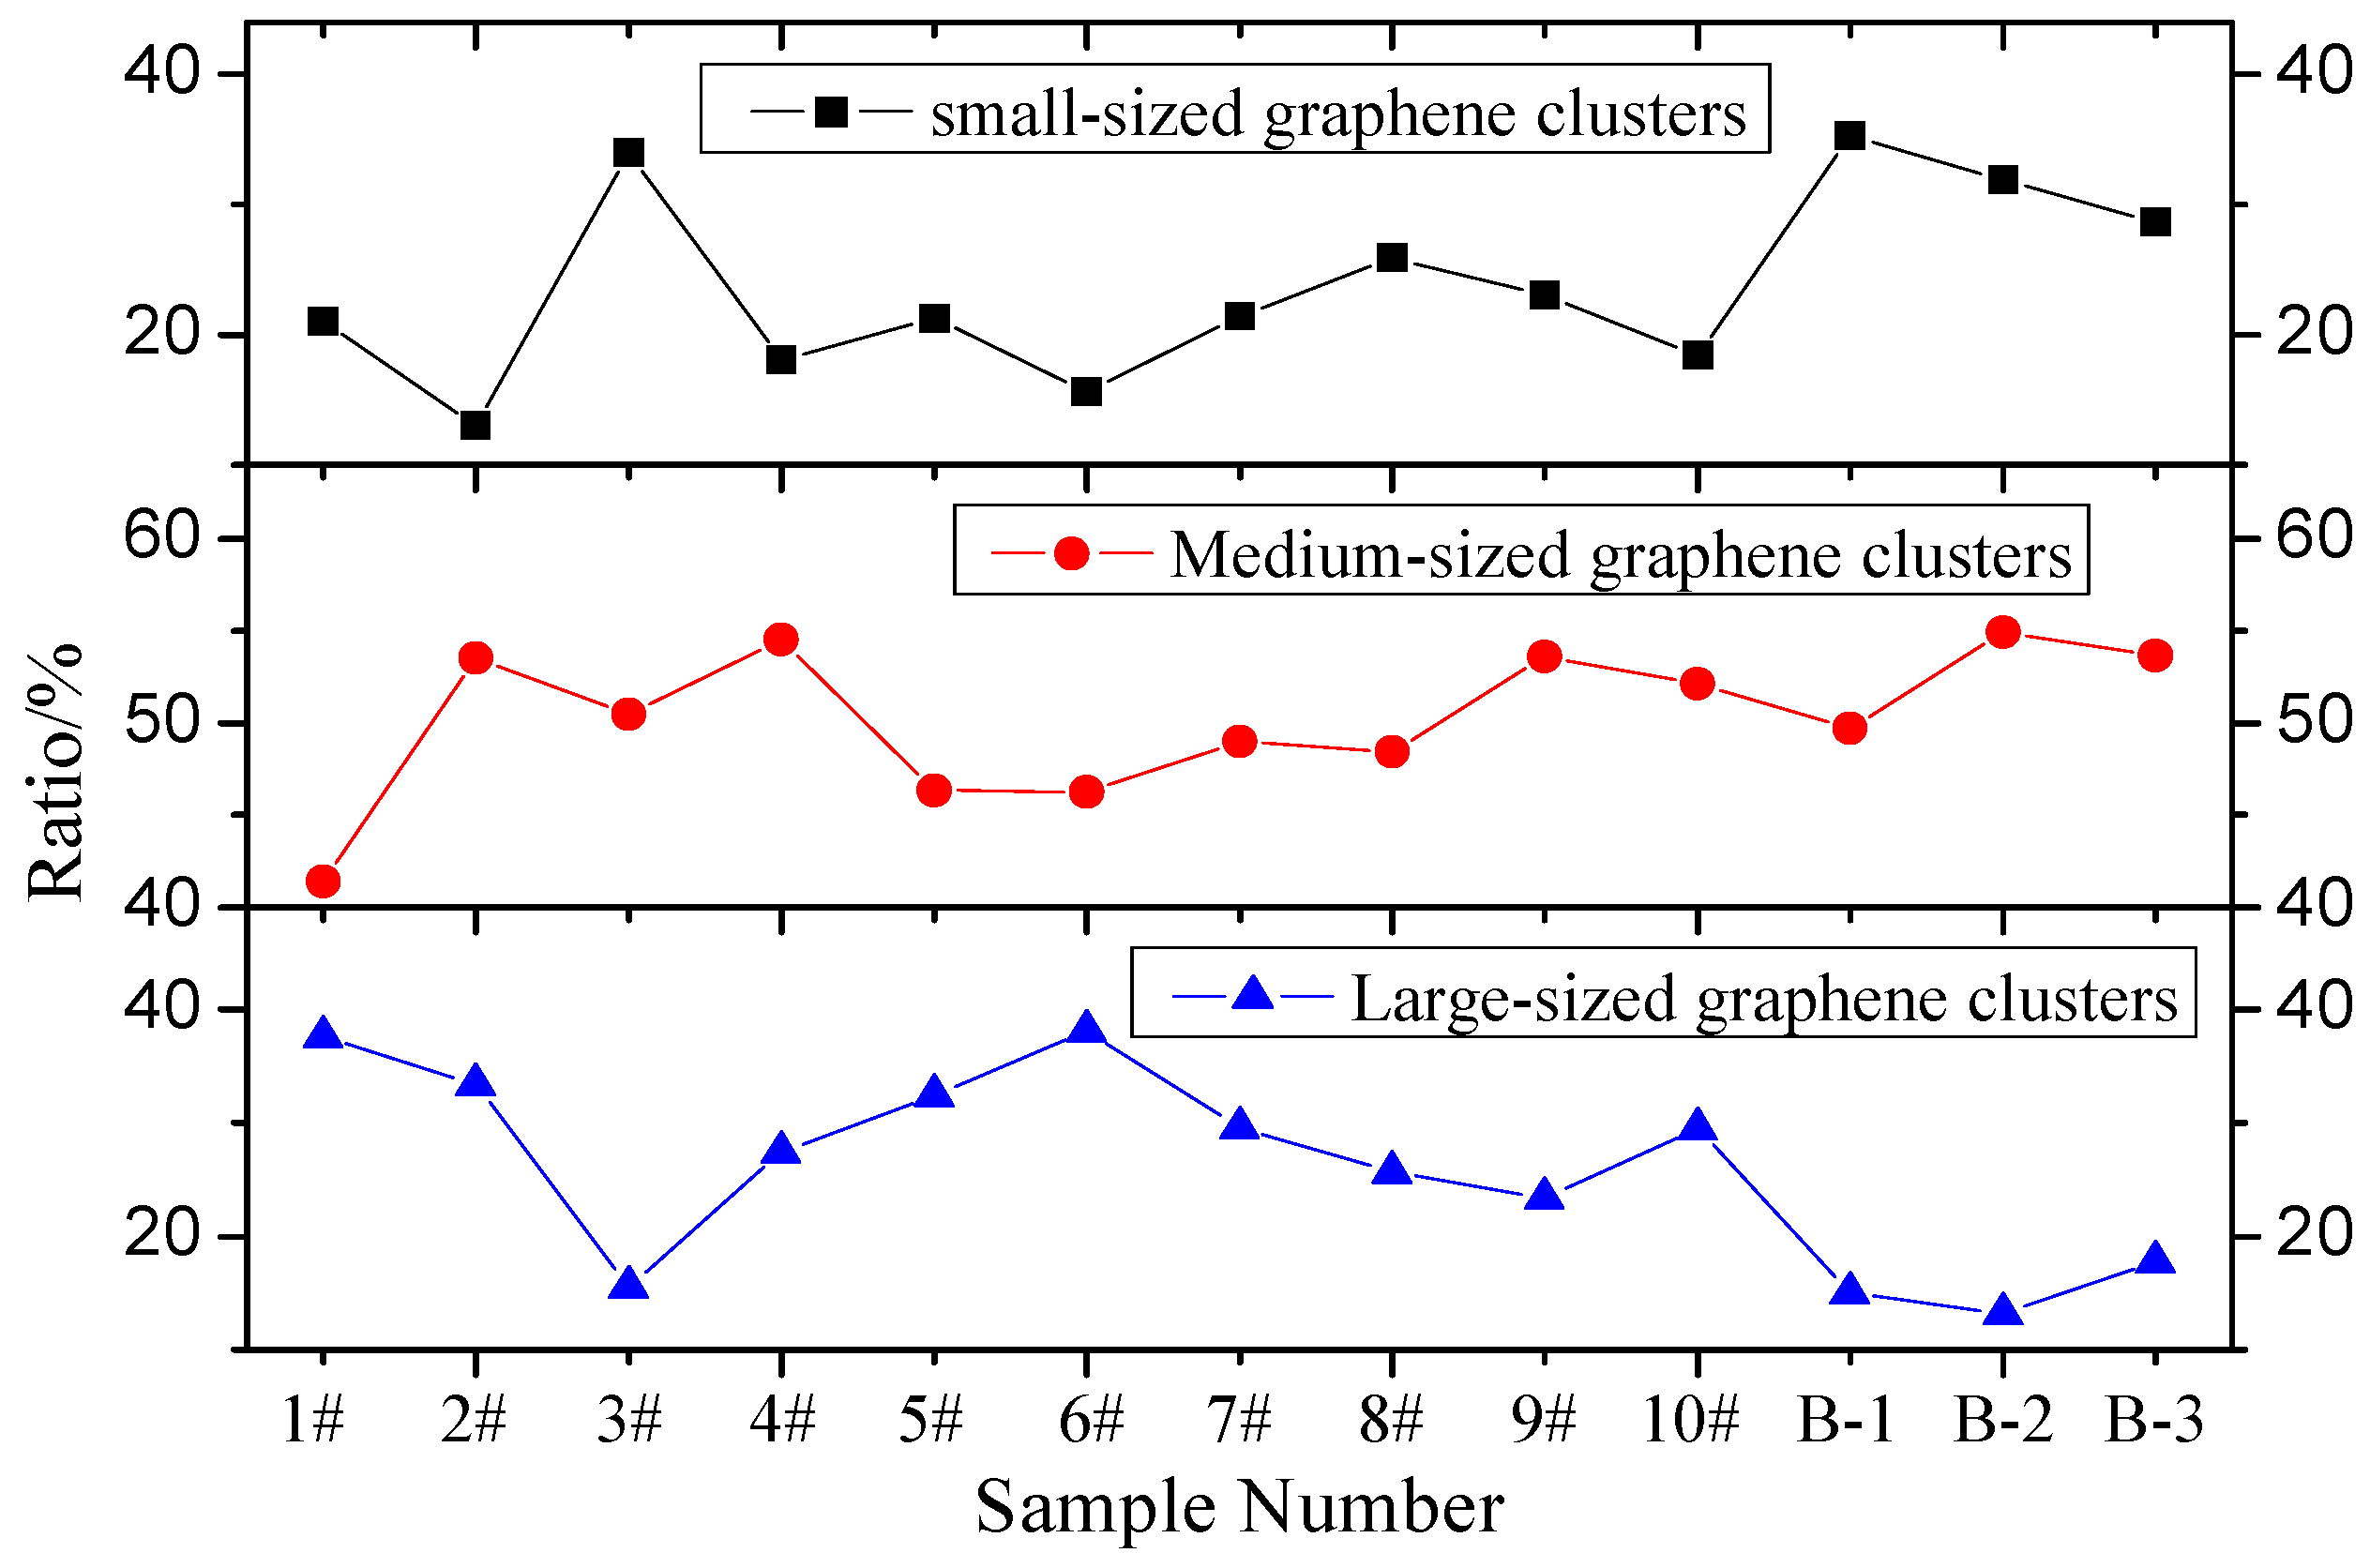
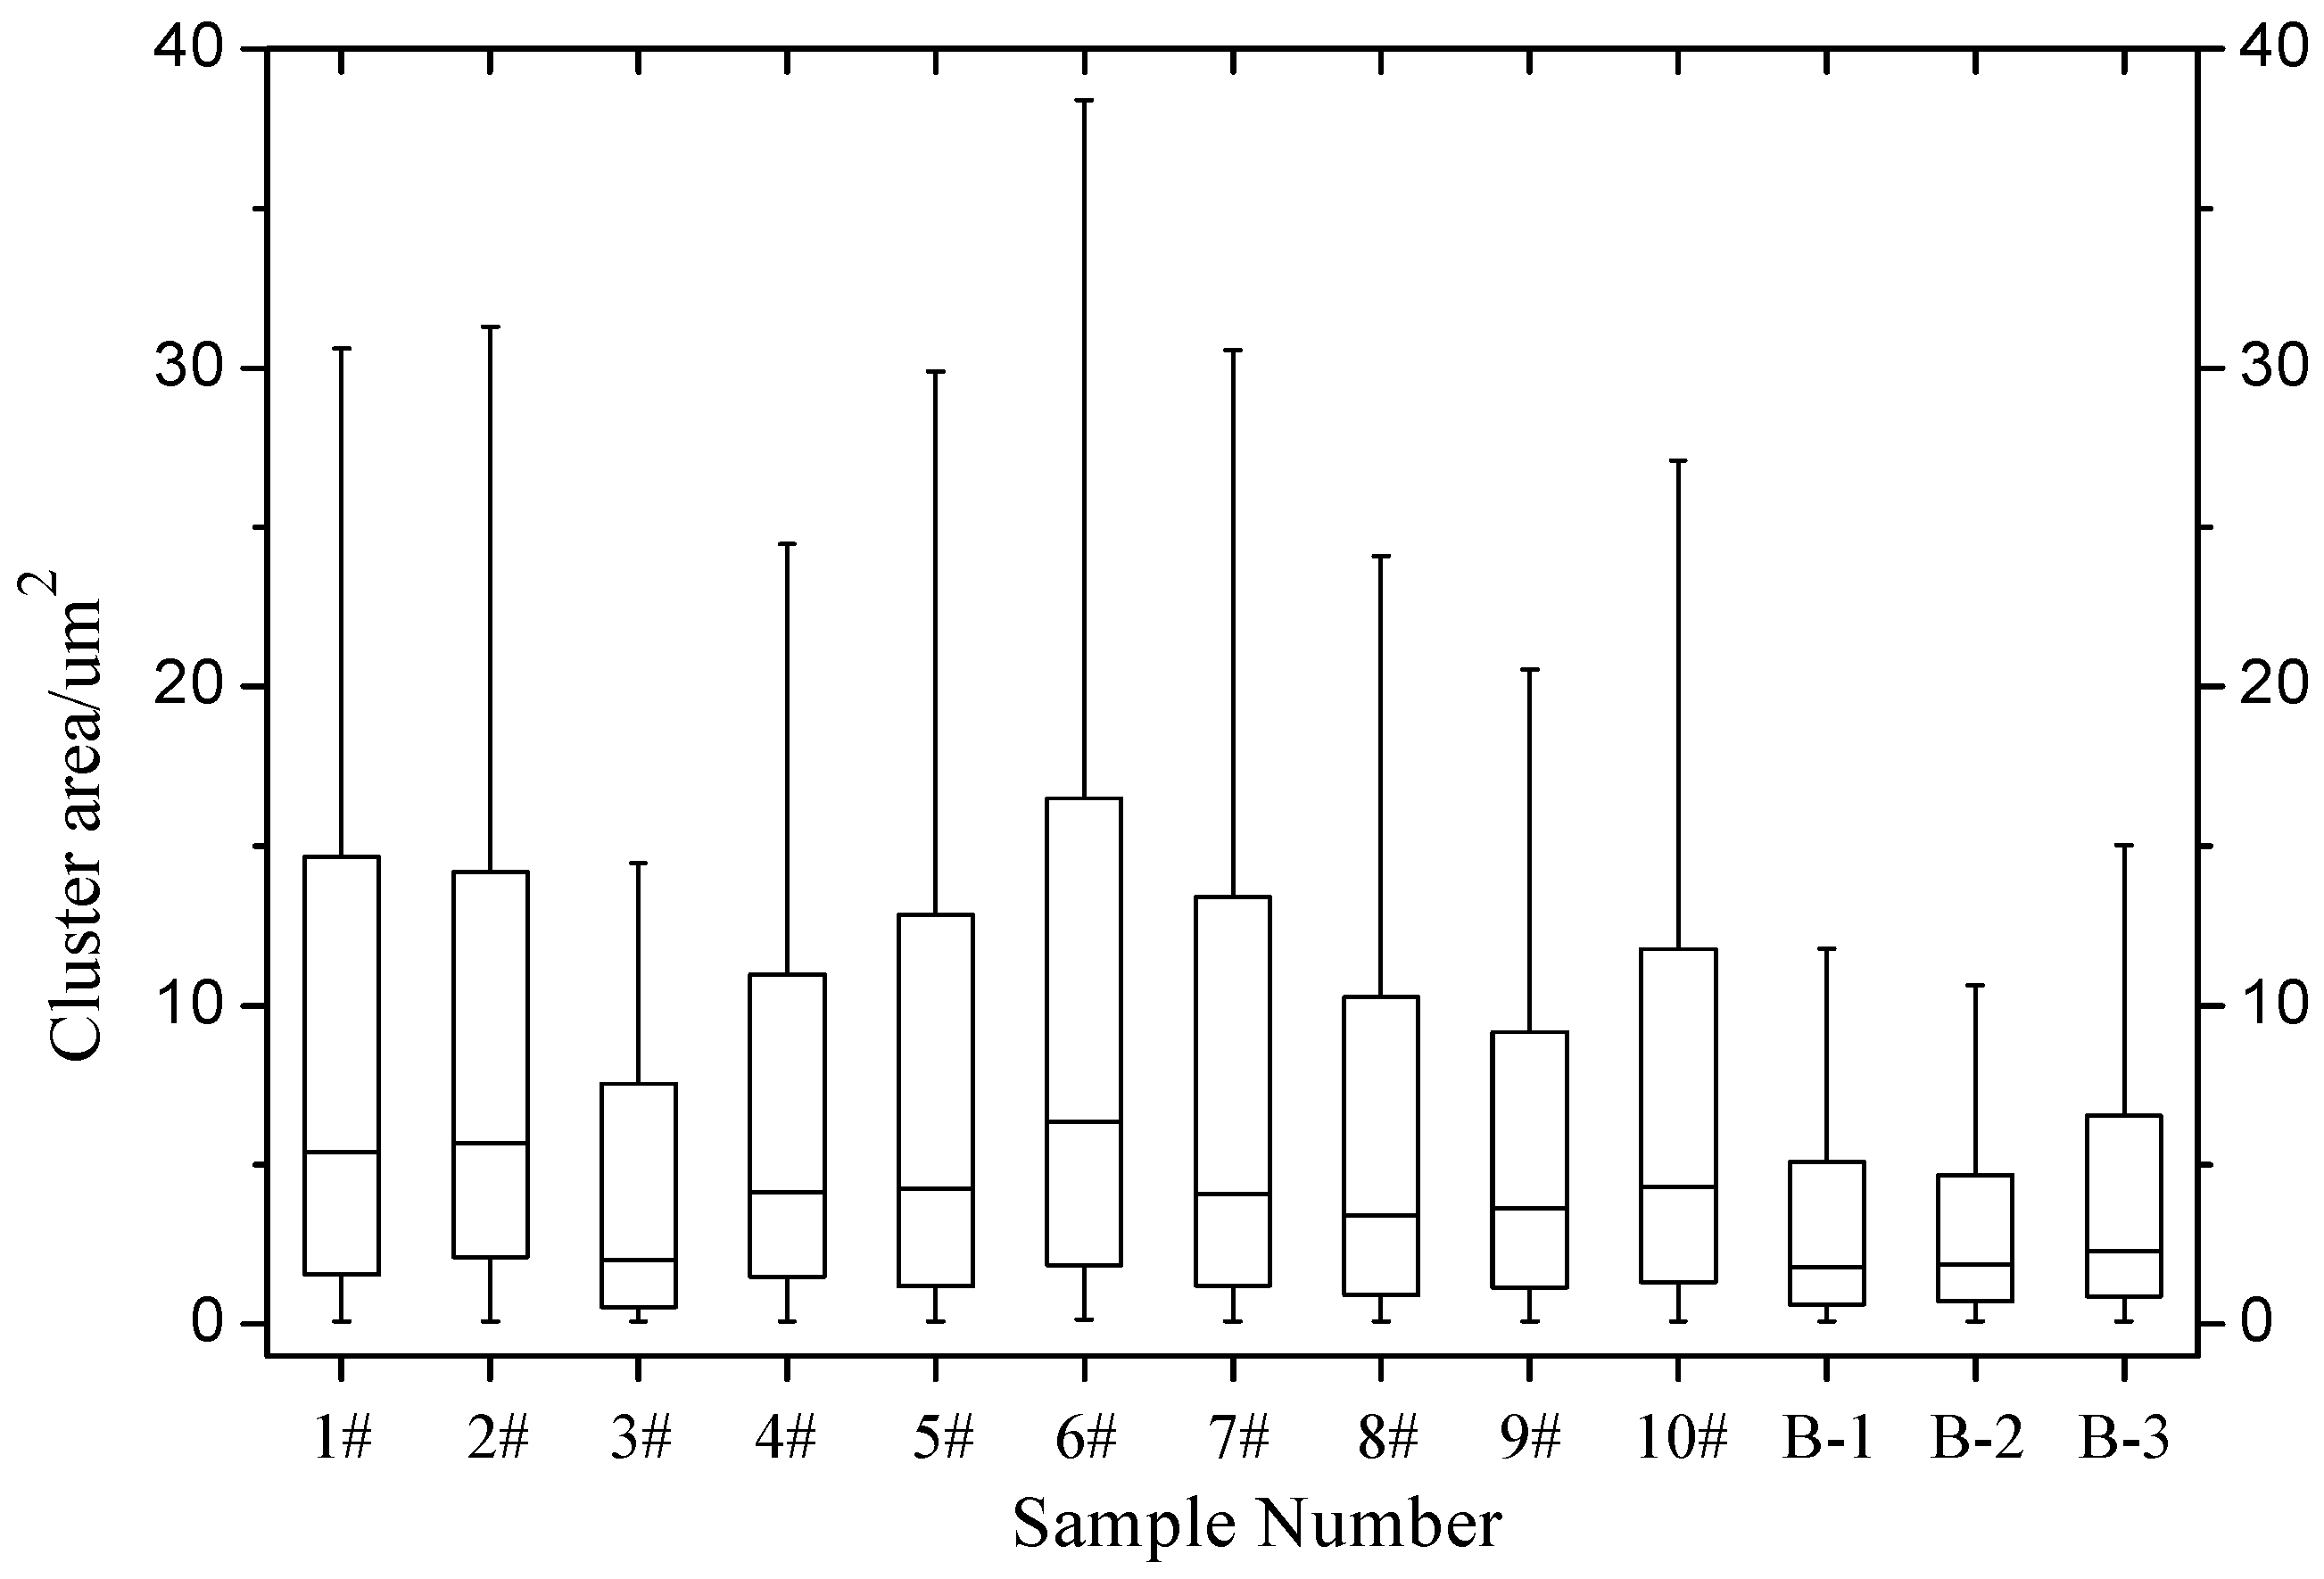
- Graphene can exist in an asphalt medium in a stable form, and some graphene in asphalt is in the form of clusters. When the graphene and dispersant composition is close to the optimal ratio, the dispersant changes the form of graphene in asphalt from irregular clusters to regular clusters and from distinct, large clusters to indistinct, small clusters. When the graphene distribution in asphalt is closer to the ideal situation, graphene asphalt has improved high- and low-temperature performance. When the dispersant cannot distribute graphene evenly in asphalt, the majority of graphene clusters in asphalt are medium-sized.
- (4)
- Although EBS is used in this study, graphene is still not distributed evenly in asphalt in the form of flakes but is in the form of small clusters. Methods to ideally disperse or intercalate graphene in asphalt to substantially improve asphalt performance require further investigation.
Author Contributions
Funding
Acknowledgments
Conflicts of Interest
References
- Geim, A.K. Graphene: Status and prospects. Science 2009, 324, 1530–1534. [Google Scholar] [CrossRef] [PubMed]
- Wu, J.; Pisula, W.; Müllen, K. Graphenes as potential material for electronics. Chem. Rev. 2007, 107, 718–747. [Google Scholar] [CrossRef] [PubMed]
- Rao, C.N.R.; Sood, A.K.; Voggu, R.; Subrahmanyam, K.S. Some novel attributes of graphene. J. Phys. Chem. Lett. 2010, 1, 572–580. [Google Scholar] [CrossRef]
- Zhang, Y.; Tan, Y.W.; Stormer, H.L.; Kim, P. Experimental observation of the quantum Hall effect and Berry’s phase in graphene. Nature 2005, 438, 201–204. [Google Scholar] [CrossRef] [PubMed]
- Bolotin, K.I.; Sikes, K.J.; Jiang, Z.; Klima, M.; Fudenberg, G.; Hone, J.; Kim, P.; Stormer, H.L. Ultrahigh electron mobility in suspended graphene. Solid State Commun. 2008, 146, 351–355. [Google Scholar] [CrossRef]
- Schadler, L.S.; Giannaris, S.C.; Ajayan, P.M. Load transfer in carbon nanotube epoxy composites. Appl. Phys. Lett. 1998, 73, 3842–3844. [Google Scholar] [CrossRef]
- Balandin, A.A.; Ghosh, S.; Bao, W.; Calizo, I.; Teweldebrhan, D.; Miao, F.; Lau, C.N. Superior thermal conductivity of single-layer graphene. Nano Lett. 2008, 8, 902–907. [Google Scholar] [CrossRef] [PubMed]
- Chae, H.K.; Siberio-Pérez, D.Y.; Kim, J.; Go, Y.; Eddaoudi, M.; Matzger, A.J.; O’Keeffe, M.; Yaghi, O.M. A route to high surface area, porosity and inclusion of large molecules in crystals. Nature 2004, 427, 523. [Google Scholar] [CrossRef] [PubMed]
- Lee, C.; Wei, X.; Kysar, J.W.; Hone, J. Measurement of the elastic properties and intrinsic strength of monolayer graphene. Science 2008, 321, 385–388. [Google Scholar] [CrossRef] [PubMed]
- Van den Brink, J. From strength to strength. Nat. Nanotechnol. 2007, 2, 199–201. [Google Scholar] [CrossRef] [PubMed]
- Weitz, R.T.; Yacoby, A. Graphene rests easy. Nat. Nanotechnol. 2010, 5, 699–700. [Google Scholar] [CrossRef] [PubMed]
- Wu, J.; Xu, H.; Zhang, J. Raman spectroscopy of graphene. Acta Chim. Sin. 2014, 72, 301–318. [Google Scholar] [CrossRef]
- Qi-Sen, Z.; Xin, X. Research review on constitutive model and microstructure of asphalt and asphalt mixture. China J. Highw. Transp. 2016, 29, 26–33. [Google Scholar]
- Huang, G. Exploitation of Modified Asphalt of Fume Suppression and Study on Performance of Its Mixture under the Elevated Temperture. Ph.D. Thesis, Chongqing Jiaotong University, Chongqing, China, 2013. [Google Scholar]
- Zhang, B. The Effect of Modified Graphene on the Flame Retardancy and Smoke Suppression Properties of Polymer. Master’s Thesis, Anhui Jianzhu University, Hefei, China, 2017. [Google Scholar]
- Liu, Y.; Han, M.; Yin, Y.; Fenglei, Z.; Liu, L.; Jing, L. Research progress and prospective exploration of graphene in intelligent highway. Mater. Rev. 2017, 31, 169–172. [Google Scholar]
- Wang, Z.; Dai, Q.; Guo, S. Microwave-healing performance of modified asphalt mixtures with flake graphite and exfoliated graphite nanoplatelet. Constr. Build. Mater. 2018, 187, 865–875. [Google Scholar] [CrossRef]
- Wang, Z.; Dai, Q.; Guo, S.; Wang, R.; Ye, M.; Yap, Y.K. Experimental investigation of physical properties and accelerated sunlight-healing performance of flake graphite and exfoliated graphite nanoplatelet modified asphalt materials. Constr. Build. Mater. 2017, 134, 412–423. [Google Scholar] [CrossRef]
- Wang, Z.; Dai, Q.; Guo, S. Laboratory performance evaluation of both flake graphite and exfoliated graphite nanoplatelet modified asphalt composites. Constr. Build. Mater. 2017, 149, 515–524. [Google Scholar] [CrossRef]
- Yao, H.; Dai, Q.; You, Z.; Ye, M.; Yap, Y.K. Rheological properties, low-temperature cracking resistance, and optical performance of exfoliated graphite nanoplatelets modified asphalt binder. Constr. Build. Mater. 2016, 113, 988–996. [Google Scholar] [CrossRef]
- Li, Y.; Wu, S.; Amirkhanian, S. Investigation of the graphene oxide and asphalt interaction and its effect on asphalt pavement performance. Constr. Build. Mater. 2018, 165, 572–584. [Google Scholar] [CrossRef]
- Huang, G. Suppression mechanism of expanded graphite for asphalt fume and dynamic performance of asphalt mixture of fume suppression. China J. Highw. Transp. 2015, 28, 1–10. [Google Scholar]
- He, Z. Study on Mechanism and Suppression Technology of Modified Asphalt Smoke at High Temperature; National Natural Science Foundation: Beijing, China, 2014; pp. 85–93.
- Cheng, I.F.; Xie, Y.; Allen Gonzales, R.; Brejna, P.R.; Sundararajan, J.P.; Fouetio Kengne, B.A.; Eric Aston, D.; McIlroy, D.N.; Foutch, J.D.; Griffiths, P.R. Synthesis of graphene paper from pyrolyzed asphalt. Carbon 2011, 49, 2852–2861. [Google Scholar] [CrossRef]
- Amirkhanian, A.; Xiao, F.; Amirkhanian, S. Evaluation of high temperature rheological characteristics of asphalt binder with carbon nano particles. J. Test. Eval. 2011, 39, 583–591. [Google Scholar]
- Moreno-Navarro, F.; Sol-Sánchez, M.; Gámiz, F.; Rubio-Gámez, M.C. Mechanical and thermal properties of graphene modified asphalt binders. Constr. Build. Mater. 2018, 180, 265–274. [Google Scholar] [CrossRef]
- Le, J.; Marasteanu, M.; Turos, M. Graphene Nanoplatelet (GNP) Reinforced Asphalt Mixtures: A Novel Multifunctional Pavement Material; NCHRP IDEA Project 173; University of Minnesota: Minneapolis, MN, USA, 2016; pp. 1–29. [Google Scholar]
- Zhou, X.; Zhang, X.; Xu, S.; Wu, S.; Liu, Q.; Fan, Z. Evaluation of thermo-mechanical properties of graphene/carbon-nanotubes modified asphalt with molecular simulation. Mol. Simulat. 2017, 43, 312–319. [Google Scholar] [CrossRef]
- Liu, X.; Wu, S. Study on the graphite and carbon fiber modified asphalt concrete. Constr. Build. Mater. 2011, 25, 1807–1811. [Google Scholar] [CrossRef]
- Liu, K.; Zhang, K.; Wu, J.; Muhunthan, B.; Shi, X. Evaluation of mechanical performance and modification mechanism of asphalt modified with graphene oxide and warm mix additives. J. Clean. Prod. 2018, 193, 87–96. [Google Scholar] [CrossRef]
- Han, M.; Li, J.; Muhammad, Y.; Yin, Y.; Yang, J.; Yang, S.; Duan, S. Studies on the secondary modification of SBS modified asphalt by the application of octadecyl amine grafted graphene nanoplatelets as modifier. Diam. Relat. Mater. 2018, 89, 140–150. [Google Scholar] [CrossRef]
- Han, M.; Li, J.; Muhammad, Y.; Hou, D.; Zhang, F.; Yin, Y.; Duan, S. Effect of polystyrene grafted graphene nanoplatelets on the physical and chemical properties of asphalt binder. Constr. Build. Mater. 2018, 174, 108–119. [Google Scholar] [CrossRef]
- Zeng, W.; Wu, S.; Pang, L.; Sun, Y.; Chen, Z. The utilization of graphene oxide in traditional construction materials: Asphalt. Mater. 2017, 10, 48. [Google Scholar] [CrossRef] [PubMed]
- Habib, N.Z.; Aun, N.C.; Zoorob, S.E.; Lee, P.I. Use of graphene oxide as a bitumen modifier: An innovative process optimization study. Adv. Mater. Res. 2015, 1105, 365–369. [Google Scholar] [CrossRef]
- Standard Test Methods of Asphalt and Asphalt Mixtures for Highway Engineering: JTG E20-2011; Ministry of Communications of the People’s Republic of China: Beijing, China, 2011.
- Xin, C.; Lu, Q.; Ai, C.; Rahman, A.; Qiu, Y. Optimization of hard modified asphalt formula for gussasphalt based on uniform experimental design. Constr. Build. Mater. 2017, 136, 556–564. [Google Scholar] [CrossRef]
- Yu, J.; Zhang, X. Evaluation of environmental factors to fatigue performance of asphalt mixes based on uniform design. Highway 2010, 21, 82–86. [Google Scholar]
- Li, T.Z.; Yang, X.L. An efficient uniform design for Kriging-based response surface method and its application. Comput. Geotech. 2019, 109, 12–22. [Google Scholar] [CrossRef]
- Fang, K.; Lin, D.K.J.; Winker, P.; Zhang, Y. Uniform Design: Theory and Application. Technometrics 2000, 42, 237–248. [Google Scholar] [CrossRef]
- Zhang, G.; Wang, W. A citation review on the uniform experimental design. J. Appl. Stat. Mgmt. 2013, 32, 89–99. [Google Scholar]
- Li, Y. The Preparation Technology of Graphene Modified Asphalt with High-Performance Road. Master’s Thesis, Chongqing Jiaotong University, Chongqing, China, 2018. [Google Scholar]
- Bao, D.; Yu, Y.; Zhao, Q. Evaluation of the chemical composition and rheological properties of bio-asphalt from different biomass sources. Road Mater. Pavement 2019, 1, 1–15. [Google Scholar] [CrossRef]
- Hadiwardoyo, S.P.; Sinaga, E.S.; Fikri, H. The influence of Buton asphalt additive on skid resistance based on penetration index and temperature. Constr. Build. Mater. 2013, 42, 5–10. [Google Scholar] [CrossRef]
- Wang, R.; Fan, H.; Jiang, W.; Ni, G.; Qu, S. Amino-functionalized graphene quantum dots prepared using high-softening point asphalt and their application in Fe3+ detection. Appl. Surf. Sci. 2019, 467–468, 446–455. [Google Scholar] [CrossRef]
- Sun, D.; Lv, W. Evaluation of low temperature performances of polymer modified asphalts by force-ductility test. J. Build. Mater. 2007, 10, 37–42. [Google Scholar]
- Gu, M. Asphalt and Asphalt Mixture at Low Temperature Performance Evaluation Methods of Research. Master’s Thesis, Shandong Jianzhu University, Jinan, China, 2017. [Google Scholar]
- Jahanbakhsh, H.; Karimi, M.; Moghadas Nejad, F.; Jahangiri, B. Viscoelastic-based approach to evaluate low temperature performance of asphalt binders. Constr. Build. Mater. 2016, 128, 384–398. [Google Scholar] [CrossRef]
- Huang, G.; He, Z.; Hu, C.; Huang, T. Performance evaluation of rock modified asphalt based on analysis of microstructure and rheological property. J. Southeast Univ. 2010, 40, 367–372. [Google Scholar]
- Xu, O.; Xiao, F.; Han, S.; Amirkhanian, S.N.; Wang, Z. High temperature rheological properties of crumb rubber modified asphalt binders with various modifiers. Constr. Build. Mater. 2016, 112, 49–58. [Google Scholar] [CrossRef]
- Ali, A.W.; Kim, H.H.; Mazumder, M.; Lee, M.-S.; Lee, S.-J. Multiple Stress Creep Recovery (MSCR) characterization of polymer modified asphalt binder containing wax additives. Int. J. Pavement Res. Technol. 2018, 1, 1–15. [Google Scholar] [CrossRef]
- Huang, W.; Tang, N. Characterizing SBS modified asphalt with sulfur using multiple stress creep recovery test. Constr. Build. Mater. 2015, 93, 514–521. [Google Scholar] [CrossRef]
- Yang, X.; You, Z. High temperature performance evaluation of bio-oil modified asphalt binders using the DSR and MSCR tests. Constr. Build. Mater. 2015, 76, 380–387. [Google Scholar] [CrossRef]
- Liu, Y. Response Surface Modeling by Local Kernel Partial Least Squares. Master’s Thesis, Tsinghua University, Beijing, China, 2013. [Google Scholar]
- Tang, Q.Y.; Zhang, C.X. Data Processing System (DPS) software with experimental design, statistical analysis and data mining developed for use in entomological research. Insect Sci. 2013, 20, 254–260. [Google Scholar] [CrossRef] [PubMed]
- Wang, Y.; Wang, T. Comparison of the interpolation data produced by CSI and 1stopt in sedimentation prediction. J. Ludong Univ. 2017, 33, 374–378. [Google Scholar]
- Chen, X. Optimizing, Fitting and Modeling 1stopt Application; China Building Material Press: Beijing, China, 2012. [Google Scholar]
- Zhang, Y. Graphene and High Quality Graphene: Controllable Synthesis, Characterization, Properties and Application. Ph.D. Thesis, Wuhan University, Wuhan, China, 2014. [Google Scholar]
- Li, Y.; Li, J.; Ding, S.; Sun, X. Characterization of remaining oil after polymer flooding by laser scanning confocal fluorescence microscopy. J. Disper. Sci. Technol. 2014, 35, 898–906. [Google Scholar] [CrossRef]
- Liu, P.; Yang, C.; Ling, Z.; Zhu, E.; Shi, Q. Technological routes toward homogeneous dispersion of graphene: A review. Mater. Rev. 2016, 30, 39–45. [Google Scholar]
- Bai, M. Preparation and Application of Graphene and Graphene Dispersions. Ph.D. Thesis, Beijing University of Chemical Technology, Beijing, China, 2016. [Google Scholar]
- Poorsargol, M.; Alimohammadian, M.; Sohrabi, B.; Dehestani, M. Dispersion of graphene using surfactant mixtures: Experimental and molecular dynamics simulation studies. Appl. Surf. Sci. 2019, 464, 440–450. [Google Scholar] [CrossRef]
- Zhang, X.; Huang, T.; Zhang, Y.; Gao, H.; Jiang, M. Image-pro plus analysis of pore structure of concrete. J. Build. Mater. 2015, 18, 177–182. [Google Scholar]
- Salemi, M.; Wang, H. Image-aided random aggregate packing for computational modeling of asphalt concrete microstructure. Constr. Build. Mater. 2018, 177, 467–476. [Google Scholar] [CrossRef]
- Xing, C.; Tan, Y.; Liu, X.; Anupam, K.; Scarpas, T. Research on local deformation property of asphalt mixture using digital image correlation. Constr. Build. Mater. 2017, 140, 416–423. [Google Scholar] [CrossRef]


| Test Item | Test Result | Technology Index | Test Method | |
|---|---|---|---|---|
| penetration (25 °C, 5 s, 100 g)/0.1 mm | 64.70 | 60.0~80.0 | T0604 | |
| ductility (15 °C, 5 cm/min)/cm | 103.00 | ≥100.0 | T0605 | |
| softening point/°C | 48.10 | ≥45.0 | T0606 | |
| density (15 °C)g/cm3 | 1.21 | actual measurement | T0603 | |
| wax content/% | 2.04 | ≤2.2 | T0615 | |
| dynamic viscosity(60 °C)/Pa·s | 197 | ≥180 | T0620 | |
| flash point/°C | 315 | ≥260 | T0611 | |
| after RTFOT | mass change/% | −0.18 | ≤±0.8 | T0610 |
| residual penetration ratio/% | 63.50 | ≥61.0 | T0604 | |
| 10 °C ductility/cm | 8.60 | ≥6.0 | T0605 | |
| Parameter | Index |
|---|---|
| graphene layers/thickness | 1–3, monolayer rate >80% |
| ash content/% | <3.0 |
| specific surface area/m²/g | 110.0 |
| film electrical conductivity/S/cm | 550.0 |
| flake diameter (D50)/um | 7.0~12.0 |
| flake diameter (D90)/um | 11.0~15.0 |
| appearance | Black-grey powder |
| bulk density/g/mL | 0.01~0.02 |
| water content/% | <2.0 |
| Parameter | Index |
|---|---|
| appearance | White powder |
| initial melting point/°C | 141.0~146.0 |
| total amine/mg KOH/g | ≤3.0 |
| color value | ≤5.0 |
| acid value/mg KOH/g | ≤7.0 |
| fineness degree/mesh | 600 |
| heating decrement/% | ≤0.5 |
| flash point/°C | ≥28.0 |
| Factor | Level | |||||||||
|---|---|---|---|---|---|---|---|---|---|---|
| 1 | 2 | 3 | 4 | 5 | 6 | 7 | 8 | 9 | 10 | |
| X1/r.p.m. | 2000 | 2500 | 3000 | 3500 | 4000 | 4500 | 5000 | 5500 | 6000 | 7000 |
| X2/min | 30 | 30 | 60 | 60 | 90 | 90 | 120 | 120 | 180 | 180 |
| X3/‰ | 2 | 4 | 6 | 8 | 10 | 12 | 14 | 16 | 18 | 20 |
| X4/% | 1 | 2 | 3 | 4 | 5 | 6 | 7 | 8 | 9 | 10 |
| X5/℃ | 110 | 110 | 120 | 120 | 130 | 130 | 140 | 140 | 150 | 150 |
| Test # | Factor | ||||
|---|---|---|---|---|---|
| X1/r.p.m. | X2/min | X3/‰ | X4/% | X5/°C | |
| 1# | 2000 | 60 | 8 | 5 | 150 |
| 2# | 2500 | 90 | 16 | 10 | 140 |
| 3# | 3000 | 180 | 2 | 4 | 130 |
| 4# | 3500 | 30 | 10 | 9 | 120 |
| 5# | 4000 | 60 | 18 | 3 | 110 |
| 6# | 4500 | 120 | 4 | 8 | 150 |
| 7# | 5000 | 180 | 12 | 2 | 140 |
| 8# | 5500 | 30 | 20 | 7 | 130 |
| 9# | 6000 | 90 | 6 | 1 | 120 |
| 10# | 7000 | 120 | 14 | 6 | 110 |
| The Number of Latent Variables | Partial Least Square Quadratic Polynomial Regression Determinant Coefficient R2 | Partial Least Square Quadratic Term Regression Determinant Coefficient R2 | Partial Least Square Interaction Term Regression Determinant Coefficient R2 | ||||||||||||
|---|---|---|---|---|---|---|---|---|---|---|---|---|---|---|---|
| Y1 | Y2 | Y3 | Y4 | Y5 | Y1 | Y2 | Y3 | Y4 | Y5 | Y1 | Y2 | Y3 | Y4 | Y5 | |
| 1 | 0.720 | 0.274 | 0.262 | 0.294 | 0.001 | 0.740 | 0.387 | 0.278 | 0.216 | 0.009 | 0.694 | 0.346 | 0.326 | 0.363 | 0.001 |
| 2 | 0.923 | 0.336 | 0.401 | 0.317 | 0.591 | 0.777 | 0.391 | 0.795 | 0.714 | 0.424 | 0.911 | 0.374 | 0.559 | 0.470 | 0.646 |
| 3 | 0.944 | 0.424 | 0.658 | 0.764 | 0.631 | 0.813 | 0.760 | 0.822 | 0.732 | 0.882 | 0.912 | 0.651 | 0.663 | 0.733 | 0.652 |
| 4 | 0.961 | 0.688 | 0.701 | 0.787 | 0.699 | 0.843 | 0.921 | 0.921 | 0.825 | 0.941 | 0.973 | 0.789 | 0.820 | 0.849 | 0.669 |
| 5 | 0.965 | 0.864 | 0.796 | 0.835 | 0.749 | 0.976 | 0.941 | 0.943 | 0.876 | 0.973 | 0.977 | 0.922 | 0.881 | 0.906 | 0.879 |
| Regression Model | Partial Least Square Quadratic Polynomial Regression Model | Partial Least Square Quadratic Term Regression Model | Partial Least Square Interaction Term Regression Model |
|---|---|---|---|
| regression equation of penetration | Y1 = 69.065 + 5.02 × 10⁻⁴ × X1 + 0.248 × X2 + 0.236 × X3 − 2.019 × X4 − 0.291 × X5 − 2.58 × 10⁻⁴ × X22 + 1.99 × 10⁻² × X32 − 8.66 ×10⁻² × X42 + 2.21 × 10⁻³ × X52 – 5 × 10⁻⁶ × X1 × X2 + 6.3 × 10⁻⁵ × X1 × X3 + 1.36 × 10−4 X1 × X4 − 3.2 × 10⁻⁵ × X1 × X5 − 1.24 × 10⁻³ × X2 × X3 + 6.94 × 10⁻³ × X2 × X4 − 1.7 × 10⁻³ × X2 × X5 + 1.5 × 10⁻² × X3 × X4 − 5.54 × 10⁻³ × X3 × X5 + 1.33 × 10⁻² × X4 × X5 | Y1 = 145.630 − 6.78 × 10⁻³ × X1 + 9.45 × 10⁻² × X2 − 1.488 × X3 + 2.012 × X4 − 1.153 × X5 + 1 × 10⁻⁶ × X12 − 6.22 × 10⁻⁴ × X22 + 7.31 × 10⁻² × X32 − 0.189 × X42 + 4.47 × 10⁻³ × X52 | Y1 = 12.794 + 5.05 × 10⁻³ × X1 + 0.266 × X2 + 1.397 × X3 − 4.966 × X4 + 0.434 × X5 – 5 × 10⁻⁶ × X1 × X2 + 6.9 × 10⁻⁵ × X1 × X3 + 1.91 × 10⁻⁴ × X1 × X4 − 4.9 × 10⁻⁵ × X1 × X5 − 1.39 × 10⁻³ × X2 × X3 + 1.13 × 10⁻² × X2 × X4 − 2.39 × 10⁻³ × X2 × X5 + 9.34 × 10⁻³ × X3 × X4 − 1.09 × 10⁻² × X3 × X5 + 2.39 × 10⁻² × X4 × X5 |
| regression equation of fracture energy | Y2 = −7.782+1.16 × 10⁻² × X1 + 1.081 × X2 − 8.445 × X3 − 15.546 × X4 + 4.022 × X5 + 2 × 10⁻⁶ × X12 + 5.57 × 10⁻⁴ × X22 + 4.82 × 10⁻² × X32 + 0.233 × X42 − 9.80 × 10⁻³ × X52 − 8 × 10⁻⁶ × X1 × X2 − 1.67 × 10⁻⁴ × X1 × X3 − 7.05 × 10⁻⁴ × X1 × X4 − 1.37 × 10⁻⁴ × X1 × X5 + 1.92 × 10⁻³ × X2 × X3 − 5.54 × 10⁻³ × X2 × X4 − 6.86 × 10⁻³ × X2 × X5 + 0.349 × X3 × X4 + 4.28 × 10⁻² × X3 × X5 + 7.85 × 10⁻² × X4 × X5 | Y2 = −465.825 − 5.36 × 10⁻² × X1 + 0.209 × X2 + 0.885 × X3 − 9.127 × X4 + 12.342 × X5 + 7 × 10⁻⁶ × X12 + 5.2 × 10⁻⁵ × X22 − 1.56 × 10⁻² × X32 + 0.616 × X42 − 4.19 × 10⁻² × X52 | Y2 = 112.752 + 2.48 × 10⁻² × X1 + 0.944 × X2 − 8.115 × X3 − 10.189 × X4 + 1.410 × X5 + 1.3 × 10⁻⁵ × X1 × X2 − 2.61 × 10⁻⁴ × X1 × X3 − 9.33 × 10⁻⁴ × X1 × X4 − 1.16 × 10⁻⁴ × X1 × X5 + 5.59 × 10⁻³ × X2 × X3 − 1.51 × 10⁻² × X2 × X4 − 5.56 × 10⁻³ × X2 × X5 + 0.361 × X3 × X4 + 5.25 × 10⁻² × X3 × X5 + 7.08 × 10⁻² × X4 × X5 |
| regression equation of softening point | Y3 = 41.772 + 1.71 × 10⁻⁴ × X1 + 1.13 × 10⁻² × X2 − 0.106 × X3 − 0.142 × X4 + 8.69 × 10⁻² × X5 + 1.2 × 10⁻⁵ × X22 + 1.88 × 10⁻³ × X32 − 2.17 × 10⁻³ × X42 − 2.02 × 10⁻⁴ × X52 + 1 × 10⁻⁶ × X1 × X2 + 4 × 10⁻⁶ × X1 × X3 − 3 × 10⁻⁶ × X1 × X5 + 8.6 × 10⁻⁵ × X2 × X3 − 4.69 × 10⁻⁴ × X2 × X4 − 8 × 10⁻⁵ × X2 × X5 + 6.23 × 10⁻³ × X3 × X4 + 6.17 × 10⁻⁴ × X3 × X5 + 7.55 × 10⁻⁴ × X4 × X5 | Y3 = 19.483 − 8.74 × 10⁻⁴ × X1 − 8.32 × 10⁻⁴ × X2 + 0.129 × X3 − 0.348 × X4 + 0.467 × X5 + 2.4 × 10⁻⁵ × X22 − 2.08 × 10⁻³ × X32 + 2.6 × 10⁻² × X42 − 1.72 × 10⁻³ × X52 | Y3 = 45.499 + 3.88 × 10⁻⁴ × X1 + 1.39 × 10⁻³ × X2 − 8.17 × 10⁻² × X3 − 3.67 × 10⁻² × X4 + 2.26 × 10⁻² × X5 + 1 × 10⁻⁶ × X1 × X2 + 1 × 10⁻⁶ × X1 × X3 − 8 × 10⁻⁶ × X1 × X4 − 2 × 10⁻⁶ × X1 × X5 + 1.98 × 10⁻⁴ × X2 × X3 − 7.9 × 10⁻⁴ × X2 × X4 + 2 × 10⁻⁶ × X2 × X5 + 5.77 × 10⁻³ × X3 × X4 + 8.89 × 10⁻⁴ × X3 × X5 + 2.43 × 10⁻⁴ × X4 × X5 |
| regression equation of anti-rutting factor | Y4 = 903.586 + 2.12 × 10⁻⁴ × X1 − 1.517 × X2 + 1.279 × X3 + 4.146 × X4 + 5.787 × X5 + 3 × 10⁻⁶ × X12 + 2.48 × 10⁻³ × X22 + 5.2 × 10⁻² × X32 − 0.291 × X42 − 7.68 × 10⁻³ × X52 + 2.44 × 10⁻⁴ × X1 × X2 + 4.46 × 10⁻⁴ × X1 × X3 + 1.98 × 10⁻⁴ × X1 × X4 − 2.54 × 10⁻⁴ × X1 × X5 + 3.84 × 10⁻² × X2 × X3 − 0.114 × X2 × X4 + 6.55 × 10⁻³ × X2 × X5 + 0.361 × X3 × X4 + 3.92 × 10⁻² × X3 × X5 − 2.03 × 10⁻² × X4 × X5 | Y4 = −2748.009 − 0.116 × X1 − 0.855 × X2 + 55.224 × X3 − 50.766 × X4 + 63.364 × X5 + 1.8 × 10⁻⁵ × X12 + 7.32 × 10⁻³ × X22 − 1.742 × X32 + 4.757 × X42 − 0.228 × X52 | Y4 = 1256.714 + 5.72 × 10⁻³ × X1 − 3.325 × X2 + 1.769 × X3 + 21.236 × X4 + 0.849 × X5 + 2.97 × 10⁻⁴ × X1 × X2 − 1.4 × 10⁻⁵ × X1 × X3 − 6.69 × 10⁻⁴ × X1 × X4 + 1.25 × 10⁻⁴ × X1 × X5 + 4.61 × 10⁻² × X2 × X3 − 0.184 × X2 × X4 + 2.57 × 10⁻² × X2 × X5 + 0.196 × X3 × X4 + 7.24 × 10⁻² × X3 × X5 − 9.25 × 10⁻² × X4 × X5 |
| regression equation of creep recovery rate | Y5 = −50.358 − 1.12 × 10⁻⁴ × X1 + 0.160 × X2 − 1.083 × X3 − 0.878 × X4 + 0.748 × X5 + 2.8 × 10⁻⁴ × X22 + 2.52 × 10⁻² × X32 − 3.78 × 10⁻² × X42 − 2.43 × 10⁻³ × X52 − 8 × 10⁻⁶ × X1 × X2 + 6.5 × 10⁻⁵ × X1 × X3 + 6.1 × 10⁻⁵ × X1 × X4 − 7 × 10⁻⁶ × X1 × X5 − 1.72 × 10⁻³ × X2 × X3 − 2.55 × 10⁻⁴ × X2 × X4 − 8.69 × 10⁻⁴ × X2 × X5 + 4.20 × 10⁻² × X3 × X4 + 3.57 × 10⁻³ × X3 × X5 + 5.04 × 10⁻³ × X4 × X5 | Y5 = −146.464 − 4.88 × 10⁻³ × X1 − 1.68 × 10⁻² × X2 − 0.597 × X3 + 0.508 × X4 + 2.342 × X5 + 1 × 10⁻⁶ × X12 + 3.9 × 10⁻⁵ × X22 + 4.6 × 10⁻² × X32 − 2.84 × 10⁻² × X42 − 8.52 × 10⁻³ × X52 | Y5 = −19.031 − 3.4 × 10⁻⁵ × X1 + 0.221 × X2 − 0.521 × X3 − 1.787 × X4 + 0.151 × X5 − 1.2 × 10⁻⁵ × X1 × X2 + 9.8 × 10⁻⁵ × X1 × X3 + 1.15 × 10⁻⁴ × X1 × X4 − 1 × 10⁻⁶ × X1 × X5 − 2.75 × 10⁻³ × X2 × X3 − 7.99 × 10⁻⁴ × X2 × X4 − 1.06 × 10⁻³ × X2 × X5 + 5.01 × 10⁻² × X3 × X4 + 3.51 × 10⁻³ × X3 × X5 + 7.24 × 10⁻³ × X4 × X5 |
| Regression Model and Calculation Method | Partial Least Square Quadratic Term Regression Model | Partial Least Square Interaction Term Regression Model | ||
|---|---|---|---|---|
| B-1 | B-2 | B-3 | ||
| optimization solution | shear rate X1/r.p.m. | 6500 | 7000 | 6500 |
| shear time X2/min | 180 | 200 | 30 | |
| graphene mixing amount X3/‰ | 20 | 20 | 20 | |
| stearic amide mixing amount X4/% | 1.00 | 8.26 | 10.00 | |
| shear temperature X5/°C | 140 | 160 | 150 | |
| value of dependent variable | penetration index Y1/0.1 mm | 88.15 | 51.27 | 66.22 |
| fracture energy Y2/N·mm | 4301.6 | 3927.4 | 3541.9 | |
| softening point Y3/ | 47.51 | 52.68 | 51.39 | |
| 64 °C antirutting factor Y4/kPa | 2099.27 | 2338.77 | 1909.48 | |
| 0.1 kPa creep recovery rate Y5/% | 30.13 | 9.25 | 23.43 | |
| Item | SK70# Matrix Asphalt | Partial Least Square Quadratic Term Regression Model | Partial Least Square Interaction Term Regression Model | |||||
|---|---|---|---|---|---|---|---|---|
| B-1 | Change Rate/% | B-2 | Change Rate/% | B-3 | Change Rate/% | |||
| penetration/0.1 mm | 64.7 | 61.5 | −4.95 | 62.3 | −3.71 | 58.6 | −9.43 | |
| softening point/°C | 48.1 | 58.6 | 21.83 | 52.3 | 8.73 | 54.3 | 12.89 | |
| 5 °C force ductility | maximum force/N | 96.6 | 168.0 | 73.91 | 136.0 | 40.79 | 123.0 | 27.33 |
| ductility/mm | 6.11 | 42.54 | 596.24 | 44.21 | 623.57 | 48.39 | 691.98 | |
| fracture energy/N·mm | 387.7 | 4035.7 | 940.93 | 3542.4 | 813.70 | 3358.3 | 766.21 | |
| 64 °C antirutting factor/Pa | 1442.22 | 2099 | 45.54 | 1643 | 13.92 | 1443 | 0.05 | |
| 0.1 kPa creep recovery rate/% | 2.19 | 20.24 | 824.20 | 8.75 | 299.54 | 7.93 | 262.10 | |
© 2019 by the authors. Licensee MDPI, Basel, Switzerland. This article is an open access article distributed under the terms and conditions of the Creative Commons Attribution (CC BY) license (http://creativecommons.org/licenses/by/4.0/).
Share and Cite
Zhang, X.; He, J.-X.; Huang, G.; Zhou, C.; Feng, M.-M.; Li, Y. Preparation and Characteristics of Ethylene Bis(Stearamide)-Based Graphene-Modified Asphalt. Materials 2019, 12, 757. https://doi.org/10.3390/ma12050757
Zhang X, He J-X, Huang G, Zhou C, Feng M-M, Li Y. Preparation and Characteristics of Ethylene Bis(Stearamide)-Based Graphene-Modified Asphalt. Materials. 2019; 12(5):757. https://doi.org/10.3390/ma12050757
Chicago/Turabian StyleZhang, Xia, Jun-Xi He, Gang Huang, Chao Zhou, Man-Man Feng, and Yan Li. 2019. "Preparation and Characteristics of Ethylene Bis(Stearamide)-Based Graphene-Modified Asphalt" Materials 12, no. 5: 757. https://doi.org/10.3390/ma12050757
APA StyleZhang, X., He, J.-X., Huang, G., Zhou, C., Feng, M.-M., & Li, Y. (2019). Preparation and Characteristics of Ethylene Bis(Stearamide)-Based Graphene-Modified Asphalt. Materials, 12(5), 757. https://doi.org/10.3390/ma12050757