Article

Europium-Doped Tellurite Glasses: The Eu2+ Emission in Tellurite, Adjusting Eu2+ and Eu3+ Emissions toward White Light Emission

1
Physics Department, Faculty of Science, Menoufia University, Shebin El-Kom 32511, Egypt
2
Department Werkstoffwissenschaften, Lehrstuhl für Glas und Keramik, Universität Erlangen-Nürnberg, Martensstrasse5, D-91058 Erlangen, Germany
3
Spectroscopy Department, National Research Centre, El-Buhooth Str., Dokki 12622, Giza, Egypt
*
Author to whom correspondence should be addressed.
Materials 2019, 12(24), 4140; https://doi.org/10.3390/ma12244140
Submission received: 21 November 2019 / Revised: 4 December 2019 / Accepted: 6 December 2019 / Published: 10 December 2019

Abstract

:
Europium-doped magnesium tellurite glasses were prepared using melt quenching techniques and attenuated total reflection (ATR) spectroscopy was used to study the glass structure. The glass transition temperature increased with increasing MgO content. Eu2+ and Eu3+ emissions were studied using photoluminescence spectroscopy (PL). The broad emission of Eu2+ ions centered at approximately 485 nm was found to decrease in intensity with increasing MgO content, while the Eu3+ emission was enhanced. The Eu3+ emission lay within the red orange range and its decay time was found to increase with increasing MgO content. Different excitation wavelengths were used to adjust Eu2+ to Eu3+ emissions to reach white light emission. The white light emission was obtained for the sample with the lowest MgO content under excitation in the near-UV range.

1. Introduction

Tellurite glasses are known for their low phonon energy, ≤800 cm−1, much lower than borate, phosphate, and silicate glasses. Beside their high liner refractive index (≈2), their nonlinear refractive index is also high, making tellurite glasses excellent candidates for use in second- and third-generation harmonic applications [1,2]. Their overall high optical basicity (^th) will enhance the reduction of doped elements. Tellurite glasses are also known for their low glass transition temperature (Tg) and low melting (Tm) temperatures. They can be doped with high concentrations of rare-earth ions (REs), 50 times higher than silicate glasses, without presenting any quenching effect [3,4].
Doping glass with REs ions is of great interest due to the number of application for which these glasses could be suitable, such as optical fibers, color displays, waveguides, solar cells, emitting diodes, optical switches, lasers, optical detectors, and optical amplifiers [5,6,7]. The f–f transitions of RE ions are not highly influenced by the change in the ligand field due to the high shielding. Where the hypersensitive transitions are electric dipole ones, such as in Sm3+ (6H5/26F1/2), Dy3+ (6F11/26H15/2), and Eu3+ (5D07F2), they are highly influenced by any changes in the host [8,9,10]. Two stable oxidation states of Europium were observed in glasses, namely, divalent and trivalent oxidation states [11,12,13]. The divalent state Eu2+ of Europium is characterized by a broad emission band extending from the ultraviolet to blue range, that is 4f65d→4f7, a partially allowed transition which is sensitive to any structural changes in the surrounding host [11,14]. The Eu3+ emission is attributed to f–f transitions, which are not highly affected by the crystal field. Nevertheless, the hypersensitive transition ≈614 nm that is an electric dipole transition is influenced by the ionicity and symmetry of the host, while the pure magnetic dipole transition ≈592 nm is less sensitive to the environment. Hence, the ratio of emission of hypersensitive transition to that of the pure magnetic is used as a probe for structural changes [15]. White light emission could be obtained from the combination of the emission from Eu2+ and emission of the Eu3+ [16,17] in silicate and phosphate glasses. However, Eu3+ is difficult to reduce and needs special treatment such as melting in a graphite furnace or nitridation.
Associating the high optical basicity of Tellurite glasses with Europium doping should lead to a high content of Eu2+ and then a suitable white light emitter. In this paper, we doped a TeO2–MgO binary series showing variations of TeO4 and TeO3 structural units of tellurite. The structural modifications of the doped glasses were studied by Infrared spectroscopy. To the best of our knowledge, the emission of Eu2+ has rarely been investigated in tellurite glass. In this paper, we studied Eu2+ emission in the prepared glass without any reducing conditions. The effect of glass composition and structure on the ratio of blue emission from Eu2+ and red emission from Eu3+ was studied. These results allowed us to optimize a promising white light emitter.

2. Materials and Methods

Magnesium tellurite glass containing europium, of the general form (99-x)TeO2-xMgO-1Eu2O3, where x = 9, 19.29, and 39 mol%, was prepared using a melt quenching technique. This sample was designated TMgxEu1. High purity dried chemicals (TeO2 (Alfa Asser 99.99%) and MgO (Sigma-Aldrich 99.99%)) and Eu2O3 (Sigma-Aldrich 99.9999%)) were weighed, mixed together using an agate mortar, and transferred in a Pt crucible to a furnace at melting temperature, varying between 850 and 1100 °C, for approximately 40 min. The melted mixture was stirred several times during the melting process. The molten mass was cast in a stainless steel mold (≈150 °C), and then transferred immediately to the annealing furnace. The annealing temperature varied between 300 and 420 °C, depending on the composition, for approximately 2 h. The results presented here were compared to our previously synthesized Eu-free glass series, (100-x)TeO2-xMgO, designated TMgx. This reference series was synthesized and annealed under the same conditions.
X-ray diffraction (XRD) measurements were done using a Brucker D8 advance eco X-ray diffractometer, with λ = 1.54178 Å, a power source of 40 KeV and 25 mA, and a graphite monochromator for Cu-Kα radiation.
The glass transition temperature, Tg, of the prepared glasses was obtained through differential scanning calorimetry (DSC), (NETZSCH DSC 404F1), using a constant heating rate of 10 °C min−1 with an error of ±1.5 °C. Tg was determined as the onset temperature.
The attenuated total reflection (ATR) spectra were collected using Thermo Nicolet iS 10, (ThermoFisher Scientific, Germany) using Diamond crystal with n = 2.4 from Czitek.
The photoluminescence spectra were measured using a spectrofluorometer equipped with double monochromators (Czerny-Turner) in excitation and emission (Fluorolog3, Horiba JobinYvon), using a 450 W Xe-lamp as the excitation source (the excitation and emission spectral resolution was 1 nm). The decay spectra were collected using the flouroHub and data station software.

3. Results and Discussion

3.1. Structural and Thermal Investigation

Since the 1 mol% of Eu2O3 doping is a high concentration, the risk of crystallization is a concern. The amorphous nature of the prepared Europium-doped magnesium tellurite glasses was confirmed by XRD measurement. The results are shown in Figure 1. No sharp crystalline peaks are observed, only the hump around 30° that is characteristic for glasses.
The glass transition temperature (Tg) curves for the prepared glasses are represented in Figure 2.
Here, an increase in the Tg can be observed when the MgO content is increased. However, when compared with the undoped glasses [18], the Tg is found to be higher for the doped glasses than that of the undoped glasses reported in our previous work (see Table 1). This behavior is attributed to the higher bond enthalpy of Eu-O (557 KJ/mol) compared to that of Mg-O (358 KJ/mol) [19,20].
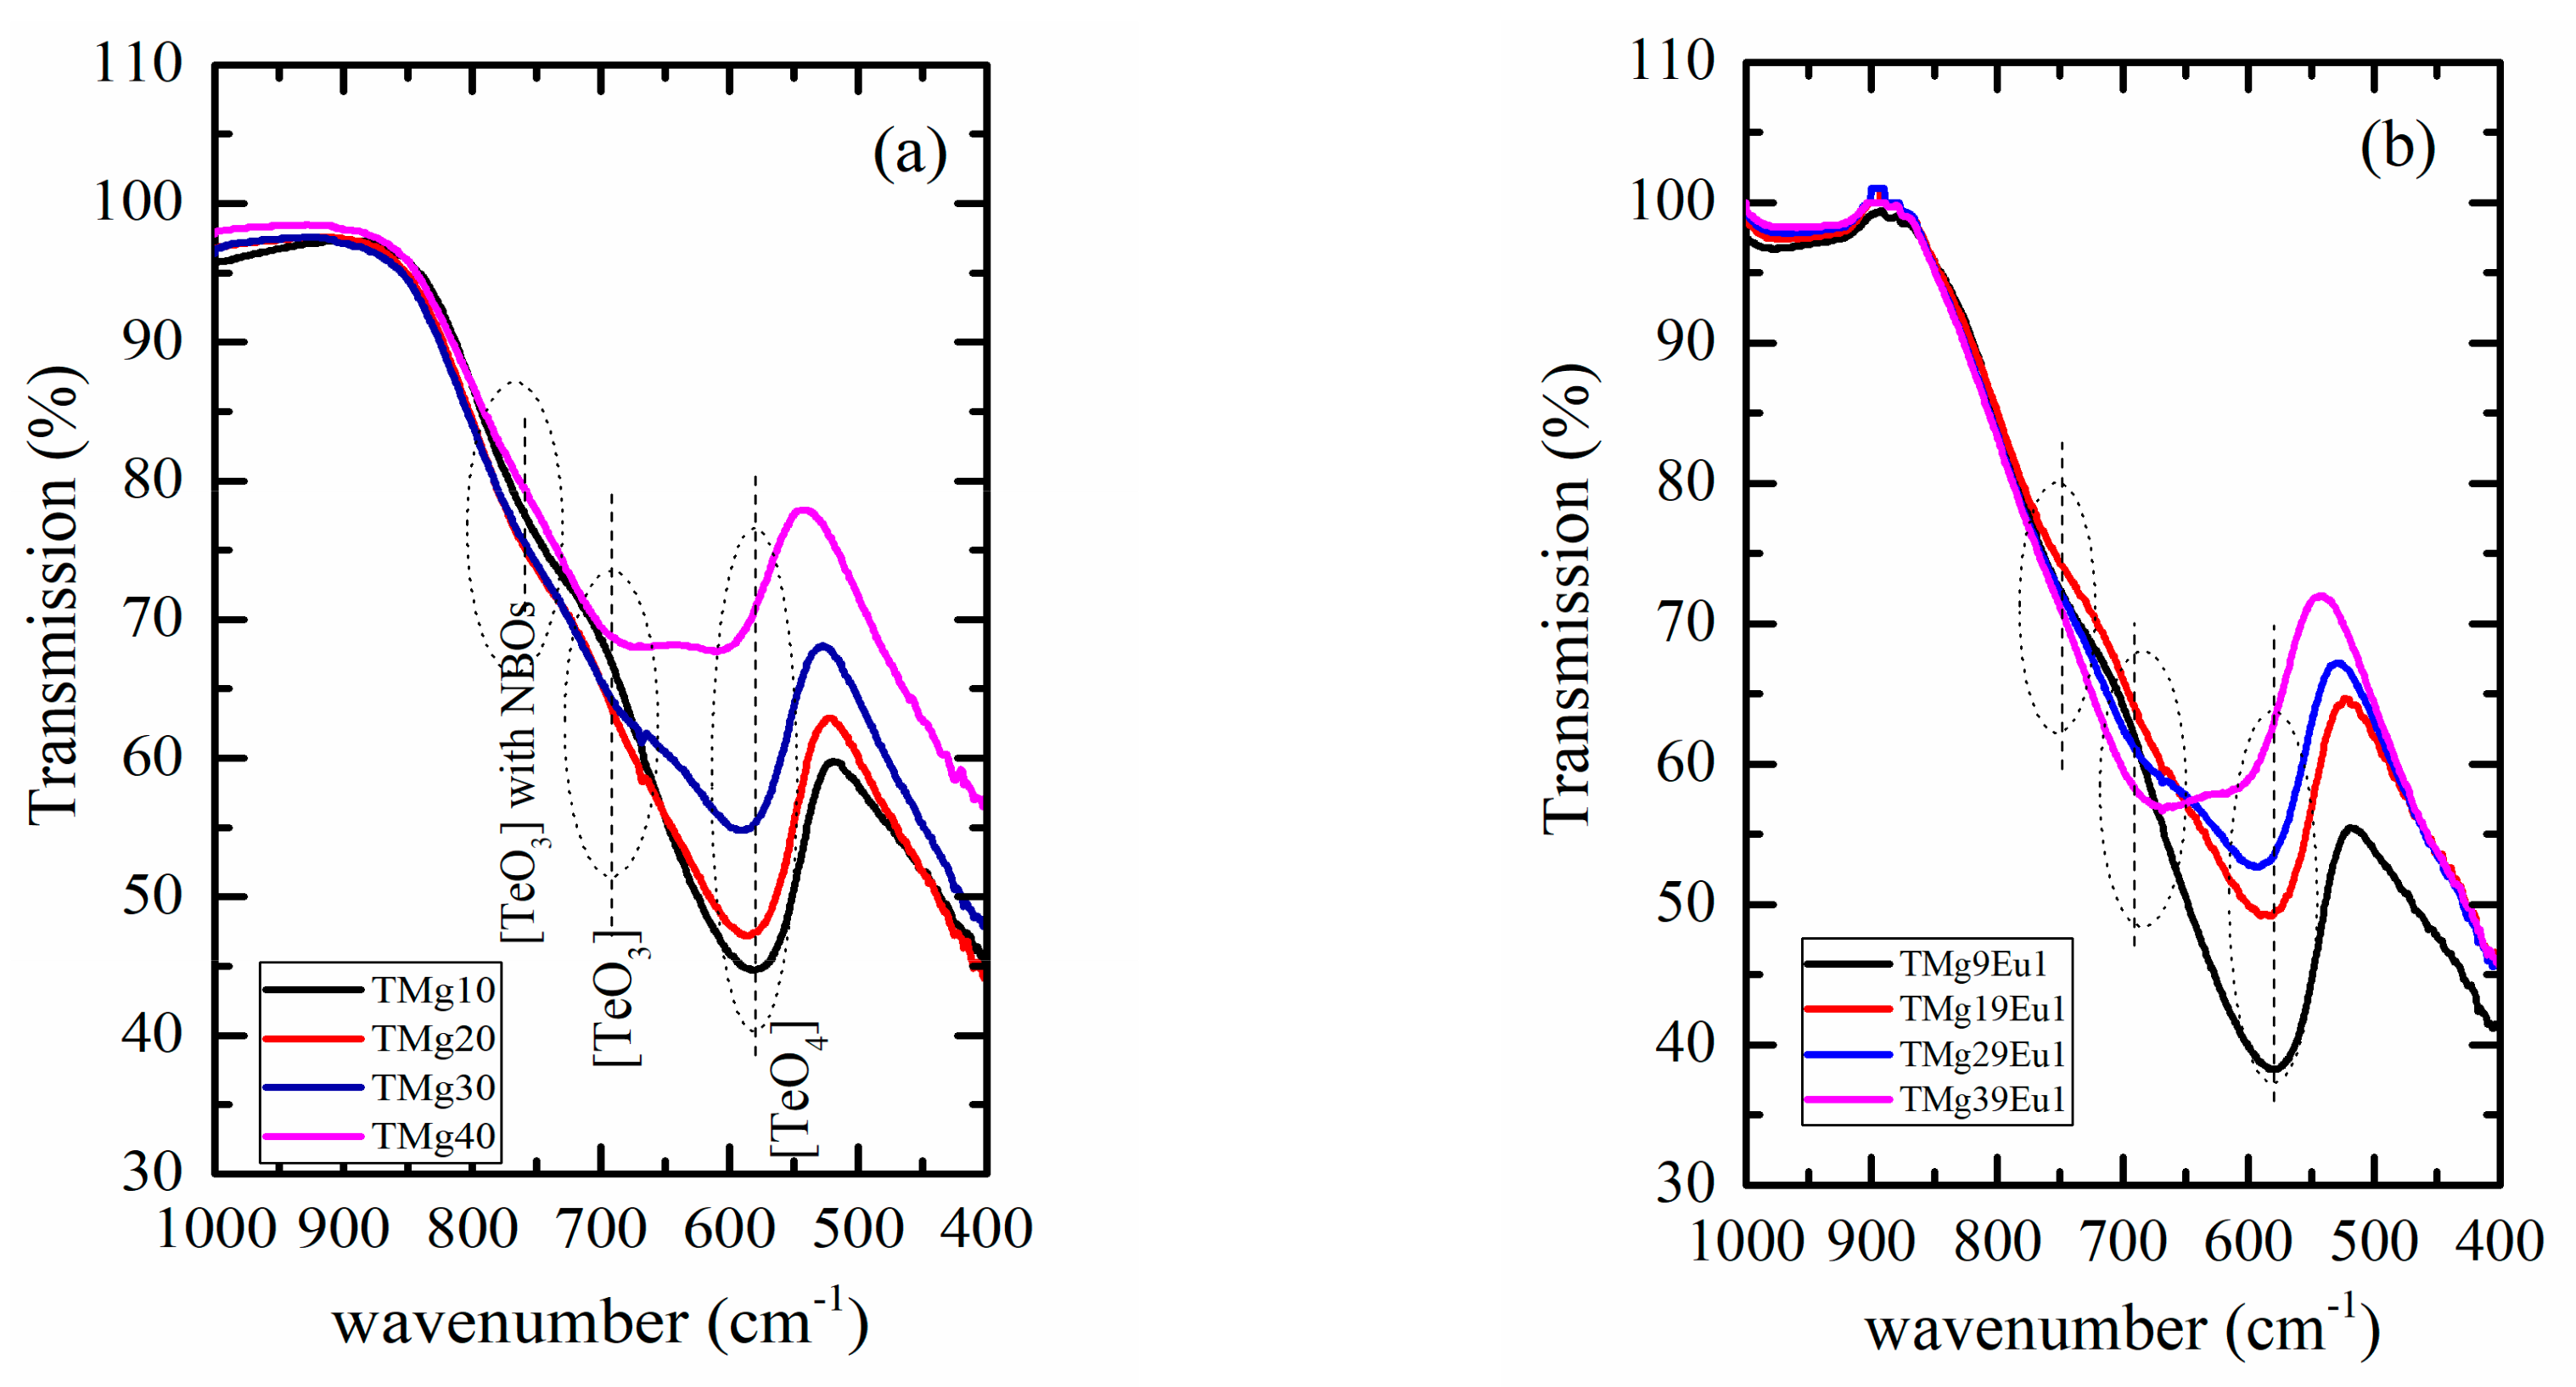
Incorporation of oxide modifier into the tellurite network leads to the change of TeO4 trigonal bipyramid to polyhedral TeO3+1 and trigonal pyramid TeO3 structural units, and is associated with the formation of non-bridging oxygen (NBOs) [21]. Figure 3 shows the ATR spectra of undoped (TMgx) and (TMgxEu1) doped series.
The spectra are dominated by a broad band extending from 500 to 900 cm−1. Although the ATR method is preferred over the KBr technique as it eliminates the effect of varying glass content in the KBr powder, the absolute intensity could be affected by the degree of contact between the glass powder and the diamond crystal. Hence, to overcome this problem, we used the normalized spectra and compared the relative rather than the absolute intensities. First, the peak centered at 590 cm−1, assigned to the [TeO4] trigonal bipyramid structural unit [22,23,24], shifts toward higher energies from 580 to 615 cm−1 with increasing MgO content. This variation is similar for both the doped and undoped series, along with the decrease in its intensity. The absorption band centered at approximately 700 cm−1 is assigned to the stretching vibrations of the trigonal pyramid (TeO3) units [24,25,26] and it shows a slight shift toward lower energies (from 672 to 665 cm−1) with increasing MgO content. The relative contribution between the TeO3 and TeO4 units increases with increasing MgO and is more pronounced for the doped samples. This behavior confirms that, As MgO increases, the TeO4 decreases as it is converted to (TeO3) structural units and that Eu doping also contributes to this conversion. The last band centered around 770 cm−1 shows a slight shift to higher energies as MgO increases for both series. This center is attributed to the stretching vibration between tellurium and NBOs of the trigonal pyramidal (TeO3) structural units [27,28].
To have a better view of the structural changes, the spectra were converted to absorption. A baseline anchored at 525 and 850 cm−1 was subtracted and the spectra were normalized, and then deconvoluted using Gaussian shape components [29,30]. Figure 4a represents an example of the deconvoluted spectra. From the deconvoluted data, the change in the area of the bands related to the TeO4 (assigned as A4) and TeO3 (assigned as A3) and the ratio between areas of bands related to the TeO4 structural units to the total area was calculated and is plotted in Figure 4b. This ratio can be considered in a first approximation to be proportional to the concentration of the species and confirms the conversion of TeO4 to TeO3 units. The difference between undoped and doped glasses becomes greater the higher the MgO content (x = 29 and 39 mol%).

3.2. Photoluminescence Spectroscopy

3.2.1. Photoluminescence of Eu3+

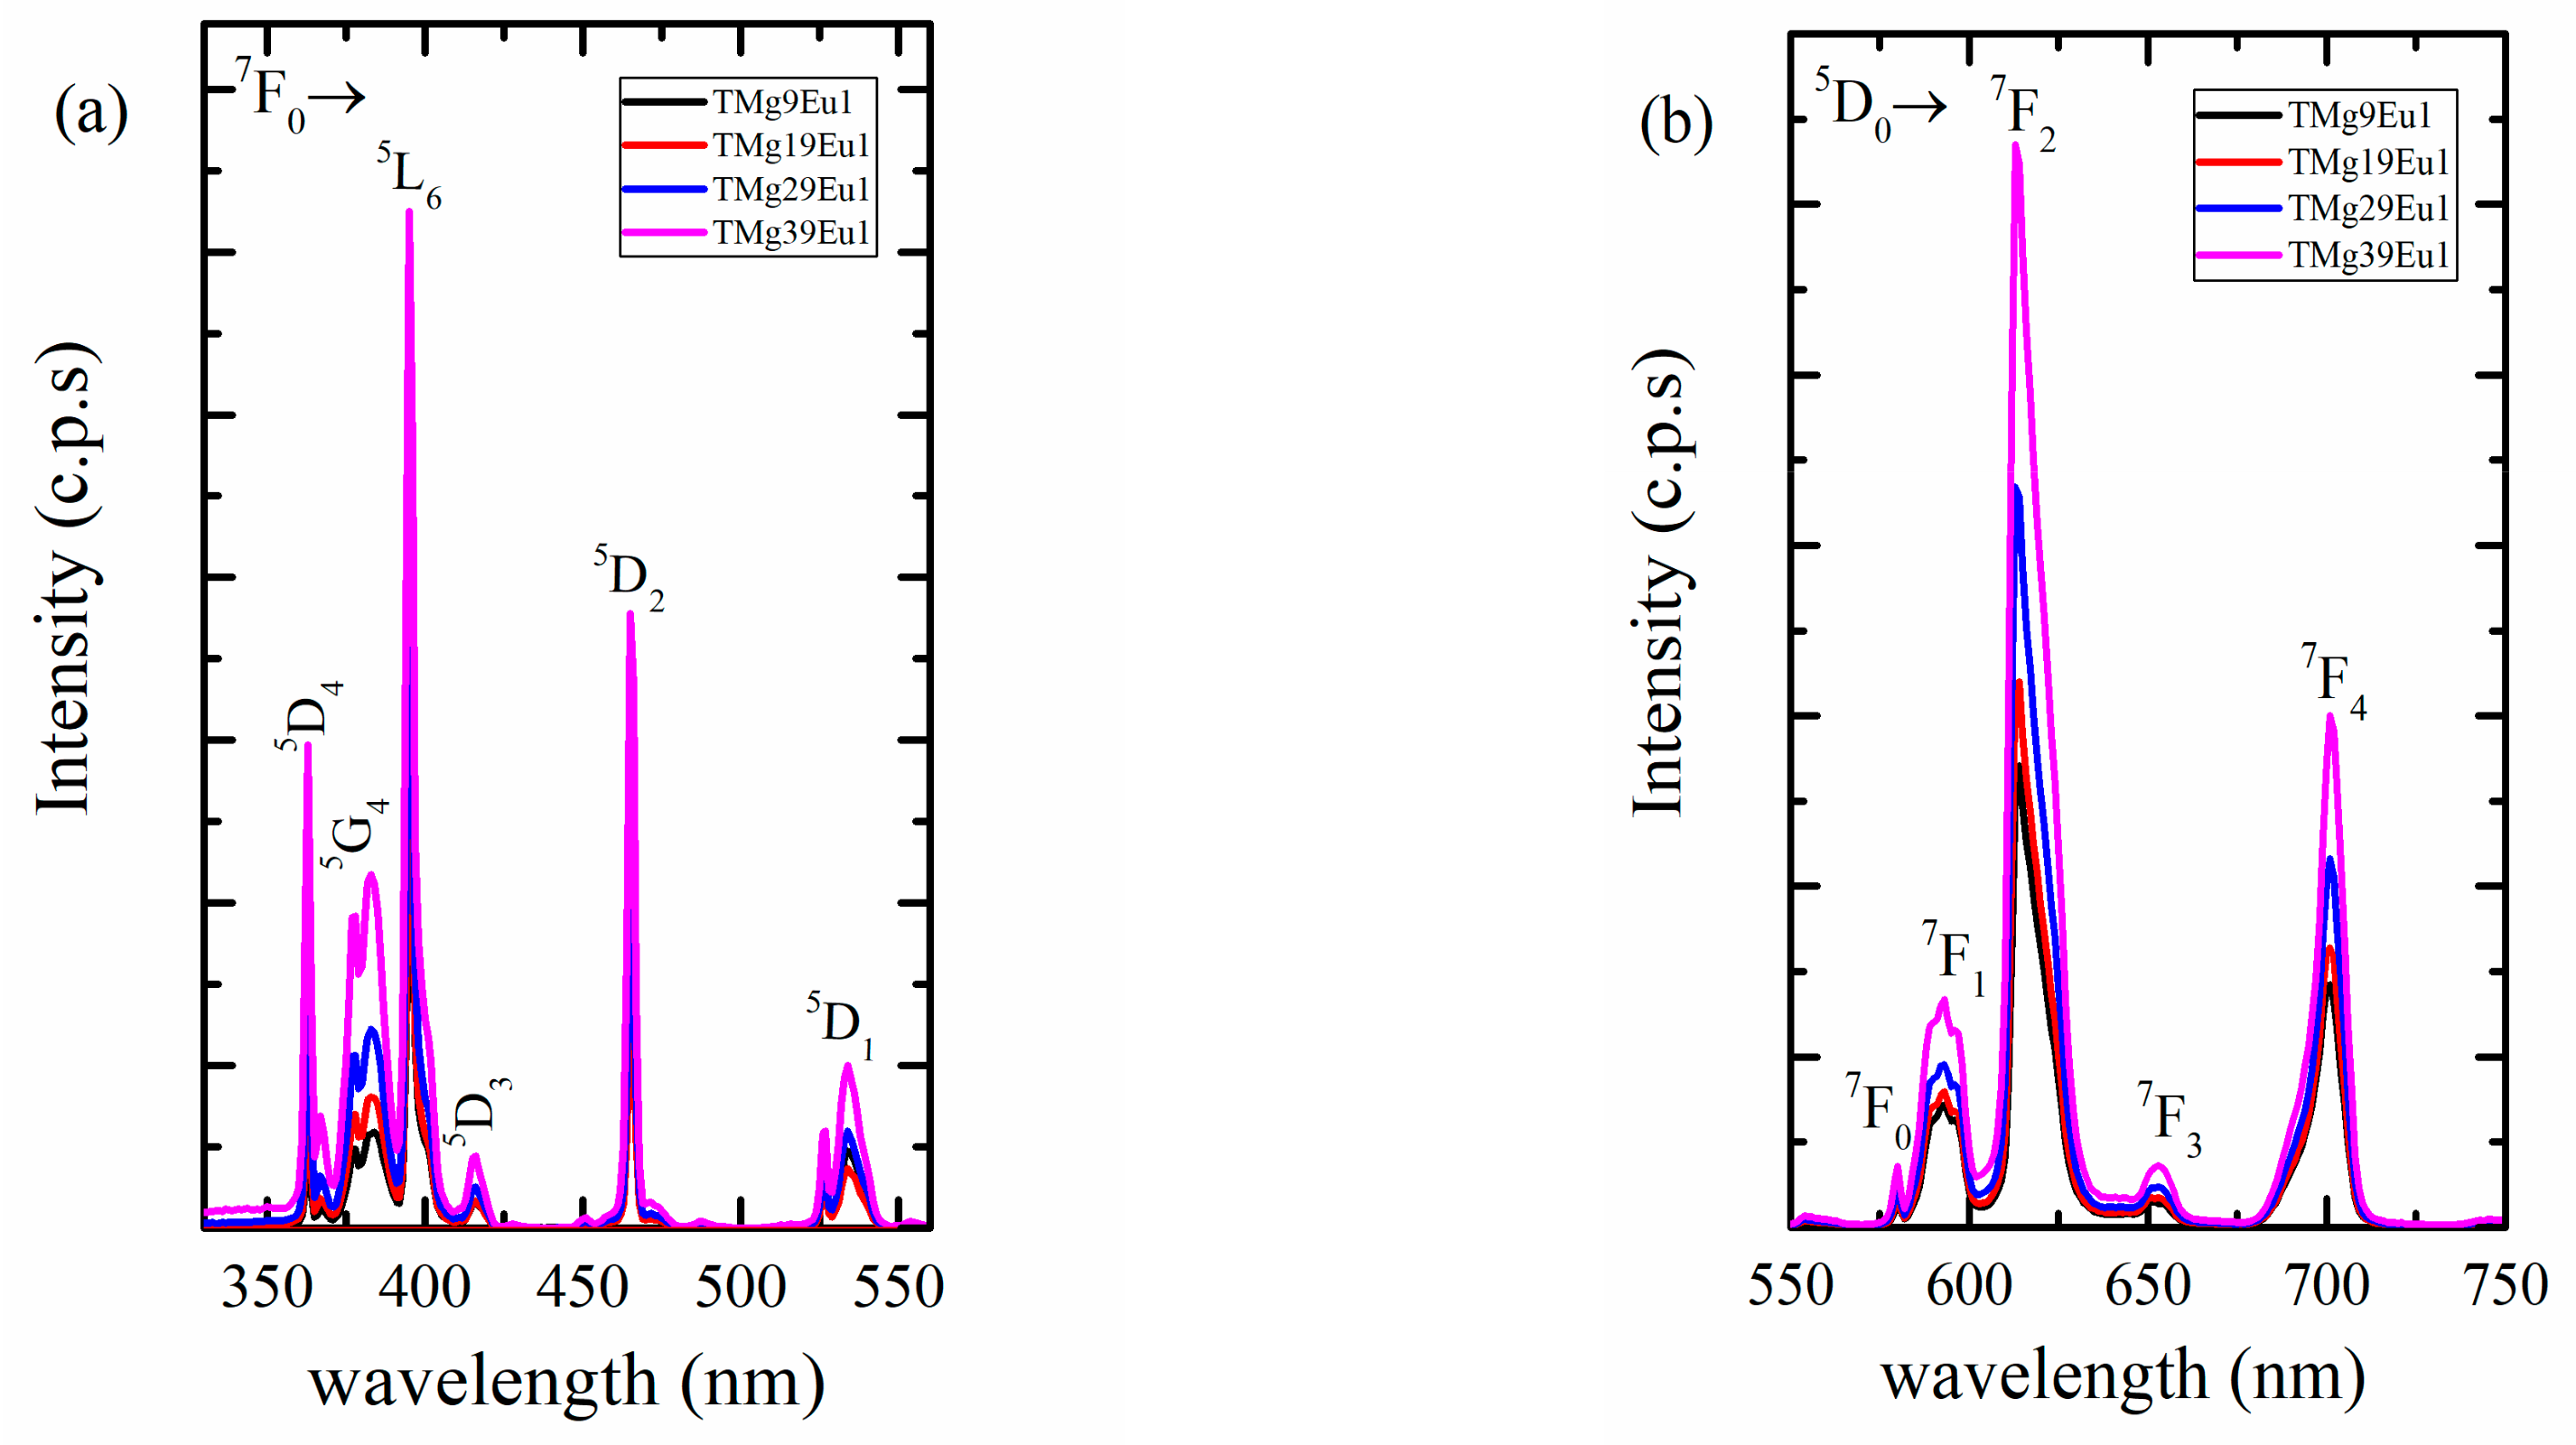
The emission and excitation spectra for Eu3+ are presented in Figure 5. The excitation spectrum (Figure 5a) shows six lines, all originating from the ground state 7F0 to different excited states centred around 363, 380, 394, 416, 466, and 530 nm corresponding to the energy states 5D4, 5G4, 5L6, 5D2, and 5F1, respectively [31,32,33,34]. In all of the prepared glasses, the excitation spectra were identical, as expected since the f–f transitions were shielded. The maximum excitation at 392 nm, corresponding to the transition 7F05L6, was chosen to discern the emission spectra of Eu3+ ions presented in Figure 5b.
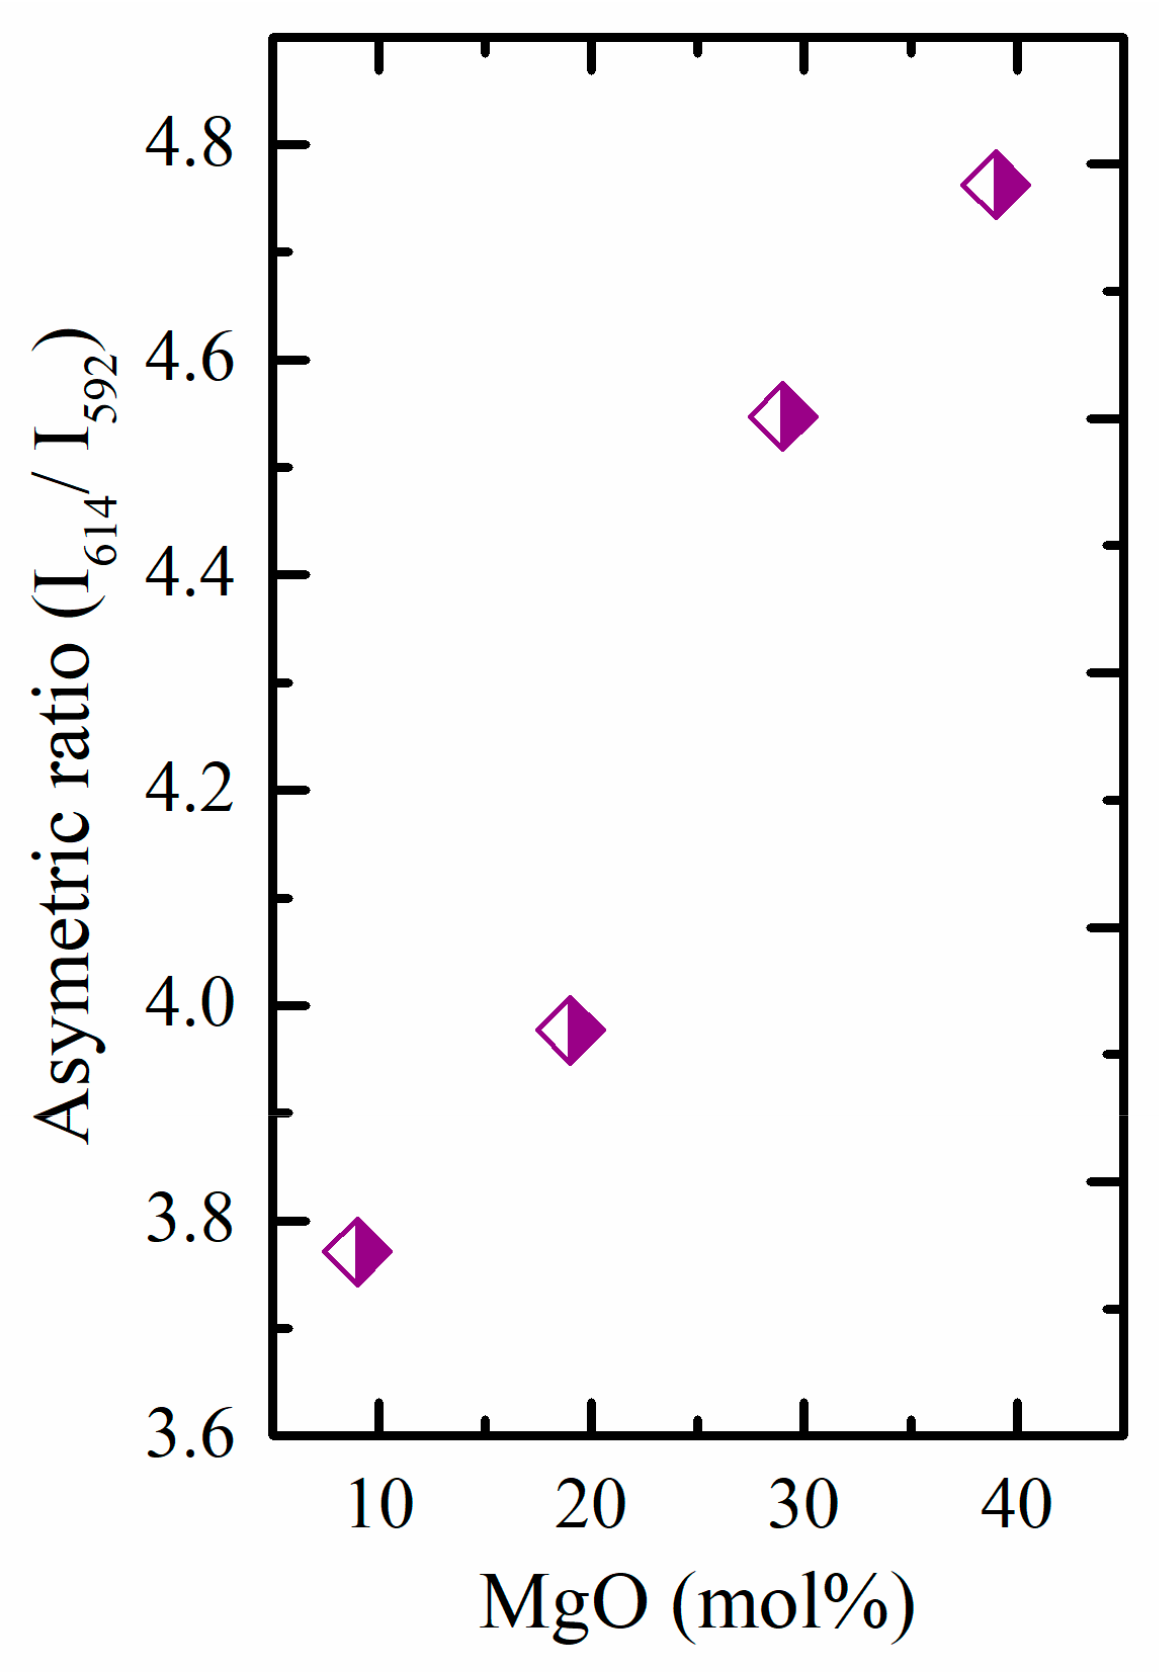
The spectra are dominated by the characteristic emission lines of Eu3+ ions, all originating from the 5D0 to different lower energy states at approximately 592, 614, 653, and 701 nm, corresponding to the energy states 7F0, 7F1, 7F2, 7F3, and 7F4, respectively [31,34,35,36]. Here again, the emission spectra do not show any shift with composition; however, variations in intensities can be observed. The total intensity increases with the MgO content. The intensity ratio (I614/I592) is known as the asymmetry ratio and was used as indication of structural changes [34,37]. The increase in the intensity of the hypersensitive transition (5D07F2) assisted by the increase observed for the asymmetry ratio indicates that the Eu-symmetry site decreases with increasing the MgO content (see Figure 6). The asymmetric ratio is compared to other Eu-doped glasses in Table 2. These structural modifications around Eu ions can be correlated to the increase in the proportion of TeO3 units (Figure 4b). The increase in TeO3 units is combined with an increase in non-bridging oxygen, which could also affect the Eu3+ environment.
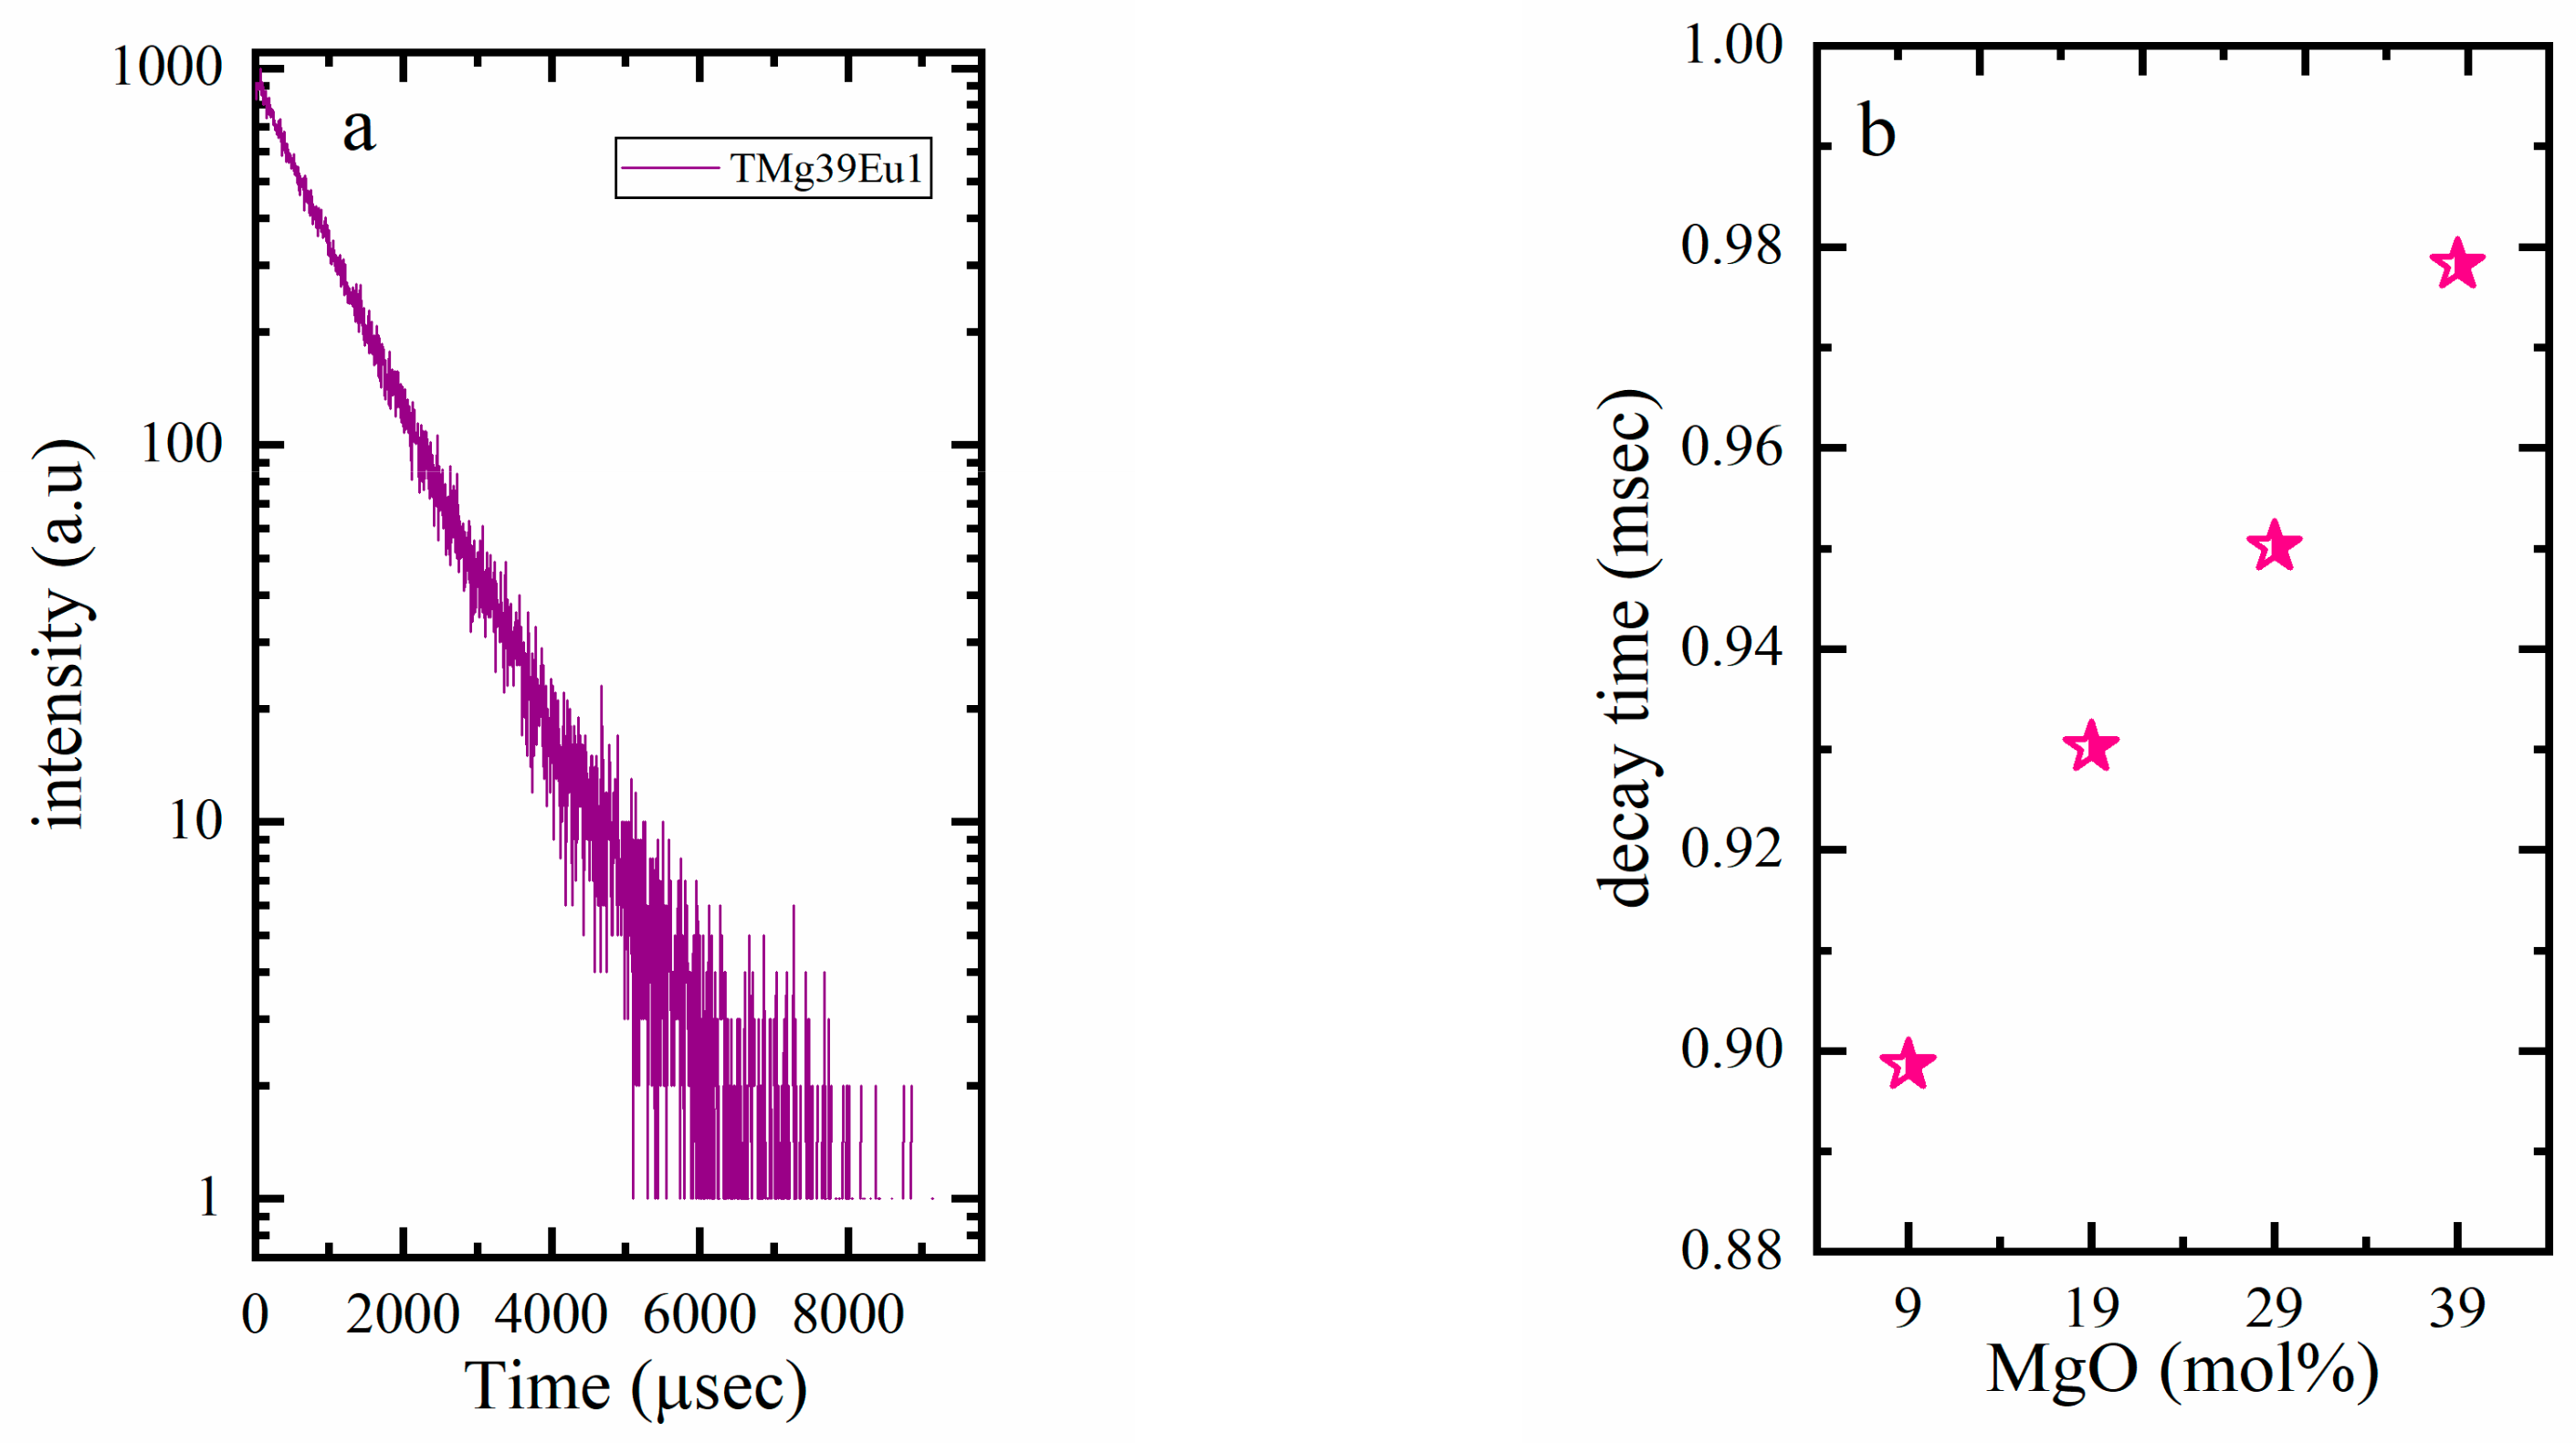
Figure 7a shows an example of the decay curves. The decay is found to have a single exponential and this behaviour suggests that the Eu3+ is homogeneously distributed in the glass host. The decay times (τ) were obtained and used to calculate the decay rate (decay rate = 1/τ (ms−1)) (see Figure 7b).
The enhancement of the intensity of the hypersensitive transition 5D07F2 (Figure 5b) and the lower decay rate (Table 1) are understood in terms of the low phonon energy of tellurite, as well as the decrease in the optical basicity of the glass host, as these lead to more ionicity around Eu ions. The decrease in the optical basicity (see, Table 1) of the glass arises not only from the lower basicity of MgO (0.69), which replaces TeO2 (0.95), but is also due to the lower basicity of the TeO3 units that formed upon increasing MgO, than that of TeO4 units. Optical basicity was calculated theoretically according to the following relation [45,46]:
^ th = X MgO ^ MgO + X TeO 2 ^ TeO 2 + X Eu 2 O 3 ^ Eu 2 O 3
where XMgO, XTeO2, and XEu2O3 are the oxygen equivalent fraction and ^ MgO and ^ TeO 2 are the optical basicity values of each oxide. ^MgO, ^TeO2, and ^Eu2O3 were taken as 0.69, 0.95, and 1.10, respectively [47,48].

3.2.2. Toward White Light Emission

Divalent europium Eu2+ has a broad emission due to the 4f65d→4f7 transition. This emission lies in the blue range and is strongly affected by any change in the ligand field of the host [35]. Figure 8 shows the emission spectra of Eu2+ ions for the prepared TMgxEu1 glass series excited at 330 nm. The emission of Eu2+ is almost constant and centered at ≈413 nm when compared with data reported for alkali phosphate excited using the same excitation wavelength [49], it was found to be lower in our case. A relationship between optical basicity and Eu2+ emission was proposed for phosphate, silicate, and borate glasses [35,49,50]; however, the current results show that tellurite glasses do not follow this relationship. Indeed, with an optical basicity almost double compared to silicates and phosphate, the Eu2+ emission in tellurite is at almost the same position.
Looking now at the intensity, it can be seen that the Eu3+ emission was enhanced compared to Eu2+ emission with increasing MgO content (Figure 8).
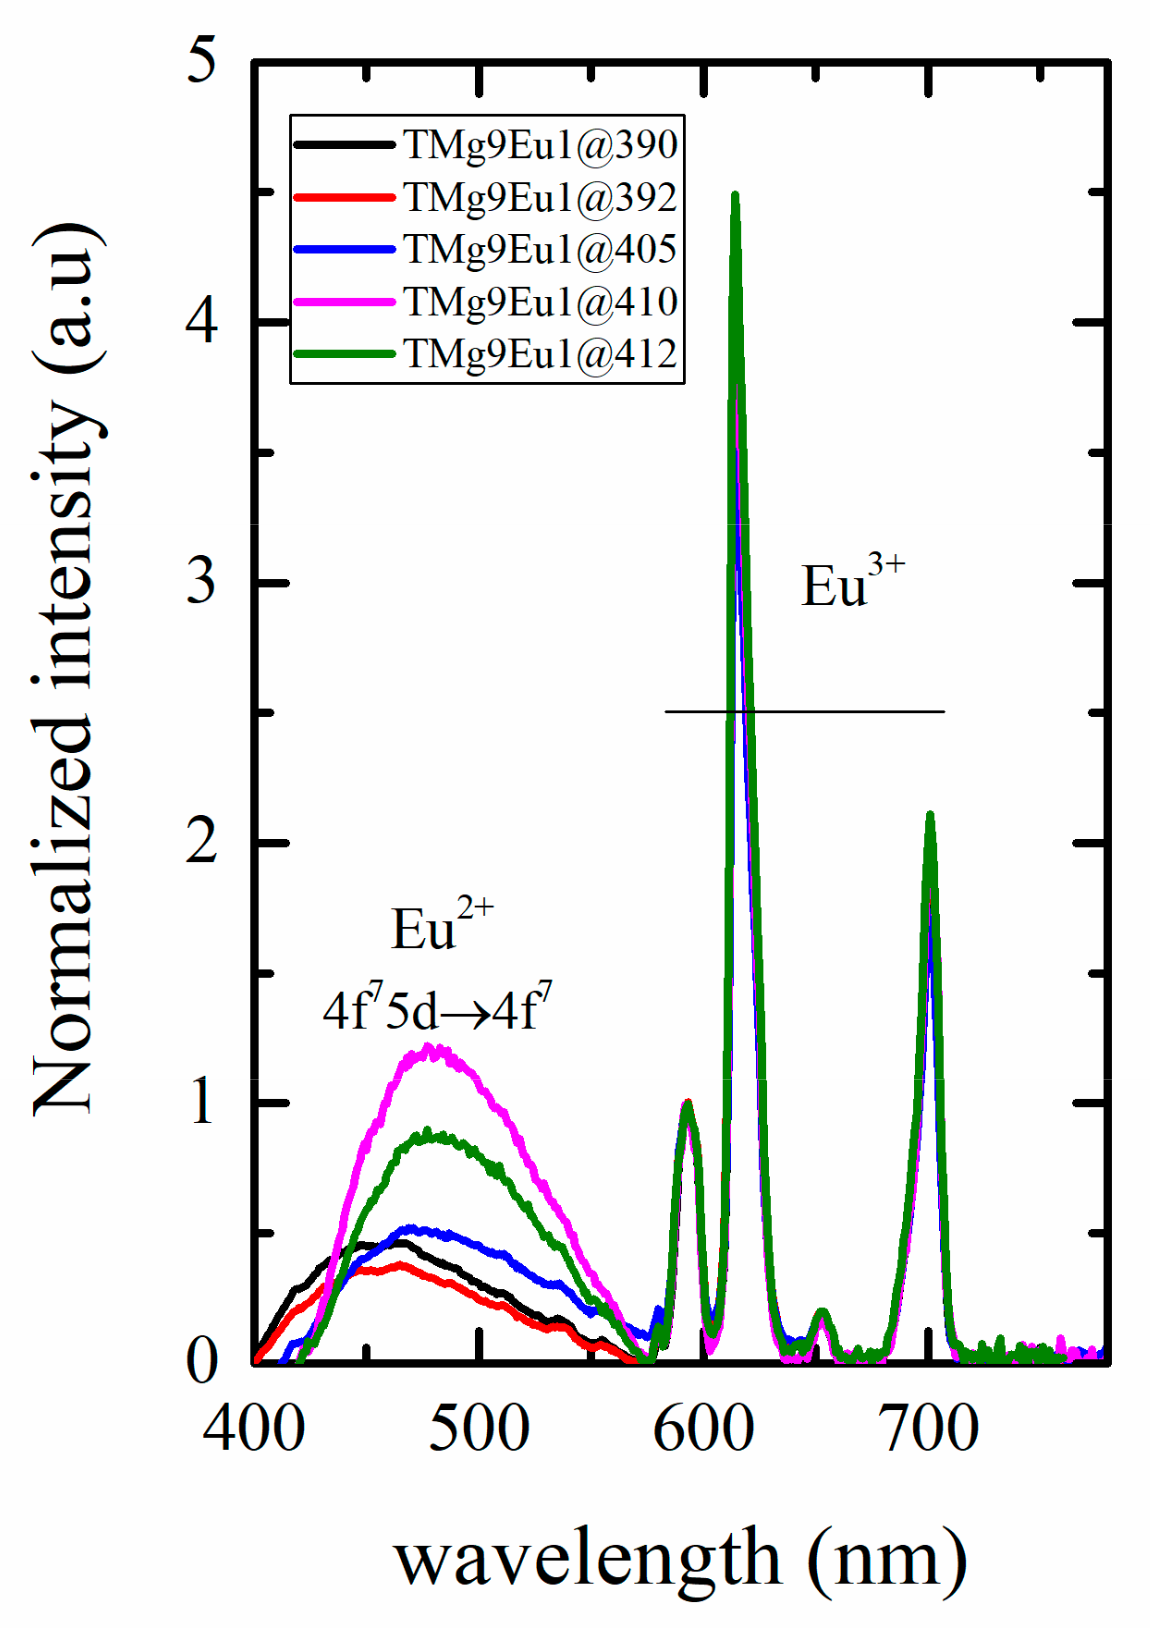
Figure 8b shows the ratio between Eu2+ and Eu3+ emissions at 413 nm and 592 nm, respectively. The emission at 592 nm was chosen because it is a pure magnetic transition that is not affected by any structural change around the RE ions. It can be used as a reference and its intensity is proportional to the Eu3+ concentration. This ratio decreases with increasing MgO content, which can be understood as being due to a change of the redox state of Eu or to a decrease of Eu2+ emission. It is known that the intensity and the position of Eu2+ can be affected by the ligand field, doping concentration, and by the excitation wavelength; therefore, we first discuss how it would be affected by the change in the excitation wavelength. Figure 9 shows an example of how the Eu2+ emission changes under different excitation wavelengths for the glass sample TMg9Eu1. The emission of Eu2+ was recorded along with that of Eu3+ over the range 430–780 nm under different excitation wavelengths. A shift toward a lower energy could be observed upon increasing the excitation wavelength. The emission shifts from 455 nm to 483 nm between an excitation at 390 and 412 nm.
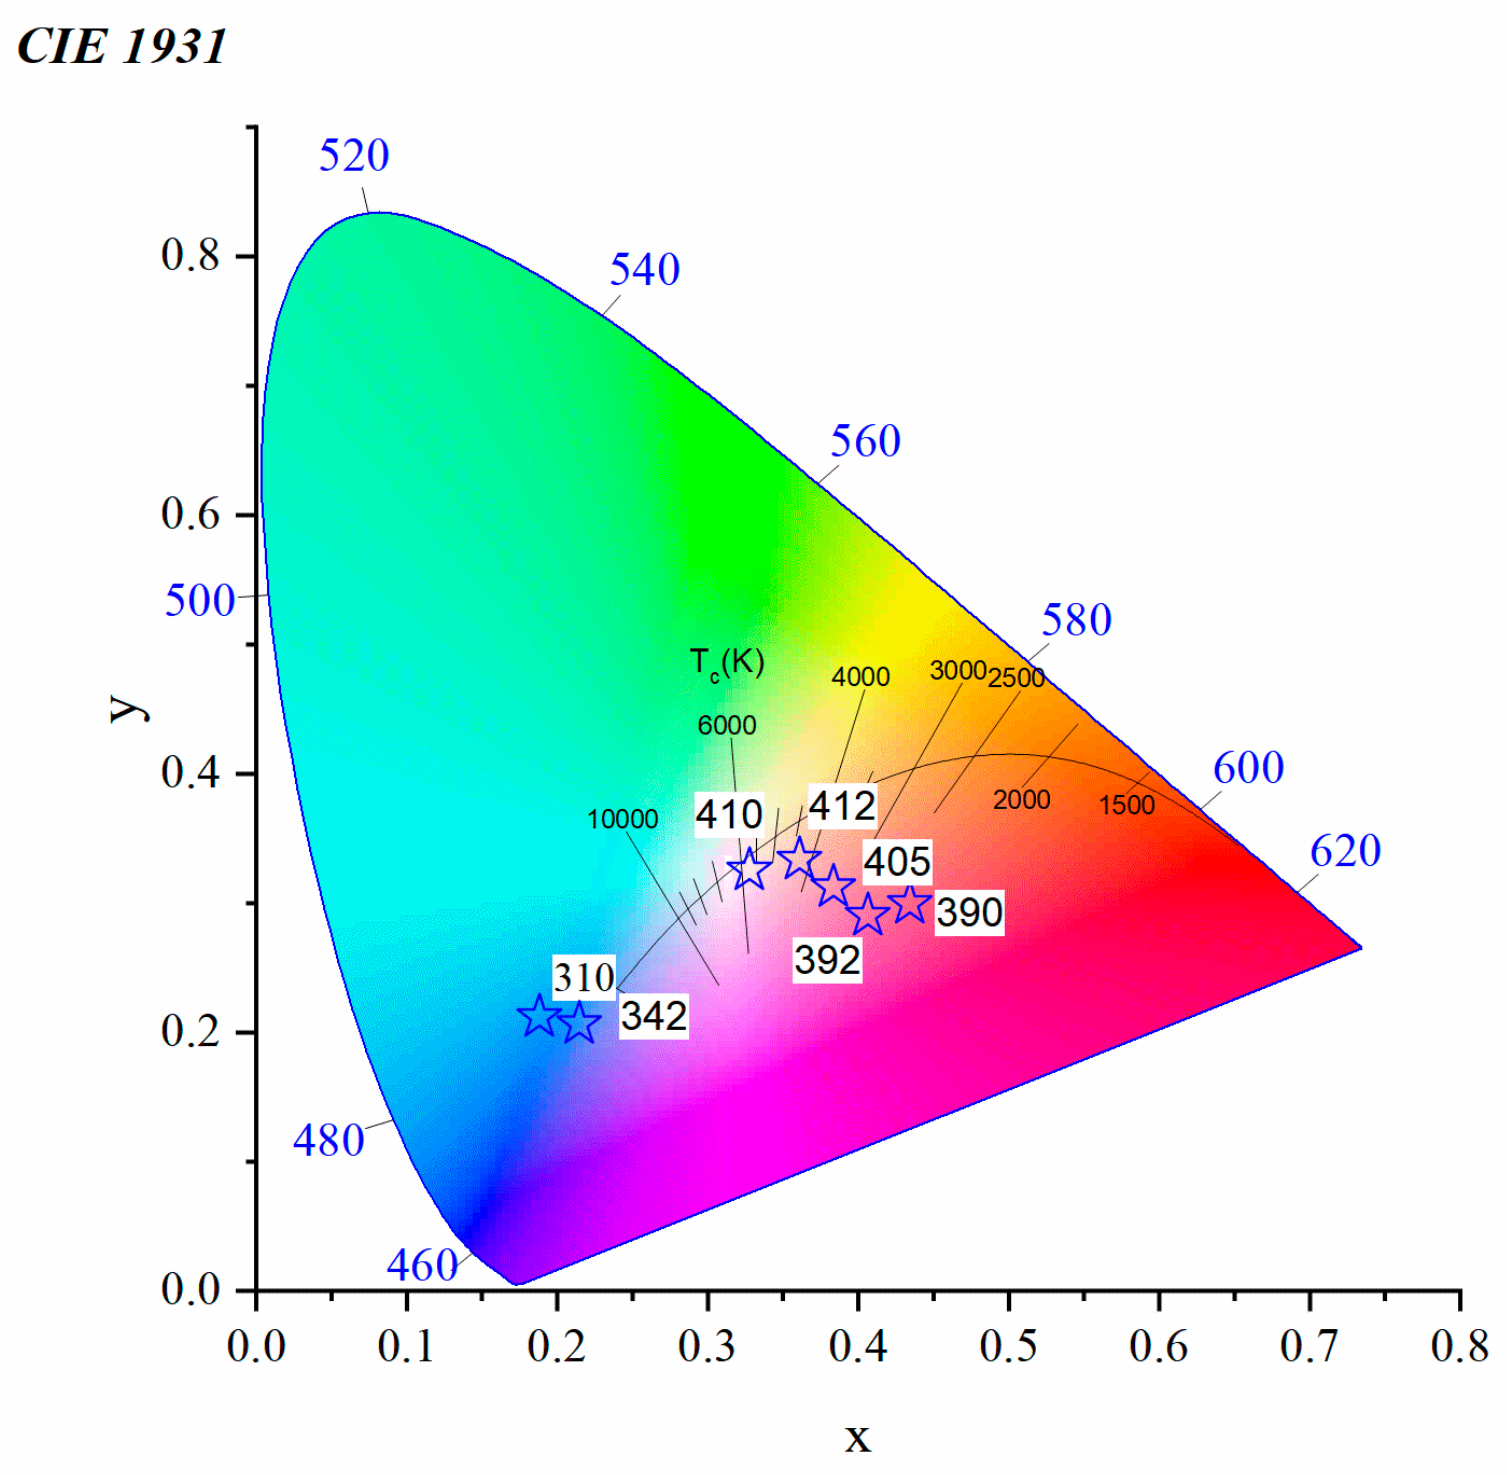
The Eu2+ emission intensity increases when the excitation is changed from 390 to 410 nm and then decreases with higher excitation, here 412 nm. The shift of the Eu2+ emission alone has a very small effect on the colour. However, the variation of the intensity ratio between the blue Eu2+ and the red Eu3+ provides us with a good chance to maintain white emission by tuning the excitation wavelength. From the spectra of Figure 9, the colour coordinate associated with each excitation can be computed as shown in Figure 10.
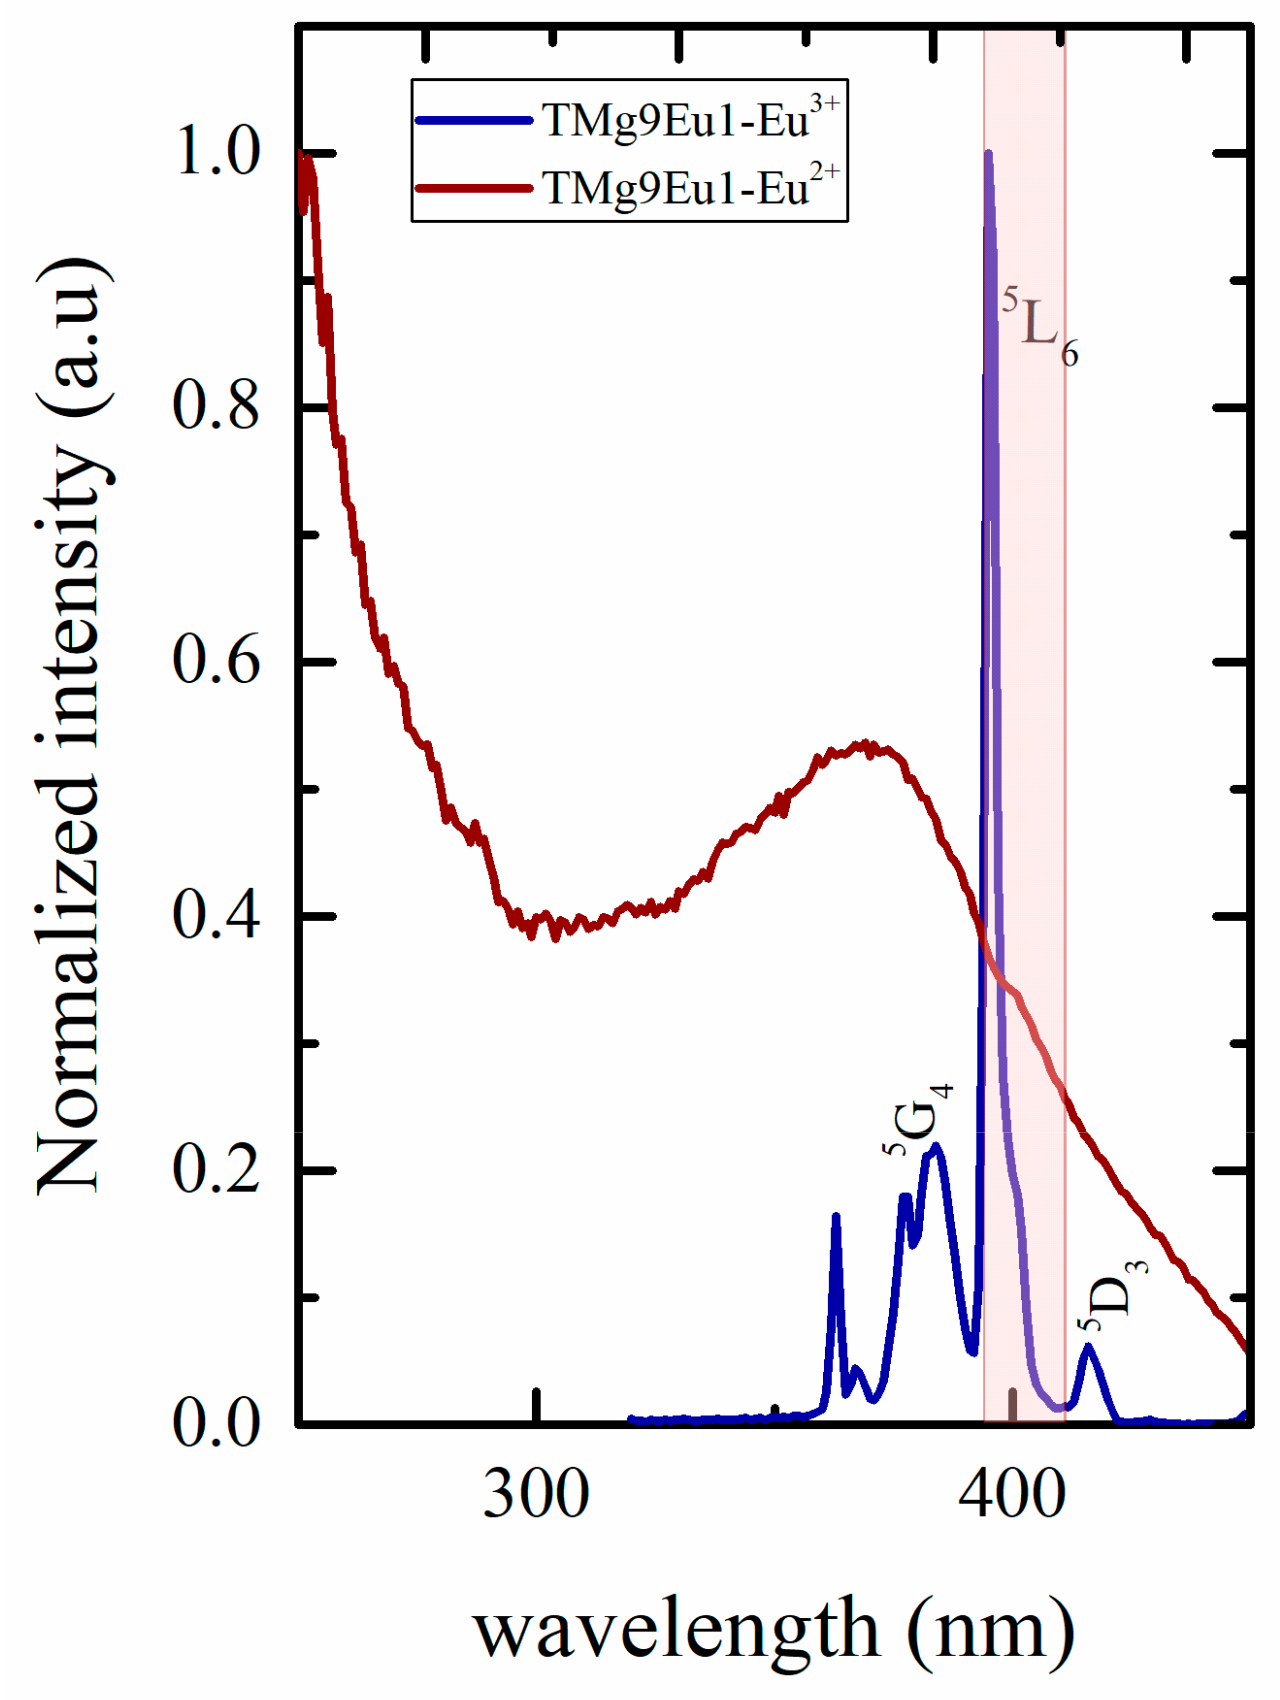
A low excitation wavelength (310, 342 nm) is out of any excitation lines for Eu3+ and the colour emitted is dominated by the blue Eu2+ emission. To understand better these variations of colours, excitation spectra for both ions are plotted in Figure 11, where the excitations from 392 to 412 nm are represented by the shaded region and exist on the edge of 7F05L6 excitation lines of Eu3+. The strong red emission of Eu3+ balances the blue emission of Eu2+ and the colour changes from the red to yellow-white region. The emission almost reaches the white light at 410 nm.
As excitation with 410 nm gives the highest intensity of Eu2+ emission and the emission falls in the white region. This wavelength was used to record the emission spectra for all of the glasses and here we can follow how the host will affect the emission under certain excitations (see Figure 12a). The spectra show that the Eu2+ emission’s relative intensity compared to the normalized Eu3+ emission decreases with increasing MgO content. No shift was observed for the position (≈485 nm). A similar trend is observed with an excitation at 330 nm in Figure 8a, but at a higher wavelength (≈485 nm) compared to that reported for Duran glasses (≈450 nm) [35]. The ratio between the intensity of Eu2+ emission to the pure magnetic transition of Eu3+ (I485/I592) indicates that the decrease in the intensity of the Eu2+ emission is associated with increase in the intensity of the hypersensitive transition of Eu3+ that could propose an energy transfer from Eu2+ to Eu3+ (see Figure 12b).
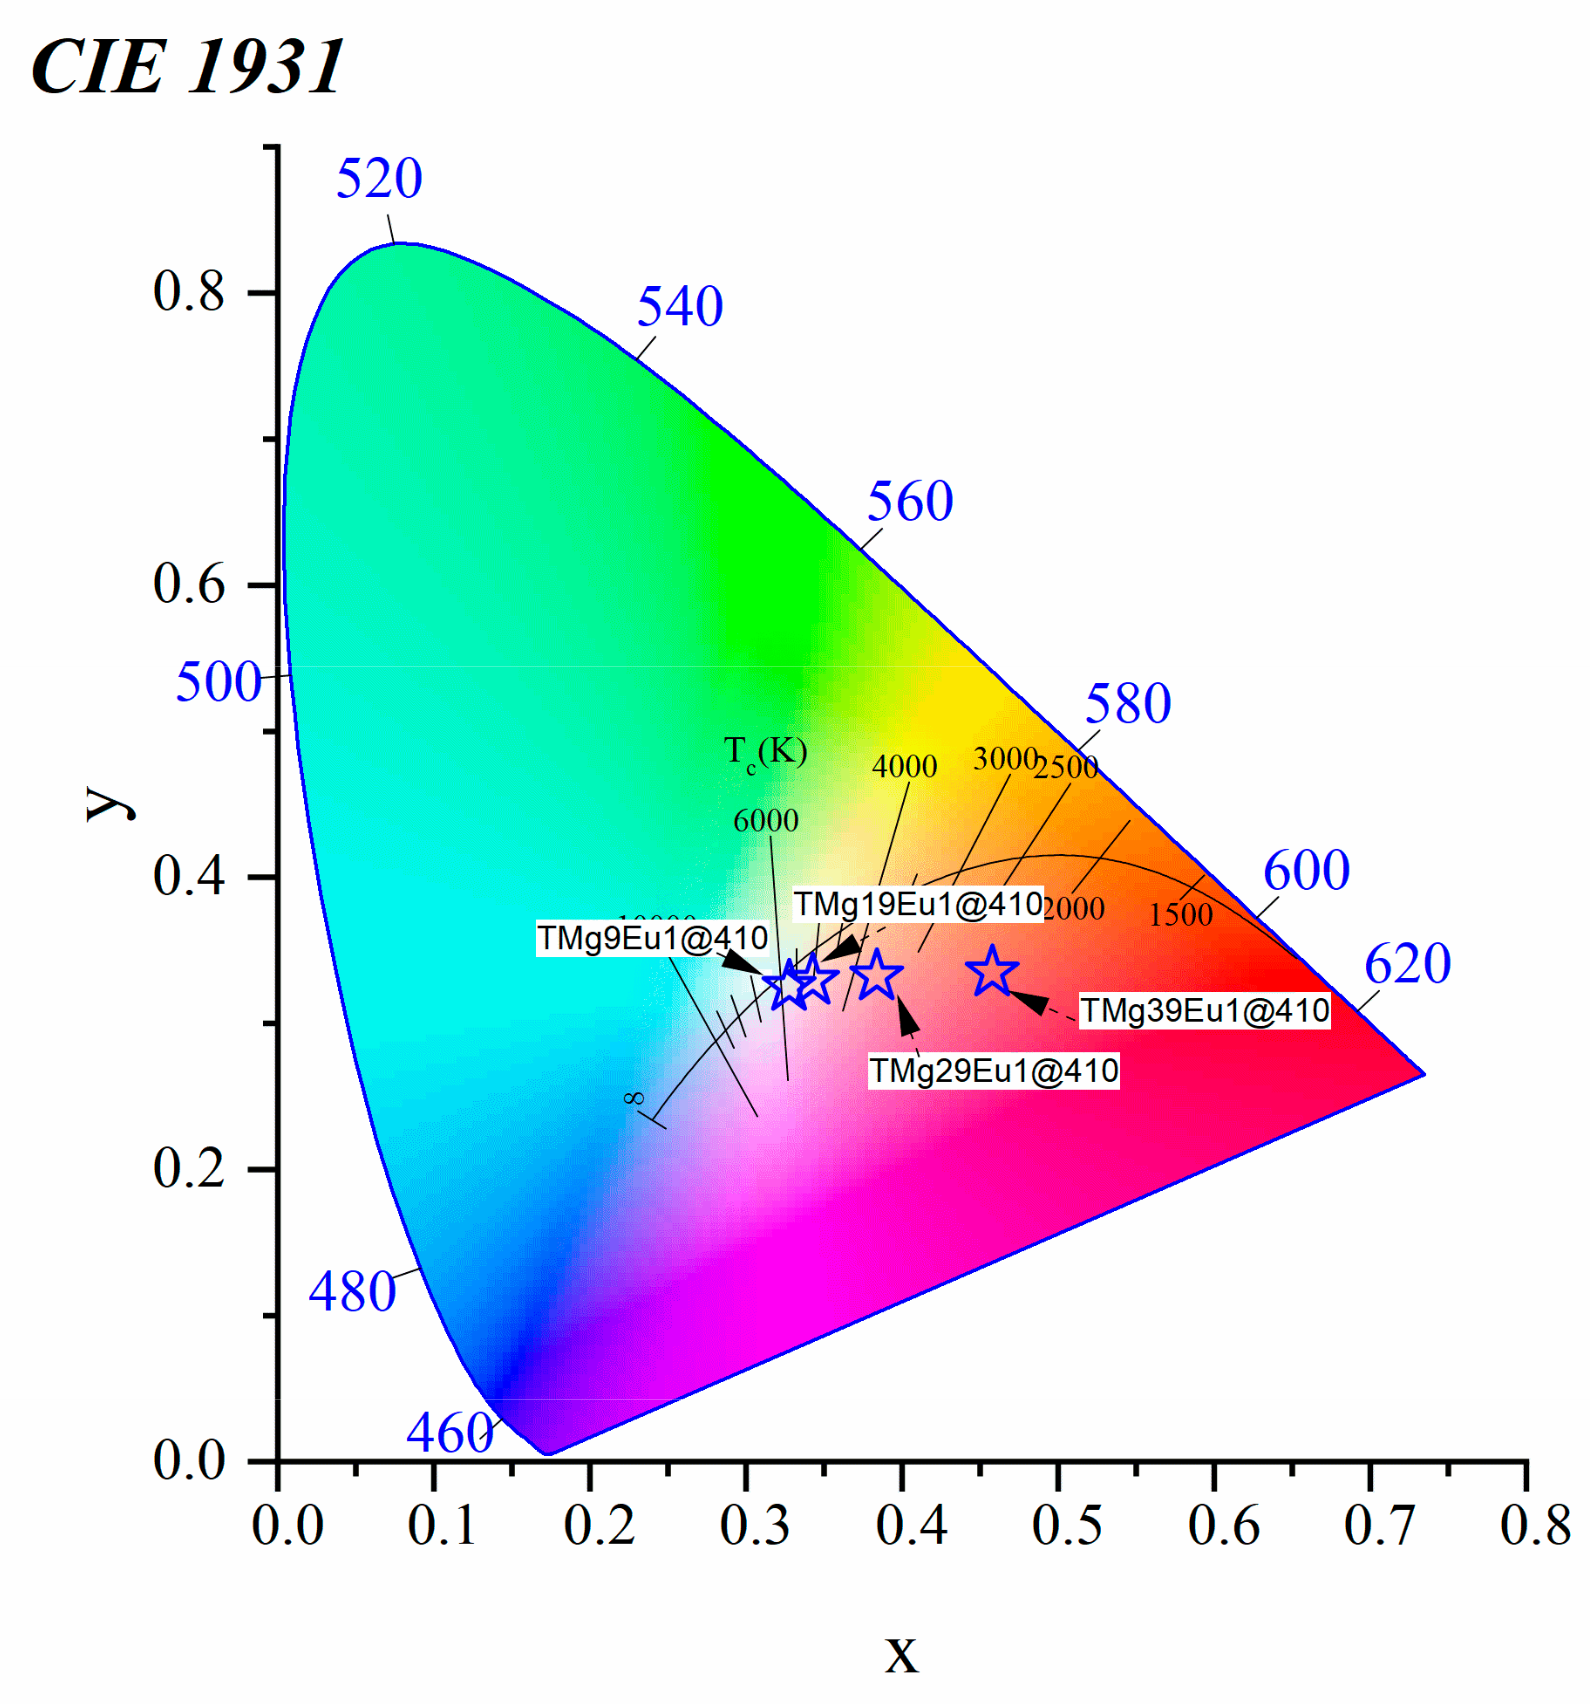
The evolution of the intensity ratio between Eu2+ and Eu3+ allows us to tune the emitted color of our glasses as previously seen but this time using glass chemistry. The colour coordinates were computed from the spectra of Figure 12a, and are reported in Figure 13. From the Commission International de I’Eclairage (CIE) diagram, it can be noticed that the TMg9Eu1 is almost in the cool white region with its x, y coordinates (0.32, 0.32). As MgO increases, the colour coordinates of the emission under an excitation at 410 nm shift away from the white to the red-orange region.

4. Conclusions

In this study, we performed a thermal, structural, and spectroscopic analysis of binary magnesium tellurite glasses doped with 1 mol% of Eu2O3. The amorphous nature of the prepared glasses was proven using X-ray diffraction spectroscopy. The increase in the glass transition temperature for the doped glass compared to the undoped is associated with the high bond enthalpy of Eu2O3. Attenuated total reflection spectroscopy was used to study the structural change of the glass host. The transformation of the TeO4 trigonal bipyramid structural units to TeO3 trigonal pyramid is found to be higher in the doped glasses than the undoped, especially at high MgO content. The low phonon energy of Te-glass, and the decrease of the optical basicity of the glass host, all lead to more iconicity around Eu-ions. This leads to the increase of the intensity of the hypersensitive transition at 614 nm of Eu3+ and the decrease in the decay rate with increasing MgO content. Both Eu2+ and Eu3+ emissions were examined under different excitation wavelengths and the relative intensity of Eu2+ compared to Eu3+ was the highest with λexc = 410 nm, leading to a white emission. By increasing MgO content, Eu2+ emission intensity decreases. The color coordinates indicate that the emission of the TMg9Eu1 glass sample lies almost in the white region and shifts to the red-orange region with increasing MgO content. The results show that a good balance between Eu2+ and Eu3+ in tellurite glasses leads to white light emission.

Author Contributions

H.E., preparation of glass, characterization, and first draft of the manuscript; H.O., supervision of the work, editing and review of the manuscript; I.H., supervision; M.I., supervision; D.d.L. supervision of the work, editing and review of the manuscript.

Funding

This research received no external funding.

Conflicts of Interest

The authors declare no conflicts of interest.

References

  1. Rolli, R.; Montagna, M.; Chaussedent, S.; Monteil, A.; Tikhomirov, V.; Ferrari, M. Erbium-doped tellurite glasses with high quantum efficiency and broadband stimulated emission cross section at 1.5 μm. Opt. Mater. 2003, 21, 743–748. [Google Scholar] [CrossRef] [Green Version]
  2. Hirashima, H.; Ide, M.; Yoshida, T. Memory switching of V2O5TeO2 glasses. J. Non-Cryst. Solids 1986, 86, 327–335. [Google Scholar] [CrossRef]
  3. Chen, F.; Xu, T.; Dai, S.; Nie, Q.; Shen, X.; Zhang, J.; Wang, X. Linear and non-linear characteristics of tellurite glasses within TeO2–Bi2O3–TiO2 ternary system. Opt. Mater. 2010, 32, 868–872. [Google Scholar] [CrossRef]
  4. Kaur, A.; Khanna, A.; Pesquera, C.; González, F.; Sathe, V. Preparation and characterization of lead and zinc tellurite glasses. J. Non-Cryst. Solids 2010, 356, 864–872. [Google Scholar] [CrossRef]
  5. Mahato, K.; Rai, S.; Rai, A. Optical studies of Eu3 doped oxyfluoroborate glass. Spectrochim Acta A 2004, 60, 979–985. [Google Scholar] [CrossRef]
  6. Kumar, G.M.; Bhaktha, B.S.; Rao, D.N. Self-quenching of spontaneous emission in Sm3 doped lead-borate glass. Opt. Mater. 2006, 28, 1266–1270. [Google Scholar] [CrossRef]
  7. Man, S.; Pun, E.; Chung, P. Tellurite glasses for 1.3 μm optical amplifiers. Opt. Commun. 1999, 168, 369–373. [Google Scholar] [CrossRef]
  8. Driesen, K.; Lenaerts, P.; Binnemans, K.; Görller-Walrand, C. Influence of heat treatment on the intensities of f–f transitions in lanthanide-doped sol–gel glasses. Phys. Chem. Chem. Phys. 2002, 4, 552–555. [Google Scholar] [CrossRef]
  9. Othman, H.; Arzumanyan, G.; Möncke, D. The influence of different alkaline earth oxides on the structural and optical properties of undoped, Ce-doped, Sm-doped, and Sm/Ce co-doped lithium alumino-phosphate glasses. Opt. Mater. 2016, 62, 689–696. [Google Scholar] [CrossRef]
  10. Othman, H.A.; Elkholy, H.S.; Hager, I.Z. Spectroscopic investigation of samarium-doped lead oxyflouroborate glasses using photo and cathode luminescence. Int. J. Appl. Glass Sci. 2016, 8, 313–321. [Google Scholar] [CrossRef]
  11. Xia, Z.; Zhang, Y.; Molokeev, M.S.; Atuchin, V.V. Structural and Luminescence Properties of Yellow-Emitting NaScSi2O6:Eu2 Phosphors: Eu2 Site Preference Analysis and Generation of Red Emission by Codoping Mn2 for White-Light-Emitting Diode Applications. J. Phys. Chem. C 2013, 117, 20847–20854. [Google Scholar] [CrossRef]
  12. Reisfeld, R.; Velapoldi, R.A.; Boehm, L.; Ish-Shalom, M. Transition probabilities of europium in phosphate glasses. J. Phys. Chem. 1971, 75, 3980–3983. [Google Scholar] [CrossRef]
  13. Capobianco, J.A.; Proulx, P.P.; Bettinelli, M.; Negrisolo, F. Absorption and emission spectroscopy ofEu3 in metaphosphate glasses. Phys. Rev. B 1990, 42, 5936–5944. [Google Scholar] [CrossRef] [PubMed]
  14. Farias, A.M.; Sandrini, M.; Viana, J.R.M.; Baesso, M.L.; Bento, A.C.; Rohling, J.H.; Guyot, Y.; Ligny, D.D.; Nunes, L.A.O.; Gandra, F.G.; et al. Emission tunability and local environment in europium-doped OH−-free calcium aluminosilicate glasses for artificial lighting applications. Mater. Chem. Phys. 2015, 156, 214–219. [Google Scholar] [CrossRef]
  15. Prasad, V.R.; Babu, S.; Ratnakaram, Y.C. Luminescence performance of Eu3 doped lead free zinc phosphate glasses for red emission. In AIP Conference Proceedings, International Conference on Condensed Matter and Applied Physics (ICC 2015); American Institute of Physics (AIP Publishing): Melville, NY, USA, 2016; Volume 1728, p. 020394. [Google Scholar] [CrossRef]
  16. Deopa, N.; Kaur, S.; Prasad, A.; Joshi, B.; Rao, A. Spectral studies of Eu3 doped lithium lead alumino borate glasses for visible photonic applications. Opt. Laser Technol. 2018, 108, 434–440. [Google Scholar] [CrossRef]
  17. Divina, R.; Suthanthirakumar, P.; Naseer, K.A.; Marimuthu, K. Luminescence studies on Eu3 ions doped telluroborate glasses for photonic applications. Dae Solid State Phys. Symp. 2018 2019. [Google Scholar] [CrossRef]
  18. Elkholy, H.; Othman, H.; Hager, I.; Ibrahim, M.; de Ligny, D. Thermal and optical properties of binary magnesium tellurite glasses and their link to the glass structure. J. Alloys Compd 2019. (under review). [Google Scholar]
  19. Luo, Y.-R. Comprehensive Handbook of Chemical Bond Energies; CRC Press: Boca Raton, FL, USA; p. 2007. [CrossRef]
  20. Langes Handbook of Chemistry, 12th ed.; Edited by John A. Dean. McGraw-Hill: New York, NY 1978; Volume 10020. J. Pharm. Sci. 1979, 68, 805–806. [CrossRef]
  21. Babu, S.S.; Jang, K.; Cho, E.J.; Lee, H.; Jayasankar, C.K. Thermal, structural and optical properties of Eu3 -doped zinc-tellurite glasses. J. Phys. D Appl. Phys. 2007, 40, 5767–5774. [Google Scholar] [CrossRef]
  22. Rada, S.; Culea, M.; Culea, E. Structure of TeO2·B2O3 glasses inferred from infrared spectroscopy and DFT calculations. J. Non-Cryst. Solids 2008, 354, 5491–5495. [Google Scholar] [CrossRef]
  23. Noguera, O.; Merle-Méjean, T.; Mirgorodsky, A.; Smirnov, M.; Thomas, P.; Champarnaud-Mesjard, J.-C. Vibrational and structural properties of glass and crystalline phases of TeO2. J. Non-Cryst. Solids 2003, 330, 50–60. [Google Scholar] [CrossRef]
  24. Rada, S.; Dan, V.; Rada, M.; Culea, E. Gadolinium-environment in borate–tellurate glass ceramics studied by FTIR and EPR spectroscopy. J. Non-Cryst. Solids 2010, 356, 474–479. [Google Scholar] [CrossRef]
  25. Gowda, V.V.; Reddy, C.N.; Radha, K.; Anavekar, R.; Etourneau, J.; Rao, K. Structural investigations of sodium diborate glasses containing PbO, Bi2O3 and TeO2: Elastic property measurements and spectroscopic studies. J. Non-Cryst. Solids 2007, 353, 1150–1163. [Google Scholar] [CrossRef]
  26. Jha, A.; Shen, S.; Naftaly, M. Structural origin of spectral broadening of 1.5-μm emission inEr3 -doped tellurite glasses. Phys. Rev. B 2000, 62, 6215–6227. [Google Scholar] [CrossRef]
  27. Rada, S.; Culea, M.; Culea, E. Toward Modeling Phosphate Tellurate Glasses: The Devitrification and Addition of Gadolinium Ions Behavior. J. Phys. Chem. A 2008, 112, 11251–11255. [Google Scholar] [CrossRef]
  28. Rada, S.; Culea, E.; Culea, M. Gadolinium doping of vanadate-tellurate glasses and glass ceramics. J. Mater. Sci. 2008, 43, 6480–6485. [Google Scholar] [CrossRef]
  29. Azianty, S.; Yahya, A. Enhancement of elastic properties by WO3 partial replacement of TeO2 in ternary (80−x)TeO2–20PbO–xWO3 glass system. J. Non-Cryst. Solids 2013, 378, 234–240. [Google Scholar] [CrossRef]
  30. Mohamed, E.; Ahmad, F.; Aly, K. Effect of lithium addition on thermal and optical properties of zinc–tellurite glass. J. Alloys Compd. 2012, 538, 230–236. [Google Scholar] [CrossRef]
  31. Rakpanich, S.; Wantana, N.; Ruangtaweep, Y.; Kaewkhao, J. Eu3+ doped borosilicate glass for solid-state luminescence material. JMMM 2017, 27, 35–38. [Google Scholar] [CrossRef]
  32. Kumar, M.V.; Jamalaiah, B.; Gopal, K.R.; Reddy, R. Novel Eu3 -doped lead telluroborate glasses for red laser source applications. J. Solid State Chem. 2011, 184, 2145–2149. [Google Scholar] [CrossRef]
  33. Ivankov, A.; Seekamp, J.; Bauhofer, W. Optical properties of Eu3 -doped zinc borate glasses. J. Lumin. 2006, 121, 123–131. [Google Scholar] [CrossRef]
  34. Kaur, S.; Jayasimhadri, M.; Rao, A. A novel red emitting Eu3 doped calcium aluminozincate phosphor for applications in w-LEDs. J. Alloys Compd. 2017, 697, 367–373. [Google Scholar] [CrossRef]
  35. Herrmann, A.; Fibikar, S.; Ehrt, D. Time-resolved fluorescence measurements on Eu3 - and Eu2 -doped glasses. J. Non-Cryst. Solids 2009, 355, 2093–2101. [Google Scholar] [CrossRef]
  36. Polisadova, E. Effects of matrix composition and Eu3 concentration on luminescence properties of phosphate glass. Funct. Mater. 2013, 20, 290–294. [Google Scholar] [CrossRef] [Green Version]
  37. You, H.; Nogami, M. Optical Properties and Local Structure of Eu3 Ions in Sol–Gel TiO2–SiO2 Glasses. J. Phys. Chem. B 2004, 108, 12003–12008. [Google Scholar] [CrossRef]
  38. Linganna, K.; Jayasankar, C. Optical properties of Eu3 ions in phosphate glasses. Spectrochim. Acta A 2012, 97, 788–797. [Google Scholar] [CrossRef] [PubMed]
  39. Venkatramu, V.; Babu, P.; Jayasankar, C. Fluorescence properties of Eu3 ions doped borate and fluoroborate glasses containing lithium, zinc and lead. Spectrochim. Acta A 2006, 63, 276–281. [Google Scholar] [CrossRef]
  40. Babu, S.S.; Babu, P.; Jayasankar, C.; Sievers, W.; Tröster, T.; Wortmann, G. Optical absorption and photoluminescence studies of Eu3 -doped phosphate and fluorophosphate glasses. J. Lumin. 2007, 126, 109–120. [Google Scholar] [CrossRef]
  41. Swapna, K.; Mahamuda, S.; Rao, A.S.; Sasikala, T.; Packiyaraj, P.; Moorthy, L.R.; Prakash, G.V. Luminescence characterization of Eu 3 doped Zinc Alumino Bismuth Borate glasses for visible red emission applications. J. Lumin. 2014, 156, 80–86. [Google Scholar] [CrossRef]
  42. Maheshvaran, K.; Marimuthu, K. Concentration dependent Eu3 doped boro-tellurite glasses—Structural and optical investigations. J. Lumin. 2012, 132, 2259–2267. [Google Scholar] [CrossRef]
  43. Pisarski, W.; Pisarska, J.; Mączka, M.; Ryba-Romanowski, W. Europium-doped lead fluoroborate glasses: Structural, thermal and optical investigations. J. Mol. Struct. 2006, 792, 207–211. [Google Scholar] [CrossRef]
  44. Marimuthu, K.; Karunakaran, R.; Babu, S.S.; Muralidharan, G.; Arumugam, S.; Jayasankar, C. Structural and spectroscopic investigations on Eu3 -doped alkali fluoroborate glasses. J. Solid State Sci. 2009, 11, 1297–1302. [Google Scholar] [CrossRef]
  45. Duffy, J.A.; Harris, B.; Kamitsos, E.I.; Chryssikos, G.D.; Yiannopoulos, Y.D. Basicity Variation in Network Oxides: Distribution of Metal Ion Sites in Borate Glass Systems. J. Phys. Chem. B 1997, 101, 4188–4192. [Google Scholar] [CrossRef]
  46. Duffy, J.A. A review of optical basicity and its applications to oxidic systems. Geochim. Cosmochim. Acta 1993, 57, 3961–3970. [Google Scholar] [CrossRef]
  47. Dimitrov, V.; Sakka, S. Electronic oxide polarizability and optical basicity of simple oxides. I. J. Appl. Phys 1996, 79, 1736–1740. [Google Scholar] [CrossRef]
  48. Dimitrov, V.; Komatsu, T. Communication: Group optical basicity of tellurite glasses. Phys. Chem. Glasses-B 2011, 52, 138–141. [Google Scholar]
  49. Cicconi, M.R.; Veber, A.; Ligny, D.D.; Rocherullé, J.; Lebullenger, R.; Tessier, F. Chemical tunability of europium emission in phosphate glasses. J. Lumin. 2017, 183, 53–61. [Google Scholar] [CrossRef]
  50. Wang, C.; Peng, M.; Jiang, N.; Jiang, X.; Zhao, C.; Qiu, J. Tuning the Eu luminescence in glass materials synthesized in air by adjusting glass compositions. Mater. Lett. 2007, 61, 3608–3611. [Google Scholar] [CrossRef]
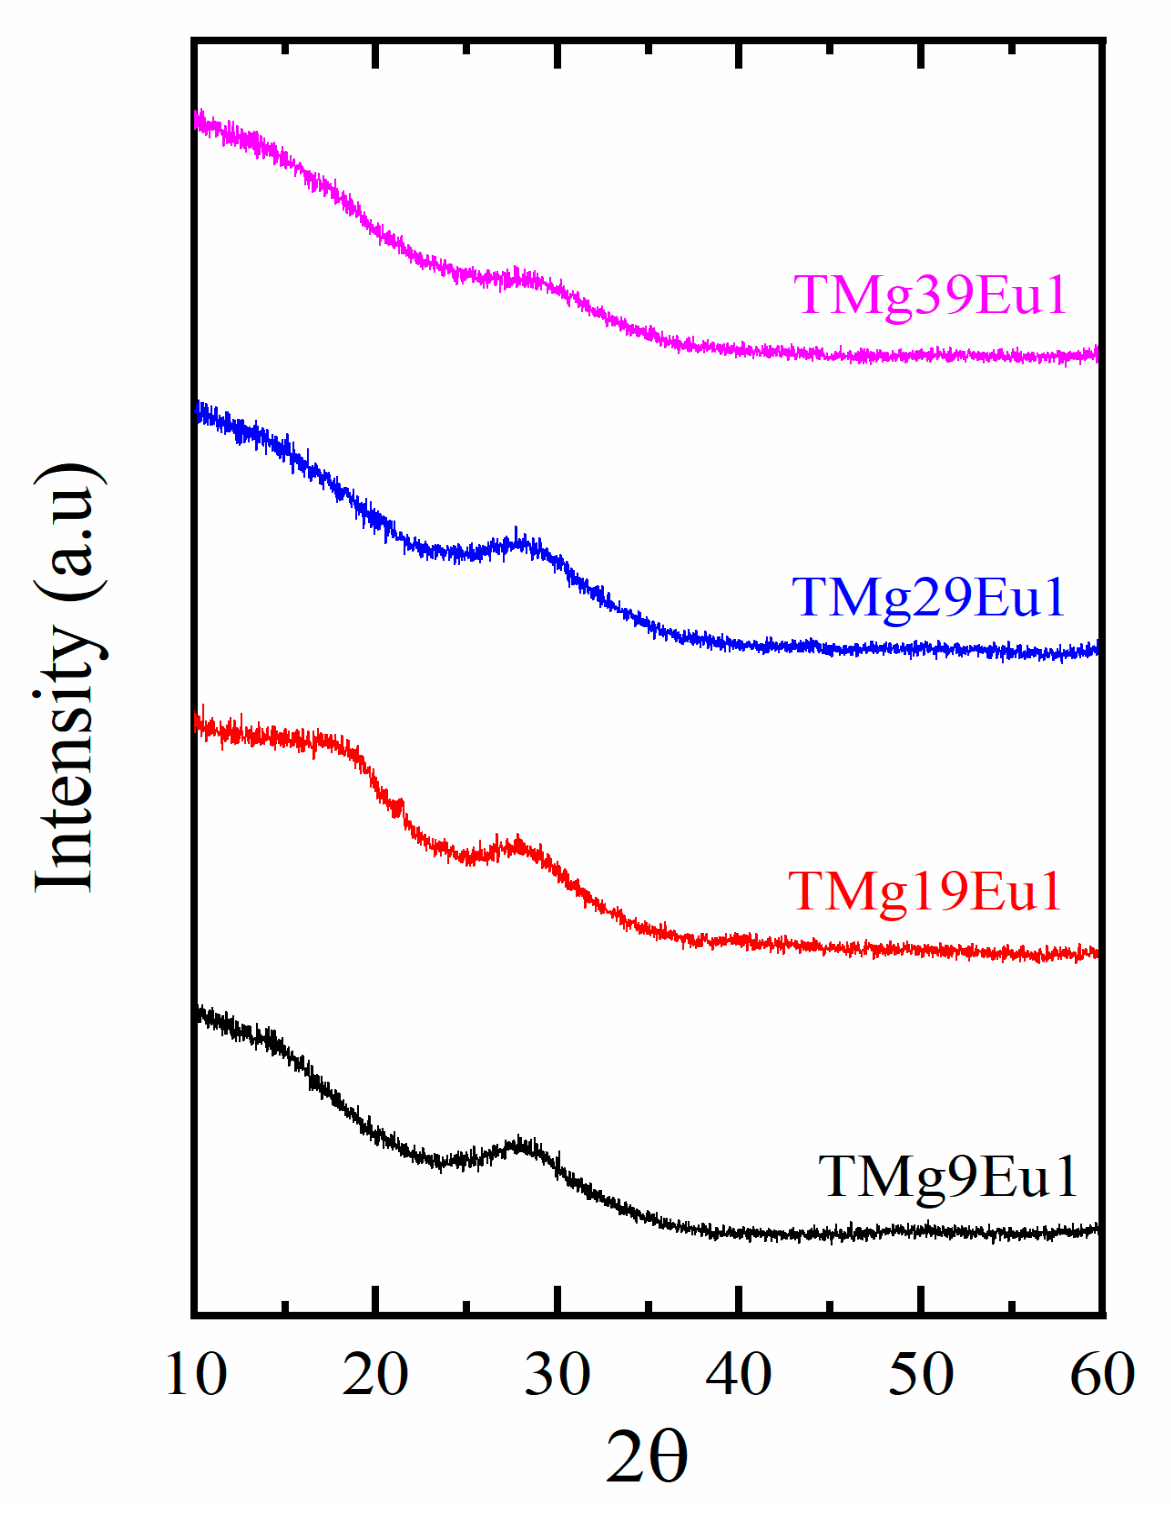
Figure 1. XRD spectra of the prepared (xTeO2-(99-x)MgO-1Eu2O3) glasses.
Materials 12 04140 g001
Figure 2. Differential scanning calorimetry (DSC) spectra for Tg of (xTeO2-(99-x)MgO-1Eu2O3) glasses.
Materials 12 04140 g002
Figure 3. Attenuation of Total Reflectance (ATR) transmission spectra: (a) for the (TMgx) undoped series; (b) for the (TMgxEu1) doped series. The peak position of the TeO3 with the non-bridging oxygen (NBOs) line was fixed at 760 cm−1, the TeO3 at 700 cm−1, and TeO4 at 580 cm−1.
Materials 12 04140 g003
Figure 4. This figure shows: (a) An example of the deconvoluted ATR spectra; (b) the change in the area of the envelope related to the TeO4 (A4) to the total area (A4 + A3).
Materials 12 04140 g004
Figure 5. (a) Excitation spectra of Eu3+ at λem = 614 nm; (b) Emission spectra for Eu3+ at λex = 392 nm for the prepared glasses.
Materials 12 04140 g005
Figure 6. Graphic of the asymmetry ratio (I614/I592) of the prepared glasses.
Materials 12 04140 g006
Figure 7. Graphic of (a) an example of the decay spectra; (b) the decay time of the prepared glasses.
Materials 12 04140 g007
Figure 8. Graphics of (a) normalized emission spectra for the prepared glasses under λex = 330 nm; (b) the ratio between the Eu2+ to Eu3+ emission at 413 nm of Eu2+and emission at 592 nm of Eu3+.
Materials 12 04140 g008
Figure 9. Normalized emission spectra of the TMg9Eu1 glass sample under different excitation wavelengths. The normalization is done to the pure magnetic transition of Eu3+ at 592 nm.
Materials 12 04140 g009
Figure 10. Commission International de I’Eclairage (CIE) 1931 chromaticity diagram of a TMg9Eu1 glass sample under different excitation wavelengths.
Materials 12 04140 g010
Figure 11. Superposition of the normalized excitation spectra of Eu2+ and Eu3+; shaded region represents the tuning excitation region that was used to reach the white color.
Materials 12 04140 g011
Figure 12. Graphic of (a) normalized emission spectra of the prepared glasses at λex = 410 nm; (b) intensity ratio of Eu2+ emission (480 nm) to that of the pure magnetic transition of Eu3+ emission (592 nm).
Materials 12 04140 g012
Figure 13. CIE 1931 chromaticity diagram for the prepared glasses at λex = 410 nm.
Materials 12 04140 g013
Table 1. Sample key, glass composition, glass transition temperature Tg (°C), optical basicity (^th) and decay rate (ms−1).
Sample KeyCompositionTg ± 1.5 °C1 Tg* ± 1.5 °C^thDecay Rate (ms−1)
TMg9Eu190TeO2-9MgO-1Eu2O33353250.9401.113
TMg19Eu180TeO2-19MgO-1Eu2O33603540.9251.075
TMg29Eu170TeO2-29MgO-1Eu2O34333780.9091.052
TMg39Eu160TeO2-39MgO-1Eu2O34524500.8901.022
1 Tg*: for the undoped corresponding glasses, see our previous work [18].
Table 2. The asymmetric ratio (R) of the prepared glasses and other reference values for other Eu-doped glasses.
Sample KeyR (5D07F2/5D07F1)Reference
TMg9Eu13.77Current study
TMg19Eu13.98Current study
TMg29Eu14.55Current study
TMg39Eu14.76Current study
PKSAEu104.43[38]
PbFBEu103.92[39]
PKBFAEu104.69[40]
LiPbAlBEu32.024[16]
LiPbAlBEu72.468[16]
ZnAlBiBEu0.11.951[41]
ZnAlBiBEu2.52.78[41]
BTeMgKEu14.12[42]
BTeMgKEu24.24[42]
BTeMgKEu34.14[42]
PbFBAlWEu12.30[43]
TeZnNaLiNbEu13.73[44]