Article

Influence of Crystallite Size on the Magnetic Order in Semiconducting ZnCr2Se4 Nanoparticles

1
Institute of Chemistry, University of Silesia, 40-007 Katowice, Poland
2
Institute of Material Science, University of Silesia, 40-007 Katowice, Poland
3
Institute of Physics, University of Silesia, 40-007 Katowice, Poland
*
Author to whom correspondence should be addressed.
Materials 2019, 12(23), 3947; https://doi.org/10.3390/ma12233947
Submission received: 24 October 2019 / Revised: 13 November 2019 / Accepted: 26 November 2019 / Published: 28 November 2019
(This article belongs to the Section Materials Physics)

Abstract

:
Structural, electrical, magnetic, and specific heat measurements were carried out on ZnCr2Se4 single crystal and on nanocrystals obtained from the milling of this single crystal after 1, 3, and 5 h, whose crystallite sizes were 25.2, 2.5, and 2 nm, respectively. For this purpose, the high-energy ball-milling method was used. The above studies showed that all samples have a spinel structure, and are p-type semiconductors with less milling time and n-type with a higher one. In turn, the decrease in crystallite size caused a change in the magnetic order, from antiferromagnetic for bulk material and nanocrystals after 1 and 3 h of milling to spin-glass with the freezing temperature Tf = 20 K for the sample after 5 h of milling. The spin-glass behavior for this sample was derived from a broad peak of dc magnetic susceptibility, a splitting of the zero-field-cooling and field-cooling susceptibilities, and from the shift of Tf towards the higher frequency of the ac susceptibility curves. A spectacular result for this sample is also the lack of a peak on the specific heat curve, suggesting a disappearance of the structural transition that is observed for the bulk single crystal.

1. Introduction

The search for new materials for applications in thermoelectric devices is becoming more and more popular. Seleno-spinels are interesting compounds useful for this purpose [1,2,3], possessing a large cubic cell with an edge of 10 Å, a large ion radius of selenium (198 pm [4]), and strong covalence [5]. Pure ZnCr2Se4 in both mono and polycrystalline form is a p-type semiconductor, has a helical antiferromagnetic structure (AFM) below the Néel temperature TN = 20 K, and a strong ferromagnetic component (FM), as evidenced by the high positive Curie–Weiss temperature (θ) of 115 K [6,7]. At TN temperature, there is a structural phase transition from cubic Fd-3m to tetragonal symmetry I41/amd with slight contraction along the c axis [8,9]. ZnCr2Se4 is a normal spinel in which zinc ions occupy tetrahedral sites and chromium ions occupy octahedral ones. Replacing one element with another or adding another element can strongly affect the physico-chemical properties of the matrix [10,11,12,13,14].
Recently, a CuCr2S4 spinel was obtained from pure elements Cu, Cr, and S by mechanical alloying (MA), whose crystallite size was on the order of 2.8 nm [15]. This method showed that, instead of the classic metallic ferromagnet, we received an antiferromagnetic semiconductor also with a spinel structure. Moreover, spin frustration for further Cr–Cr ion coordination spheres was observed [15].
In the present work, we obtained ZnCr2Se4 nanopowders, by the high-energy ball-milling method, from the milling of the ZnCr2Se4 single crystal after 1, 3, and 5 h. Structural, magnetic, electronic transport, and specific heat studies were carried out on the single crystal and nanopowder samples. We expect these studies to show that obtaining nanoscale ZnCr2Se4 crystallites will significantly change their physical properties.

2. Materials and Methods

The nanosized crystallites of ZnCr2Se4 spinel were made with the use of the high-energy ball-milling (HEBM) method. The starting materials for the HEBM method were single crystalline samples to avoid impurity phases, whose lack was confirmed by powder X-ray diffraction studies.
Single crystals of ZnCr2Se4 were grown by chemical vapor transport technique with the anhydrous chromium chloride as the carrier agent. A stoichiometric mixture of the selenide ZnSe and transporting agent CrCl3 were enclosed in evacuated (~10−3 Pa) and sealed quartz ampoules (a length of about 200 mm and an inner diameter of 20 mm). The ampoules were heated in a two-zone gradient furnace for 3 weeks. The optimal temperatures at the crystallization and melting zones were between 1123 and 1223 K, respectively. The right choice of transport conditions resulted in obtaining good quality octahedral crystals with surface types (111).
Milling was carried out in PULVERISETTE 7 premium line Planetary Ball Mill (Fritsch, Germany) at room temperature with stainless steel vessels and balls (5 mm). Single crystals were milled up to 5 h at the speed of 500 rpm with a 10:1 ball-to-crystals ratio in dry conditions. Milling of single crystals was carried out under a protective argon (Ar) atmosphere.
The powders obtained after 1, 3, and 5 h of milling were characterized by X-ray diffraction technique (Empyrean, PANalytical, Almelo, Netherlands) and scanning electron microscopy (SEM).
The X-ray diffraction experiment was performed with the Empyrean PANalytical Diffractometer with copper radiation (λCu = 1.5418 Å) and PIXcel counter. The phase analyses were performed with the ICDD PDF4+ 2017 crystallographic database. The determination of unit cell parameters, crystallite sizes, and lattice strain values, as well as qualitative phase analysis, were refined by the use of the High Score Plus PANalytical software (HSP version 3.0, PANalytical, Almelo, Netherlands) based on the Williamson–Hall theory [16] and Rietveld refinement [17,18]. The scheme of analyses, conditions, and accuracy of methods were presented in detail in, among other works [19,20].
The morphology of the powders was studied by the use of a scanning electron microscope (SEM) (Jeol JSM-6480) (JEOL Ltd, Tokyo, Japan).
The electrical conductivity σ(T) was measured in the 74–410 K temperature range using the dc method and KEITHLEY 6517B Electrometer/High Resistance Meter (Keithley Instruments, LLC, Solon, OH, USA). The thermoelectric power S(T) was measured in the temperature range of 100–400 K by a Seebeck Effect Measurement System (MMR Technologies, Inc., San Jose, CA, USA). The static dc magnetic susceptibility was measured in both the zero-field cooled (ZFC) and the field-cooled (FC) modes in the magnetic field Hdc = 1 kOe. The calculations of the effective magnetic moment, and the method of preparation of powder samples for measurements of electrical conductivity and thermopower, are described in detail in [15,21,22,23]. Magnetization isotherms were measured at 2, 10, 20, 40, 60, and 300 K in applied external fields up to 70 kOe. Magnetization and dc magnetic susceptibility were carried out in the temperature range of 2–300 K using a Quantum Design MPMS-XL-7AC SQUID magnetometer (Quantum Design, San Diego, CA, USA). For ac magnetic susceptibility in the frequency range 300 Hz–10 kHz, and with specific heat measurements, a Quantum Design Physical Properties Measurement System (QD-PPMS) (Quantum Design, San Diego, CA, USA) was used. The superexchange integrals for the first two coordination spheres J1 and J2 were calculated with the aid of the Holland and Brown equations: J1 = (−9TN + θ)/60 and J2 = (3TN + θ)/120 [24]. The exchange constant JSG of the spin-glass system was estimated using the random energy model [25,26,27] by the expression: JSG = Tf⋅(4⋅ln2)1/2 [25].

3. Results and Discussion

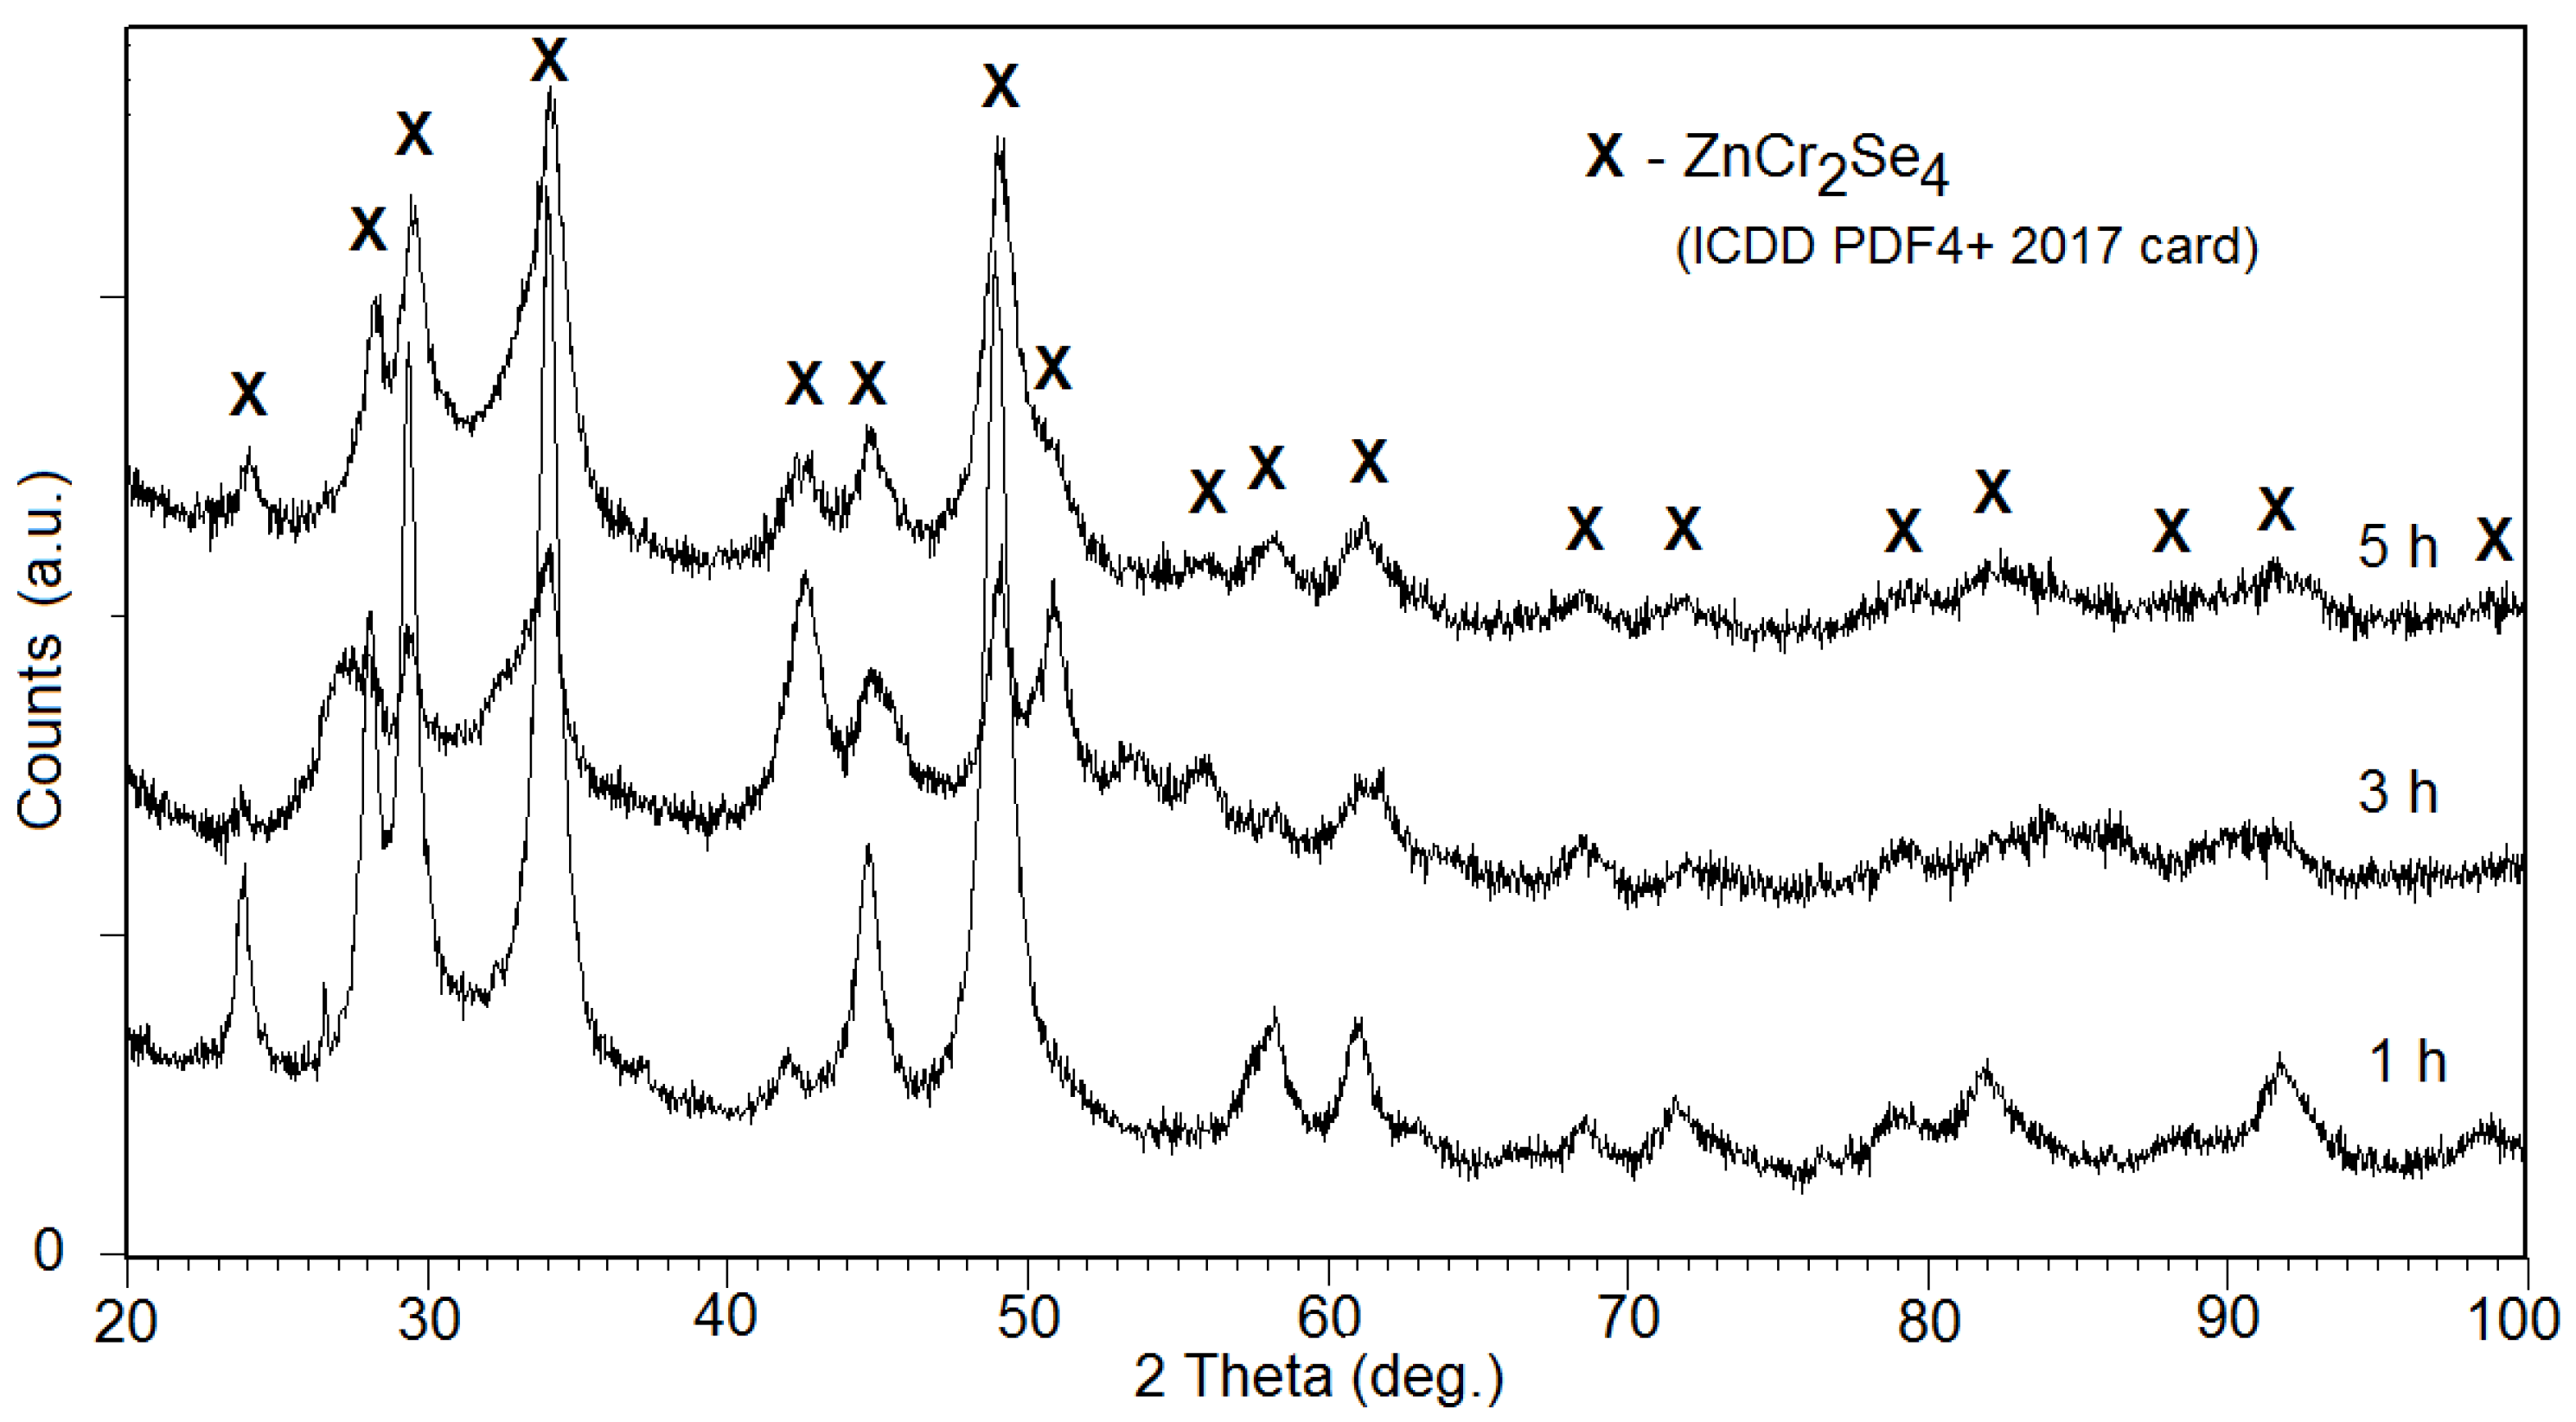
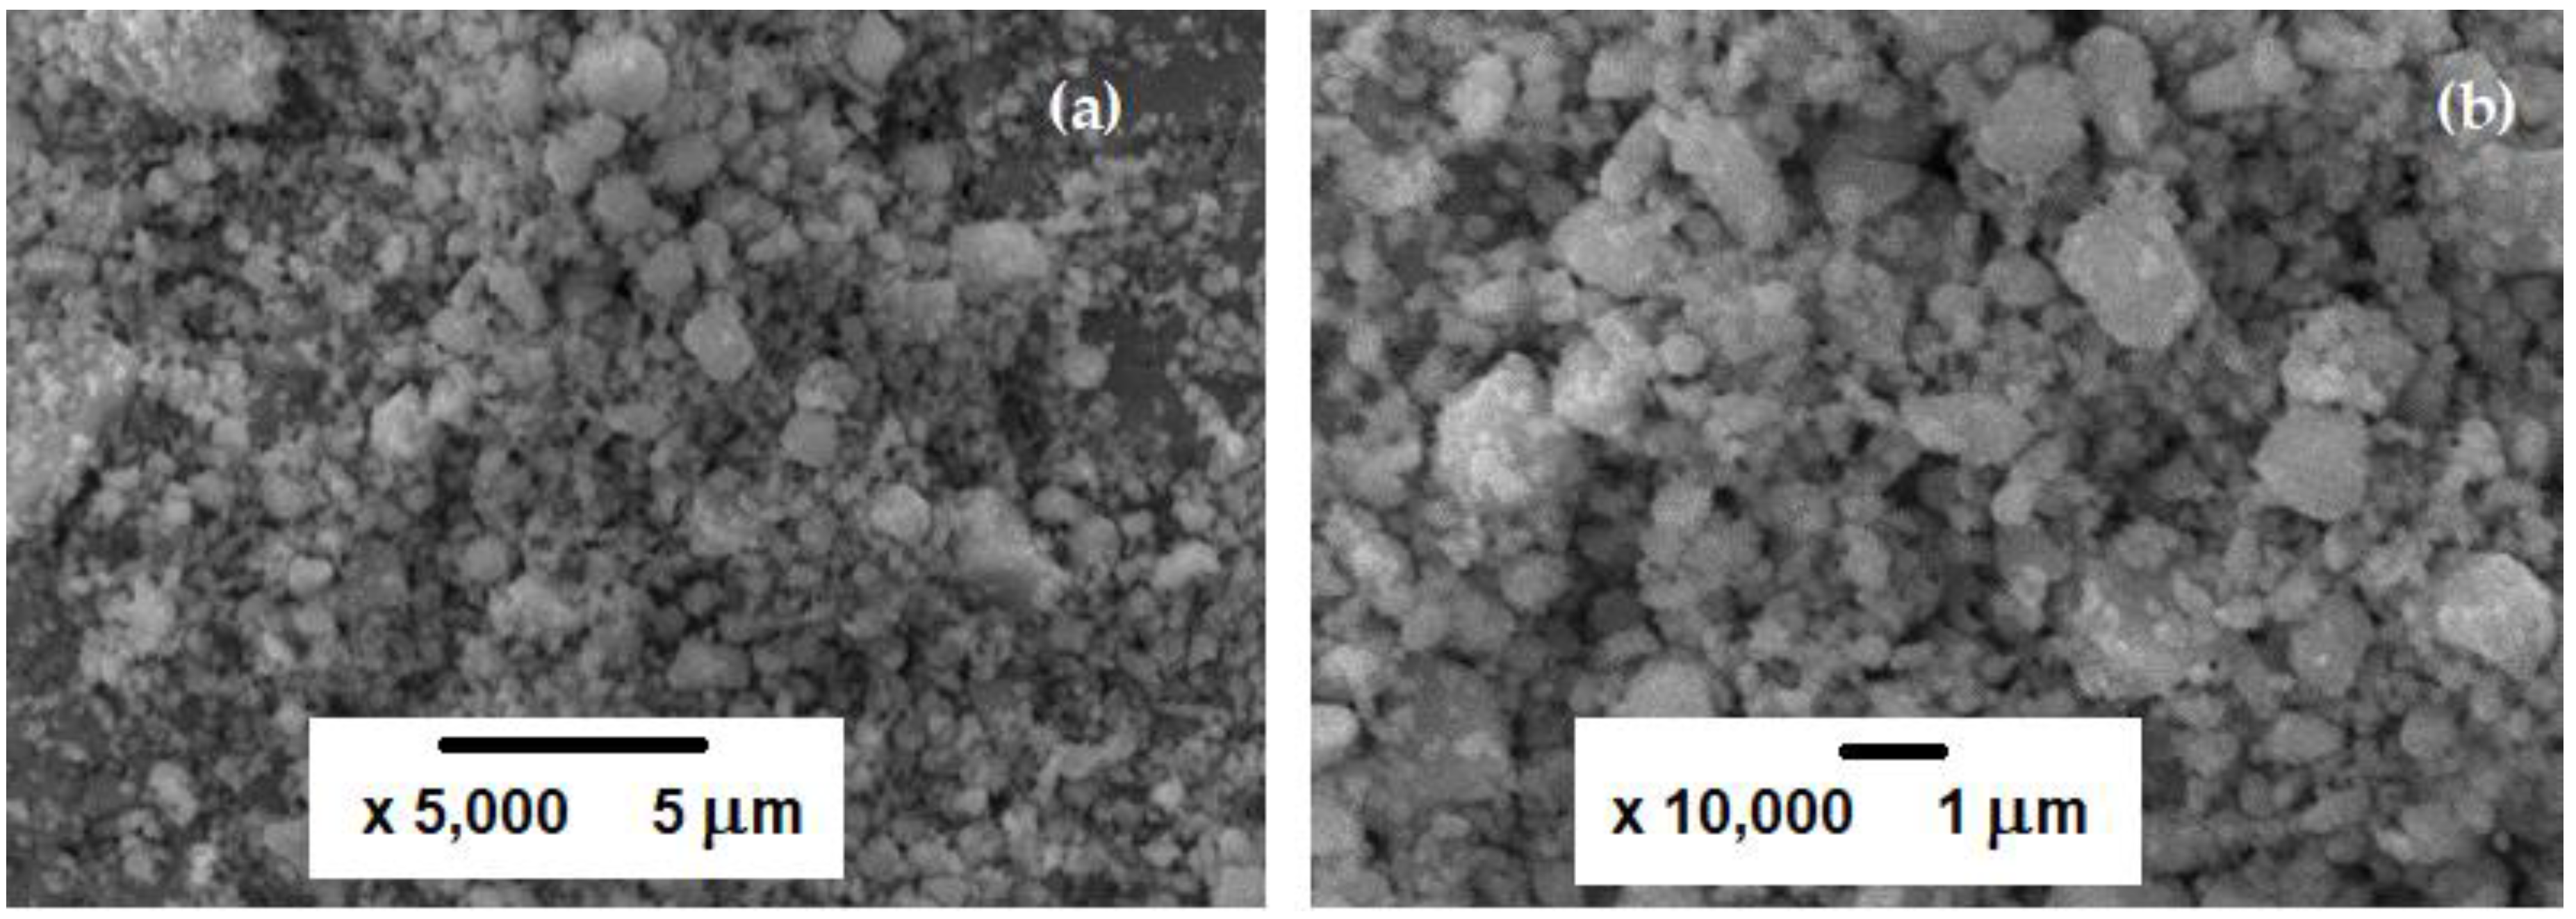
3.1. Structural Characteristics

X-ray diffraction patterns analysis (Figure 1) indicated the presence of spinel ZnCr2Se4 (Fd-3m) in all samples (ICDD PDF4+ 2017: 03-065-0689). Structural analysis carried out by the use of the Rietveld procedure allowed the determination of lattice parameters of nanocrystalline spinel after a specified milling time and its size of crystallites and lattice strains (Table 1). During the milling process, the size of spinel ZnCr2Se4 crystallites decreased from 25.2 nm (for 1 h), then 2.5 nm (for 1 h) to 2 nm (for 5 h) (Table 1). The significant change of lattice strain (τ) value obtained after 5 h of milling and visible change of peak intensities (e.g., 2θ = 28, 32 diffraction line) might indicate the unit cell deformation and appearance of texture in the material. The refinement parameters obtained during the analysis process reached acceptable [17,18,19,20] levels of: Rexp = 5.1–10.7%; Rp = 5.8–12.1%; Rwp = 7.5–10.1%; and goodness-of-fit (S) = 1.7–1.9.
SEM images of the investigated ZnCr2S4 powder after milling for 5 h, presented in Figure 2, showed morphology typical of materials subjected to high-energy ball-milling. Repeated processes occurring during milling lead to the formation of small particles. The formation of smaller or larger agglomerates, consisting of submicro-sized or nanosized particles, was an effect of crushing and subsequent agglomeration by cold welding, fracturing, and re-welding. The particles visible in the SEM images represent grains and their agglomerates of various sizes, from 0.1 to 2 μm.

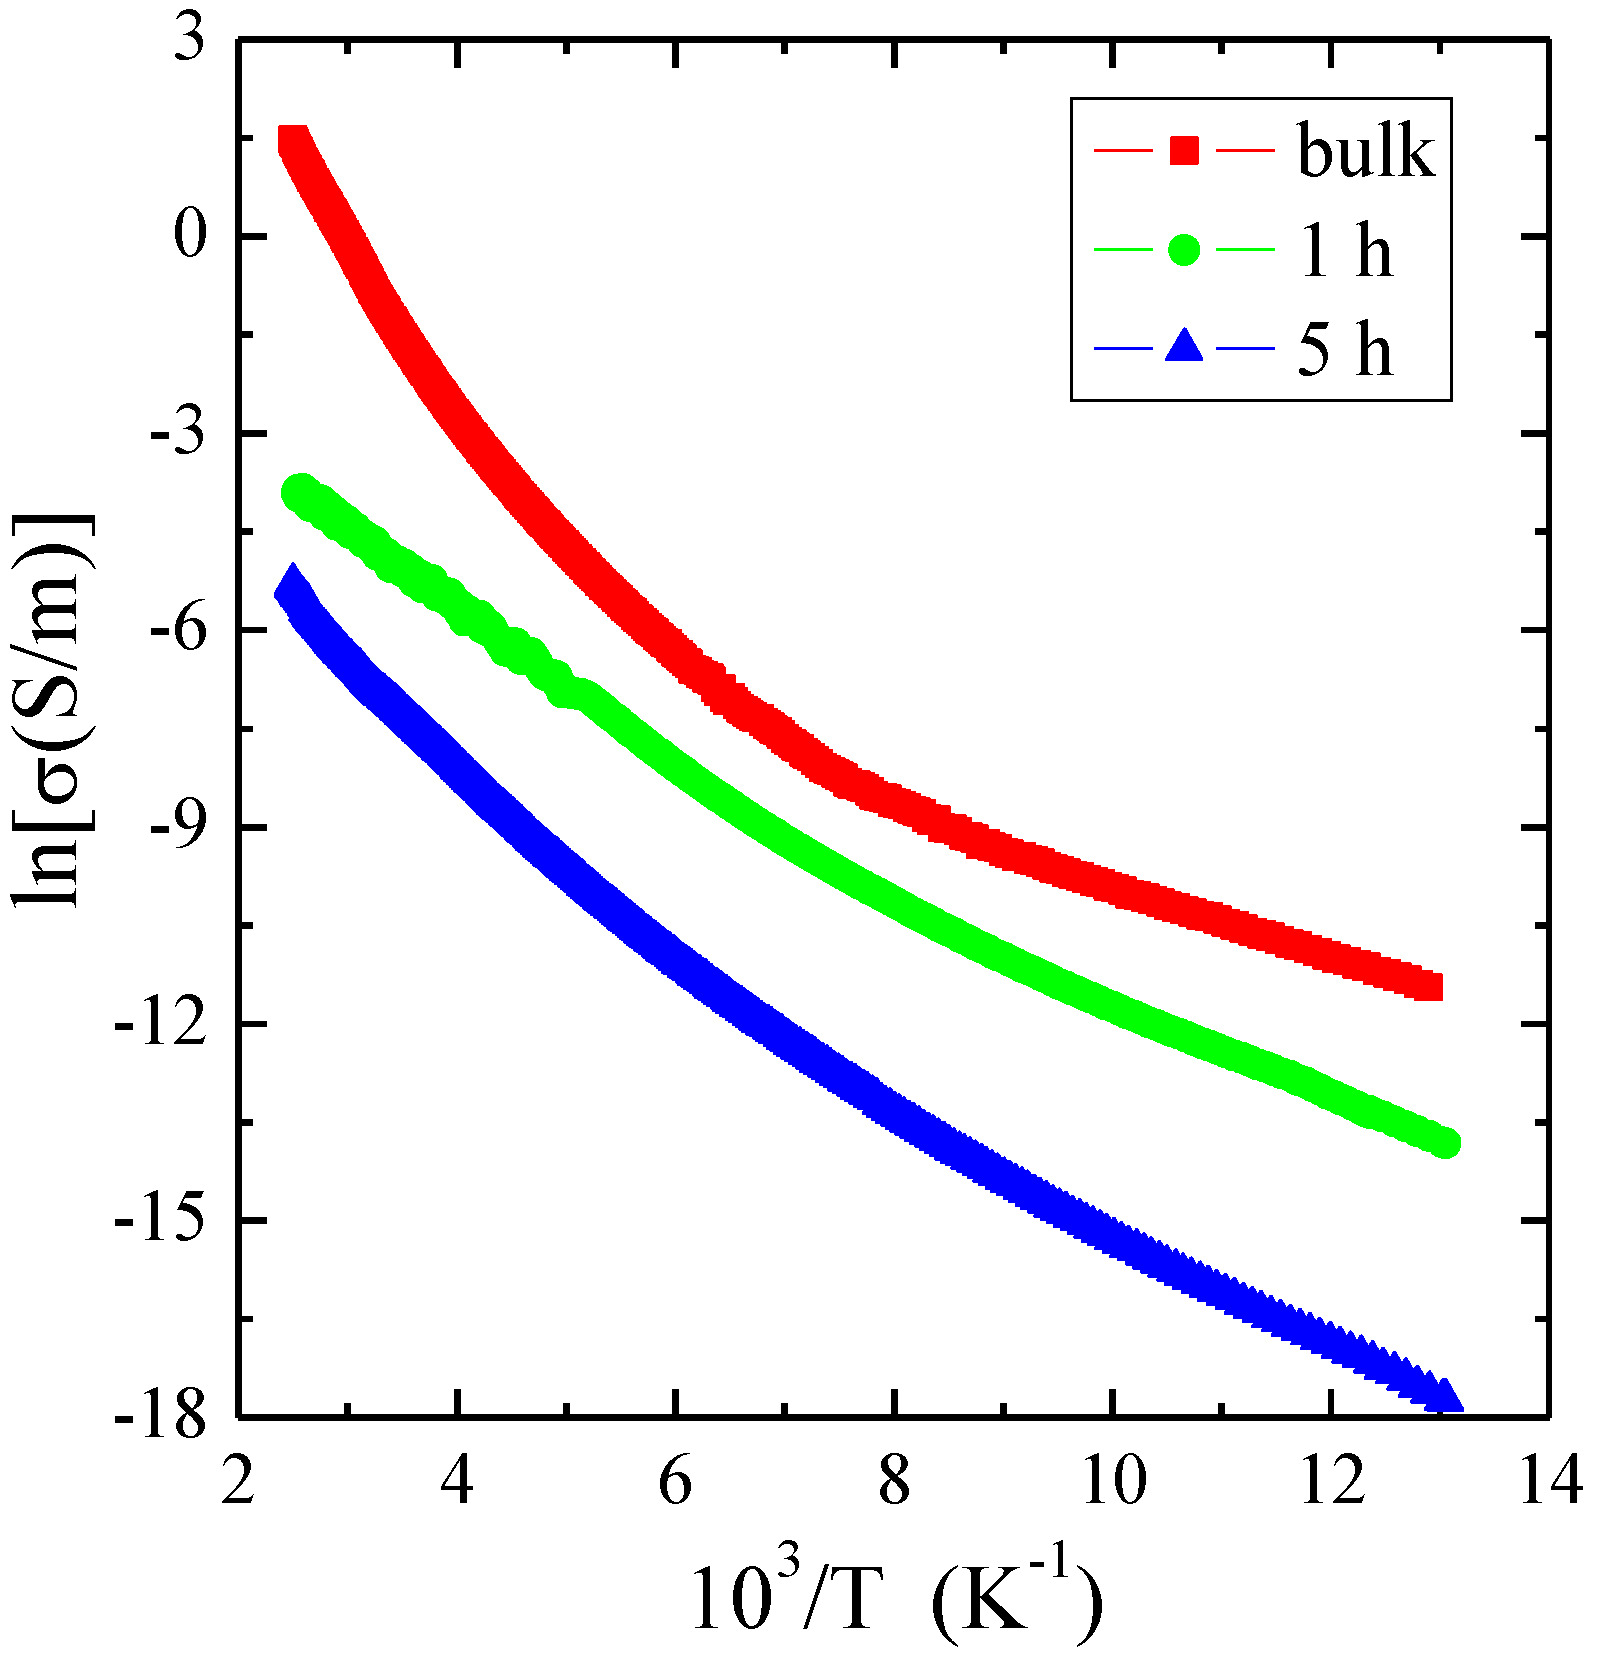
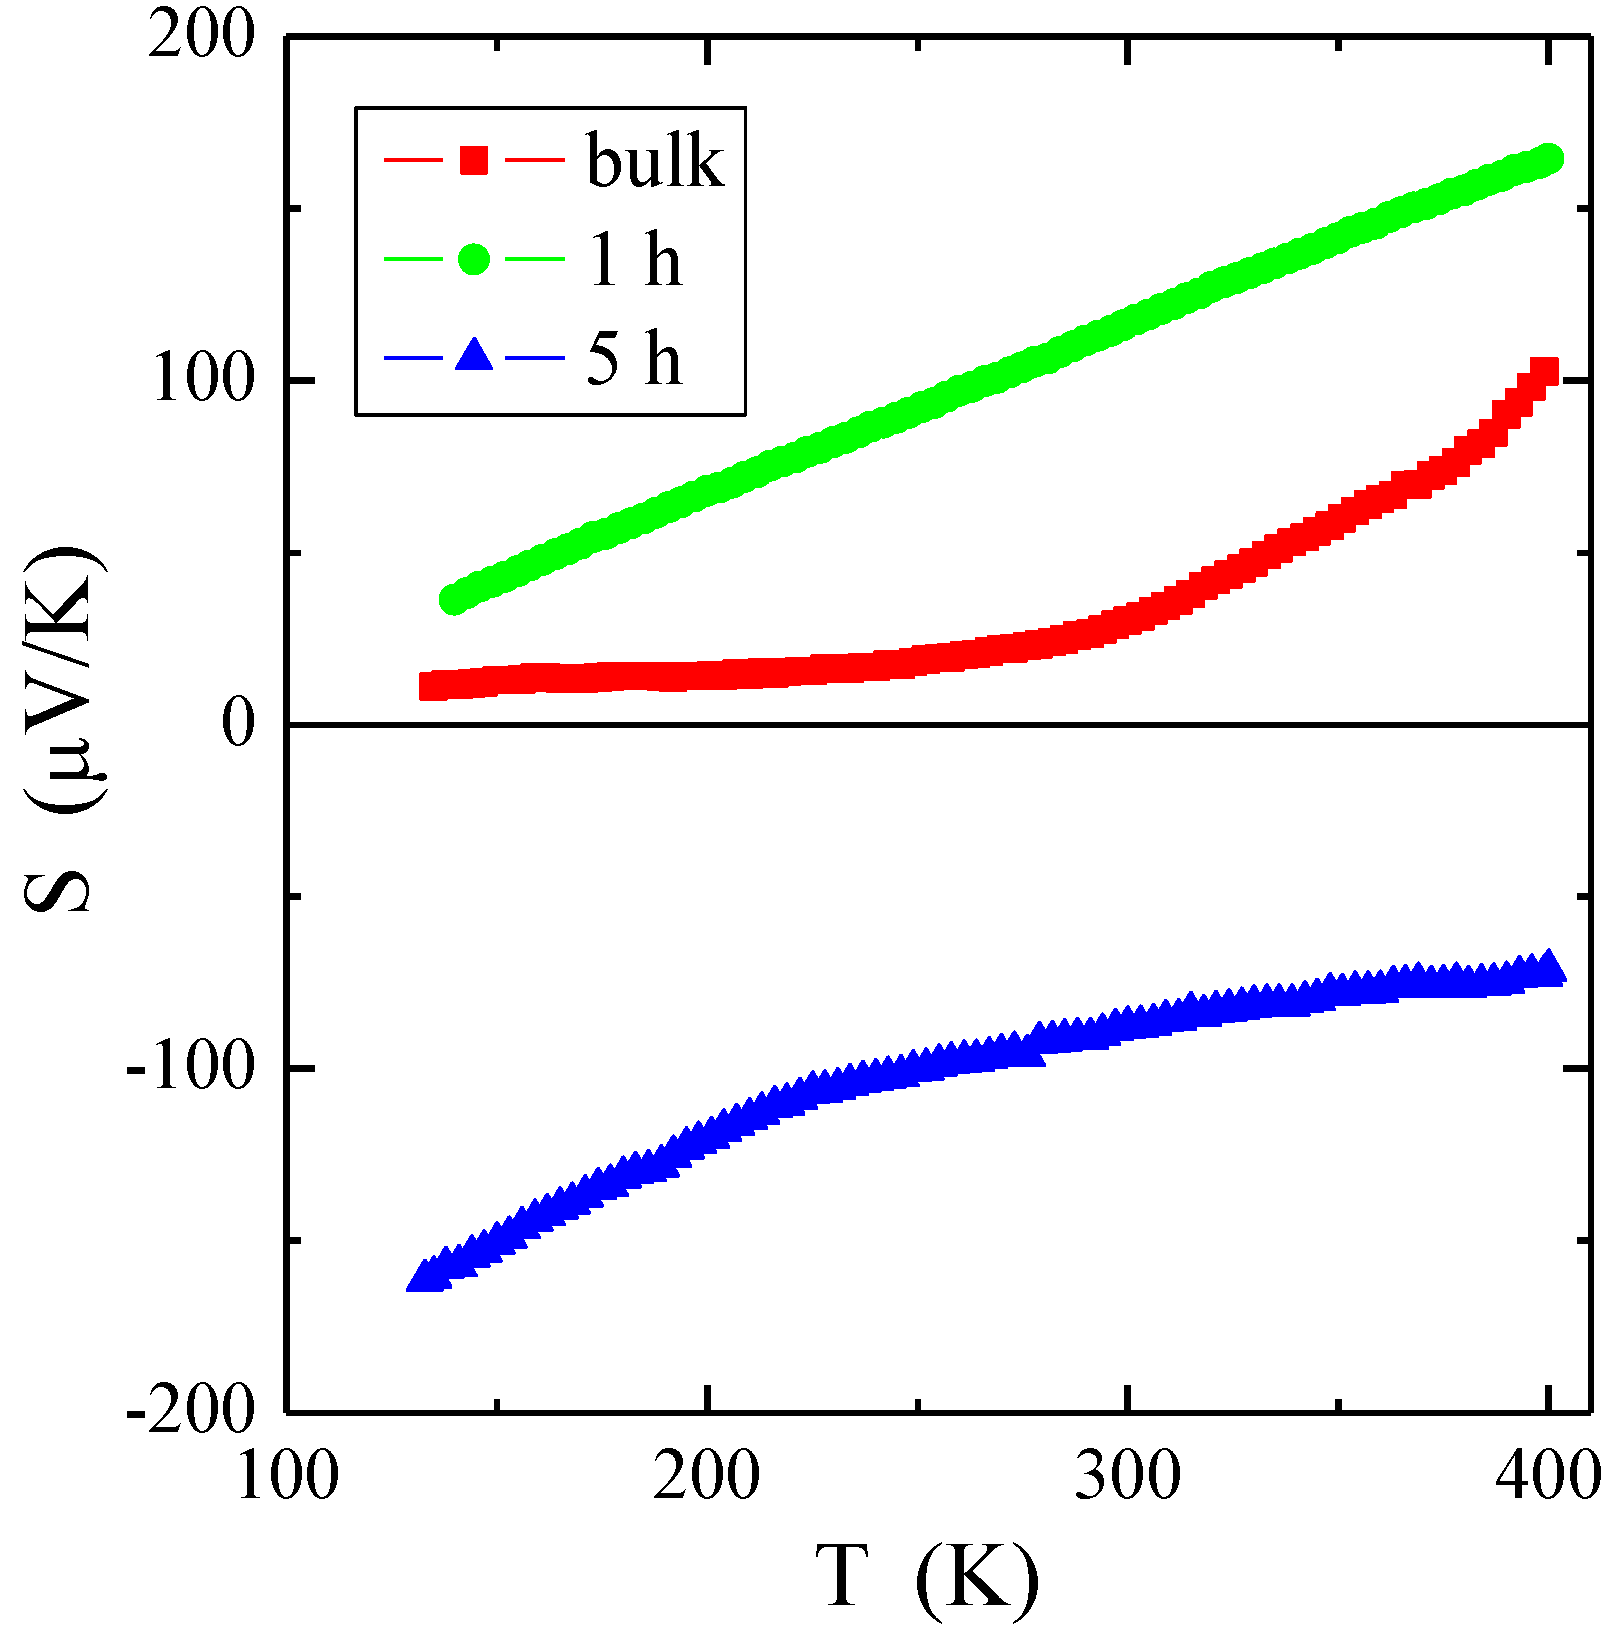
3.2. Electrical Properties

The electrical conductivity (σ) measurements of single crystal and nanocrystals after 1 and 5 h of milling, displayed in Figure 3, showed semiconducting behavior. As the crystallite size decreased, the electrical conductivity decreased in the measured temperature range. The electrical conductivity of all samples was thermally activated, and activation energy (EA) slightly increased in the extrinsic region from 0.05 eV (for bulk), then 0.06 eV (for 1 h) to 0.07 eV (for 5 h). In the intrinsic region, EA changed from 0.22 eV (for bulk), then 0.10 eV (for 1 h) to 0.14 eV (for 5 h). A much smaller EA of nanoparticles in the intrinsic region compared to a bulk material may be the result of the formation of agglomerates composed of submicro-sized or nanosized particles, visible on the SEM image.
Temperature measurements of thermoelectric power (Figure 4) showed the dominance of holes in the bulk material (well-known in the literature [7,28]) as well as in the sample after one hour of milling, and the dominance of electrons in the sample after five hours of milling. In the latter, the electron conductivity may have been due to the appearance of donor (anion) vacancies and structural defects during the formation of small particles as a result of crushing. In the materials of the spinel structure, strong ionic bonds existed between cations and anions. The appearance of a non-zero value of the electrical conductivity in spinels might have been caused by both the existence of mixed valence bands and ion vacancies [29]. In the ZnCr2Se4 spinel, which is a p-type semiconductor, chromium ions were in the 3d t2g ground state and did not form a band of mixed valence. Therefore, after a longer milling time, there was a predominance of anion vacancies over cationic ones, which was manifested by a change in the type of conduction from p to n.

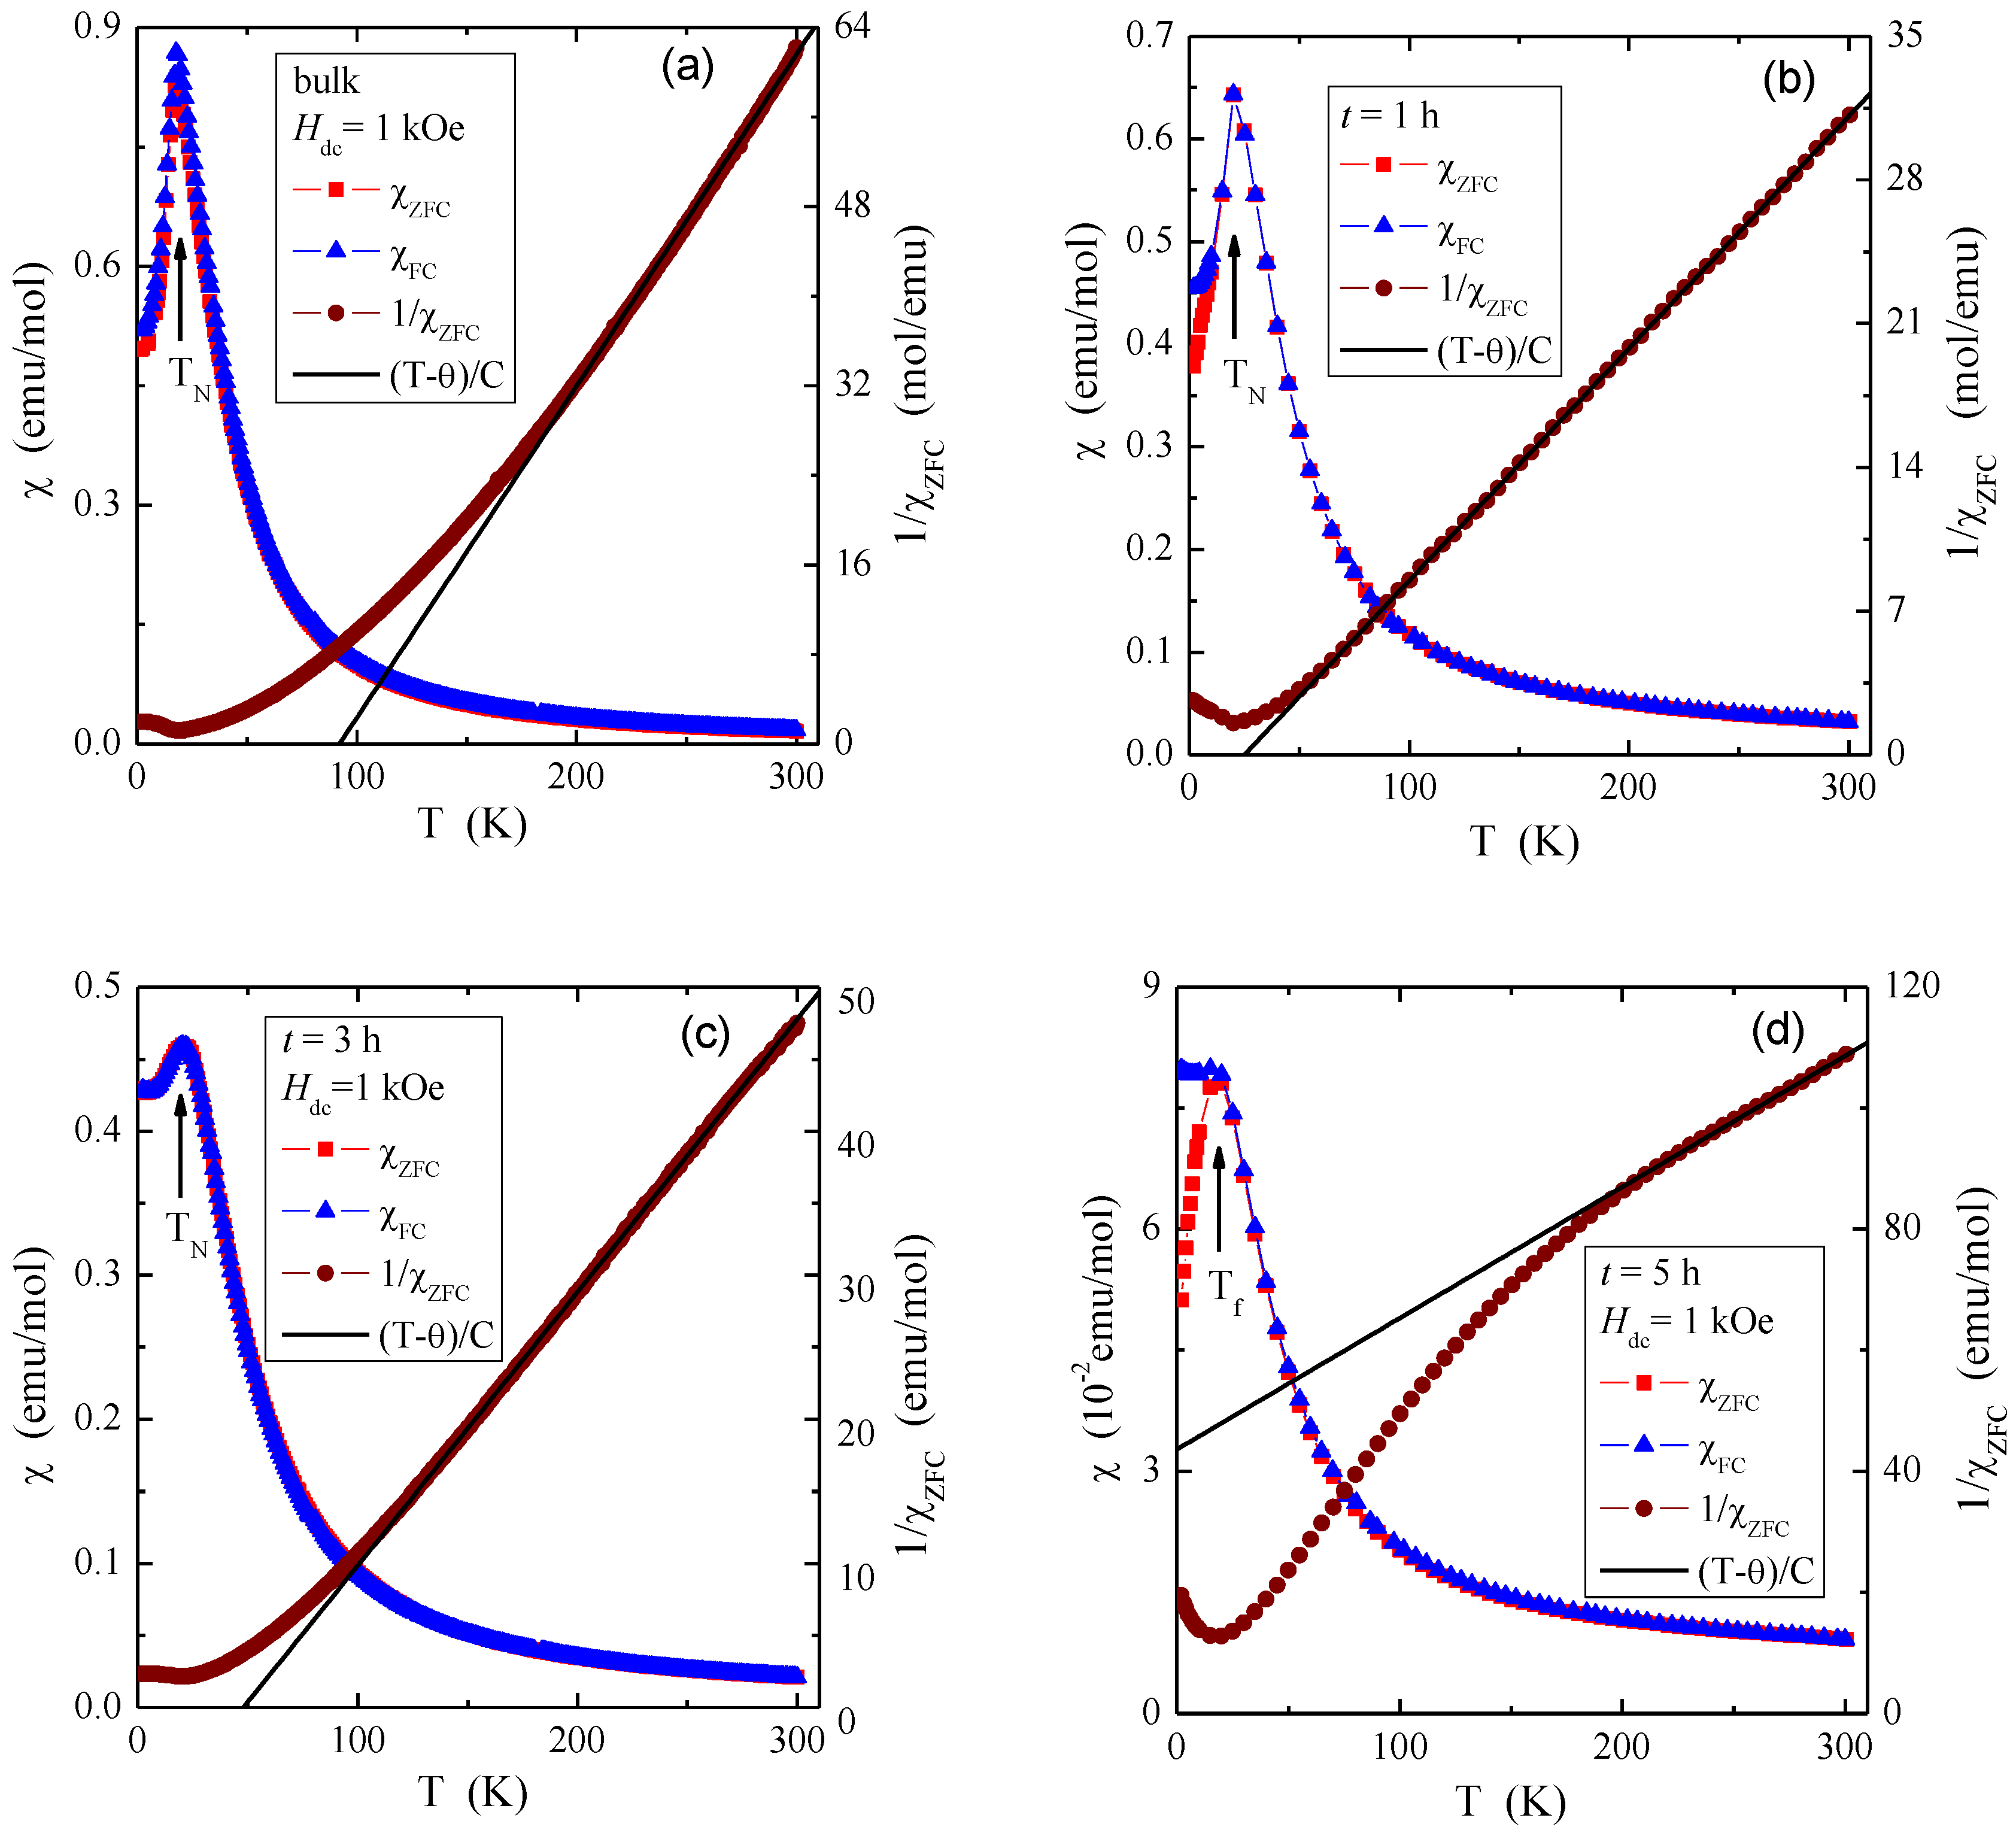
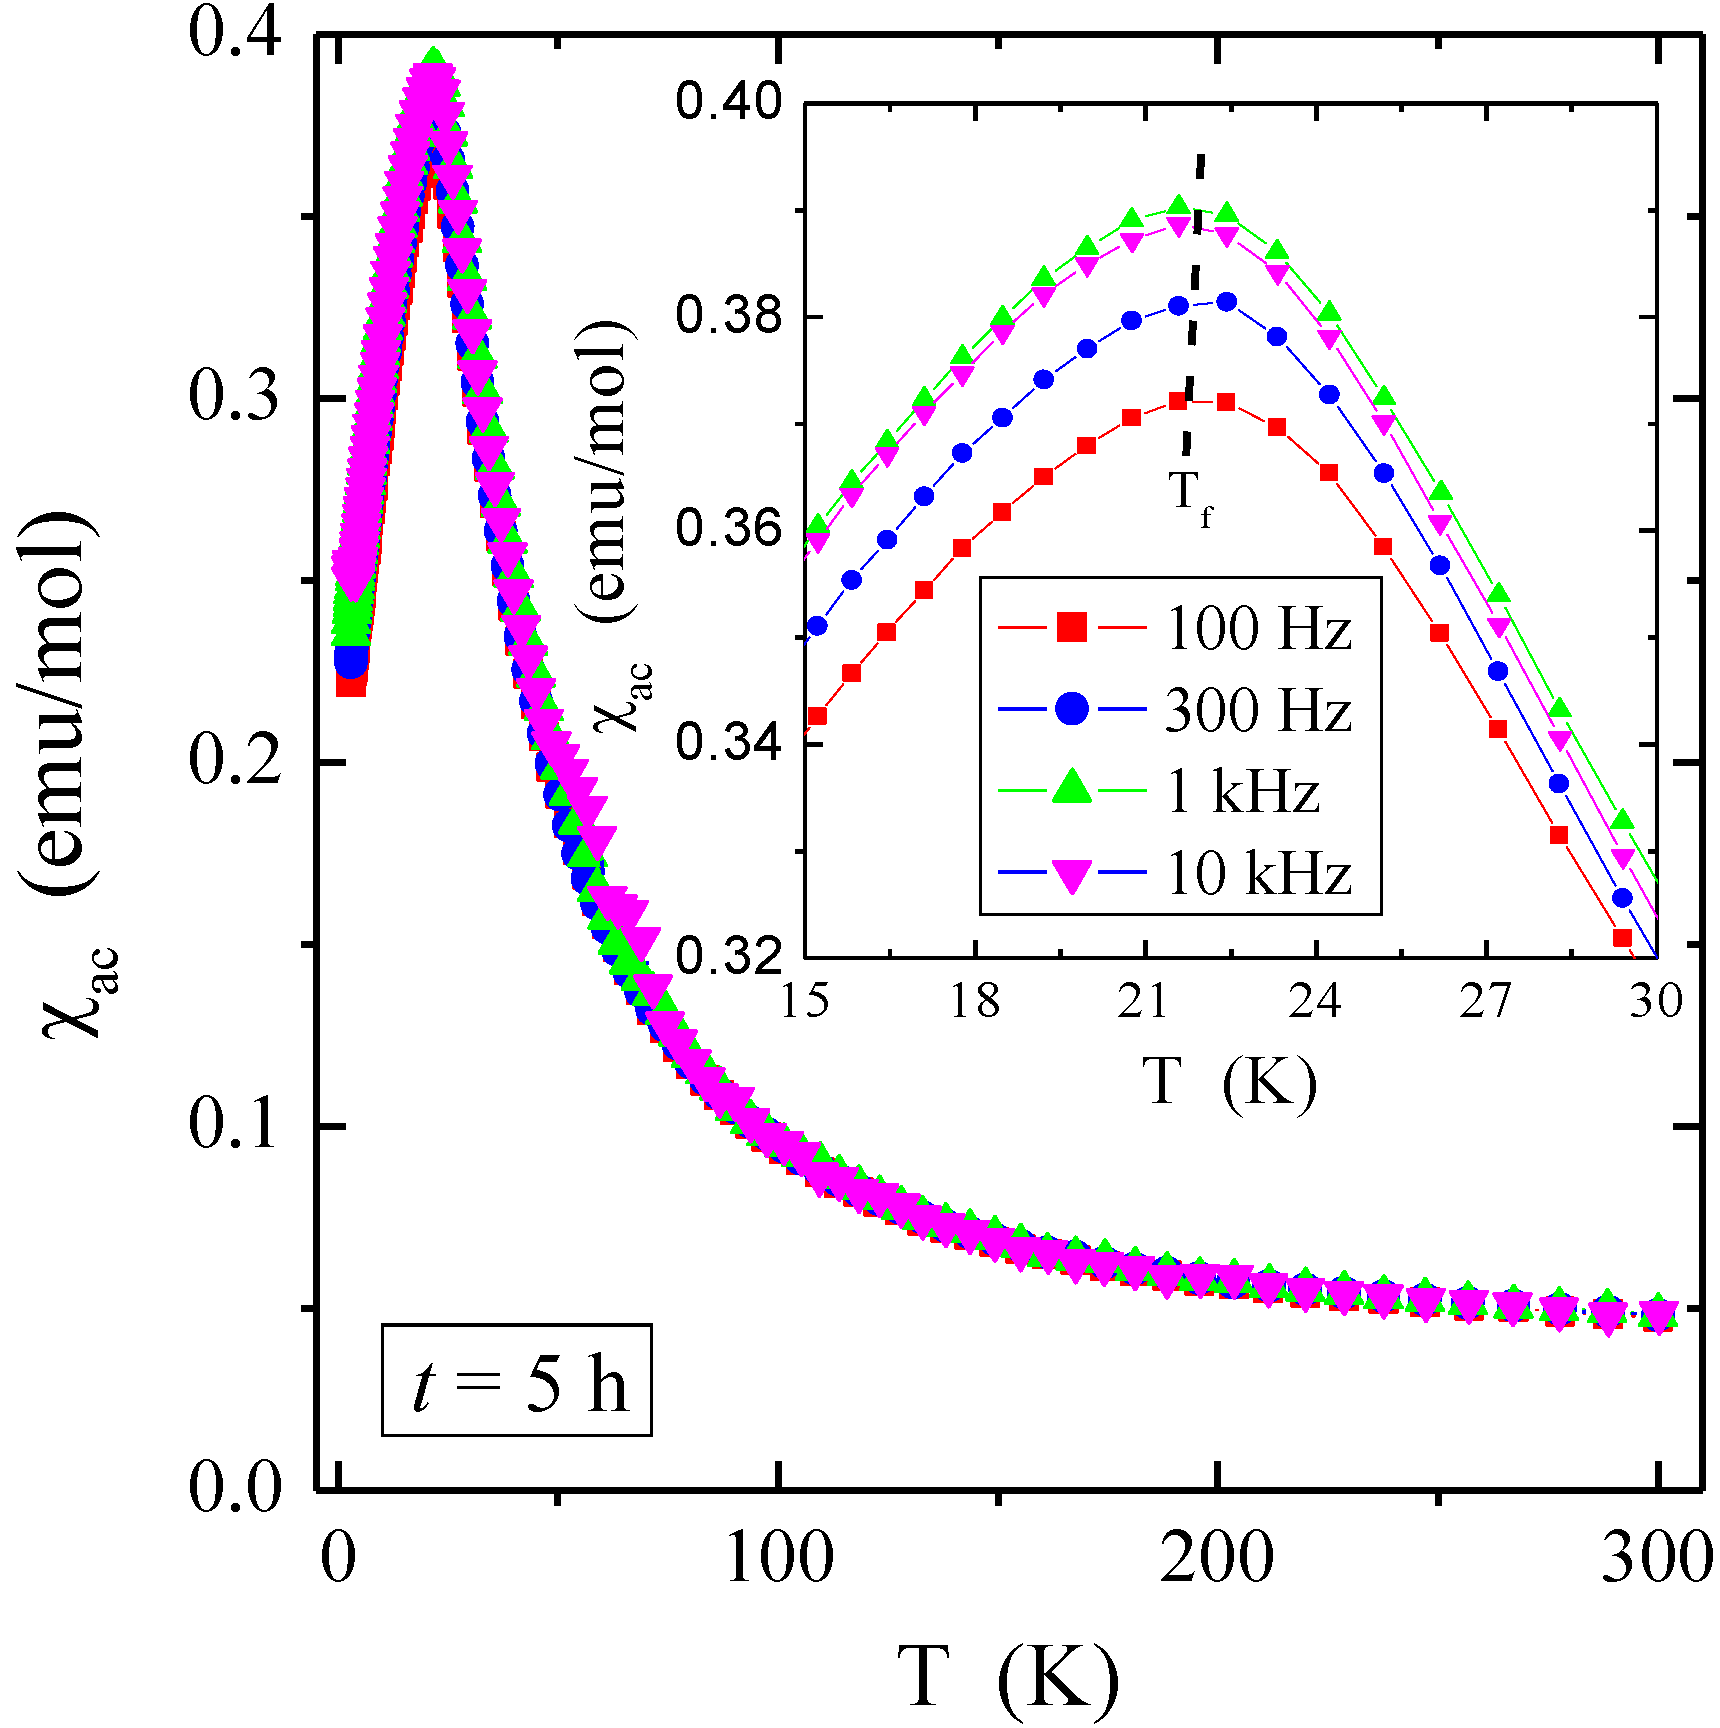
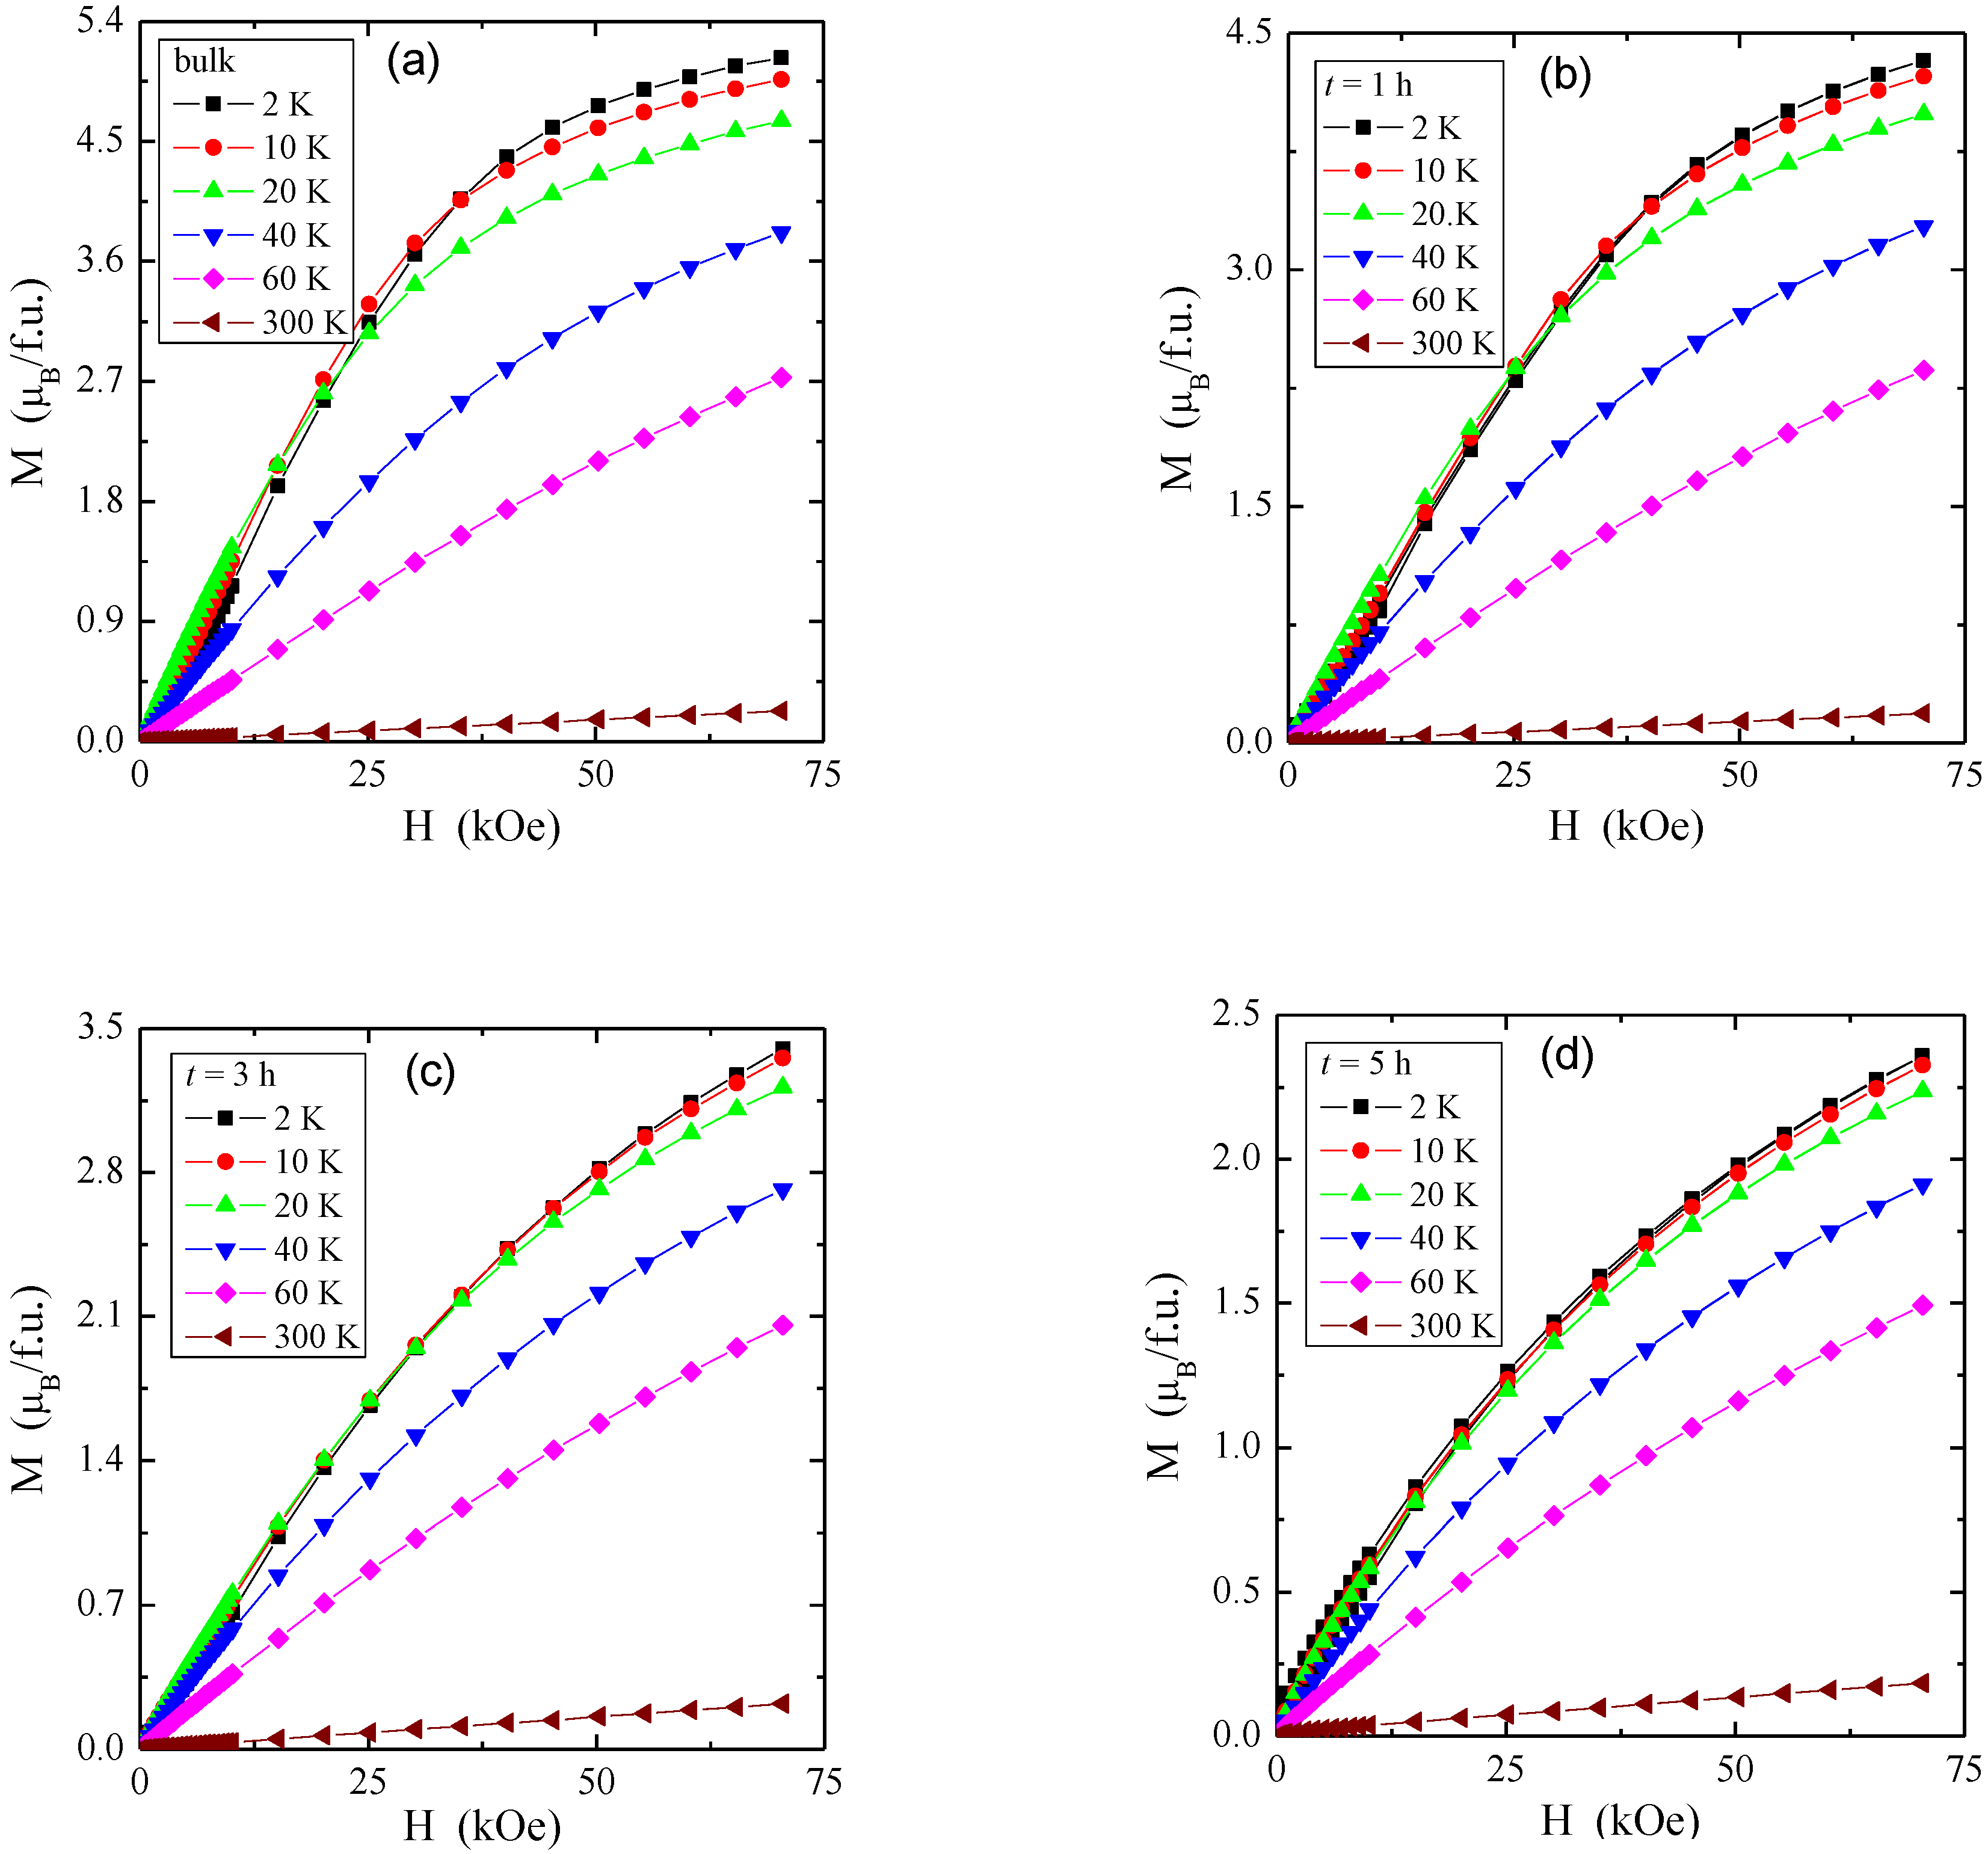
3.3. Magnetic Properties
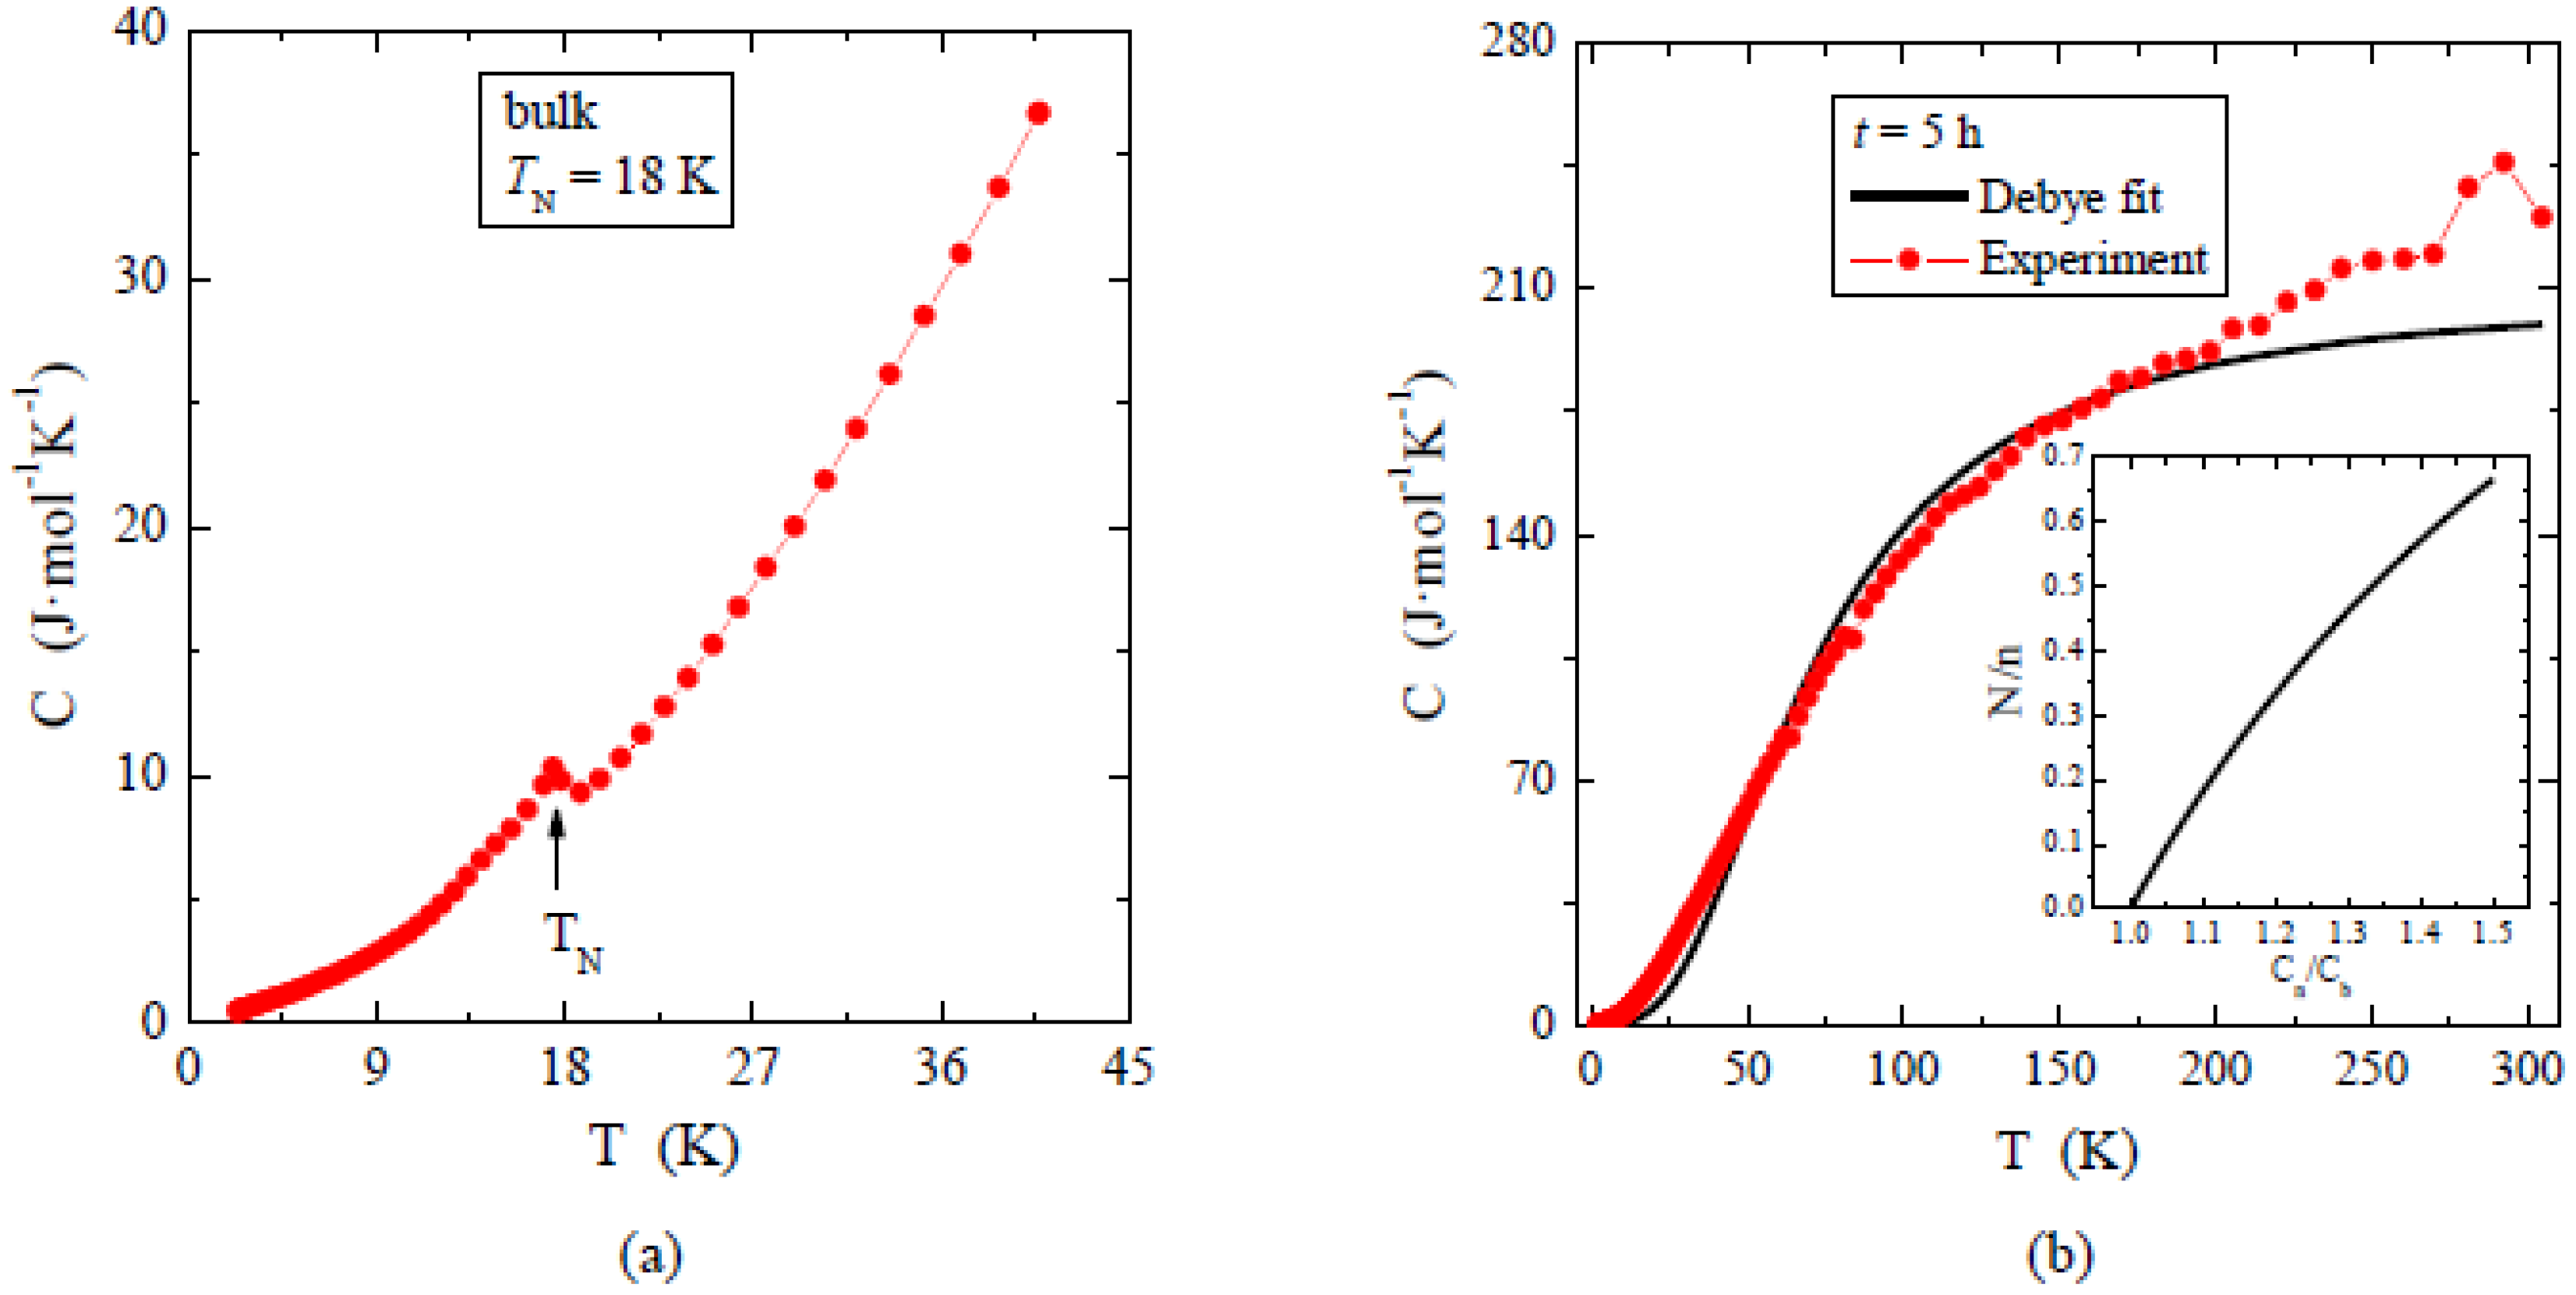
The temperature dependence of dc magnetic susceptibility, both ZFC (χZFC) and FC (χFC), showed AFM order for bulk material and nanocrystals after 1 and 3 h of milling with the Néel temperatures of 18, 20, and 20 K, respectively (Figure 5, Table 2). At the same time, the positive value of the paramagnetic Curie–Weiss temperature (θ), characteristic of the short-range FM interactions, varied from 92 (for bulk), then 25 (for 1 h) to 48 K (for 3 h). The nanocrystal after 5 h of milling showed unexpectedly ferrimagnetic (FIM) long-range interactions visible in the deviation of the curve of the inverse magnetic susceptibility (1/χZFC) from its linear part, and AFM short-range interactions visible in the negative value of paramagnetic Curie–Weiss temperature of θ = −201 K (Table 2), as well as the spin-glass-like (SG) behavior, evidenced by the splitting of the ZFC and FC magnetic susceptibility below the freezing temperature of Tf = 20 K (Figure 5). The confirmation of the existence of the SG state was also the shift of the ac magnetic susceptibility peak towards the higher frequencies (Figure 6) that is described by the Vogel–Fulchel law [30]. However, this shift was not exactly monotonous with frequency, hence the Vogel–Fulchel law cannot be fit reliably. Usually, the ZnCr2Se4 single crystals described in the literature have a positive and high Curie–Weiss temperature in the range of θ = 90–115 K [6,7,9], just like the single crystal in this study.
The reduction in crystallite size strongly affected both the value and the sign of this temperature (Table 2). All nanocrystals had significantly higher values of the effective magnetic moment, compared to the theoretical value of μeff = 5.477 μB/f.u., in which the Cr3+ ions were in the 3d t2g high-spin configuration, and the experimental values of 5.197 and 5.714 μB/f.u. for the single crystal under study, and taken from [9], respectively (Table 2). It may indicate that, in the studied spinel nanoparticles, magnetic dipoles or magnetic cluster structure had formed.
The crystallite size also affected the magnetic interactions described by the superexchange integrals (Table 2). For single crystal and nanocrystals after 1 and 3 h of milling, the superexchange integral for the first coordination sphere (J1) is negative and becomes more negative for nanocrystals. In turn, the superexchange integral for the second coordination sphere (J2) is positive and becomes less positive for nanocrystals. In this case, the J1 integral represents the antiferromagnetic long-range interactions, while the J2 integral represents the short-range ferromagnetic ones. As a consequence, for nanocrystals after 5 h of milling, i.e., for the sample with the smallest crystallite size (Table 1), the spin-glass state whose exchange integral is large, i.e., JSG = 33.3 K (Table 2), was observed. For comparison, JSG = 73.3 K for spin-glass-like behavior in single-crystalline Cu0.44In0.48Cr1.95Se4 spinel was found [31].
The magnetic isotherms of the single crystal and the nanocrystals after 1, 3, and 5 h of milling are displayed in Figure 7. With the reduction of crystallite size, magnetization at 2 K, and in the magnetic field of 75, kOe decreases from 5.125 µB/f.u. (for bulk) to 2.358 µB/f.u. (for 5 h), and the magnetic isotherms move away from the state of saturation. On magnetic isotherms at 2 K and in the magnetic field of 10 kOe, the inflection points are clearly visible, which are characteristic of the first critical field associated with the transition from the helical phase to the conical phase (metamagnetic threshold) for single crystal and nanocrystals after 1 and 3 h of milling. As the milling time increases, we observe the shift of the first critical field towards smaller fields and its disappearance for a 5 h sample. A similar shift is observed for M–H hysteresis (not visible in Figure 7), as well as, e.g., in NiO nanocrystals [32]. The second critical field associated with the transition from the magnetic cone structure to the ferromagnetic phase was not observed for any of the studied samples in the magnetic field up to 75 kOe. It is usually perceived in a magnetic field of 65 kOe [9] when the magnetic isotherm reaches saturation.

3.4. Specific Heat

Figure 8 shows the specific heat measured up to 40 K for the single crystal (8a) and up to 300 K for nanocrystal after 5 h of milling (8b). The specific heat C (T) measured for the single crystal shows at the temperature TN λ-shape peak characteristic of the second-type paramagnetic-antiferromagnetic order. In the temperature range T > TN the specific heat is usually expresses by phonon contribution C(T) = βT3. However, in the case of monocrystalline ZnCr2Se4, the C (T) ~ T3 behavior is limited only to narrow temperature range TN < T < 28 K, because of presence of spin fluctuations [11] that modify the lattice contribution to specific heat. In this narrow temperature range β = 0.00045 J/mol K4. For N = 7 atoms in formula unit, β = N(12/5)π4RθD gives the Debye temperature θD ≈ 311 K. For the nanocrystalline material, we also fitted the Debye model to the C (T) data (as is shown in Figure 8b) in the wide temperature range, assuming that the spin fluctuations are removed in nano-grained material. The obtained fit parameters were: Debye temperature θD = 290 K and the number of atoms nD = 8.38. The number of atoms is significantly larger than the expected 7 for the ZnCr2Se4 formula unit. The simple explanation of this phenomenon can be provided on the basis of the model published in [30], where the authors have shown that, for the nanoparticles, the specific heat is larger than for the bulk solid. The inset presents the fraction of the number of atoms on the surface N to the total number of atoms n, versus the ratio of specific heat measured for nanoparticles Cn to the specific heat measured for the bulk solid lattice Cb. In our case, such an estimation shows that 32% of atoms are on the surface, which clearly confirms that our sample was milled down to a few nm in size. In Figure 8a, a clear peak at TN in the specific heat curve of a single crystal is observed, but no peak is visible in specific heat for the nanocrystal after 5 h of milling (Figure 8b), which suggests that, for such small nanoparticles, no long range magnetic order was present. There is a spread in the size of nanoparticles. Despite the fact that most of them are in the nm range, a small fraction can be larger and exhibit magnetic ordering, which is visible in the ac magnetic susceptibility.

4. Conclusions

The nanocrystals were obtained using the high-energy ball-milling method from the ZnCr2Se4 single crystal after 1, 3, and 5 h of milling, whose crystallite sizes were 25.2, 2.5, and 2 nm, respectively. Structural, electrical, magnetic, and specific heat measurements showed that all samples had a spinel structure, were p-type semiconductors with less milling time, and n-type with a higher one. With a decrease in crystallite size, the magnetic order changed from antiferromagnetic for bulk material and nanocrystals after 1 and 3 h of milling to the spin-glass state for the nanocrystal after 5 h of milling. The spin-glass-like behavior was derived from a broad peak of dc magnetic susceptibility, a splitting of the zero-field-cooling and field-cooling susceptibilities, and from the shift of the freezing temperature towards the higher frequency of the ac susceptibility curves. The spin-glass-like system was also confirmed by the large exchange constant of 33.3 K, which was additionally accompanied by the lack of a peak on the specific heat curve, suggesting a disappearance of the structural transition.
In summary, decreasing the spinel monocrystal crystallite resulted in a change in magnetic order from AFM to SG, an increase in AFM long-range interactions, and weakening of FM short-range ones that finally led to a strong competition of FIM and AFM interactions in the spin-glass sample with the smallest crystallite size.

Author Contributions

Conceptualization, E.M., M.K., and T.G.; methodology, E.M., M.K., and T.G.; validation, E.M.; formal analysis, M.K., T.G., and A.G.; investigation, E.M., M.K., A.G., J.G., M.O., B.S., and J.P.; resources, E.M. and A.G.; writing—original draft preparation, E.M., M.K., T.G., and A.Ś.; writing—review and editing, E.M. and M.K.; visualization, M.K. and T.G.; supervision, E.M. and M.K.; project administration, E.M. and M.K.

Funding

This research received no external funding.

Acknowledgments

This work is partly supported by the Ministry of Scientific Research and Information Technology (Poland) and funded from Science Resource: No.1S-0300-500-1-05-06.

Conflicts of Interest

The authors declare no conflicts of interest.

References

  1. Snyder, G.J.; Caillat, T.; Fleurial, J.P. Thermoelectric properties of chalcogenides with the spinel structure. Mater. Res. Innov. 2001, 5, 67–73. [Google Scholar] [CrossRef]
  2. Groń, T.; Krajewski, A.; Duda, H.; Urbanowicz, P. Influence of nonstoichiometry on the lattice excitations in the ZnxCuyCrzSe4 p-type spinel ferromagnetic conductors. Physica B 2006, 373, 245–252. [Google Scholar] [CrossRef]
  3. Mazur, S.; Groń, T.; Jendrzejewska, I. Influence of spin arrangement on thermopower in ZnxCuyCrzSe4 spinels. J. Alloy Compd. 2009, 480, 19–22. [Google Scholar] [CrossRef]
  4. Shannon, R.D. Revised effective ionic radii and systematic studies of interatomic distances in halides and chalcogenides. Acta Cryst. 1976, A 32, 751–767. [Google Scholar] [CrossRef]
  5. Philipsborn, H. Chalcogenide spinels and alternative structures. Z. Kristallogr. Cryst. Mater. 1971, 133, 464–472. [Google Scholar] [CrossRef]
  6. Plumier, R. Étude par diffraction de neutrons de l’antiferromagnétisme hélicoïdal du spinelle ZnCr2Se4 en présence d’un champ magnétique. J. Phys. (Paris) 1966, 27, 213–219. [Google Scholar] [CrossRef]
  7. Lotgering, F.K. Proceedings of the International Conference on Magnetism: Held at Nottingham, Sept. 1964; Institute of Physics (IOP): London/Bristol, UK, 1965; p. 533. [Google Scholar]
  8. Kleinberger, R.; Kouchkovsky, R. Étude radiocristallographique á basse température du spinelle ZnCr2Se4. Phys. Solides. Comp. Rend. Acad. Sci. (Paris) 1966, 262, 628–630. [Google Scholar]
  9. Hemberger, J.; von Nidda, H.A.K.; Tsurkan, V.; Loidl, A. Large magnetostriction and negative thermal expansion in the frustrated antiferromagnet ZnCr2Se4. Phys. Rev. Lett. 2007, 98, 147203. [Google Scholar] [CrossRef]
  10. Malicka, E.; Waśkowska, A.; Mydlarz, T.; Kaczorowski, D. Structural and magnetic properties of single—Crystalline spinel systems ZnCr2−xAlxSe4 (x = 0.15 and 0.23). J. Alloy Compd. 2007, 440, 1–5. [Google Scholar] [CrossRef]
  11. Malicka, E.; Groń, T.; Ślebarski, A.; Gągor, A.; Pacyna, A.W.; Sitko, R.; Goraus, J.; Mydlarz, T.; Heimann, J. Specific heat and magnetic susceptibility of single-crystalline ZnCr2Se4 spinels doped with Ga, In and Ce. Mater. Chem. Phys. 2011, 131, 142–150. [Google Scholar] [CrossRef]
  12. Malicka, E.; Waśkowska, A.; Heimann, J.; Mydlarz, T.; Sitko, R.; Kaczorowski, D. Structural and magnetic properties of Zn1−xSbxCr2−x/3Se4 (x = 0.11, 0.16 and 0.20) single crystals. J. Solid State Chem. 2008, 181, 1970–1976. [Google Scholar] [CrossRef]
  13. Jendrzejewska, I.; Zajdel, P.; Goryczka, T.; Goraus, J.; Kita, A.; Mydlarz, T. Influence of covalency and anion polarization on magnetic and electronic properties of ZnCr2−x NixSe4. J. Alloy Compd. 2012, 520, 153–157. [Google Scholar] [CrossRef]
  14. Jendrzejewska, I.; Groń, T.; Kusz, J.; Żelechower, M.; Maciążek, E.; Ślebarski, A.; Fijałkowski, M. Spin-glass-like behaviour in tin doped ZnCr2Se4 single crystals. J. Alloys Compd. 2015, 635, 238–244. [Google Scholar] [CrossRef]
  15. Maciążek, E.; Malicka, E.; Karolus, M.; Panek, J.; Stokłosa, Z.; Groń, T.; Gudwański, A.; Sawicki, B. Magnetic characteristics of CuCr2S4 nanospinels obtained by mechanical alloying and heat treatment. IEEE Trans. Magn. 2017, 53, 2400205. [Google Scholar]
  16. Williamson, G.K.; Hall, W.H. X-ray line broadening from filed aluminium and wolfram. Acta Metall. 1953, 1, 22–31. [Google Scholar] [CrossRef]
  17. Young, R.A. The Rietveld Method; Oxford University Press: Oxford, UK, 1993; Chapter 6. [Google Scholar]
  18. McCusker, L.B.; von Dreele, R.B.; Cox, D.E.; Louer, D.; Scardi, P. Rietveld refinement guidelines. J. Appl. Crystallogr. 1999, 32, 36–50. [Google Scholar] [CrossRef]
  19. Karolus, M.; Łągiewka, E. Crystallite size and lattice strain in nanocrystalline Ni-Mo alloys studied by Rietveld Refinement. J. Alloy Compd. 2004, 367, 235–238. [Google Scholar] [CrossRef]
  20. Karolus, M. Applications of Rietveld refinement in Fe-B-Nb alloy structure studies. J. Mater. Process. Technol. 2006, 175, 246–250. [Google Scholar] [CrossRef]
  21. Groń, T.; Krok-Kowalski, J.; Duda, H.; Mydlarz, T.; Gilewski, A.; Walczak, J.; Filipek, E.; Bärner, K. Metamagnetism in the Cr2V4−xMoxO13+0.5x solid solutions. Phys. Rev. B 1995, 51, 16021–16024. [Google Scholar] [CrossRef]
  22. Krok-Kowalski, J.; Groń, T.; Warczewski, J.; Mydlarz, T.; Okońska-Kozłowska, I. Ferrimagnetism and metamagnetism in Cd1−xCuxCr2S4 spinels. J. Magn. Magn. Mater. 1997, 168, 129–138. [Google Scholar] [CrossRef]
  23. Groń, T.; Pacyna, A.W.; Malicka, E. Influence of temperature independent contribution of magnetic susceptibility on the Curie-Weiss law. Solid State Phenom. 2011, 170, 213–218. [Google Scholar] [CrossRef]
  24. Holland, W.E.; Brown, H.A. Application of the Weiss molecular field theory to the B-site spinel. Phys. Status Solidi A 1972, 10, 249–253. [Google Scholar] [CrossRef]
  25. Derrida, B. Random-energy model: Limit of a family of disordered models. Phys. Rev. Lett. 1980, 45, 79–82. [Google Scholar] [CrossRef]
  26. Derrida, B. Random-energy model: An exactly solvable model of disordered systems. Phys. Rev. B 1981, 24, 2613–2626. [Google Scholar] [CrossRef]
  27. Binder, K.; Young, A.P. Spin glasses: Experimental facts, theoretical concepts, and open questions. Rev. Mod. Phys. 1986, 58, 801–976. [Google Scholar] [CrossRef]
  28. Groń, T.; Duda, H.; Warczewski, J. Influence of the valence of the substituted cations on the electrical properties of the magnetically modulated spinels Zn1−xAxCr2Se4 (A = Cu, Ga2/3). Phys. Rev. B 1990, 41, 12424–12431. [Google Scholar] [CrossRef] [PubMed]
  29. Groń, T. Influence of vacancies and mixed valence on the transport processes in solid solutions with the spinel structure. Philos. Mag. B 1994, 70, 121–132. [Google Scholar] [CrossRef]
  30. Tholence, J.L. On the frequency dependence of the transition temperature in spin glasses. Solid State Commun. 1980, 35, 113–117. [Google Scholar] [CrossRef]
  31. Duda, H.; Maciążek, E.; Groń, T.; Mazur, S.; Pacyna, A.W.; Waśkowska, A.; Mydlarz, T.; Gilewski, A. Spin-glass-like behaviour in single-crystalline Cu0.44In0.48Cr1.95Se4. Phys. Rev. B 2008, 77, 035207-8. [Google Scholar] [CrossRef]
  32. Yi, J.B.; Ding, J.; Feng, Y.P.; Peng, G.W.; Chow, G.M.; Kawazoe, Y.; Liu, B.H.; Yin, J.H.; Thongmee, S. Size-dependent magnetism and spin-glass behavior of amorphous NiO bulk, clusters, and nanocrystals: Experiments and first-principles calculations. Phys. Rev. B 2007, 76, 224402. [Google Scholar] [CrossRef]
Figure 1. The X-ray diffraction patterns of spinel ZnCr2Se4 (ICDD PDF4+ 2017: 03-065-0689 card) after 1, 3, and 5 h of milling.
Materials 12 03947 g001
Figure 2. SEM images of ZnCr2Se4 powder after 5 h of milling magnified (a) 5,000 times and (b) 10,000 times.
Materials 12 03947 g002
Figure 3. Electrical conductivity (lnσ) vs. reciprocal temperature 103/T measured for ZnCr2Se4 single crystal and nanocrystals after 1 and 5 h of milling.
Materials 12 03947 g003
Figure 4. Thermoelectric power S vs. temperature T measured for ZnCr2Se4 single crystal and nanocrystals after 1 and 5 h of milling.
Materials 12 03947 g004
Figure 5. Zero-field-cooled (ZFC) and field-cooled (FC) magnetic susceptibility χ vs. temperature T at Hdc = 1 kOe for ZnCr2Se4 single crystal (a) and nanocrystals after 1 h (b), 3 h (c), and 5 h (d) of milling. TN and Tf are the Néel and freezing temperatures, respectively.
Materials 12 03947 g005
Figure 6. In-phase component of ac magnetic susceptibility χac vs. temperature T at Hac = 2 Oe recorded at different frequencies and after 5 h of milling. Inset: χac(T) magnification in the range up to 30 K.
Materials 12 03947 g006
Figure 7. Magnetization M vs. magnetic field H at 2, 10, 20, 40, 60, and 300 K kOe for ZnCr2Se4 single crystal (a) and nanocrystals after 1 h (b), 3 h (c), and 5 h (d) of milling.
Materials 12 03947 g007
Figure 8. Specific heat C vs. temperature T in zero-magnetic field measured for the single crystal (a) and for nanocrystals after 5 h of milling (b). This sum contains electronic, antiferromagnetic, and lattice contribution. In the right panel, the solid line represents the Debye fit. In the inset we show: N/n vs. Cn/Cb, where N is the number of atoms on the surface, n is the total number of atoms, Cn is the specific heat measured for nanoparticles, and Cb is the specific heat measured for the bulk solid lattice.
Materials 12 03947 g008
Table 1. Structural parameters of ZnCr2Se4 nanospinel.
t
(h)
a
(Å)
d
(nm)
τ
(%)
110.5064(5)25.(2)0.8
310.4856(4)2.(5)1.1
510.4758(3)2.(0)1.3
t is the milling time, a is the unit cell parameter, d is the crystallite size, and τ is the lattice strain. For comparison, the theoretical unit cell parameter of ZnCr2Se4 bulk spinel (a = 10.4970 Å) was taken from the ICDD PDF4+ 2017: 03-065-0689 card.
Table 2. Magnetic parameters of ZnCr2Se4 nanospinels.
t
(h)
d
(nm)
C
(emu⋅K/mol)
TN
(K)
θ
(K)
µeff
B/f.u.)
M(2K)
B/f.u.)
J1
(K)
J2
(K)
Ref.
-bulk4.08221905.7146.0−1.651.28[9]
-bulk3.37718925.1975.125−1.171.22this paper
1258.84120258.4094.328−2.580.71this paper
32.55.27320486.4943.401−2.200.90this paper
524.611Tf = 20 K−2016.0732.358JSG = 33.3 Kthis paper
t is the milling time; d is the crystallite size; C is the Curie constant; TN, Tf, and θ are the Néel, freezing, and Curie–Weiss temperatures, respectively; μeff is the effective magnetic moment; M is the magnetization at 2 K; J1 and J2 are the superexchange integrals for the first two coordination spheres; and JSG is the exchange constant of the spin-glass system. For comparison, magnetic parameters of ZnCr2Se4 bulk single crystal from the literature [9] were taken.

