Funding
This research was funded by the National Natural Science Foundation of China (51902270, 51909223), the Open Research Fund of State Key Laboratory of Simulation and Regulation of Water Cycle in River Basins (China Institute of Water Resources and Hydropower Research), Grant NO: IWHR-SKL-KF201910, the Fundamental Research Fund of Xijing University (XJ18B02, XJ18T02), and the Education Department of Shaanxi province (18JK1200, 19JK0913).
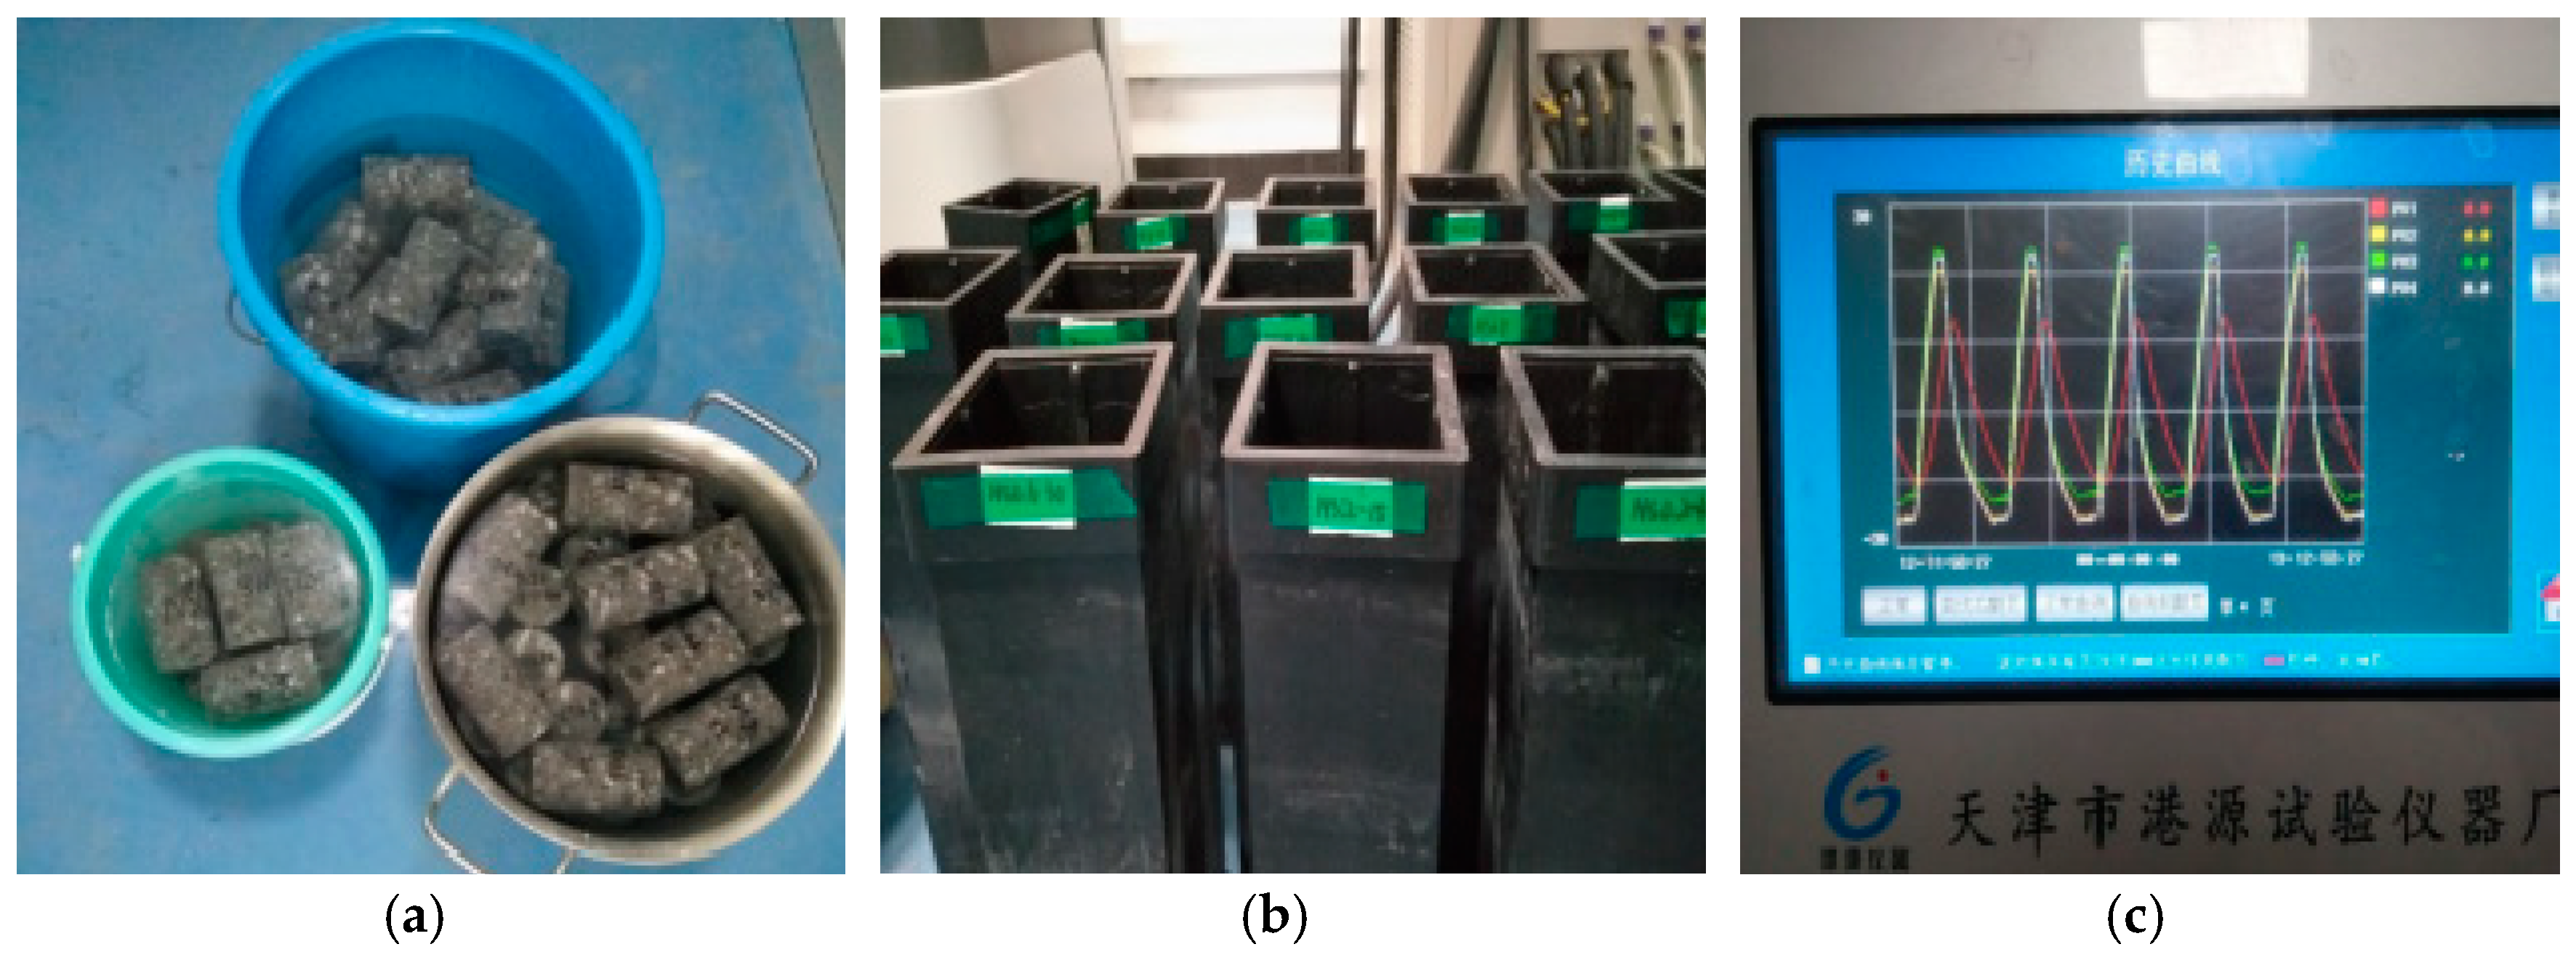
Figure 1.
The procedures of freezing and thawing cycles test. (a) Test simple soaking; (b) Sample box marking; (c) Temperature of freeze thaw setup.
Figure 1.
The procedures of freezing and thawing cycles test. (a) Test simple soaking; (b) Sample box marking; (c) Temperature of freeze thaw setup.
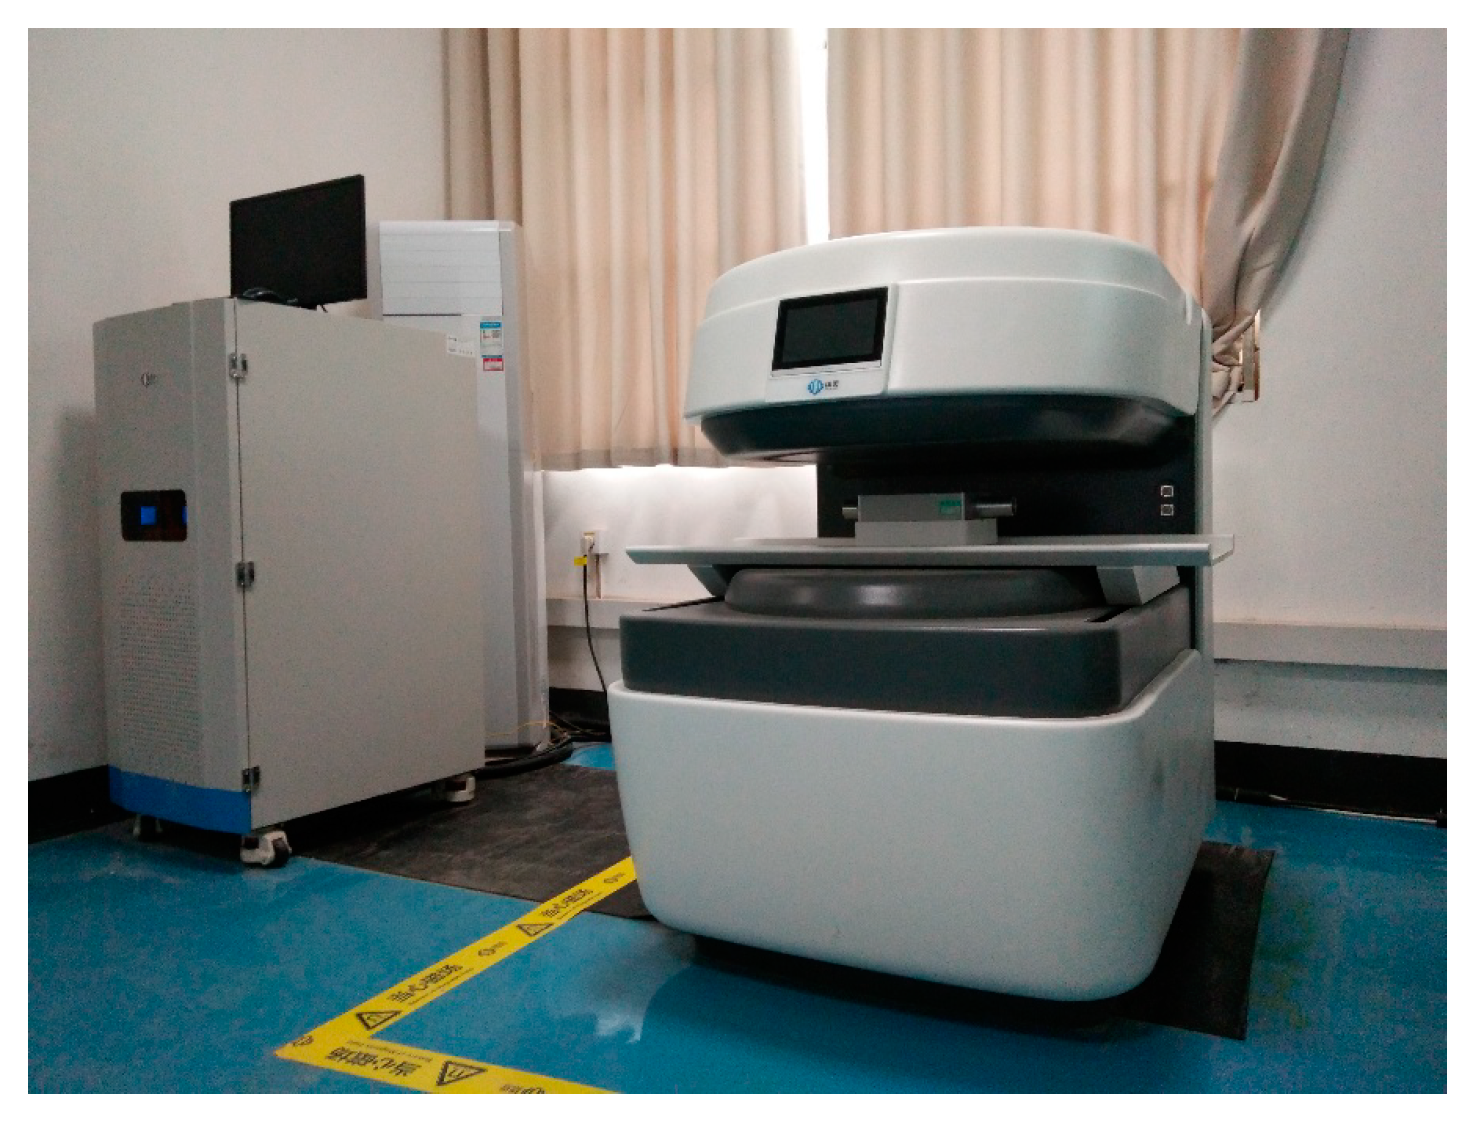
Figure 2.
The MacroMR12-150H-I instrument.
Figure 2.
The MacroMR12-150H-I instrument.
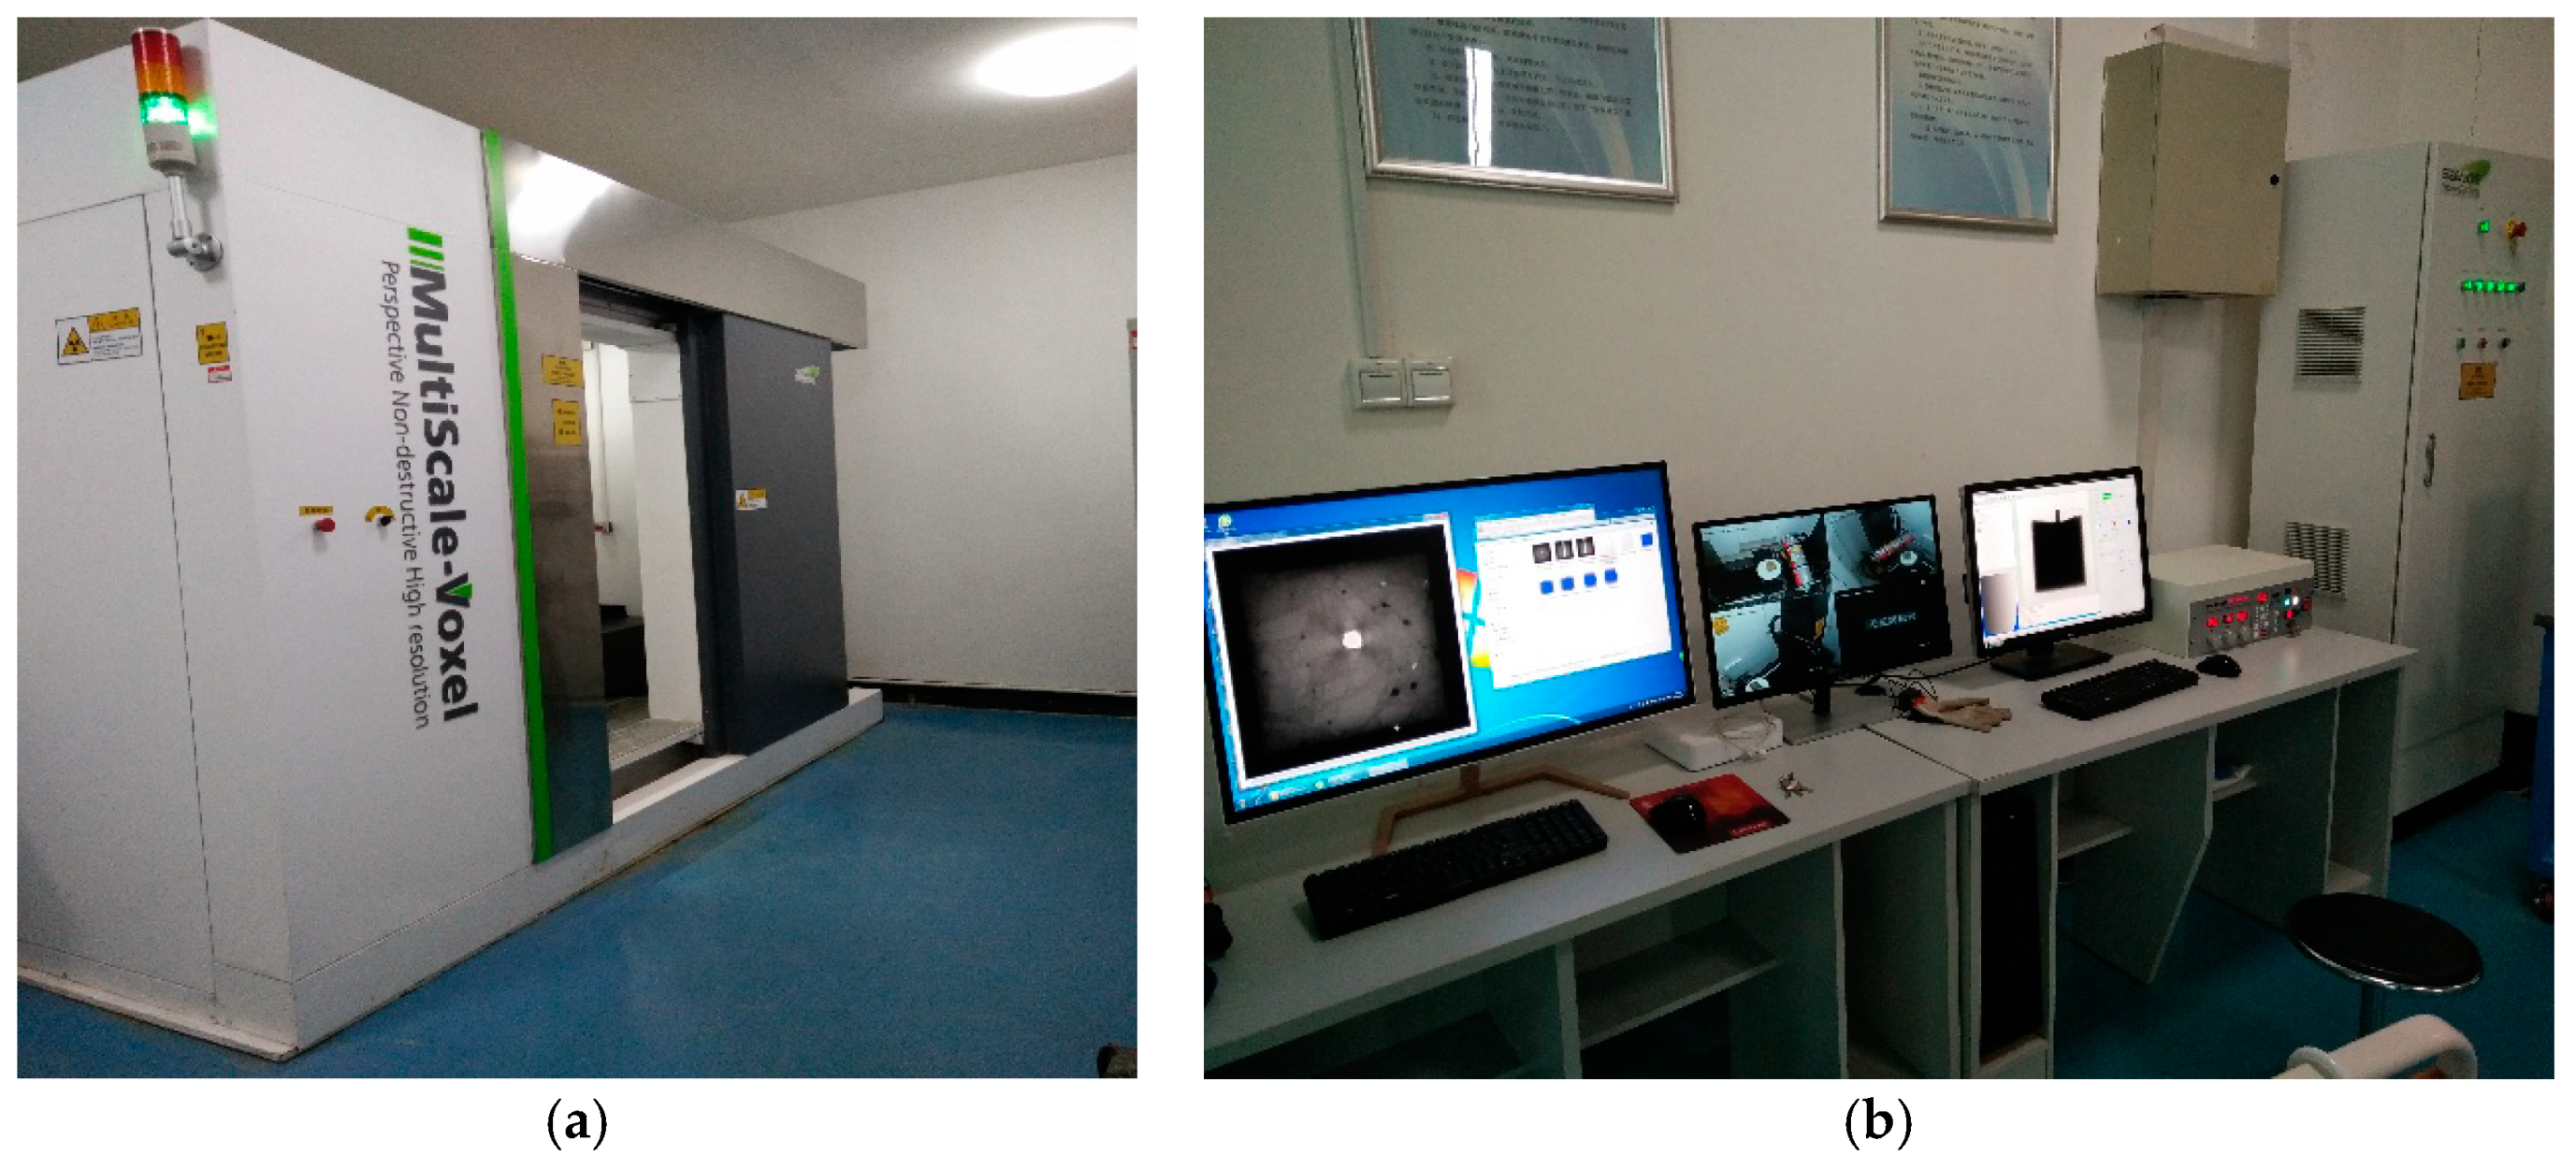
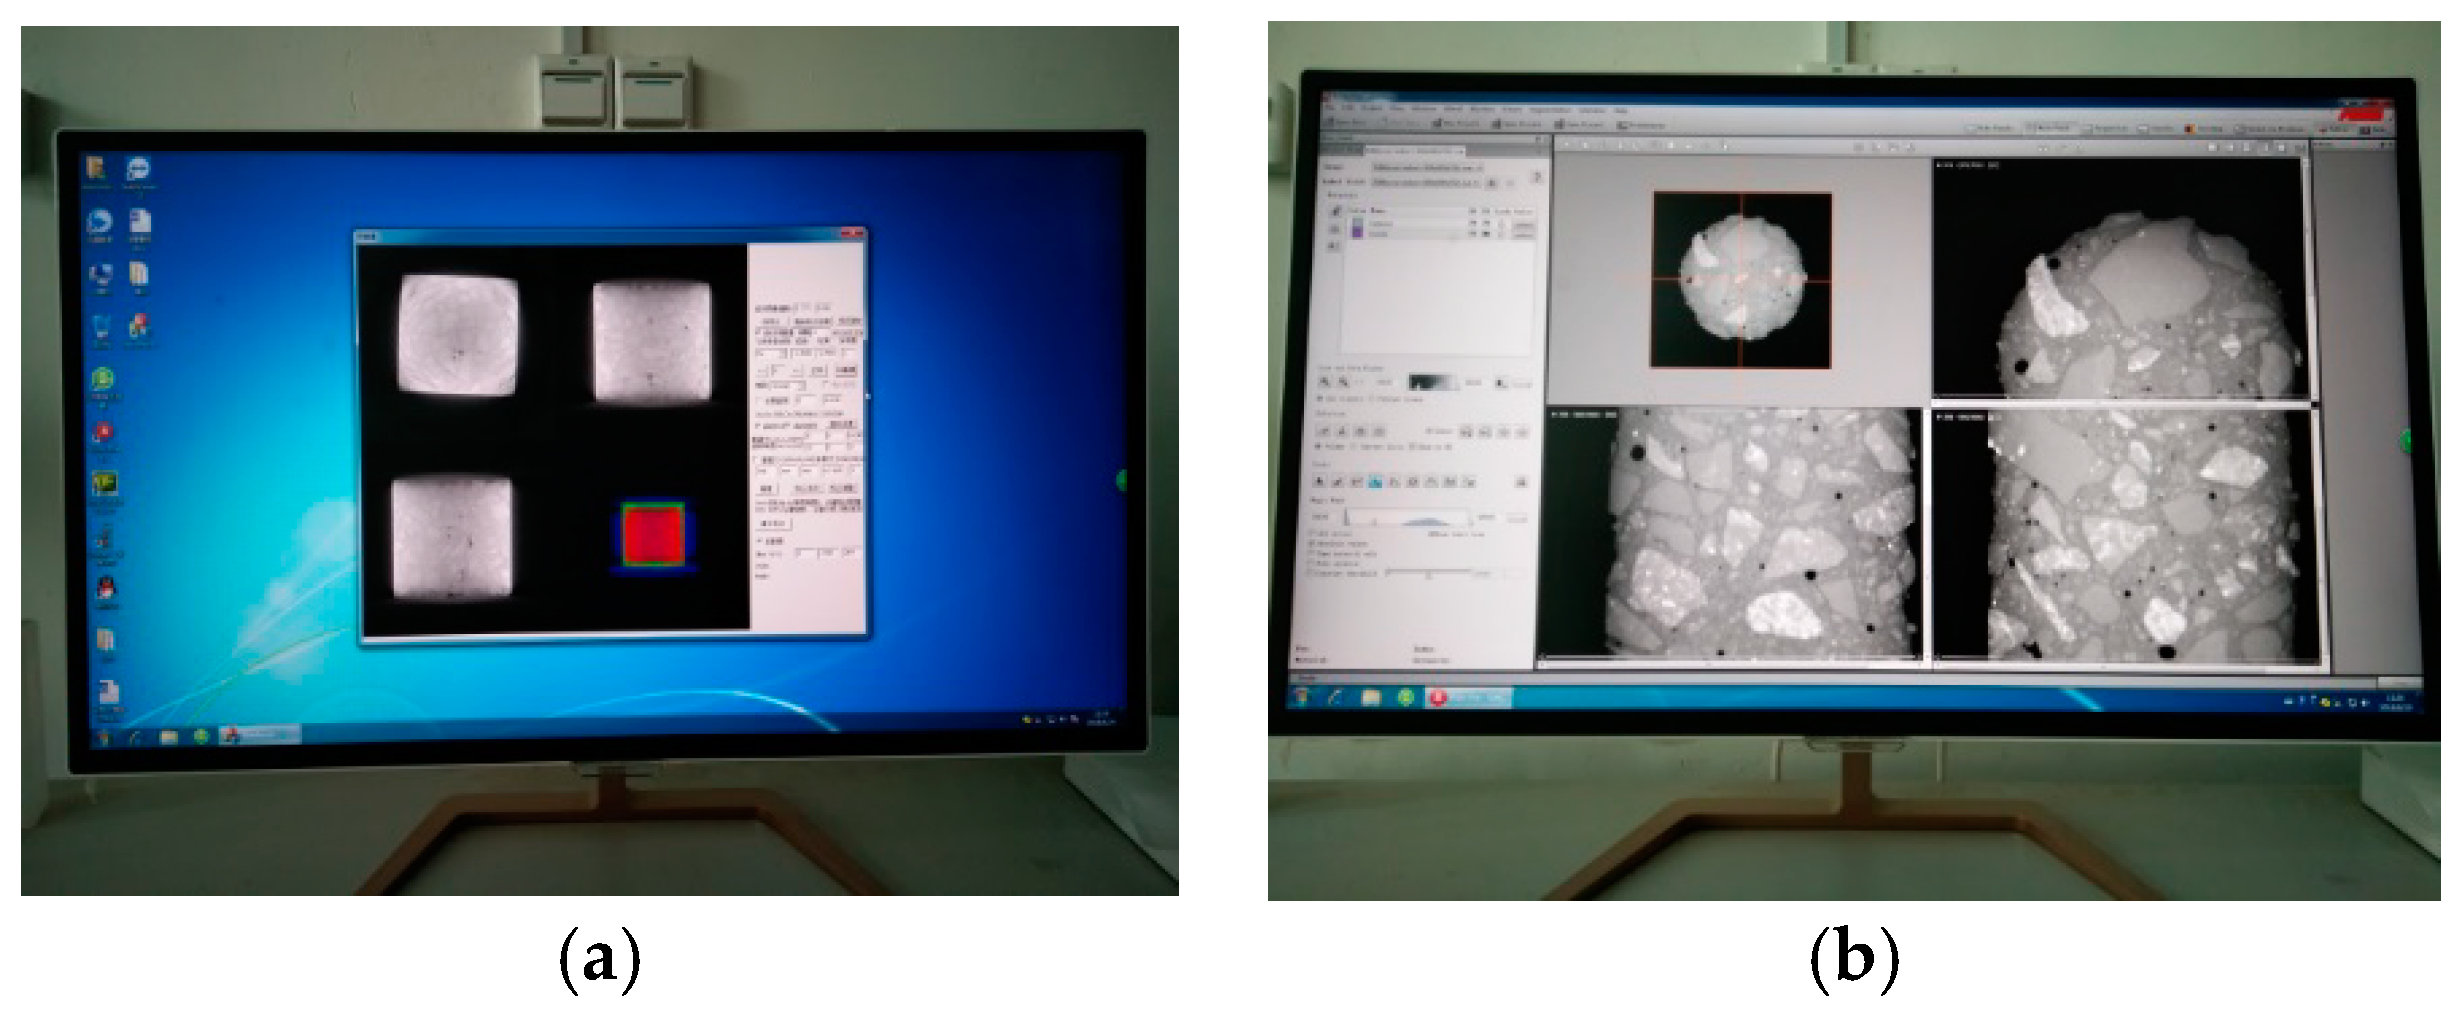
Figure 3.
The ICT Equipment. (a) The ICT Scanning Equipment; (b) The ICT Operating Equipment.
Figure 3.
The ICT Equipment. (a) The ICT Scanning Equipment; (b) The ICT Operating Equipment.
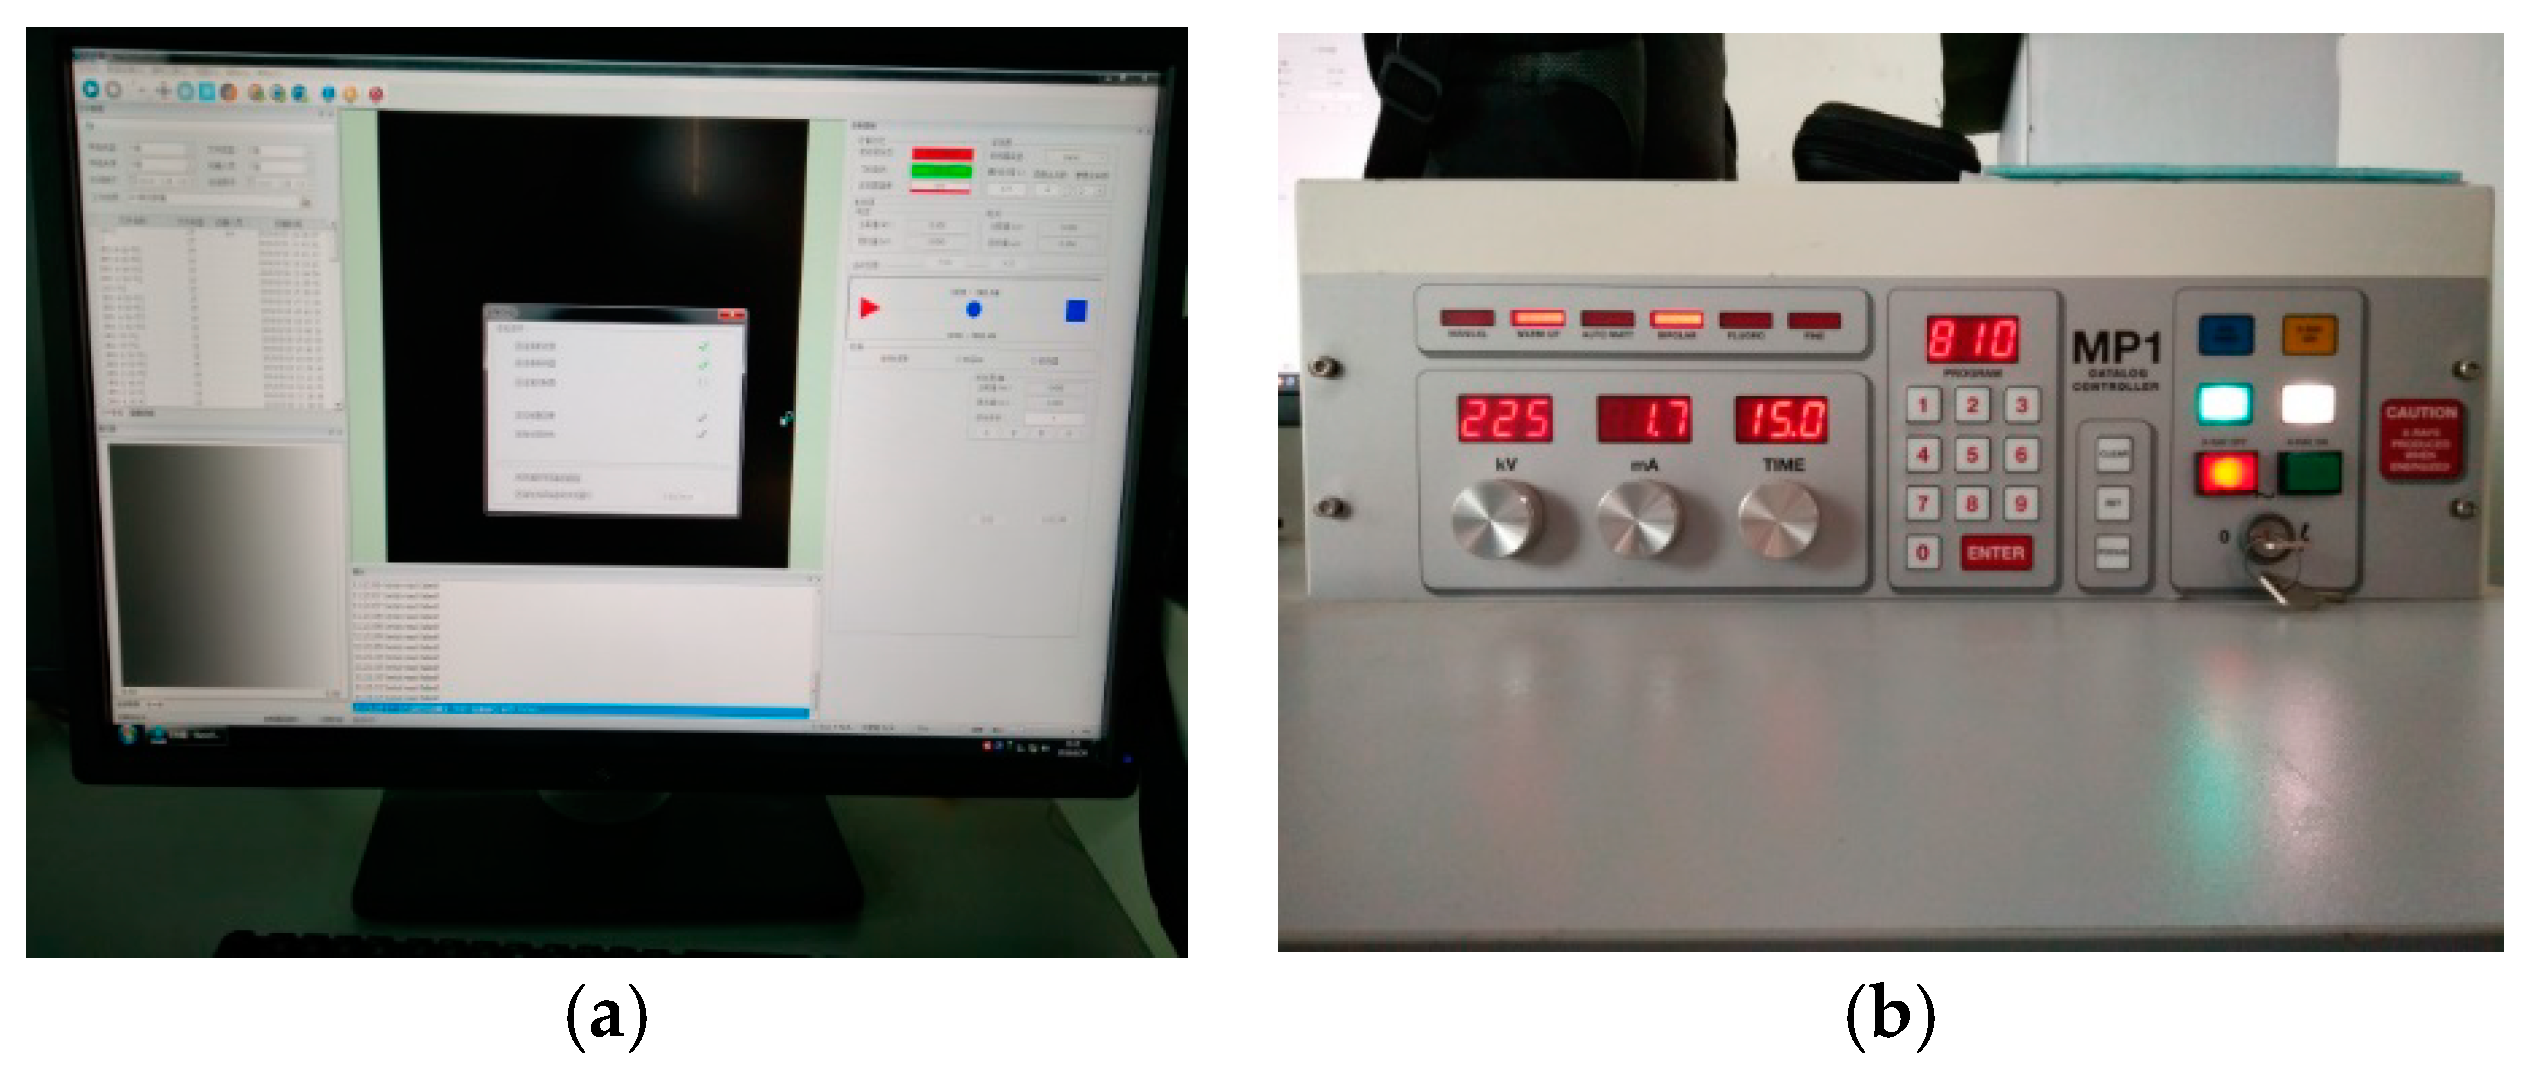
Figure 4.
The Preparations for ICT. (a) Debugging Setup Interface; (b) ICT Radiation Source Preheating.
Figure 4.
The Preparations for ICT. (a) Debugging Setup Interface; (b) ICT Radiation Source Preheating.
Figure 5.
Preliminary Data Processing. (a) Data Pre-processing Interface; (b) Avizo Data Post-Processing Interface.
Figure 5.
Preliminary Data Processing. (a) Data Pre-processing Interface; (b) Avizo Data Post-Processing Interface.
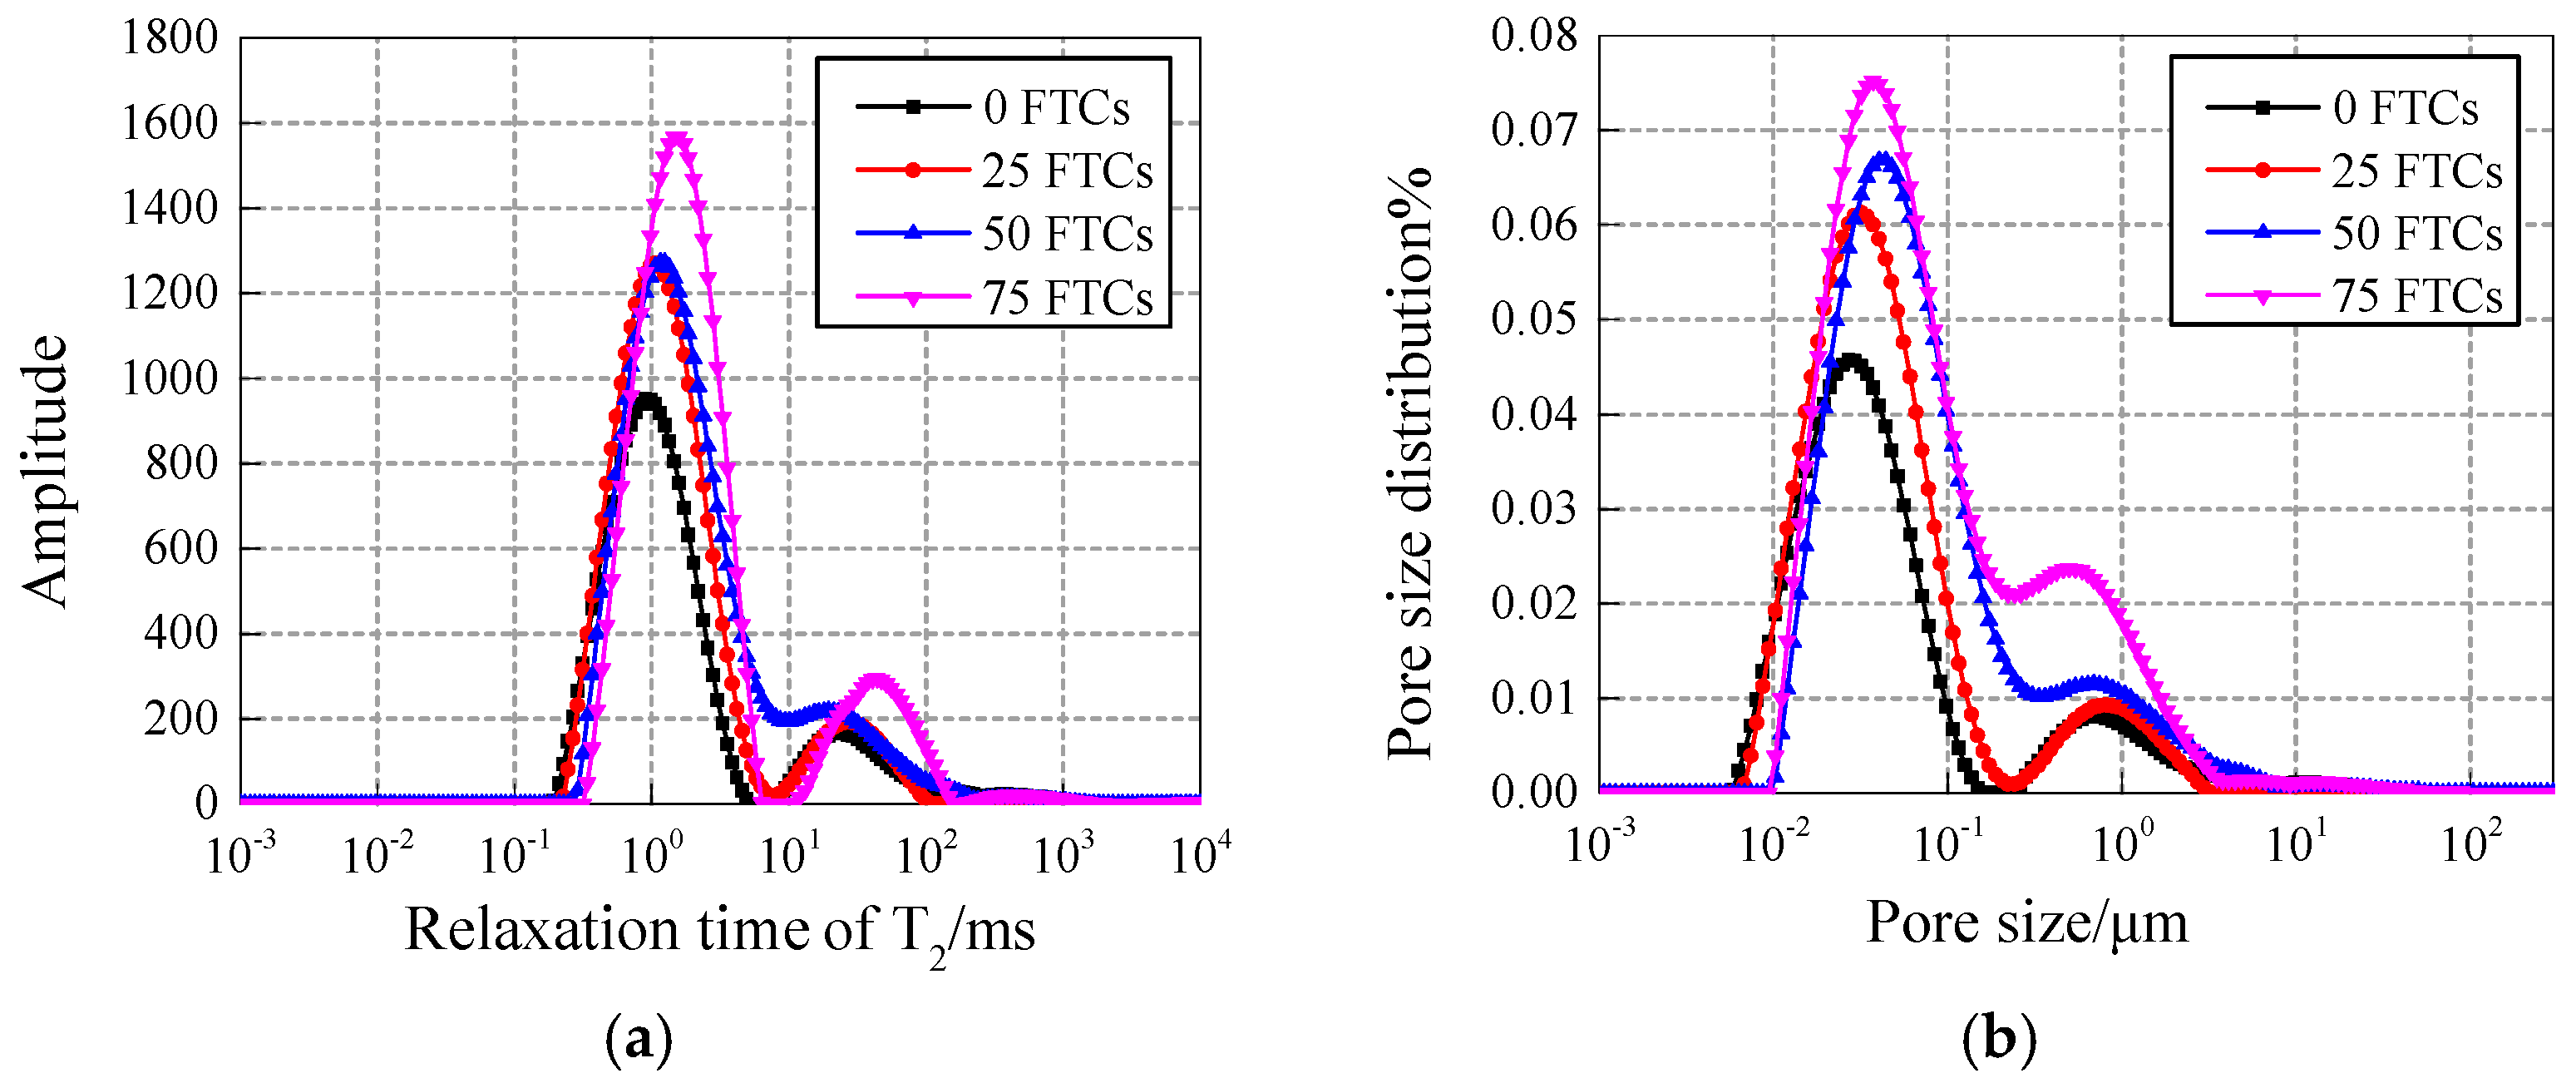
Figure 6.
(a) T2 spectrum and (b) pore fluid size distribution of the 15 nm-NS specimens.
Figure 6.
(a) T2 spectrum and (b) pore fluid size distribution of the 15 nm-NS specimens.
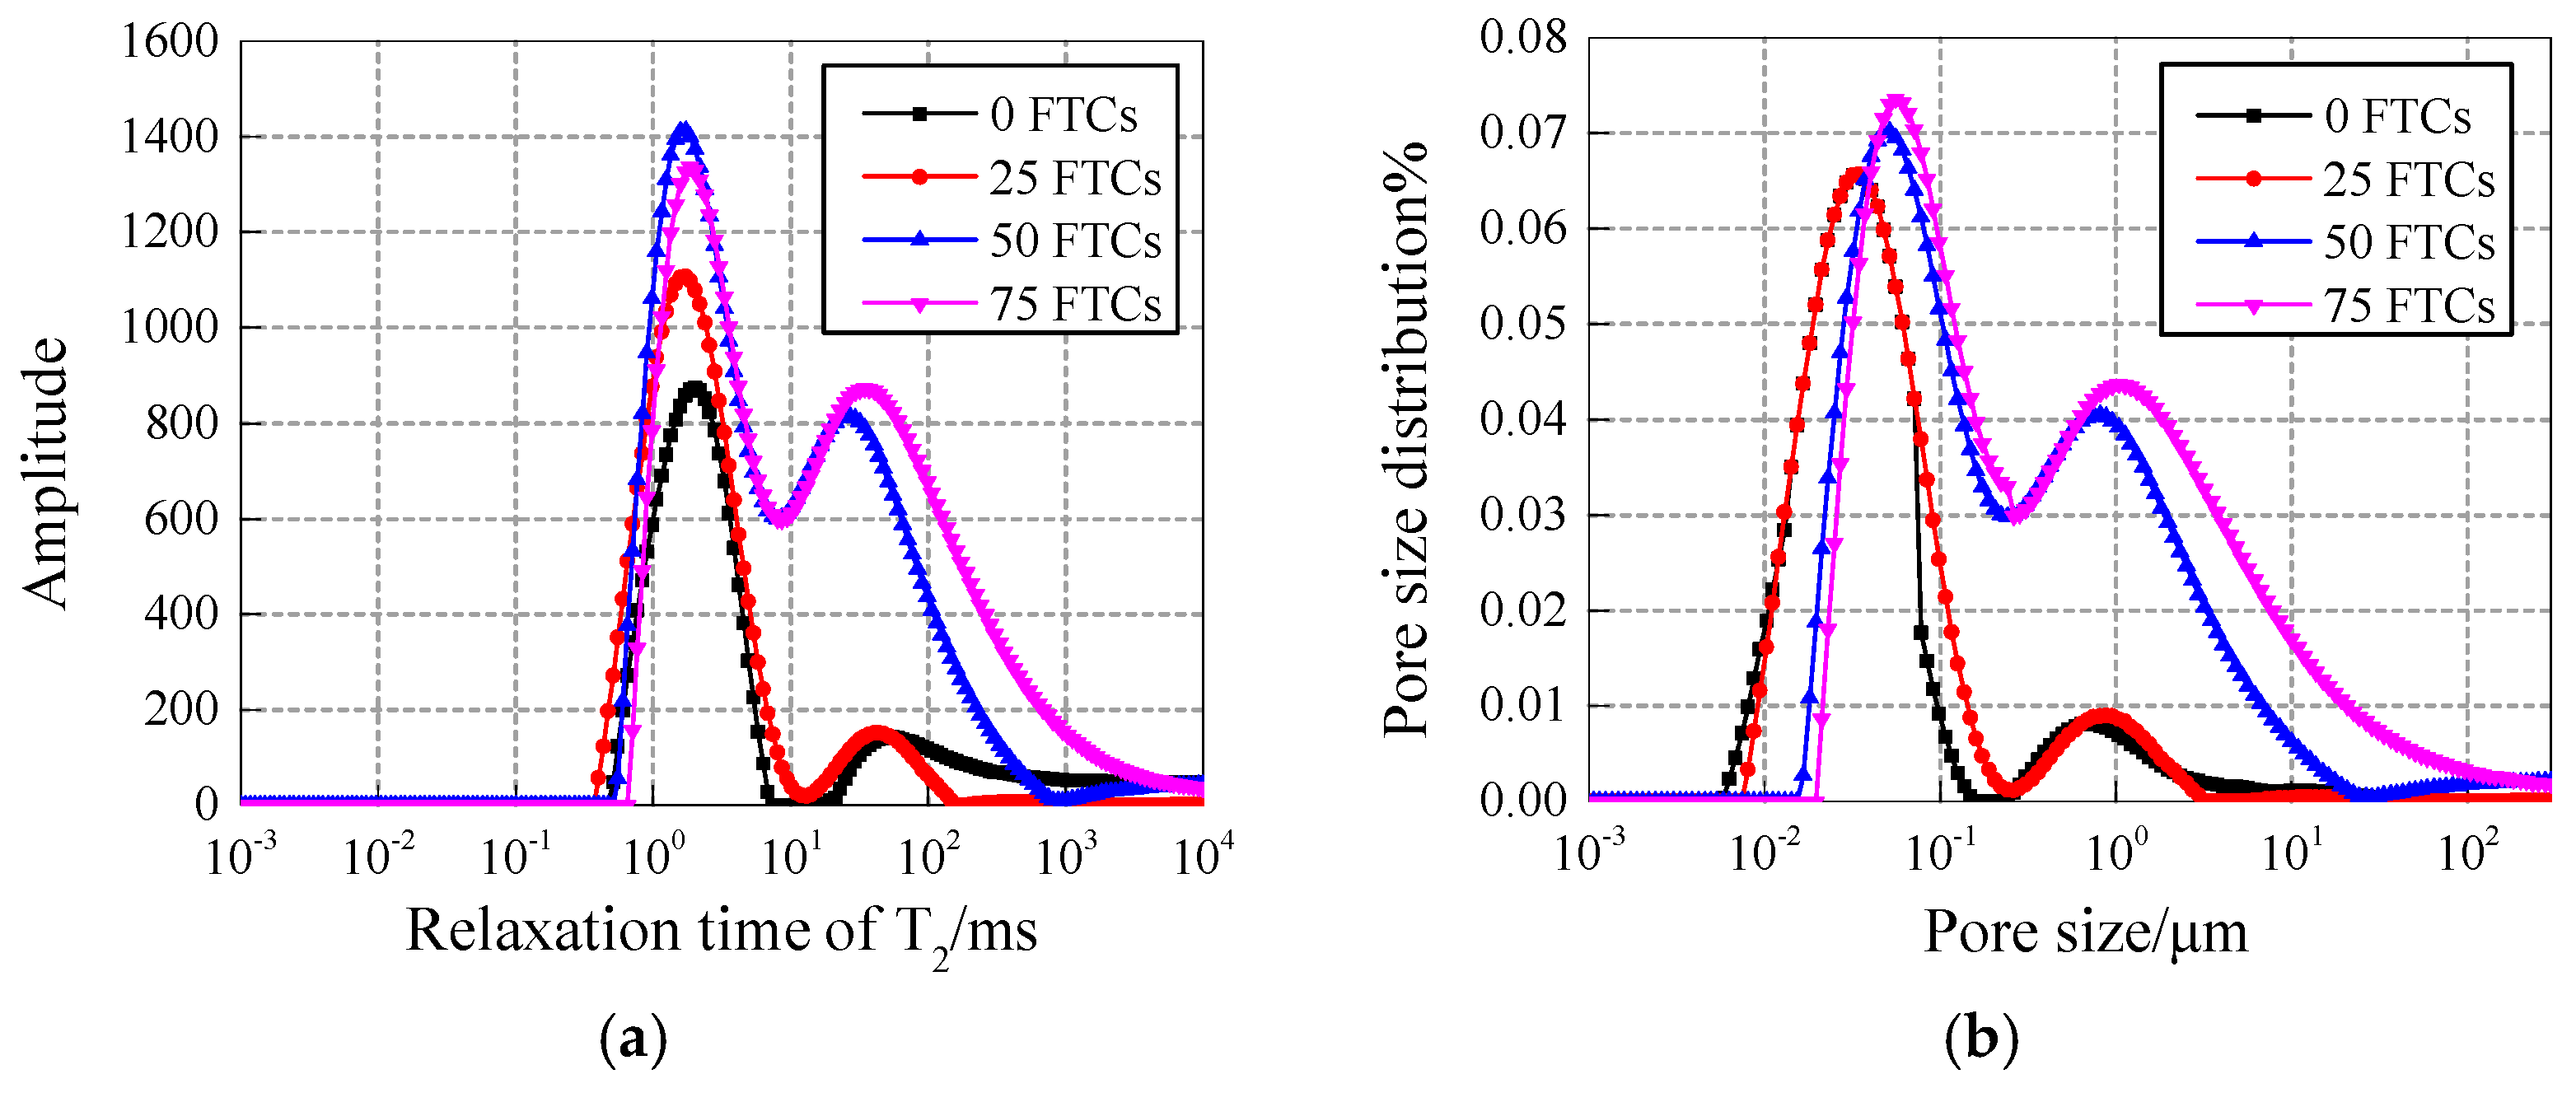
Figure 7.
(a) T2 spectrum and (b) pore fluid size distribution of 30 nm-NS specimens.
Figure 7.
(a) T2 spectrum and (b) pore fluid size distribution of 30 nm-NS specimens.
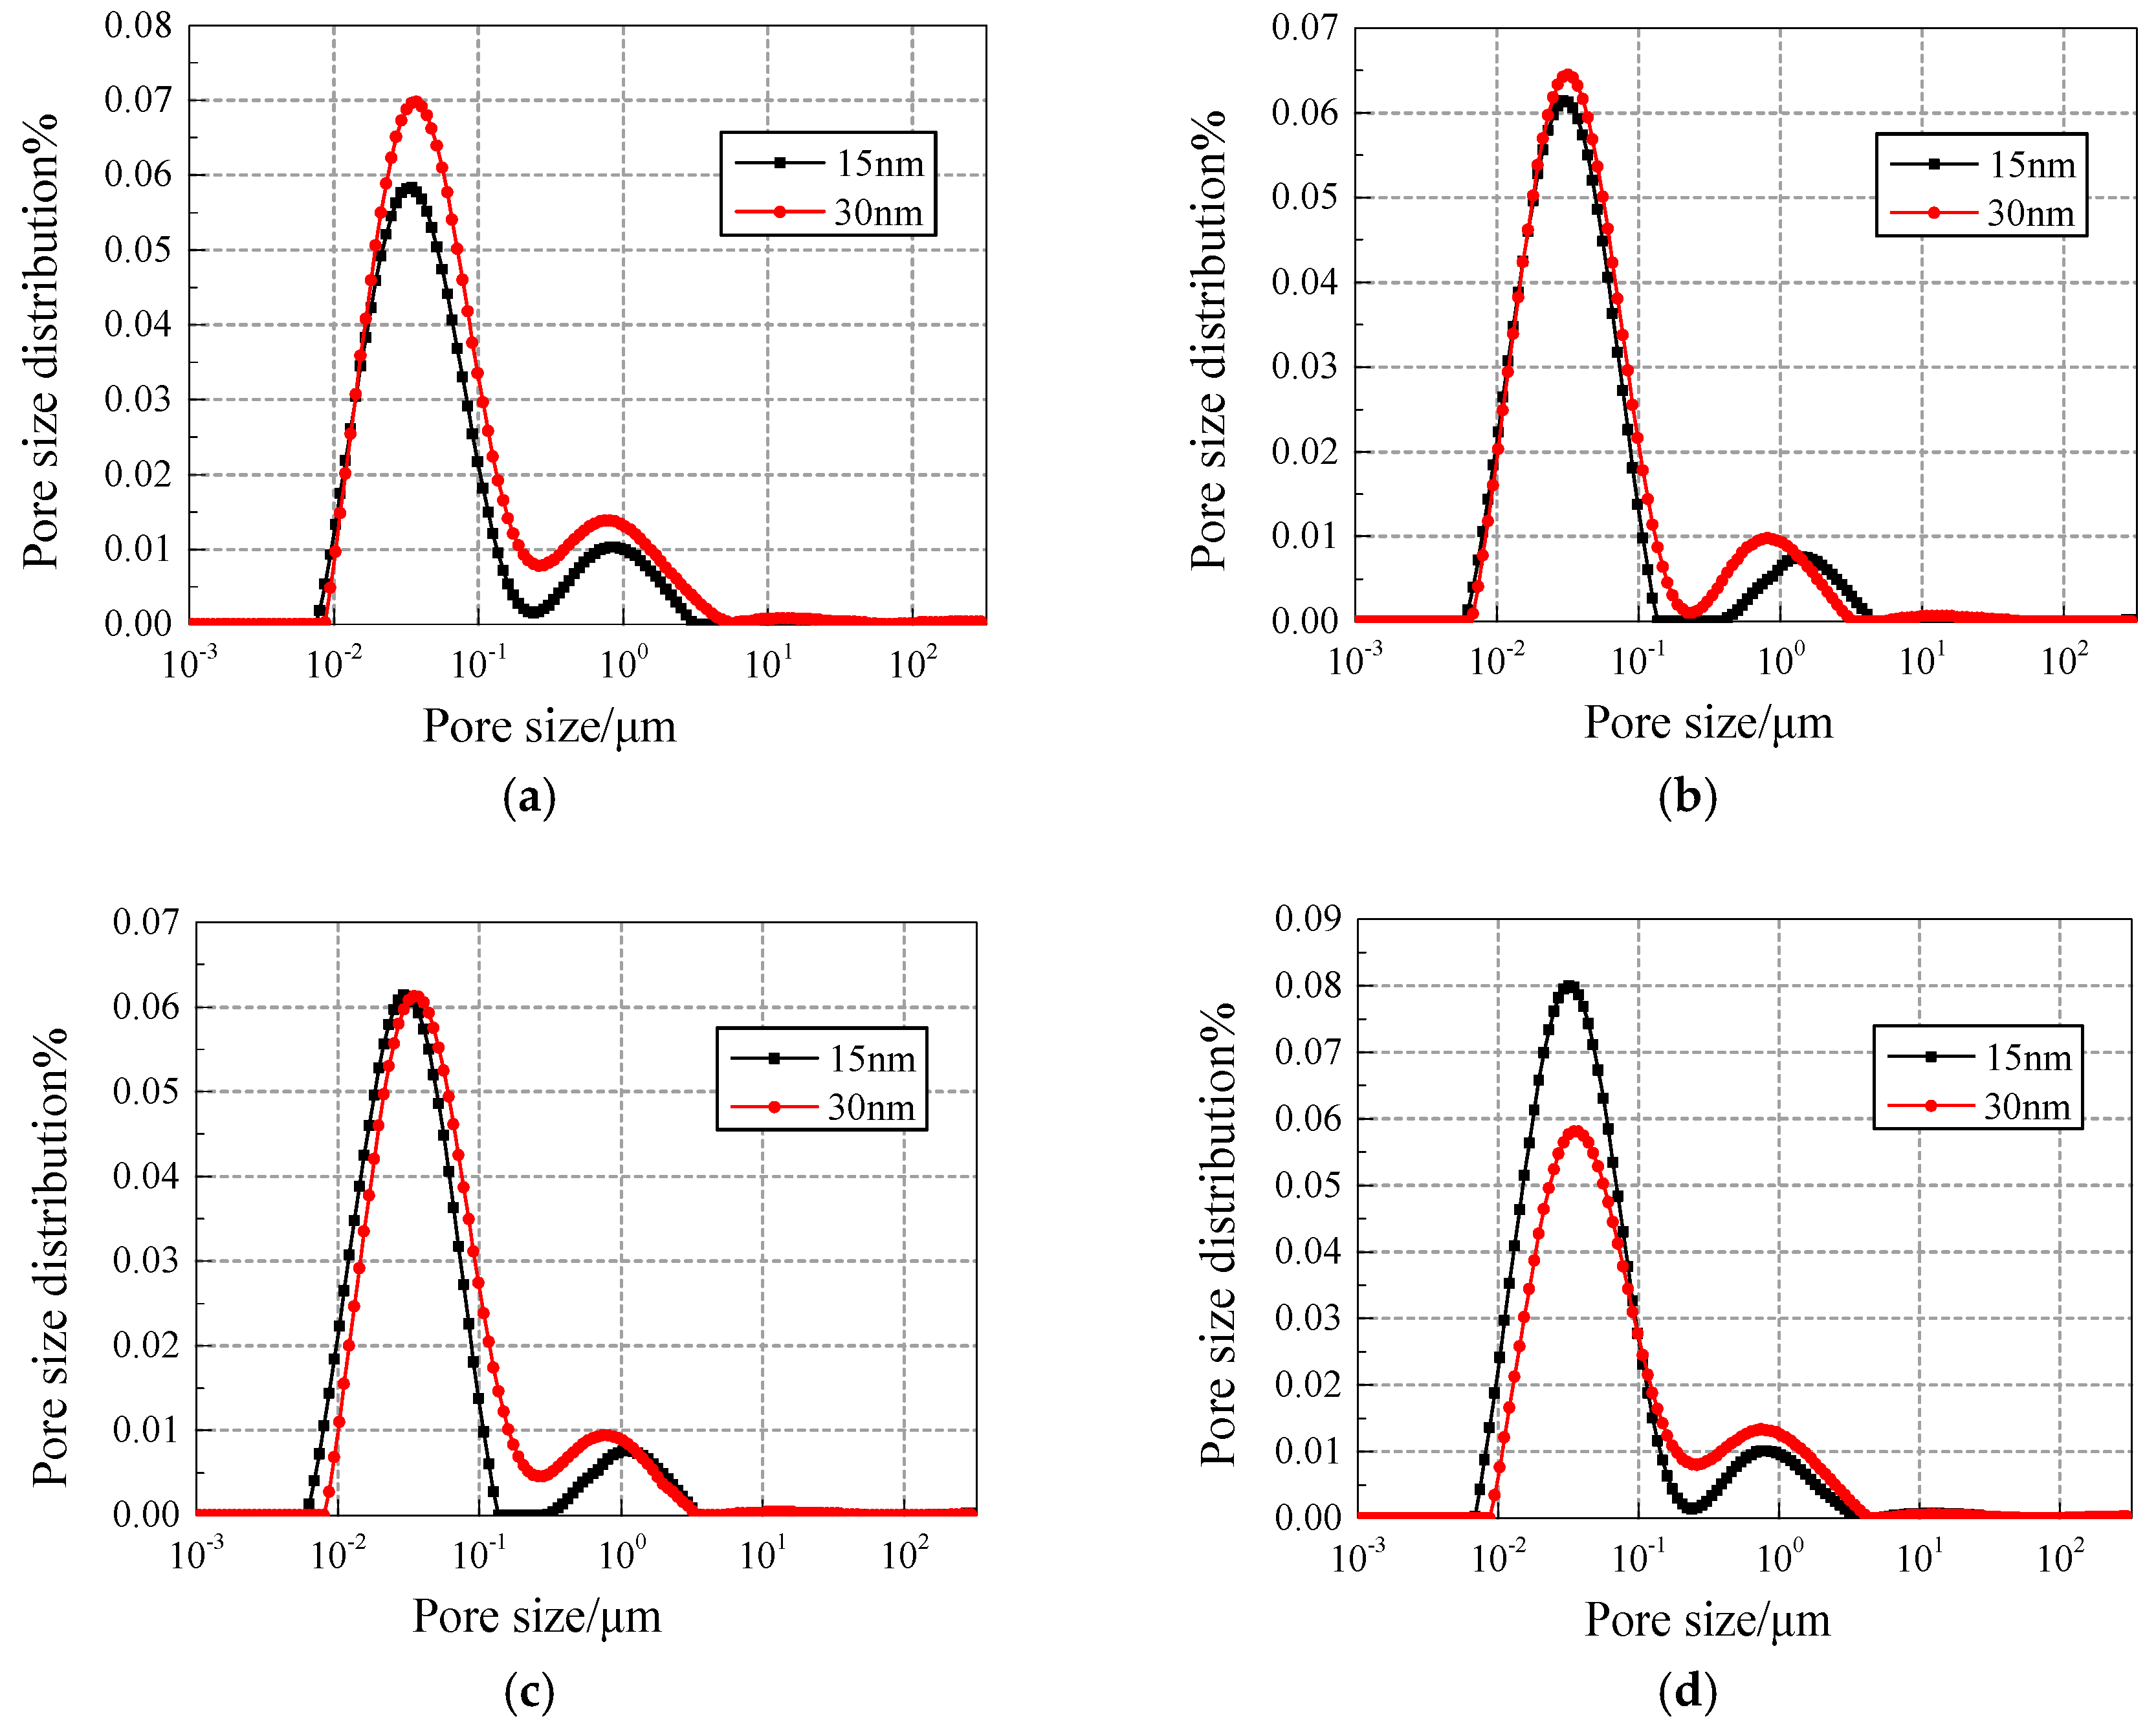
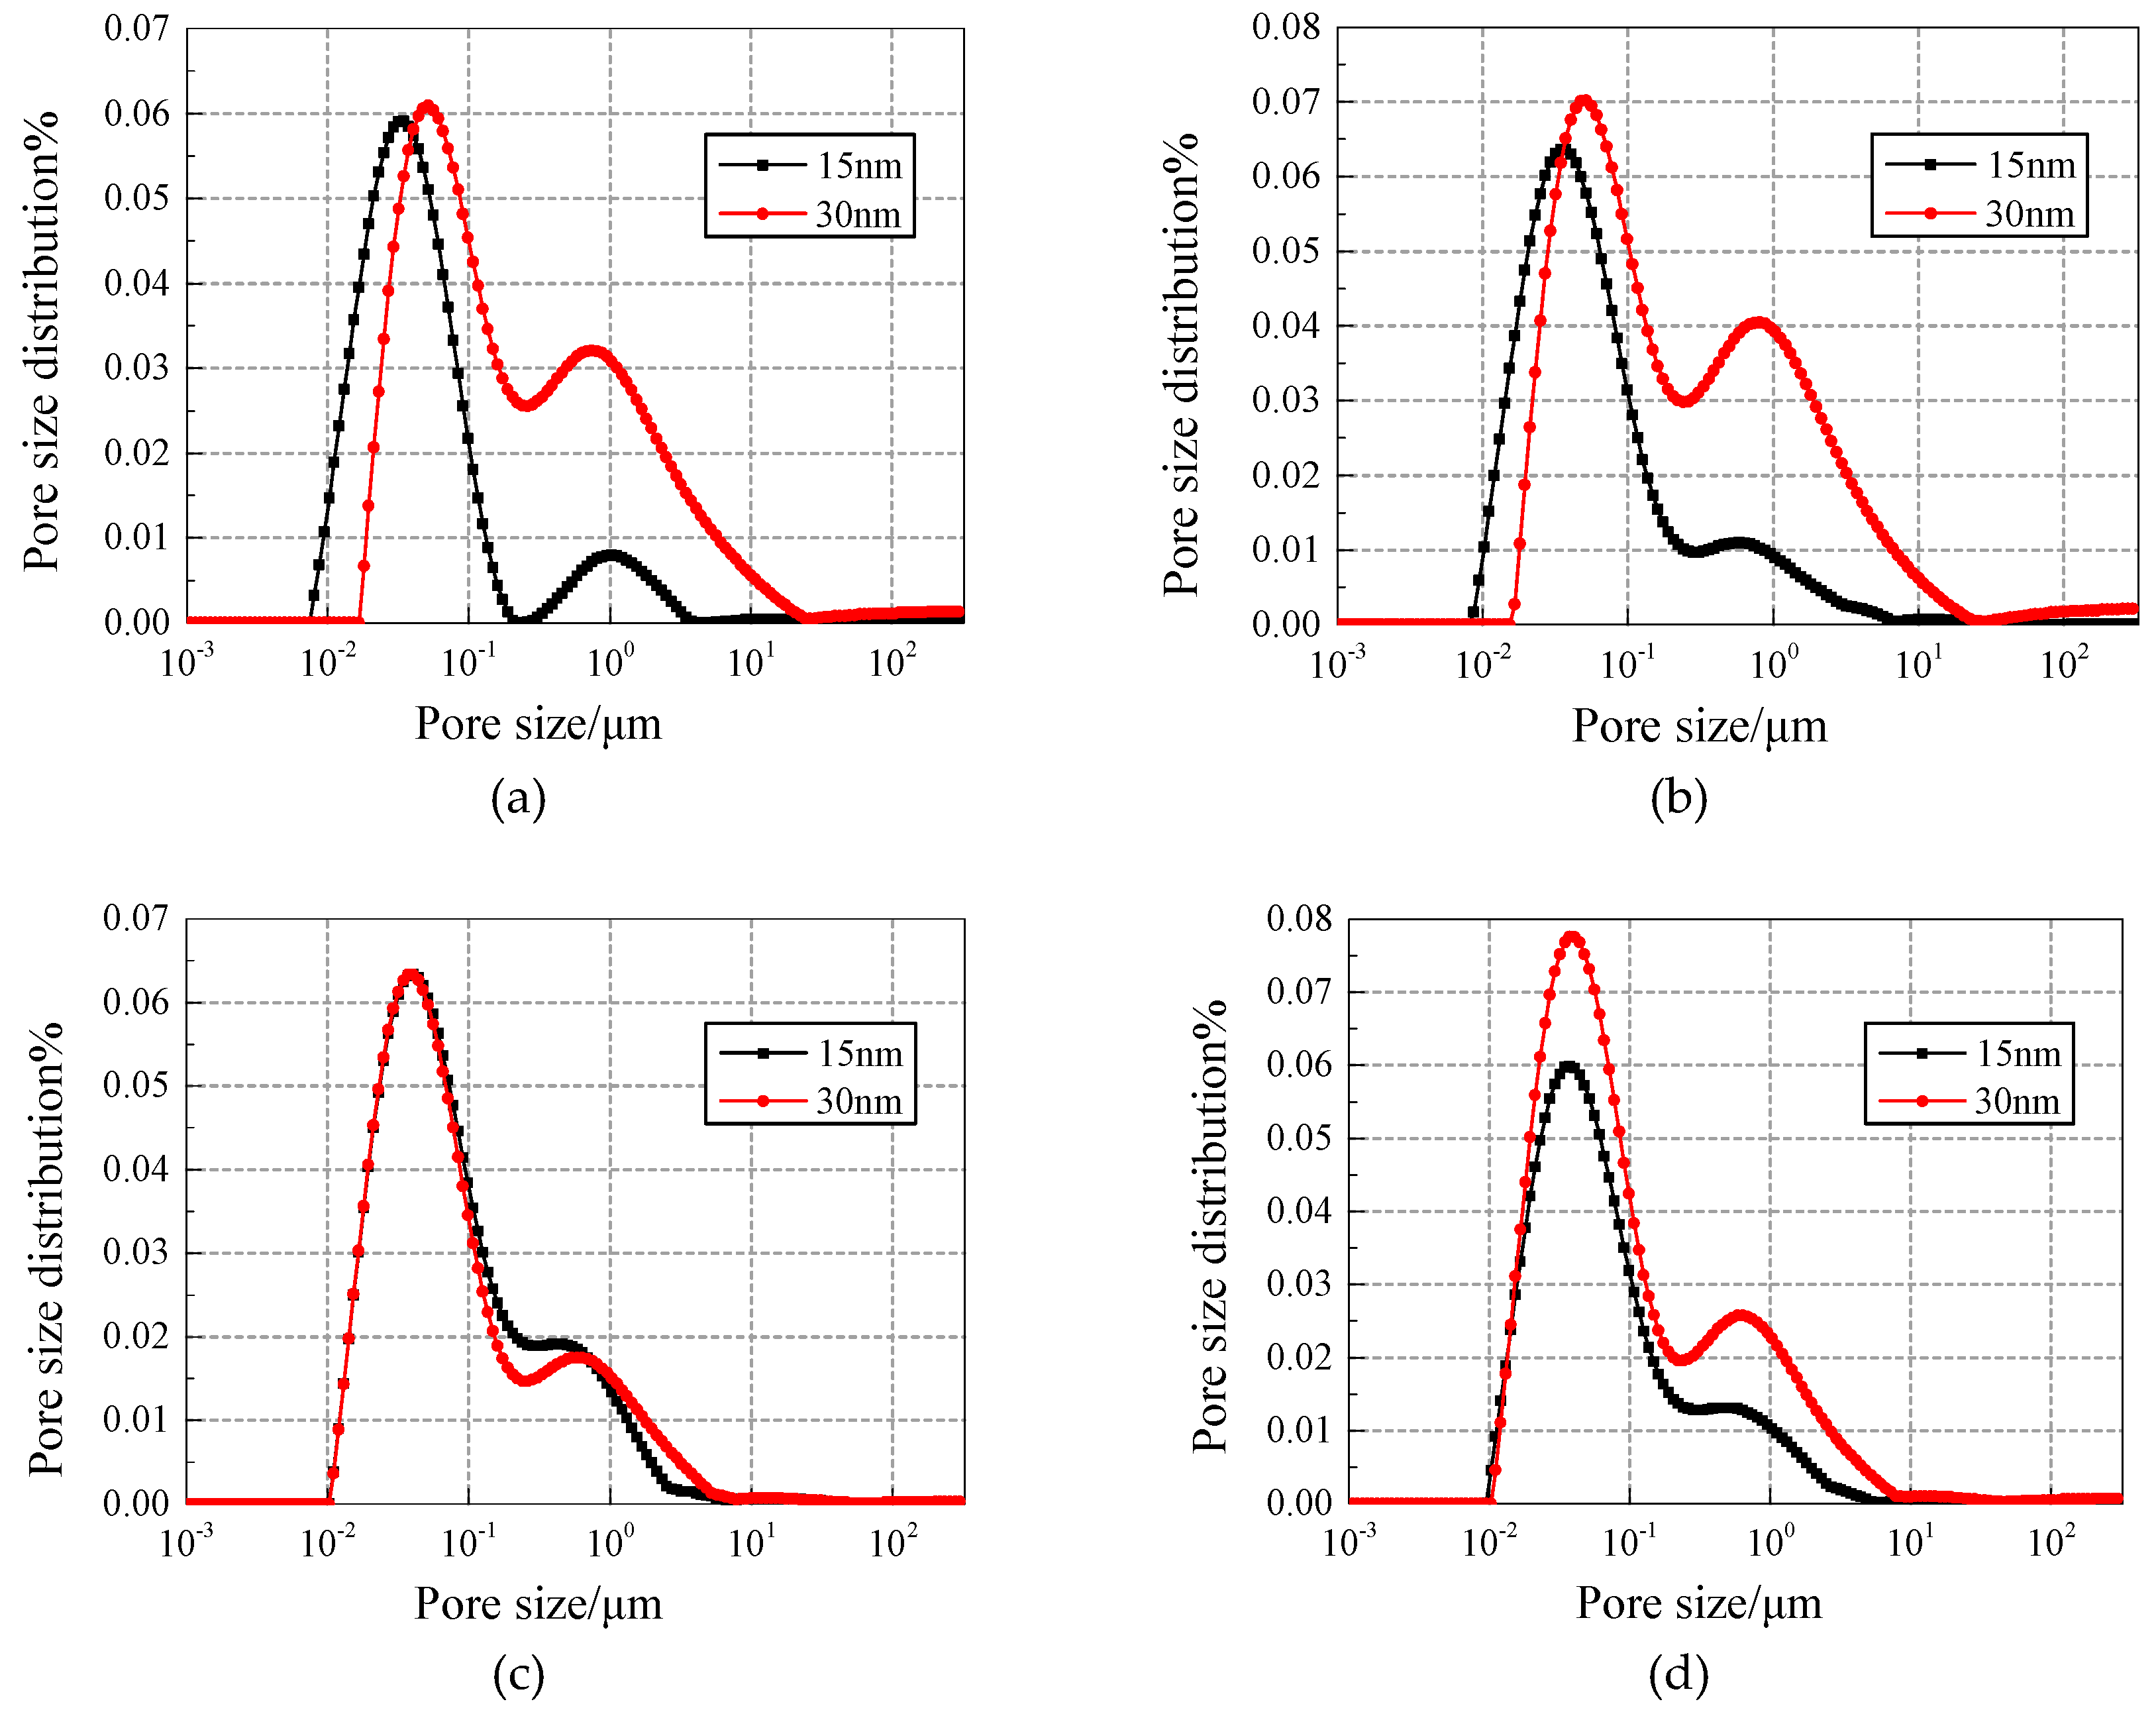
Figure 8.
Pore fluid size distribution of NS specimens with different contents under 25 freezing and thawing cycles. (a) Content of 0.2%; (b) Content of 0.4%; (c) Content of 0.6%; (d) Content of 0.8%.
Figure 8.
Pore fluid size distribution of NS specimens with different contents under 25 freezing and thawing cycles. (a) Content of 0.2%; (b) Content of 0.4%; (c) Content of 0.6%; (d) Content of 0.8%.
Figure 9.
Pore fluid size distribution of NS specimens with different contents under 50 freezing and thawing cycles. (a) Content of 0.2%; (b) Content of 0.4%; (c) Content of 0.6%; (d) Content of 0.8%.
Figure 9.
Pore fluid size distribution of NS specimens with different contents under 50 freezing and thawing cycles. (a) Content of 0.2%; (b) Content of 0.4%; (c) Content of 0.6%; (d) Content of 0.8%.
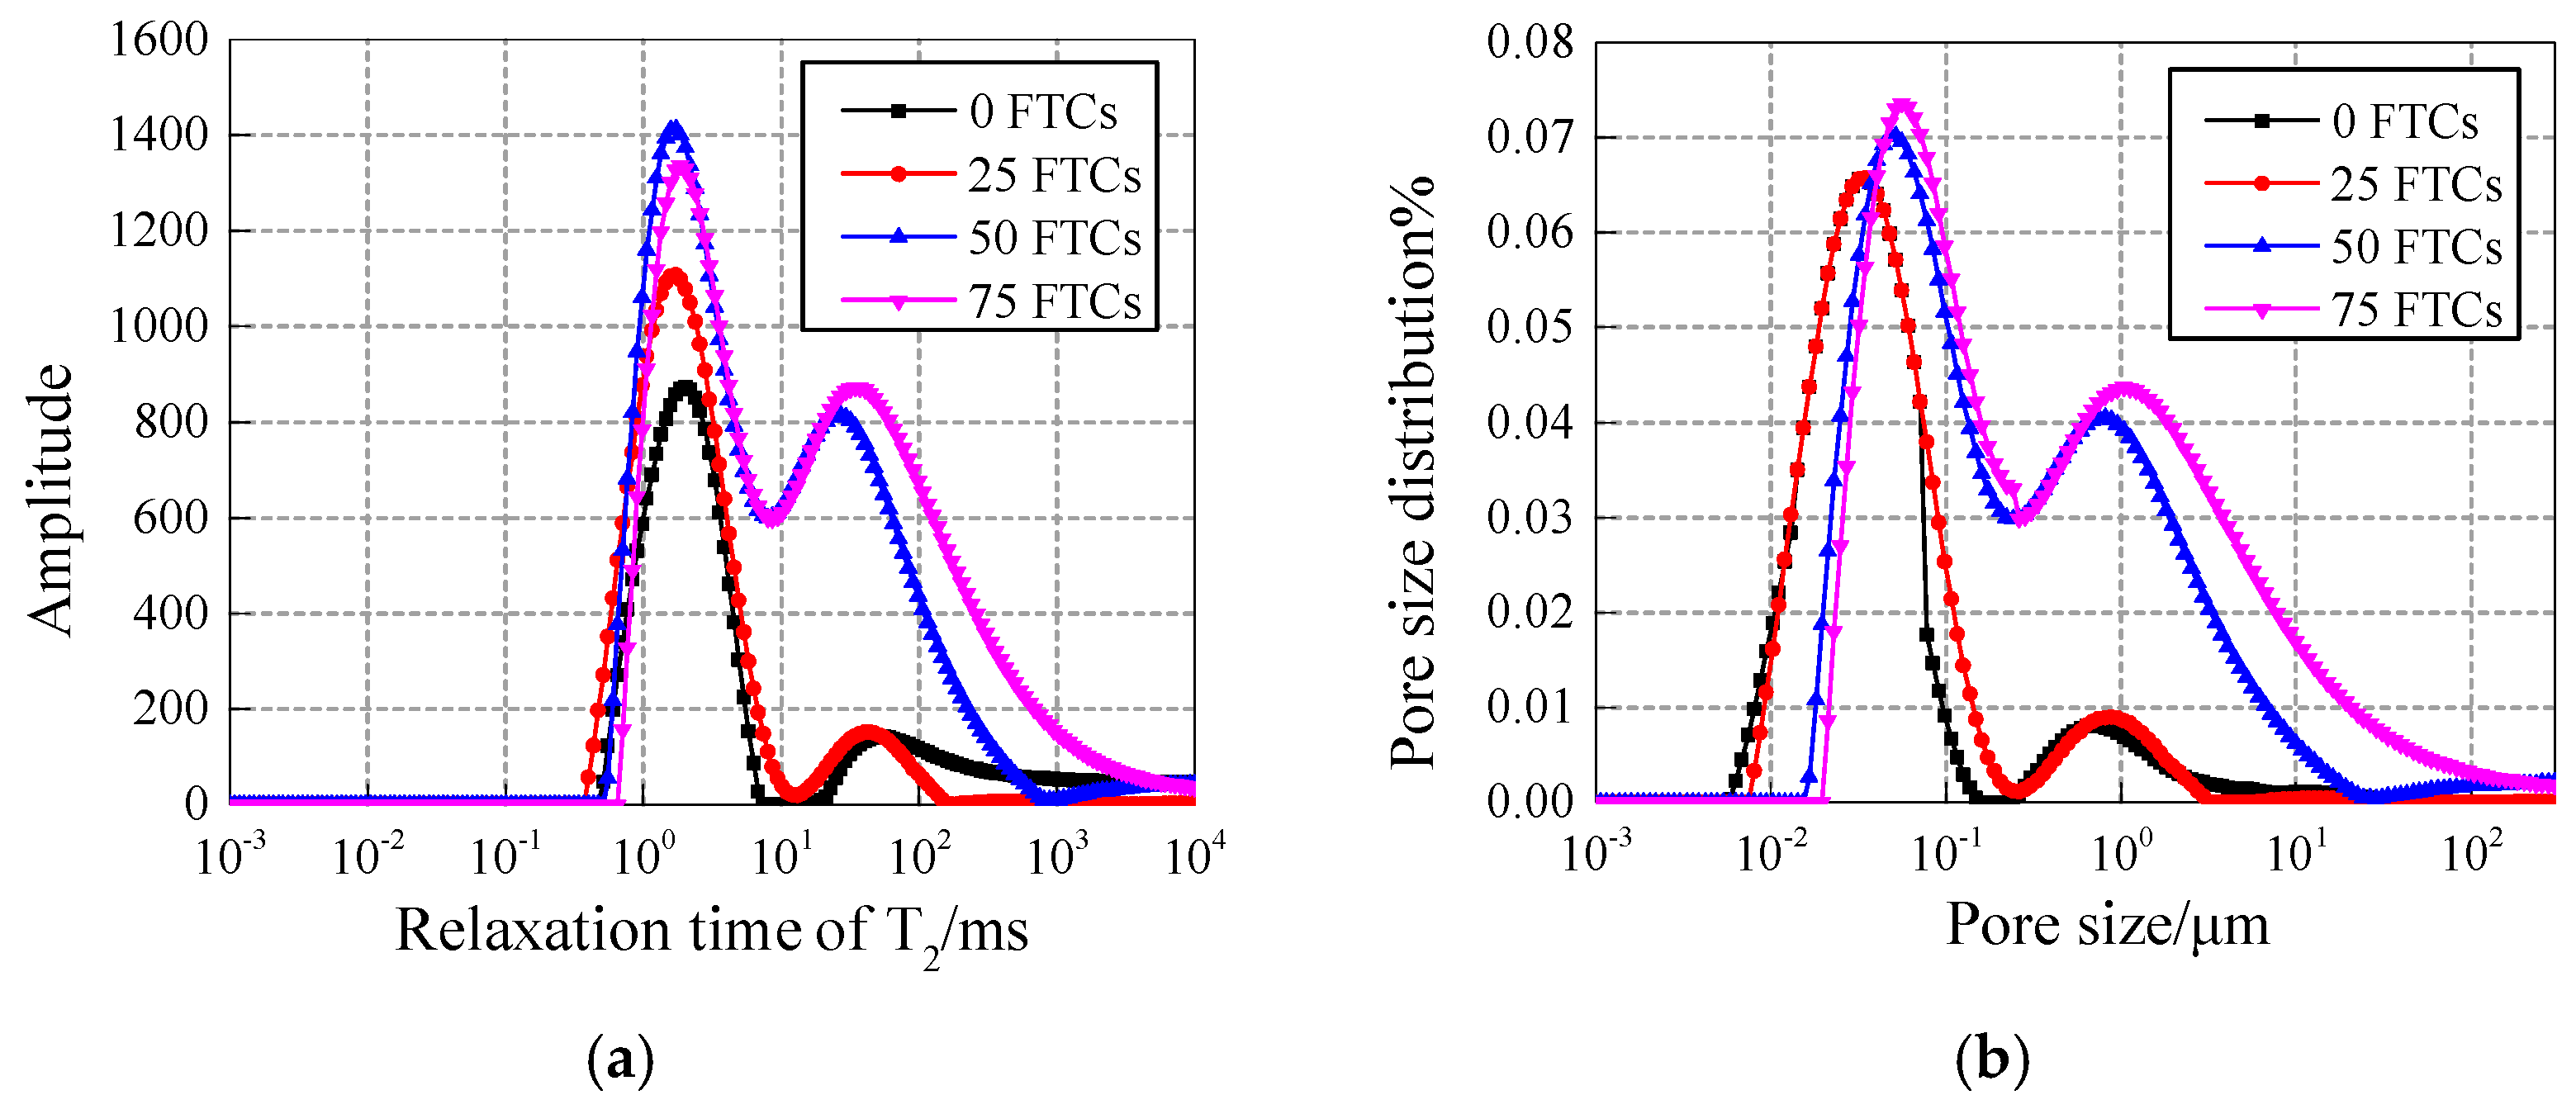
Figure 10.
(a) T2 spectrum and (b) pore fluid size distribution of 30 nm-NS added concrete.
Figure 10.
(a) T2 spectrum and (b) pore fluid size distribution of 30 nm-NS added concrete.
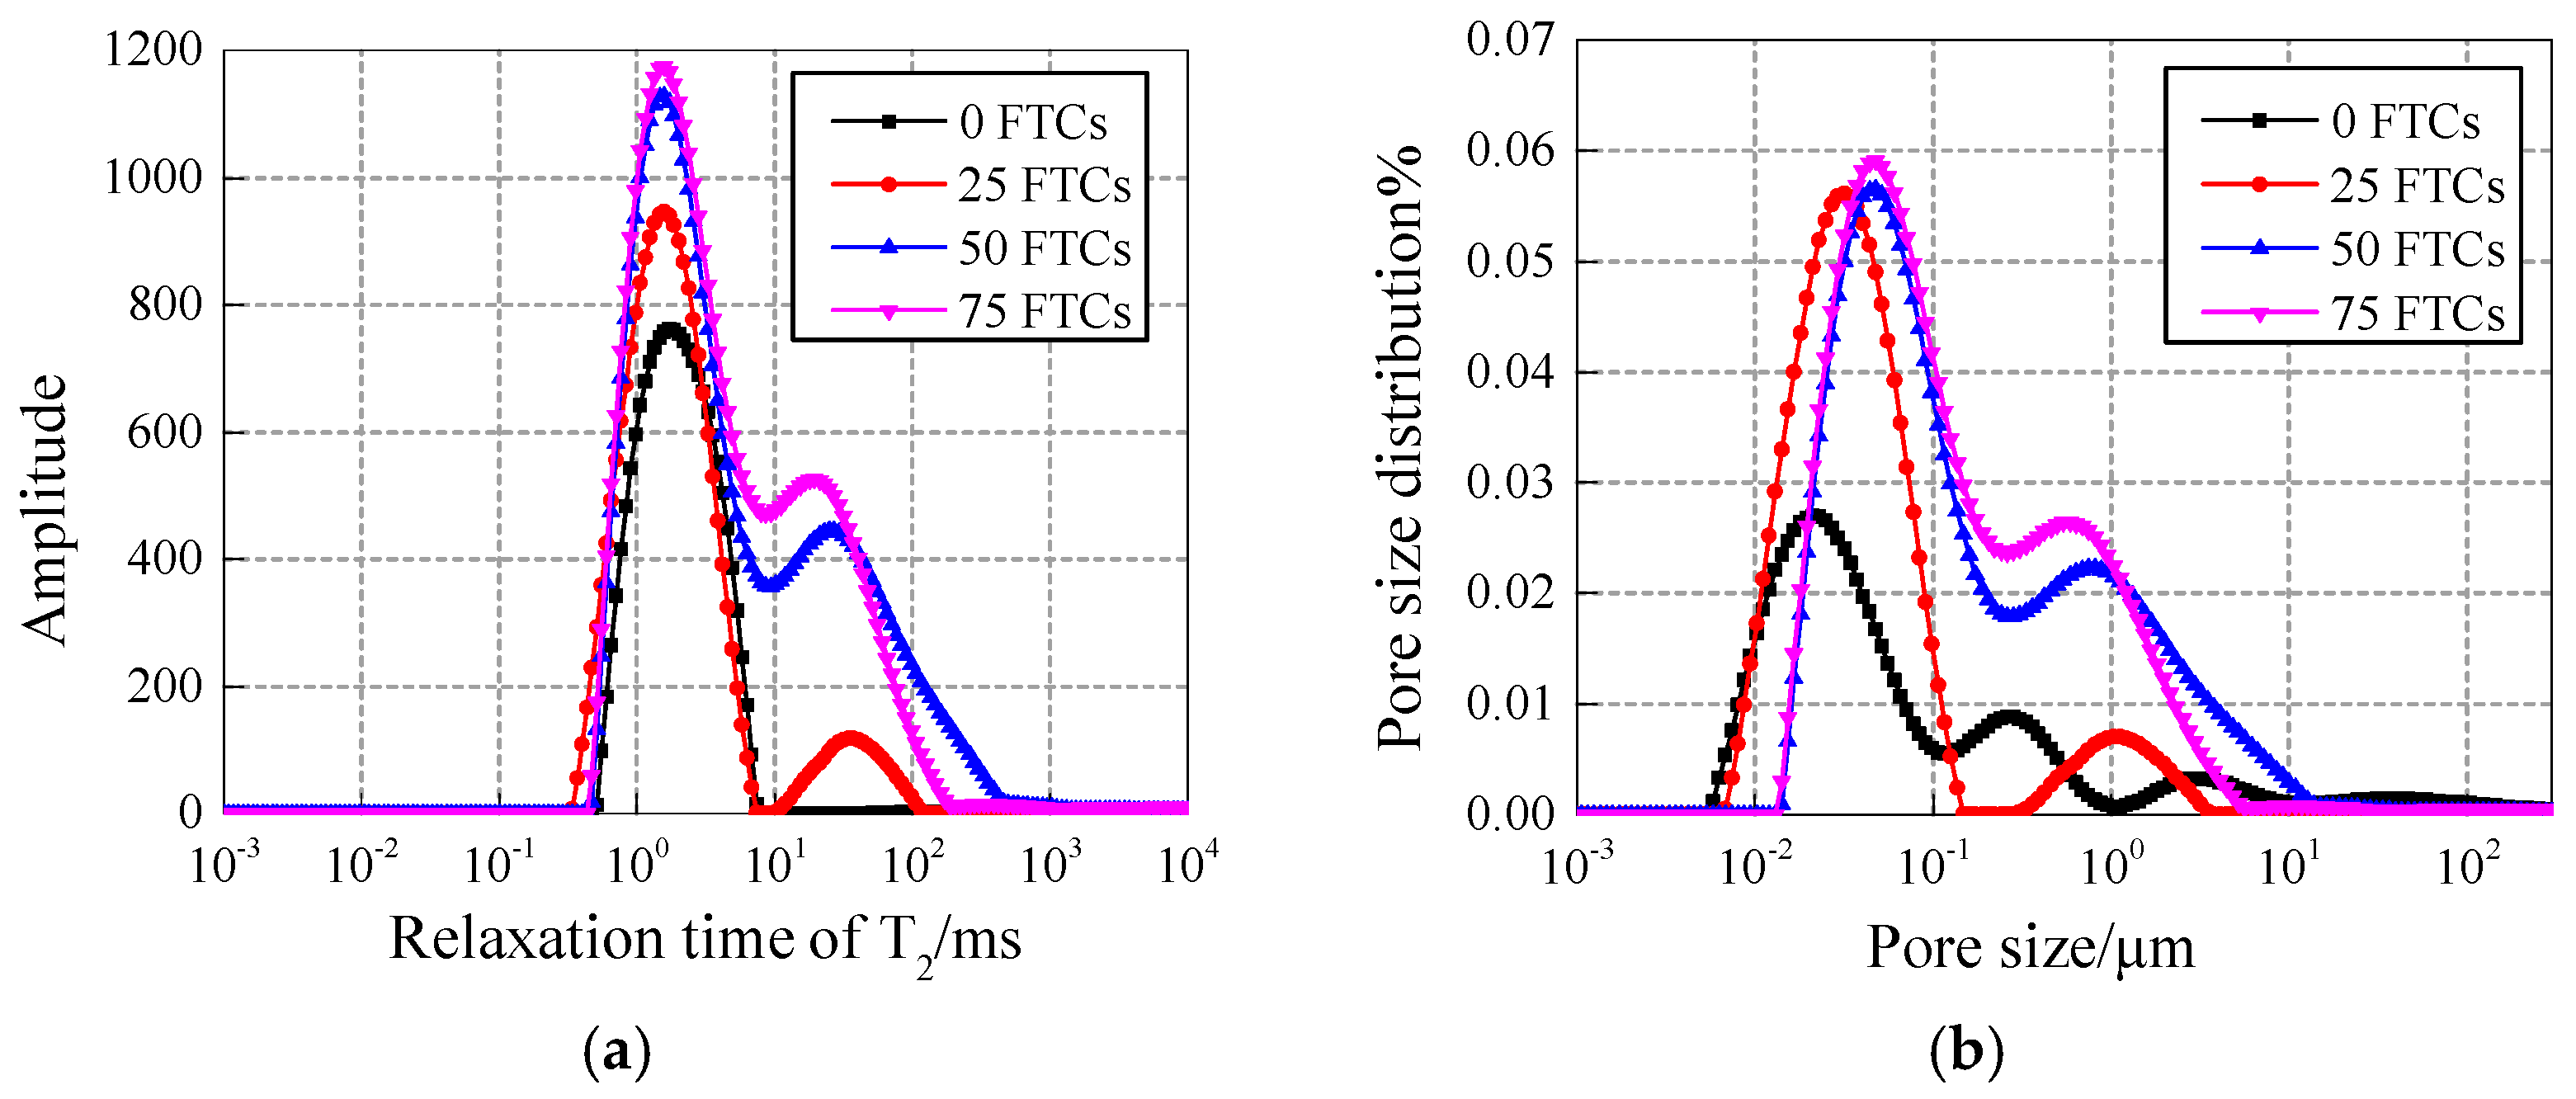
Figure 11.
(a) T2 spectrum and (b) pore fluid size distribution of 30 nm-NT added concrete.
Figure 11.
(a) T2 spectrum and (b) pore fluid size distribution of 30 nm-NT added concrete.
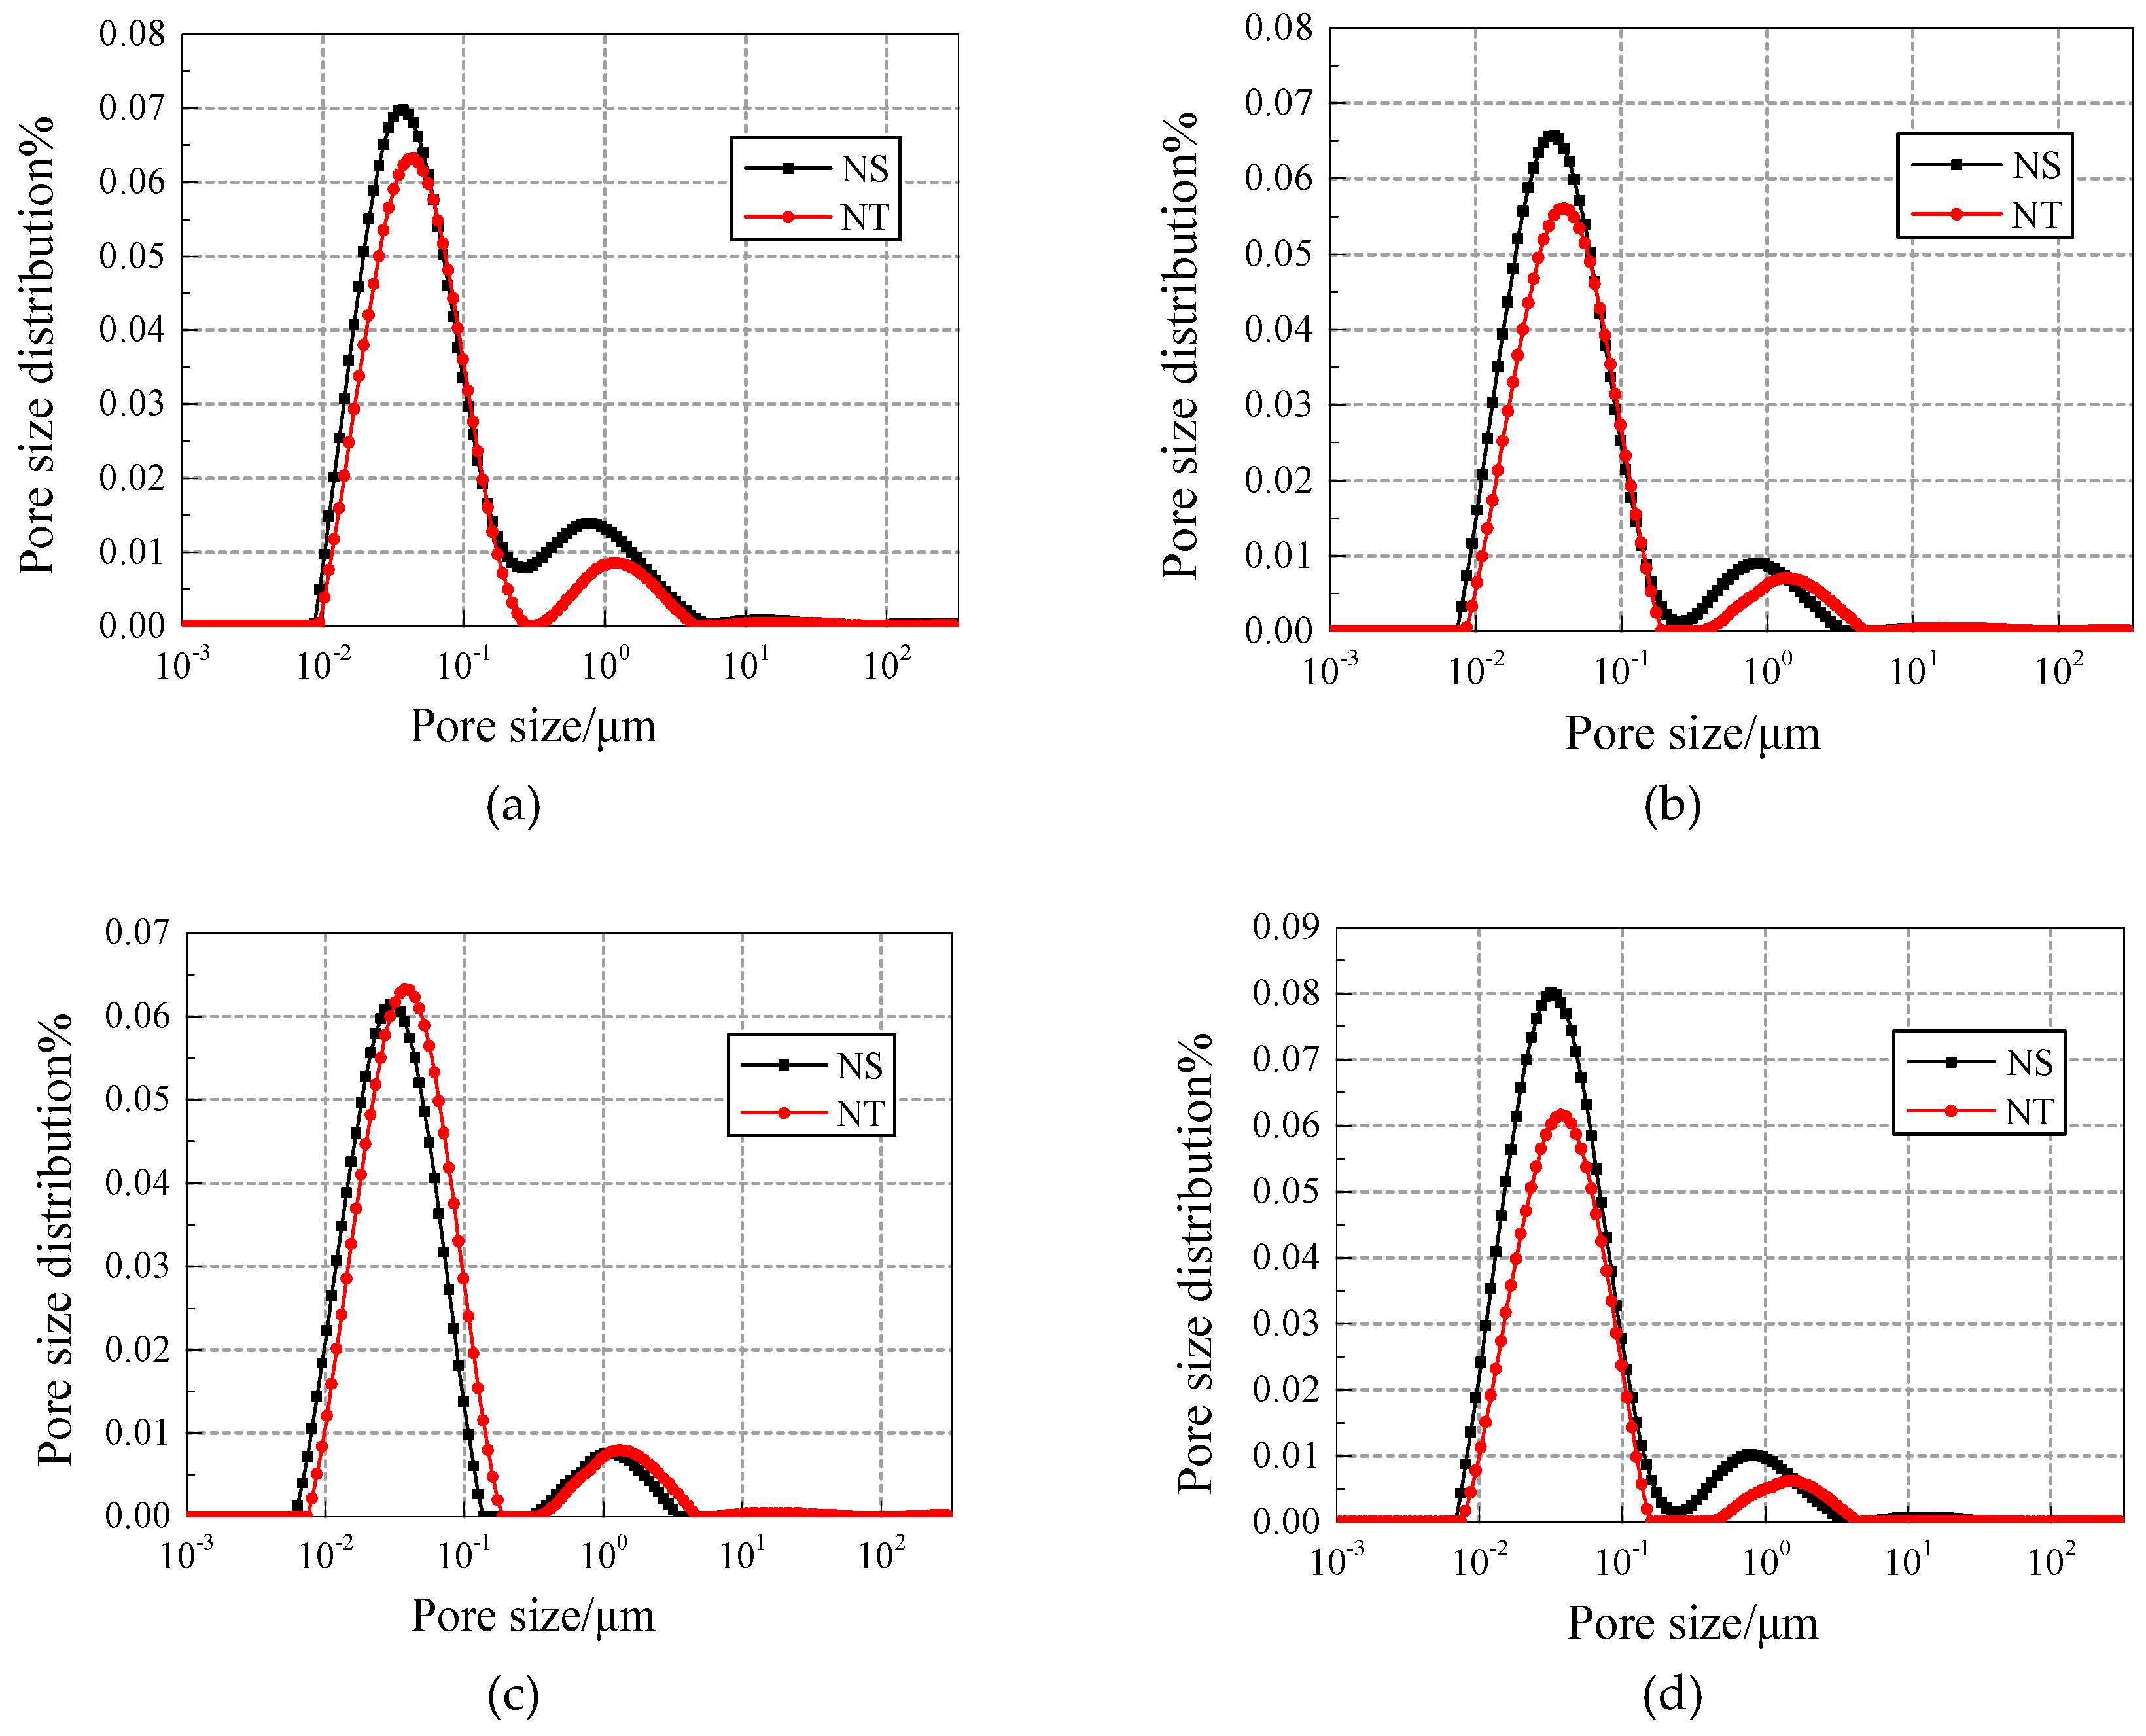
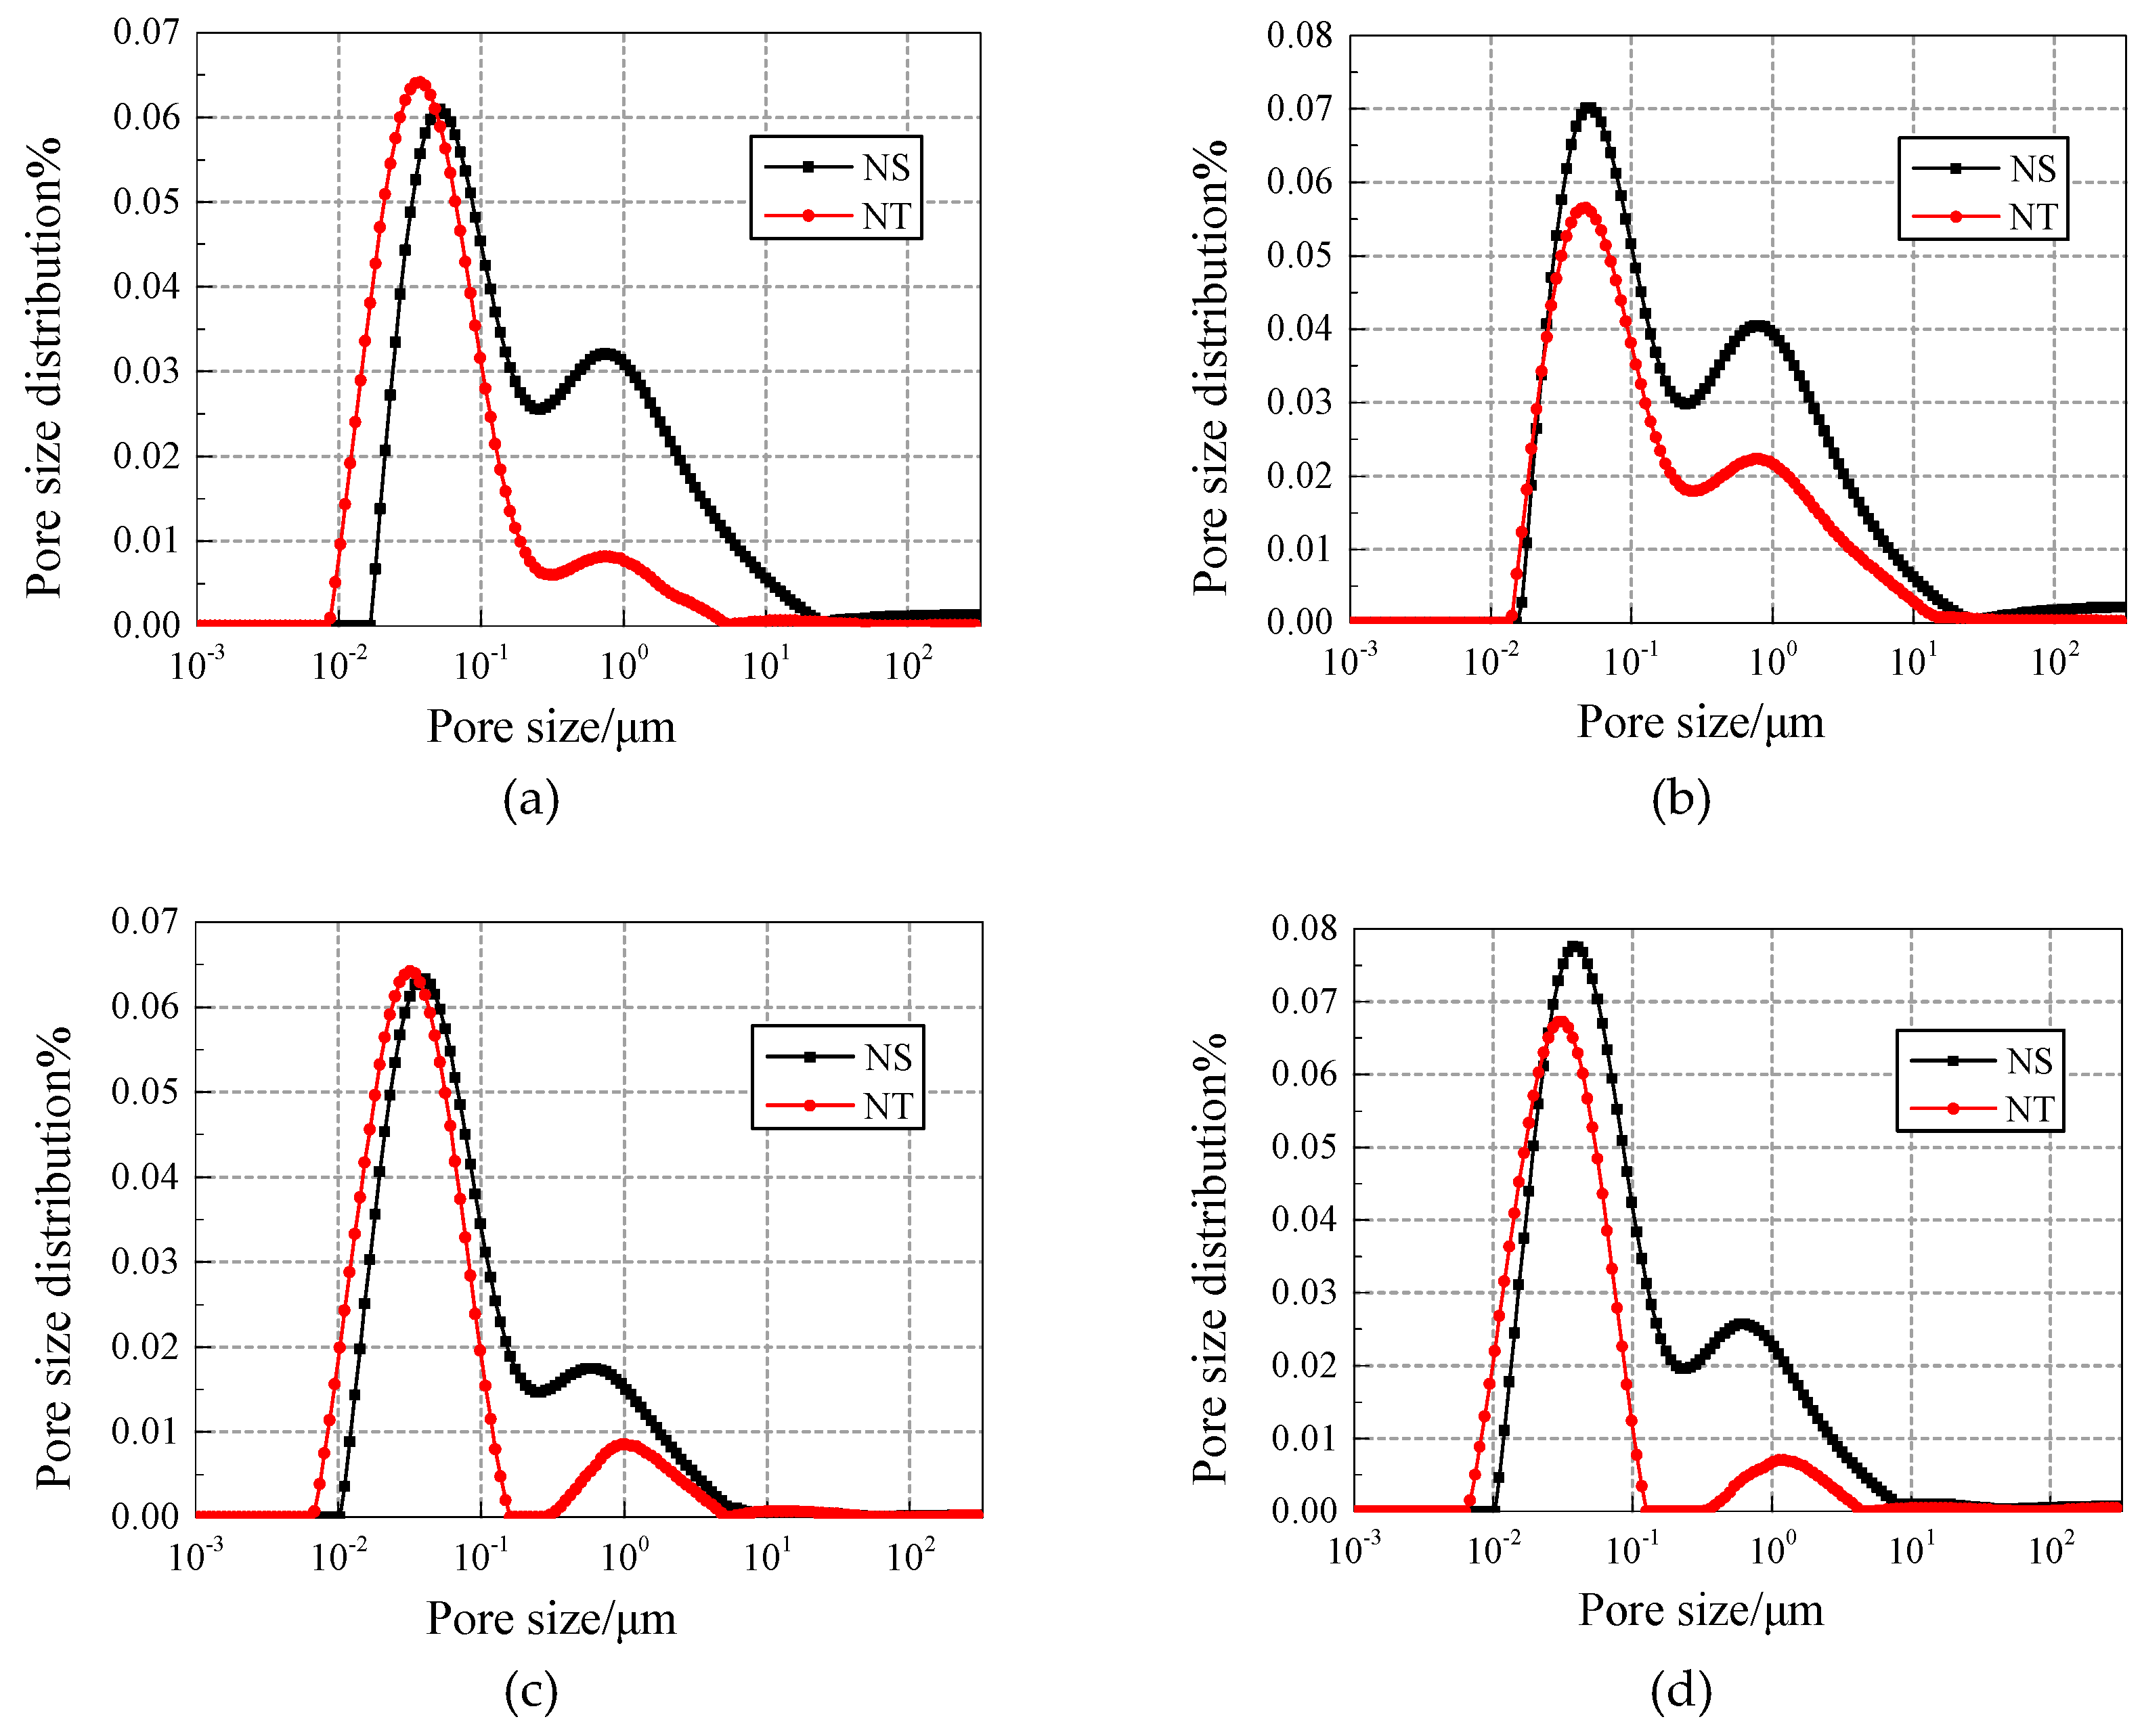
Figure 12.
Comparison of pore fluid size distribution of NS/NT added concrete under 25 freezing and thawing cycles. (a) Content of 0.2%; (b) Content of 0.4%; (c) Content of 0.6%; (d) Content of 0.8%.
Figure 12.
Comparison of pore fluid size distribution of NS/NT added concrete under 25 freezing and thawing cycles. (a) Content of 0.2%; (b) Content of 0.4%; (c) Content of 0.6%; (d) Content of 0.8%.
Figure 13.
Comparison of pore fluid size distribution of NS/NT added concrete under 50 freezing and thawing cycles. (a) Content of 0.2%; (b) Content of 0.4%; (c) Content of 0.6%; (d) Content of 0.8%.
Figure 13.
Comparison of pore fluid size distribution of NS/NT added concrete under 50 freezing and thawing cycles. (a) Content of 0.2%; (b) Content of 0.4%; (c) Content of 0.6%; (d) Content of 0.8%.
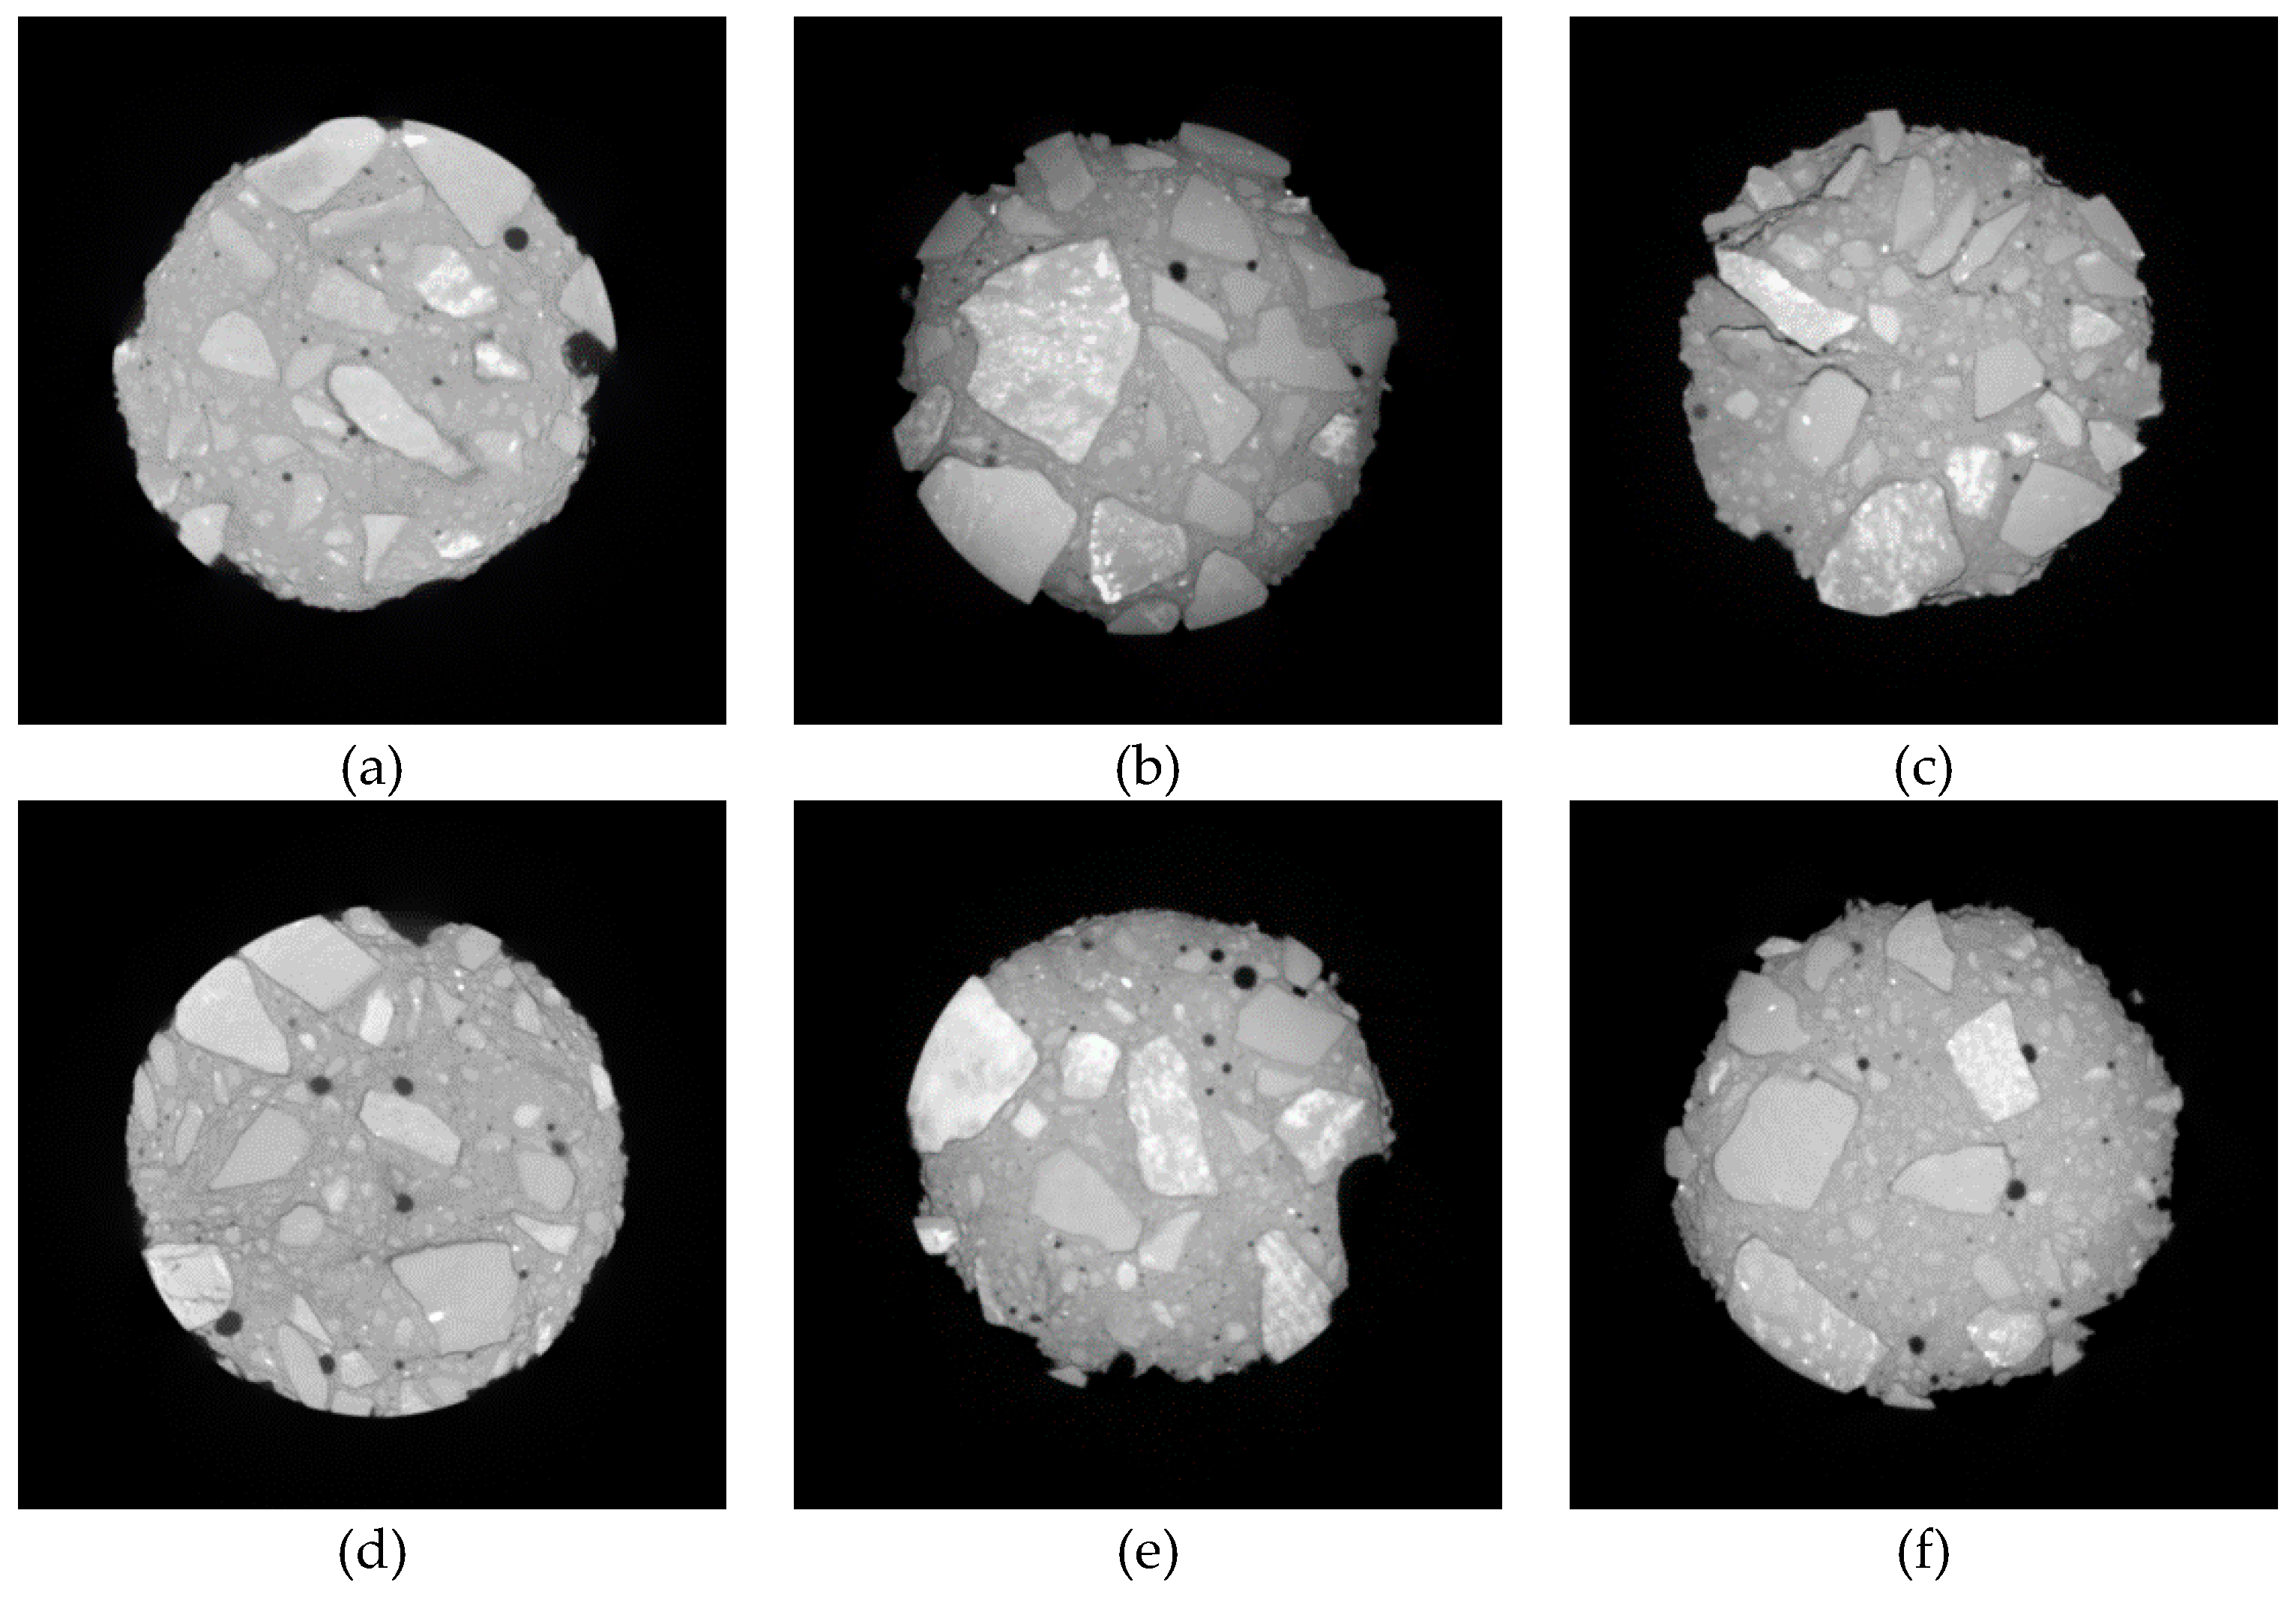
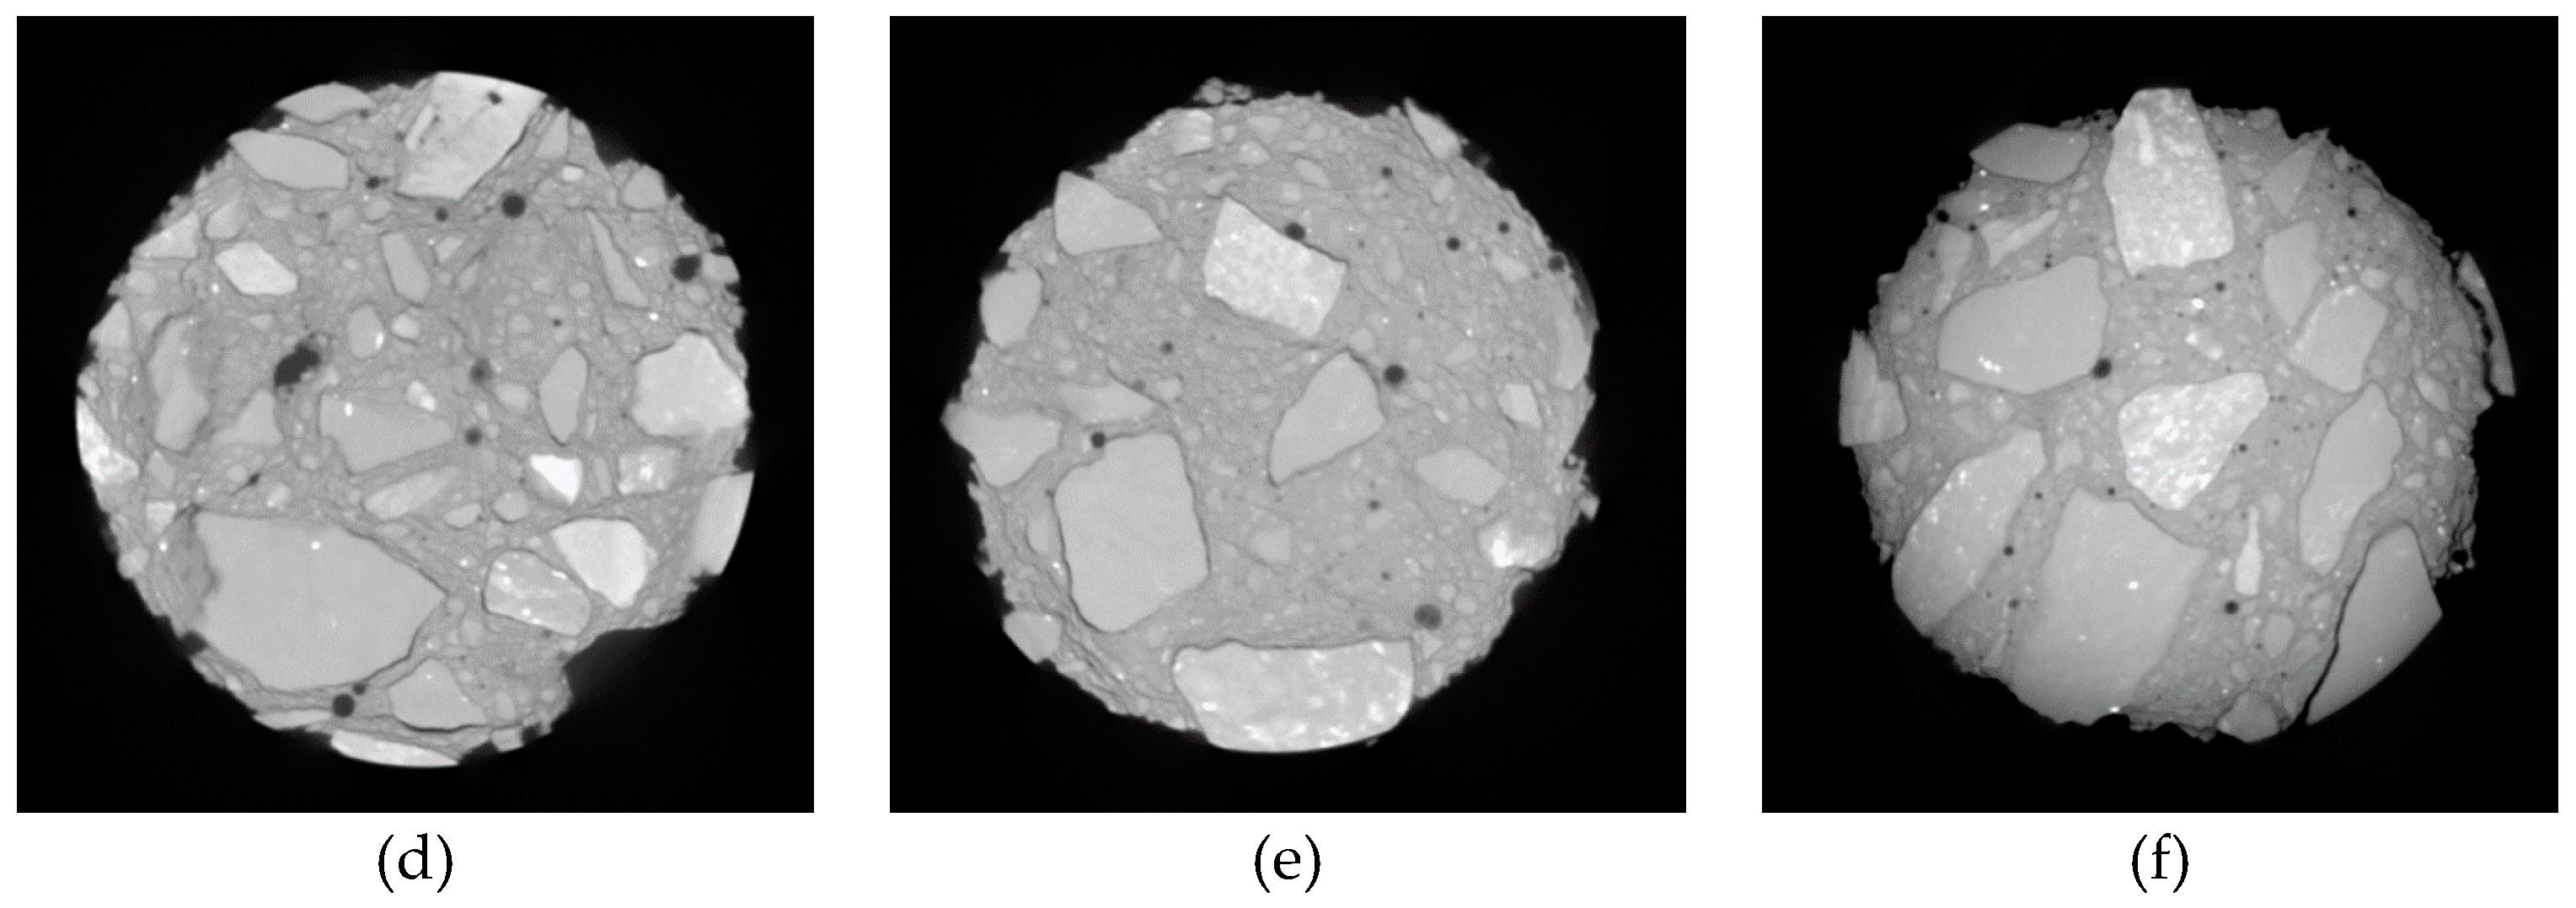
Figure 14.
CT scanning images of different nano-particle added concrete subjected to 25 FTCs. (a) 15 nm-NS (0.2%); (b) 15 nm-NS (0.6 %); (c) 30 nm-NS (0.2%); (d) 30 nm-NS (0.4%); (e) 30 nm-NT (0.2%); (f) 30 nm-NT (0.6%).
Figure 14.
CT scanning images of different nano-particle added concrete subjected to 25 FTCs. (a) 15 nm-NS (0.2%); (b) 15 nm-NS (0.6 %); (c) 30 nm-NS (0.2%); (d) 30 nm-NS (0.4%); (e) 30 nm-NT (0.2%); (f) 30 nm-NT (0.6%).
Figure 15.
CT scanning images of different nano-particle added concrete subjected to 50 FTCs. (a) 15 nm-NS (0.2%); (b) 15 nm-NS (0.6 %); (c) 30 nm-NS (0.2%); (d) 30 nm-NS (0.4%); (e) 30 nm-NT (0.2%); (f) 30 nm-NT (0.6%).
Figure 15.
CT scanning images of different nano-particle added concrete subjected to 50 FTCs. (a) 15 nm-NS (0.2%); (b) 15 nm-NS (0.6 %); (c) 30 nm-NS (0.2%); (d) 30 nm-NS (0.4%); (e) 30 nm-NT (0.2%); (f) 30 nm-NT (0.6%).
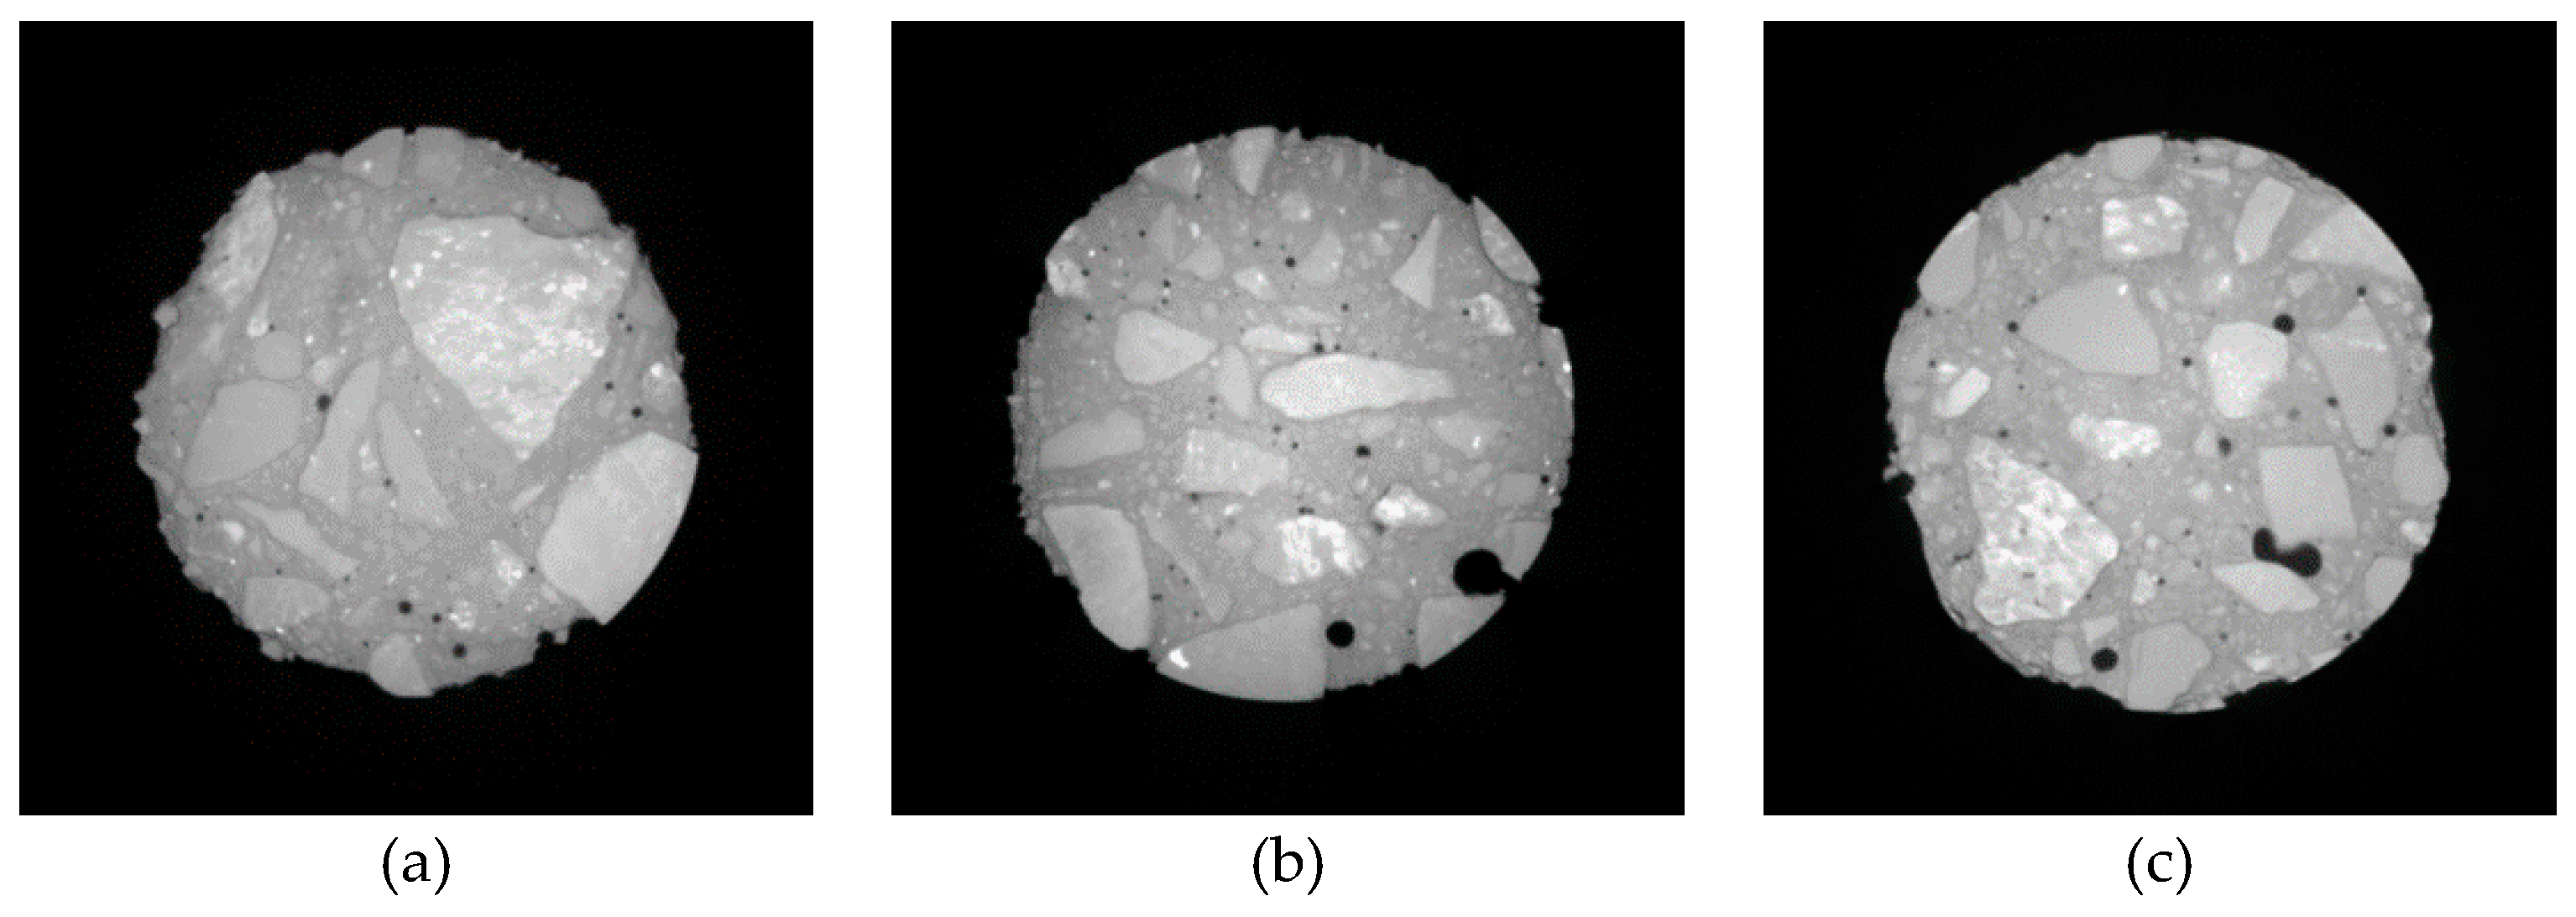
Figure 16.
CT scanning images of different nano-particle added concrete subjected to 75 FTCs. (a) 15 nm-NS (0.2%); (b) 15 nm-NS (0.6 %); (c) 30 nm-NS (0.2%); (d) 30 nm-NS (0.4%); (e) 30 nm-NT (0.2%); (f) 30 nm-NT (0.6%).
Figure 16.
CT scanning images of different nano-particle added concrete subjected to 75 FTCs. (a) 15 nm-NS (0.2%); (b) 15 nm-NS (0.6 %); (c) 30 nm-NS (0.2%); (d) 30 nm-NS (0.4%); (e) 30 nm-NT (0.2%); (f) 30 nm-NT (0.6%).
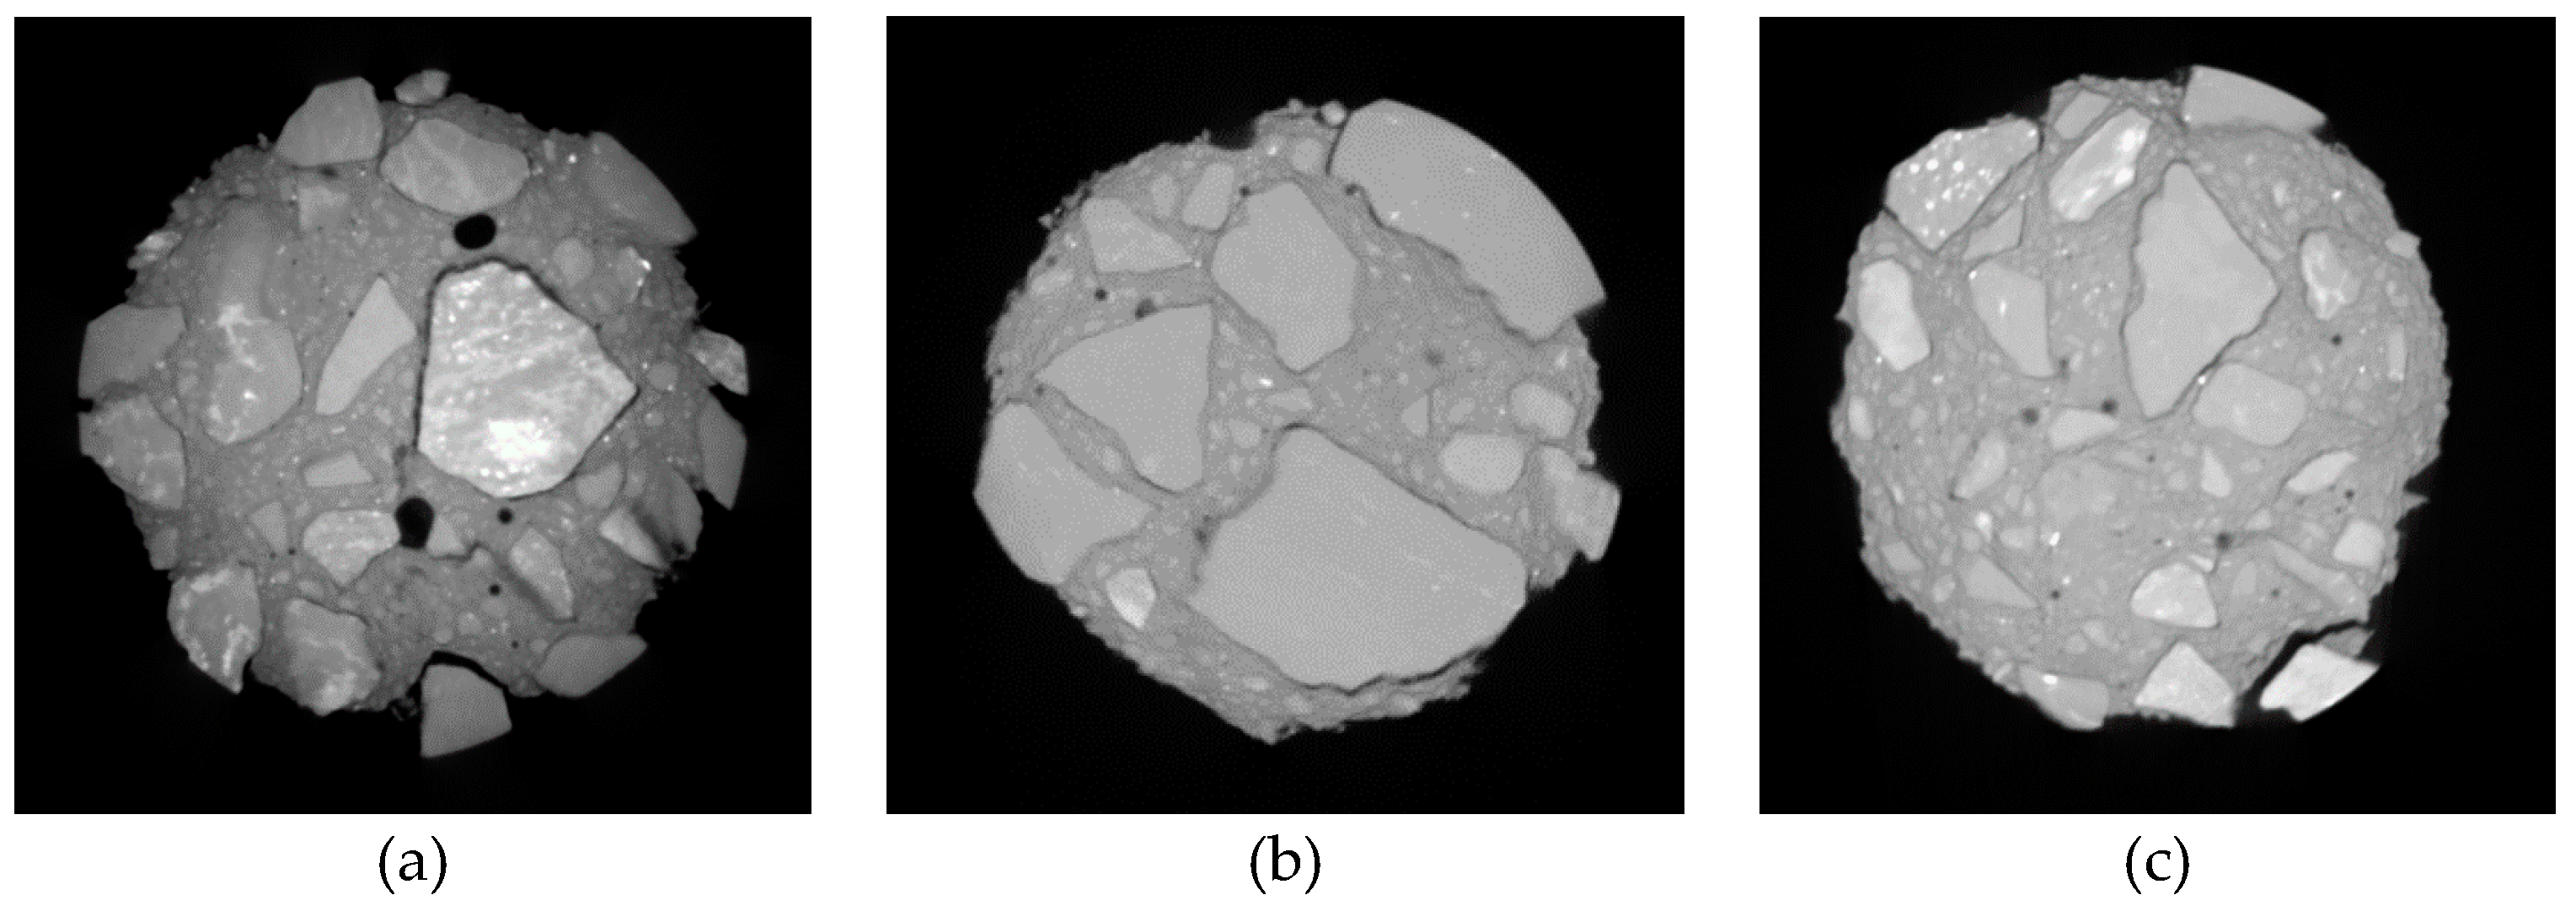
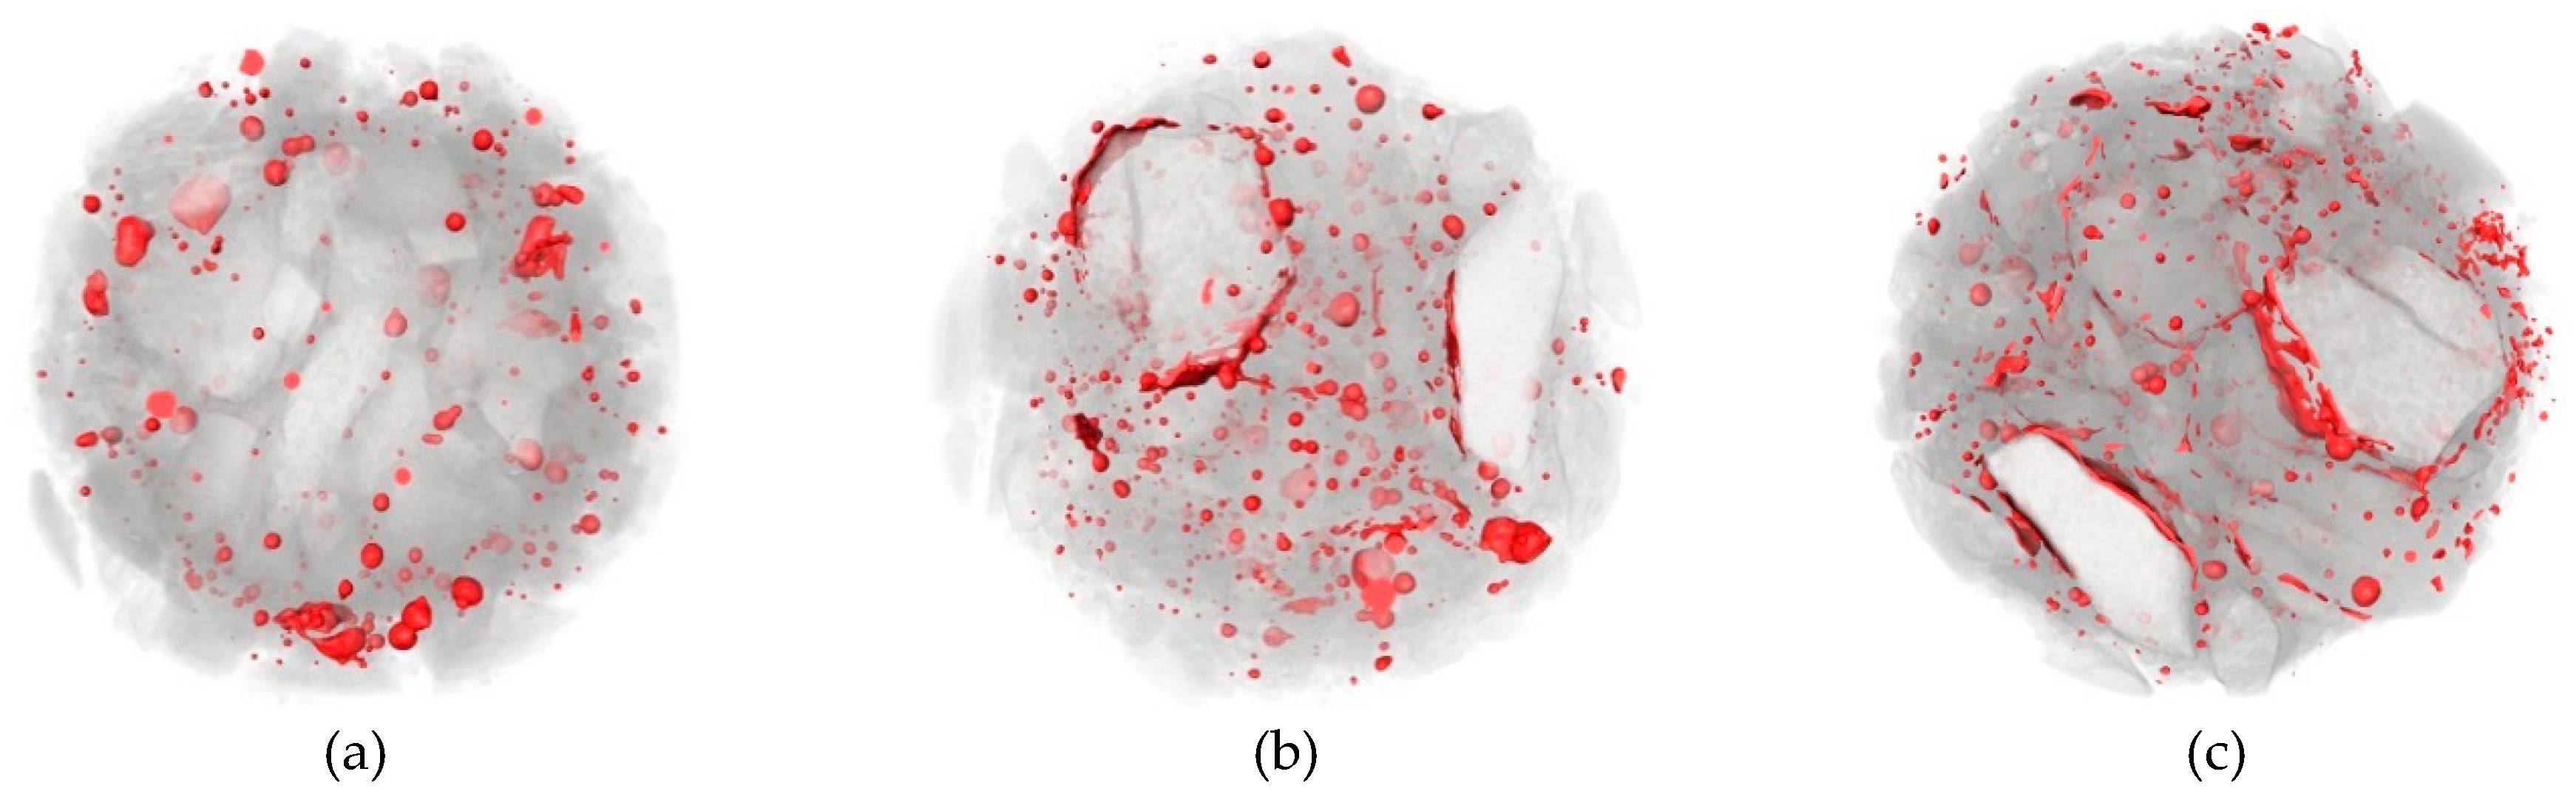
Figure 17.
Pore distribution under different freezing and thawing cycles of 0.6% 15 nm-NS added concrete. (a) 25 FTCs; (b) 50 FTCs; (c) 75 FTCs.
Figure 17.
Pore distribution under different freezing and thawing cycles of 0.6% 15 nm-NS added concrete. (a) 25 FTCs; (b) 50 FTCs; (c) 75 FTCs.
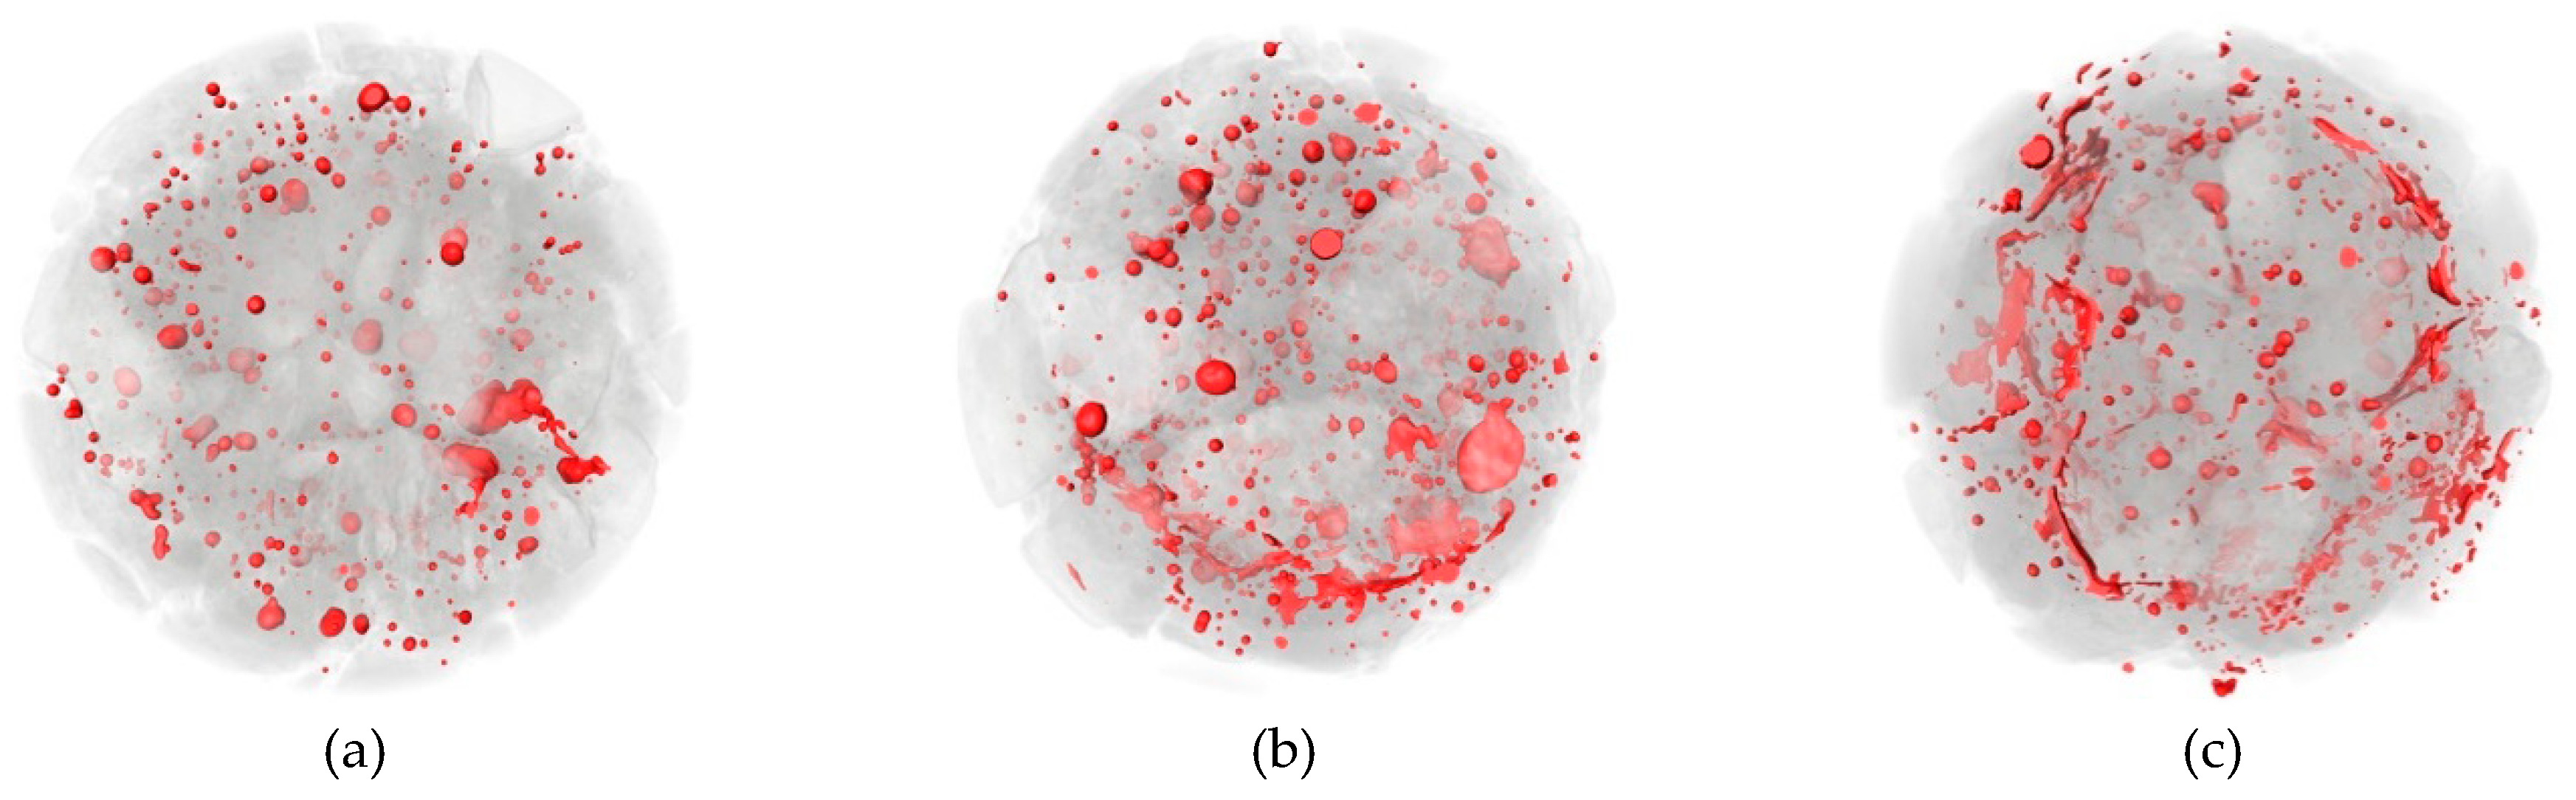
Figure 18.
Pore distribution under different freezing and thawing cycles of 0.4% 30 nm-NS added concrete. (a) 25 FTCs; (b) 50 FTCs; (c) 75 FTCs.
Figure 18.
Pore distribution under different freezing and thawing cycles of 0.4% 30 nm-NS added concrete. (a) 25 FTCs; (b) 50 FTCs; (c) 75 FTCs.
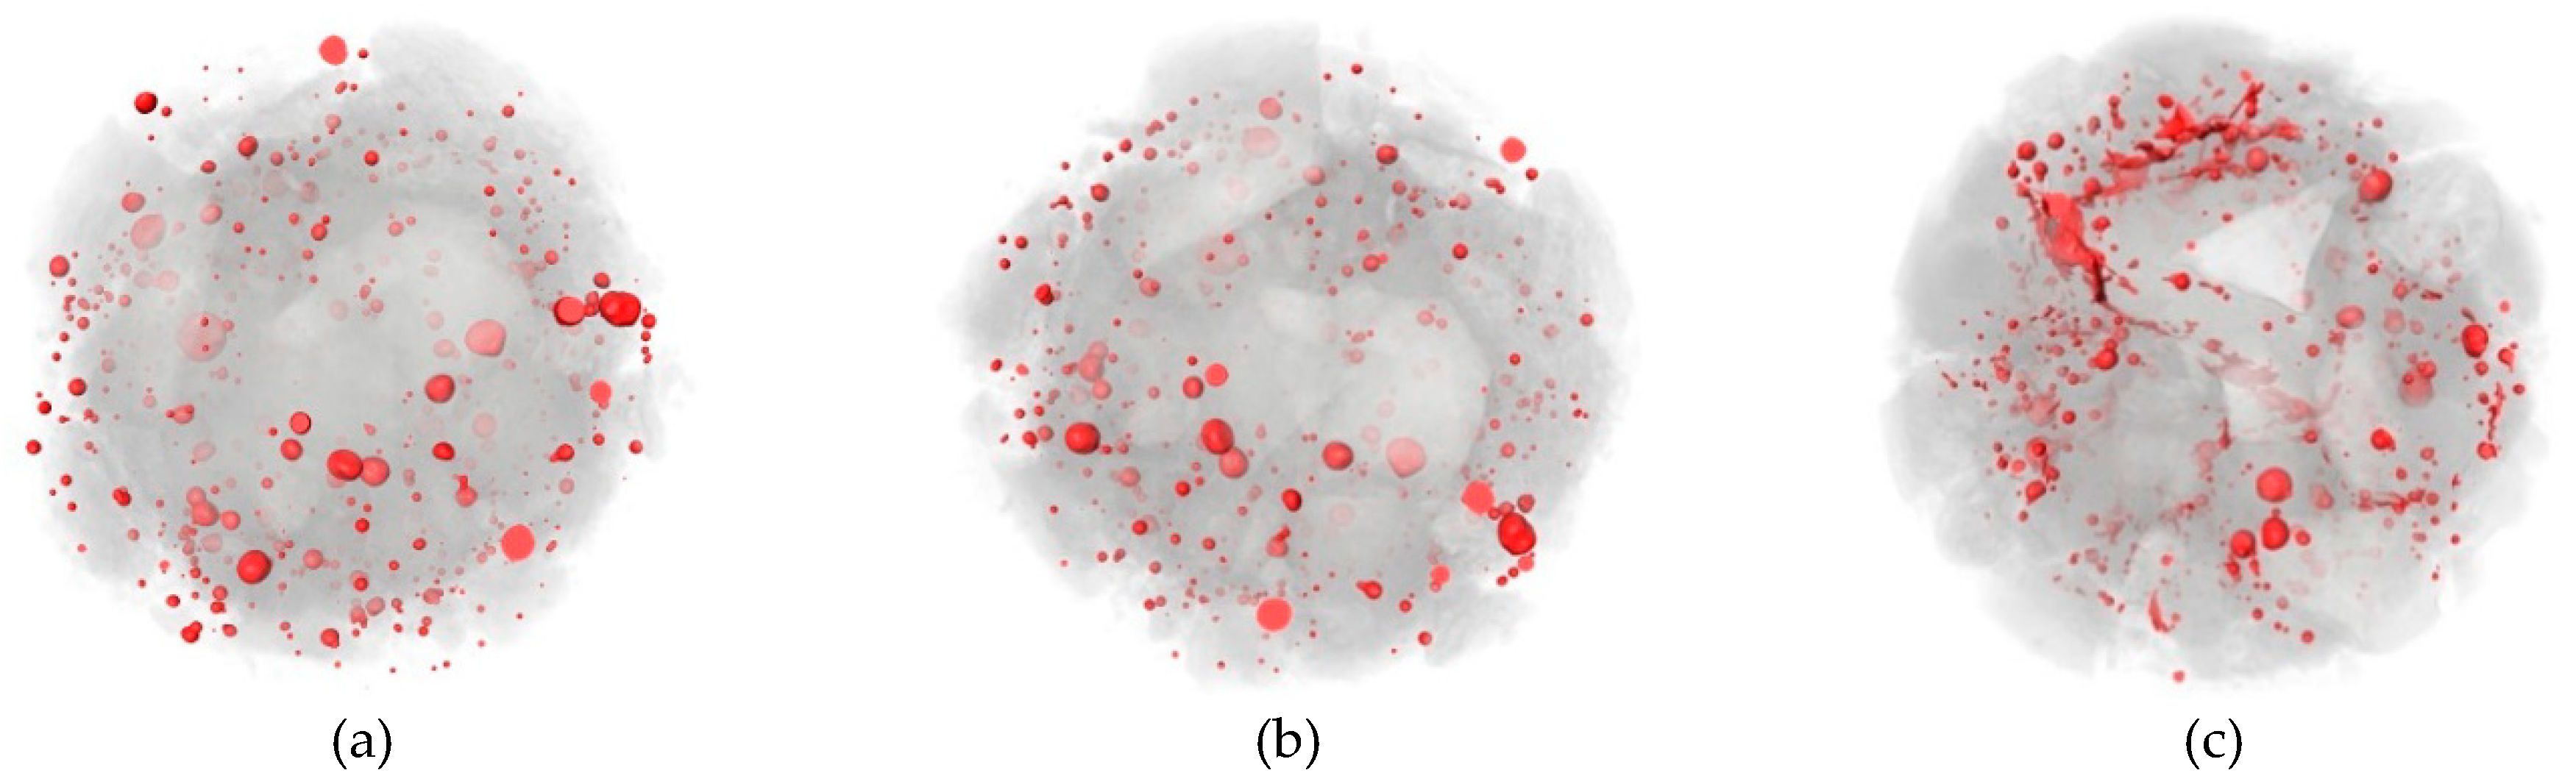
Figure 19.
Pore distribution under different freezing and thawing cycles of 0.6% 30 nm-NT added concrete. (a) 25 FTCs; (b) 50 FTCs; (c) 75 FTCs.
Figure 19.
Pore distribution under different freezing and thawing cycles of 0.6% 30 nm-NT added concrete. (a) 25 FTCs; (b) 50 FTCs; (c) 75 FTCs.
Table 1.
The physical properties of Portland cement.
Table 1.
The physical properties of Portland cement.
| Density (g/cm3) | Fineness (%) | Specific Surface Area (m2/g) | Stability | Setting Time (min) |
|---|
| Initial Setting | Final Setting |
|---|
| 3.10 | ≤8.0 | 0.36 | Qualified | ≥60 | ≤300 |
Table 2.
The chemical compositions of Portland cement (%).
Table 2.
The chemical compositions of Portland cement (%).
| CaO | SiO2 | Al2O3 | Fe2O3 | MgO | SO3 | Alkali | Ignition Loss |
|---|
| 61.43 | 22.81 | 5.62 | 3.36 | 1.35 | 2.17 | 0.54 | 2.60 |
Table 3.
The properties of nano-particles.
Table 3.
The properties of nano-particles.
| Item | Size (nm) | Formula Weight | Purity (%) | Ignition Loss (%) | Specific Surface Area(m2/g) | PH |
|---|
| Nano-SiO2 (NS) | 15 | 60.08 | 99.8 | 0.2 | 250 | 5–7 |
| 30 | 99.5 | 0.5 | 220 |
| Nano-TiO2 (NT) | 30 | 79.88 | 99 | 1 | 45 | 6–8 |
Table 4.
The physical properties of polycarboxylic acid superplasticizer.
Table 4.
The physical properties of polycarboxylic acid superplasticizer.
| Appearance | Hydroxyl | PH | Water Content | Solubility |
|---|
| Light yellow to white flakes | 22–27 | 5.0–7.0 | ≤0.5 | Soluble in water and other organic |
Table 5.
The mix proportions of specimens.
Table 5.
The mix proportions of specimens.
| Specimen | W/C | C/kg | Aggregate | Nano-Particles/g | W/kg | SP/g |
|---|
| S/kg | G/kg | 15nm-NS | 30 nm-NS slurry | 30 nm-NT slurry |
|---|
| NS0.2-15 | 0.5 | 8.77 | 14.28 | 26.54 | 17.57 | 0 | 0 | 4.39 | 0 |
| NS0.4-15 | 0.5 | 8.75 | 14.28 | 26.54 | 35.14 | 0 | 0 | 4.39 | 0 |
| NS0.6-15 | 0.5 | 8.73 | 14.28 | 26.54 | 52.70 | 0 | 0 | 4.39 | 0 |
| NS0.8-15 | 0.5 | 8.71 | 14.28 | 26.54 | 70.27 | 0 | 0 | 4.39 | 0 |
| NS1-15 | 0.5 | 8.70 | 14.28 | 26.54 | 87.84 | 0 | 0 | 4.39 | 0 |
| NS1.5-15 | 0.5 | 8.65 | 14.28 | 26.54 | 131.76 | 0 | 0 | 4.39 | 0 |
| NS2-15 | 0.5 | 8.61 | 14.28 | 26.54 | 175.68 | 0 | 0 | 4.39 | 0 |
| NS0.2-30 | 0.5 | 8.77 | 14.28 | 26.54 | 0 | 105.39 | 0 | 4.30 | 17.56 |
| NS0.4-30 | 0.5 | 8.75 | 14.28 | 26.54 | 0 | 210.77 | 0 | 4.22 | 21.95 |
| NS0.6-30 | 0.5 | 8.73 | 14.28 | 26.54 | 0 | 316.16 | 0 | 4.13 | 26.34 |
| NS0.8-30 | 0.5 | 8.71 | 14.28 | 26.54 | 0 | 421.55 | 0 | 4.04 | 30.73 |
| NT0.2-30 | 0.5 | 8.77 | 14.28 | 26.54 | 0 | 0 | 105.39 | 4.30 | 17.56 |
| NT0.4-30 | 0.5 | 8.75 | 14.28 | 26.54 | 0 | 0 | 210.77 | 4.22 | 21.95 |
| NT0.6-30 | 0.5 | 8.73 | 14.28 | 26.54 | 0 | 0 | 316.16 | 4.13 | 26.34 |
| NT0.8-30 | 0.5 | 8.71 | 14.28 | 26.54 | 0 | 0 | 421.55 | 4.04 | 30.73 |
Table 6.
The mass loss rate of specimens after certain freezing and thawing cycles (%).
Table 6.
The mass loss rate of specimens after certain freezing and thawing cycles (%).
| Different Contents (%) | 25 Cycles | 50 Cycles | 75 Cycles |
|---|
| 15 nm-NS | 30 nm-NS | 30 nm-NT | 15 nm-NS | 30 nm-NS | 30 nm-NT | 15 nm-NS | 30 nm-NS | 30 nm-NT |
|---|
| 0.2 | 1.77 | 1.88 | 1.94 | 3.28 | 3.56 | 3.66 | 4.00 | 4.36 | 4.38 |
| 0.4 | 1.11 | 1.35 | 1. 77 | 2.57 | 2.95 | 3.00 | 3.71 | 3.55 | 4.12 |
| 0.6 | 0.96 | 1.48 | 1.52 | 2.20 | 3.16 | 2.66 | 3.42 | 3.87 | 3.99 |
| 0.8 | 1.25 | 1.98 | 1.86 | 3.01 | 3.43 | 3.38 | 4.00 | 3.90 | 4.20 |
| Average | 1.27 | 1.67 | 1.77 | 2.77 | 3.28 | 3.18 | 3.78 | 3.92 | 4.17 |
Table 7.
The internal porosity of nano-particle added concrete under different FTCs (%).
Table 7.
The internal porosity of nano-particle added concrete under different FTCs (%).
| Different Content % | 25 FTCs | 50 FTCs | 75 FTCs |
|---|
| 15 nm | 30 nm | 15 nm | 30 nm | 15 nm | 30 nm |
|---|
| NS | NS | NT | NS | NS | NT | NS | NS | NT |
|---|
| 0.2 | 1.66 | 1.96 | 1.58 | 1.97 | 2.52 | 1.99 | 1.98 | 3.45 | 2.04 |
| 0.4 | 1.62 | 1.57 | 1.57 | 1.75 | 1.94 | 1.60 | 1.90 | 3.25 | 2.08 |
| 0.6 | 1.48 | 1.66 | 1.35 | 1.69 | 2.43 | 1.56 | 1.79 | 2.38 | 1.42 |
| 0.8 | 1.68 | 2.03 | 1.43 | 1.81 | 2.90 | 1.72 | 1.89 | 3.35 | 1.94 |


