1. Introduction
The tortuosity in pore structure is one of the key factors affecting the transport performance of cement-based materials. It is usually defined as the ratio of the average diffusion path of a particle to the shortest distance of its straight line [
1]. Many scholars have been devoted to testing pore tortuosity through experimental methods, however, it is relatively difficult to test directly. At present, the prediction of pore tortuosity is based on experimental statistical methods or empirical models and the reliability of the model is indirectly proven by experiments. Zhong et al. [
2] established a model of pore tortuosity based on the average pore size measured by experiments. De Larrard et al. [
3] established the pore tortuosity model based on the theory of an artificial neural network by using the existing experimental data as input data, combined with the numerical model. Piet et al. [
4] established a tortuosity model based on the shape and gradation of spherical aggregate particles. The above models were obtained through the experimental statistical method, and the influence of the change of the aggregate’s own morphology on the transport path in cement-based materials was not fully considered, resulting in a certain under estimation between the theoretical prediction and the actual medium transport.
Alireza et al. [
5] digitized the geometry and morphology of cracks by image analysis technology, and then established the tortuosity model of cracks. Akira et al. [
6] used the three-dimensional spatial distribution model of calcium silicate hydrate (C–S–H) to establish the tortuosity model. Promentilla et al. [
7] characterized the three dimensional pore structure based on x-ray synchrotron radiation micro-tomography technology, and established the pore tortuosity model. Zuo et al. [
1] established a two-dimensional geometric model of the tortuosity of the transport path by analyzing an image of cement hardened paste by scanning electron microscopy. Liu et al. [
8] and Zhou et al. [
9] used fractal theory to analyze the tortuosity of capillary pore in cementitious materials, and established the corresponding tortuosity model. Li et al. [
10] used macro and micro models to establish the tortuosity model of nano-channels in concrete. Liu et al. [
11] provided a multi-scale transport tortuosity model ranging from the nano-scale through to the micro-scale and macro-scale of concrete, which was based on the porous media mechanics and multi-scale method, combined with numerical calculation and 3D visualization.
However, the above models were obtained by the image analysis method, and the influence of the randomness of aggregate distribution in concrete on the transport path of cement-based materials was not fully considered, resulting in a certain gap between the theoretical prediction and actual medium transport. In this study, based on the stereological principle and geometric method, tortuosity models of cement-based materials containing ideal pebbles and gravel polygonal aggregates were proposed, considering the morphology and gradation of aggregate. Second, the morphology of the actual aggregate was quantitatively characterized by image processing technology considering the effect of actual aggregate morphology on tortuosity, and finally the tortuosity model was validated by the mercury intrusion porosimetry test and the data reported in previous studies.
2. Theoretical Model of Tortuosity for Ideal Aggregate in Cement-Based
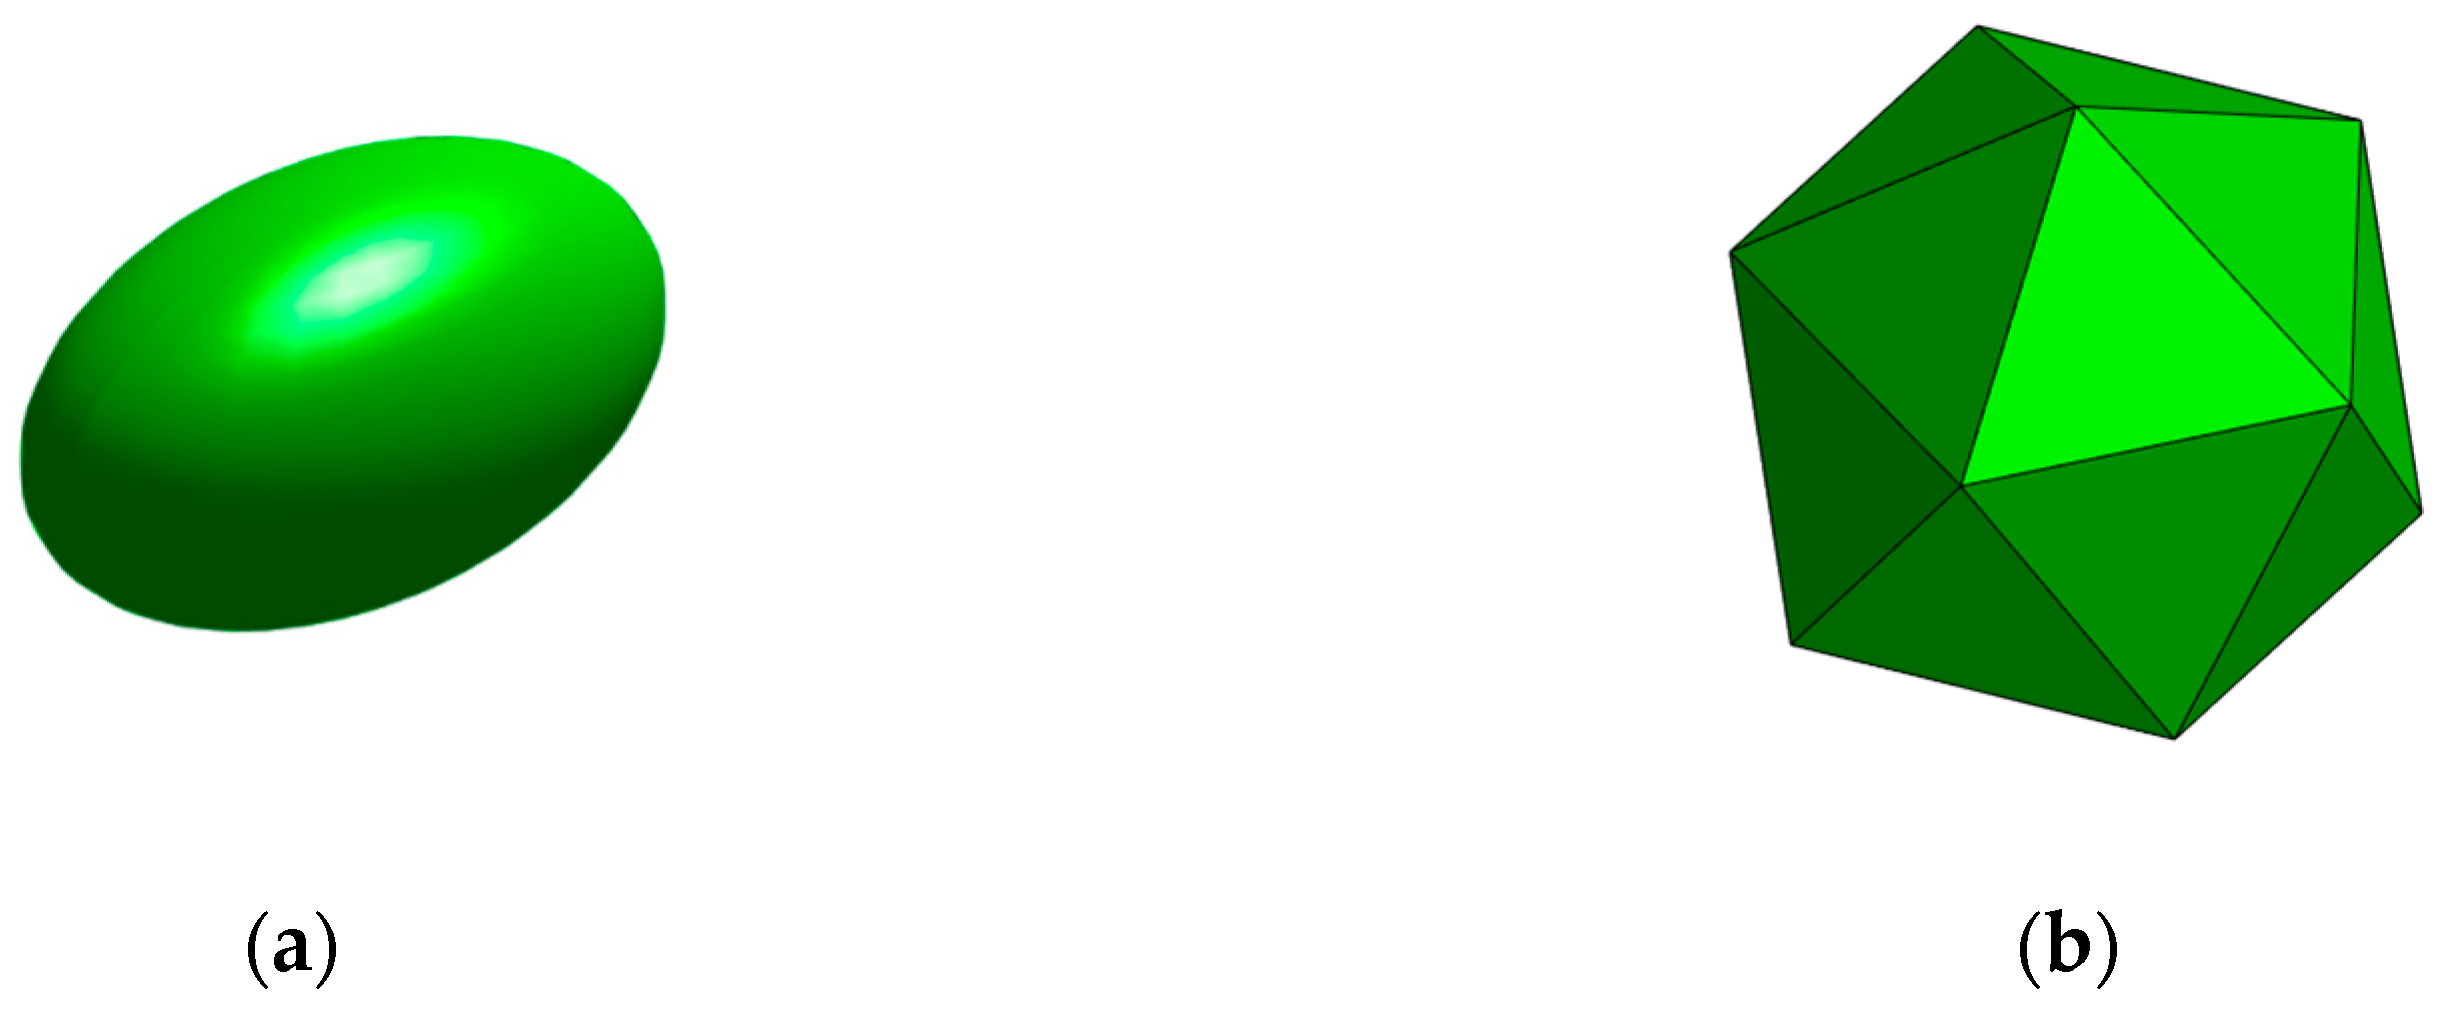
In this paper, mortar can be seen as the result of embedding fine aggregates into a cement slurry, and concrete can be seen as the result of embedding coarse aggregates into mortar. Due to the different sizes of the coarse and fine aggregates, we took the grading of the aggregate size as a weight function to homogenize the whole aggregate to obtain the average size of the aggregate. Then, the average size aggregate with the same size was uniformly embedded in the matrix, and the mortar and concrete model after the aggregate homogenization was obtained. The shape of the aggregate varies, as the fine aggregates are small, it is regarded as sphere; coarse aggregates are mainly divided into pebbles and gravel according to different sources, so it is regarded as ellipsoid and polyhedron, respectively [
12], as shown in
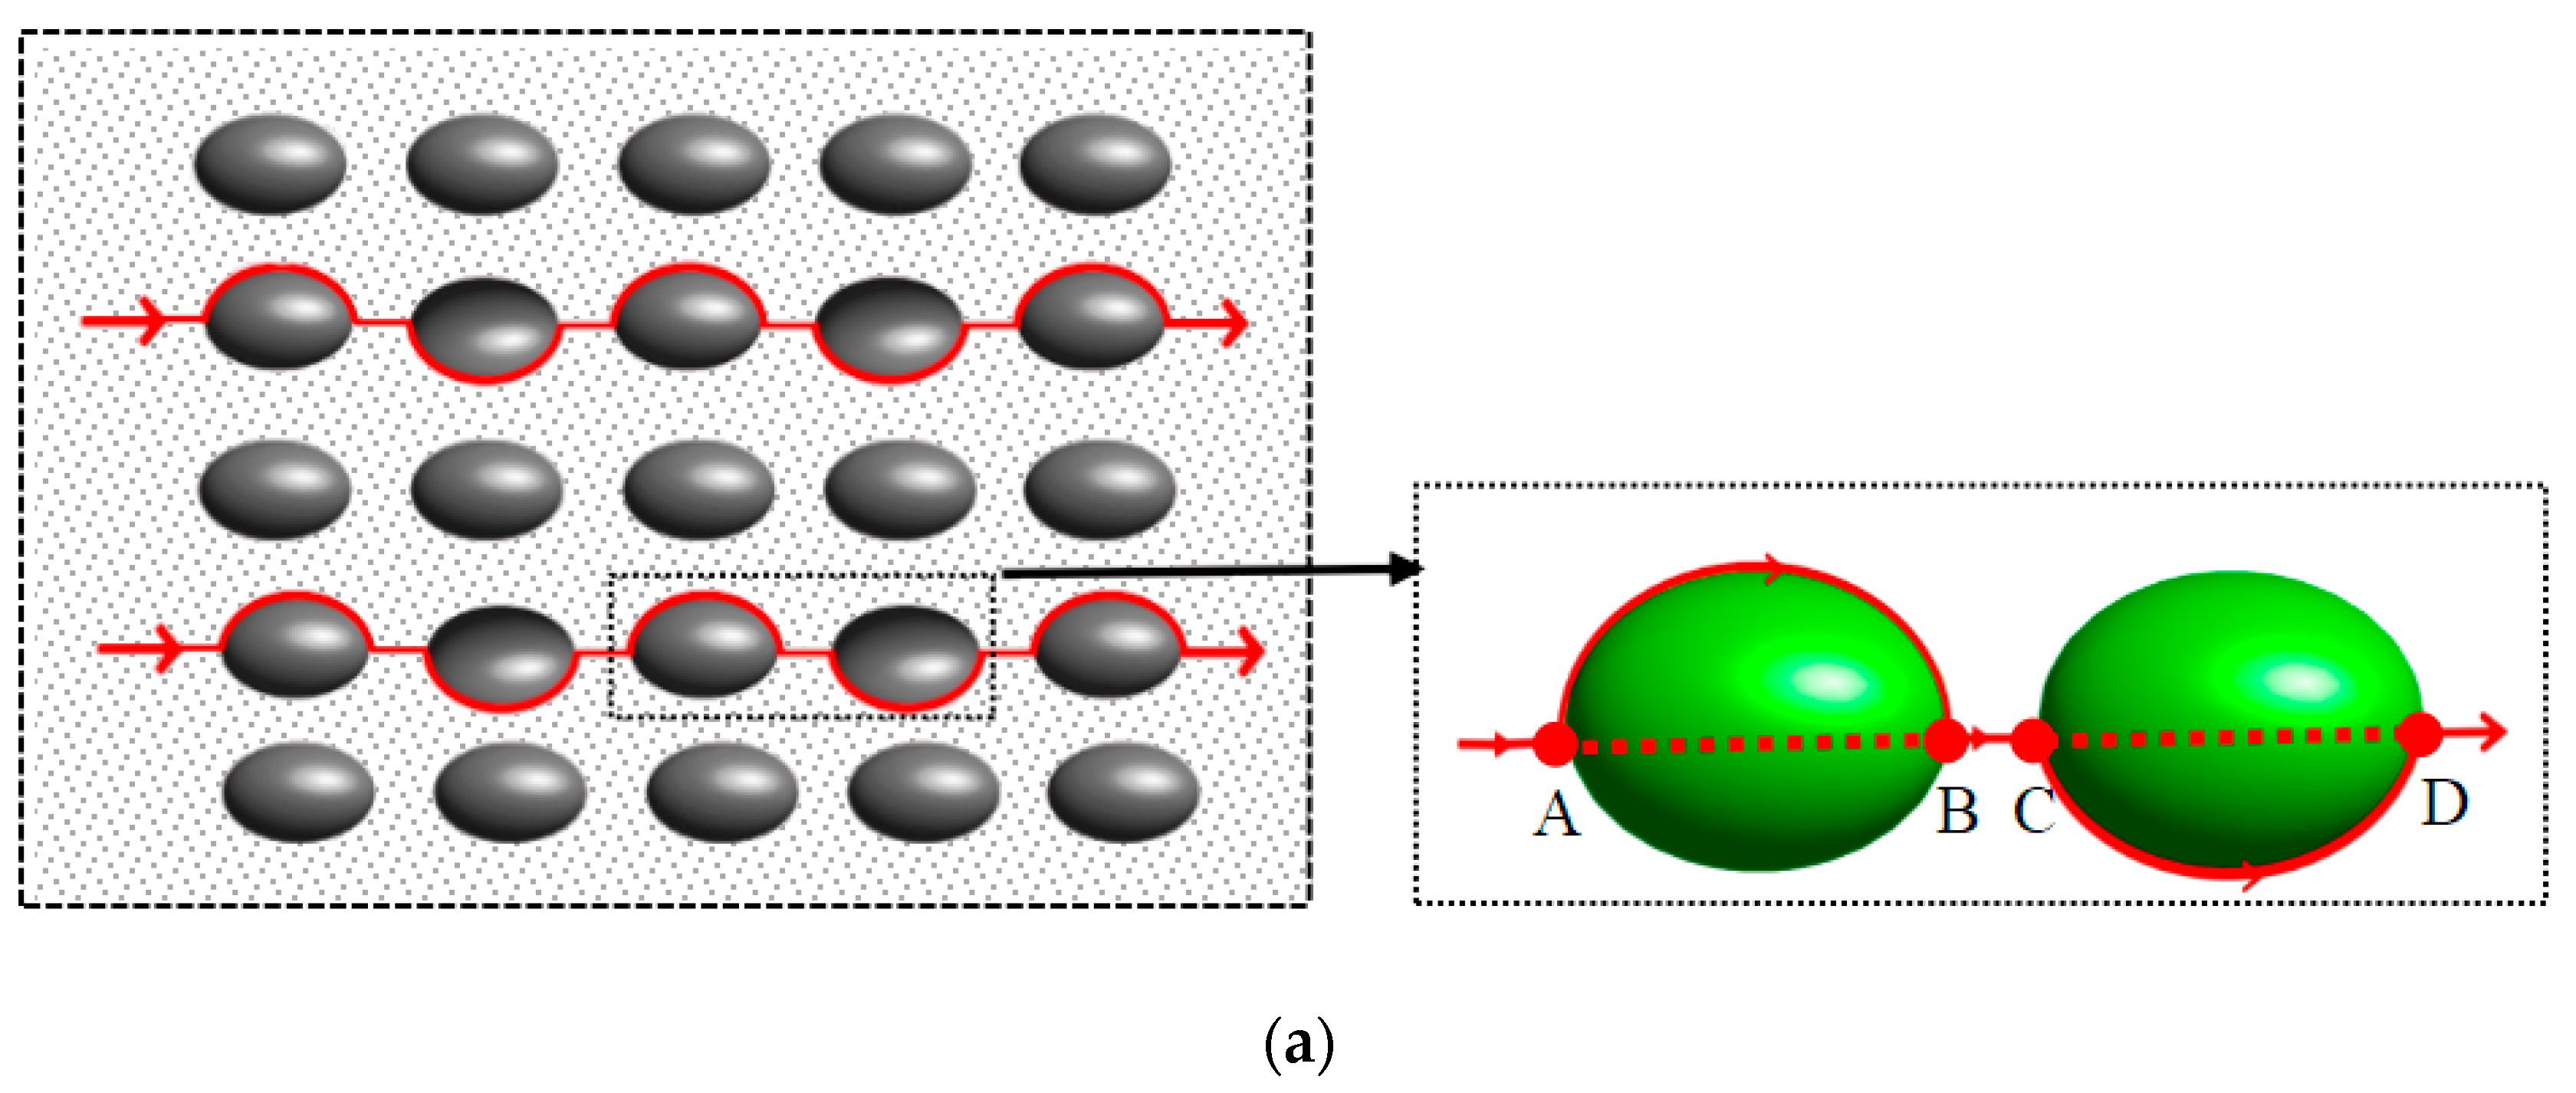
Figure 1. As the aggregate of the same particle size is evenly distributed in the matrix, the representative volume unit was taken, as shown in
Figure 2.
For the pebble aggregate, the red solid line between points AB and CD is expressed in
, which is the average actual path length of the particles along the aggregate. The red dotted line between points AB and CD is expressed in
, which is the average displacement length between the start point and the end point. BC is the average distance between the pebble aggregates, expressed in o. For crushed stone aggregates, the red solid line between points DE and FG is expressed in
, which is the average actual path length of the particles along the aggregate. The red dotted line between point DE and FG is expressed in
, which is the average displacement length between the starting point and the end point. EF is the average distance between the crushed stone aggregates, expressed in
. The average tortuosity is defined as the ratio of the actual path length of particles to the displacement length between the starting point and the end point of the particles. Combined with the literature [
1], the specific expression of average tortuosity is shown in Equation (1):
where
and
denote the actual transport path length of the particles moving along the sand aggregate surface and the stone aggregate surface, respectively;
and
denote the linear distance between the starting point and the end point of the sand and the stone, respectively;
and
denote the sand and the stone aggregate spacing, respectively;
ha is the degree of hydration of the cement;
τuh-cp and
τh-cp are the tortuosity of the stacked cement particles and the tortuosity of the fully hydrated cement particles, respectively; and
φuh-cp and
φh-cp are the porosity of the stacked cement particles and the porosity of the fully hydrated cement particles, respectively, with
φuh-cp = 0.58;
w is the mass of water;
c is the mass of cement.
2.1. Derivation of Tortuosity Model
As an indispensable and important part of concrete, the aggregate has a great influence on the corrosion resistance of concrete. The model treated aggregate size as an inclusion embedded in the cement slurry matrix. The shape of the aggregate was mainly pebbles and gravel, as shown in
Figure 2.
The pebble aggregate particles are regarded as rotating ellipsoidal particles with different diameters, embedded in the mortar matrix. If the size distribution function fd of an elliptical aggregate is known, the short half-axis of the revolving ellipsoid is b and the long half-axis is a, k is the ratio of length to diameter of a revolving ellipsoid. When k = a/b > 1, the ellipsoid is prolate; when k = a/b < 1, the ellipsoid is oblate.
The volume (
V) of the rotating ellipsoid is obtained as follows:
The surface area (
S) of the rotating ellipsoid is obtained as follows:
the equivalent diameter of an aspheric particle is defined as the diameter of a sphere, which equals the volume of the aspheric particle. In other words, the particle size distribution of the non-spherical aggregate particles can be correlated with the particle size distribution of the equivalent spherical particles. The equivalent diameter (
Deq), can be expressed as:
The gravel aggregate particles are regarded as regular octahedron and icosahedron. According to geometry and stereoscopic principles, the relationship between the edge length (
a) and its circumscribed sphere radius (
rcir) can be expressed as:
The volume (
V) of the regular octahedron and icosahedron are given as follows:
The surface area (
S) of the regular octahedron and icosahedron are given as follows:
For Plato polyhedral aggregate particles, the particle size of the polyhedral aggregate can be correlated with that of the spherical aggregate by means of an equivalent diameter. For a regular octahedron and icosahedron, its equivalent diameter can be expressed as:
We mainly discuss two special grades of aggregate: Fuller grade aggregates and equal volume grade aggregates, which represent the upper and lower limits of aggregate size grading in concrete. Therefore, the size distribution function
fd(
x) of the polyhedral aggregate can be expressed as [
13]:
The volume fraction (
fst) of aggregate in concrete can be calculated by the concrete mix ratio. When the edge length of concrete blocks is known to be
L, the number of aggregates (
N) can be obtained.
The average value of the surface spacing between adjacent aggregates can be expressed by the mean free path (
) [
14], which is directly affected by the aggregate volume fraction (
fs) and solid specific surface area (
SV), as shown in Equations (11) and (12):
The average arc length (
) and chord length
(
) of the ellipsoidal aggregate are given as follows, respectively.
The average arc and chord length of the regular octahedron and icosahedron aggregate are given as follows, respectively.
By substituting Equations (13)–(16) into Equation (1a), the tortuosity of cement-based materials can be expressed as follows:
where
τc,
τm, and
τcp are the tortuosity of the concrete, mortar, and porosity of cement pastes, respectively, and the expression is given in [
1].
Porosity (
φ) is also an important parameter affecting ion diffusion performance in concrete. The formula of porosity is as follows [
15]:
where
w is the mass of water;
c is the mass of cement; and
fvc is the cement volume fraction.
2.2. Numerical Simulation of the Influence of Aggregate Morphology and Grades on Tortuosity
In theoretical simulation, the aggregate morphology is often regarded as regular octahedron and regular icosahedron, spherical, elliptical, and oblate pebble aggregates, as shown in
Figure 3. According to GB/T 14865-2011 [
16] in China, the length of pebble particles should be less than 2.4 times the average particle size of the corresponding particle size, and the thickness of pebble particles should be more than 0.4 times the average particle size. Therefore, the range of the length–diameter ratio of the pebble aggregate is 0.4~2.4.
According to Equation (17) as established in
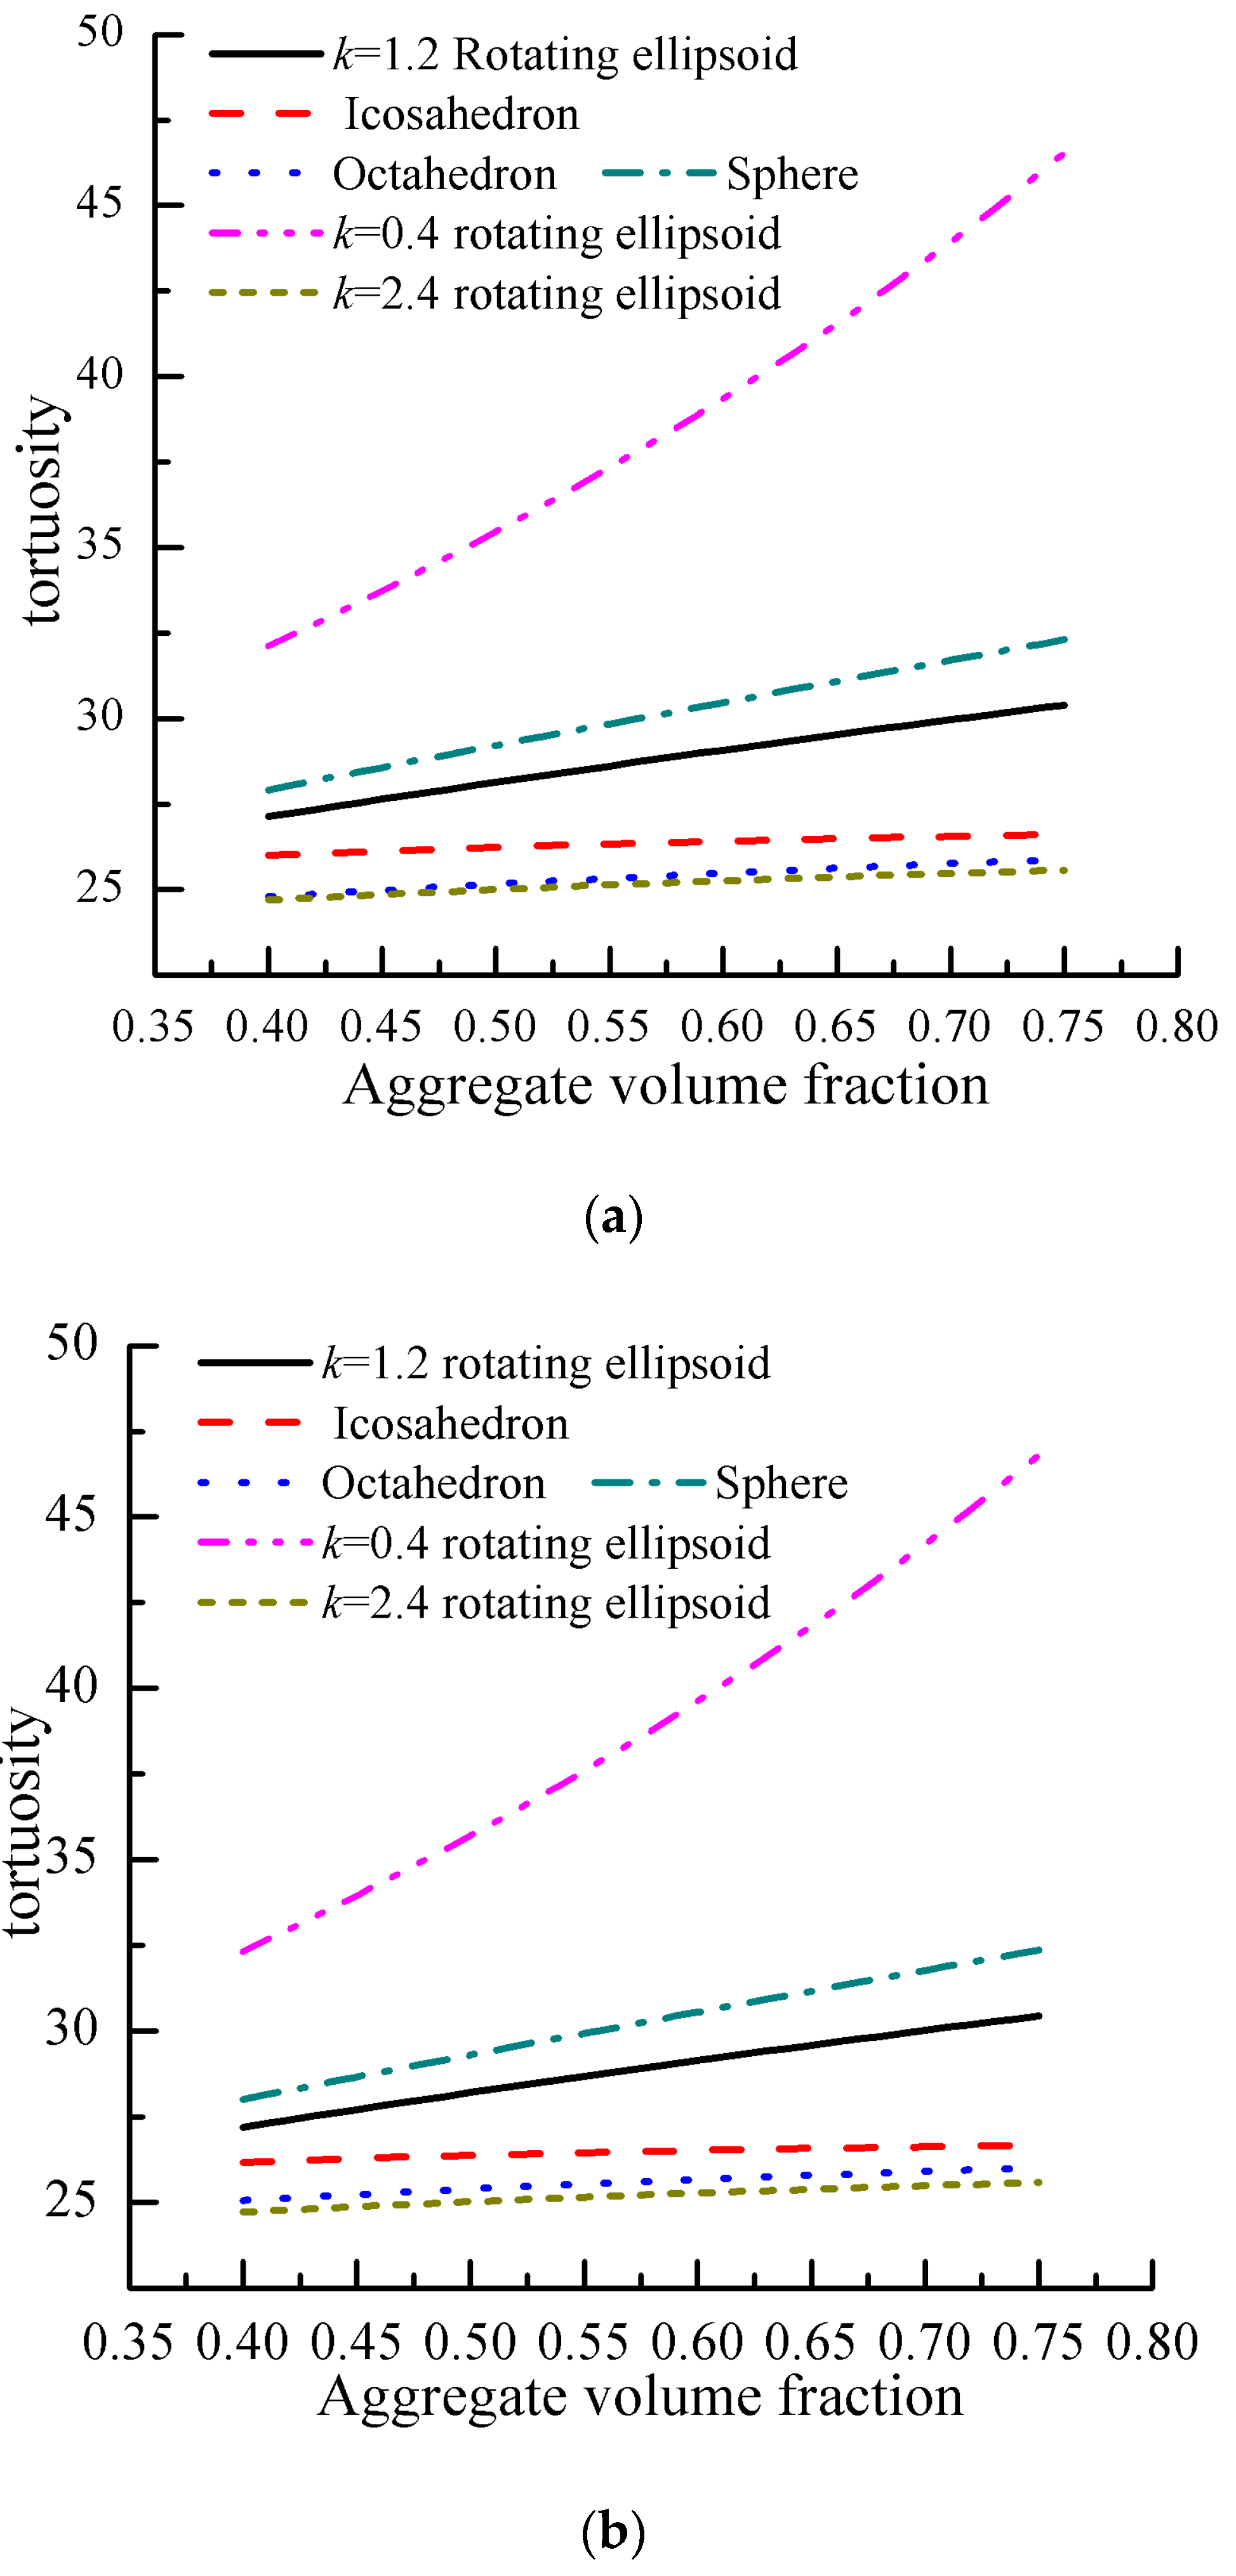
Section 2.1, for aggregates with Fuller and equal volume distribution, the influence of aggregate morphology including spherical, ellipsoid, octahedron, and icosahedron on tortuosity is shown in
Figure 4. It can be seen that the shape, the volume fraction, and the gradation of aggregates are important factors affecting the change in the tortuosity in cement-based materials, and the tortuosity increased with the increase in the aggregate volume fraction.
It can be seen from
Figure 4a that when the aggregate gradation and volume fraction were the same, the tortuosity value changes significantly with the morphology of gravel, and its size is sphere > icosahedron > octahedron in turn. Compared with spheres, the tortuosity values of icosahedral and octahedral aggregates were reduced by 11% and 15%, respectively. According to Equations (13)–(16), it is known that the closer the shape the aggregate is to a sphere, the larger the perimeter of the aggregate. With the increase in the perimeter of the aggregate in unit volume concrete, the length of the transport path increases, therefore, the tortuosity value of the concrete increases.
It can also be seen from
Figure 4a that when the aggregate gradation and volume fraction are the same, the influence of the pebble morphology on the transport is simulated for the length–diameter ratio
k = 0.4, 1, 1.2, and 2.4, representing the oblate, spherical, ellipsoid, and needle-bar aggregates. As can be seen from the figure, the tortuosity value was ellipsoid (
k = 0.4) > sphere (
k = 1) > ellipsoid (
k = 1.2) > ellipsoid (
k = 2.4). Compared with spherical aggregates, the tortuosity value of ellipsoid (
k = 0.4), ellipsoid (
k = 1.2), and ellipsoid (
k = 2.4) increased by 18%, 10%, and 15%, respectively. The tortuosity value decreased with the increase in the length–diameter ratio. The main reason is that when the short axis of the ellipsoidal aggregate is the same as the radius of the spherical aggregate, according to Equations (13) and (14), as the length–diameter ratio increases, the quantity of the aggregate in the unit volume concrete increases, thereby increasing the perimeter of the aggregate and extending the transport path, therefore increasing the tortuosity value. Although the ellipsoidal aggregate in concrete with a length–diameter ratio (
k) less than 1 has a larger tortuosity value, its compressive strength is lower, so it is used less in engineering.
In addition, from
Figure 4a,b, it can be seen that the gradation of the aggregate also has a great influence on the tortuosity values. When the shape and the volume fraction of the aggregates are the same, the tortuosity of cement-based materials with Fuller gradation aggregates is greater than that with an equal volume gradation aggregates. For example, when the rotary ellipsoid and regular icosahedron
k = 1.2 changed from 0.4 to 0.75, concrete tortuosity and Fuller gradation at the same volume gradation decreased by 7% and 9%, respectively. The equal volume aggregate gradation and Fuller aggregate gradation represent the upper and lower limits of concrete aggregate gradation, respectively. When the aggregate shape and volume fraction are the same, the amount of aggregate under the Fuller gradation in the unit volume concrete will be larger than that of the equal volume gradation. The more aggregates there are in the concrete, the longer the aggregate circumference sum, resulting in a longer ion transport path and the greater the tortuosity.
3. Morphological Characterization of Actual Aggregate in Cement-Based Materials
The tortuosity model established in
Section 2.1 was mainly based on ideal aggregate particles, which has a certain gap with the actual aggregate morphology. The theoretical prediction in
Section 2.2 also confirms that the aggregate morphology has a great influence on the pore tortuosity in cement-based materials. Therefore, it is necessary to carry out statistical characterization of the actual aggregate morphology to establish the similarity relationship between the ideal and actual aggregate. There are many parameters to represent the morphological characteristics of aggregates such as flatness, aspect ratio, micro-characteristics, roundness, practical sphericity, roughness, corner parameters, axial coefficient, roundness, etc. [
17,
18,
19,
20,
21,
22]. According to the parameters required for the tortuosity model established in
Section 2.1, the parameters of the micro-characteristics were selected to characterize the morphology of the actual pebble and gravel aggregates.
3.1. Expressions of the Microscopic Characteristics of Actual Aggregate Particles
The microscopic characteristics refer to the ratio between the equivalent perimeter (Pe) and the real perimeter (P) of the aggregate particles. In this way, the microscopic characteristics of pebbles can be described as the ratio of the perimeter of the equivalent ellipse circumference of particles to the real perimeter of the particles. The gravels are described as the ratio of the perimeter of a regular decagon tangential to the perimeter of a particle with an equal area.
Thus, the microscopic characteristics (
ξ) of pebbles and gravel can be expressed as follows:
Thus, the
ξ of pebbles can be expressed as follows:
where
A represents the sum of the pixels in the boundary area of particles;
P represents the sum of the continuous pixels in the boundary area of particles;
Pe represents the circumference of the equivalent ellipse of the object; and
e represents the eccentricity of the equivalent ellipse.
Gravel is often regarded as octahedrons and icosahedrons, therefore, its projection shape is regular quadrilateral and decagon, respectively. The
ξ of gravel is as follows:
According to Equations (20) and (21), the tortuosity of the actual aggregate concrete can be expressed as:
where
ξst is the microscopic characteristics of sand and
ξsa is the microscopic characteristics of stone.
3.2. Characterization of Microscopic Properties of Actual Aggregate
The specific processing method is as follows:
(1) Sampling through the quartile method and laying it on a white background plane to avoid overlapping aggregate particles as far as possible.
(2) The images of coarse and fine aggregate particles are taken by a digital camera with more than 5 million pixels in the JPG file format. According to the JPG file format image obtained above, this paper used MATLAB programming software (MathWorks company of Beijing, China) to process the images of coarse and fine aggregate particles.
(3) The image in the JPG file format taken by digital camera is a RGB image that can be transformed into a gray image, which can greatly reduce the amount of image data and facilitate image processing, as shown in
Figure 5a. By analyzing the gray histogram of the image to determine the optimal threshold needed for image segmentation, the threshold is used for binarization, and the gray image is transformed into a binary image, reverse binary image, and optimized image, as shown in
Figure 5b–d.
(4) Then, the image area, edge circumference, eccentricity of the equivalent ellipse, the long axis of the equivalent ellipse, the short axis of the equivalent ellipse, and the diameter of the equivalent circle are extracted.
(5) Finally, the shape parameters of the aggregates are calculated by the weighted average method:
In the formula, F represents the shape parameters of the aggregate particles as a whole; fs represents the volume fraction of the aggregates per grain size; and ξ represents the shape parameter value of the corresponding granular aggregate.
3.3. Testing Process and Statistical Results of Micro-Properties of Fine Aggregate
After the obtained sand sample was uniformly stirred, the sample was divided by the quarter method, and after washing with water, six samples of not less than 550 g each were taken. The two samples were respectively placed in an oven at a temperature of 105 ± 5 °C and dried to a constant weight, and then 500 g of the sample was taken. The sieving results of the sample are shown in
Figure 6.
According to the definition of the micro-characteristics and considering the actual situation, sand grains below 1.18 mm were regarded as spheres and their shape parameters were 1, where the sand particle size in the range of 1.18~2.36 mm and 2.36~4.75 mm were counted by the MATLAB programming language, according to the image processing steps given in
Section 3.2. The statistical results of the micro-characteristic are shown in
Table 1 and
Table 2, respectively. It can be seen that the micro-characteristics of sand particles with particle sizes of 1.18~2.36 mm and 2.36~4.75 mm were between 0.95~0.98.
3.4. Testing Process and Statistical Result of Micro-Properties of Coarse Aggregate
The coarse aggregate was divided by a quartering method to 22 kg, and then pebble and gravel aggregate samples with particle sizes of 5~10 mm and 10~20 mm were randomly sampled as shown in
Figure 7. For the image statistics, each aggregate sample was photographed from seven angles as shown in
Figure 8. After image processing with MATLAB, the statistical results of the morphological parameters of pebbles and gravels are shown in
Table 3,
Table 4,
Table 5,
Table 6 and
Table 7, respectively.
Table 3,
Table 4,
Table 5,
Table 6 and
Table 7 present the statistical morphological parameters of each aggregate including the area, circumference, eccentricity of equivalent ellipse, long and short axes, and equivalent diameter of circle by using MATLAB programming software from seven angles. These statistical morphological parameters were brought into Equation (22) and the average value of the shape parameters of the weighted aggregates were calculated and are given in
Table 8. As can be seen from
Table 8, the shape parameters of the aggregate with particle sizes of 5~10 mm and 10~20 mm ranged from 0.89~0.95.
4. Verification of Tortuosity Model
Due to the complexity of pore tortuosity, it is relatively difficult to measure directly. At present, mercury intrusion porosimetry (MIP) is commonly used to characterize the pore structure characteristics of cement-based materials such as porosity, tortuosity, and pore connectivity in cement-based materials [
23]. Therefore, it was introduced in this paper to verify the reliability of the model established.
4.1. Preparation of Samples
Considering the possible errors caused by coarse aggregates in concrete, mortar specimens were selected to validate the model, where the water -o-cement ratio was 0.45, and the volume fraction of sand was 20%, 40%, and 50%, respectively. The gradation of sand is shown in
Figure 6. The stirred slurry was first poured into a plastic beaker of 500 mL, shaken for 3 min, and then injected into a PVC (Polyvinyl chloride) tube with a diameter of 16 mm, and shaken for another 2 min. The purpose of vibration was to eliminate the bubbles produce d during mixing to reduce the test error. After three days of curing in the standard room, the sample was taken out from the PVC tube and then both ends were removed. The intermediate sample was taken to a height of about 15 mm and then standardized to the specified age for testing the porosity tortuosity. The sample was immersed in anhydrous ethanol before the test to prevent hydration.
4.2. Testing Process and Results of Pore Tortuosity
AutoPore IV9500 produced by Micrometrics (Ottawa, Canada) was used for MIP, where the maximum pressure can reach 415 MPa, and the pore size of the measurement range was 3 nm to 360 μm. The measurement was conducted in two stages: a manual low pressure from 0.003 MPa to 0.21 MPa, and automatic high pressure from 0.21 MPa to 242 MPa. After completing the low-pressure test, the penetrometer was taken out from the low-pressure chamber and weighed. The high-pressure test was carried out. The contact angle was set at 130 degrees and the balance time was 30 s.
The experimental and theoretical prediction results of tortuosity in cement-based materials are shown in
Table 9, where the micro-characteristics of 2.36~4.75 mm particle size are 0.96. By substituting it into Equations (19)–(22), the theoretical results of actual tortuosity can be obtained. As can be seen from
Table 9, the theoretical prediction results coincide with that of the MIP test, whose maximum error is 10.41%.
To further verify the reliability of the tortuosity model, the tortuosity value given by Zuo [
1] was compared with the predicted results, as shown in
Table 10. It can be seen from the table that the relative error between the measured and predicted values was less than 10%, which also prove that the prediction model of tortuosity and the characterization of morphological parameters are reasonable.
5. Sensitivity Analysis of Model Parameters
5.1. Effect of Aggregate Morphology on Tortuosity
Aggregate morphology is mainly expressed by the microscopic characteristics of aggregate particles (ξ), where we assumed that ξ = 0.5–1 and was brought into Equation (22). The relationship of the ξ and tortuosity is demonstrated in
Figure 9. It can be seen that the tortuosity values of cement-based with pebble and gravel aggregates decreased with the increase in the ξ. For example, the tortuosity values at
ξ = 0.5 decreased by 51% and 50% with respect to that at
ξ = 1.0 for the pebble and gravel aggregate, respectively. The main reason is that the
ξ values affect the roughness of the aggregate surface. The smaller the
ξ values, the rougher the surface and the longer the perimeter of the aggregate, which increase the transport paths of the medium and are conducive to enhancing the durability of cement-based materials.
5.2. Effect of Hydration Degree on Tortuosity
The degree of hydration of cement (
ha) has a great influence on the pore tortuosity of cement paste, where we assumed that
ha = 0.5~0.9 and was brought into Equation (1b). The relationship of the
ha and tortuosity is demonstrated in
Figure 10. It can be seen that the tortuosity values of cement-based with pebble and gravel aggregates increased with the increase in the
ξ. For example, the tortuosity values at
ha = 0.5 decreased by 37.6% and 37.5% with respect to that at
ha = 0.9 for the pebble and gravel aggregate, respectively. The main reason is the decrease in porosity and pore connectivity with the increase in hydration degree of cement, which leads to the increase in tortuosity.
5.3. Effect of Water–Cement Ratio on Transport
Water–cement ratio (w/c) has a great influence on the pore structure of cement matrix between the aggregate and matrix, where we assumed that w/c = 0.35~0.55 and was brought into Equation (1b). The relationship of the w/c and tortuosity is demonstrated in
Figure 11. It can be seen that the tortuosity values of cement-based with pebble and gravel aggregates decreased with the increase in the
ξ. For example, the tortuosity values at w/c = 0.35 decreased by 29.9% and 30% with respect to that at w/c = 0.55 for the pebble and gravel aggregate, respectively. The main reason is the decrease in porosity and pore connectivity with the increase in the hydration degree of cement, which leads to the increase in tortuosity.
6. Simplified Application of Tortuosity Model in Engineering
In practical engineering, the pore tortuosity is an important parameter for predicting the transport of medium in structural concrete. The tortuosity model established above fully considers many factors such as the morphology of the aggregate, volume fraction of the aggregate, aggregate gradation and hydration degree of the slurry, etc. There are many parameters and complex calculation processes, but in practical engineering, there is an urgent need for a simpler tortuosity model in the process. Therefore, the above-mentioned tortuosity model can be simplified, and its expression can be expressed as follows:
In practical engineering, it is necessary to simplify the tortuosity formula to facilitate the practical application of engineering.
Table 11 is calculated according to Equation (1b). In
Table 12, t
1 represents the ratio of the circumference of the maximum section of the sphere, the ellipsoid of rotation, the regular octahedron, and the regular icosahedron to the circumference of the circumferential circle. t
2 represents the ratio of the area of the maximum section of sphere, ellipsoid of rotation, regular octahedron, and regular icosahedron to the area of the circumscribed circle. t
3 represents the ratio of the volume of sphere, ellipsoid of rotation, regular octahedron, and regular icosahedron to the volume of the circumscribed sphere.
The assumptions were as follows:
(1) The shape of the fine aggregate is a spherical shape; the shape of the coarse aggregate is a spheroidal shape and a regular polyhedron;
(2) Through the screening experiment, the grading of coarse and fine aggregates was statistically calculated, and the aggregate was weighted according to the grading and screening particle size to obtain the average particle size of the aggregate .
The average particle size of the fine aggregate is . The average particle size of the coarse aggregate is . R is the radius of the average particle size.
(1) The volume fraction of the aggregate fs is calculated by the concrete mix ratio.
(2) The volume fraction of fine aggregate is fsa. The volume fraction of the coarse aggregate is fst;
(3) In order to simplify the calculation, the regular polyhedron is unified into a rotating ellipsoid in combination with
Table 12.
By introducing Equations (26) and (27) into (23) and (24), the simplified tortuosity formula can be expressed as follows in Equation (28):
7. Conclusions
(1) Based on the stereological principle, the tortuosity model of ideal pebble and gravel aggregates in cement-based materials was established by the geometric method. Then, the microscopic characteristics of the actual sand and coarse aggregate were counted by using the image processing software MATLAB. The results show that the microscopic characteristics of particle size were 0.95, 0.96, 0.93, and 0.92 in the range of 2.36–4.75 mm, 5–10 mm, and 10–20 mm, respectively. On this basis, the prediction model of the tortuosity degree of actual aggregate in the actual cement-based materials was established. The reliability of the tortuosity model was proven by the mercury intrusion test data and experimental data reported in the literature. The maximum error of the model was 8.59%.
(2) The effects of the aggregate particle shape parameters, aggregate volume fraction, and water cement ratio on the tortuosity of the transport path in concrete were analyzed. The tortuosity decreased with the increase in the aggregate particle shape parameters, increased with the increase in the cement hydration degree, and increased with the increase in the water cement ratio. Combined with engineering practice and considering the morphological characteristics of the aggregate, a simplified tortuosity model was presented, which facilitates engineering applications.


