Supported ITZ Modification Efficiencies via Surface Coating Nanoparticles on Aggregate and its Influence on Properties


Abstract
1. Introduction
2. Experimental
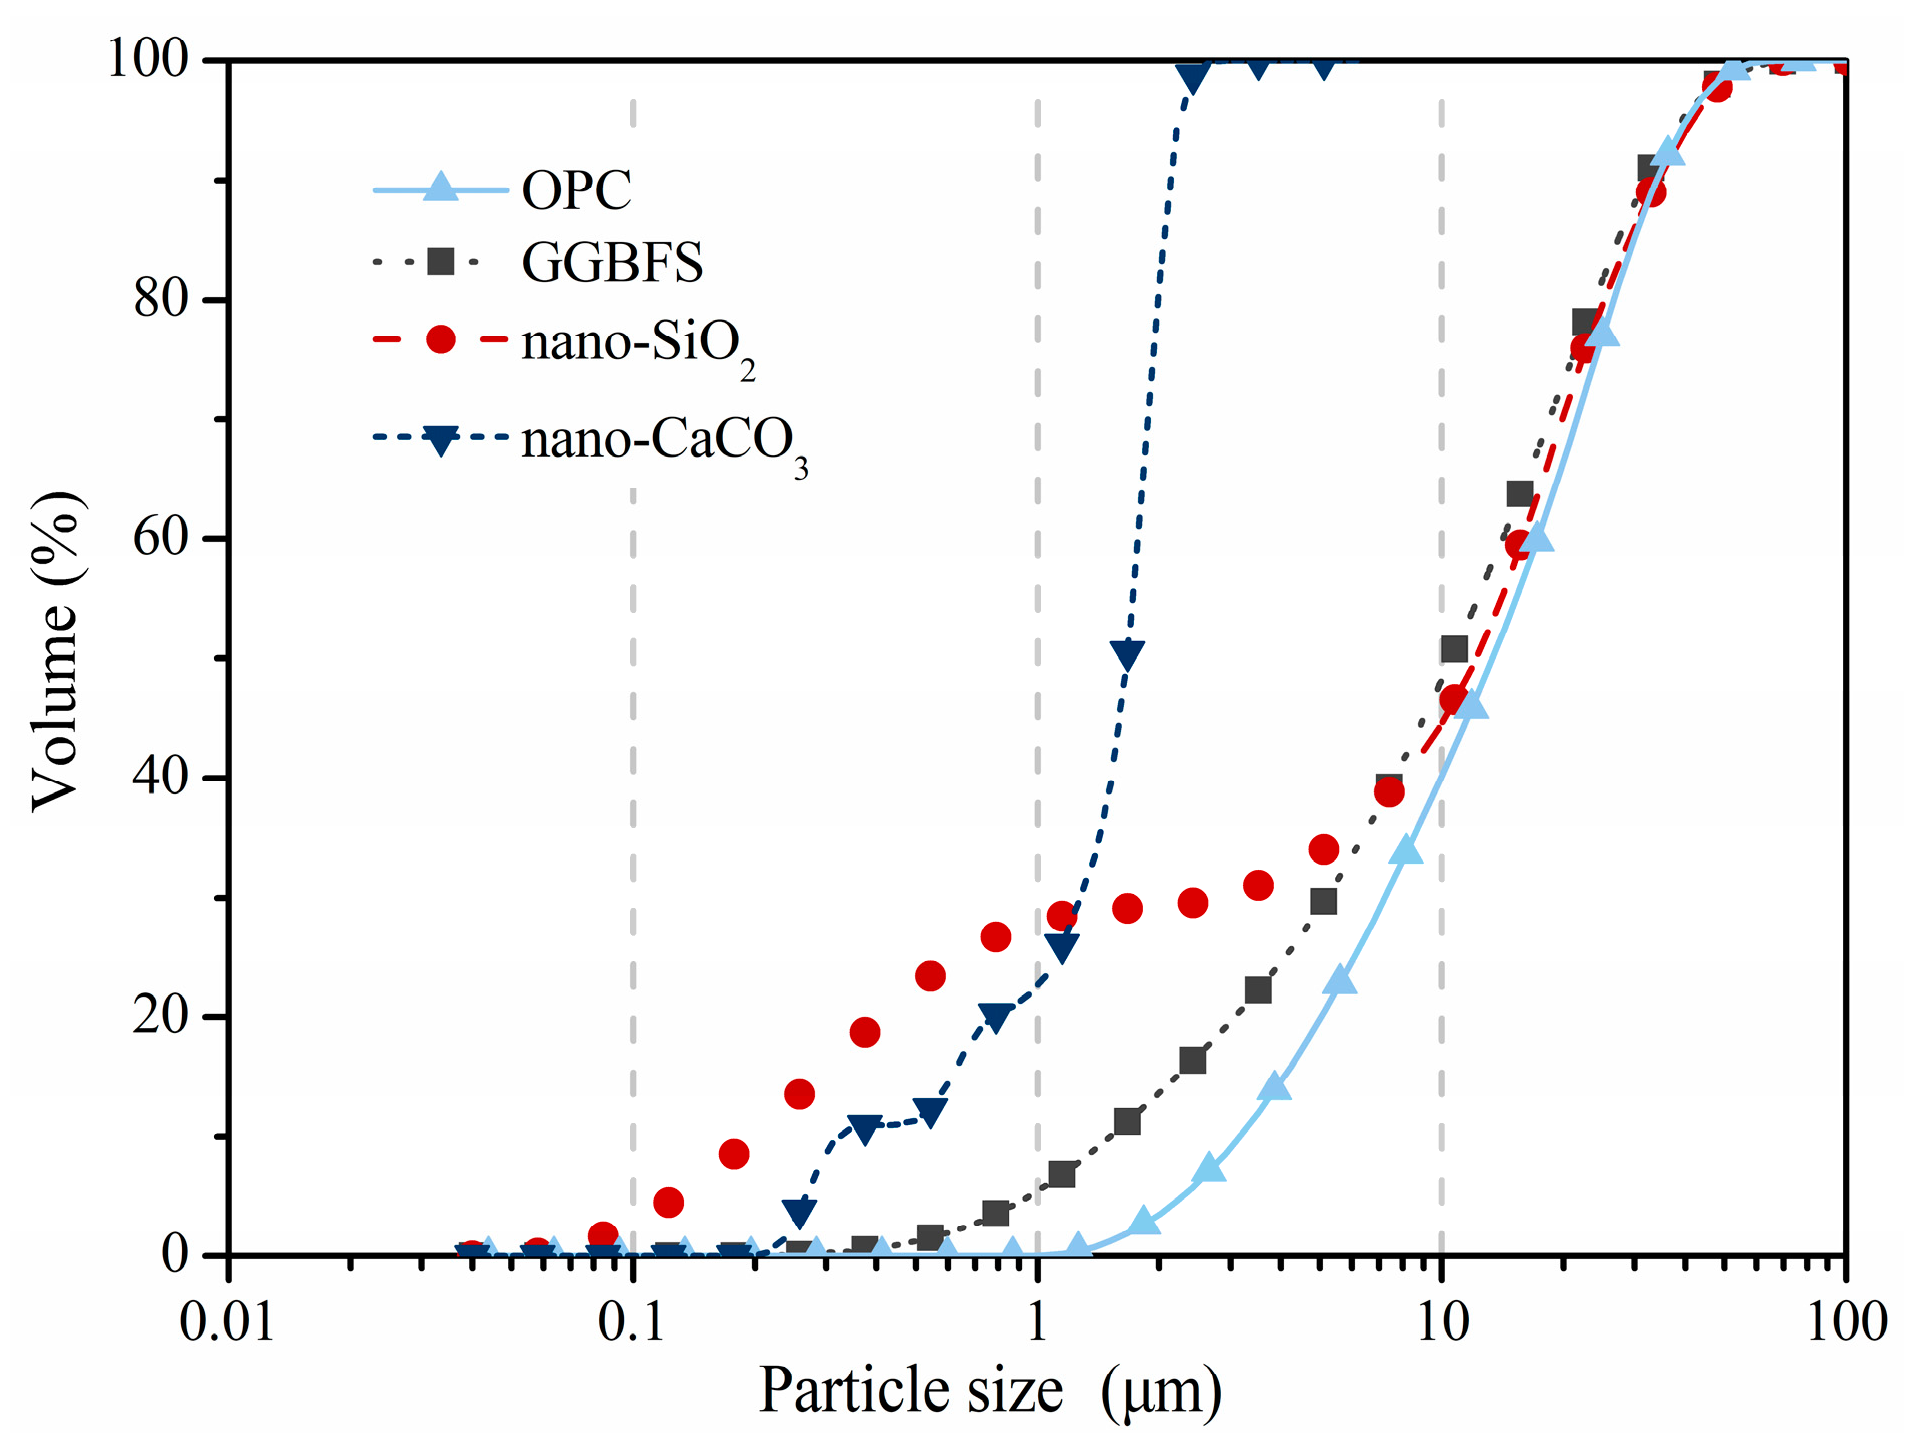
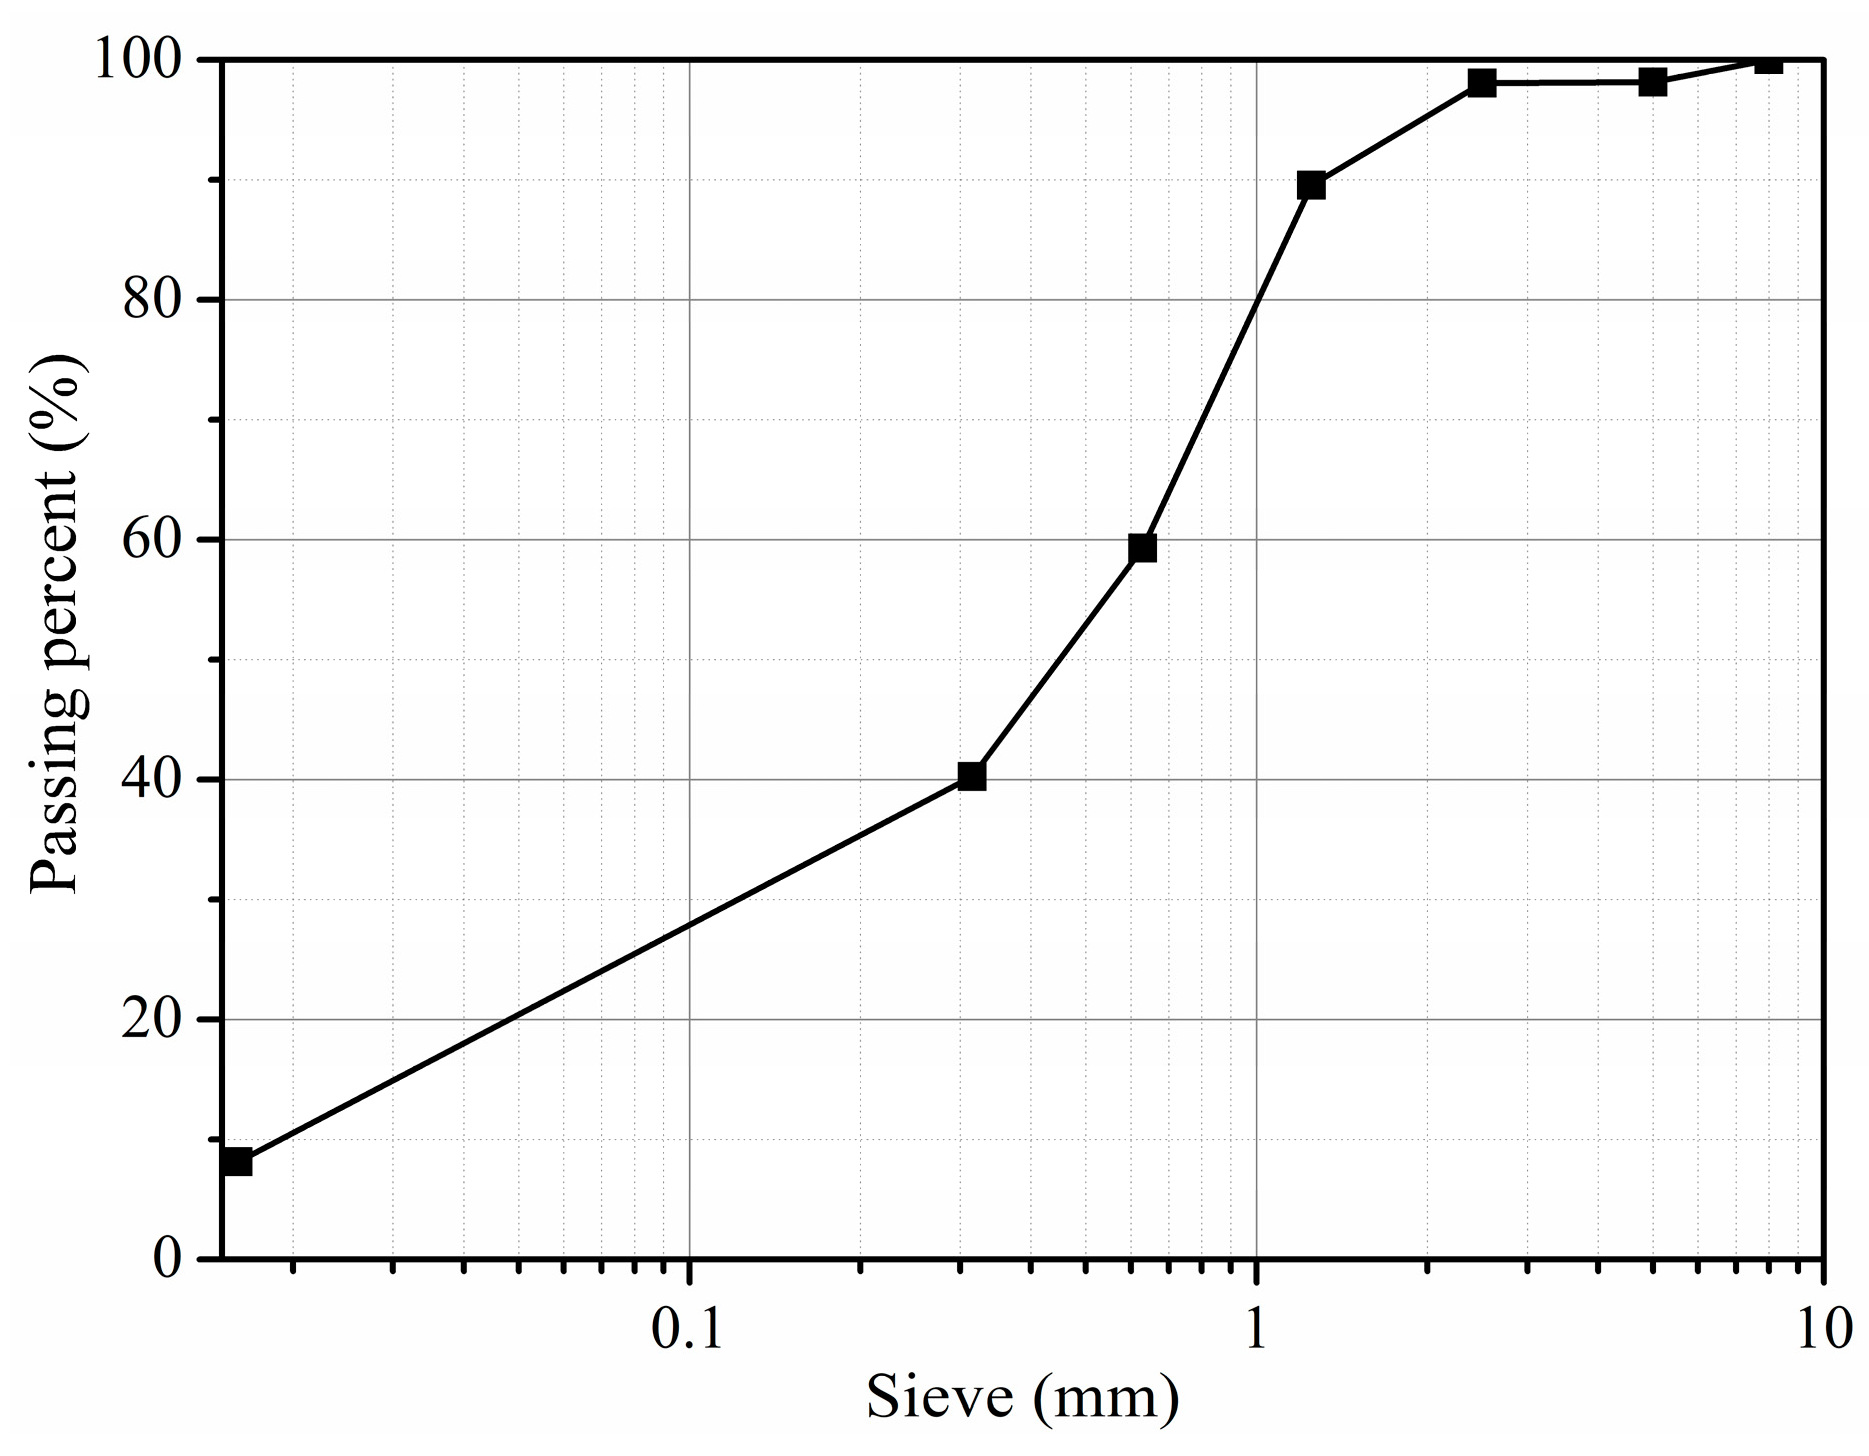
2.1. Materials
2.2. Mixture
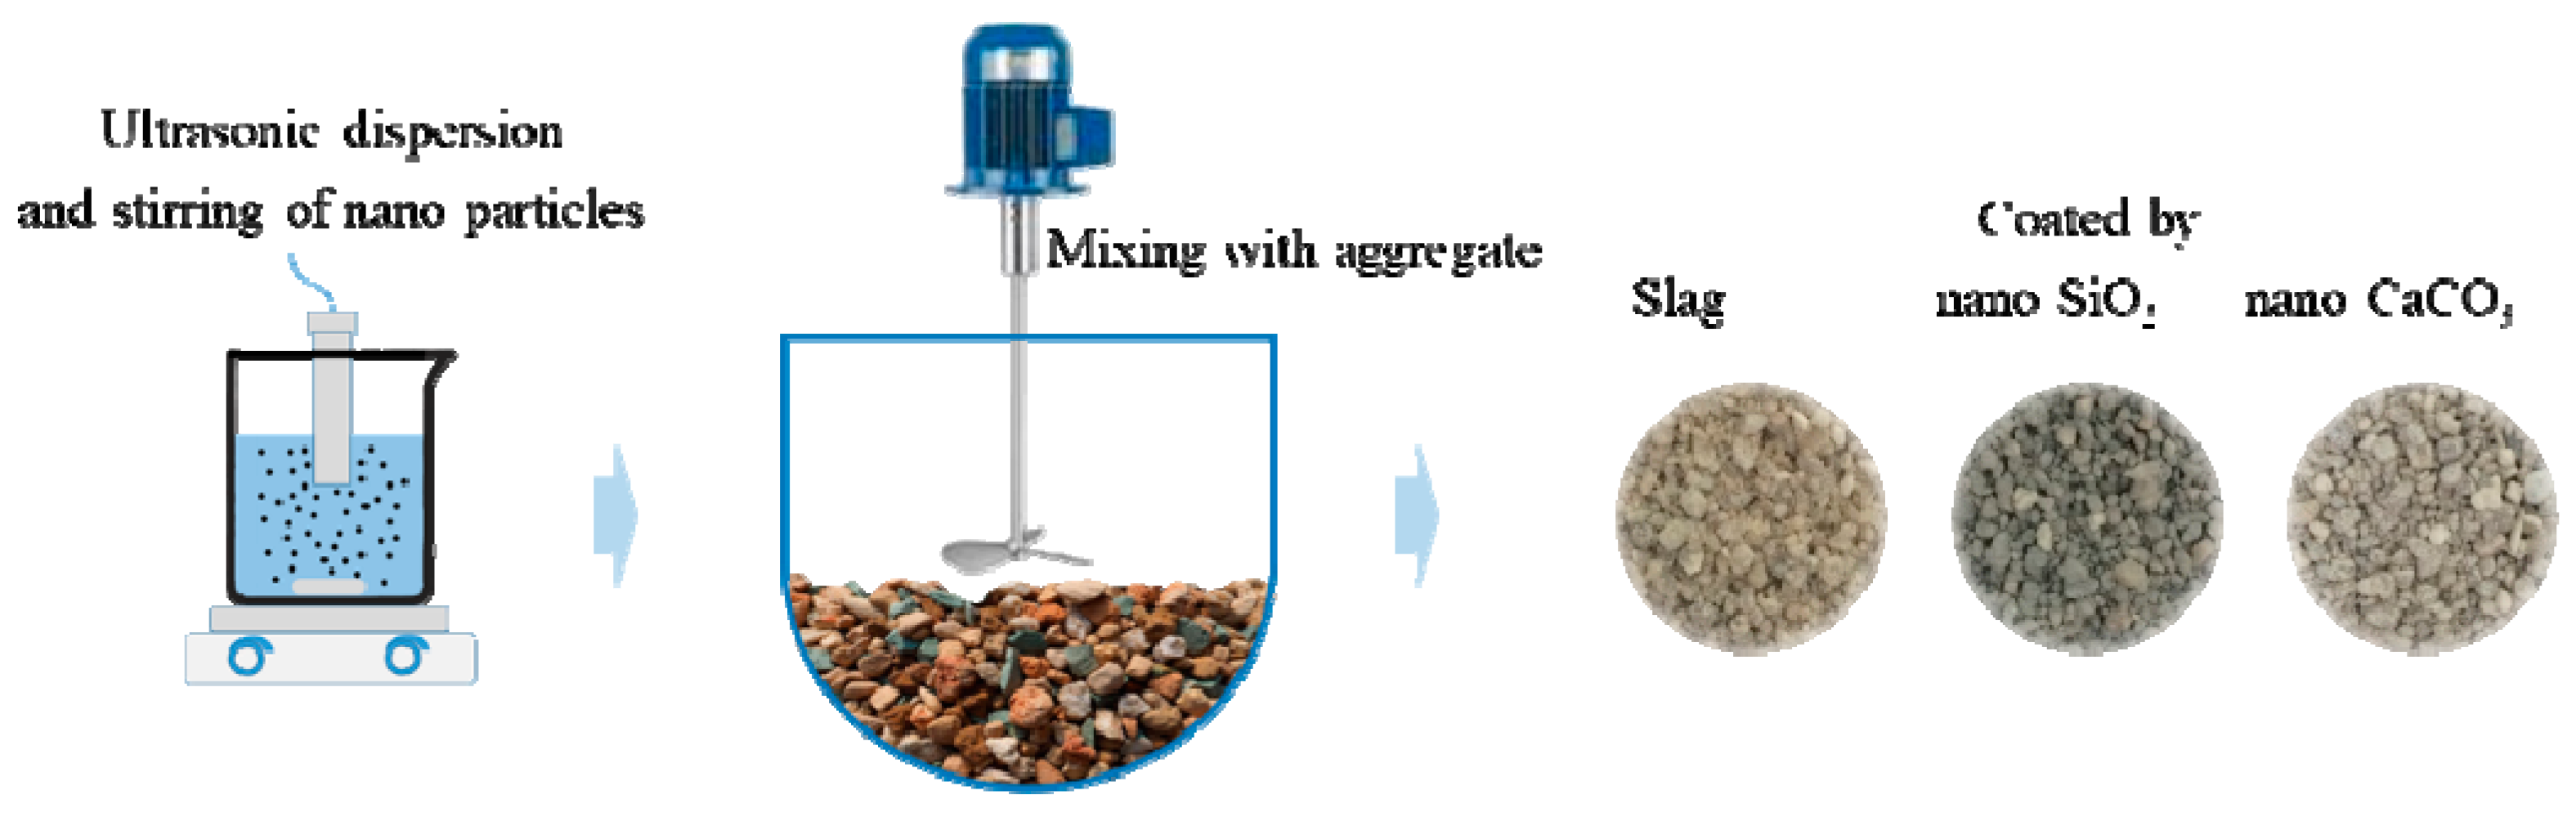
2.3. Sample Preparation
2.4. Mechanical and Transport Properties
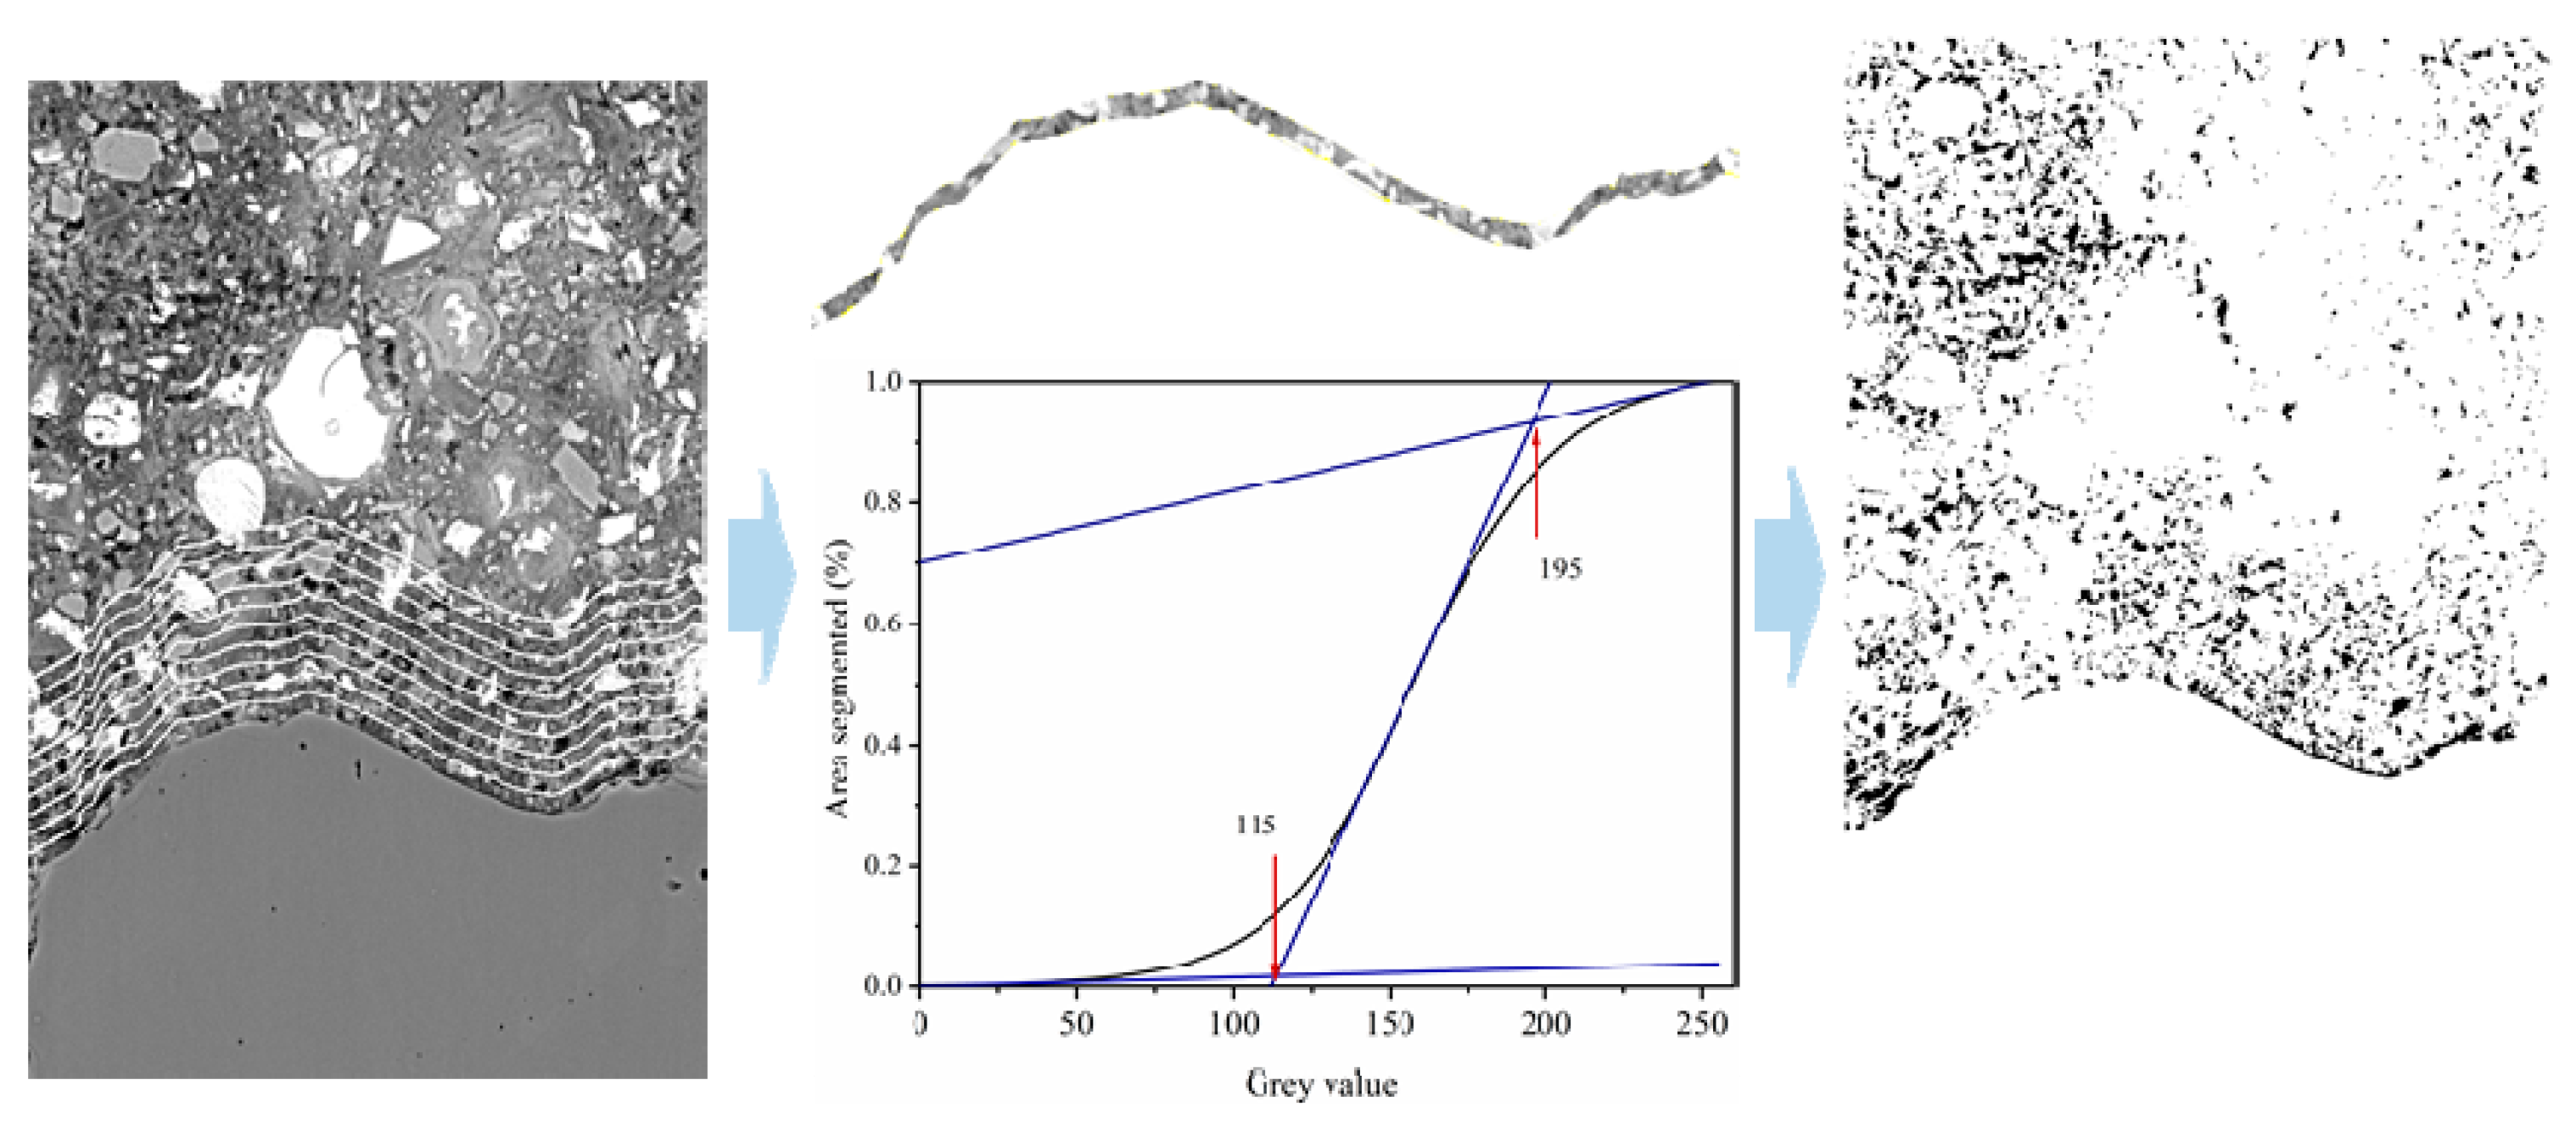
2.5. ITZ Microstructure Determination
3. Results and Discussion
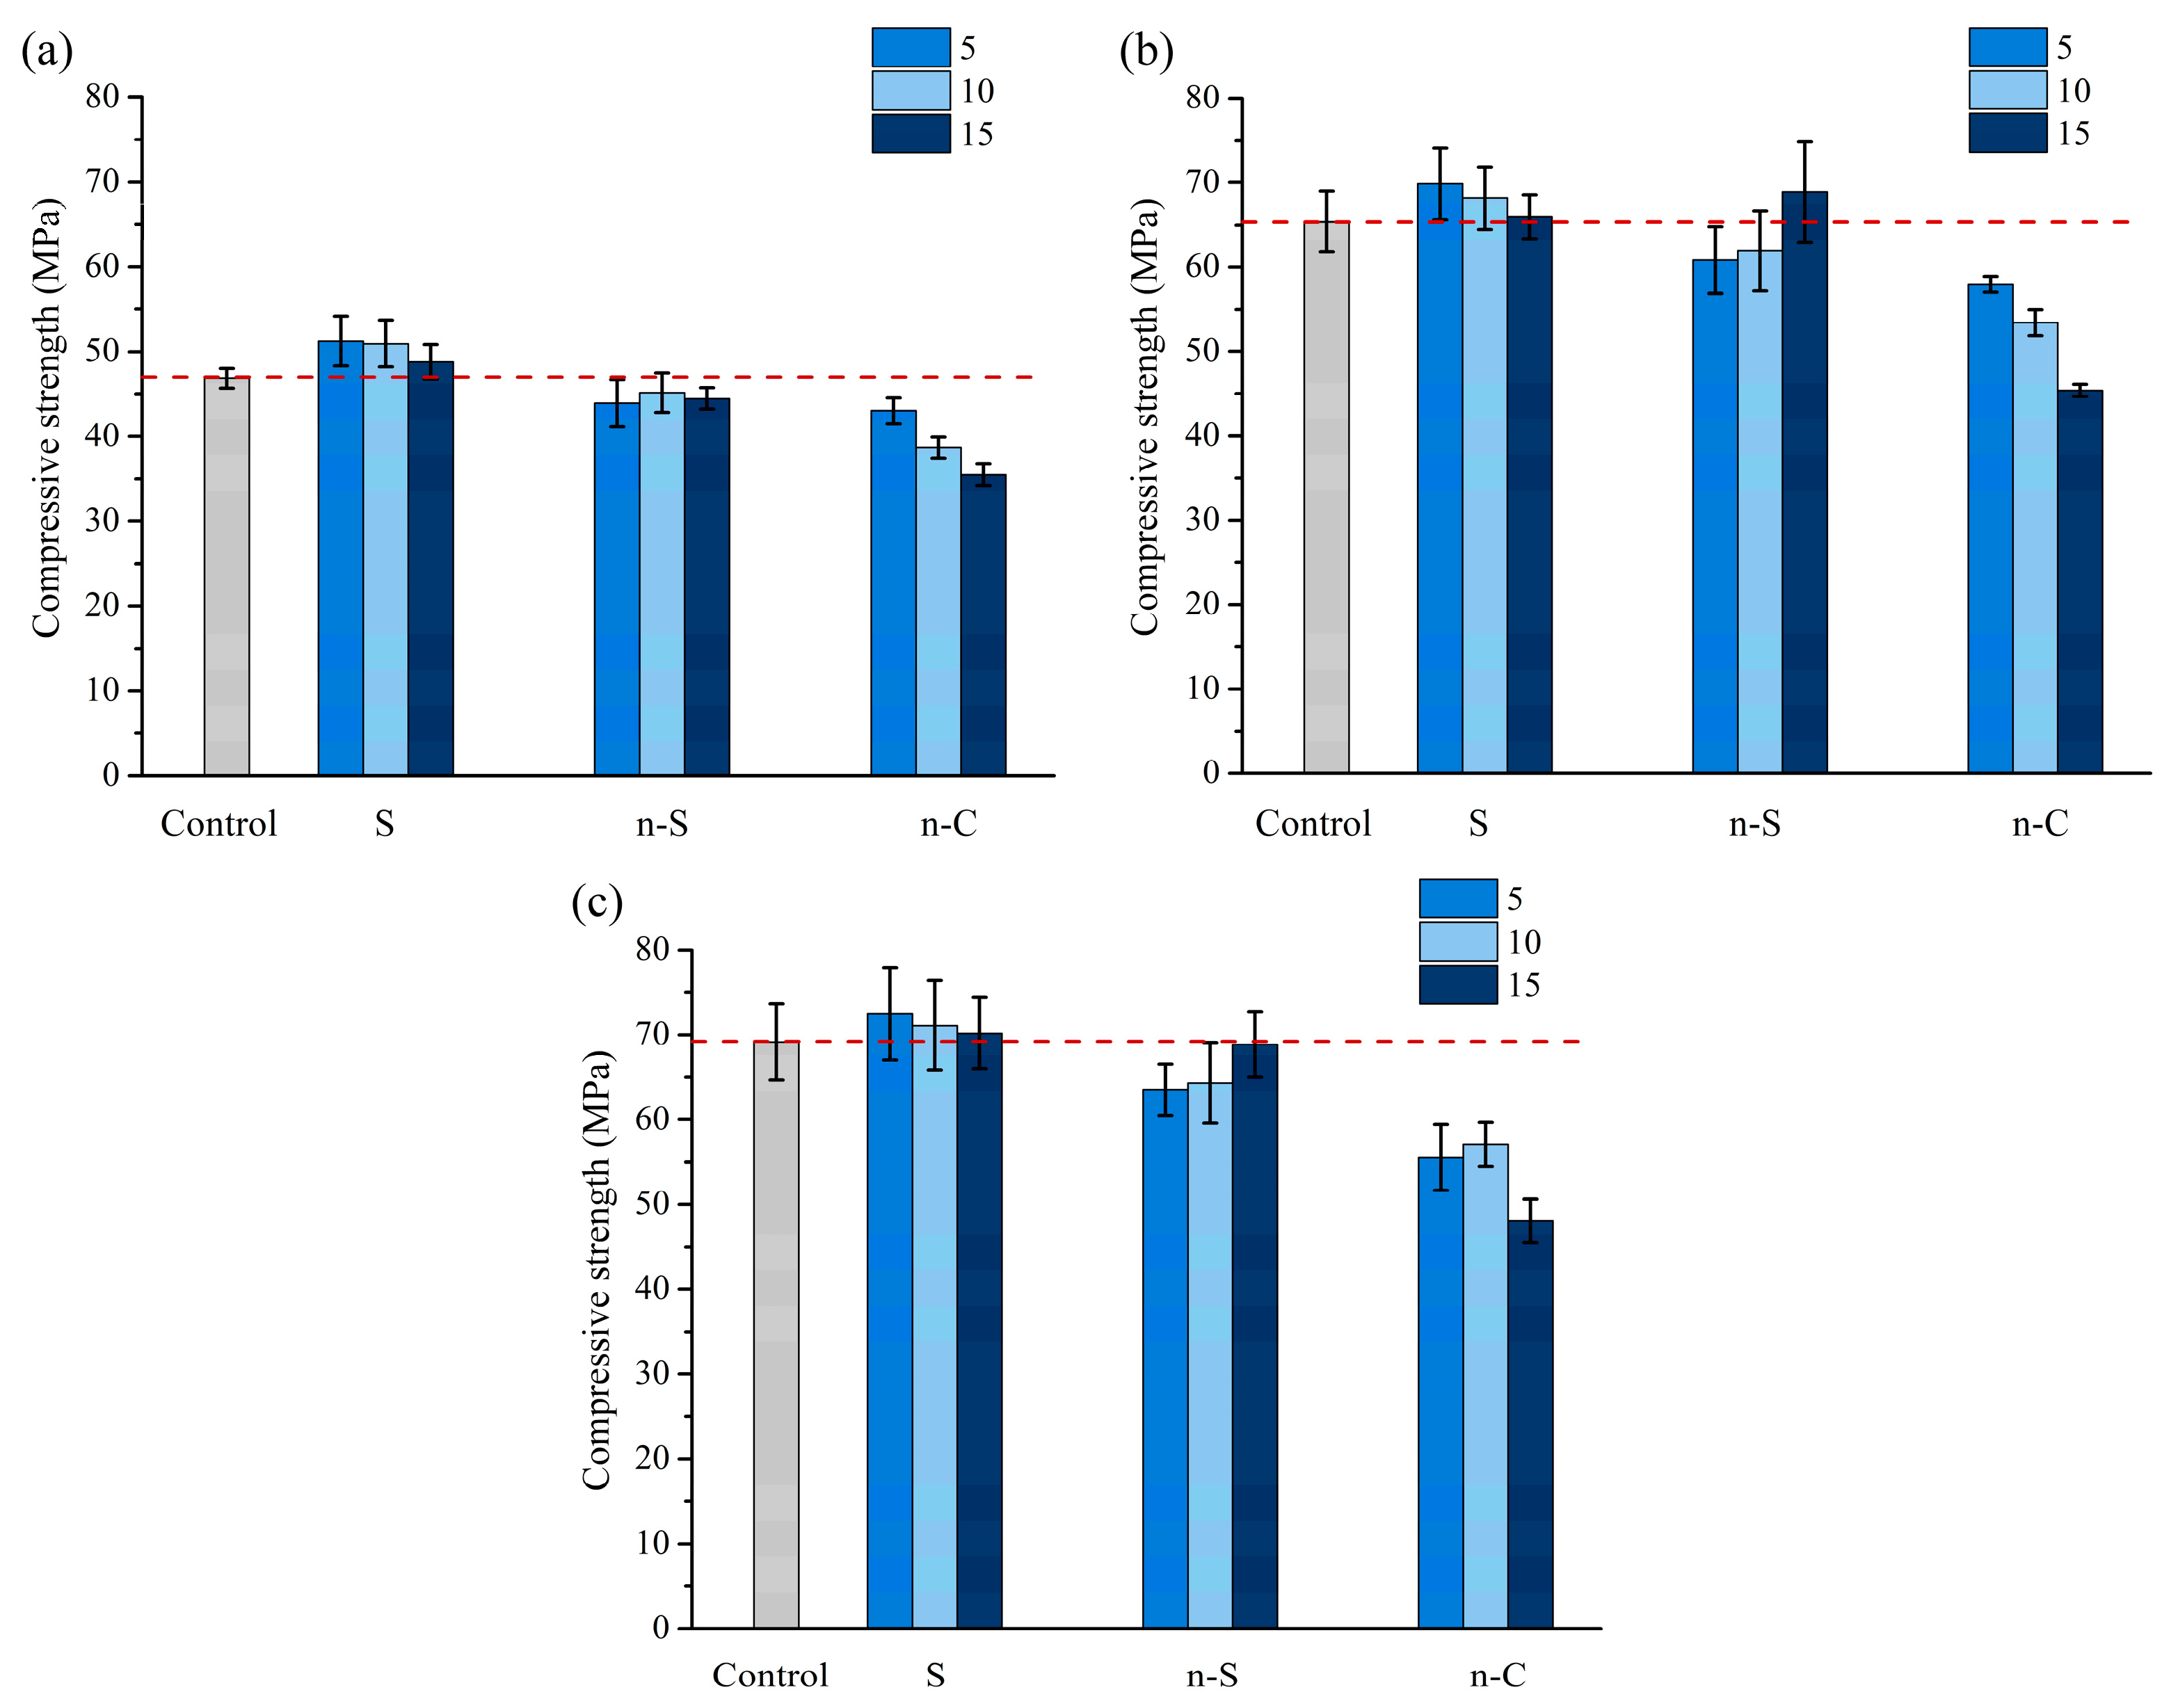
3.1. Compressive Strength
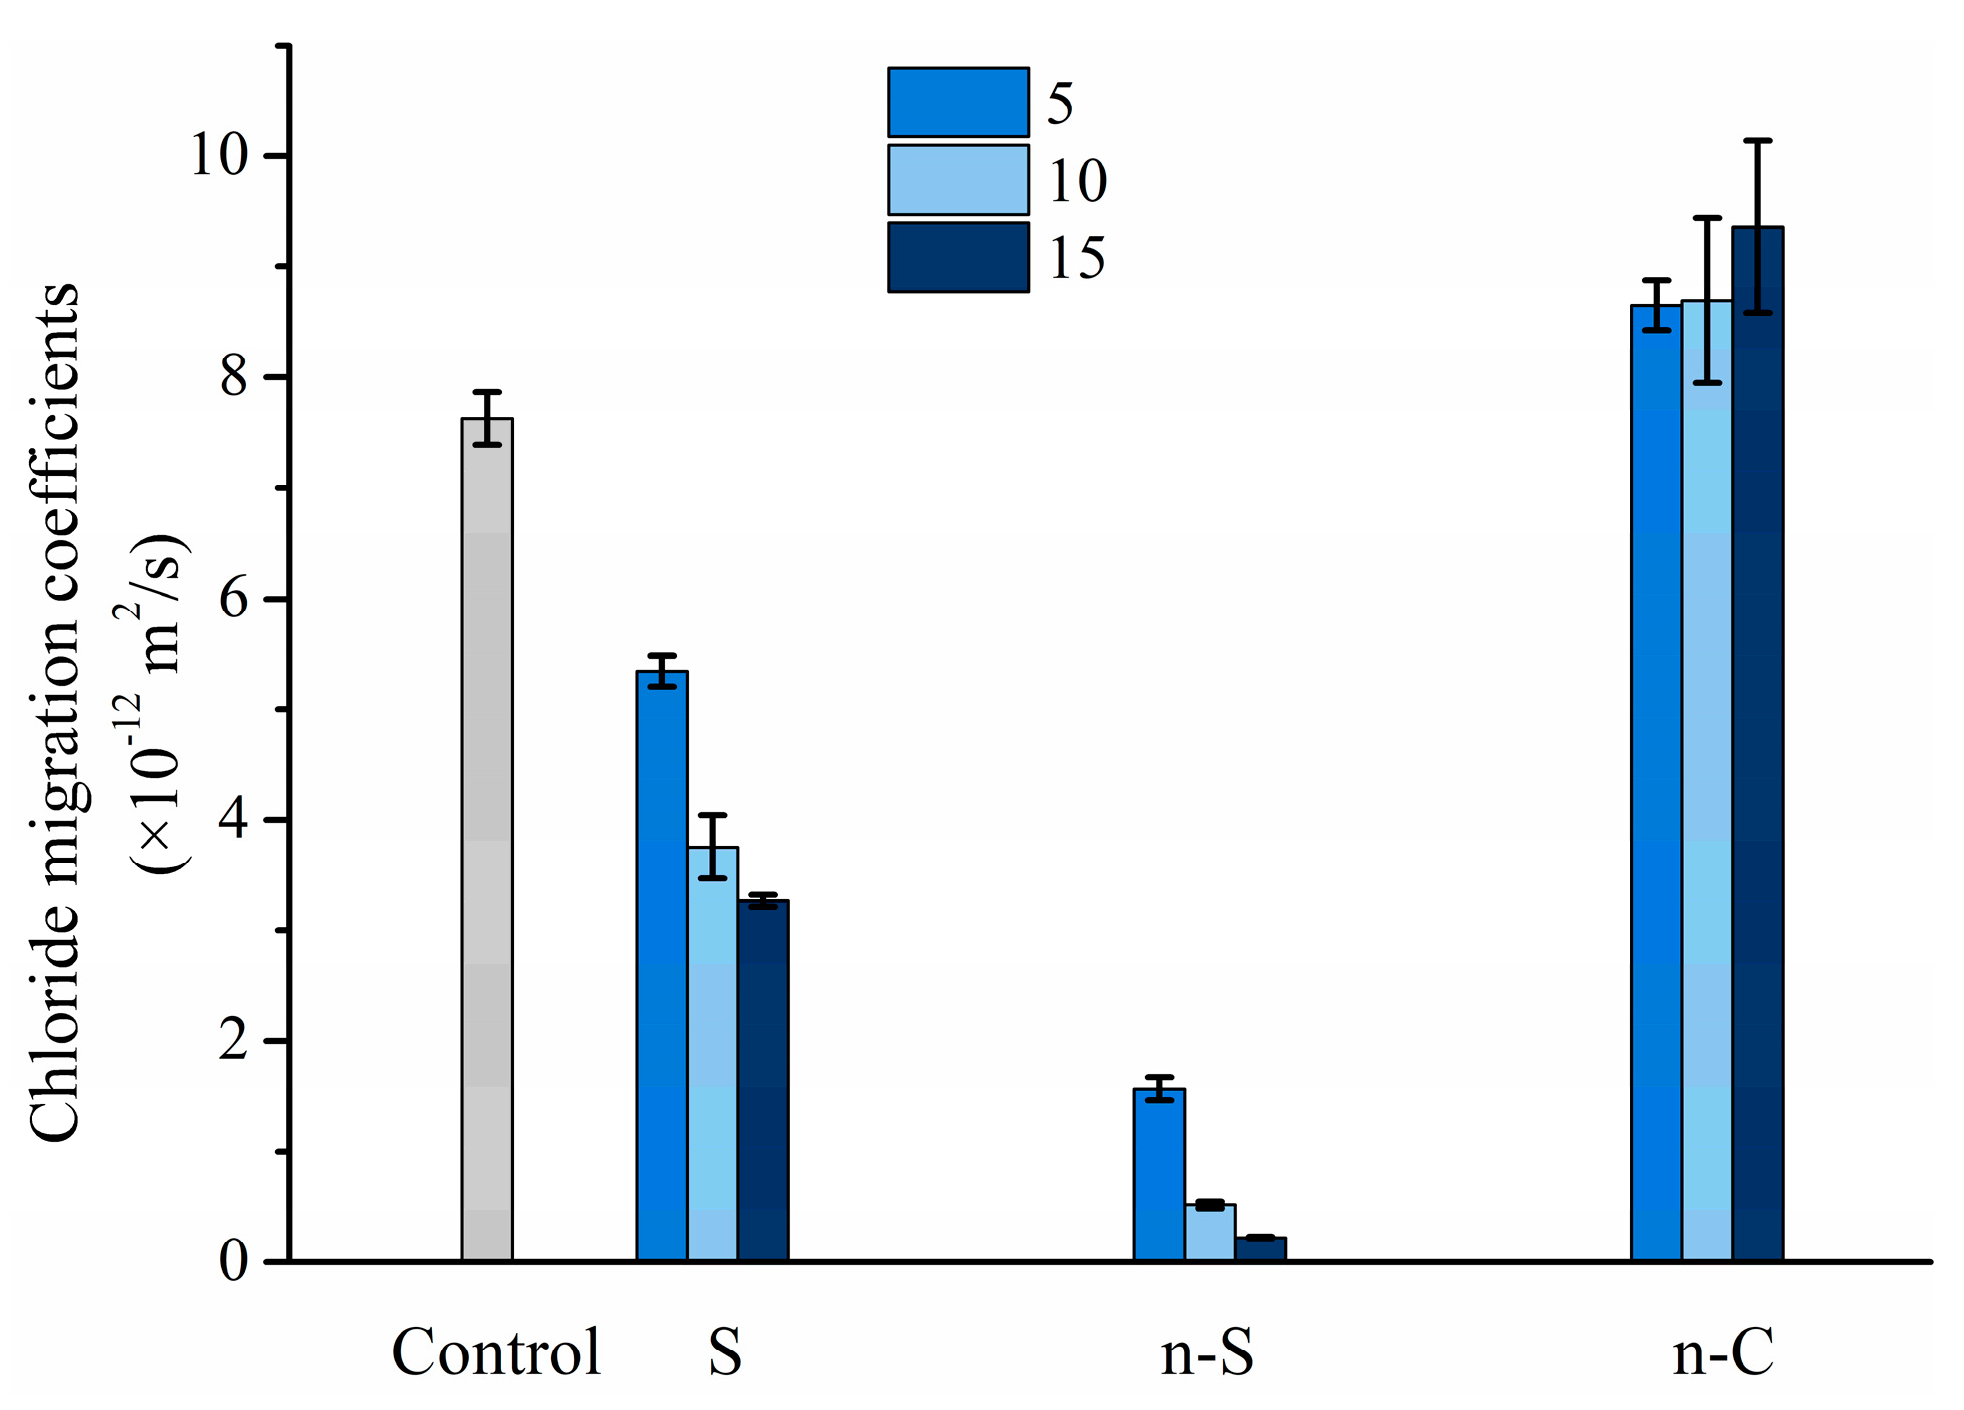
3.2. Chloride Migration
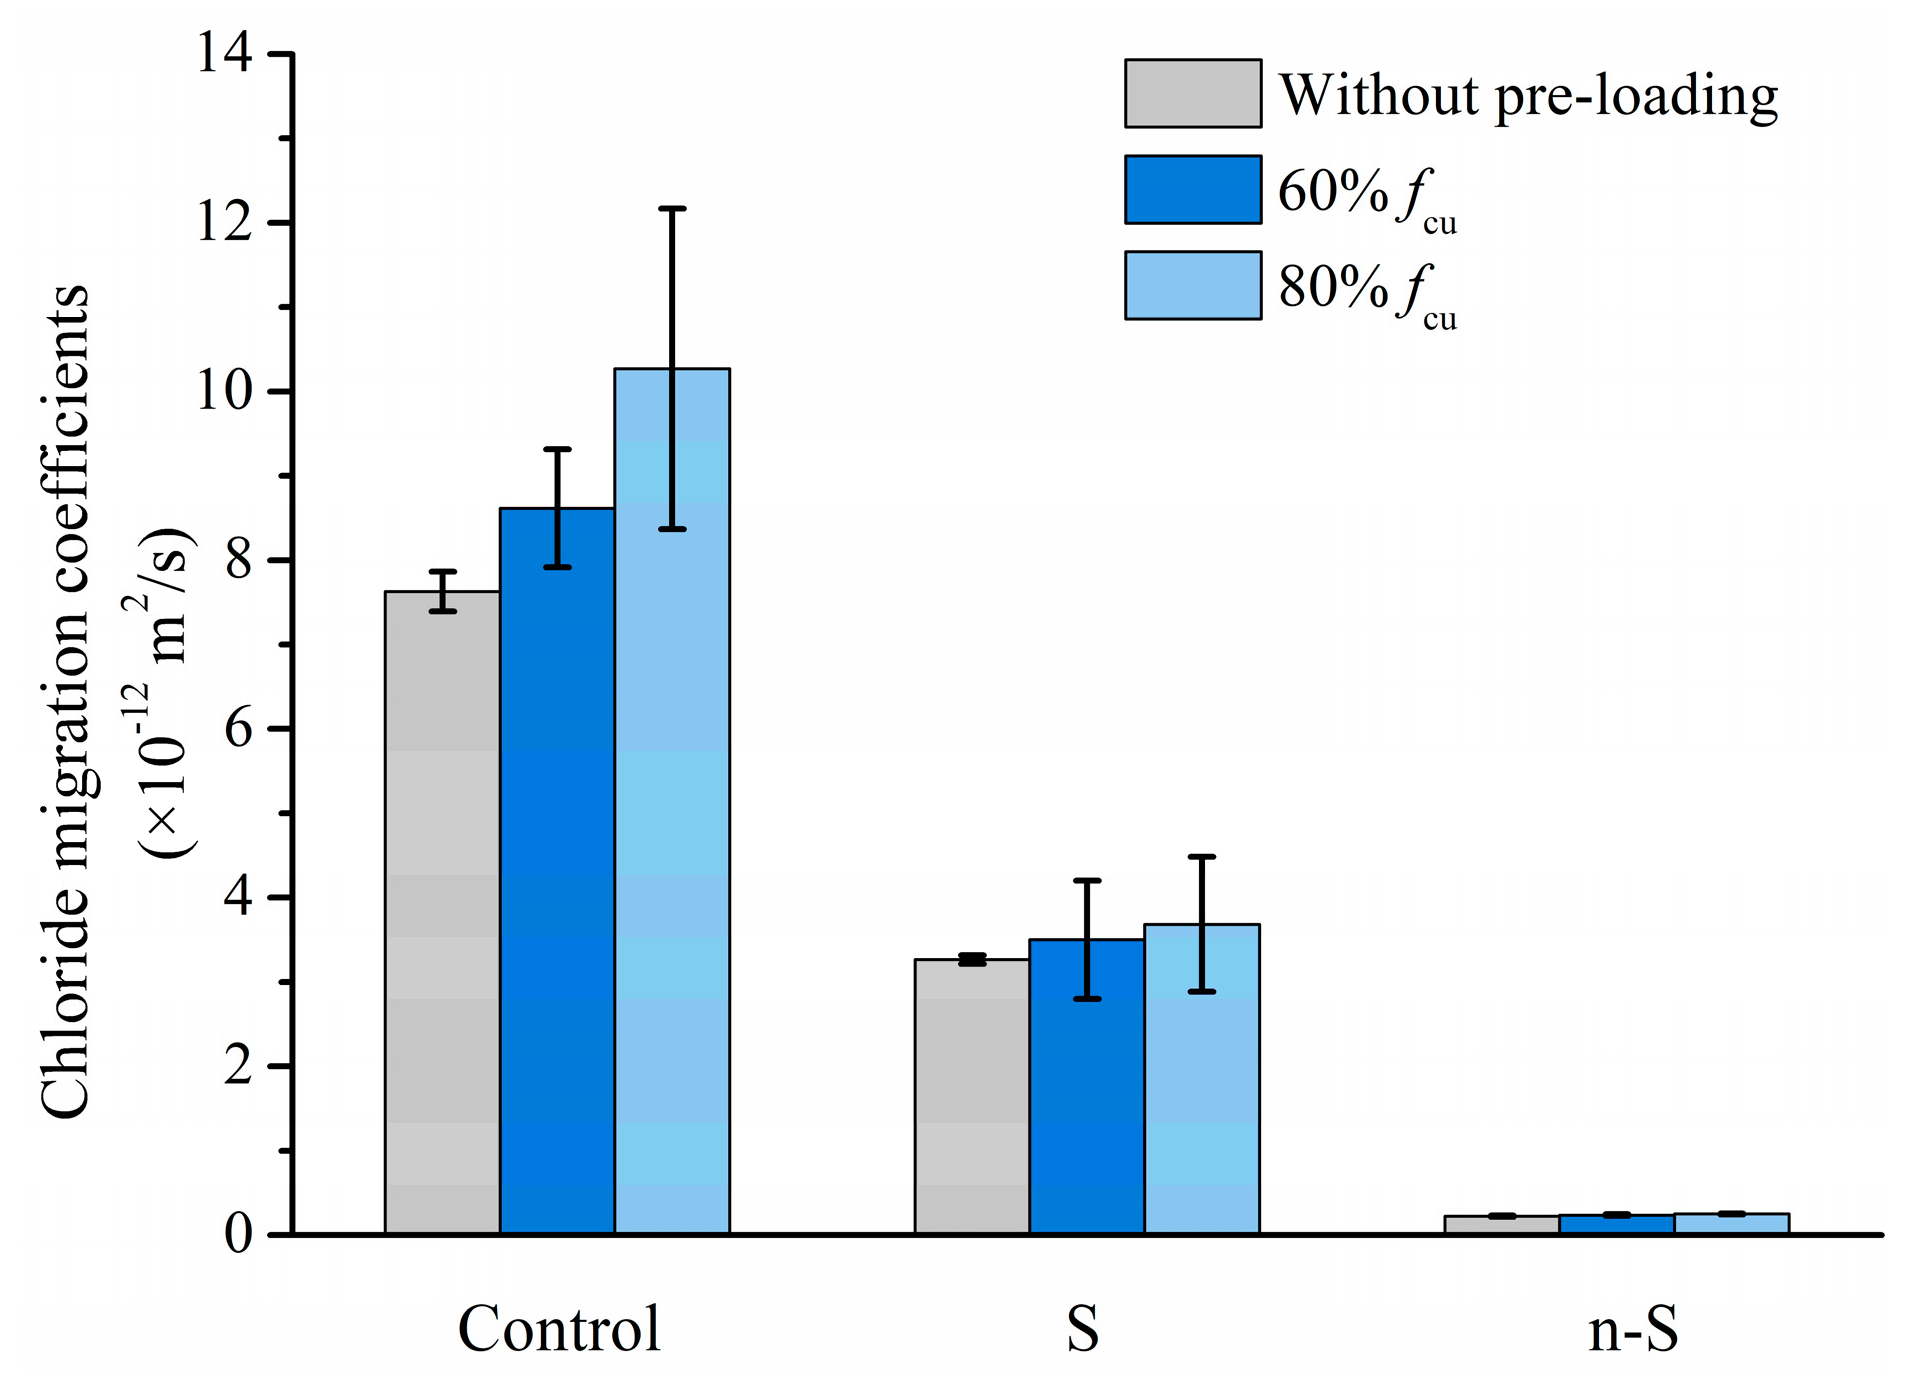
3.3. Chloride Migration after Pre-Loading
3.4. The ITZ Microstructure
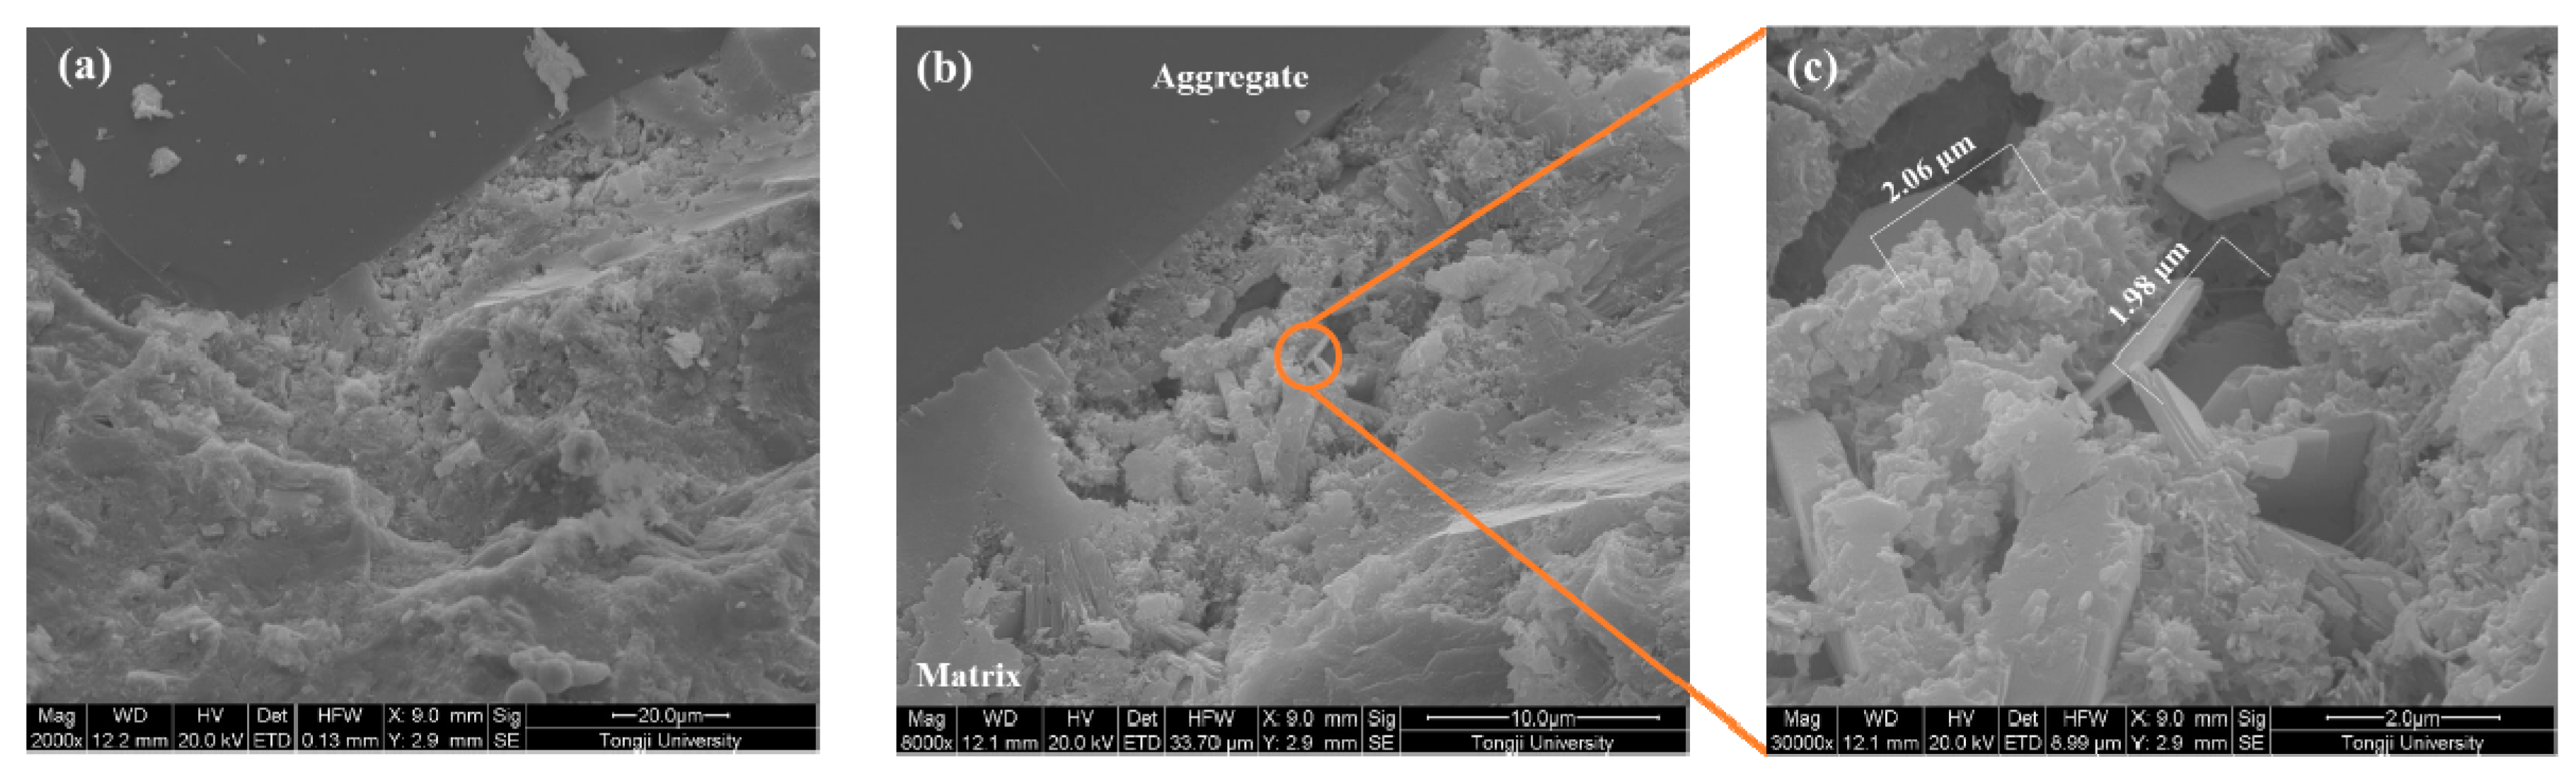
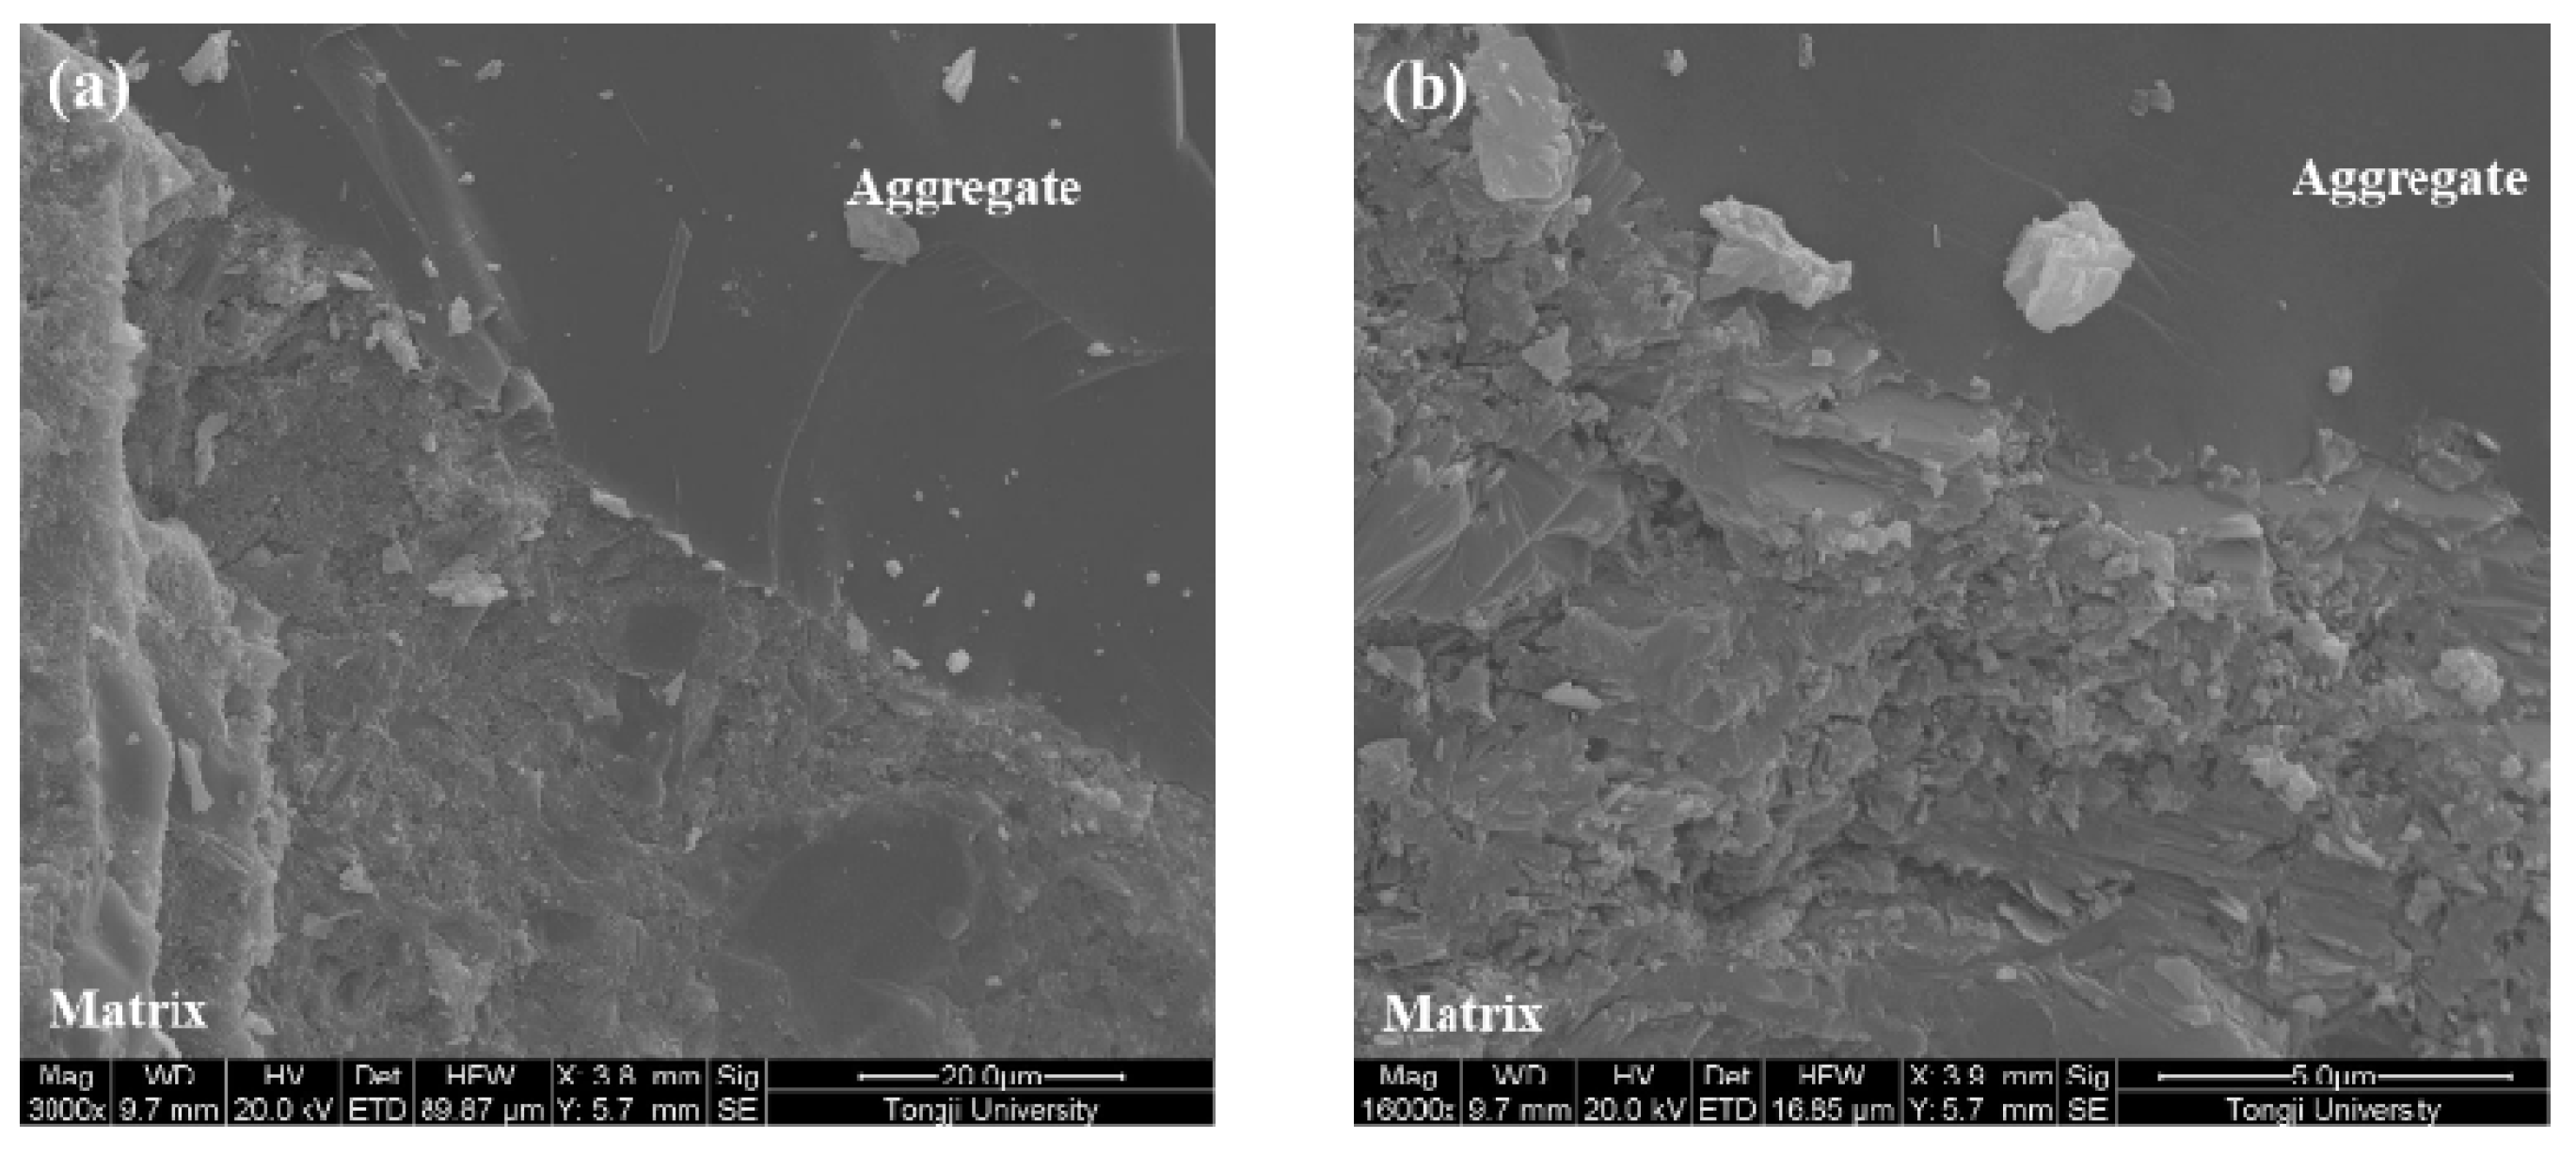
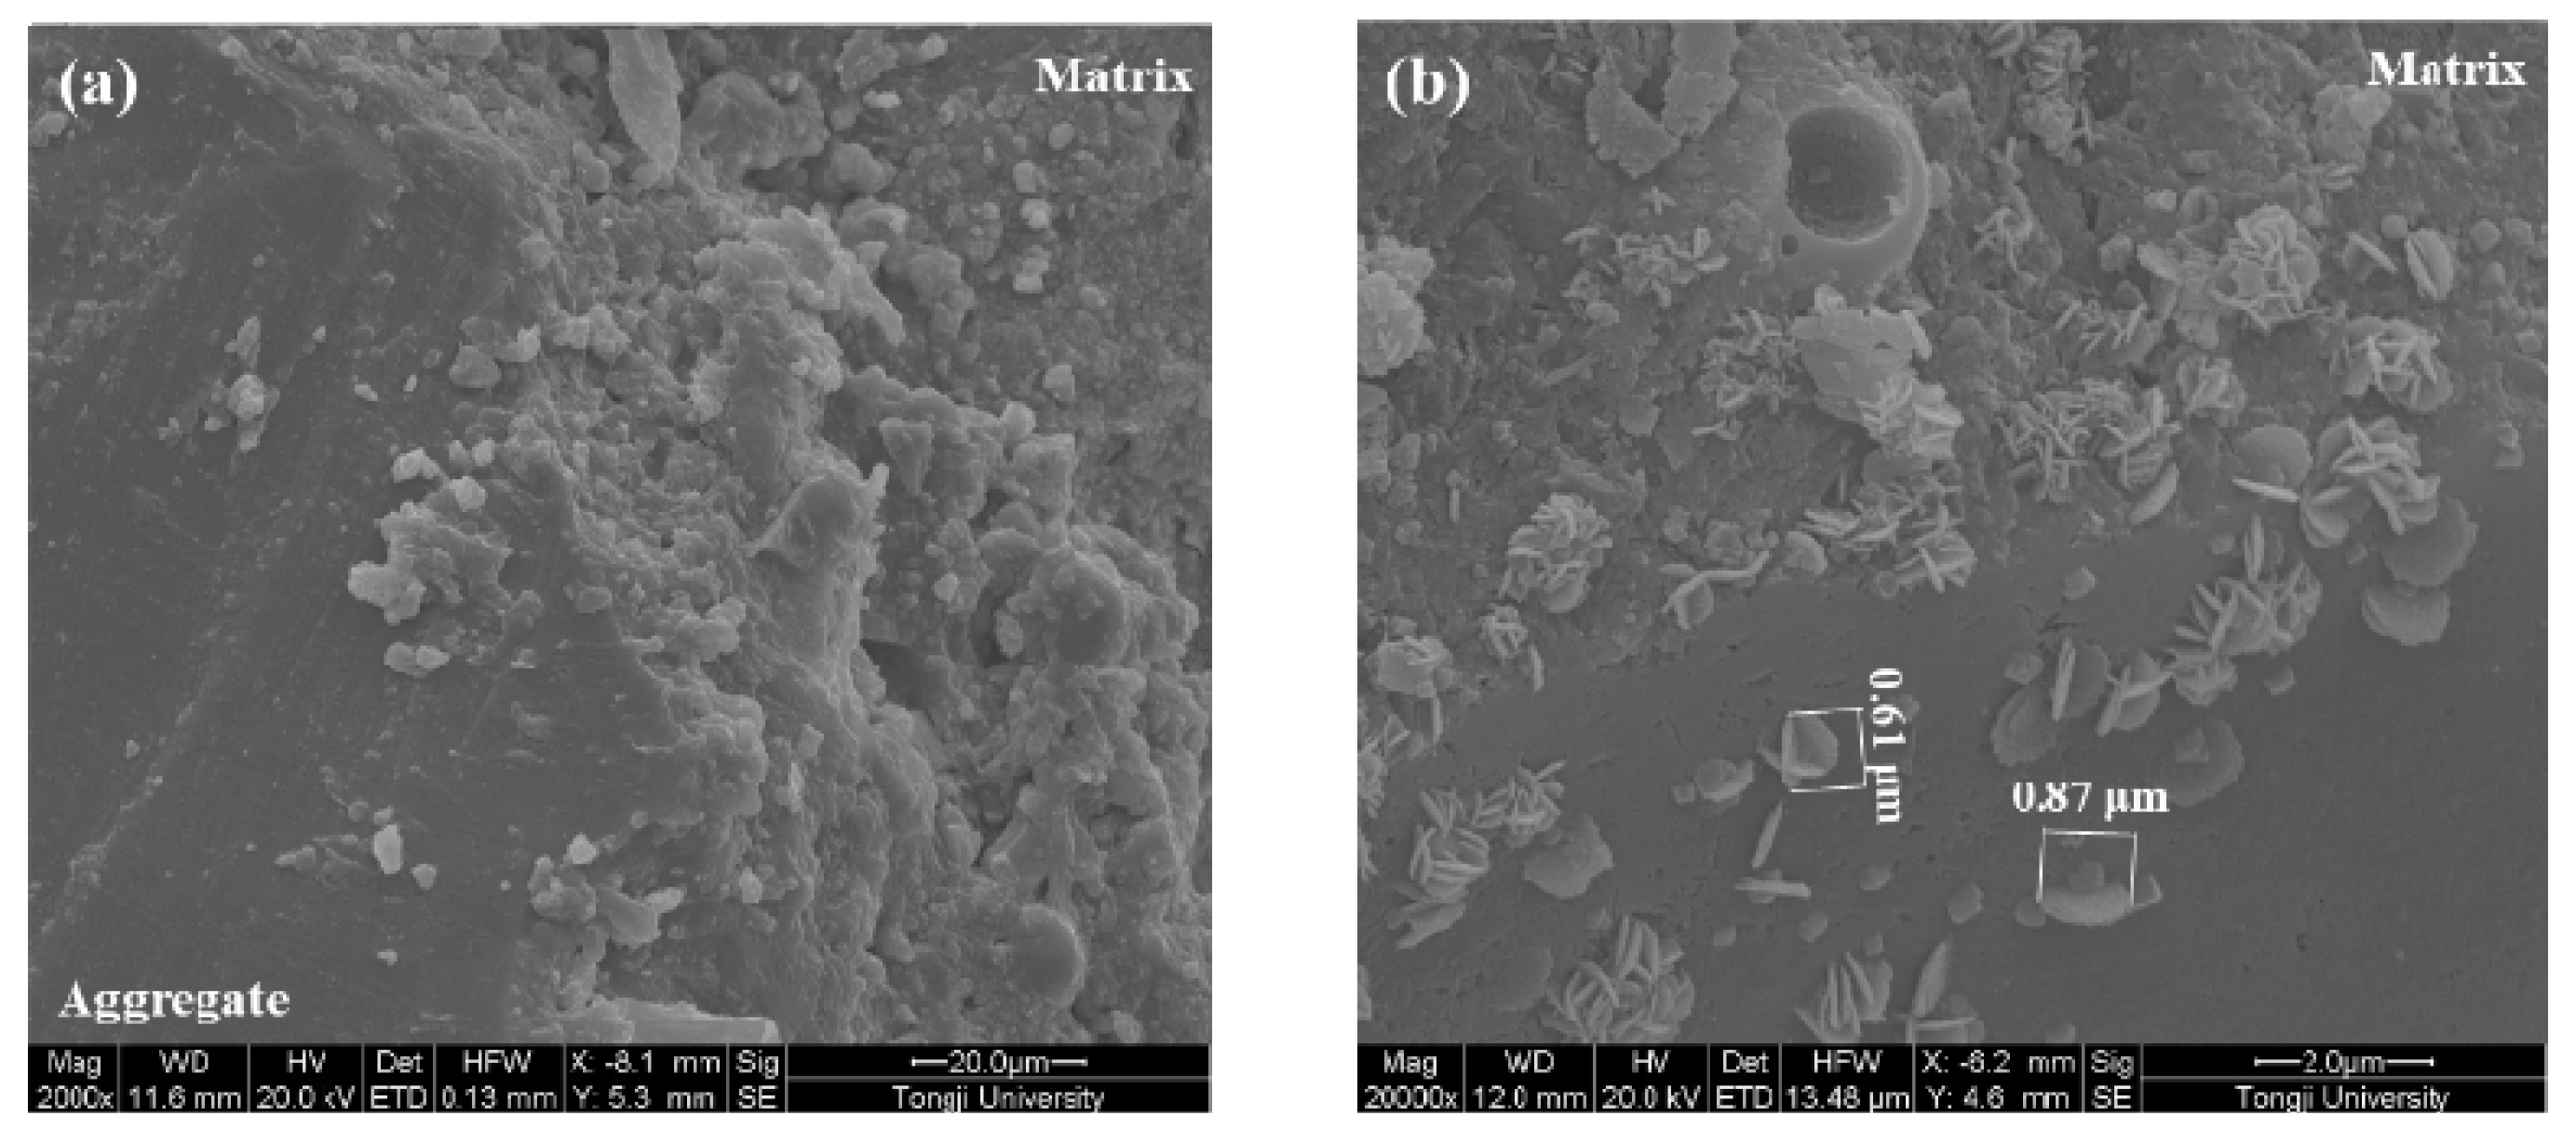
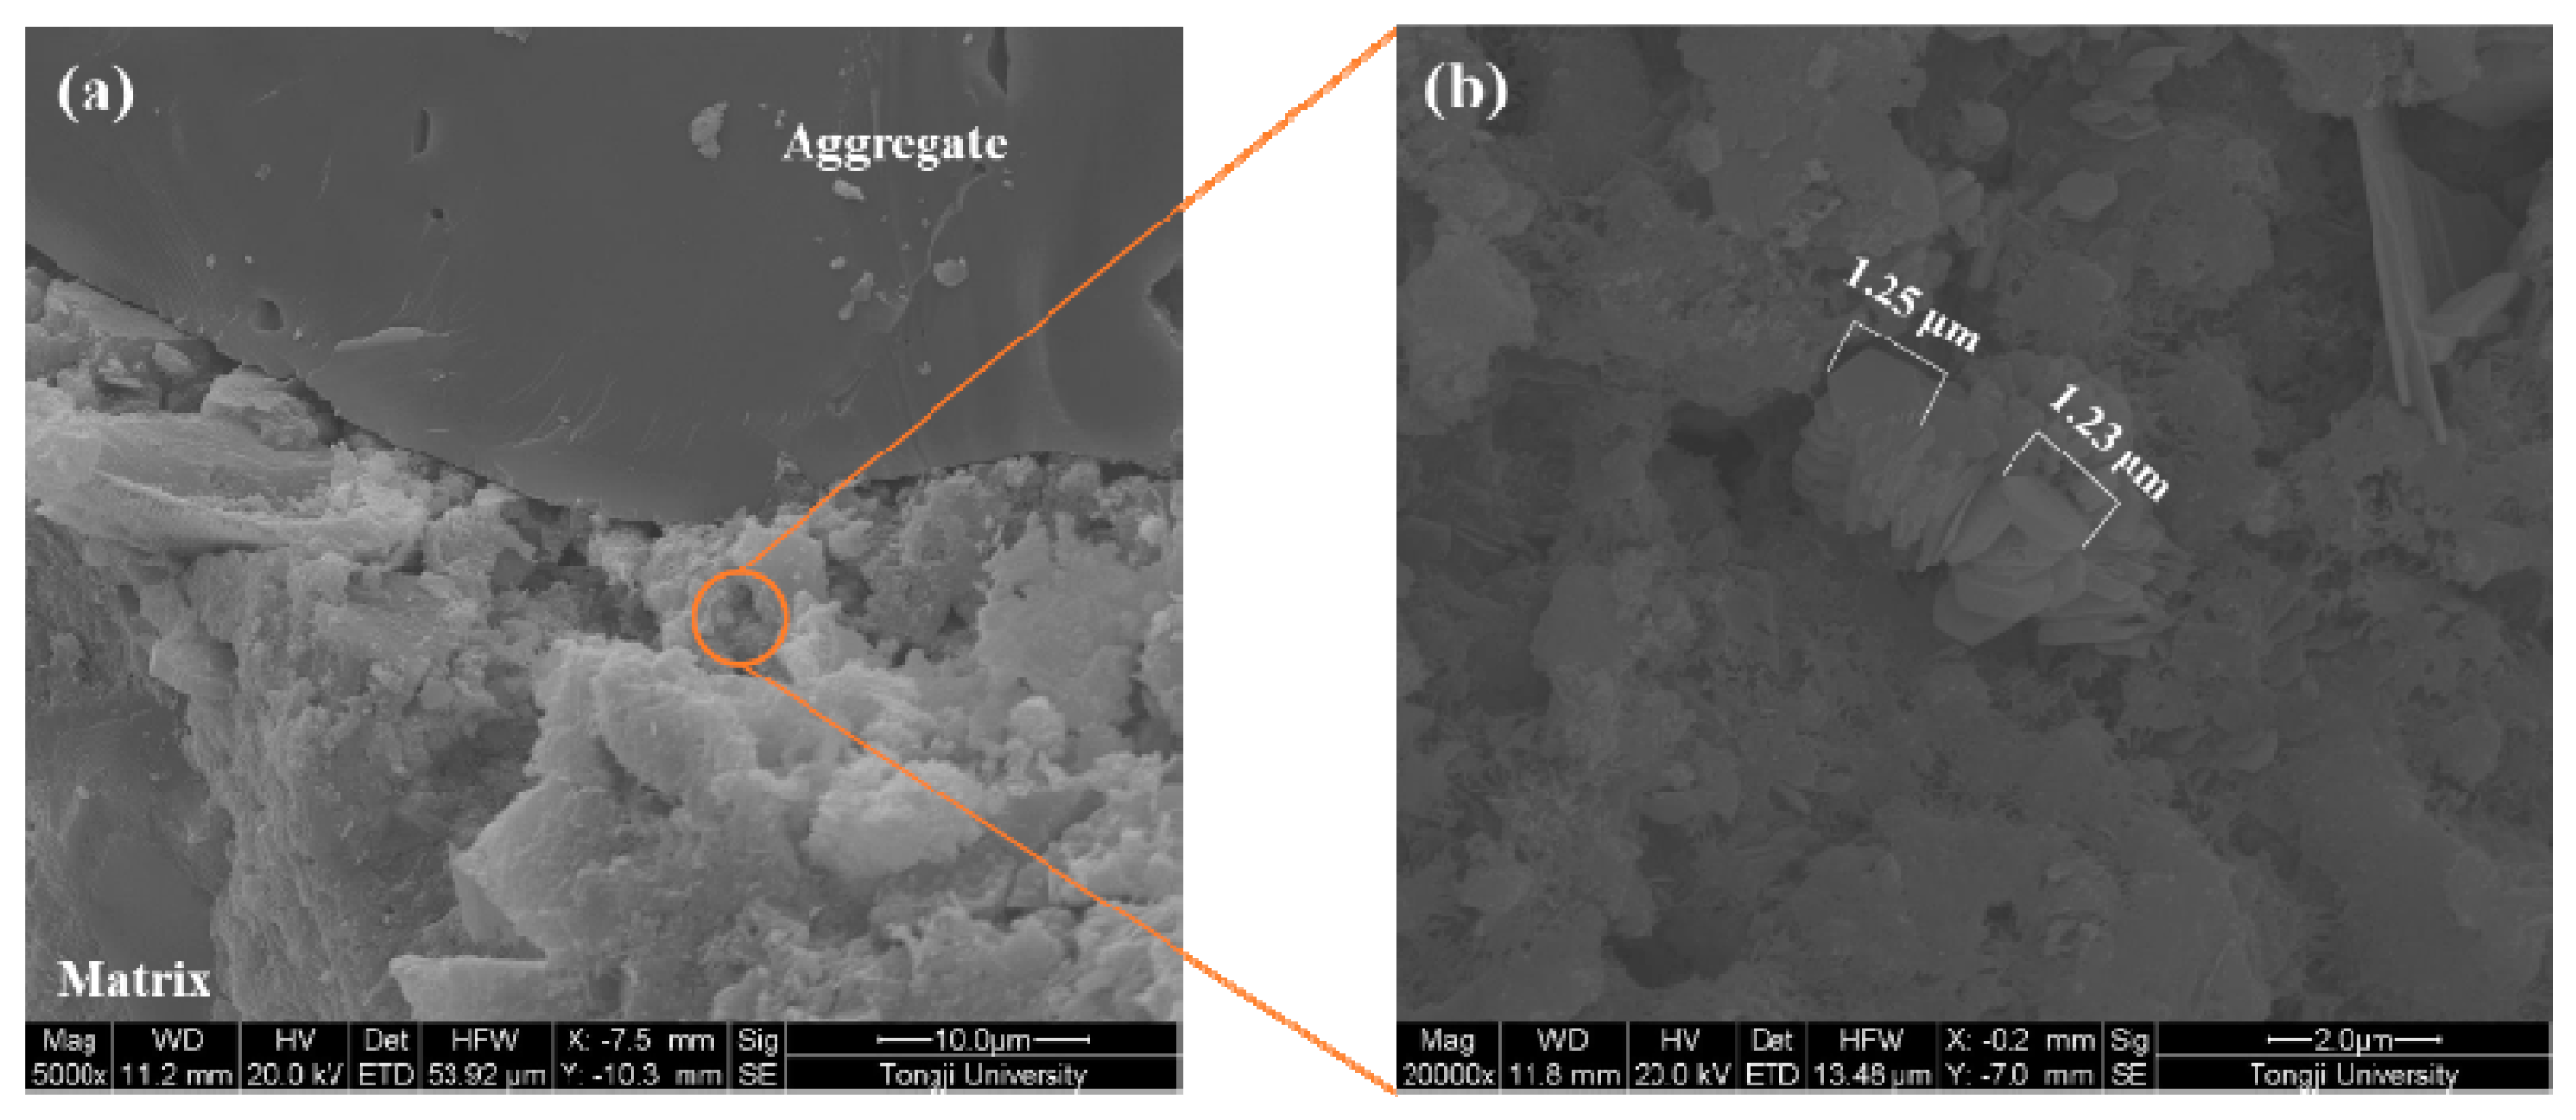
3.4.1. Morphology
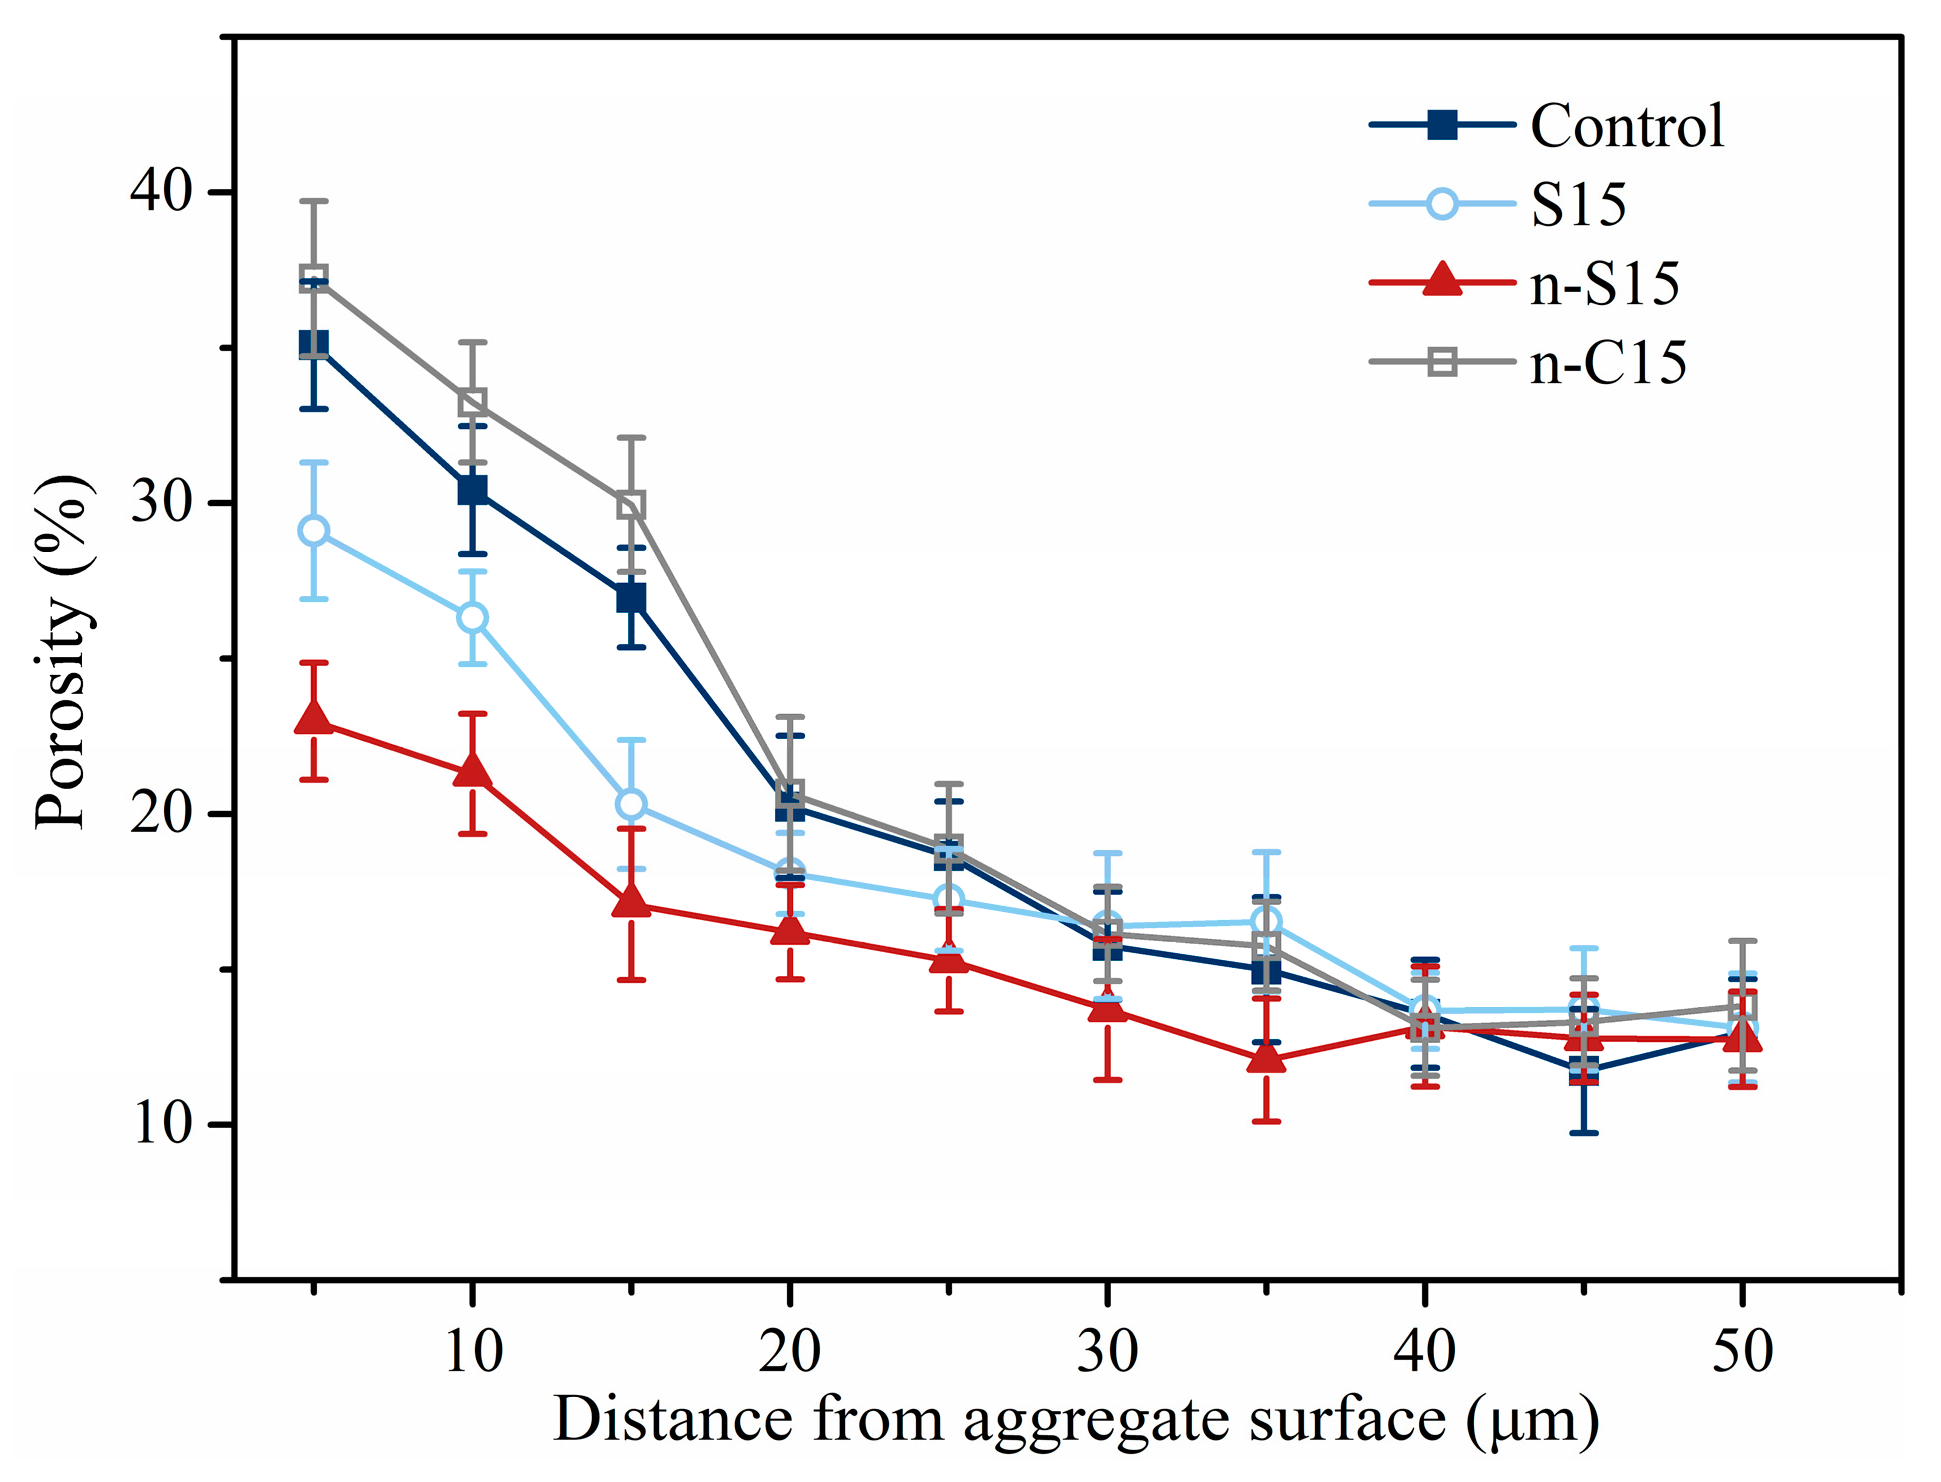
3.4.2. Porosity Distribution
4. Conclusions
Author Contributions
Funding
Conflicts of Interest
References
- Mehta, P.K.; Monteiro, P.J.M. Concrete: Microstructure, Properties, and Materials; McGraw-Hill: New York, NY, USA, 2006. [Google Scholar]
- Rossignolo, J.A. Interfacial interactions in concretes with silica fume and SBR latex. Constr. Build. Mater. 2009, 23, 817–821. [Google Scholar] [CrossRef]
- Xuan, D.X.; Shui, Z.H.; Wu, S.P. Influence of silica fume on the interfacial bond between aggregate and matrix in near-surface layer of concrete. Constr. Build. Mater. 2009, 23, 2631–2635. [Google Scholar] [CrossRef]
- Asbridge, A.H.; Chadbourn, G.A.; Page, C.L. Effects of metakaolin and the interfacial transition zone on the diffusion of chloride ions through cement mortars. Cem. Concr. Res. 2001, 31, 1567–1572. [Google Scholar] [CrossRef]
- Scrivener, K.L.; Crumbie, A.K.; Laugesen, P. The interfacial transition zone (ITZ) between cement paste and aggregate in concrete. Interface Sci. 2004, 12, 411–421. [Google Scholar] [CrossRef]
- Scrivener, K.L. Backscattered electron imaging of cementitious microstructures: Understanding and quantification. Cem. Concr. Compos. 2004, 26, 935–945. [Google Scholar] [CrossRef]
- Ollivier, J.P.; Maso, J.C.; Bourdette, B. Interfacial Transition Zone in Concrete. Adv. Cem. Based Mater. 1995, 2, 30–38. [Google Scholar] [CrossRef]
- Barnes, B.; Diamond, S.; Dolch, W. The contact zone between Portland cement paste and glass “aggregate” surfaces. Cem. Concr. Res. 1978, 8, 233–243. [Google Scholar] [CrossRef]
- Barnes, B.; Diamond, S.; Dolch, W. Micromorphology of the interfacial zone around aggregates in Portland cement mortar. J. Am. Ceram Soc. 1979, 62, 21–24. [Google Scholar] [CrossRef]
- Diamond, S. Cement Paste Microstructure in Concrete; Microstructural development during hydration of cement. Cambridge University Press: Cambridge, UK, 1987; pp. 21–23. [Google Scholar]
- Delagrave, A.; Bigas, J.P.; Ollivier, J.P.; Marchand, J.; Pigeon, M. Influence of the interfacial zone on the chloride diffusivity of mortars. Adv. Cem. Based Mater. 1997, 5, 86–92. [Google Scholar] [CrossRef]
- Scrivener, K.L.; Bentur, A.; Pratt, P.L. Quantitative characterisation of the transition zone in high strength concretes. Adv. Cem. Res. 1988, 1, 230–238. [Google Scholar] [CrossRef]
- Leemann, A.; Munch, B.; Gasser, P.; Holzer, L. Influence of compaction on the interfacial transition zone and the permeability of concrete. Cem. Concr. Res. 2006, 36, 1425–1433. [Google Scholar] [CrossRef]
- Zhang, M.H.; Lastra, R.; Malhotra, V.M. Rice-husk ash paste and concrete: Some aspects of hydration and the microstructure of the interfacial zone between the aggregate and paste. Cem. Concr. Res. 1996, 26, 963–977. [Google Scholar] [CrossRef]
- Vivekanandam, K.; Patnaikuni, I. Transition zone in high performance concrete during hydration. Cem. Concr. Res. 1997, 27, 817–823. [Google Scholar] [CrossRef]
- Kong, D.Y.; Lei, T.; Zheng, J.J.; Ma, C.C.; Jiang, J.; Jiang, J. Effect and mechanism of surface-coating pozzalanics materials around aggregate on properties and ITZ microstructure of recycled aggregate concrete. Constr. Build Mater. 2010, 24, 701–708. [Google Scholar] [CrossRef]
- Tuan, N.V.; Ye, G.; van Breugel, K.; Copuroglu, O. Hydration and microstructure of ultra high performance concrete incorporating rice husk ash. Cem. Concr. Res. 2011, 41, 1104–1111. [Google Scholar] [CrossRef]
- Chan, Y.W.; Chu, S.H. Effect of silica fume on steel fiber bond characteristics in reactive powder concrete. Cem. Concr. Res. 2004, 34, 1167–1172. [Google Scholar] [CrossRef]
- Bui, D.D.; Hu, J.; Stroeven, P. Particle size effect on the strength of rice husk ash blended gap-graded Portland cement concrete. Cem. Concr. Compos. 2005, 27, 357–366. [Google Scholar] [CrossRef]
- Shah, S.P.; Hou, P.; Konsta-Gdoutos, M.S. Nano-modification of cementitious material: Toward a stronger and durable concrete. J. Sustain. Cem.-Based Mater. 2016, 5, 1–22. [Google Scholar] [CrossRef]
- Hou, P.; Qian, J.; Cheng, X.; Shah, S.P. Effects of the pozzolanic reactivity of nanoSiO 2 on cement-based materials. Cem. Concr. Compos. 2015, 55, 250–258. [Google Scholar] [CrossRef]
- Huang, Y.; Xu, C.; Li, H.; Jiang, Z.; Yang, X. Utilization of the black tea powder as multifunctional admixture for the hemihydrate gypsum. J. Clean. Prod. 2019, 201, 231–237. [Google Scholar] [CrossRef]
- Nazari, A.; Riahi, S. The effects of SiO2 nanoparticles on physical and mechanical properties of high strength compacting concrete. Compos. Part B Eng. 2011, 42, 570–578. [Google Scholar] [CrossRef]
- Nazari, A.; Riahi, S. Improvement compressive strength of concrete in different curing media by Al2O3 nanoparticles. Mater. Sci. Eng. A 2011, 528, 1183–1191. [Google Scholar] [CrossRef]
- Fan, Y.; Zhang, S.; Kawashima, S.; Shah, S.P. Influence of kaolinite clay on the chloride diffusion property of cement-based materials. Cem. Concr. Compos. 2014, 45, 117–124. [Google Scholar] [CrossRef]
- Fan, Y.; Zhang, S.; Wang, Q.; Shah, S.P. Effects of nano-kaolinite clay on the freeze–thaw resistance of concrete. Cem. Concr. Compos. 2015, 62, 1–12. [Google Scholar] [CrossRef]
- Yang, X.; Liu, J.; Li, H.; Xu, L.; Ren, Q.; Li, L. Effect of triethanolamine hydrochloride on the performance of cement paste. Constr. Build. Mater. 2019, 200, 218–225. [Google Scholar] [CrossRef]
- Duan, P.; Shui, Z.; Chen, W.; Shen, C. Effects of metakaolin, silica fume and slag on pore structure, interfacial transition zone and compressive strength of concrete. Constr. Build. Mater. 2013, 44, 1–6. [Google Scholar] [CrossRef]
- Wu, K.; Shi, H.; Xu, L.; Ye, G.; De Schutter, G. Microstructural characterization of ITZ in blended cement concretes and its relation to transport properties. Cem. Concr. Res. 2016, 79, 243–256. [Google Scholar] [CrossRef]
- Lu, B.L.; Torquato, S. Nearest-Surface Distribution-Functions for Polydispersed Particle-Systems. Phys. Rev. A 1992, 45, 5530–5544. [Google Scholar] [CrossRef]
- Garboczi, E.J.; Bentz, D.P. Multiscale analytical/numerical theory of the diffusivity of concrete. Adv. Cem Based Mater. 1998, 8, 77–88. [Google Scholar] [CrossRef]
- GB/T 2419-2005. Test Method for Fluidity of Cement Mortar; Standards Press of China: Beijing, China, 2005. [Google Scholar]
- NordTest. Concrete, mortar and cement-based repair materials: Chloride migration coefficient from non-steady-state migration experiments. In Nordtest Method; NORDTEST: Espoo, Finland, 1999; Volume 492, p. 10. [Google Scholar]
- Tasong, W.A.; Lynsdale, C.J.; Cripps, J.C. Aggregate-cement paste interface Part I. Influence of aggregate geochemistry. Cem. Concr. Res. 1999, 29, 1019–1025. [Google Scholar] [CrossRef]
- Ozturan, T.; Cecen, C. Effect of coarse aggregate type on mechanical properties of concretes with different strengths. Cem. Concr. Res. 1997, 27, 165–170. [Google Scholar] [CrossRef]
- Akcaoglu, R.; Tokyay, M.; Celik, T. Assessing the ITZ microcracking via scanning electron microscope and its effect on the failure behavior of concrete. Cem. Concr. Res. 2005, 35, 358–363. [Google Scholar] [CrossRef]
- Lee, T.-F.F.; Cohen, M.D.; Chen, W.; Zhang, Y. Strength and Durability of Concrete: Effects of Cement Paste-Aggregate Interfaces, Part II: Significance of Transition Zones on Physical and Mechanical Properties of Portland Cement Mortar; Purdue University: West Lafayette, IN, USA, 1998. [Google Scholar]
- Gao, Y.; De Schutter, G.; Ye, G.; Huang, H.; Tan, Z.; Wu, K. Characterization of ITZ in ternary blended cementitious composites: Experiment and simulation. Constr. Build. Mater. 2013, 41, 742–750. [Google Scholar] [CrossRef]
- Kuroda, M.; Watanabe, T.; Terashi, N. Increase of bond strength at interfacial transition zone by the use of fly ash. Cem. Concr. Res. 2000, 30, 253–258. [Google Scholar] [CrossRef]
- Ke, Y.; Ortola, S.; Beaucour, A.L.; Dumontet, H. Identification of microstructural characteristics in lightweight aggregate concretes by micromechanical modelling including the interfacial transition zone (ITZ). Cem. Concr. Res. 2010, 40, 1590–1600. [Google Scholar] [CrossRef]
- Herve, E.; Care, S.; Seguin, J.P. Influence of the porosity gradient in cement paste matrix on the mechanical behavior of mortar. Cem. Concr. Res. 2010, 40, 1060–1071. [Google Scholar] [CrossRef]
- Zampini, D.; Shah, S.P.; Jennings, H.M. Early age microstructure of the paste-aggregate interface and its evolution. J. Mater. Res. 1998, 13, 1888–1898. [Google Scholar] [CrossRef]
- Prokopski, G.; Langier, B. Effect of water/cement ratio and silica fume addition on the fracture toughness and morphology of fractured surfaces of gravel concretes. Cem. Concr. Res. 2000, 30, 1427–1433. [Google Scholar] [CrossRef]
- Zimbelmann, R. A contribution to the problem of cement-aggregate bond. Cem. Concr. Res. 1985, 15, 801–808. [Google Scholar] [CrossRef]


| Materials | Compositions (wt.%) | Specific Surface Area (m2/g) | Density (kg/m3) | ||||||
|---|---|---|---|---|---|---|---|---|---|
| CaO | Al2O3 | SiO2 | MgO | Fe2O3 | SO3 | K2O | |||
| OPC | 63.12 | 4.94 | 18.73 | 1.02 | 3.99 | 3.07 | - | 397 | 3163 |
| Slag | 39.50 | 14.91 | 34.40 | 5.84 | 0.39 | - | 0.33 | 450 | 2652 |
| n-C | 55.6 | - | - | - | - | - | - | 26000 | 2557 |
| n-C | - | - | 99.1 | - | - | - | - | 23000 | 2253 |
| No. | Nanoparticles Volume (%) | Nanoparticles (kg/m3) | Aggregate Volume (%) | Cement (kg/m3) | Aggregate (kg/m3) | Water (kg/m3) | SP (wt.%) |
|---|---|---|---|---|---|---|---|
| Control | 0 | 0.0 | 45 | 825.6 | 1184.9 | 289.0 | 0.037 |
| S05 | 1.47 | 39.0 | 783.1 | 1184.9 | 287.7 | 0.035 | |
| S10 | 2.97 | 78.8 | 739.7 | 1184.9 | 286.4 | 0.032 | |
| S15 | 4.52 | 119.9 | 694.8 | 1184.9 | 285.1 | 0.032 | |
| n-S05 | 1.47 | 33.1 | 786.2 | 1184.9 | 286.7 | 0.040 | |
| n-S10 | 2.97 | 66.9 | 745.9 | 1184.9 | 284.5 | 0.044 | |
| n-S15 | 4.52 | 101.8 | 704.3 | 1184.9 | 282.1 | 0.046 | |
| n-C05 | 1.47 | 37.6 | 783.8 | 1184.9 | 287.5 | 0.054 | |
| n-C10 | 2.97 | 75.9 | 741.1 | 1184.9 | 286.0 | 0.055 | |
| n-C15 | 4.52 | 115.6 | 697.1 | 1184.9 | 284.4 | 0.061 |
© 2019 by the authors. Licensee MDPI, Basel, Switzerland. This article is an open access article distributed under the terms and conditions of the Creative Commons Attribution (CC BY) license (http://creativecommons.org/licenses/by/4.0/).
Share and Cite
Wu, K.; Han, H.; Xu, L.; Yang, X.; De Schutter, G. Supported ITZ Modification Efficiencies via Surface Coating Nanoparticles on Aggregate and its Influence on Properties. Materials 2019, 12, 3541. https://doi.org/10.3390/ma12213541
Wu K, Han H, Xu L, Yang X, De Schutter G. Supported ITZ Modification Efficiencies via Surface Coating Nanoparticles on Aggregate and its Influence on Properties. Materials. 2019; 12(21):3541. https://doi.org/10.3390/ma12213541
Chicago/Turabian StyleWu, Kai, Hao Han, Linglin Xu, Xiaojie Yang, and Geert De Schutter. 2019. "Supported ITZ Modification Efficiencies via Surface Coating Nanoparticles on Aggregate and its Influence on Properties" Materials 12, no. 21: 3541. https://doi.org/10.3390/ma12213541
APA StyleWu, K., Han, H., Xu, L., Yang, X., & De Schutter, G. (2019). Supported ITZ Modification Efficiencies via Surface Coating Nanoparticles on Aggregate and its Influence on Properties. Materials, 12(21), 3541. https://doi.org/10.3390/ma12213541