1. Introduction
Since the discovery of the Giant Magneto-Impedance (GMI) effect in 1994 [
1,
2] intensive works are focused on research of this effect in amorphous soft magnetic wires and ribbons, due to their potential applications in magnetic field sensing and measurement of the phenomena associated with it. The GMI effect consists of a significant (gigantic) change in the impedance of the high frequency AC (alternative current) current conductor under the influence of a constant external magnetic field
H. The GMI effect can be understood in the context of classical electrodynamics, connecting the change of penetration depth
δ with a DC (direct current) axial magnetic field [
3]. Novel amorphous soft magnetic materials exhibit large magnetic permeability, which changes significantly under the influence of a relatively small magnetic field. Change in permeability directly influences the penetration depth, which in turn affects the conductor’s impedance.
The change of magnetic permeability can be also influenced by stresses in the material. The effect associated with a significant change in the impedance of the conductor under the stress is called the stress impedance (SI). This effect was first described by Shen [
4] et al. with impedance change of 14% for negative magnetostriction, amorphous wire, with a 20 MHz driving signal and tensile stresses of 14 MPa. Later, the effect was used to develop stress sensors based on amorphous wire [
5,
6,
7]. Since then, SI effect has been studied in thin layers [
8,
9,
10], in sandwiched structures [
11,
12,
13,
14,
15], as well as in amorphous ribbons [
16,
17,
18,
19,
20] and wires [
21,
22,
23].
Studies on the effect of stresses on magnetic permeability are associated with the Villari effect. It relates the deformation of the material structure with a change in the magnetic state of the material. It can, for example, be represented as a change in magnetic induction B for a constant field H under the influence of stress [
24]. Although this effect was observed in the mid-nineteenth century [
25], it is still the object of interest of many scientists with regard to the new class of magnetic materials [
26].
In the presented work, comparative stress-impedance measurements in amorphous ribbons with different values and sign of magnetostriction are described. It was expected that significant SI effect will be observed both for magnetostrictive, as well as near-zero magnetostriction ribbons. Basing on obtained experimental results, the paper presents the similarity between the non-monotonous shape of the SI curve with the magnetoelastic Villari effect. The Stress-Impedance Villari point dependence on the frequency of the driving signal is depicted as well. Furthermore, analysis of obtained SI coefficients, and hysteresis of the obtained characteristics suggest the most promising material for stress-sensing applications.
2. Materials and Methods
During the investigation Fe-based, Fe-Ni and Co-based amorphous ribbons in as-cast state were used.
Table 1 summarizes the properties of the samples. Ribbons were cut into samples of width
w equal 1 ± 0.1 mm and lengths
l equal 50 mm.
The impedance Z of the ribbon was measured by four-probe method using LCR Bridge (Microtest 6630E, New Taipei City, Taiwan). Research was carried out for low and medium impedance test frequencies (<5 MHz) with a driving current Irms equal 10 mA. Special program for controlling measurement system and collecting measurement data was developed in National Instruments LabVIEW environment (v.17, National Instruments, Austin, TX, USA).
The SI ratio is calculated in respect to the minimal applied stress
σ, using following formula:
The tensile stress of up to about 200 MPa was applied by the attached loads. The minimal stress
σmin was about 3 MPa due to the weight of the holder to which the sample was attached.
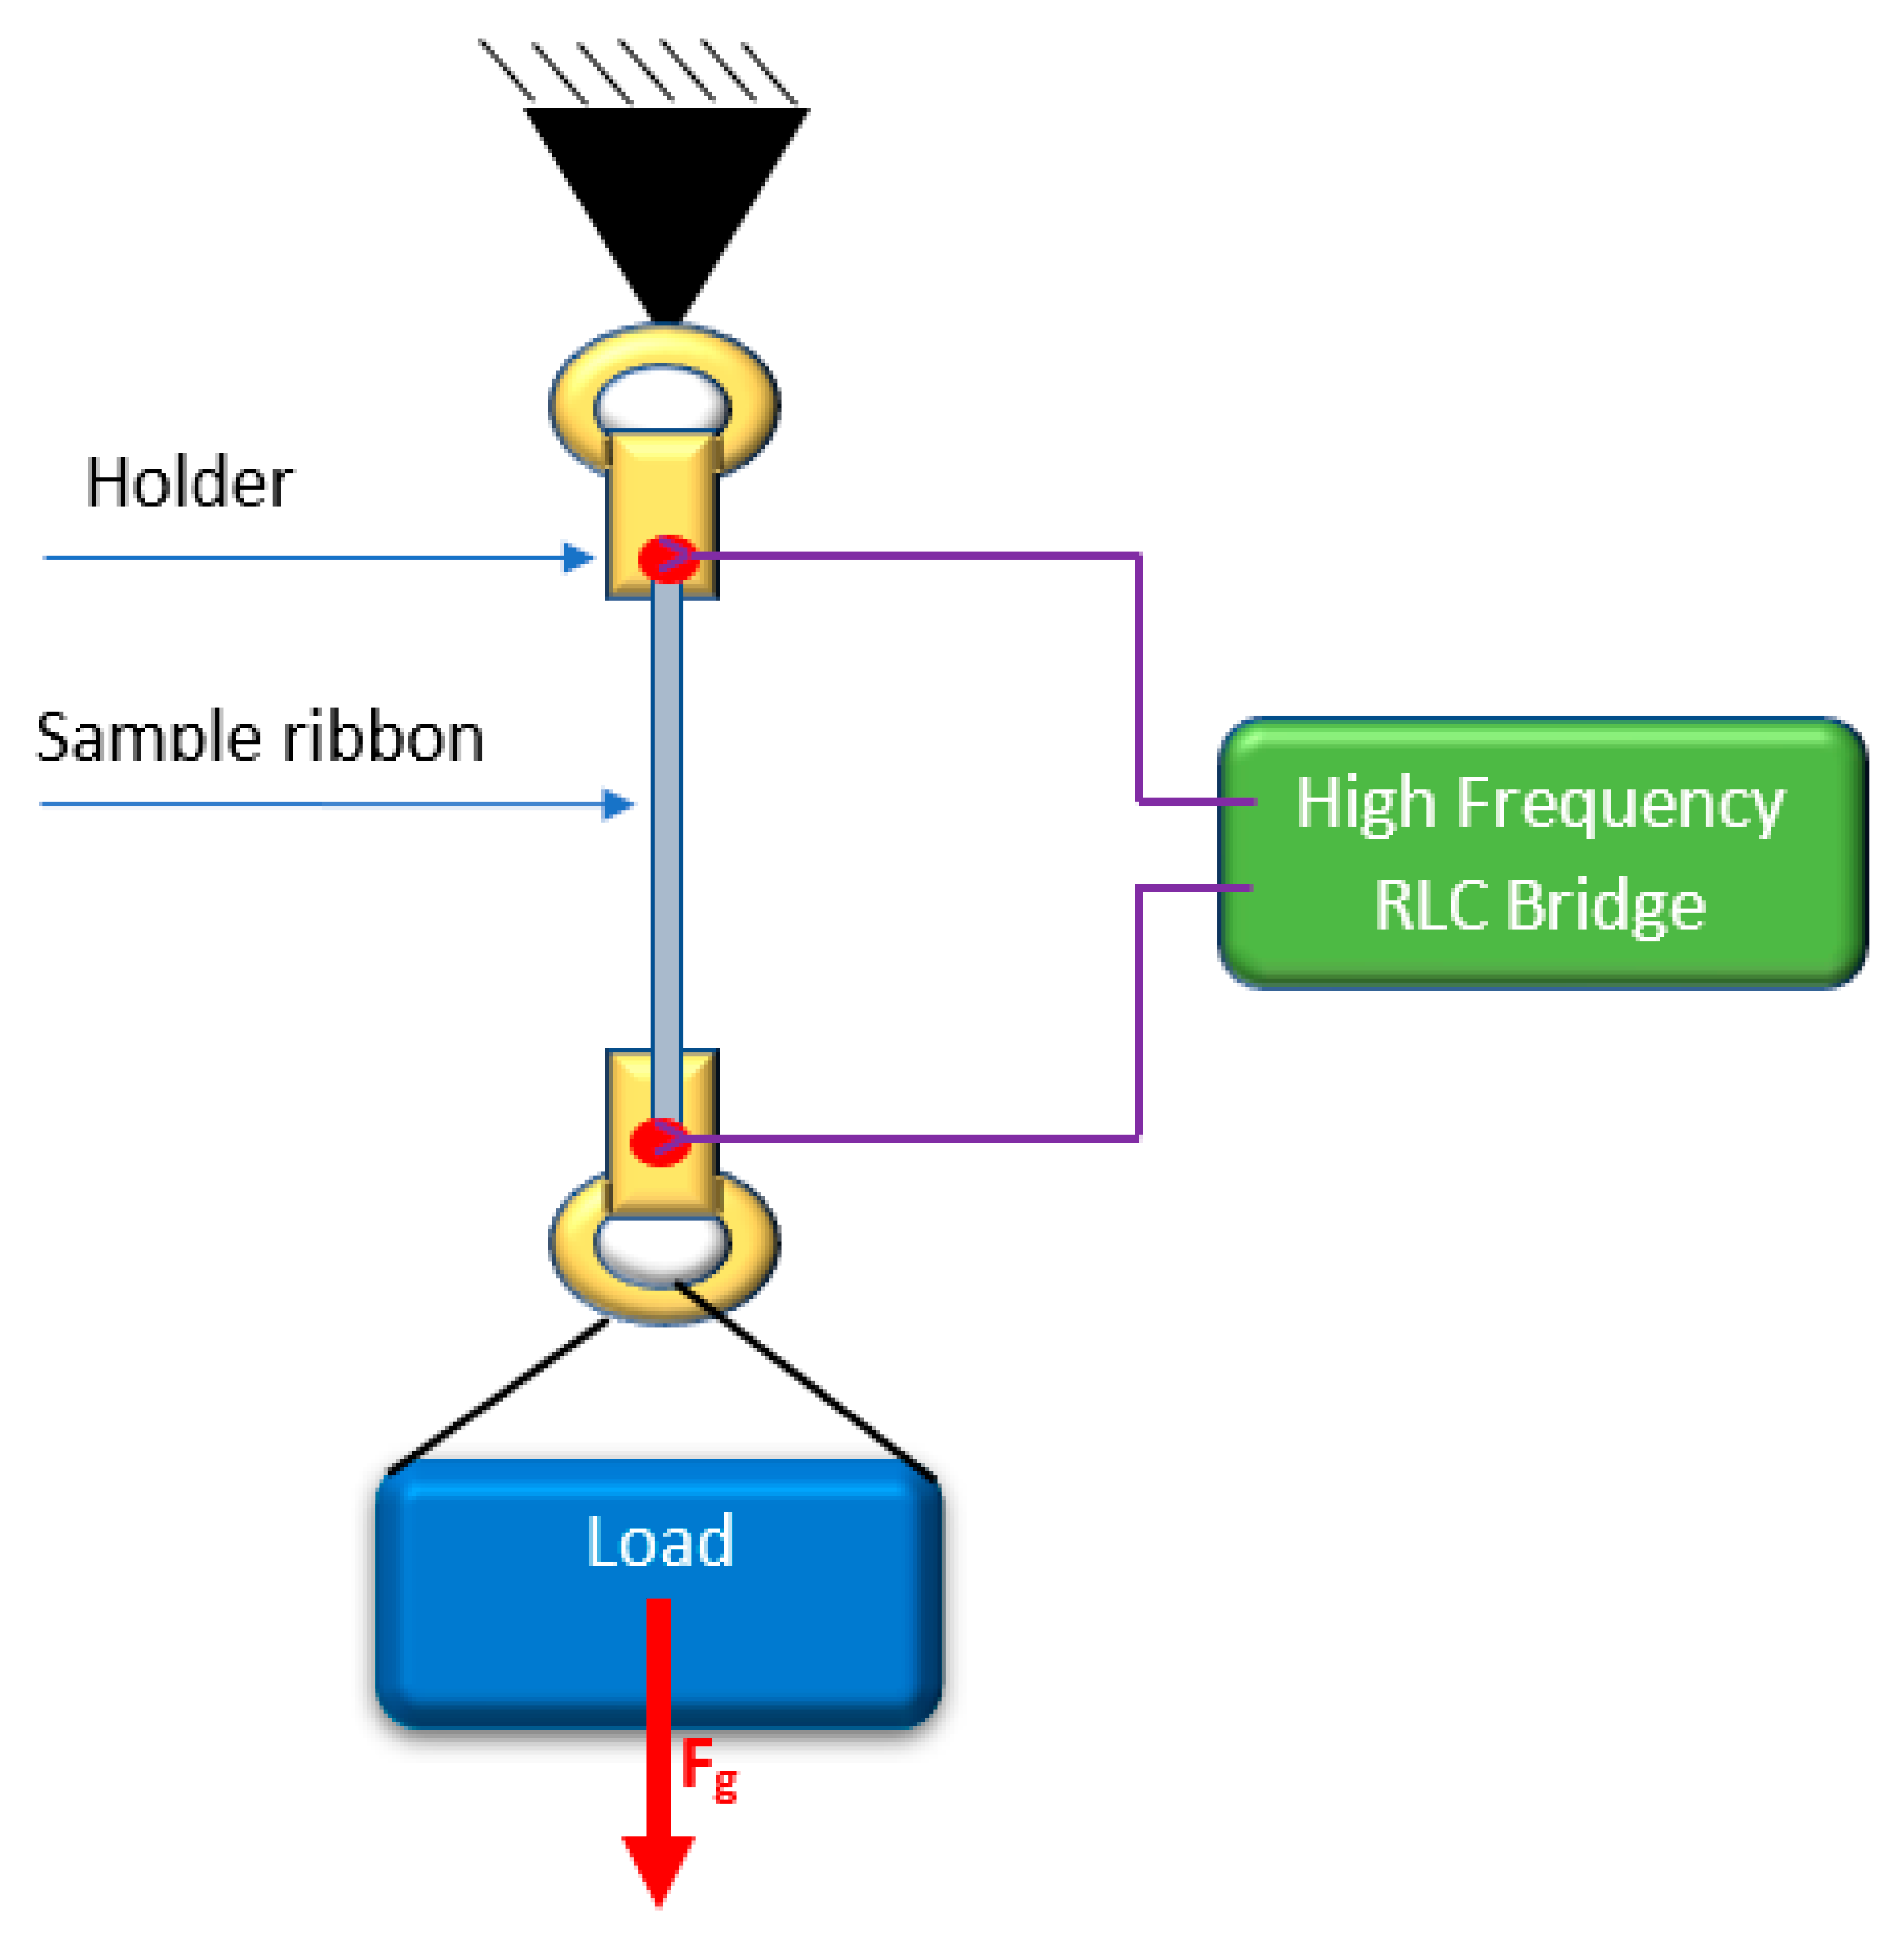
Figure 1 presents the schematic diagram of the measurement test stand and illustrates the method of applying the stresses. The loads were set in a cycle from maximal to minimal value with constant increment of 24.80 g, and from minimal to maximal in the next step to determine the measurement hysteresis. The hysteresis error e
h is calculated using following formula:
where (
Zd −
Zu)
max—maximum hysteresis loop width,
Zmax—maximal indication obtained during hysteresis measurement,
xmin—the minimal display obtained when measuring hysteresis.
In order to accurately determine the stress in the given measurement point, measurements of the weight of loads, and precise measurement of the width of the sample were carried out. An analytical scale (XA 82/220 3Y, Radwag, Radom, Poland) was used to measure the set load. Measurement of the width was made with the help of a digital optical microscope (VMS-004D, Veho, Hampshire, UK). The gravity constant used for determining stresses g equal 9.81229 m·s
−2 was taken from [
31]. The investigated sample was placed in a permanent magnetic field. Three pairs of perpendicularly set Helmholtz coils, supplied by three separated DC Power Supplies, with the application of a magnetoresistive sensor HMR2000 (Honeywell, Phoenix, AZ, USA) as feedback, were used to produce stable DC magnetic field of 40 A/m along the axis of the test sample—typical value of Earth magnetic field present in Europe. The reason for the study in such conditions was, on the one hand, the elimination of the influence on impedance of external magnetic field and, on the other hand, measurements in an environment corresponding to the magnetoelastic sensors working conditions—measurements in presence of Earth stable DC magnetic field. The measurements of impedance were performed at room temperature.
3. Results
3.1. SI Measurments
Figure 2,
Figure 3,
Figure 4 and
Figure 5 present the longitudinal tensile stress dependence of the SI for amorphous ribbons. For all of the investigated ribbons, a change in impedance under the influence of applied stresses was observed. For all of them—excluding Co
71Fe
1Mo
1Mn
4Si
14B
9—the SI effect rises with the rise of frequency. The comparison of graphs shows significant difference in SI character.
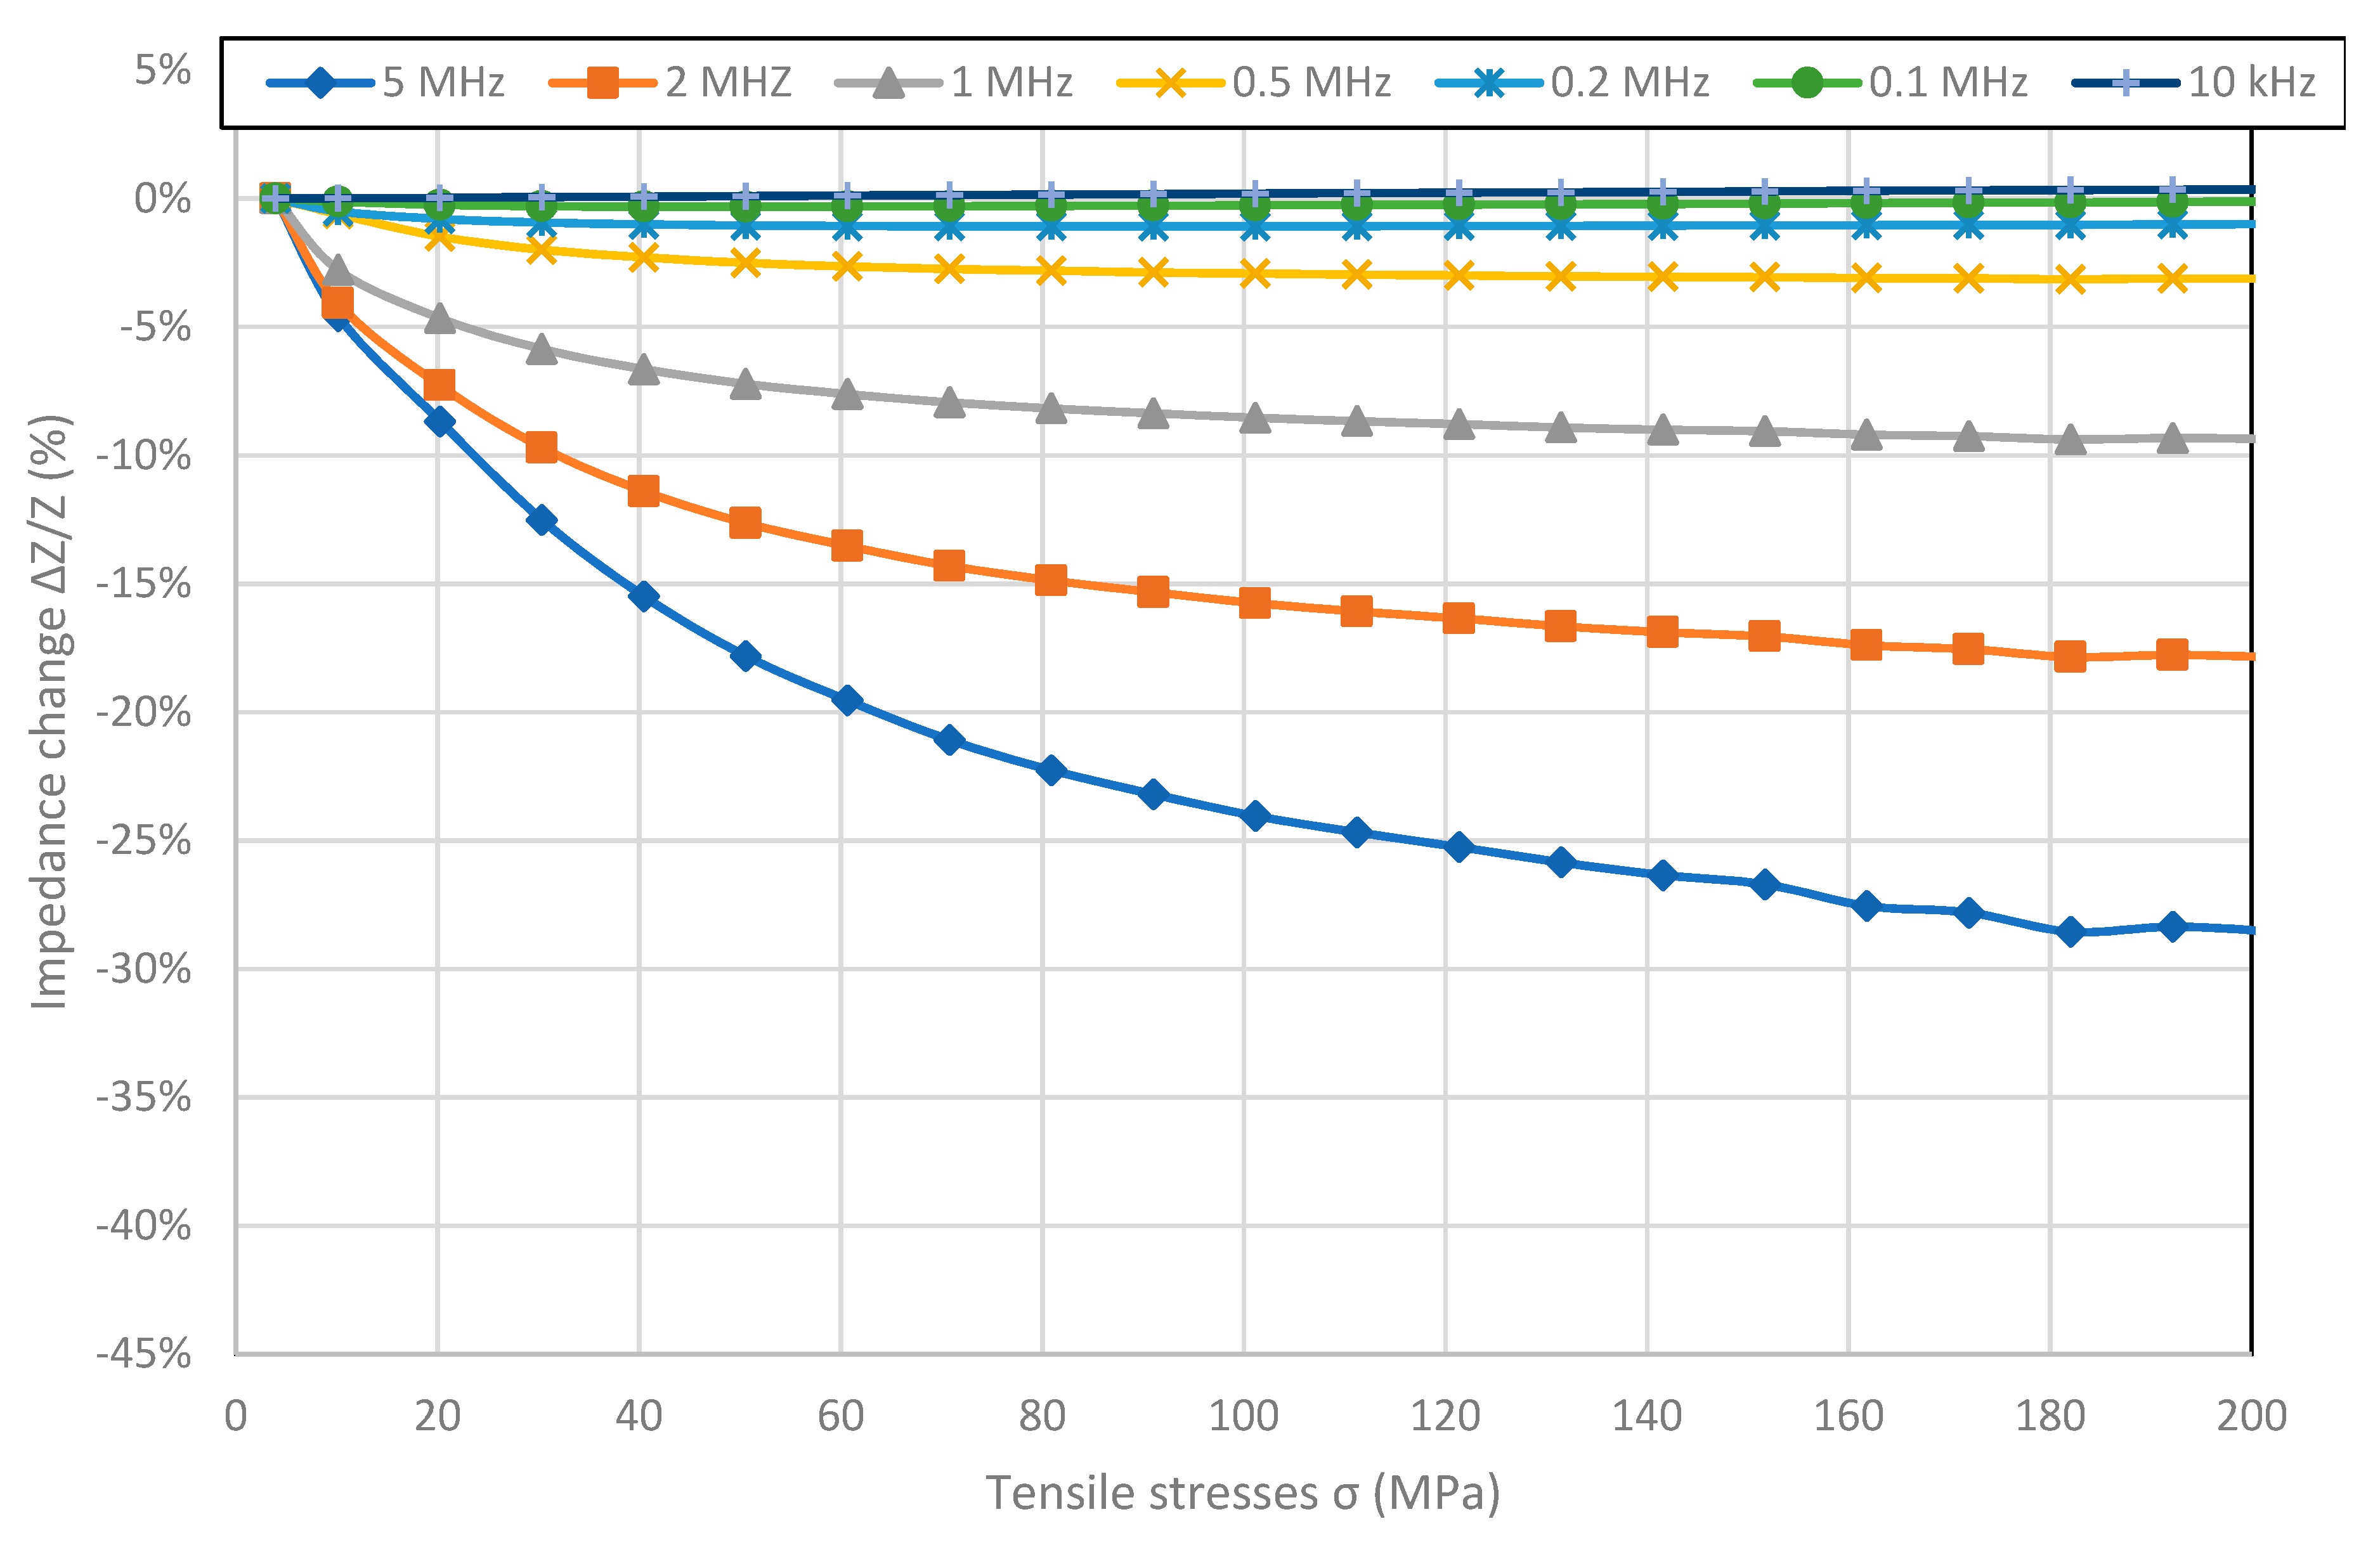
Figure 2 shows SI for Fe
80B
11Si
9 ribbon with high magnetostriction saturation
λs value. The max SI value equal to −29.07% was reported for 5 MHz frequency. For all of the frequencies the maximal value of Impedance
Z is for the minimal stresses and graphs exhibit saturation for higher stress values. The value of stress for which the saturation of the SI effect is achieved, increases with frequency and was not reached for frequencies above 1 MHz.
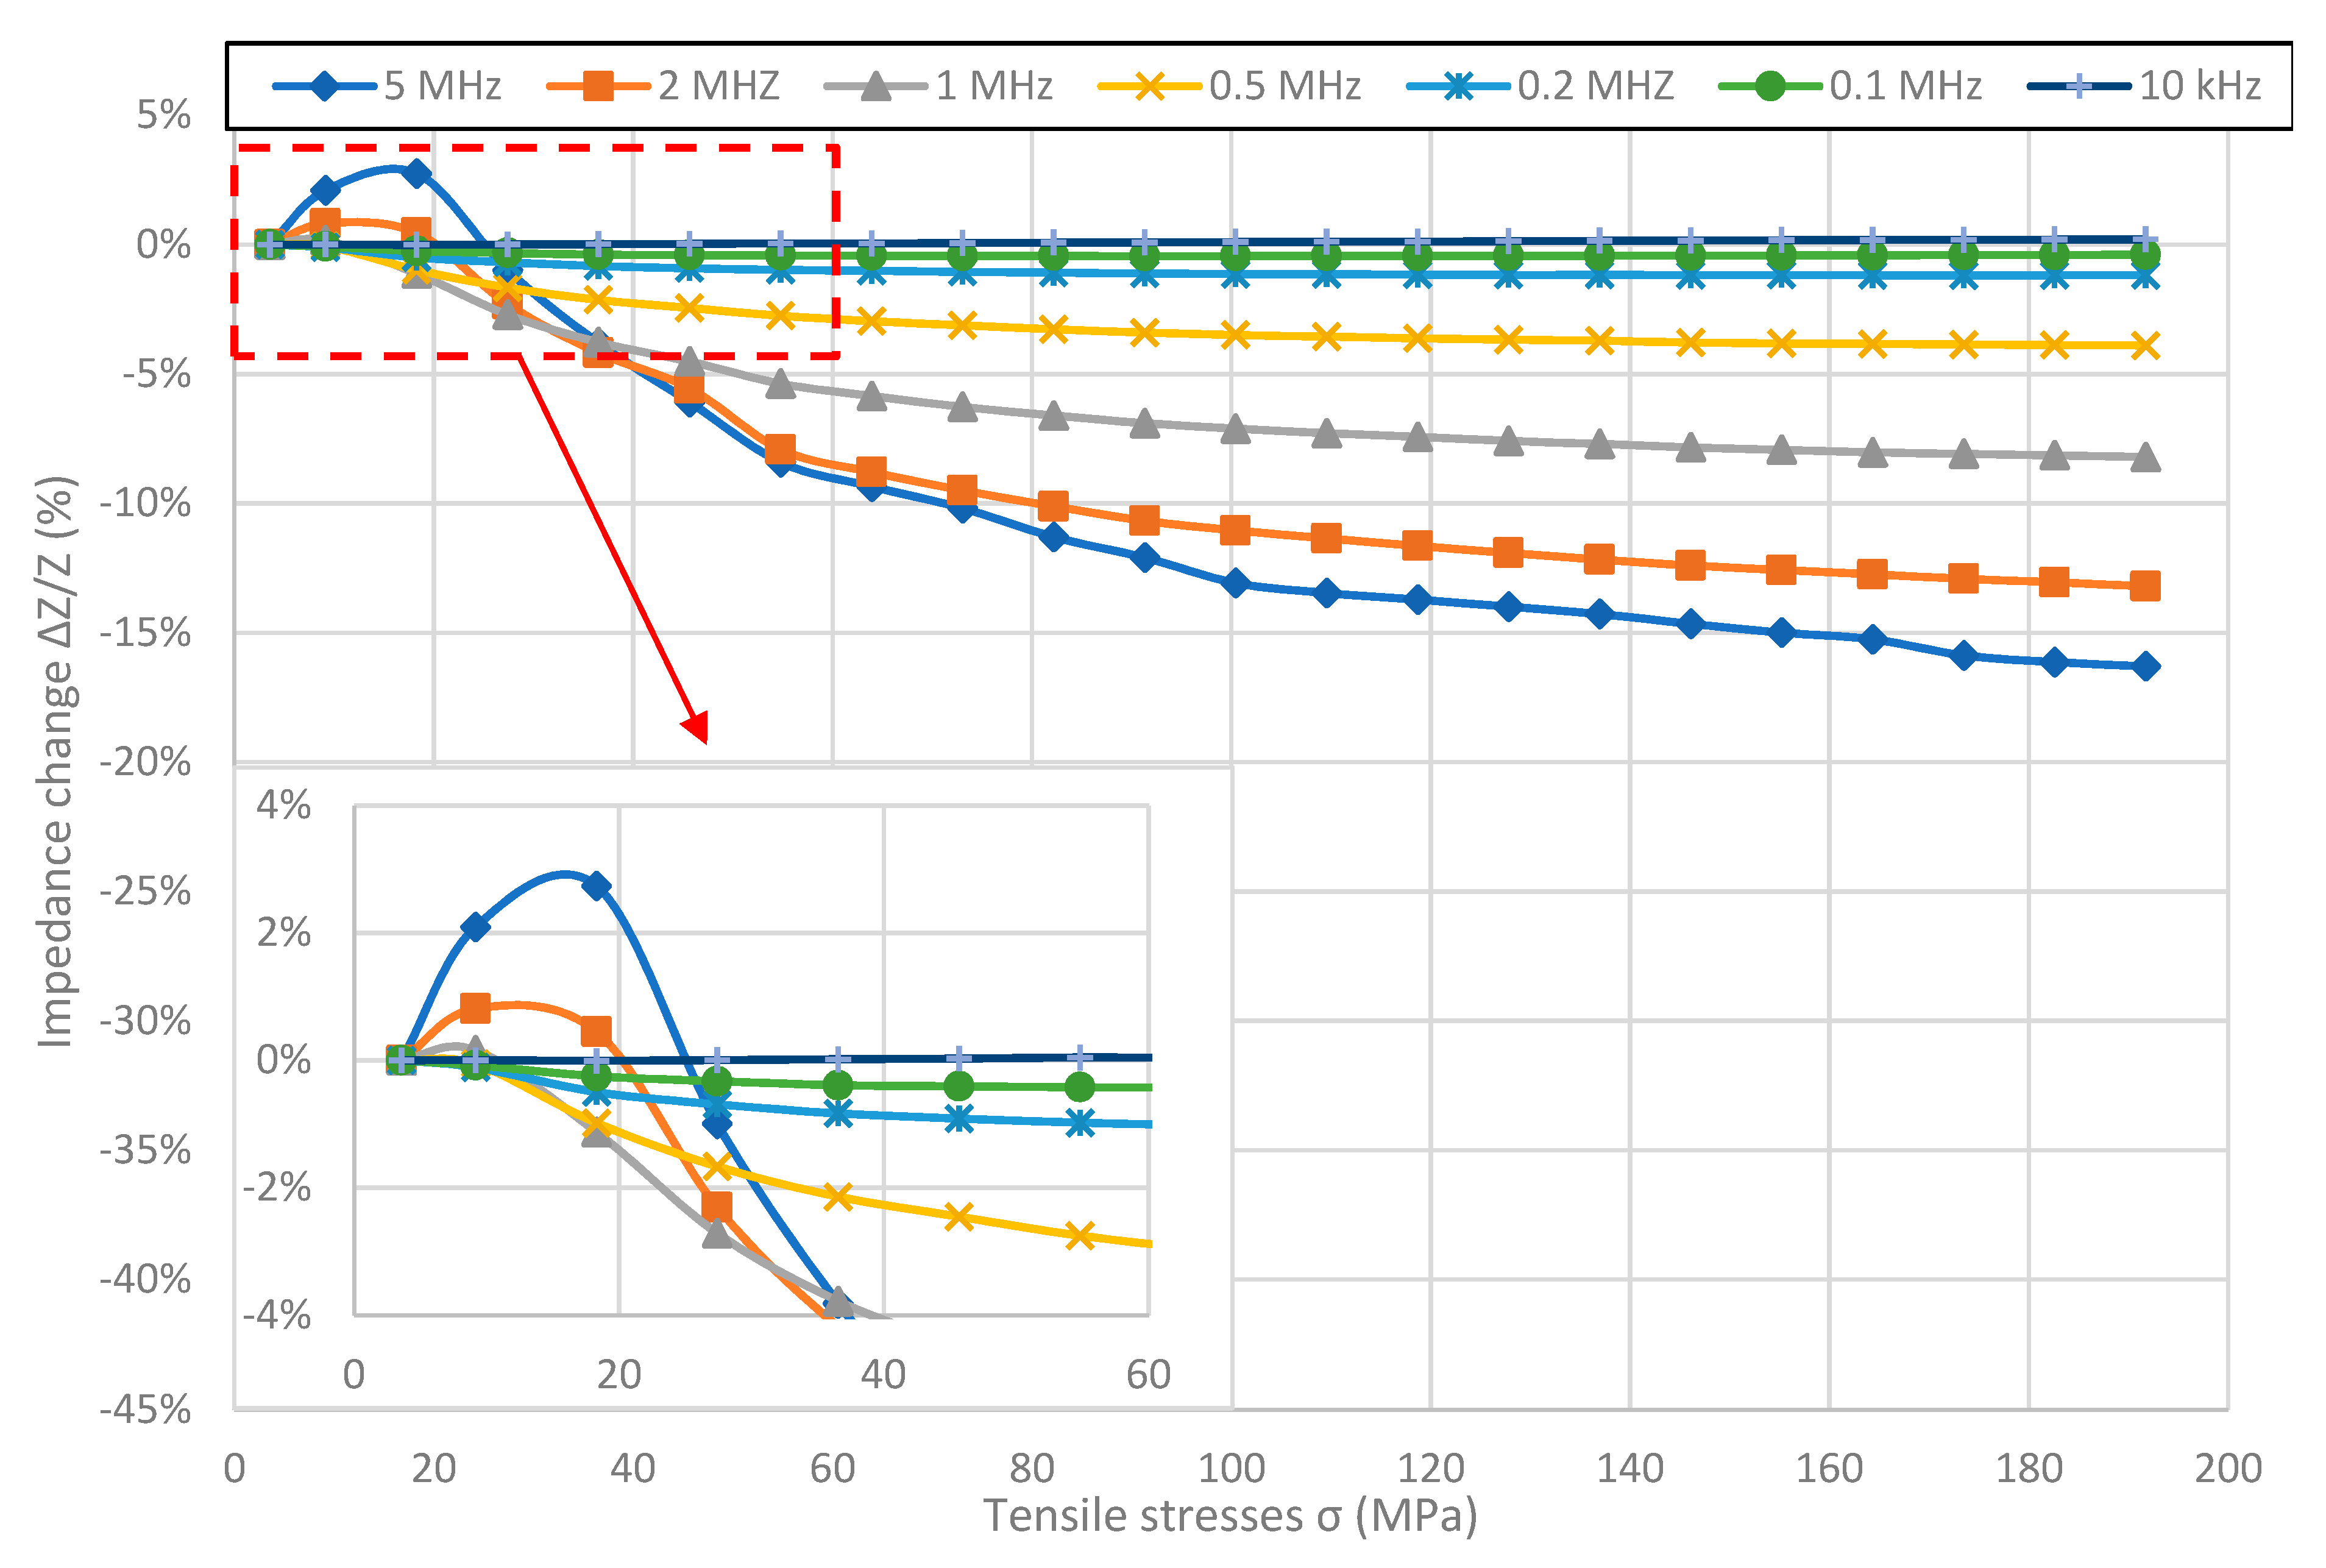
For the Fe
40Ni
38Mo
4B
18 sample (
Figure 3), shape of the graph changes with the frequency. For frequencies below 1 MHz, graphs are hyperbolic like for Fe
80B
11Si
9 ribbon. For 1 MHz and higher frequencies graphs aren’t monotonic and have pronounced reversal point. What is more, the stress value for which the inflection point occurs, increases with frequency, as can be seen more clearly at the inside of
Figure 3. The maximal SI value was obtained for the 5 MHz frequency and was absolutely 16.30%, while the difference between the maximal and minimal impedance value was 19%. Similarly to Fe
80B
11Si
9 samples, the SI effect for given stresses reaches saturation for frequencies below 1 MHz, and is close to saturation for higher frequencies.
In the
Figure 4, the results of measurements of Co
70Fe
5Ni
2Mo
5B
3Si
15 sample are presented. SI values are by far the largest of the measured samples and are −41.73% for 5 MHz. The effect in the entire measured range of stresses is not saturated and the nature of the occurrence of the reversal point is different than for the other samples. The value of stresses for which the reversal point occurs decreases with frequency, and for frequencies above 1 MHz does not occur. SI values are negative for frequencies above 0.2 MHz, and positive for lower frequencies.
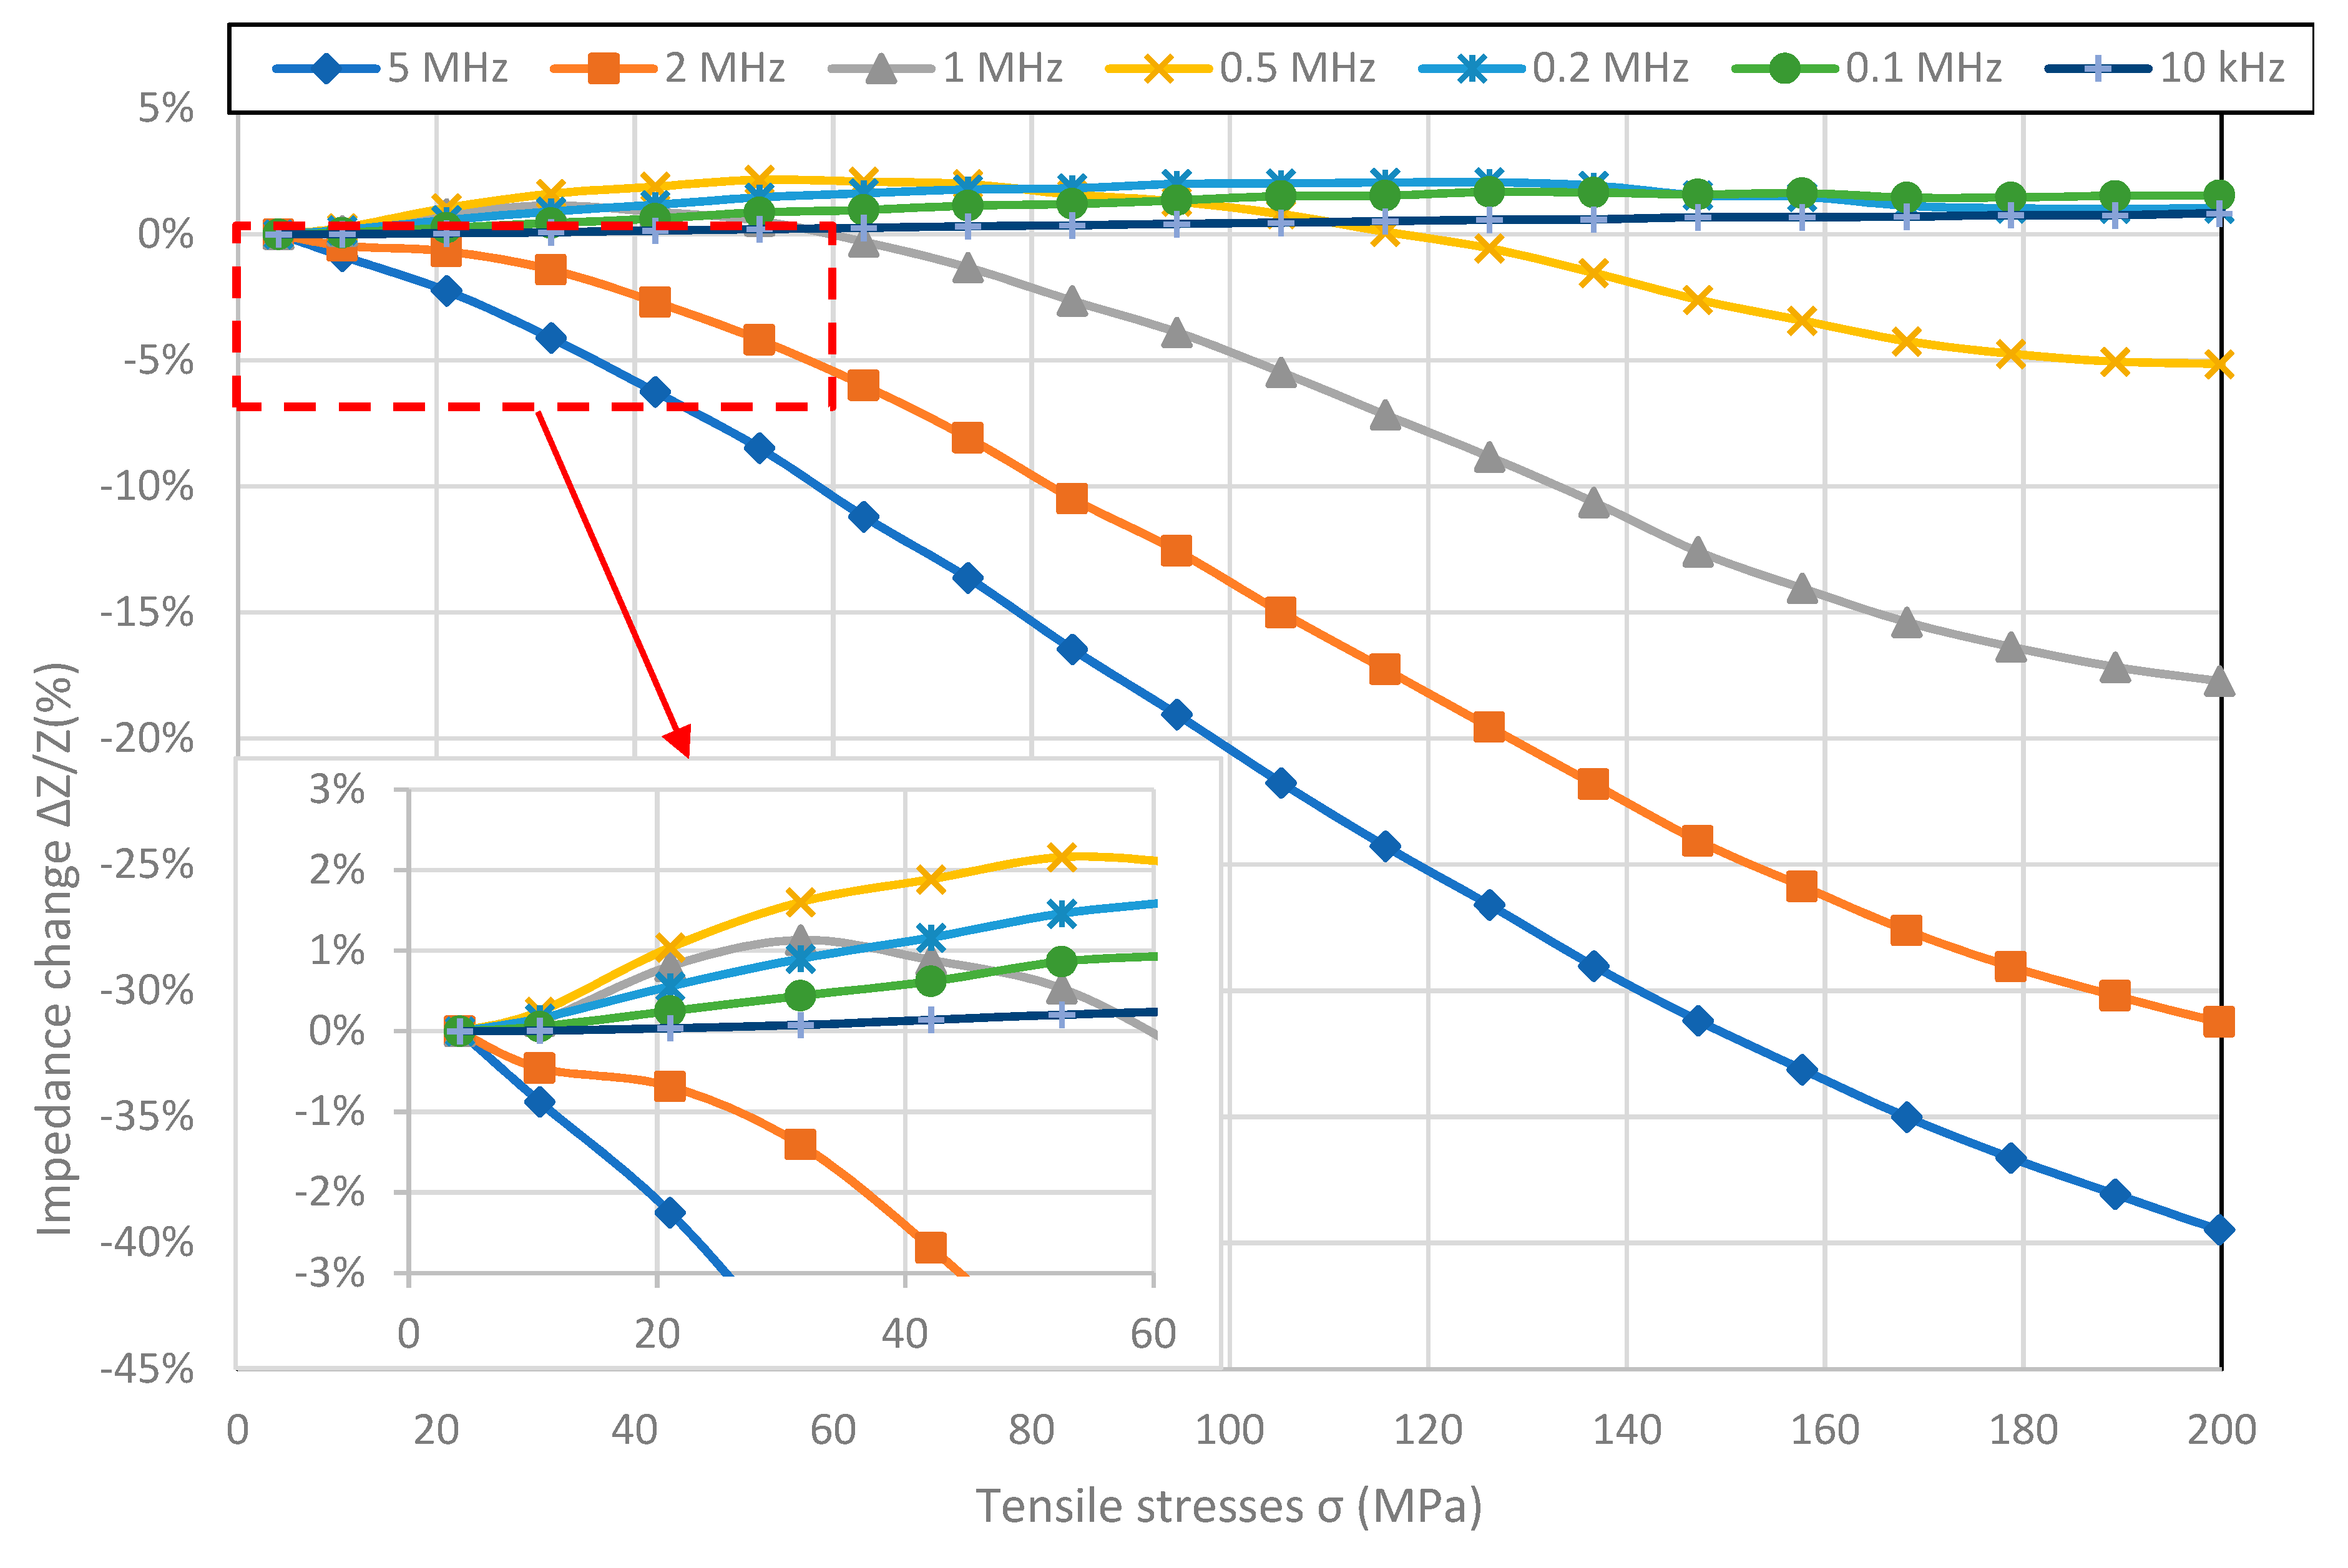
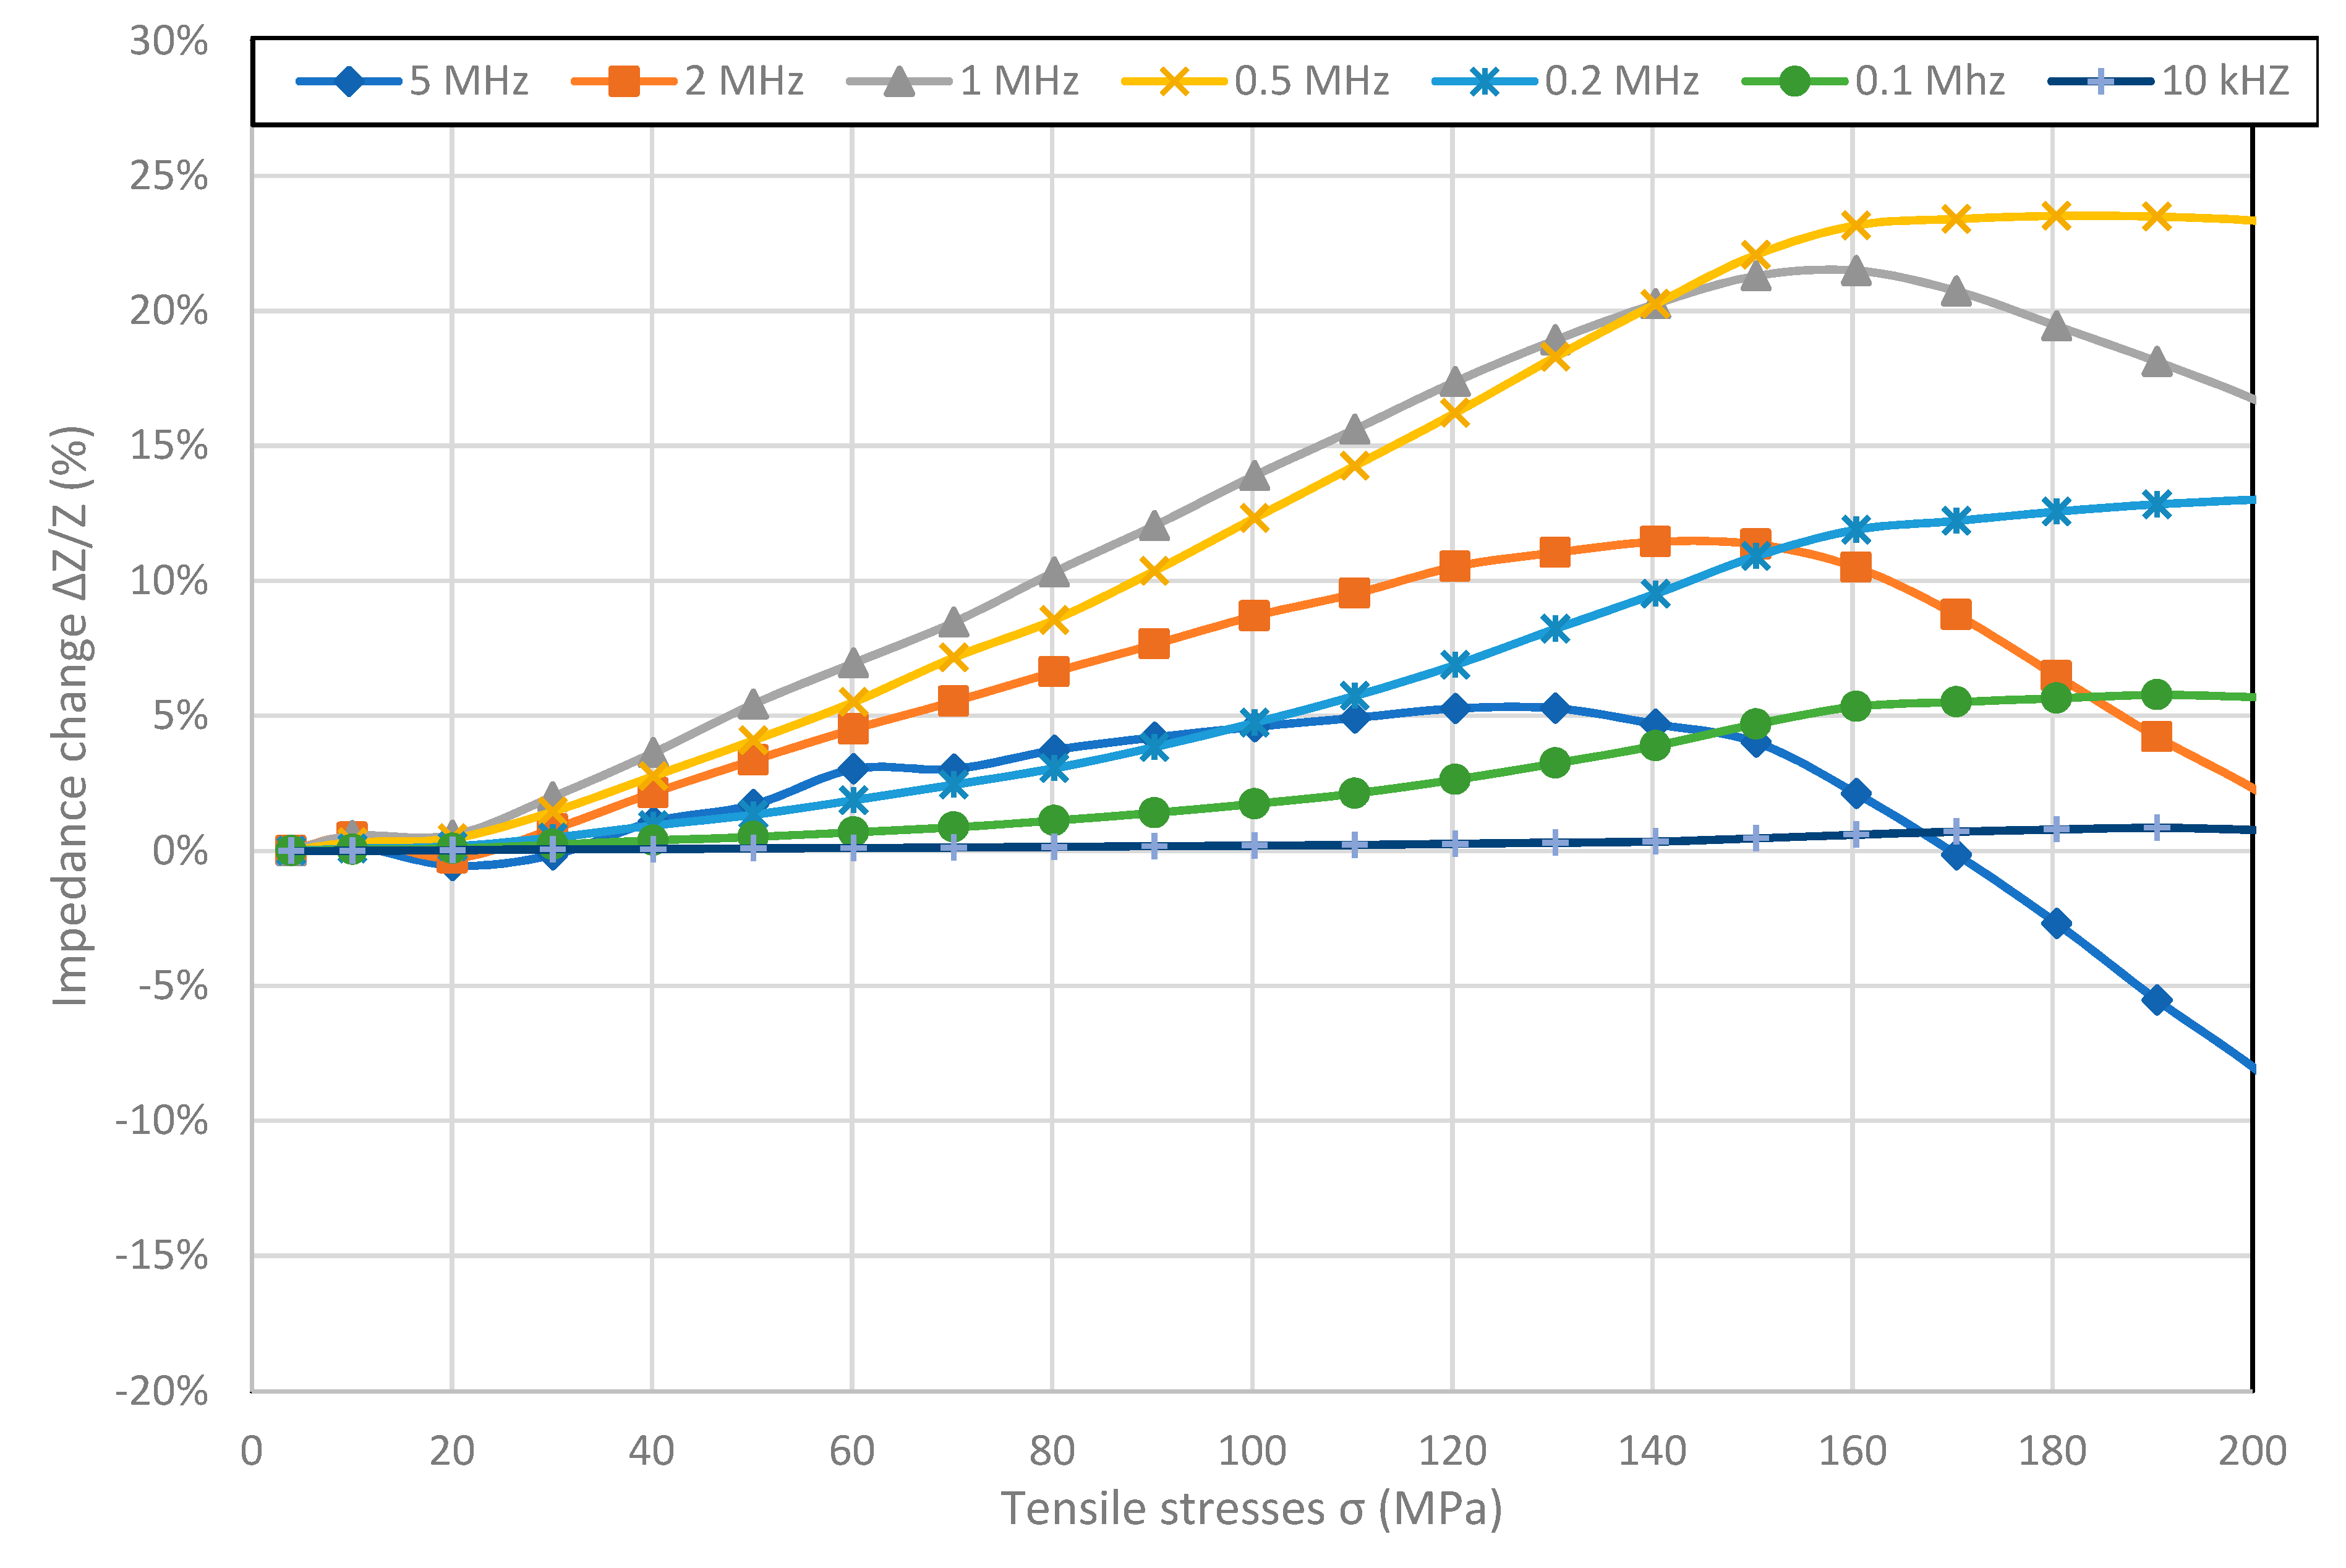
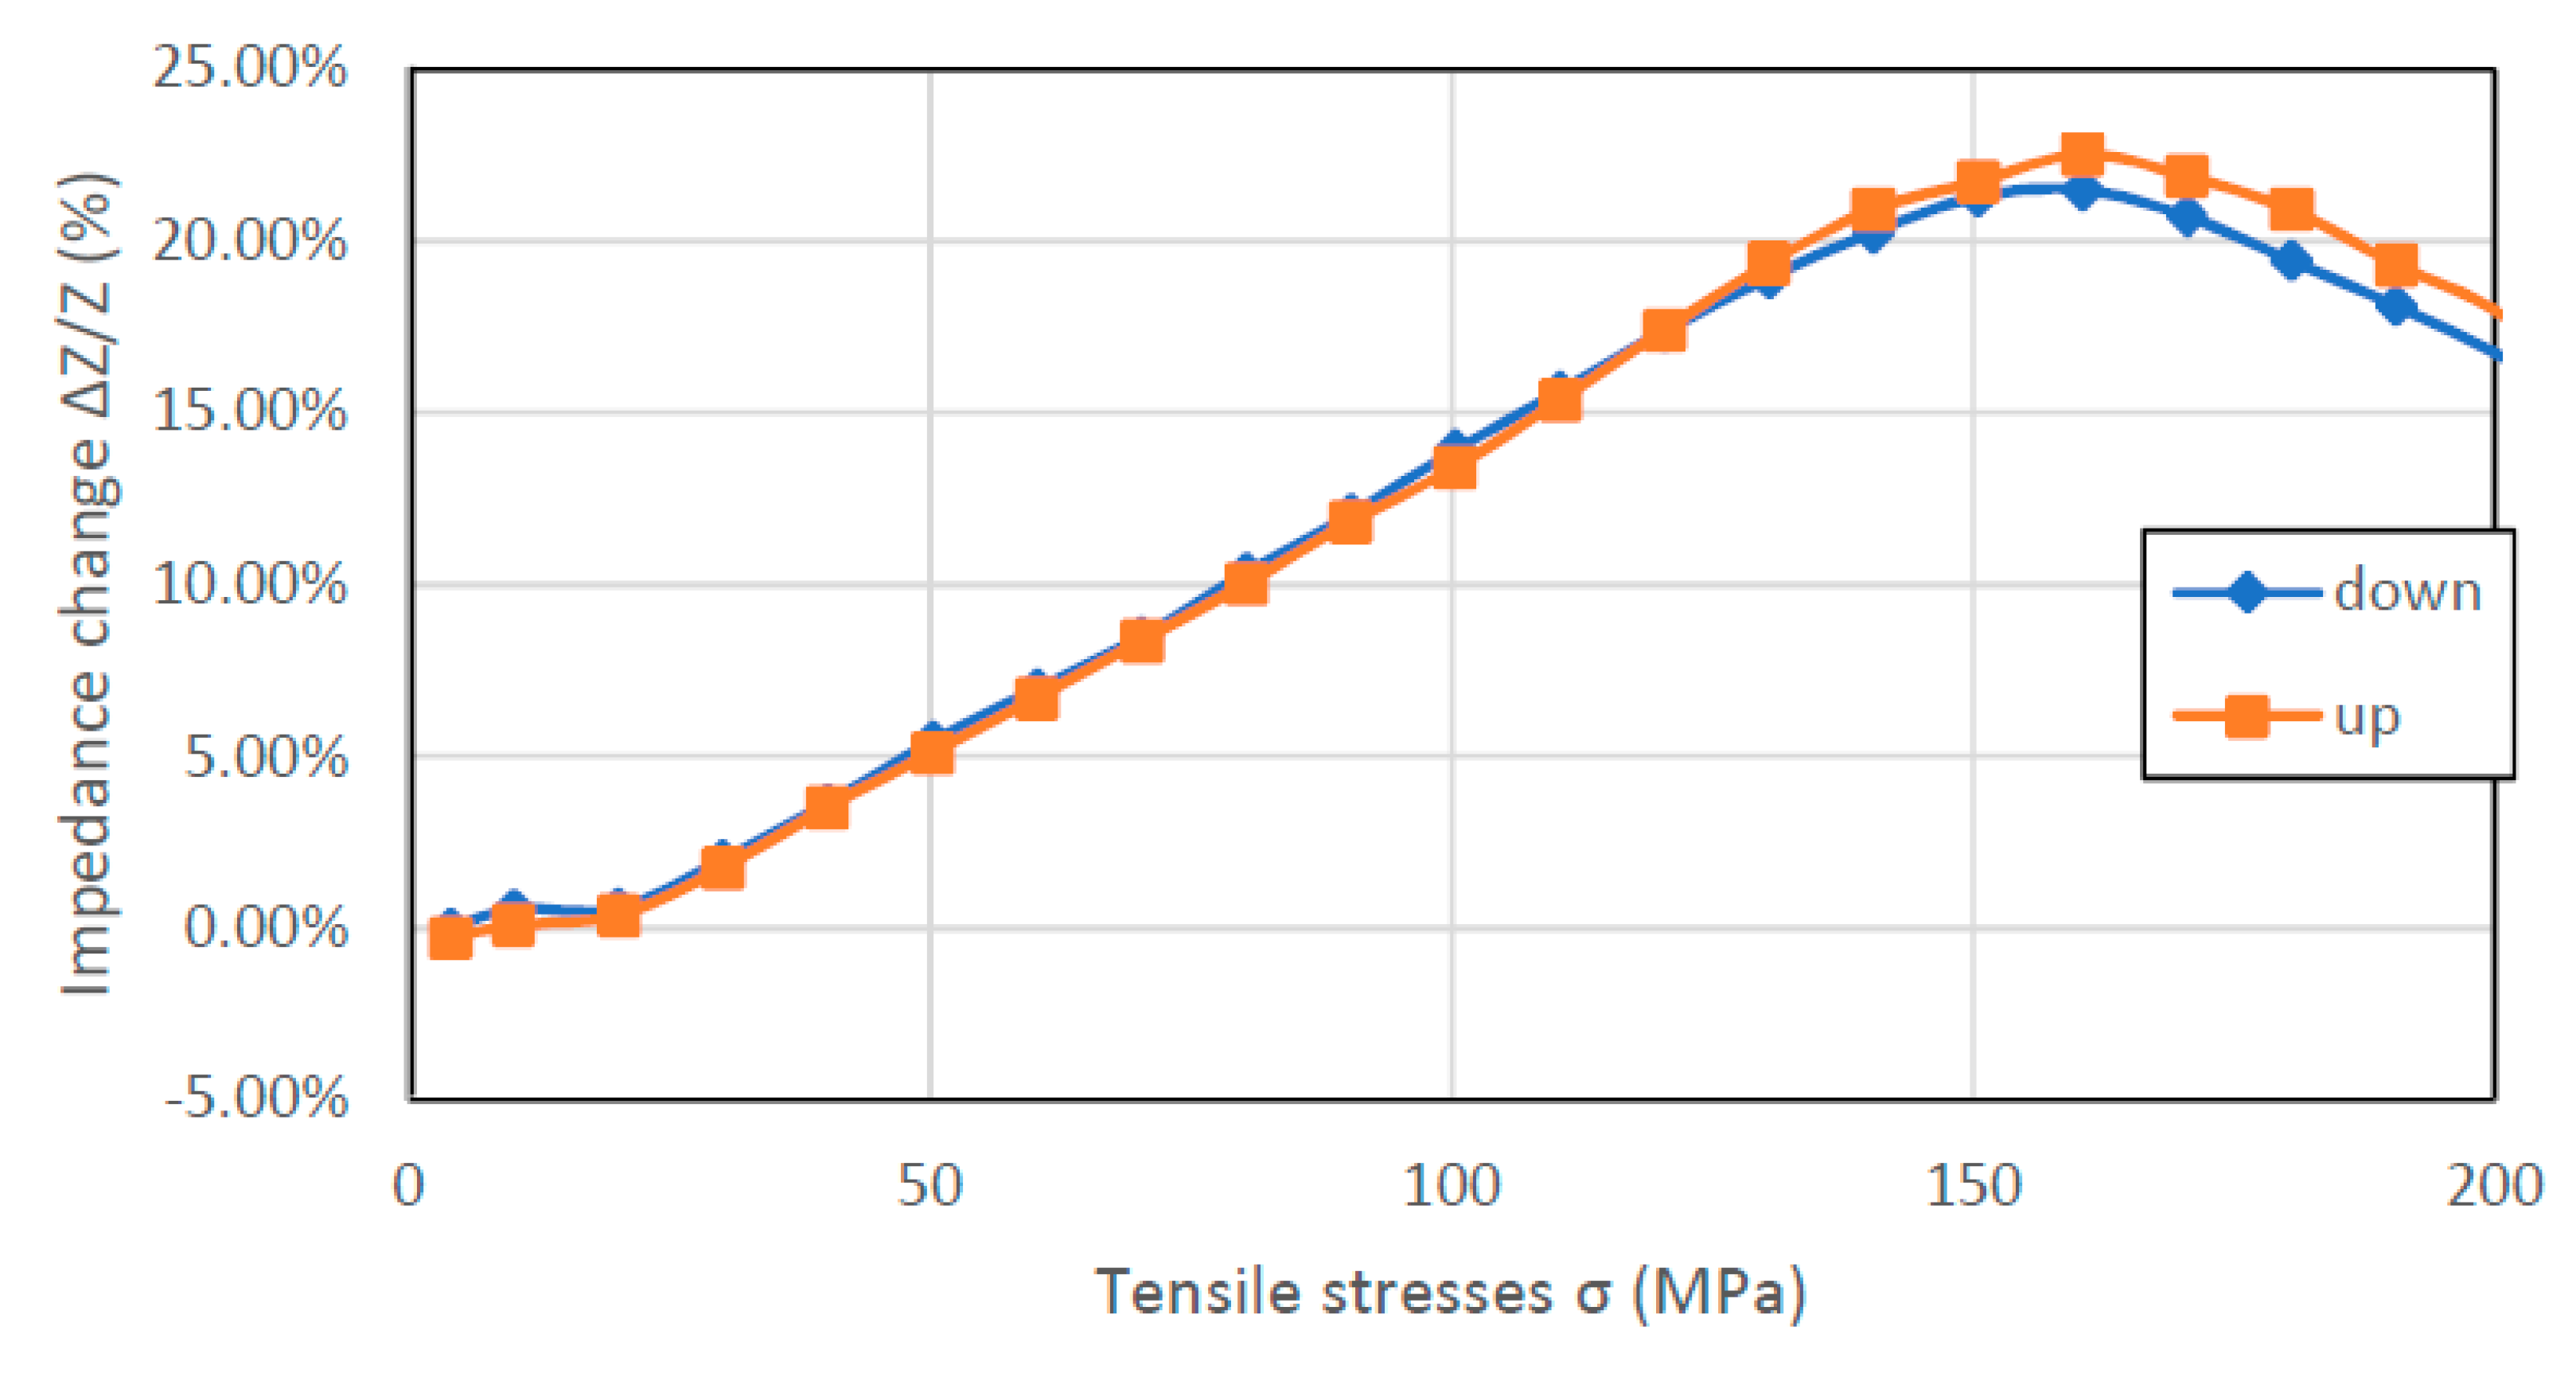
Figure 5 shows results of measured stress impedance effect for nearly zero magnetostriction Co
84Fe
1.5Mo
2Mn
1.5Si
7B
2 sample. Unlike other samples, SI values in a wide range of stresses are positive for all frequencies. The reversal point occurs for frequencies above 0.5 MHz and the stress value for which it occurs increases with frequency. In the measured range, the highest SI value of 23.52% was achieved for the frequency of 0.5 MHz. Because frequencies above 1MHz did not reach saturation in the case of extended measurements, they could reach a higher value of max-min SI.
3.2. Hysteresis of Stress Measurments
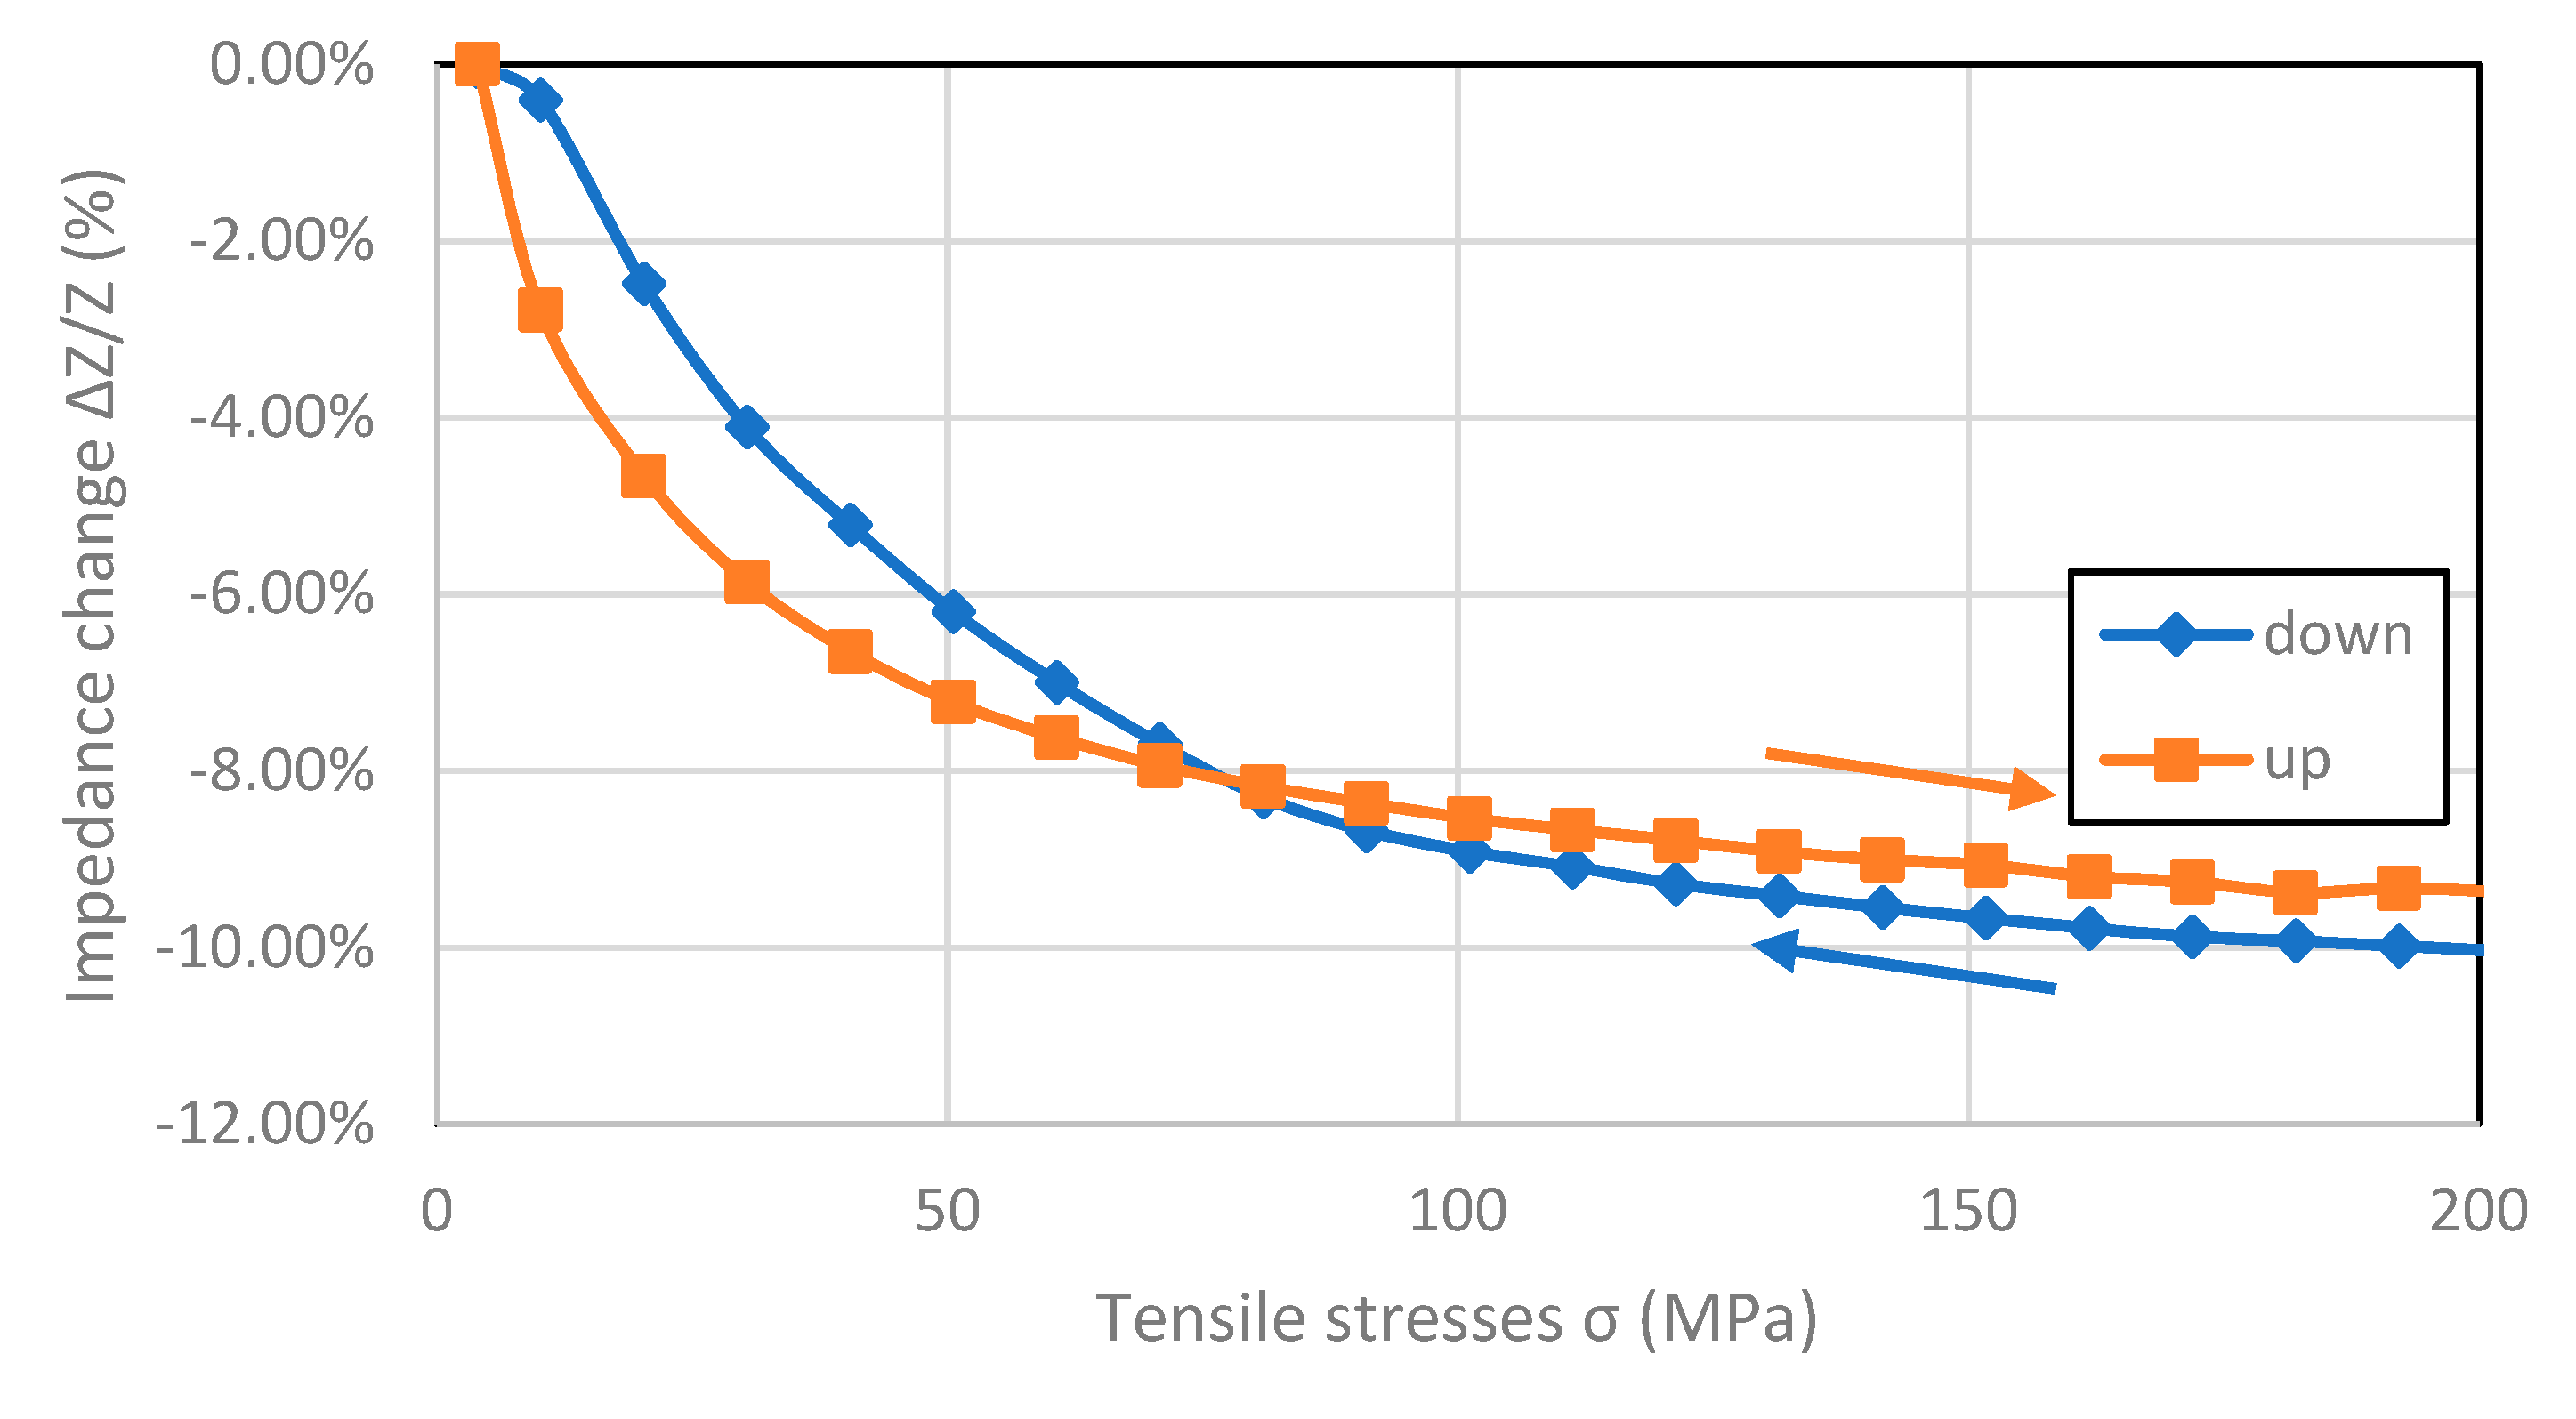
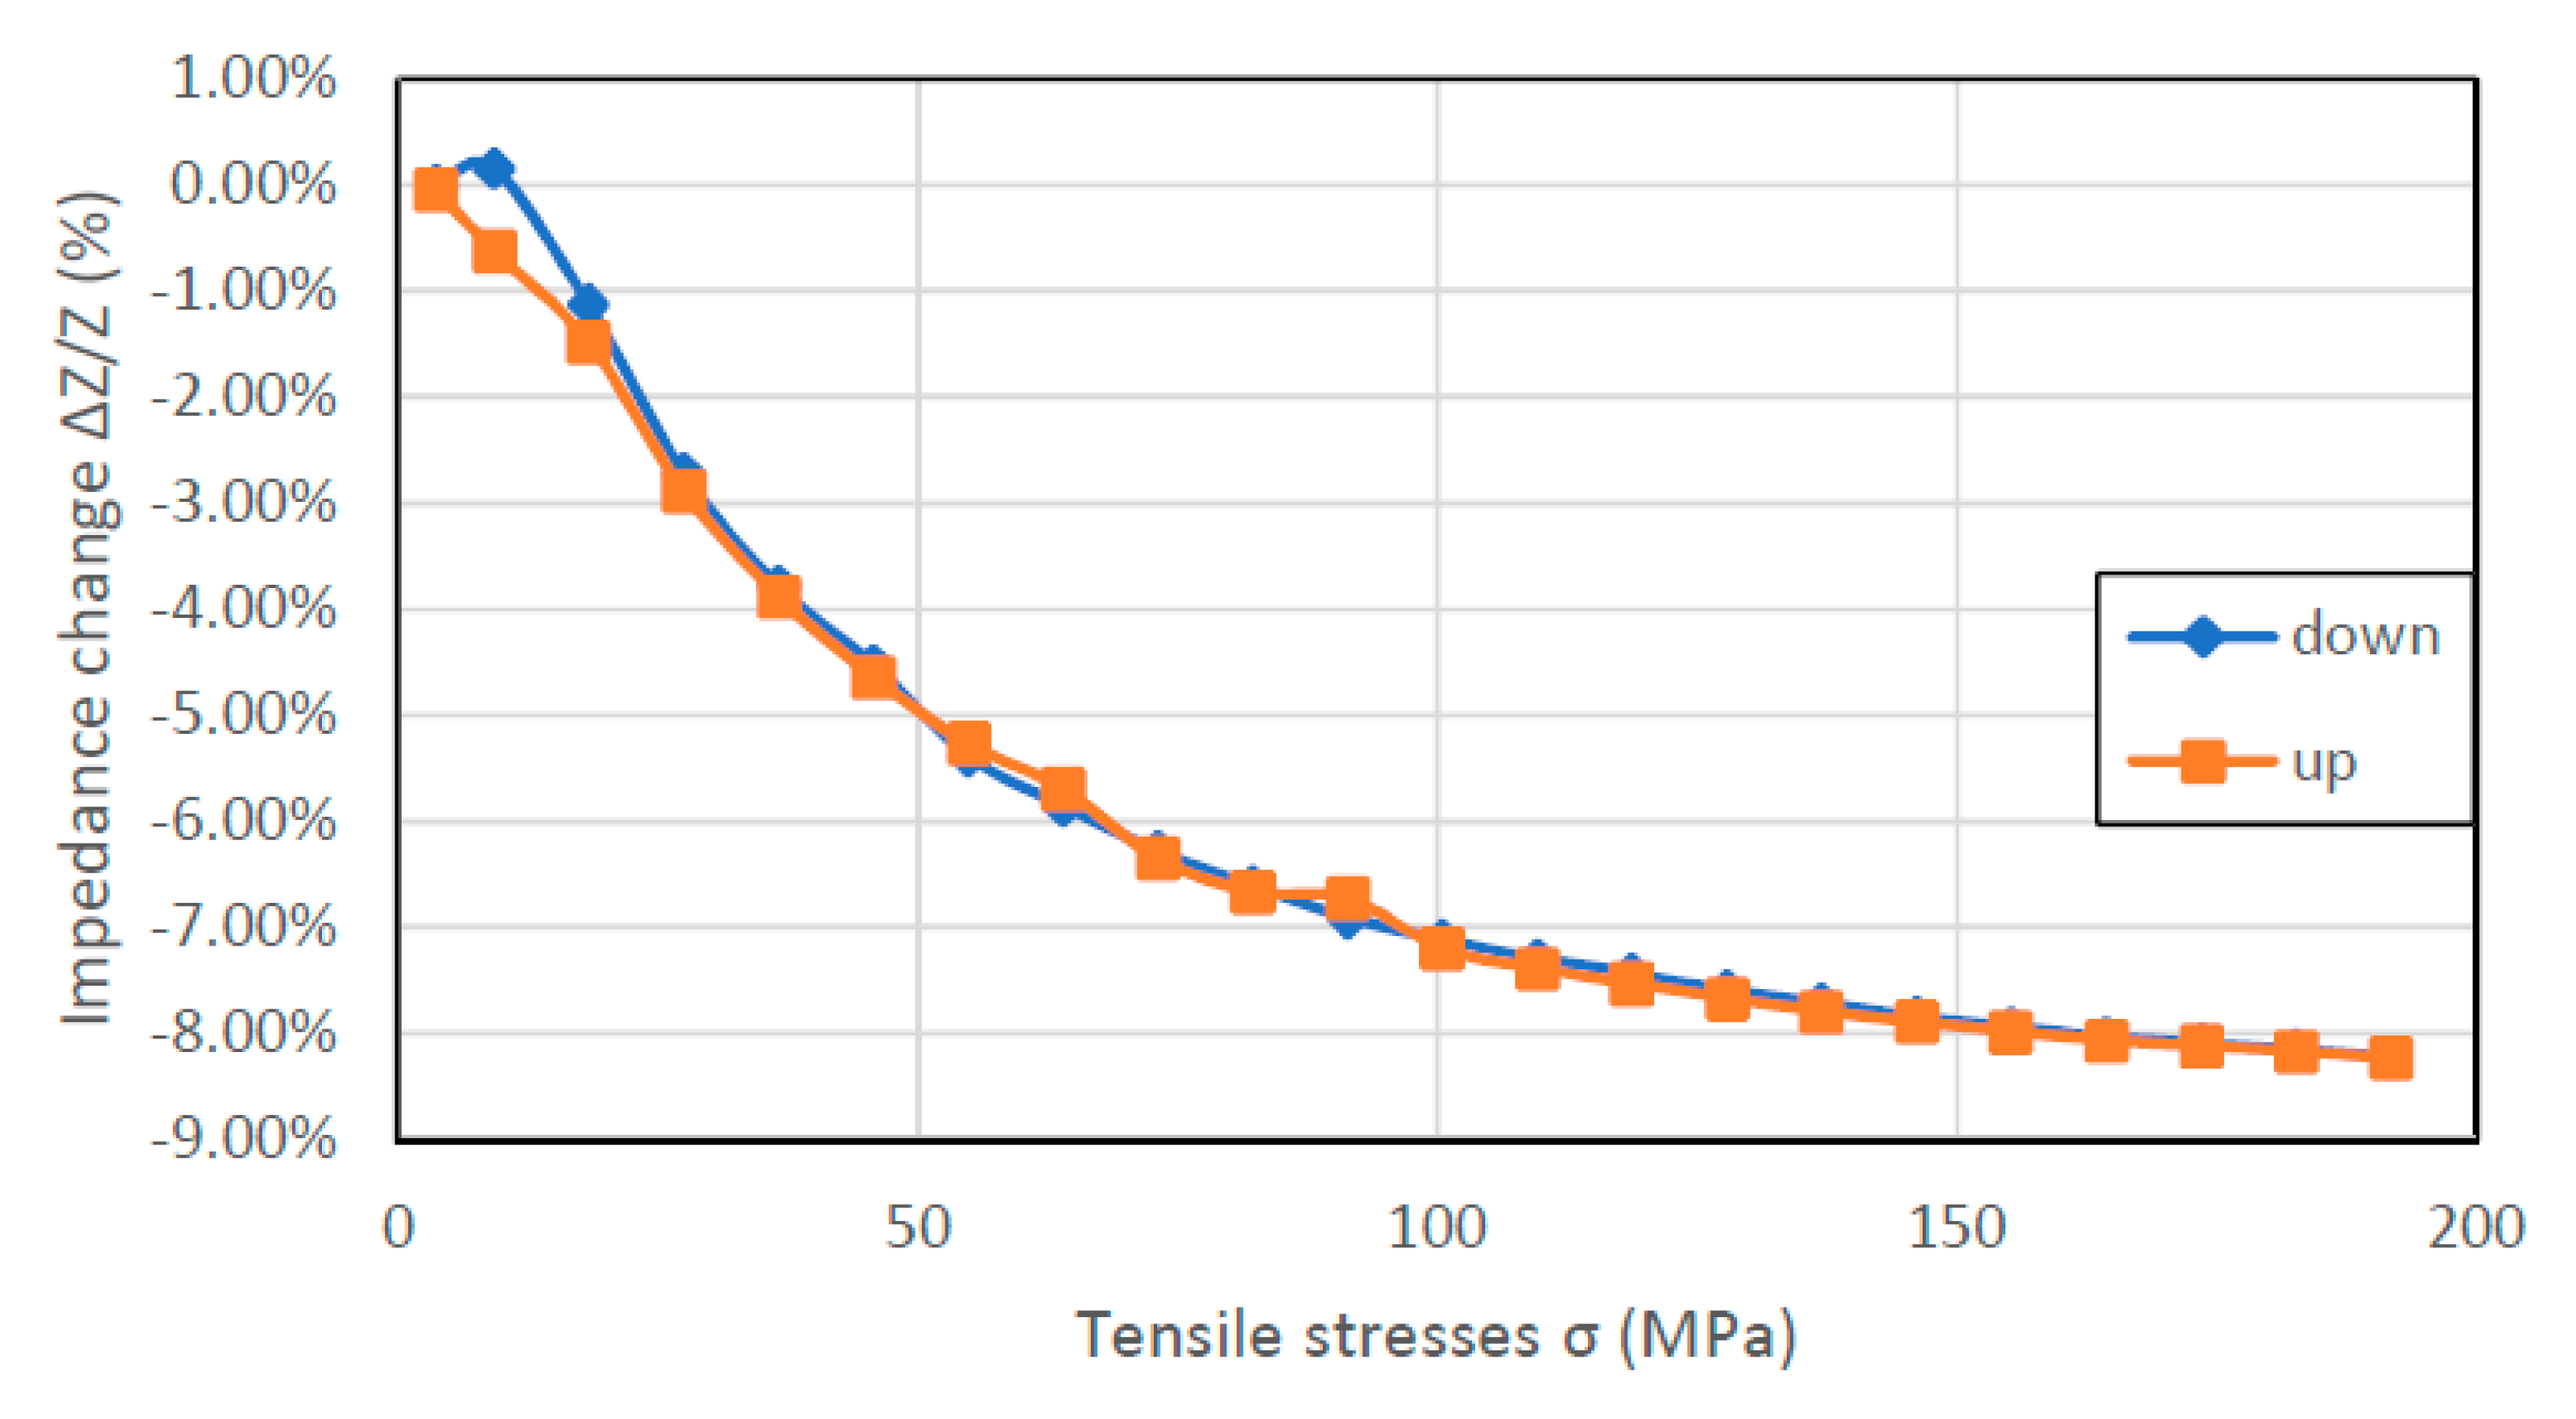
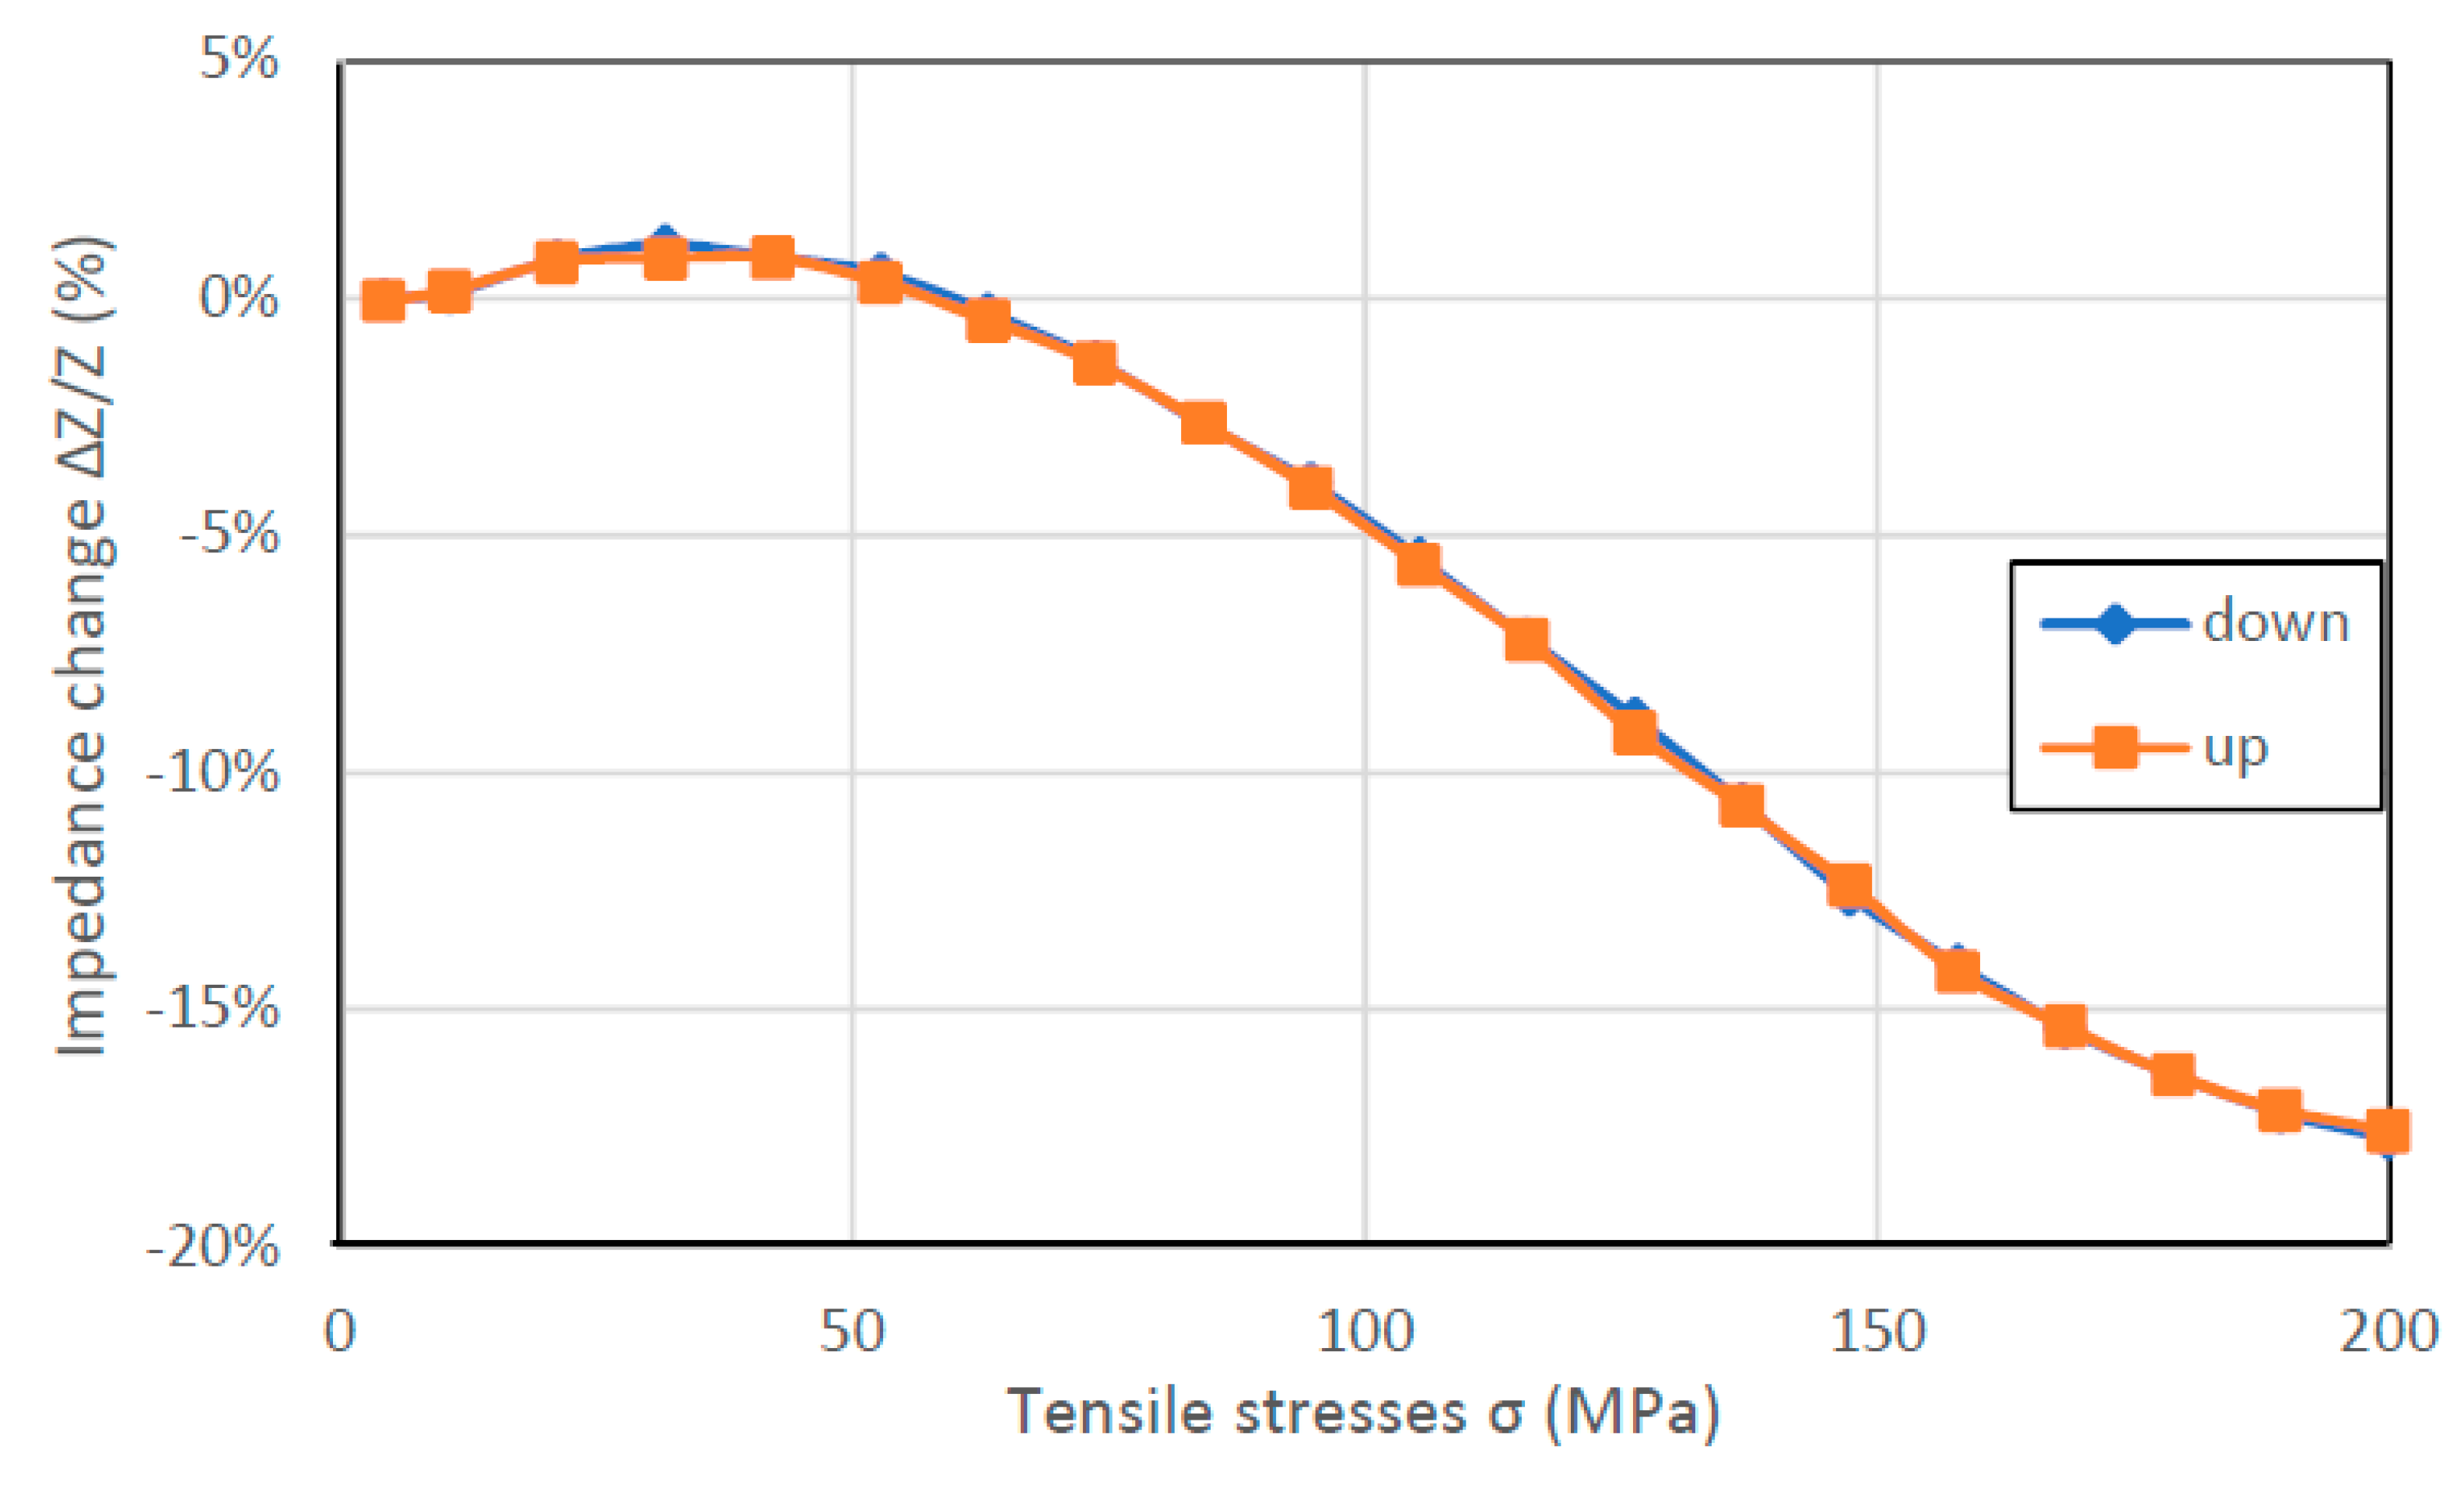
In
Figure 6,
Figure 7,
Figure 8 and
Figure 9, the results of the hysteresis of the indications of the measured samples at 1 MHz are presented. The least hysteretic properties have a Co
70Fe
5Ni
2Mo
5B
3Si
15 sample (
Figure 8)—the hysteresis error value was 1.75%, which is important from application point of view. The worst sample in this regard turned out to be Fe
80B
11Si
9 ribbon—the hysteresis error was 23.5%. Fe
40Ni
38Mo
4B
18 and Co
71Fe
1Mo
1Mn
4Si
14B
9 samples have unambiguous sections. For the Fe
40Ni
38Mo
4B
18 ribbon useful range is 25–200 MPa and for Co
71Fe
1Mo
1Mn
4Si
14B
9 ribbon the 0–125 MPa region. For these, the hysteresis error value was 9.43% and 6.54%, respectively.
4. Discussion
The dependence binding the ribbon impedance
Z to the penetration depth
δ is obtained by inserting the solution of the Maxwell equation into an equation describing the impedance using the surface impedance tensor (the transformation is described in detail in [
3,
32]):
where
Rdc is the dc electrical resistance,
i is imaginary unit and
2a is the thickness of ribbon. The function for the penetration depth
δ is expressed as follows:
where
c is the speed of light,
f is the frequency of the AC current passed along the sample,
κ is the electrical conductivity,
μ0 is magnetic permeability of the vacuum and
μr is relative permeability.
Equations (3) and (4) indicate that the change in the impedance of the conductor is the result of change of its permeability. It is known that magnetic permeability strongly depends on the magnetic field acting on it [
33]. However, the complete quantitative model of permeability changes in the function of mechanical stresses
σ was still not presented. The most advanced solution was proposed by Sablik et al. In this solution the effective field
Heff acting on the sample considers also the influence of mechanical stresses. Using the Jiles–Sablik model,
Heff can be expressed as [
34]:
The individual components are defined as:
H is the sum of exciting AC field and applied DC bias field,
α is a dimensionless mean field representing interdomain coupling and
M is the magnetization. The component of the magnetizing field connected with mechanical stress-induced anisotropy field is given as [
34]:
where
Ms is the saturation magnetization. However, this model can only be used for the small mechanical stress values. In the range of high stresses that occurred in this study, saturation magnetostriction is not constant. Moreover, it was observed that for higher values of mechanical stresses, saturation magnetostriction can change its sign [
35].
In the experiment, the composition H was constant and did not affect the impedance change. Comparing the measurements, it can be noticed that the scale of the SI effect depends primarily on magnetic permeability and secondly on magnetostriction. The largest SI ratio was obtained for a ribbon with a nearly zero magnetostriction but with a very high permeability, and the lowest for Fe-Ni alloy which had much lower permeability than Co-based ribbon, and much smaller magnetostriction than the Fe-based one.
Large impedance changes for the sample with almost zero magnetostriction, due to the expected significant change in saturation magnetostriction under the influence of stresses. The influence of stresses on the magnetostriction of amorphous alloys with a negligible value of saturation magnetostriction factor has not been sufficiently studied; however, previous research confirms these phenomena [
36].
The hysteresis of measurements visible in
Figure 6 and
Figure 9 can be explained by magnetoelastic hysteresis. External stresses interact with internal stresses, causing residual stresses and the sample does not return to its original state. This effect can be observed in the whole range of stresses or only in certain intervals.
5. Conclusions
The novelty related to the SI effect is the occurrence of a turning point for some characteristics. Such a turning point is characteristic of the Villari effect [
37]. We propose this phenomenon to be named shortly as SI-Villari point. It was also observed that the turning point stress values shifted along with the frequency. The significance of the obtained results is that as the frequency increases, the SI-Villari point will shift towards lower stresses for positive magnetostriction and towards higher stresses for negative magnetostriction. In order to better understand the phenomenon, further research is needed. What is more, also near-zero magnetostriction ribbon exhibits significant SI effect, despite the traditional connection of direct and inverse magnetoelastic effects.
The performed measurements indicate that the best investigated material for the development of a stress sensor based on the SI effect is a Co70Fe5Ni2Mo5B3Si15 ribbon, which shows the highest SI factor and very low hysteresis of indications. The range useful for application is between 80 and 160 MPa with monotonic and nearly linear characteristics.
Author Contributions
Conceptualization, P.G., M.N. and R.S.; methodology, M.N., P.G.; software, P.G.; validation, P.G.; formal analysis, P.G.; investigation, P.G.; resources, R.S.; data curation, P.G.; writing—original draft preparation, P.G.; writing—review and editing, M.N., R.S.; visualization, P.G.; supervision, R.S.; project administration, M.N.; funding acquisition, R.S.
Funding
This research was funded by the statutory funds of the Institute of Metrology and Biomedical Engineering, Warsaw University of Technology.
Conflicts of Interest
The authors declare no conflicts of interest. The funders had no role in the design of the study, in the collection, analyses, or interpretation of the data, in the writing of the manuscript, or in the decision to publish the results.
References
- Panina, L.V.; Mohri, K.; Bushida, K.; Noda, M. Magneto-impedance effect in amorphous wires. Appl. Phys. Lett. 1994, 65, 1189–1191. [Google Scholar] [CrossRef]
- Beach, R.S.; Berkowitz, A.E. Giant magnetic field dependent impedance of amorphous FeCoSiB wire. Appl. Phys. Lett. 1994, 64, 3652–3654. [Google Scholar] [CrossRef]
- Knobel, M.; Pirota, K.R. Giant magnetoimpedance: Concepts and recent progress. J. Magn. Magn. Mater. 2002, 242, 33–40. [Google Scholar] [CrossRef]
- Shen, L.P.; Uchiyama, T.; Mohri, K.; Kita, E.; Bushida, K. Sensitive Stress-Impedance Micro Sensor Using Amorphous Magnetostrictive Wire. IEEE Trans. Magn. 1997, 33, 3355–3357. [Google Scholar] [CrossRef]
- Kusumoto, D.; Shen, L.P.; Naruse, Y.; Mohri, K.; Uchiyama, T. Detections of Finger-Tip Blood Vessel Pulsation Using CoSiB Thin Amorphous Wire CMOS-IC SI Sensor. IEEE Trans. Magn. 1999, 35, 4115–4117. [Google Scholar] [CrossRef]
- Shen, L.P.; Mohri, K.; Uchiyama, T.; Honkura, Y. Sensitive Acceleration Sensor Using Amorphous Wire SI Element Combined with CMOS IC Multivibrator for Environmental Sensing. IEEE Trans. Magn. 2000, 36, 3667–3669. [Google Scholar] [CrossRef]
- Cobeño, A.F.; Zhukov, A.; Blanco, J.M.; Larin, V.; Gonzalez, J. Magnetoelastic sensor based on GMI of amorphous microwire. Sens. Actuators A 2001, 91, 95–98. [Google Scholar]
- Shin, K.; Inoue, M.; Arai, K. Strain sensitivity of highly magnetostrictive amorphous films for use in microstrain sensors. J. Appl. Phys. 1999, 85, 5465–5467. [Google Scholar] [CrossRef]
- Zhang, W.; Peng, B.; Su, D.; Tang, R.; Jiang, H. Stress impedance effects in flexible amorphous FeCoSiB magnetoelastic films. J. Magn. Magn. Mater. 2008, 320, 1958–1960. [Google Scholar] [CrossRef]
- Rong, P.; Jian, W.; Jian, H. Based on stress-impedance effect exciting signal source of a new amorphous alloy. In Proceedings of the 10th International Conference on Sensing Technology (ICST), Nanjing, China, 11–13 November 2016; pp. 1–4. [Google Scholar]
- Yamadera, H.; Nishibe, Y. Strain-impedance properties of a CoSiB/Cu/CoSiB layered film. J. Appl. Phys. 2000, 87, 5356–5358. [Google Scholar] [CrossRef]
- Mao, X.; Zhou, Y.; Chen, J.; Yu, J.; Cai, B. Giant magnetoimpedance and stress-impedance effects in multilayered FeSiB/Cu/FeSiB films with a meander structure. J. Mater. Res. 2003, 18, 868–871. [Google Scholar] [CrossRef]
- Zhou, Y.; Mao, X.; Chen, J.; Ding, W.; Gao, X.; Zhou, Z. Stress-impedance effects in layered FeSiB/Cu/FeSiB films with a meander line structure. J. Magn. Magn. Mater. 2005, 292, 255–259. [Google Scholar] [CrossRef]
- Zhou, Z.; Cao, Y.; Zhou, Y.; Chen, J.A.; Ding, W. Stress-impedance effects in sandwiched FeCuNbCrSiB/Cu/FeCuNbCrSiB films fabricated by Microelectromechanical Systems technique. J. Mater. Sci. 2007, 42, 2450–2454. [Google Scholar] [CrossRef]
- Peng, B.; Zhang, W.L.; Liu, J.D.; Zhang, W.X. Stress impedance effect of FeCoSiB/Cu/FeCoSiB sandwich layers on flexible substrate. J. Magn. Magn. Mater. 2011, 323, 1574–1576. [Google Scholar] [CrossRef]
- Li, D.R.; Lu, Z.C.; Zhou, S.X. Magnetic anisotropy and stress-impedance effect in Joule heated Fe73.5Cu1Nb3Si13.5B9 ribbons. J. Appl. Phys. 2004, 95, 204–207. [Google Scholar] [CrossRef]
- Ma, G.; Zhu, Z.; Xia, X.; Li, T. Pressure stress-impedance effect in FeCuNbSiB amorphours ribbons. Sci. China Ser. E Technol. Sci. 2009, 52, 2302–2304. [Google Scholar] [CrossRef]
- Sánchez, M.L.; Santos, J.D.; Pérez, M.J.; Olivera, J.; Prida, V.M.; Gorria, P.; Hernando, B. Fe70Cr10B20 metallic glass as a new candidate for nuclei of stress and magnetic field sensors. Sens. Actuators A Phys. 2006, 129, 66–68. [Google Scholar] [CrossRef]
- Li, D.; Lu, Z.; Zhou, S. Giant stress-impedance effect in amorphous and thermally annealed Fe73.5Cu1Nb3Si13.5B9 ribbons. Sens. Actuators A Phys. 2003, 109, 68–71. [Google Scholar] [CrossRef]
- De-Ren, L.; Zhi-Chao, L.; Shao-Xiong, Z.; Jun-Feng, Z.; Hui, L.; Wei, H. Giant stress-impedance effect in amorphous and high-current-density electropulsing annealed Fe73.5Cu1Nb3Si13.5B9 ribbons. Chin. Phys. Lett. 2002, 19, 1000–1001. [Google Scholar] [CrossRef]
- Zhukova, V.; Larin, V.S.; Zhukov, A. Stress induced magnetic anisotropy and giant magnetoimpedance in Fe-rich glass-coated magnetic microwires. J. Appl. Phys. 2003, 94, 1115–1118. [Google Scholar] [CrossRef]
- Blanco, J.M.; Zhukov, A.P.; Gonzalez, J. Torsional stress impedance and magneto-impedance in (Co0.95Fe0.05)72.5Si12.5B15 amorphous wire with helical induced anisotropy. J. Phys. D Appl. Phys. 1999, 32, 3140–3145. [Google Scholar] [CrossRef]
- Qin, F.; Peng, H.X.; Popov, V.V.; Phan, M.H. Optimization of magnetoimpedance and stress-impedance effects in single-microwire polymer composites for stress monitoring. In Behavior and Mechanics of Multifunctional Materials and Composites; International Society for Optics and Photonics: Washington, DC, USA, 2011; Volume 7978, p. 79780Z. [Google Scholar]
- Bieńkowski, A. Magnetoelastic Villari effect in Mn–Zn ferrites. J. Magn. Magn. Mater. 2000, 215, 231–233. [Google Scholar] [CrossRef]
- Villari, E. Ueber die aenderungen des magnetischen moments, welche der zug und das hindurchleiten eines galvanischen stroms in einem stabe von stahl oder eisen hervorbringen (About the changes of the magnetic moment produced by the pulling and passing of a galvanic current in a rod of steel or iron). Ann. Phys. 1865, 202, 87–122. (In German) [Google Scholar]
- Bydzovsky, J.; Kollár, M.; Svec, P.; Kraus, L.; Jancárik, V. Magnetoelastic Properties of CoFeCrSiB Amorphous Ribbons-a Possibility of their Application. J. Electr. Eng. Bratisl. 2001, 52, 205–209. [Google Scholar]
- SA1 Amorphous Alloy Datasheet. Available online: https://metglas.com/wp-content/uploads/2016/12/Amorphous-Alloys-for-Transformer-Cores-.pdf (accessed on 2 December 2018).
- 2826MB Amorphous Alloy Datasheet. Available online: https://metglas.com/wp-content/uploads/2016/12/2826MB-Technical-Bulletin.pdf (accessed on 2 December 2018).
- 2705M Amorphous Alloy Datasheet. Available online: https://metglas.com/wp-content/uploads/2016/12/2705M-Technical-Bulletin.pdf (accessed on 2 December 2018).
- Vacumschmelze GmbH & Co. KG Manufacturer. 6030 D30 Amorphous Alloy Datasheet; Vacumschmelze GmbH & Co. KG Manufacturer: Hanau, Germany, 2013; unpublished. [Google Scholar]
- Local Gravity Calculator. Available online: https://www.sensorsone.com/local-gravity-calculator/#latitude (accessed on 2 December 2018).
- Phan, M.; Peng, H. Giant Magnetoimpedance Materials: Fundamentals and Applications. Prog. Mater. Sci. 2008, 53, 323–420. [Google Scholar] [CrossRef]
- Jiles, D.C. Introduction to Magnetism and Magnetic Materials; CRC Press: Boca Raton, FL, USA, 2015. [Google Scholar]
- Sablik, M.J.; Kwun, H.; Burkhardt, G.L.; Jiles, D.C. Model for the effect of tensile and compressive stress on ferromagnetic hysteresis. J. Appl. Phys. 1987, 61, 3799–3801. [Google Scholar] [CrossRef]
- Bieńkowski, A.; Kulikowski, J. Effect of stresses on the magnetostriction of Ni-Zn (Co) ferrites. J. Magn. Magn. Mater. 1991, 101, 122–124. [Google Scholar] [CrossRef]
- Kaczkowski, Z.; Bieńkowski, A.; Szewczyk, R. Compressive Stress Dependence of Magnetic Properties of Co66Fe4Ni1B14Si15 Alloy. Czechoslov. J. Phys. 2002, 52, 183–186. [Google Scholar] [CrossRef]
- Szewczyk, R.; Bienkowski, A.; Kolano, R. Influence of nanocrystalization on magnetoelastic Villari effect in Fe73. 5Nb3Cu1Si13. 5B9 alloy. Cryst. Res. Technol. J. Exp. Ind. Crystallogr. 2003, 38, 320–324. [Google Scholar] [CrossRef]
© 2019 by the authors. Licensee MDPI, Basel, Switzerland. This article is an open access article distributed under the terms and conditions of the Creative Commons Attribution (CC BY) license (http://creativecommons.org/licenses/by/4.0/).


