Sequestration of Pb(II) Ions from Aqueous Systems with Novel Green Bacterial Cellulose Graphene Oxide Composite

Abstract
1. Introduction
2. Materials and Experiments
2.1. Chemicals and Reagents
2.2. Synthesis of Pure BC
2.3. Synthesis of GO
2.4. Synthesis of BC/GO Membranes
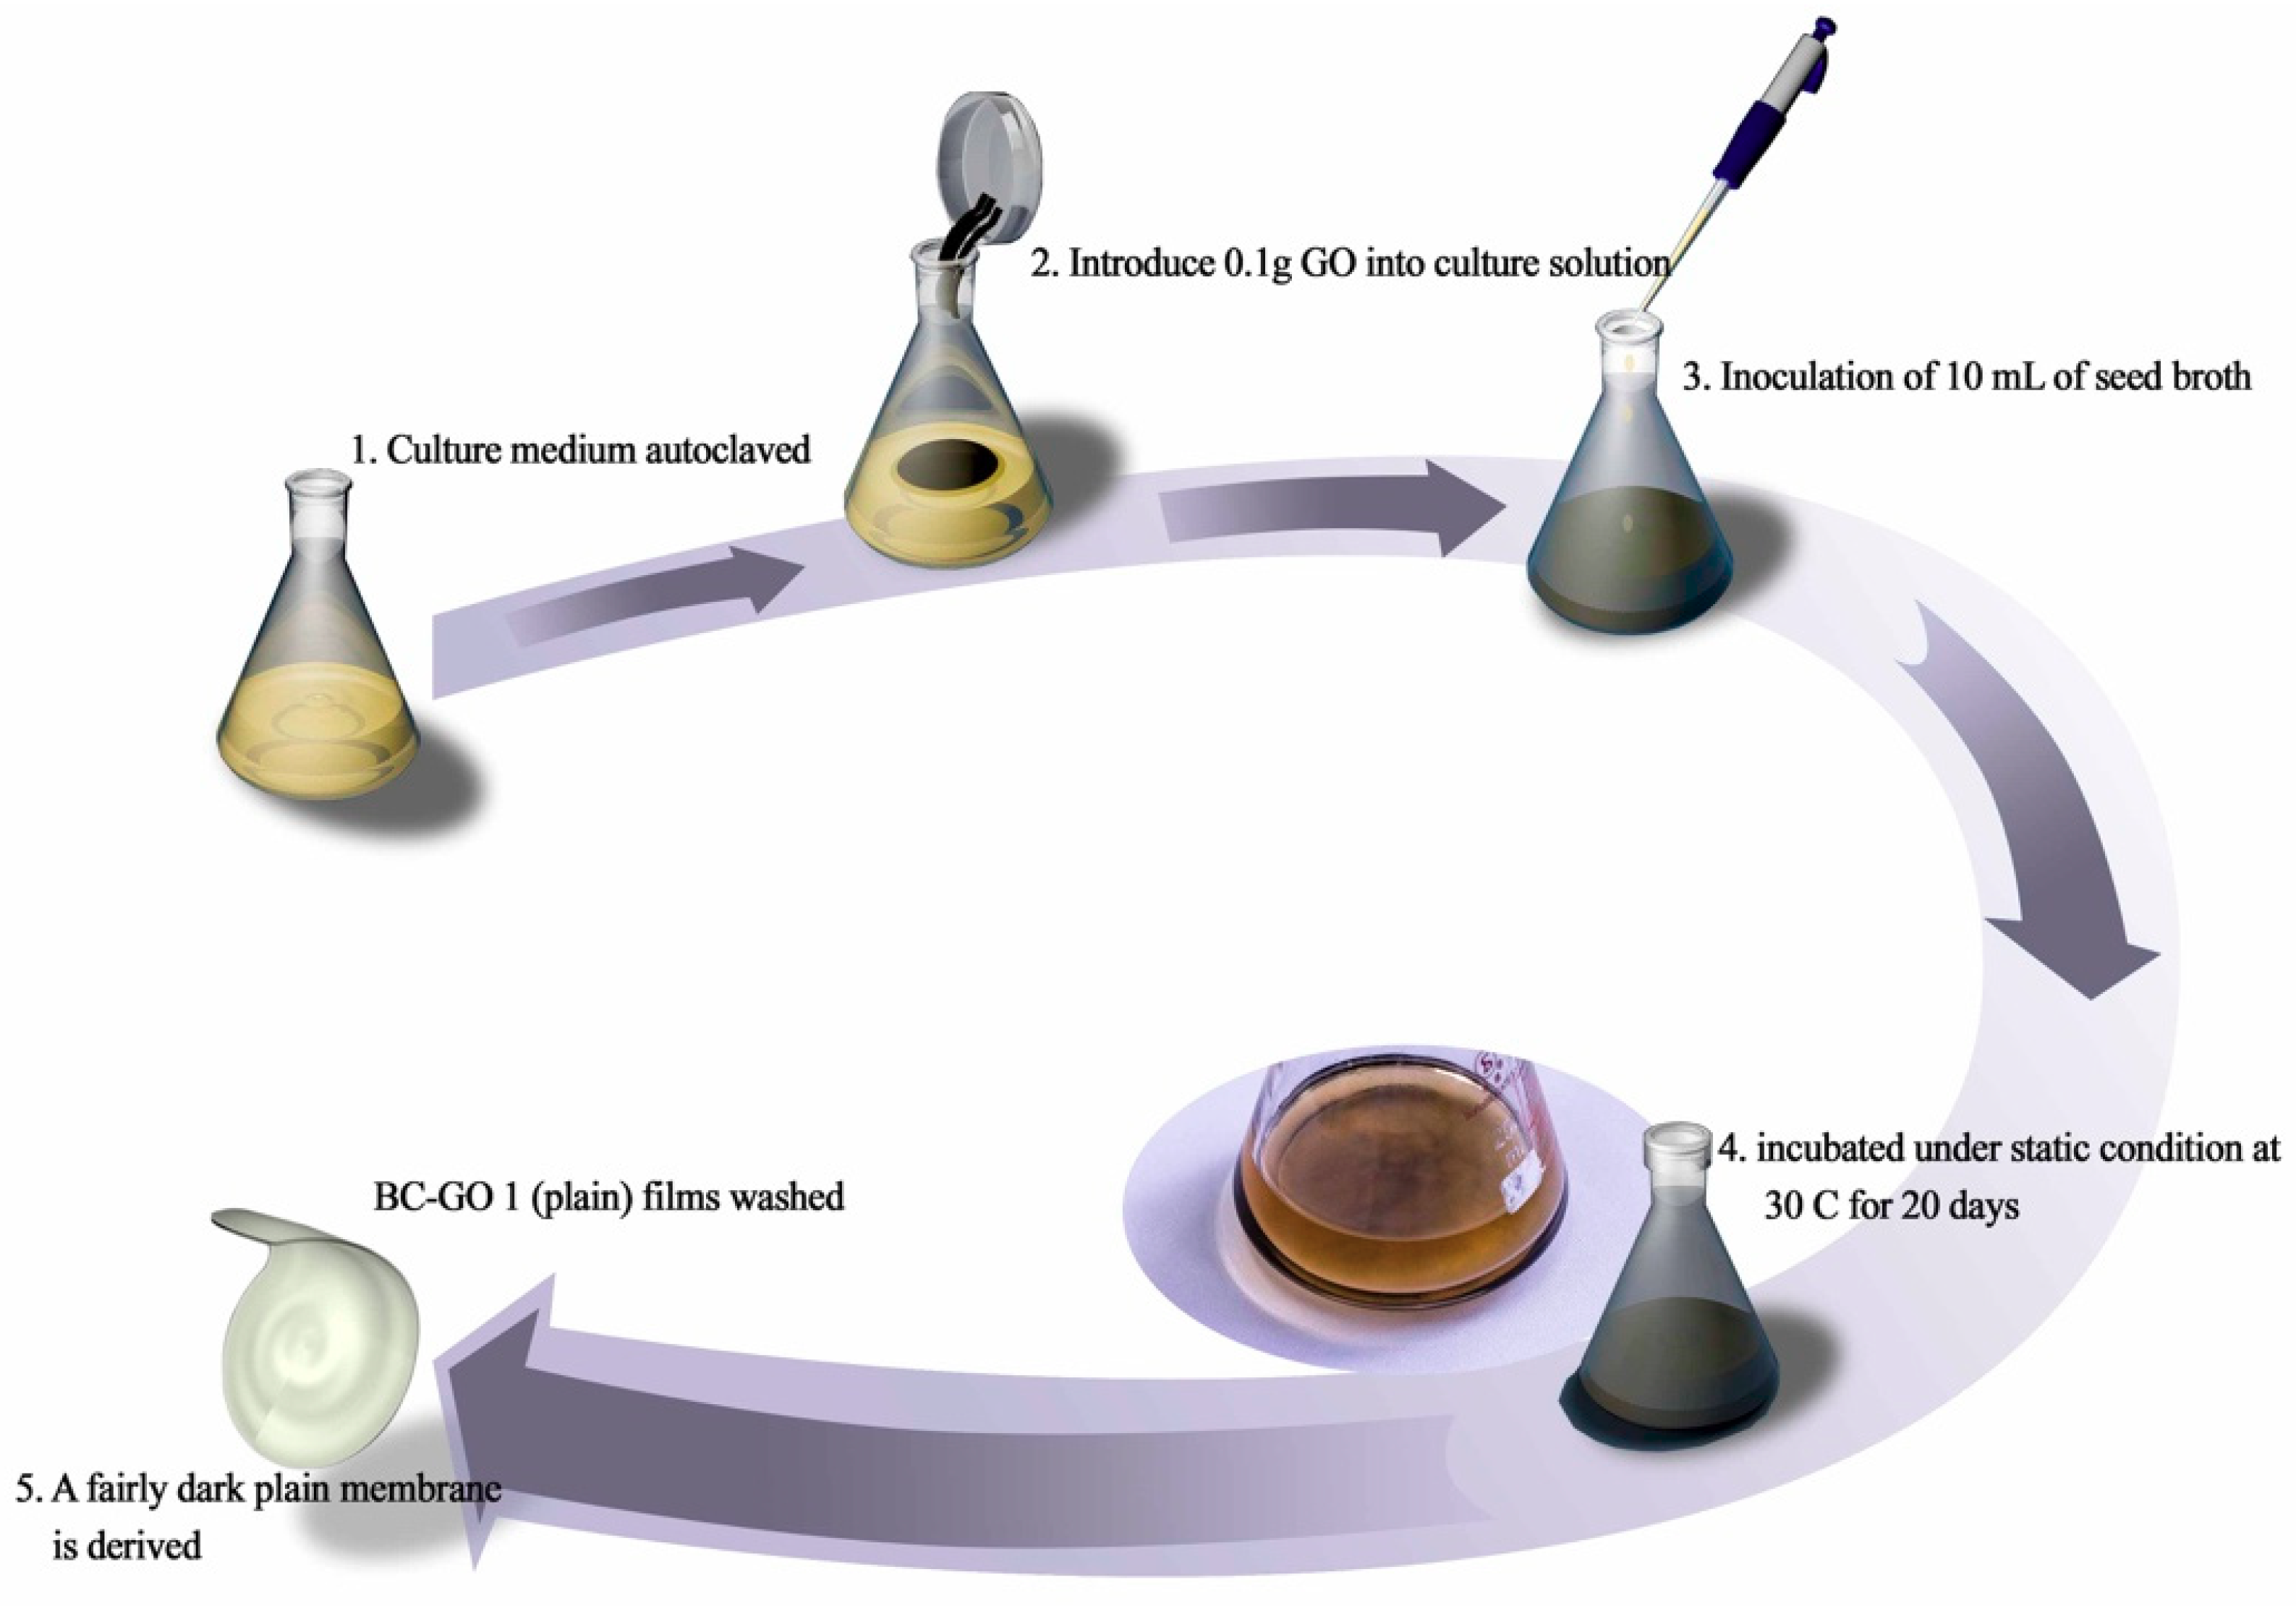
2.4.1. BC/GO 1 (Plain)
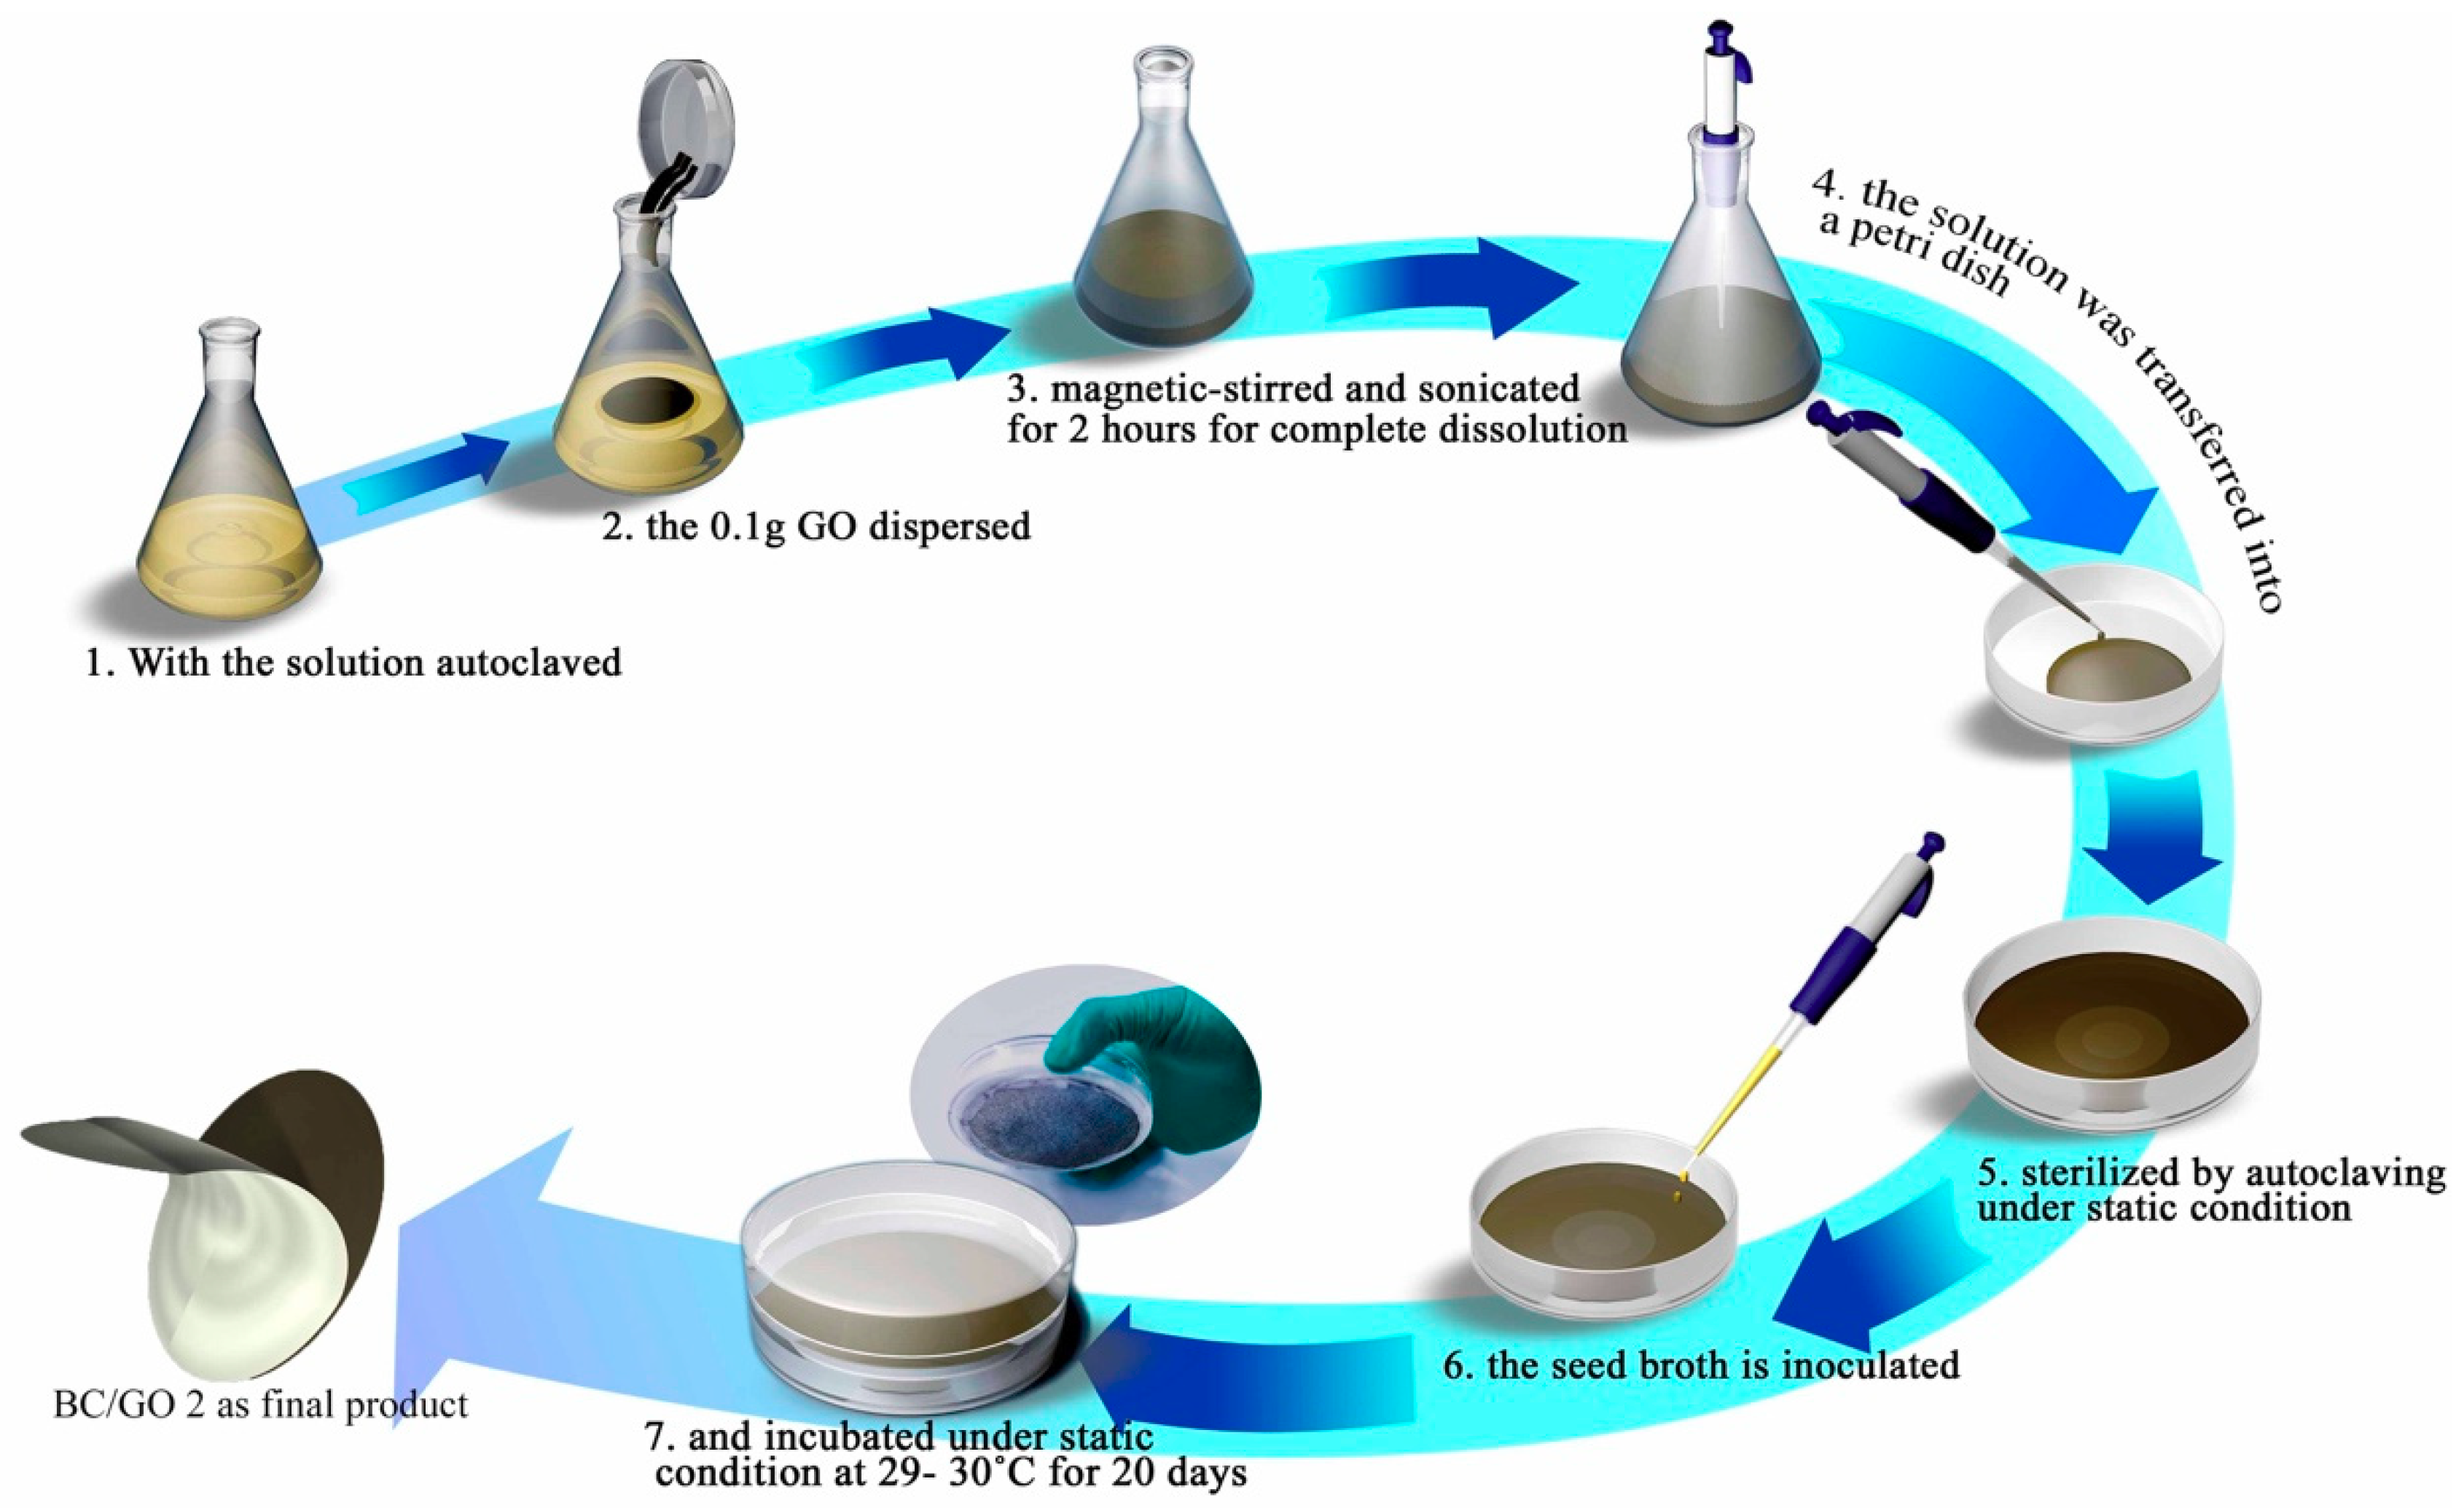
2.4.2. BC/GO 2
2.5. Characterisation
2.5.1. Fourier Transform Infrared (FTIR) Spectroscopy
2.5.2. Scanning Electron Microscopy (SEM)
2.5.3. Thermogravimetric Analysis (TGA)
2.5.4. X-ray Diffraction (XRD)
2.5.5. Specific Surface Area and Pore Size Distribution
2.6. Adsorption Experimental Studies
2.6.1. Effect of Initial Metal Ions Concentration on the Adsorption
2.6.2. Effect of pH on the Adsorption
2.6.3. Effect of Contact Time on the Adsorption
2.6.4. Effect of Absorbent Dosage on the Adsorption
2.6.5. Adsorption Isotherms
2.6.6. Adsorption Kinetics Studies
2.6.7. Desorption Experiments
3. Results and Discussion
3.1. Characterisation of Adsorbents
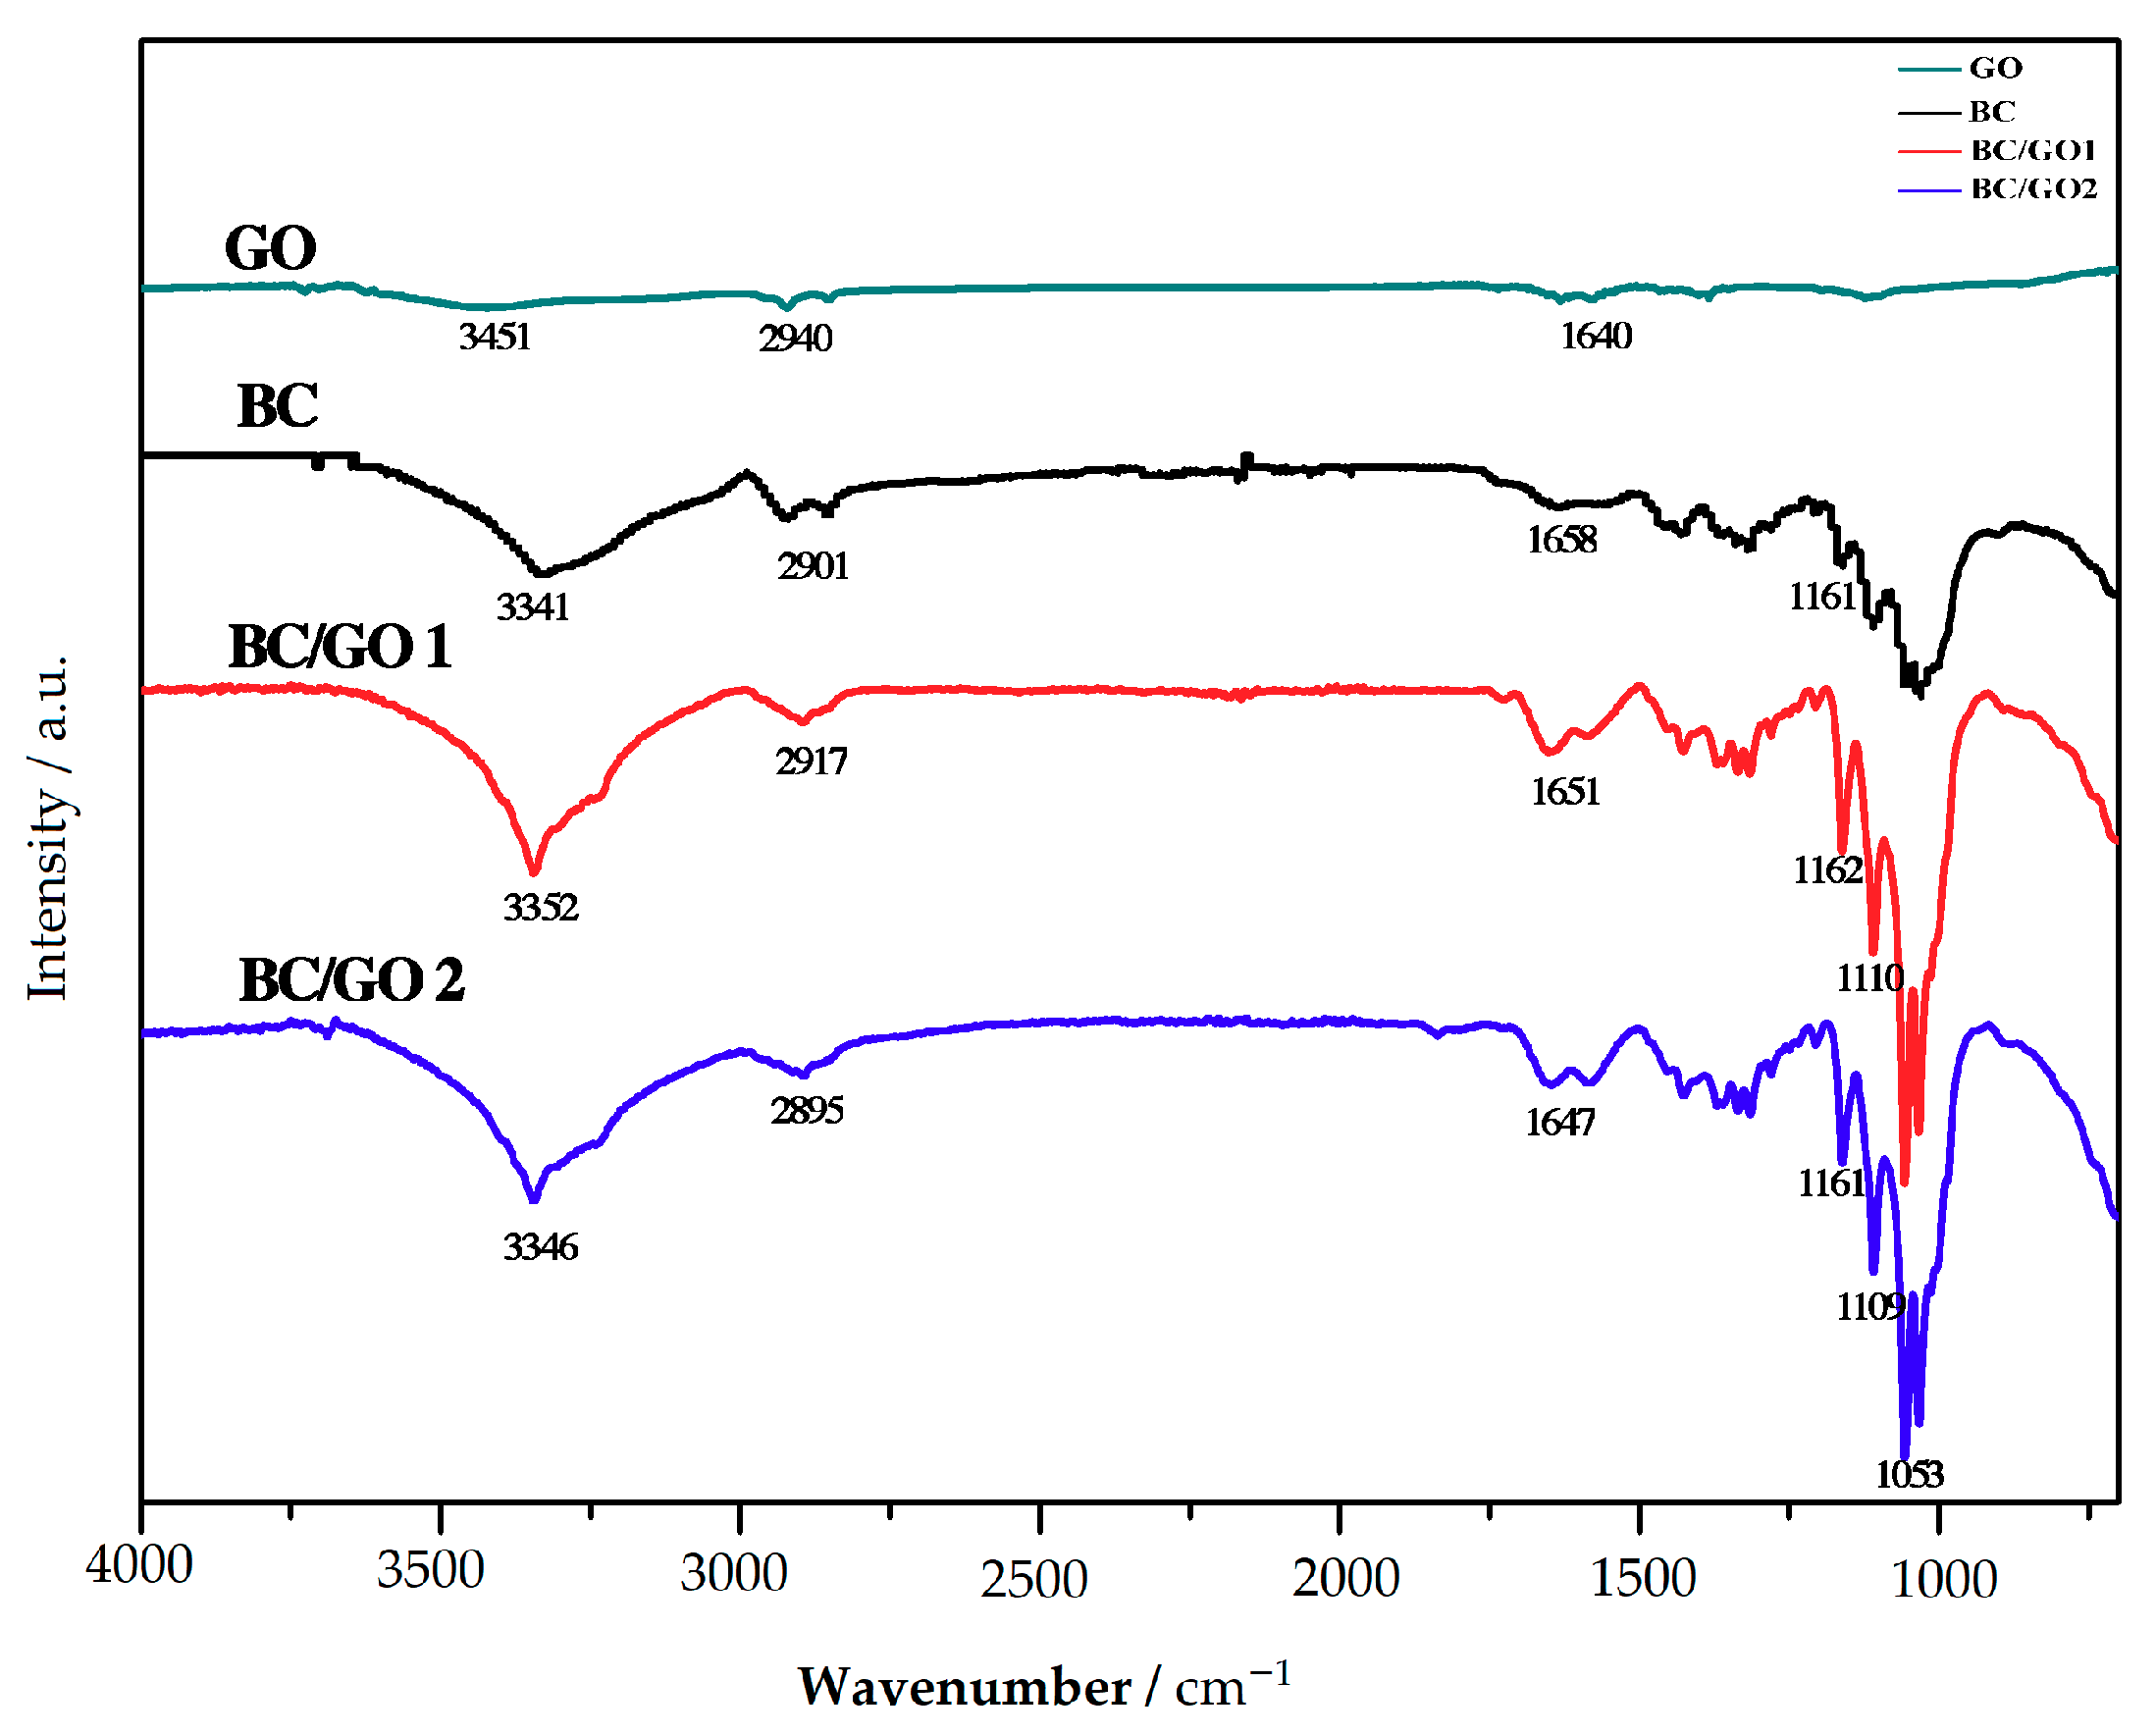
3.1.1. FTIR Analysis
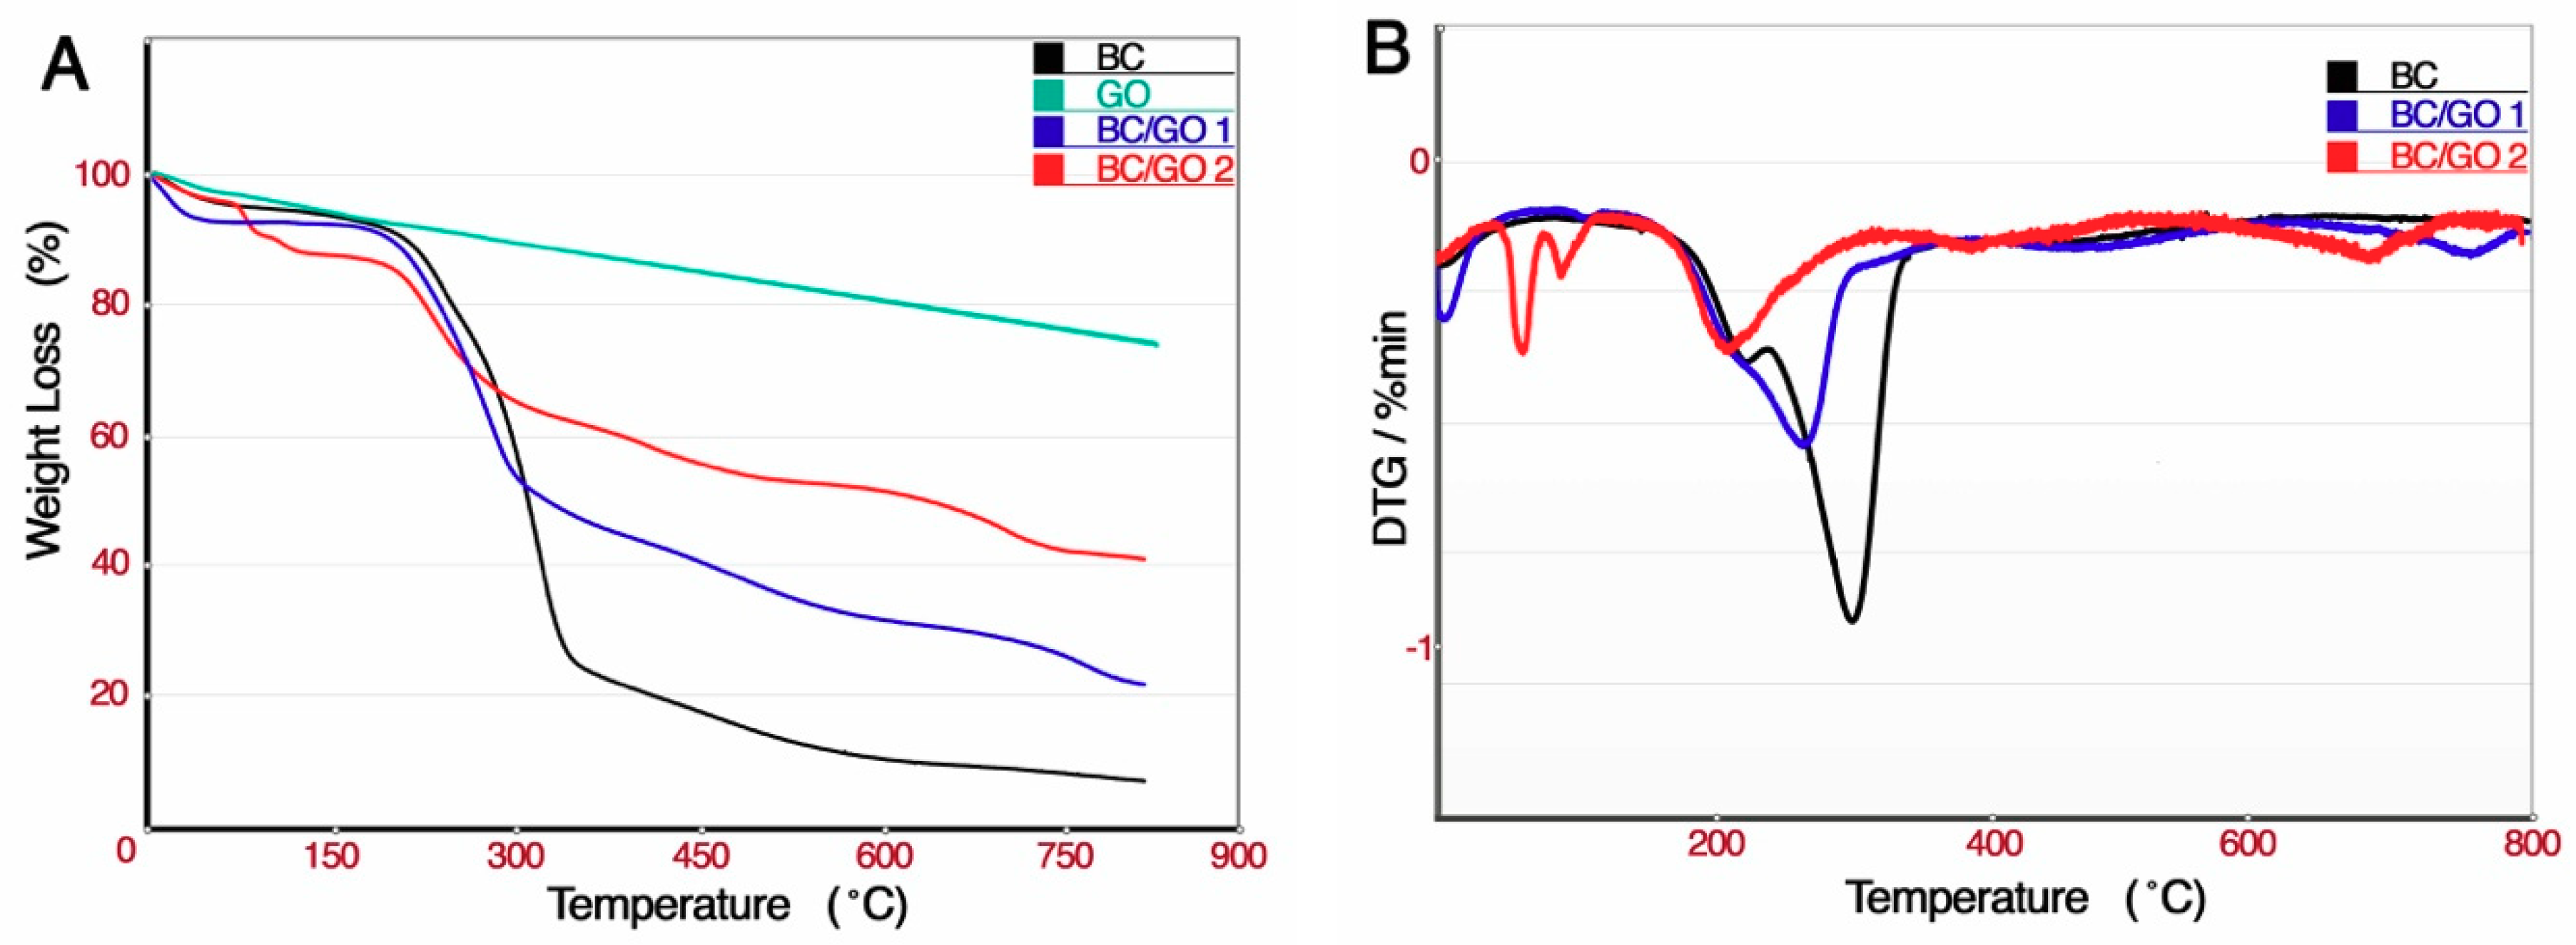
3.1.2. TGA Analysis
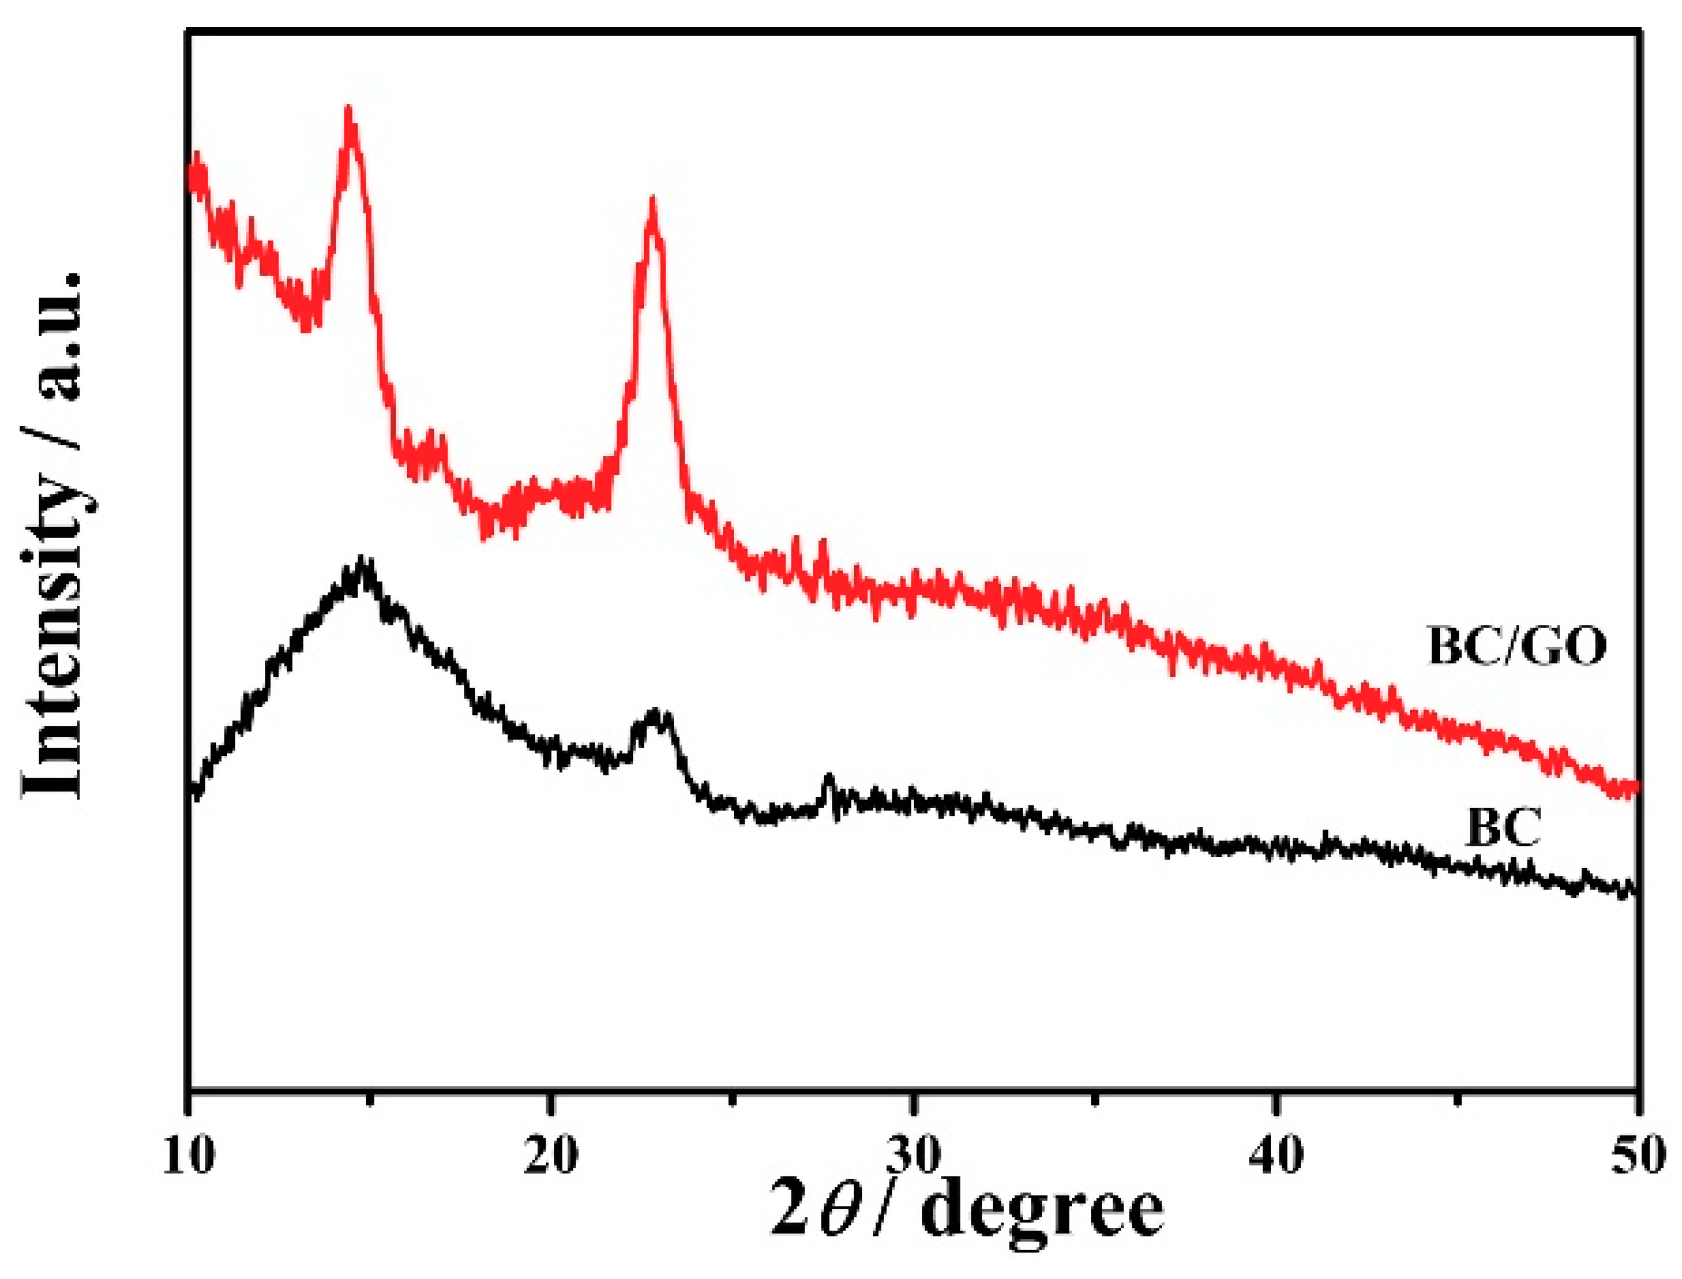
3.1.3. XRD Analysis
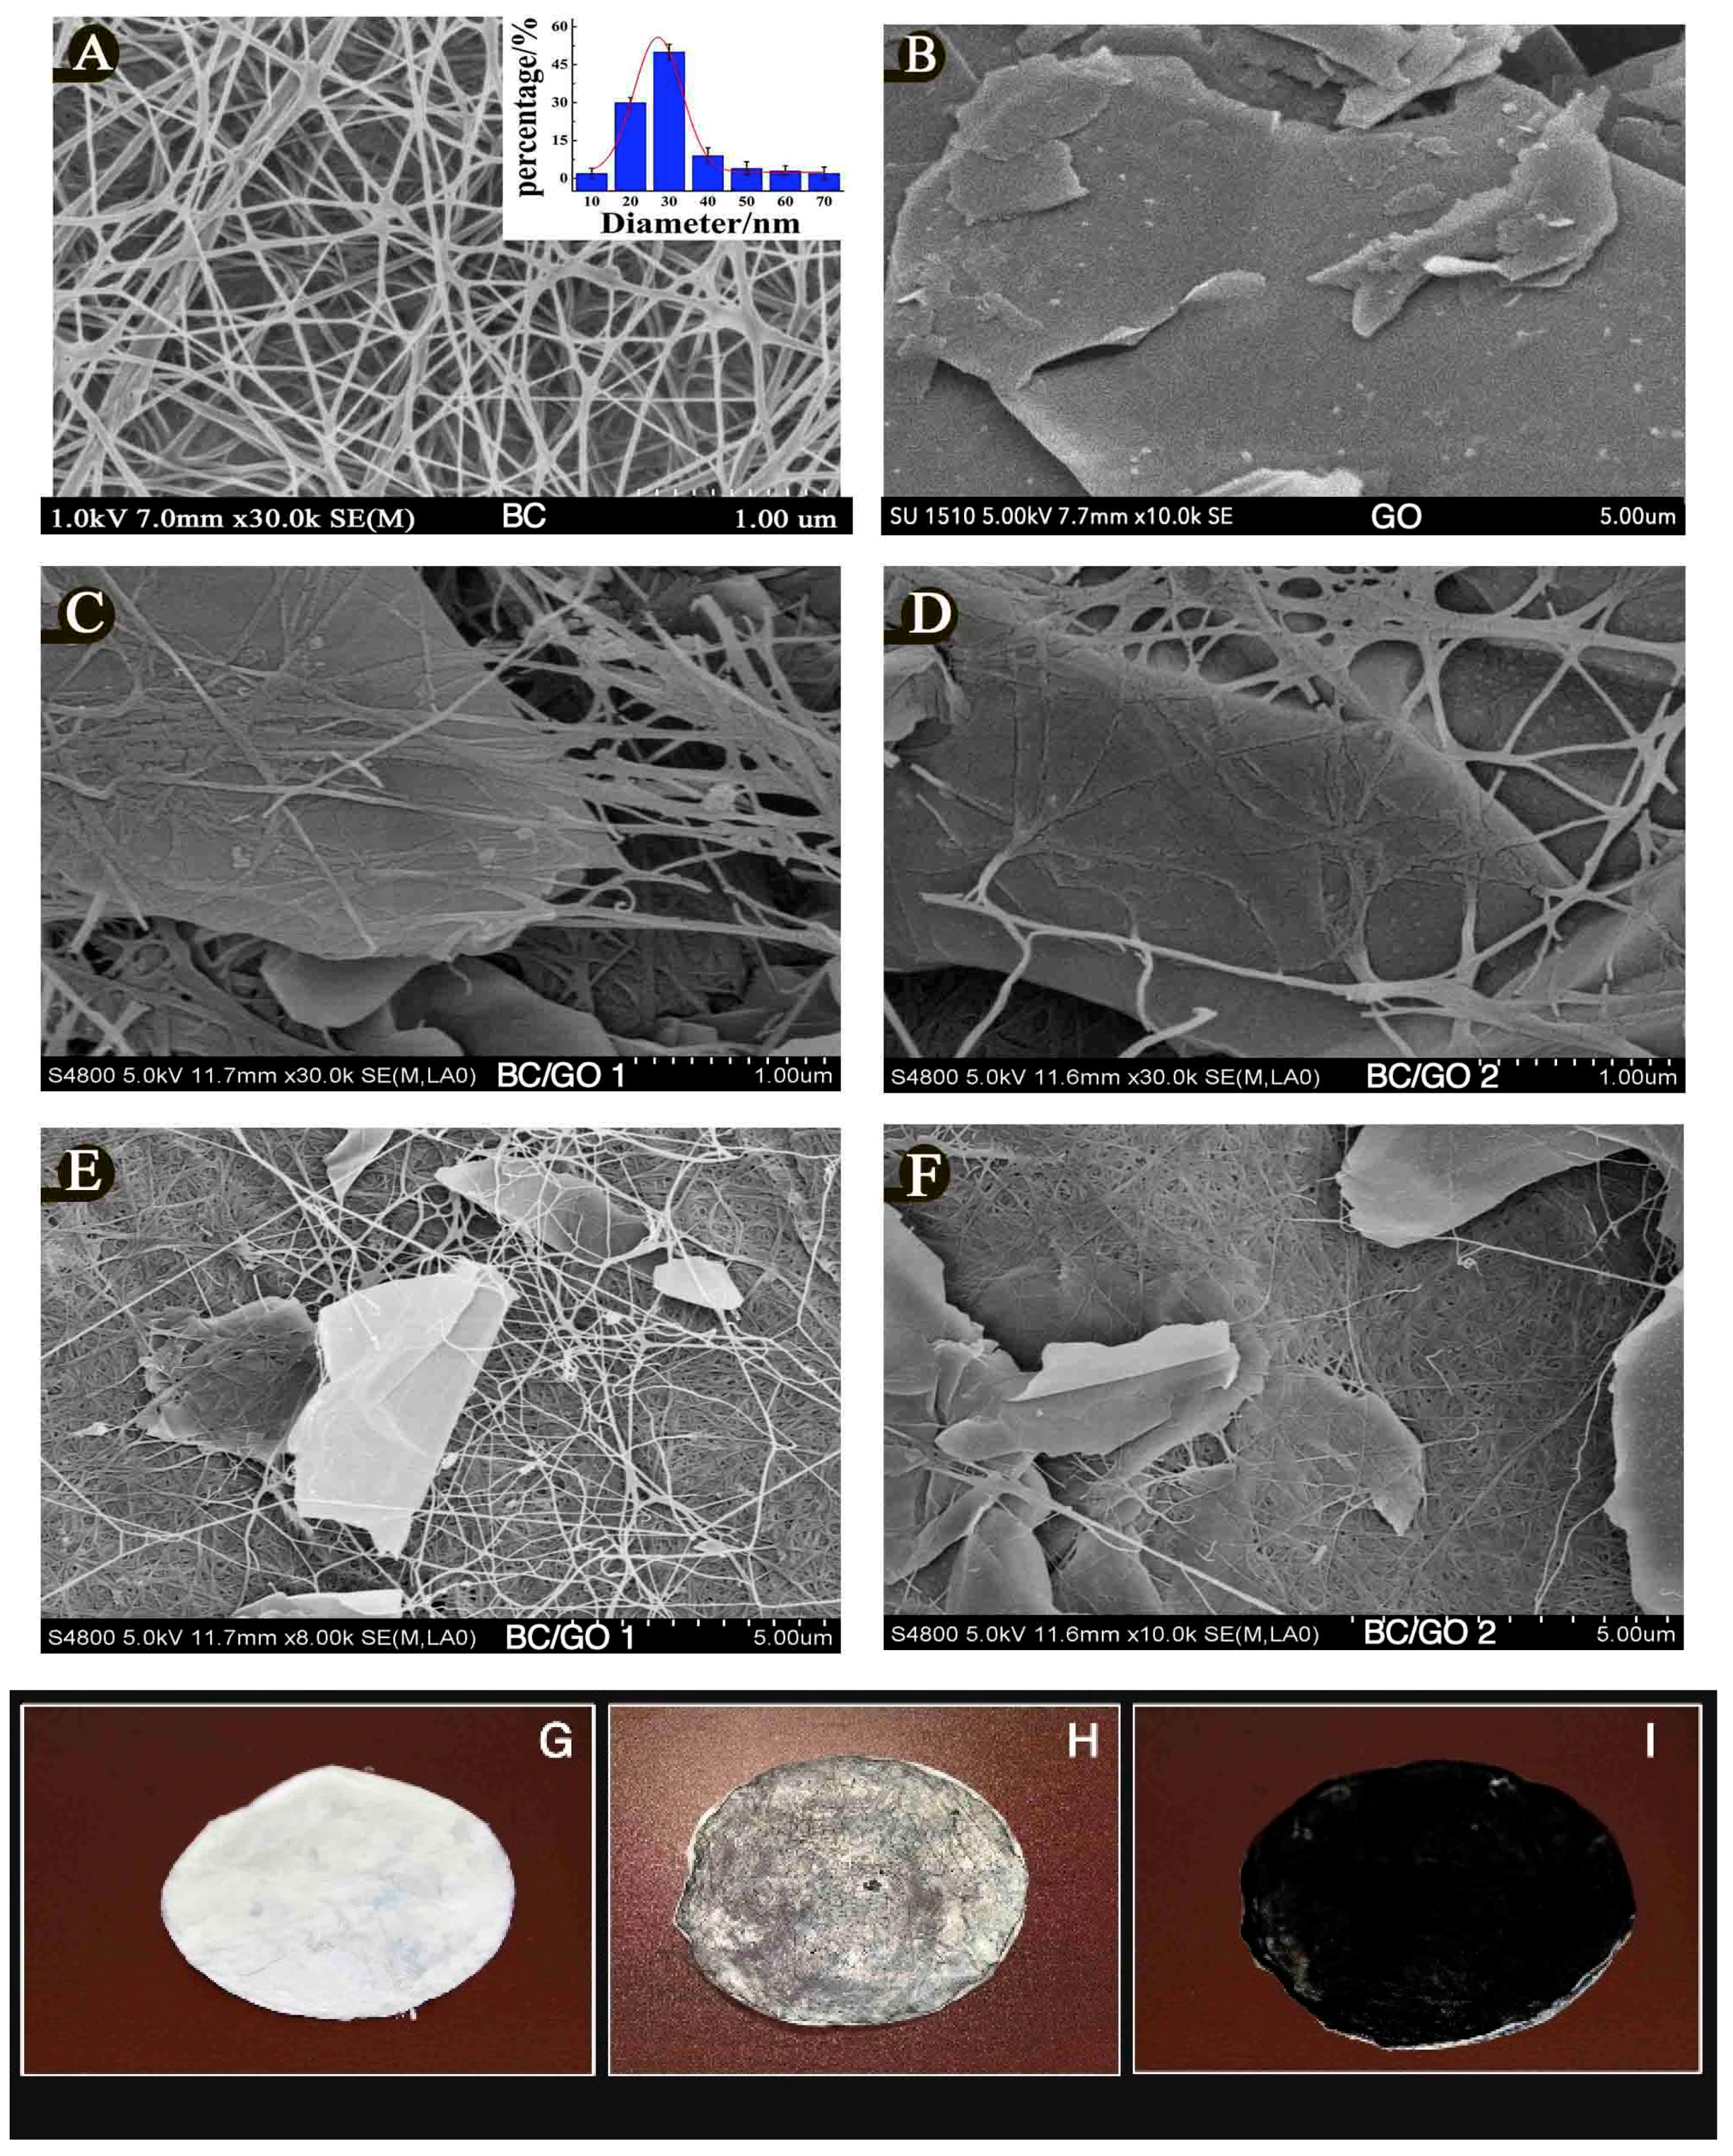
3.1.4. SEM Analysis
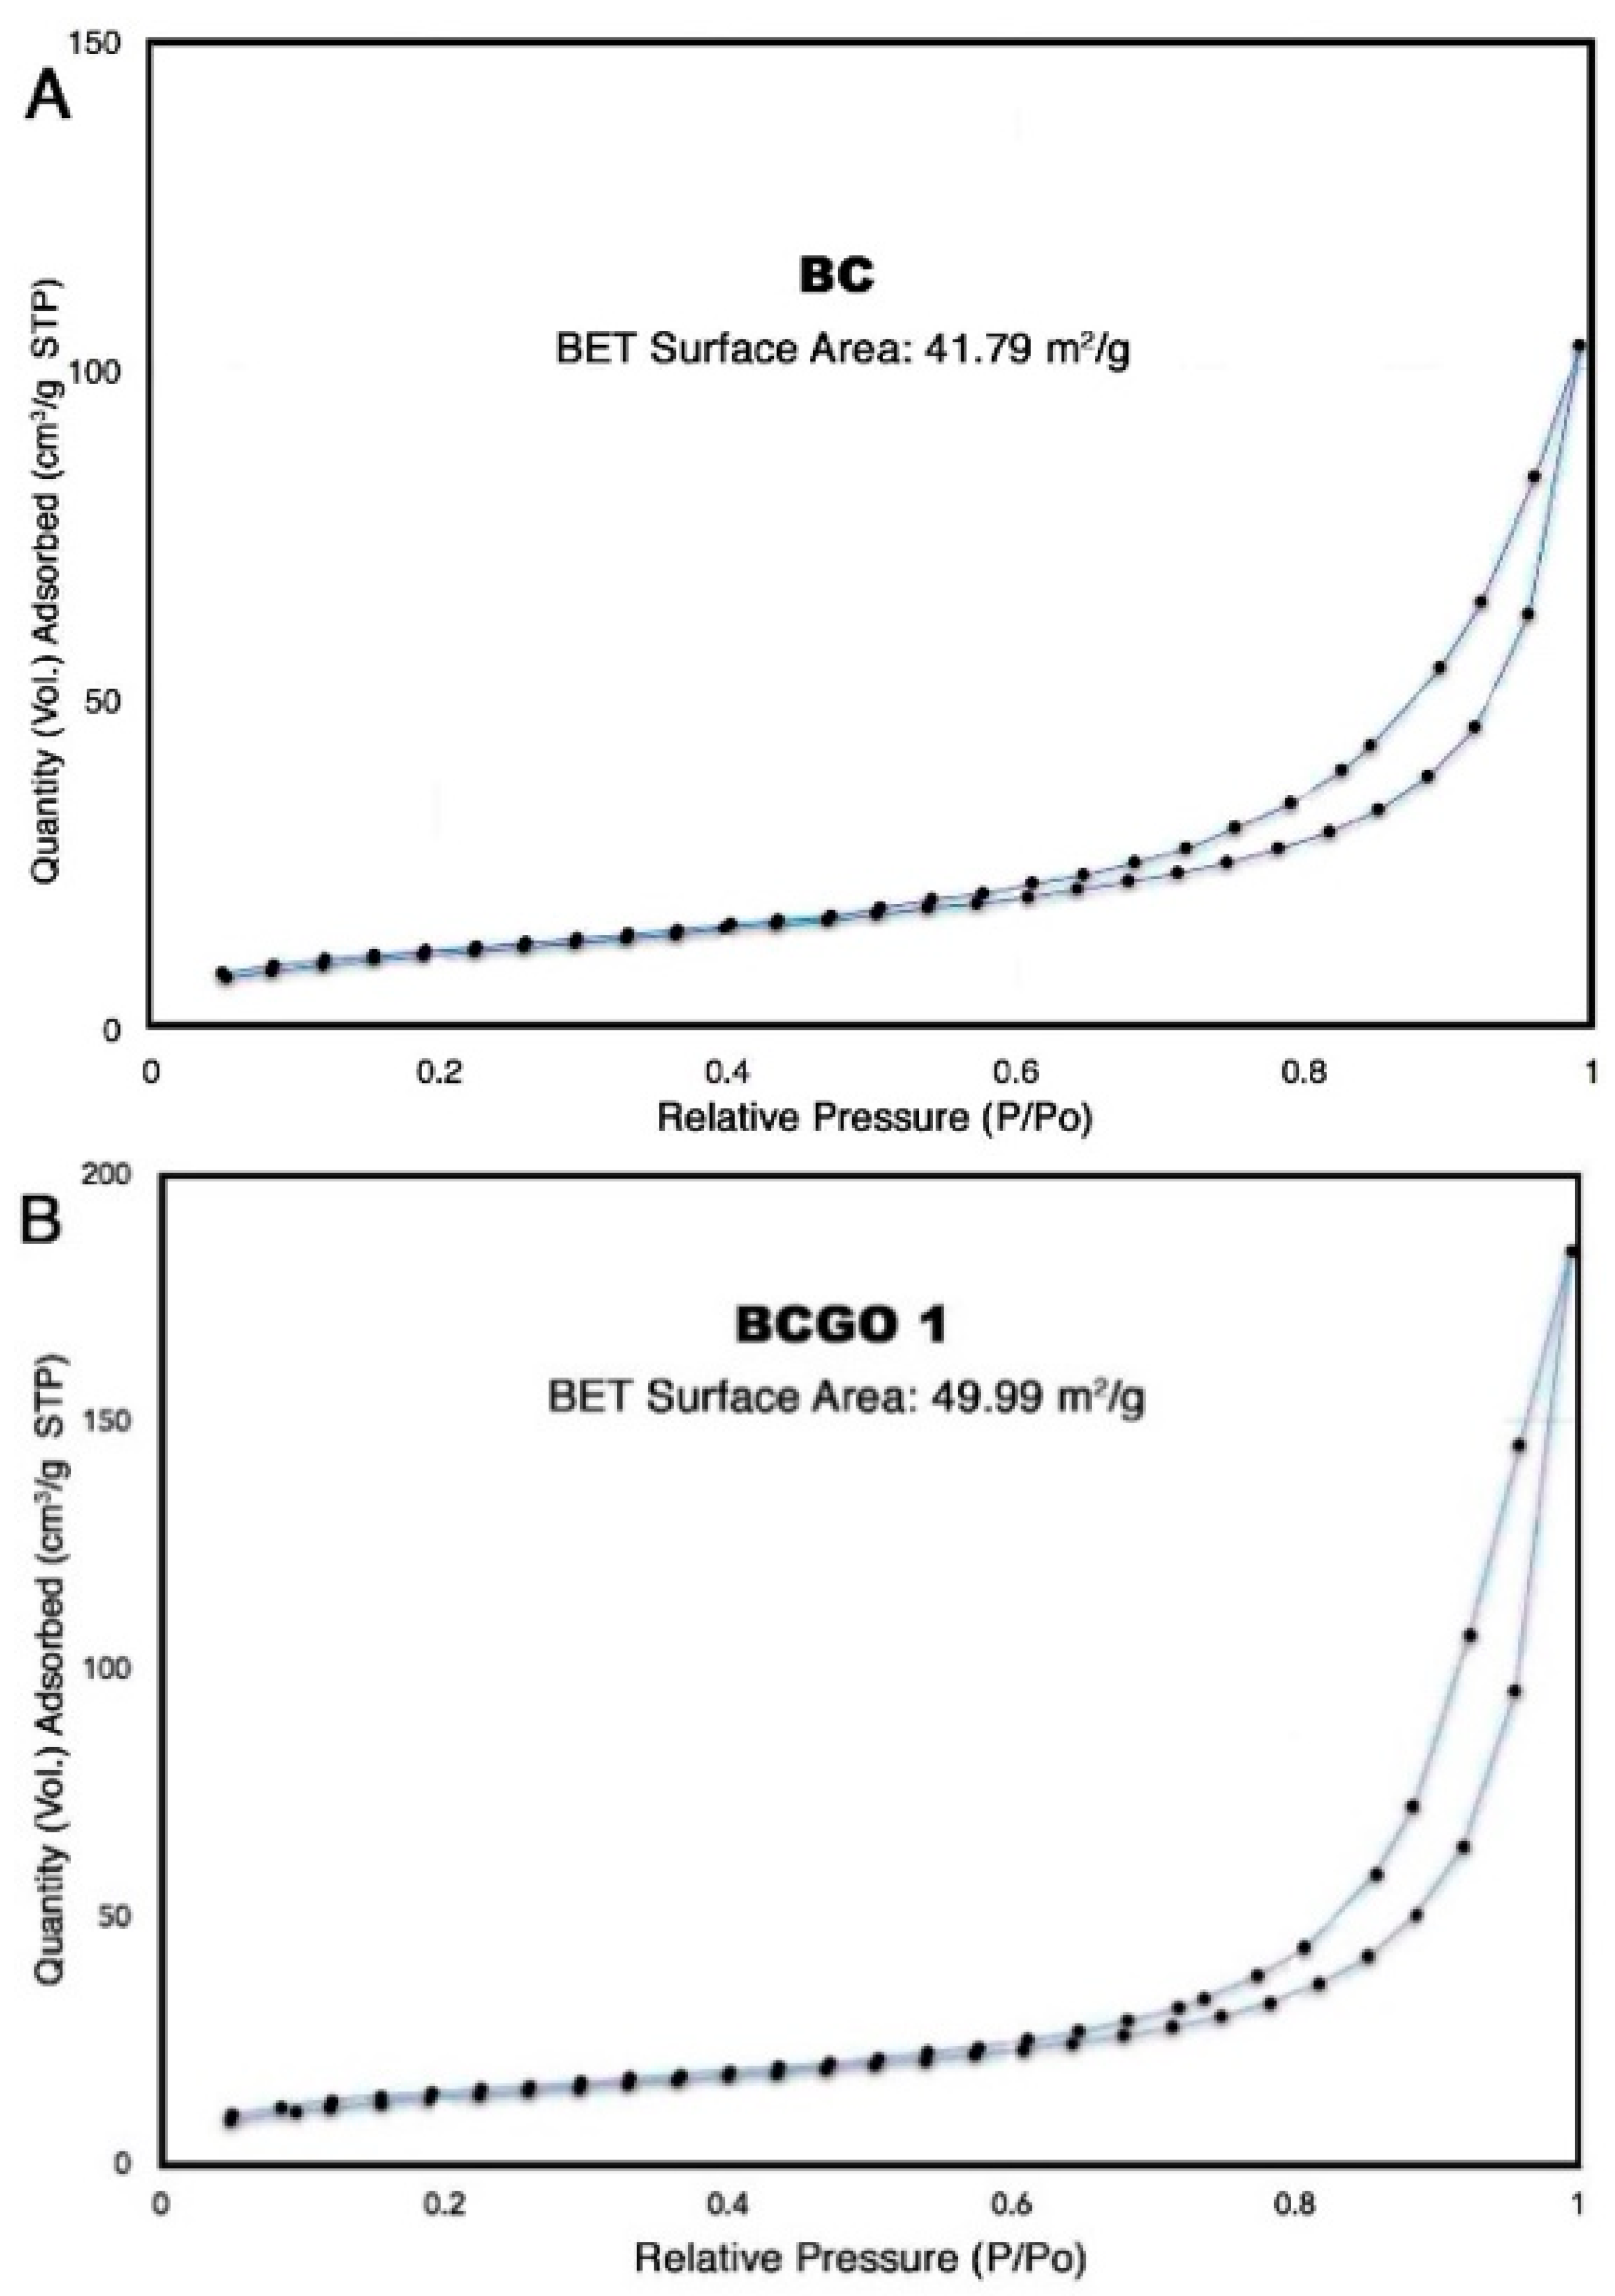
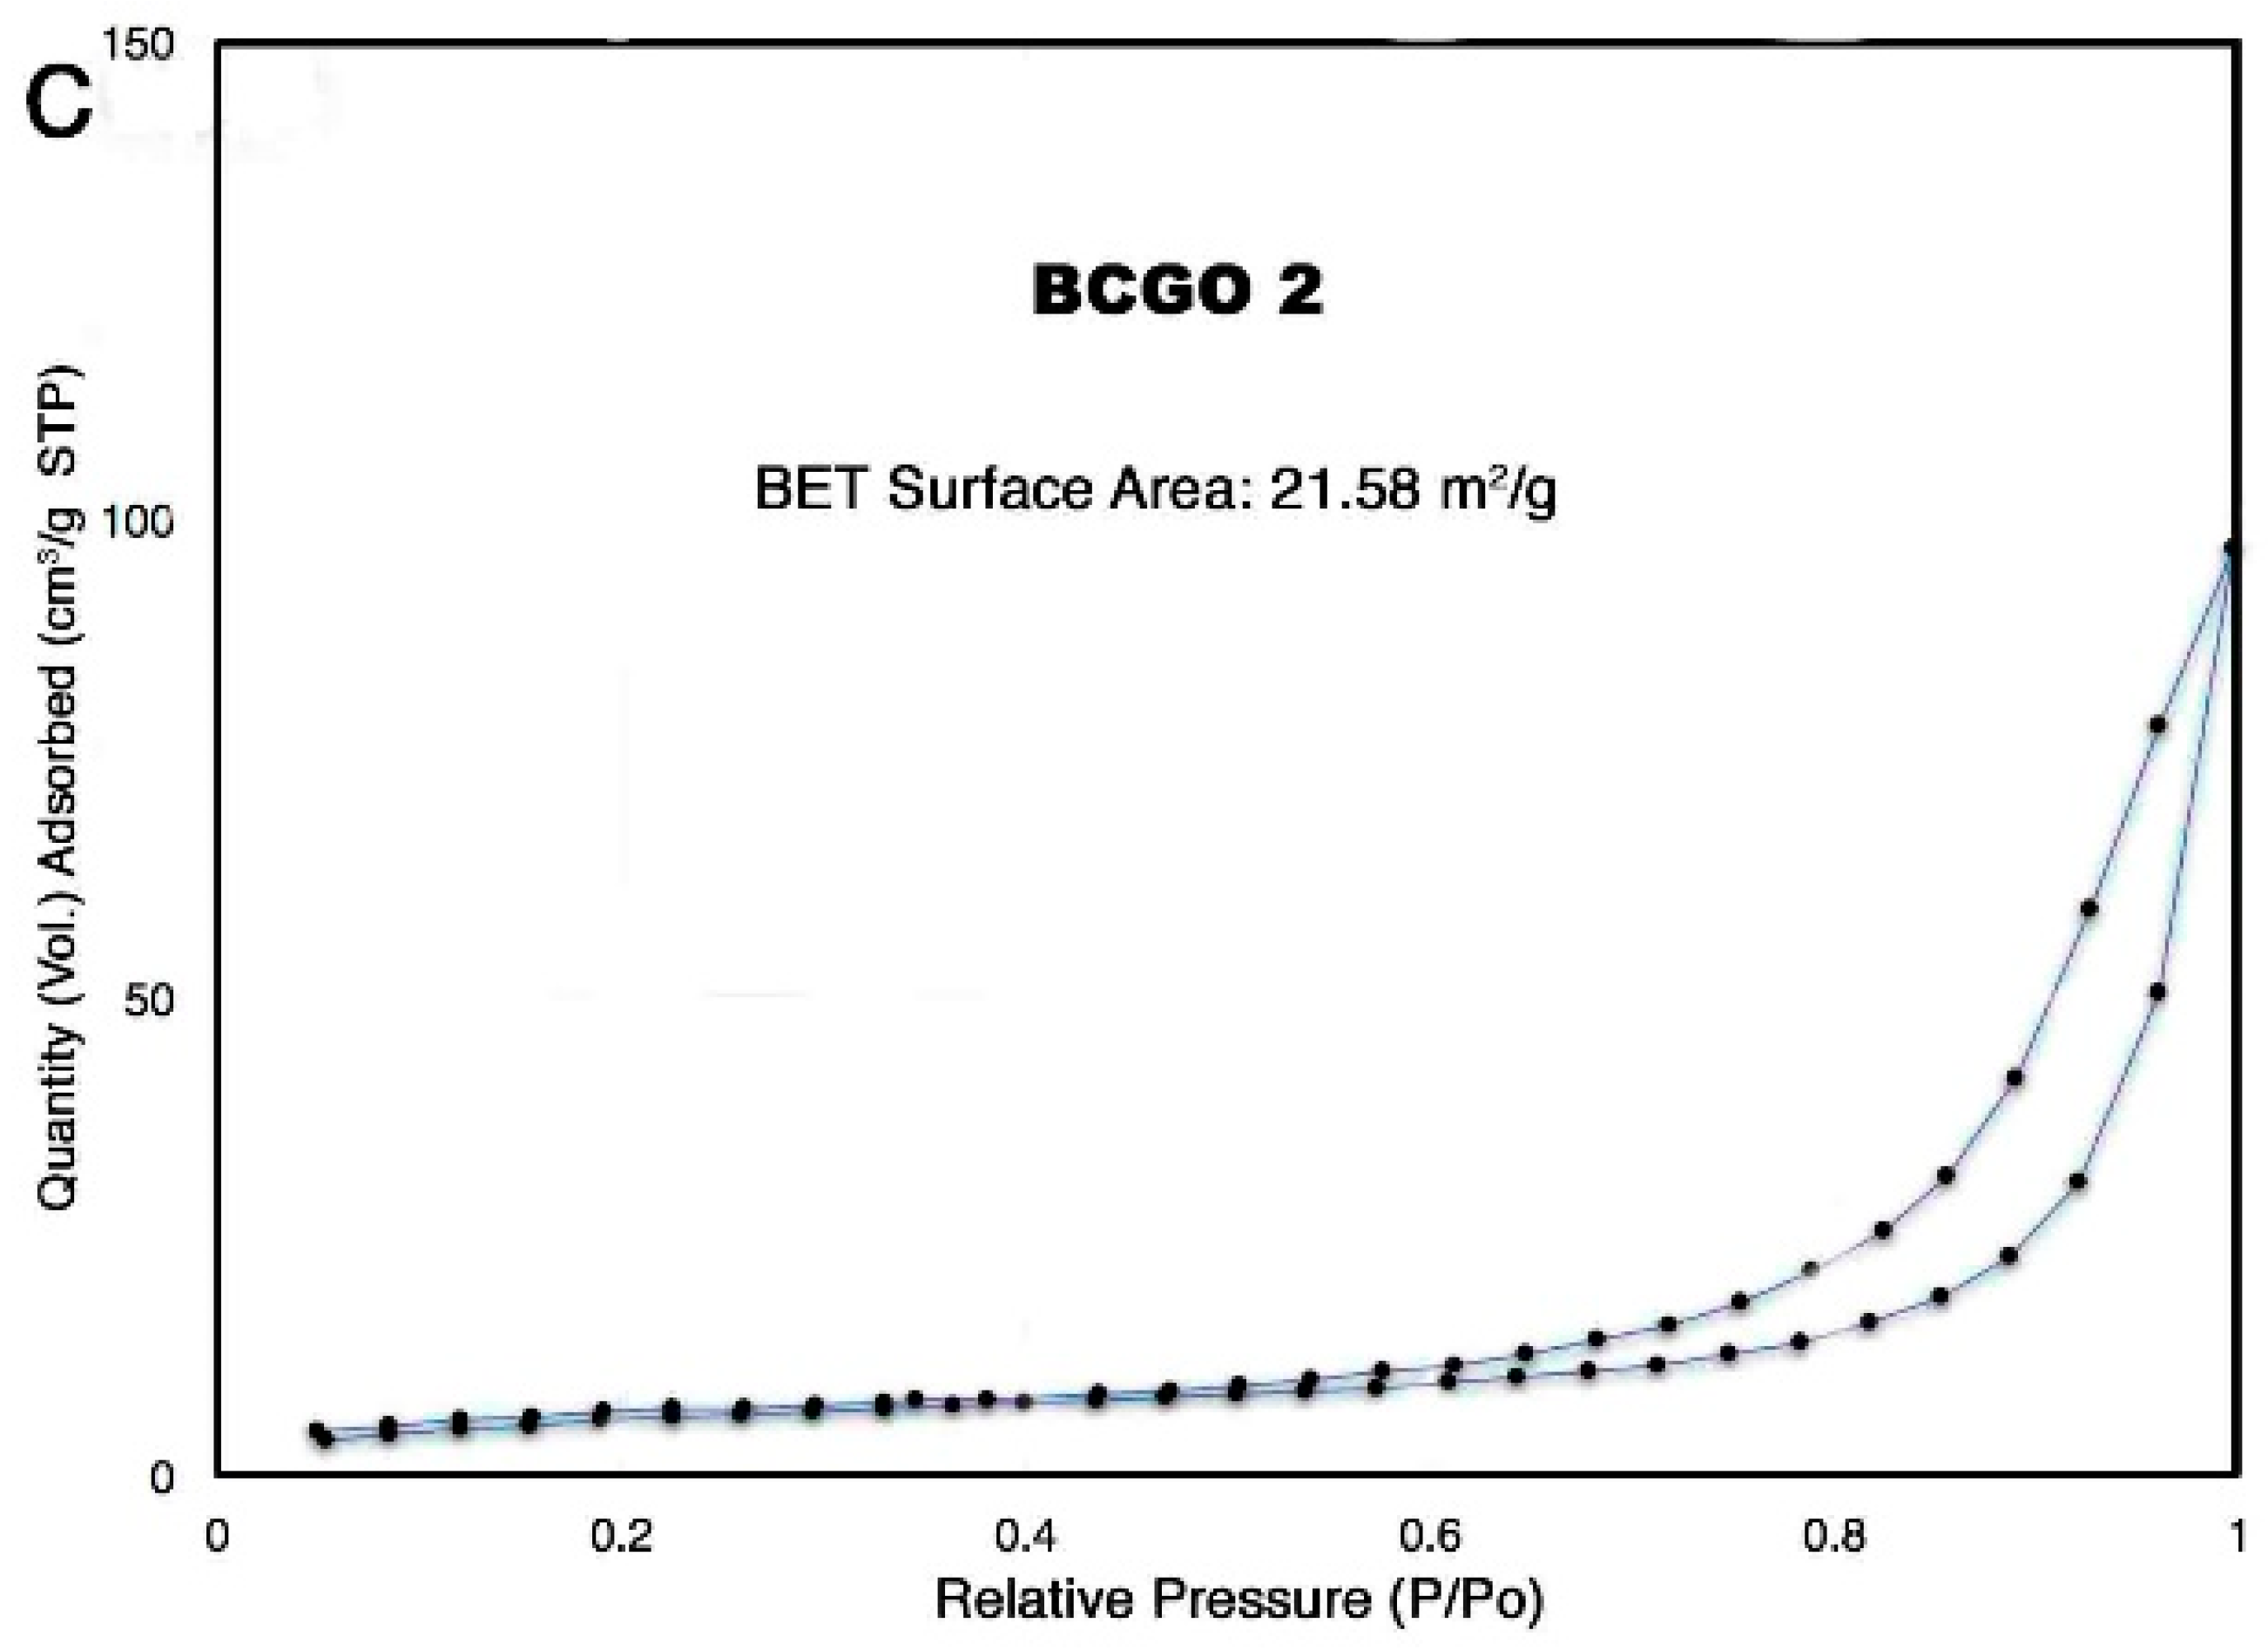
3.1.5. Analysis of Specific Surface Area (SSA) and Pore Size Distribution (PSD) of BC/GO Adsorbent
3.2. Adsorption Experiments
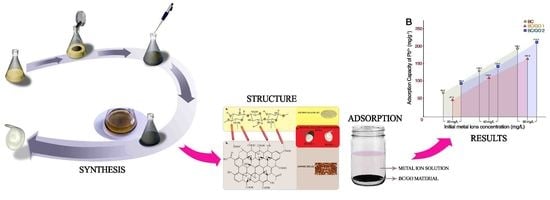
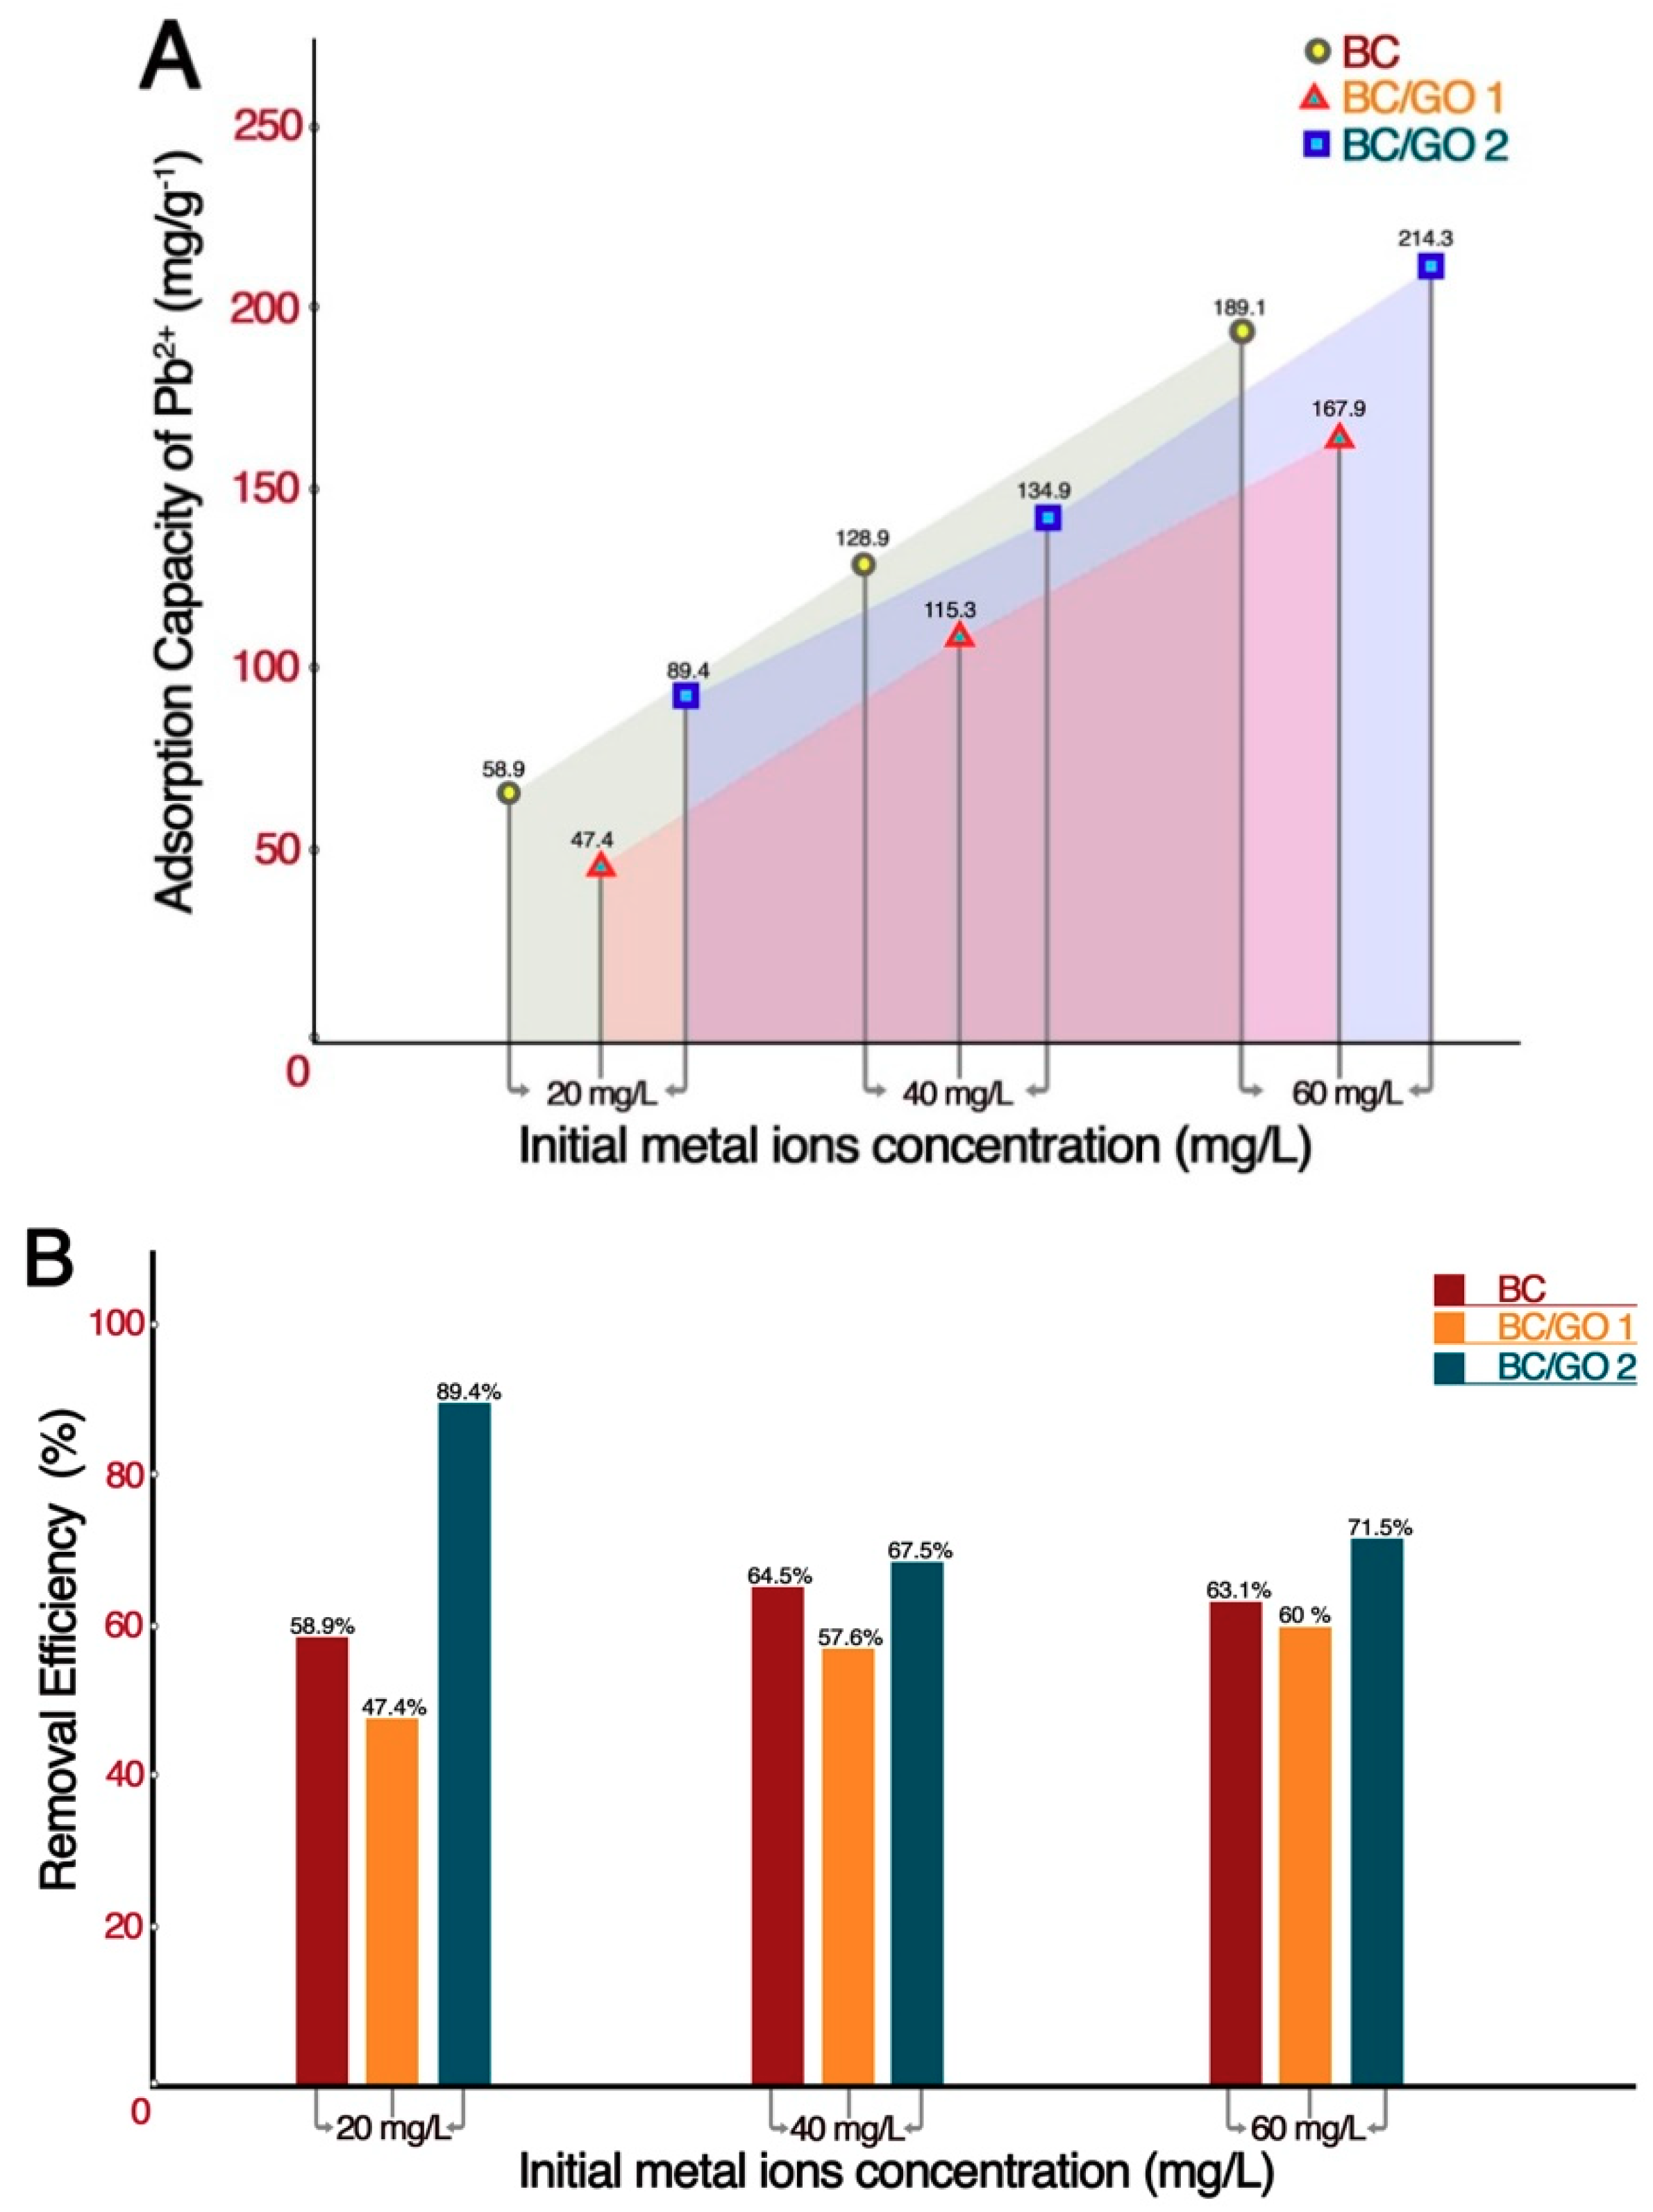
3.2.1. Effect of Initial Metal Ions Concentration on Metal Ion Removal
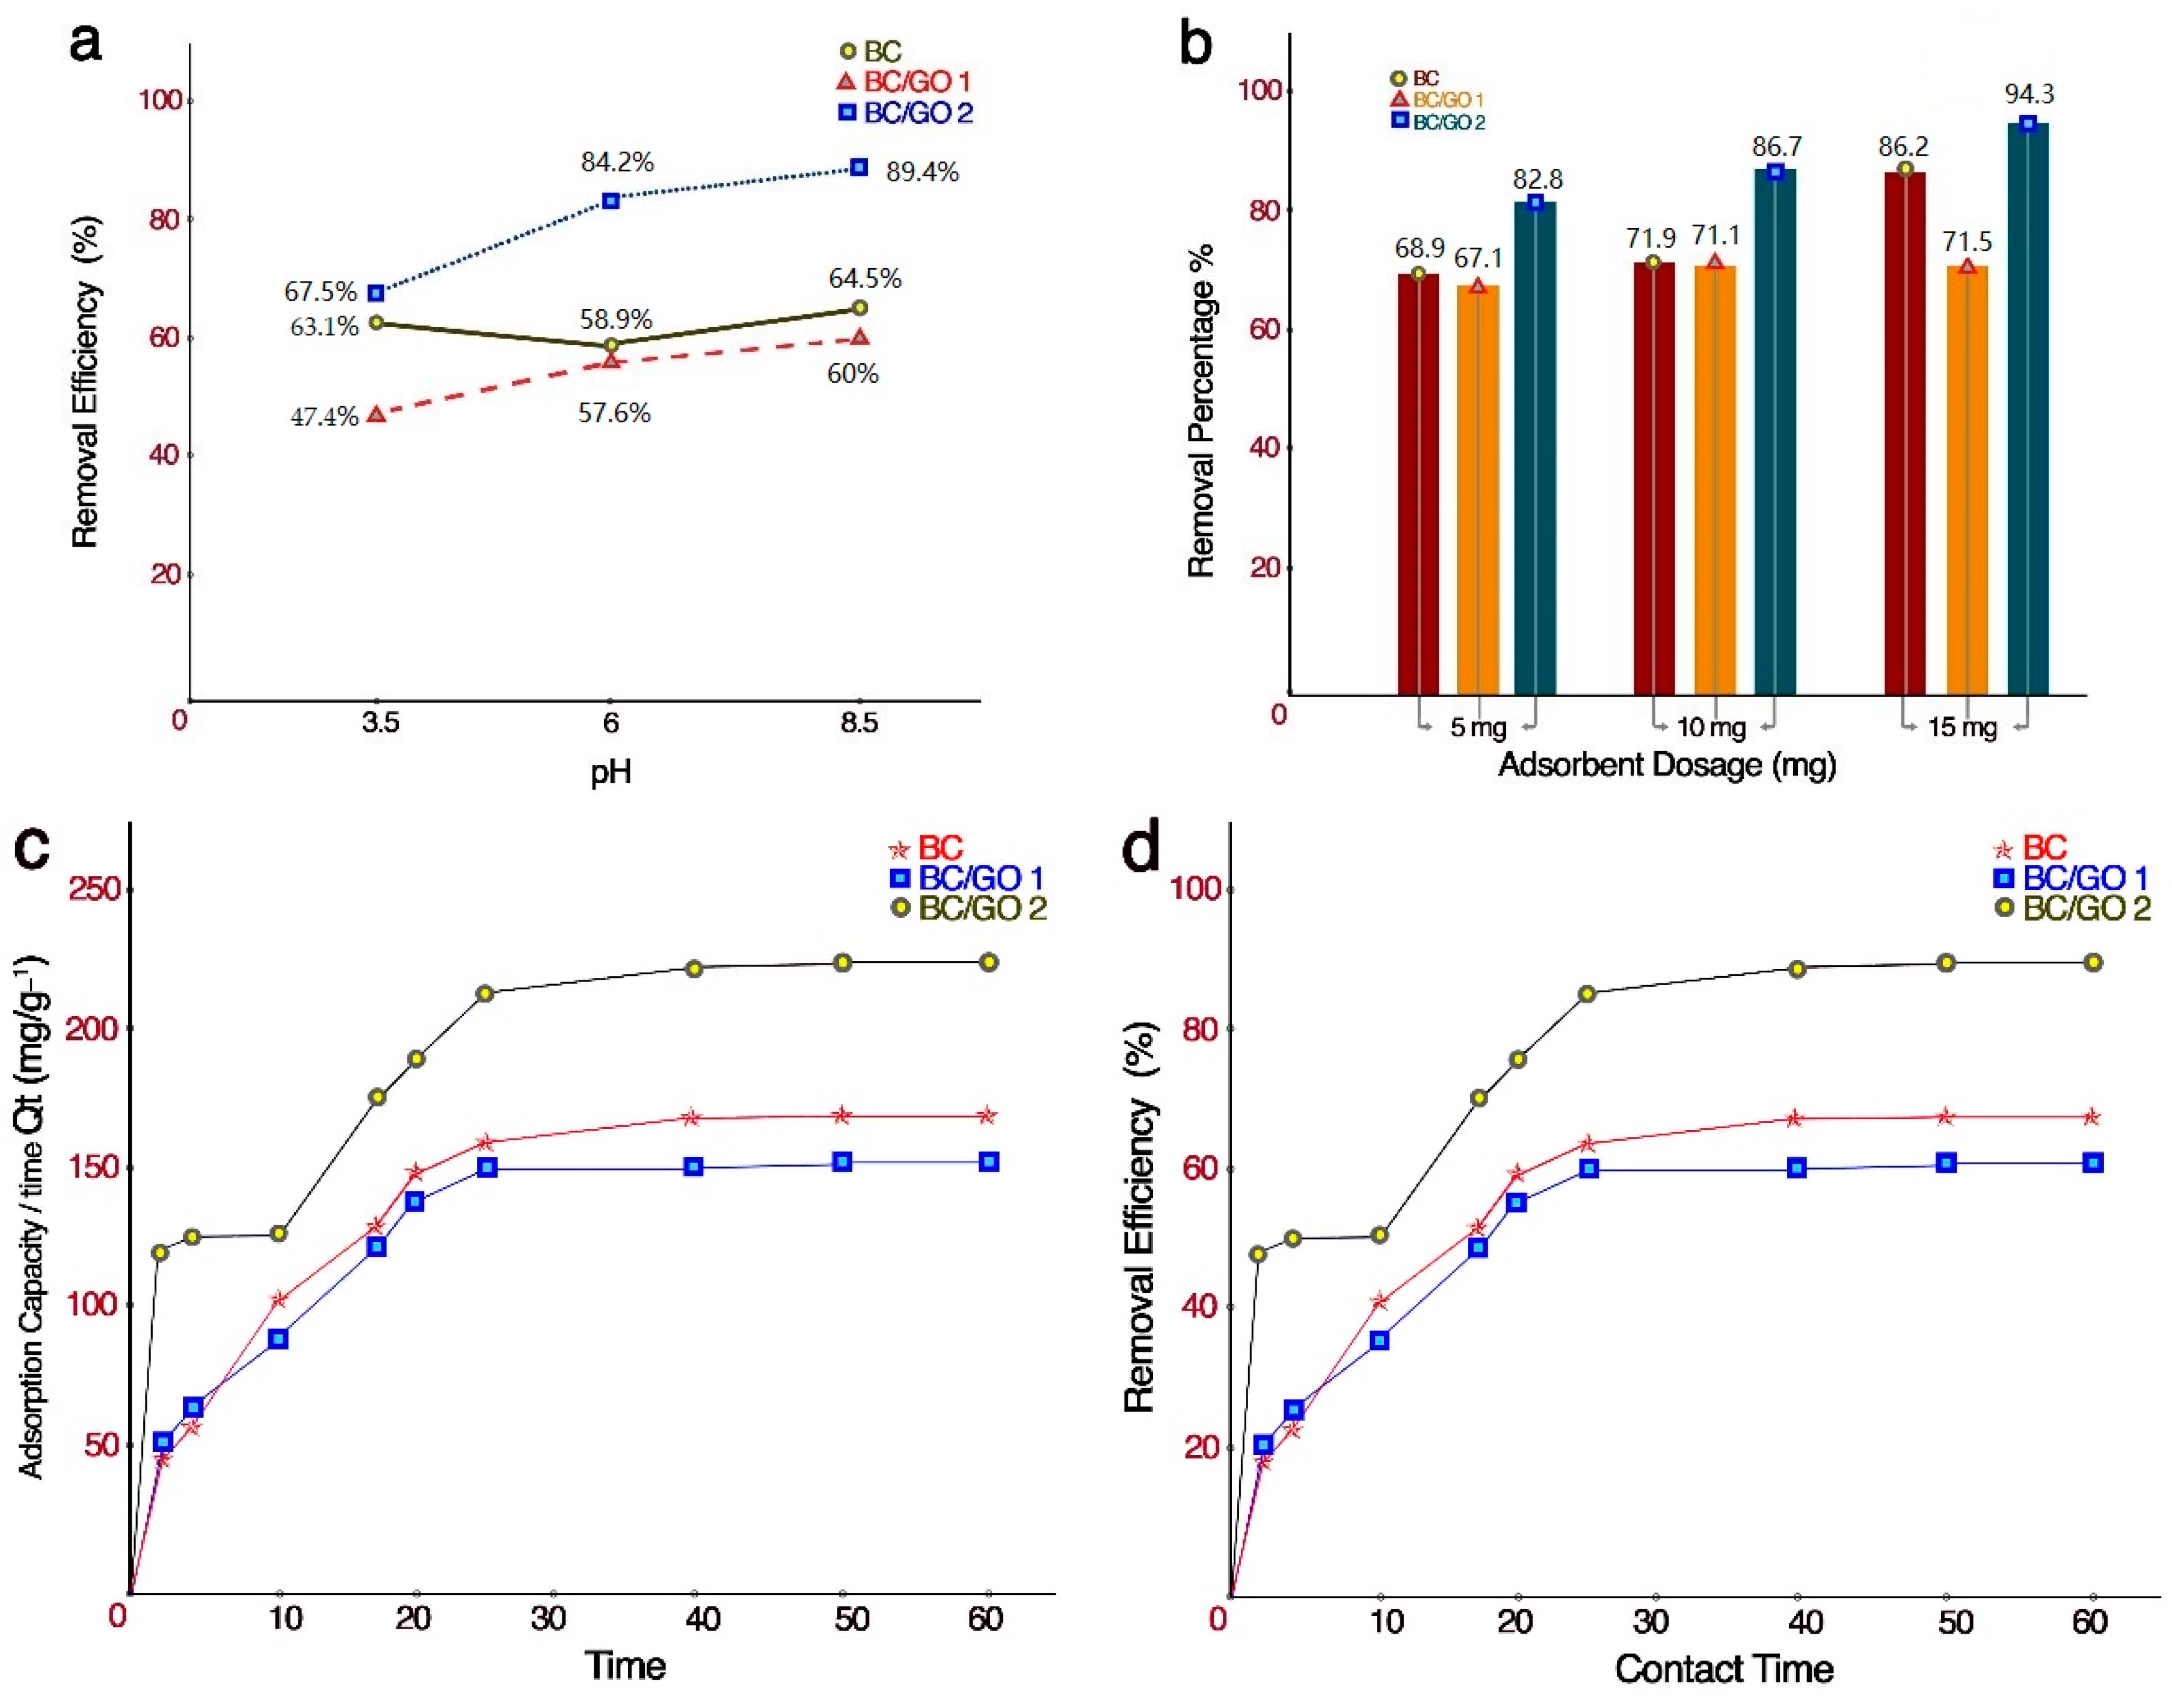
3.2.2. Effect of the Solution pH on Metal Ion Removal
3.2.3. Effect of Contact Time on Metal Ion Removal
3.2.4. Effect of Adsorbent Dosage on Metal Ion Removal
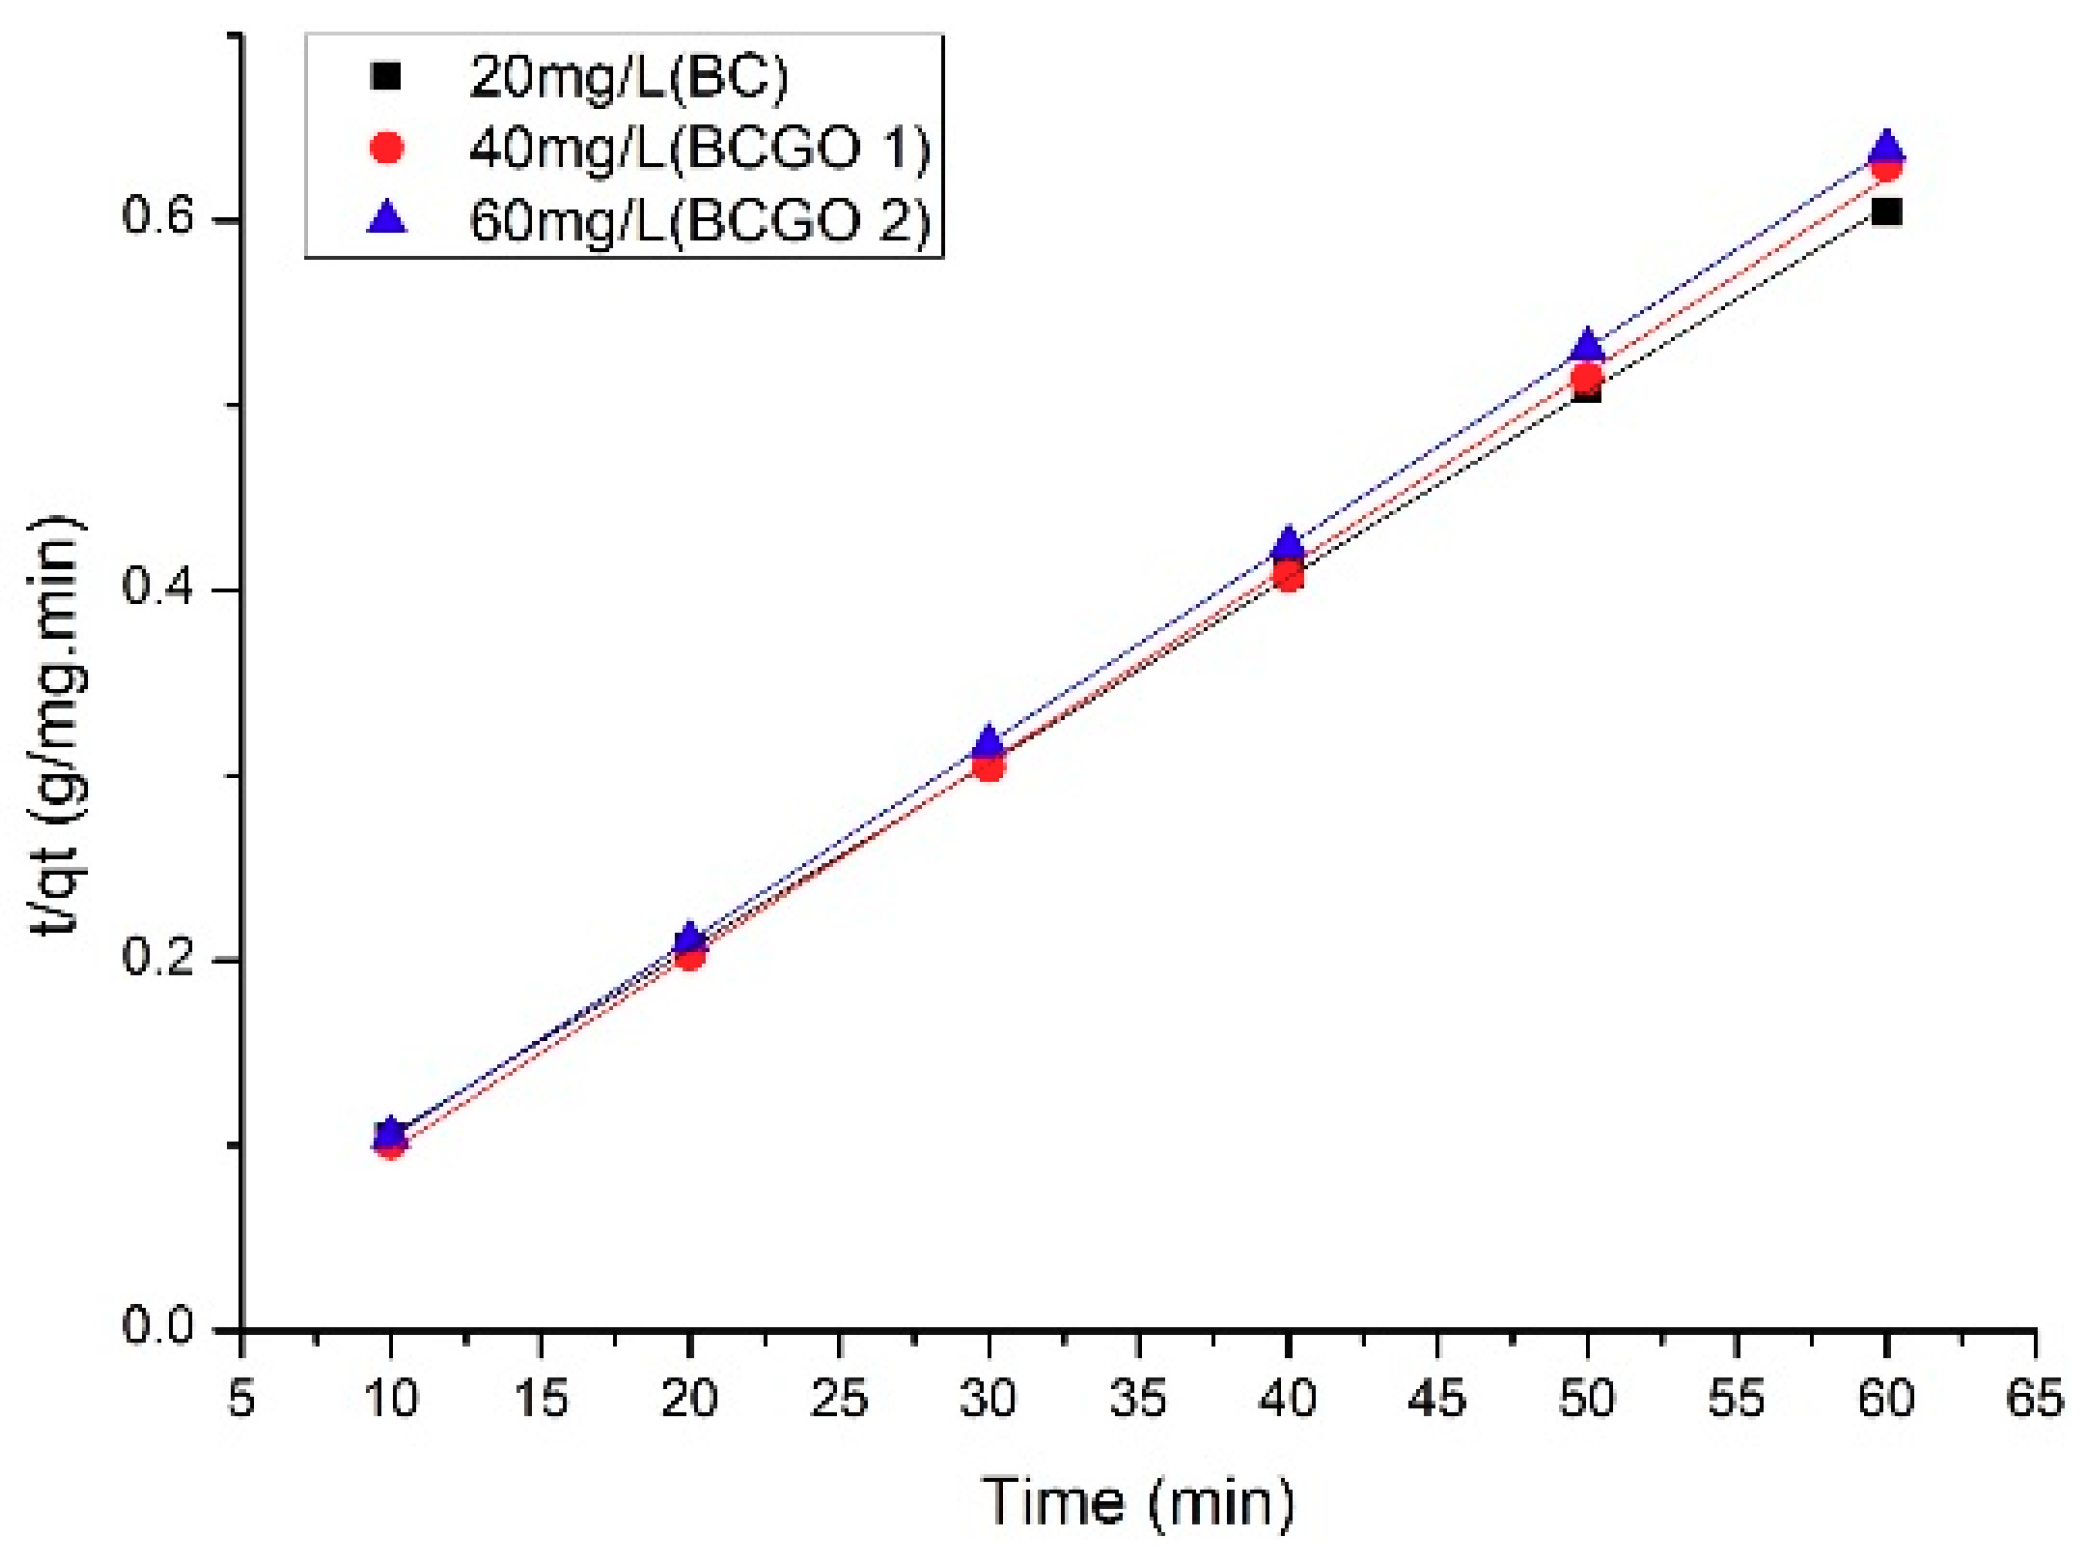
3.3. Adsorption Kinetics
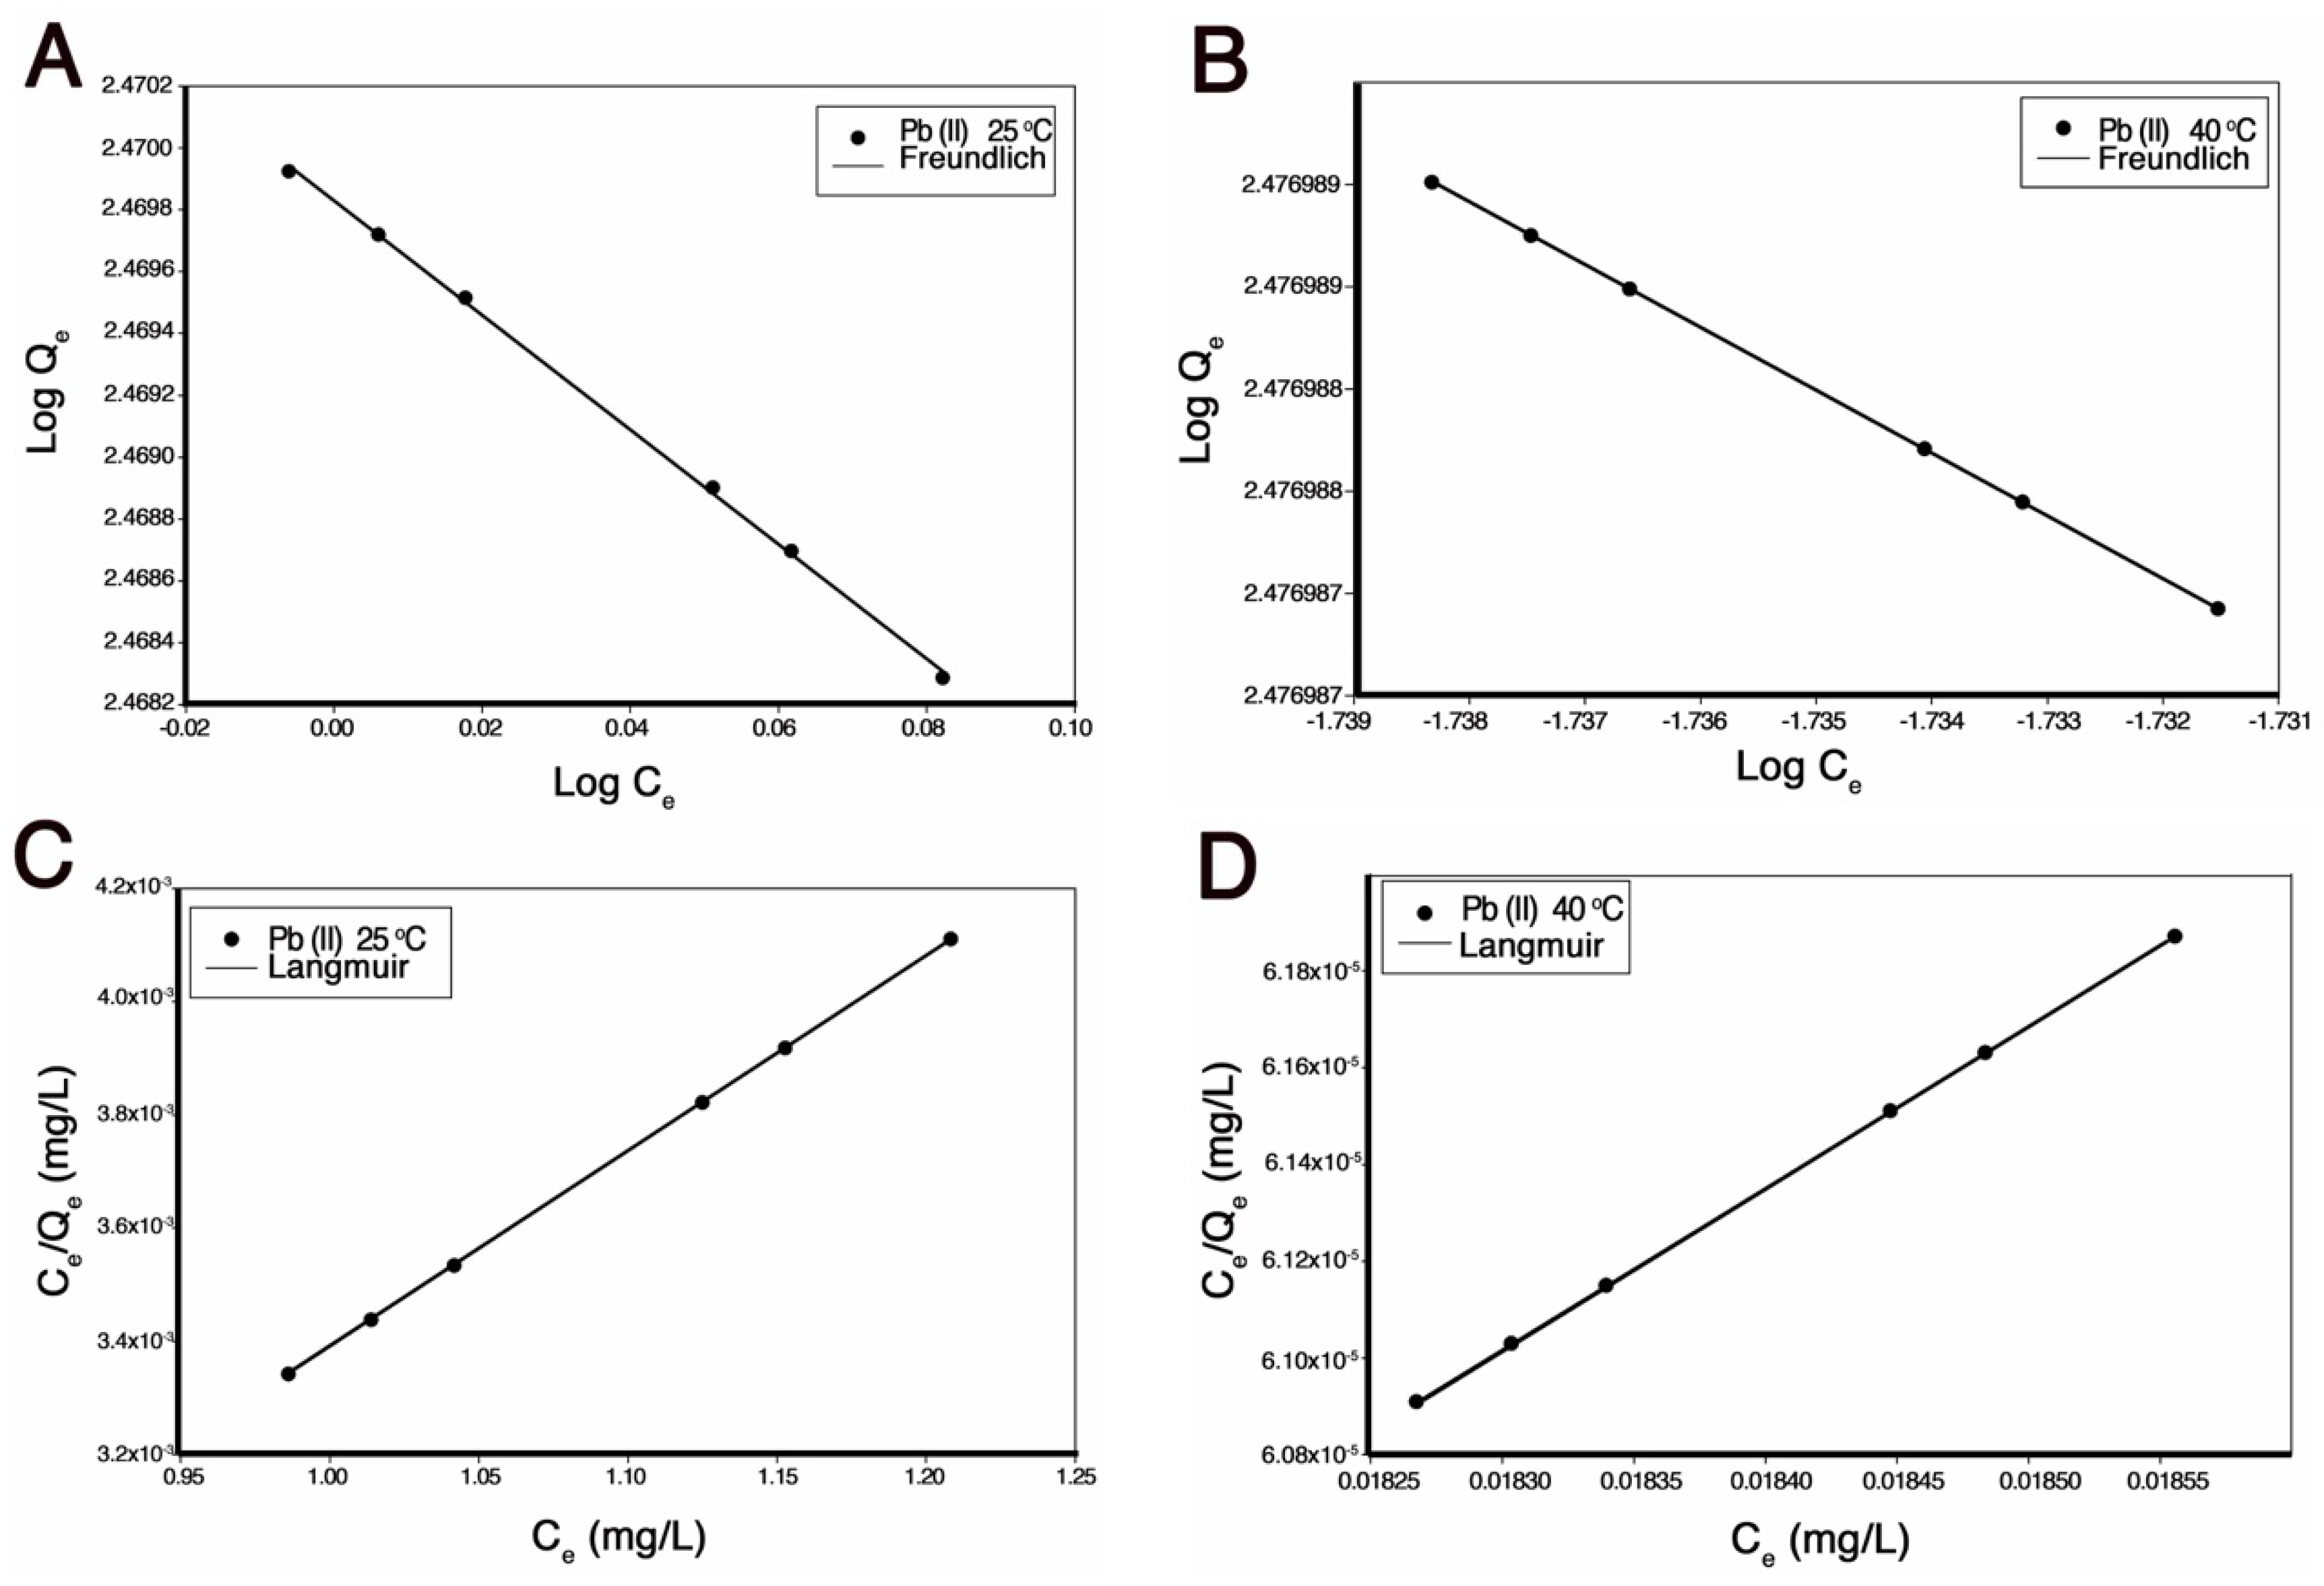
3.4. Adsorption Isotherms
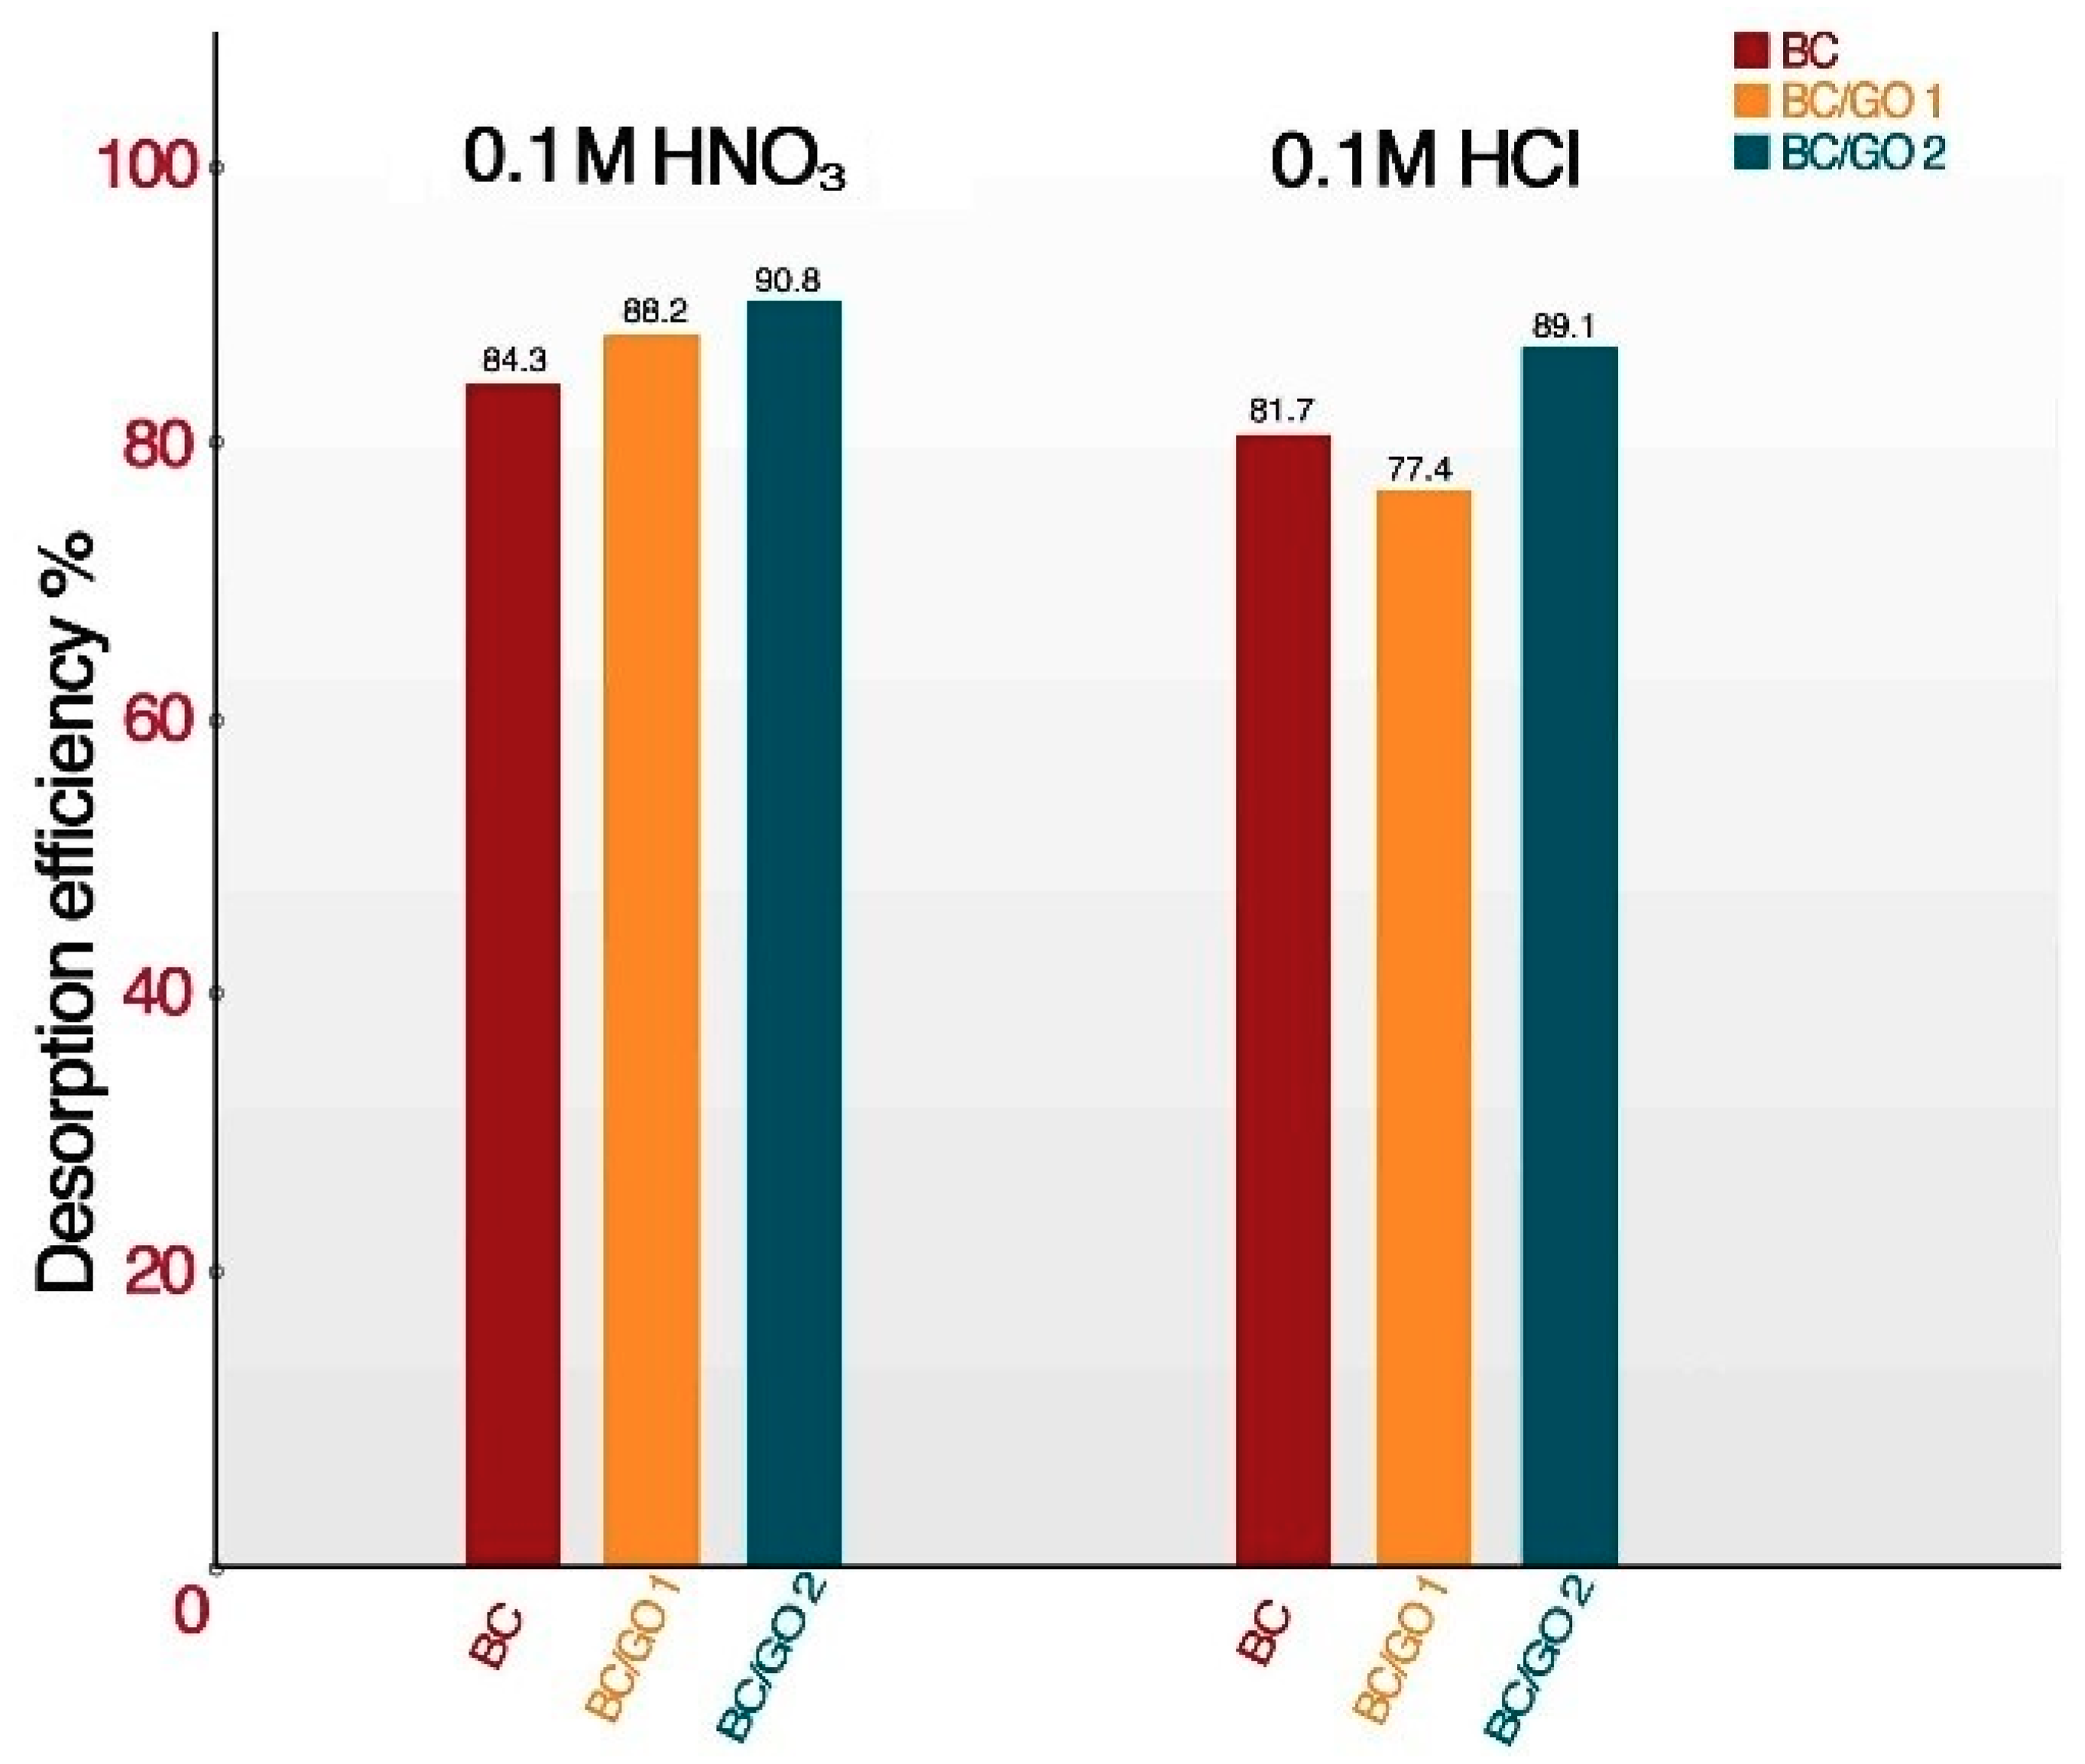
3.5. Desorption and Re-Adsorption
4. Conclusions
Author Contributions
Funding
Acknowledgments
Conflicts of Interest
References
- Ghasemi, E.; Heydari, A.; Sillanpää, M. Superparamagnetic Fe3O4@EDTA nanoparticles as an efficient adsorbent for simultaneous removal of Ag(I), Hg(II), Mn(II), Zn(II), Pb(II) and Cd(II) from water and soil environmental samples. Microchem. J. 2017, 131, 51–56. [Google Scholar] [CrossRef]
- Gupta, P.; Diwan, B. Bacterial Exopolysaccharide mediated heavy metal removal: A Review on biosynthesis, mechanism and remediation strategies. Biotechnol. Rep. (Amst.) 2017, 13, 58–71. [Google Scholar] [CrossRef] [PubMed]
- O’Connell, D.W.; Birkinshaw, C.; O’Dwyer, T.F. Removal of Lead(II) Ions from Aqueous Solutions Using a Modified Cellulose Adsorbent. Adsorpt. Sci. Technol. 2006, 24, 337–347. [Google Scholar] [CrossRef]
- Barakat, M.A. New trends in removing heavy metals from industrial wastewater. Arab. J. Chem. 2011, 4, 361–377. [Google Scholar] [CrossRef]
- Dervin, S.; Dionysiou, D.D.; Pillai, S.C. 2D nanostructures for water purification: Graphene and beyond. Nanoscale 2016, 8, 15115–15131. [Google Scholar] [CrossRef]
- Lee, A.; Elam, J.W.; Darling, S.B. Membrane materials for water purification: Design, development, and application. Environ. Sci. Water Res. Technol. 2016, 2, 17–42. [Google Scholar] [CrossRef]
- Peng, W.; Li, H.; Liu, Y.; Song, S. A review on heavy metal ions adsorption from water by graphene oxide and its composites. J. Mol. Liq. 2017, 230, 496–504. [Google Scholar] [CrossRef]
- Hristovski, K.D.; Markovski, J. Engineering metal (hydr)oxide sorbents for removal of arsenate and similar weak-acid oxyanion contaminants: A critical review with emphasis on factors governing sorption processes. Sci. Total Environ. 2017, 598, 258–271. [Google Scholar] [CrossRef]
- Tadjarodi, A.; Moazen Ferdowsi, S.; Zare-Dorabei, R.; Barzin, A. Highly efficient ultrasonic-assisted removal of Hg(II) ions on graphene oxide modified with 2-pyridinecarboxaldehyde thiosemicarbazone: Adsorption isotherms and kinetics studies. Ultrason. Sonochem. 2016, 33, 118–128. [Google Scholar] [CrossRef]
- Nupearachchi, C.N.; Mahatantila, K.; Vithanage, M. Application of graphene for decontamination of water; Implications for sorptive removal. Groundw. Sustain. Dev. 2017, 5, 206–215. [Google Scholar] [CrossRef]
- Bulgariu, L.; Bulgariu, D. Functionalized soy waste biomass—A novel environmental-friendly biosorbent for the removal of heavy metals from aqueous solution. J. Clean. Prod. 2018, 197, 875–885. [Google Scholar] [CrossRef]
- Abbas, Z.; Ali, S.; Rizwan, M.; Zaheer, I.E.; Malik, A.; Riaz, M.A.; Shahid, M.R.; Ur Rehman, M.Z.; Al-Wabel, M.I. A critical review of mechanisms involved in the adsorption of organic and inorganic contaminants through biochar. Arab. J. Geosci. 2018, 11, 448. [Google Scholar] [CrossRef]
- Liu, C.; Jin, R.-N.; Ouyang, X.-K.; Wang, Y.-G. Adsorption behavior of carboxylated cellulose nanocrystal—Polyethyleneimine composite for removal of Cr(VI) ions. Appl. Surf. Sci. 2017, 408, 77–87. [Google Scholar] [CrossRef]
- Luo, H.; Ao, H.; Li, G.; Li, W.; Xiong, G.; Zhu, Y.; Wan, Y. Bacterial cellulose/graphene oxide nanocomposite as a novel drug delivery system. Curr. Appl. Phys. 2017, 17, 249–254. [Google Scholar] [CrossRef]
- Stoica-Guzun, A.; Stroescu, M.; Jinga, S.I.; Mihalache, N.; Botez, A.; Matei, C.; Berger, D.; Damian, C.M.; Ionita, V. Box-Behnken experimental design for chromium(VI) ions removal by bacterial cellulose-magnetite composites. Int. J. Biol. Macromol. 2016, 91, 1062–1072. [Google Scholar] [CrossRef] [PubMed]
- Wang, Y.; Yadav, S.; Heinlein, T.; Konjik, V.; Breitzke, H.; Buntkowsky, G.; Schneider, J.J.; Zhang, K. Ultra-light nanocomposite aerogels of bacterial cellulose and reduced graphene oxide for specific absorption and separation of organic liquids. RSC Adv. 2014, 4, 21553–21558. [Google Scholar] [CrossRef]
- Nandgaonkar, A.G.; Wang, Q.; Fu, K.; Krause, W.E.; Wei, Q.; Gorga, R.; Lucia, L.A. A one-pot biosynthesis of reduced graphene oxide (RGO)/bacterial cellulose (BC) nanocomposites. Green Chem. 2014, 16, 3195–3201. [Google Scholar] [CrossRef]
- Shao, W.; Liu, H.; Liu, X.; Wang, S.; Zhang, R. Anti-bacterial performances and biocompatibility of bacterial cellulose/graphene oxide composites. RSC Adv. 2015, 5, 4795–4803. [Google Scholar] [CrossRef]
- Du, X.; Zhang, Z.; Liu, W.; Deng, Y. Nanocellulose-based conductive materials and their emerging applications in energy devices—A review. Nano Energy 2017, 35, 299–320. [Google Scholar] [CrossRef]
- Esa, F.; Tasirin, S.M.; Rahman, N.A. Overview of Bacterial Cellulose Production and Application. Agric. Agric. Sci. Procedia 2014, 2, 113–119. [Google Scholar] [CrossRef]
- Keshk, S.M.A.S. Bacterial Cellulose Production and its Industrial Applications. J. Bioprocess. Biotech. 2014, 4, 151. [Google Scholar] [CrossRef]
- Sriplai, N.; Mongkolthanaruk, W.; Eichhorn, S.J.; Pinitsoontorn, S. Magnetically responsive and flexible bacterial cellulose membranes. Carbohydr. Polym. 2018, 192, 251–262. [Google Scholar] [CrossRef] [PubMed]
- Pirsa, S.; Shamusi, T.; Kia, E.M. Smart films based on bacterial cellulose nanofibers modified by conductive polypyrrole and zinc oxide nanoparticles. J. Appl. Polym. Sci. 2018, 135, 46617. [Google Scholar] [CrossRef]
- Lv, P.; Feng, Q.; Wang, Q.; Li, G.; Li, D.; Wei, Q. Biosynthesis of Bacterial Cellulose/Carboxylic Multi-Walled Carbon Nanotubes for Enzymatic Biofuel Cell Application. Materials 2016, 9, 183. [Google Scholar] [CrossRef] [PubMed]
- Lv, P.; Yao, Y.; Li, D.; Zhou, H.; Naeem, M.A.; Feng, Q.; Huang, J.; Cai, Y.; Wei, Q. Self-assembly of nitrogen-doped carbon dots anchored on bacterial cellulose and their application in iron ion detection. Carbohydr. Polym. 2017, 172, 93–101. [Google Scholar] [CrossRef]
- Lv, P.; Zhou, H.; Mensah, A.; Feng, Q.; Wang, D.; Hu, X.; Cai, Y.; Amerigo Lucia, L.; Li, D.; Wei, Q. A highly flexible self-powered biosensor for glucose detection by epitaxial deposition of gold nanoparticles on conductive bacterial cellulose. Chem. Eng. J. 2018, 351, 177–188. [Google Scholar] [CrossRef]
- Jin, X.; Xiang, Z.; Liu, Q.; Chen, Y.; Lu, F. Polyethyleneimine-bacterial cellulose bioadsorbent for effective removal of copper and lead ions from aqueous solution. Bioresour. Technol. 2017, 244, 844–849. [Google Scholar] [CrossRef] [PubMed]
- Anirudhan, T.S.; Nima, J.; Sandeep, S.; Ratheesh, V.R.N. Development of an amino functionalized glycidylmethacrylate-grafted-titanium dioxide densified cellulose for the adsorptive removal of arsenic(V) from aqueous solutions. Chem. Eng. J. 2012, 209, 362–371. [Google Scholar] [CrossRef]
- Yakout, A.A.; El-Sokkary, R.H.; Shreadah, M.A.; Abdel Hamid, O.G. Cross-linked graphene oxide sheets via modified extracted cellulose with high metal adsorption. Carbohydr. Polym. 2017, 172, 20–27. [Google Scholar] [CrossRef]
- Lü, K.; Zhao, G.; Wang, X. A brief review of graphene-based material synthesis and its application in environmental pollution management. Chin. Sci. Bull. 2012, 57, 1223–1234. [Google Scholar] [CrossRef]
- Zhao, G.; Ren, X.; Gao, X.; Tan, X.; Li, J.; Chen, C.; Huang, Y.; Wang, X. Removal of Pb(II) ions from aqueous solutions on few-layered graphene oxide nanosheets. Dalton Trans. 2011, 40, 10945–10952. [Google Scholar] [CrossRef] [PubMed]
- Santhosh, C.; Kollu, P.; Felix, S.; Velmurugan, V.; Jeong, S.K.; Grace, A.N. CoFe2O4 and NiFe2O4@graphene adsorbents for heavy metal ions–kinetic and thermodynamic analysis. RSC Adv. 2015, 5, 28965–28972. [Google Scholar] [CrossRef]
- Sherlala, A.I.A.; Raman, A.A.A.; Bello, M.M.; Asghar, A. A review of the applications of organo-functionalized magnetic graphene oxide nanocomposites for heavy metal adsorption. Chemosphere 2018, 193, 1004–1017. [Google Scholar] [CrossRef] [PubMed]
- Yusuf, M.; Elfghi, F.M.; Zaidi, S.A.; Abdullah, E.C.; Khan, M.A. Applications of graphene and its derivatives as an adsorbent for heavy metal and dye removal: A systematic and comprehensive overview. RSC Adv. 2015, 5, 50392–50420. [Google Scholar] [CrossRef]
- Liu, Y.; Zhou, J.; Tang, J.; Tang, W. Three-Dimensional, Chemically Bonded Polypyrrole/Bacterial Cellulose/Graphene Composites for High-Performance Supercapacitors. Chem. Mater. 2015, 27, 7034–7041. [Google Scholar] [CrossRef]
- Liu, Y.; Zhou, J.; Zhu, E.; Tang, J.; Liu, X.; Tang, W. Facile synthesis of bacterial cellulose fibres covalently intercalated with graphene oxide by one-step cross-linking for robust supercapacitors. J. Mater. Chem. C 2015, 3, 1011–1017. [Google Scholar] [CrossRef]
- Sahraei, R.; Ghaemy, M. Synthesis of modified gum tragacanth/graphene oxide composite hydrogel for heavy metal ions removal and preparation of silver nanocomposite for antibacterial activity. Carbohydr. Polym. 2017, 157, 823–833. [Google Scholar] [CrossRef] [PubMed]
- Li, M.; Wang, C.; O’Connell, M.J.; Chan, C.K. Carbon nanosphere adsorbents for removal of arsenate and selenate from water. Environ. Sci. Nano 2015, 2, 245–250. [Google Scholar] [CrossRef]
- Tan, P.; Hu, Y.; Bi, Q. Competitive adsorption of Cu2+, Cd2+ and Ni2+ from an aqueous solution on graphene oxide membranes. Colloids Surf. A Physicochem. Eng. Asp. 2016, 509, 56–64. [Google Scholar] [CrossRef]
- Su, H.; Ye, Z.; Hmidi, N. High-performance iron oxide–graphene oxide nanocomposite adsorbents for arsenic removal. Colloids Surf. A Physicochem. Eng. Asp. 2017, 522, 161–172. [Google Scholar] [CrossRef]
- Perreault, F.; de Faria, A.F.; Elimelech, M. Environmental applications of graphene-based nanomaterials. Chem. Soc. Rev. 2015, 44, 5861–5896. [Google Scholar] [CrossRef]
- Peng, L.; Xu, Z.; Liu, Z.; Wei, Y.; Sun, H.; Li, Z.; Zhao, X.; Gao, C. An iron-based green approach to 1-h production of single-layer graphene oxide. Nat. Commun. 2015, 6, 5716. [Google Scholar] [CrossRef] [PubMed]
- Luo, H.; Xiong, G.; Yang, Z.; Raman, S.R.; Si, H.; Wan, Y. A novel three-dimensional graphene/bacterial cellulose nanocomposite prepared by in situ biosynthesis. RSC Adv. 2014, 4, 14369–14372. [Google Scholar] [CrossRef]
- Brunauer, S.; Emmett, P.H.; Teller, E. Adsorption of Gases in Multimolecular Layers. J. Am. Chem. Soc. 1938, 60, 309–319. [Google Scholar] [CrossRef]
- Barrett, E.P.; Joyner, L.G.; Halenda, P.P. The Determination of Pore Volume and Area Distributions in Porous Substances. I. Computations from Nitrogen Isotherms. J. Am. Chem. Soc. 1951, 73, 373–380. [Google Scholar] [CrossRef]
- Ho, Y.S.; McKay, G. Pseudo-second order model for sorption processes. Process Biochem. 1999, 34, 451–465. [Google Scholar] [CrossRef]
- Teodoro, F.S.; Ramos, S.; Elias, M.M.C.; Mageste, A.B.; Ferreira, G.M.D.; da Silva, L.H.M.; Gil, L.F.; Gurgel, L.V.A. Synthesis and application of a new carboxylated cellulose derivative. Part I: Removal of Co(2+), Cu(2+) and Ni(2+) from monocomponent spiked aqueous solution. J. Colloid Interface Sci. 2016, 483, 185–200. [Google Scholar] [CrossRef]
- Pakulski, D.; Czepa, W.; Witomska, S.; Aliprandi, A.; Pawluć, P.; Patroniak, V.; Ciesielski, A.; Samorì, P. Graphene oxide-branched polyethylenimine foams for efficient removal of toxic cations from water. J. Mater. Chem. A 2018, 6, 9384–9390. [Google Scholar] [CrossRef]
- Pircher, N.; Veigel, S.; Aigner, N.; Nedelec, J.M.; Rosenau, T.; Liebner, F. Reinforcement of bacterial cellulose aerogels with biocompatible polymers. Carbohydr. Polym. 2014, 111, 505–513. [Google Scholar] [CrossRef]
- Kuzmenko, V.; Saleem, A.M.; Bhaskar, A.; Staaf, H.; Desmaris, V.; Enoksson, P. Hierarchical cellulose-derived carbon nanocomposites for electrostatic energy storage. J. Phys. Conf. Ser. 2015, 660, 012062. [Google Scholar] [CrossRef]
- Deng, L.; Su, Y.; Su, H.; Wang, X.; Zhu, X. Biosorption of copper (II) and lead (II) from aqueous solutions by nonliving green algae Cladophora fascicularis—Equilibrium, kinetics and environmental effects. Adsorption 2006, 12, 267–277. [Google Scholar] [CrossRef]
- Yu, X.; Tong, S.; Ge, M.; Wu, L.; Zuo, J.; Cao, C.; Song, W. Adsorption of heavy metal ions from aqueous solution by carboxylated cellulose nanocrystals. J. Environ. Sci. 2013, 25, 933–943. [Google Scholar] [CrossRef]
- Chen, S.; Zou, Y.; Yan, Z.; Shen, W.; Shi, S.; Zhang, X.; Wang, H. Carboxymethylated-bacterial cellulose for copper and lead ion removal. J. Hazard. Mater. 2009, 161, 1355–1359. [Google Scholar] [CrossRef] [PubMed]
- Sitko, R.; Musielak, M.; Zawisza, B.; Talik, E.; Gagor, A. Graphene oxide/cellulose membranes in adsorption of divalent metal ions. RSC Adv. 2016, 6, 96595–96605. [Google Scholar] [CrossRef]
- Yang, Y.; Wu, W.-Q.; Zhou, H.-H.; Huang, Z.-Y.; Ye, T.-T.; Liu, R.; Kuang, Y.-F. Adsorption behavior of cross-linked chitosan modified by graphene oxide for Cu(II) removal. J. Cent. South Univ. 2014, 21, 2826–2831. [Google Scholar] [CrossRef]
- Wang, J.; Lu, X.; Ng, P.F.; Lee, K.I.; Fei, B.; Xin, J.H.; Wu, J.Y. Polyethylenimine coated bacterial cellulose nanofiber membrane and application as adsorbent and catalyst. J. Colloid Interface Sci. 2015, 440, 32–38. [Google Scholar] [CrossRef]
- Saravanan, R.; Ravikumar, L. The Use of New Chemically Modified Cellulose for Heavy Metal Ion Adsorption and Antimicrobial Activities. J. Water Resour. Prot. 2015, 7, 530–545. [Google Scholar] [CrossRef]


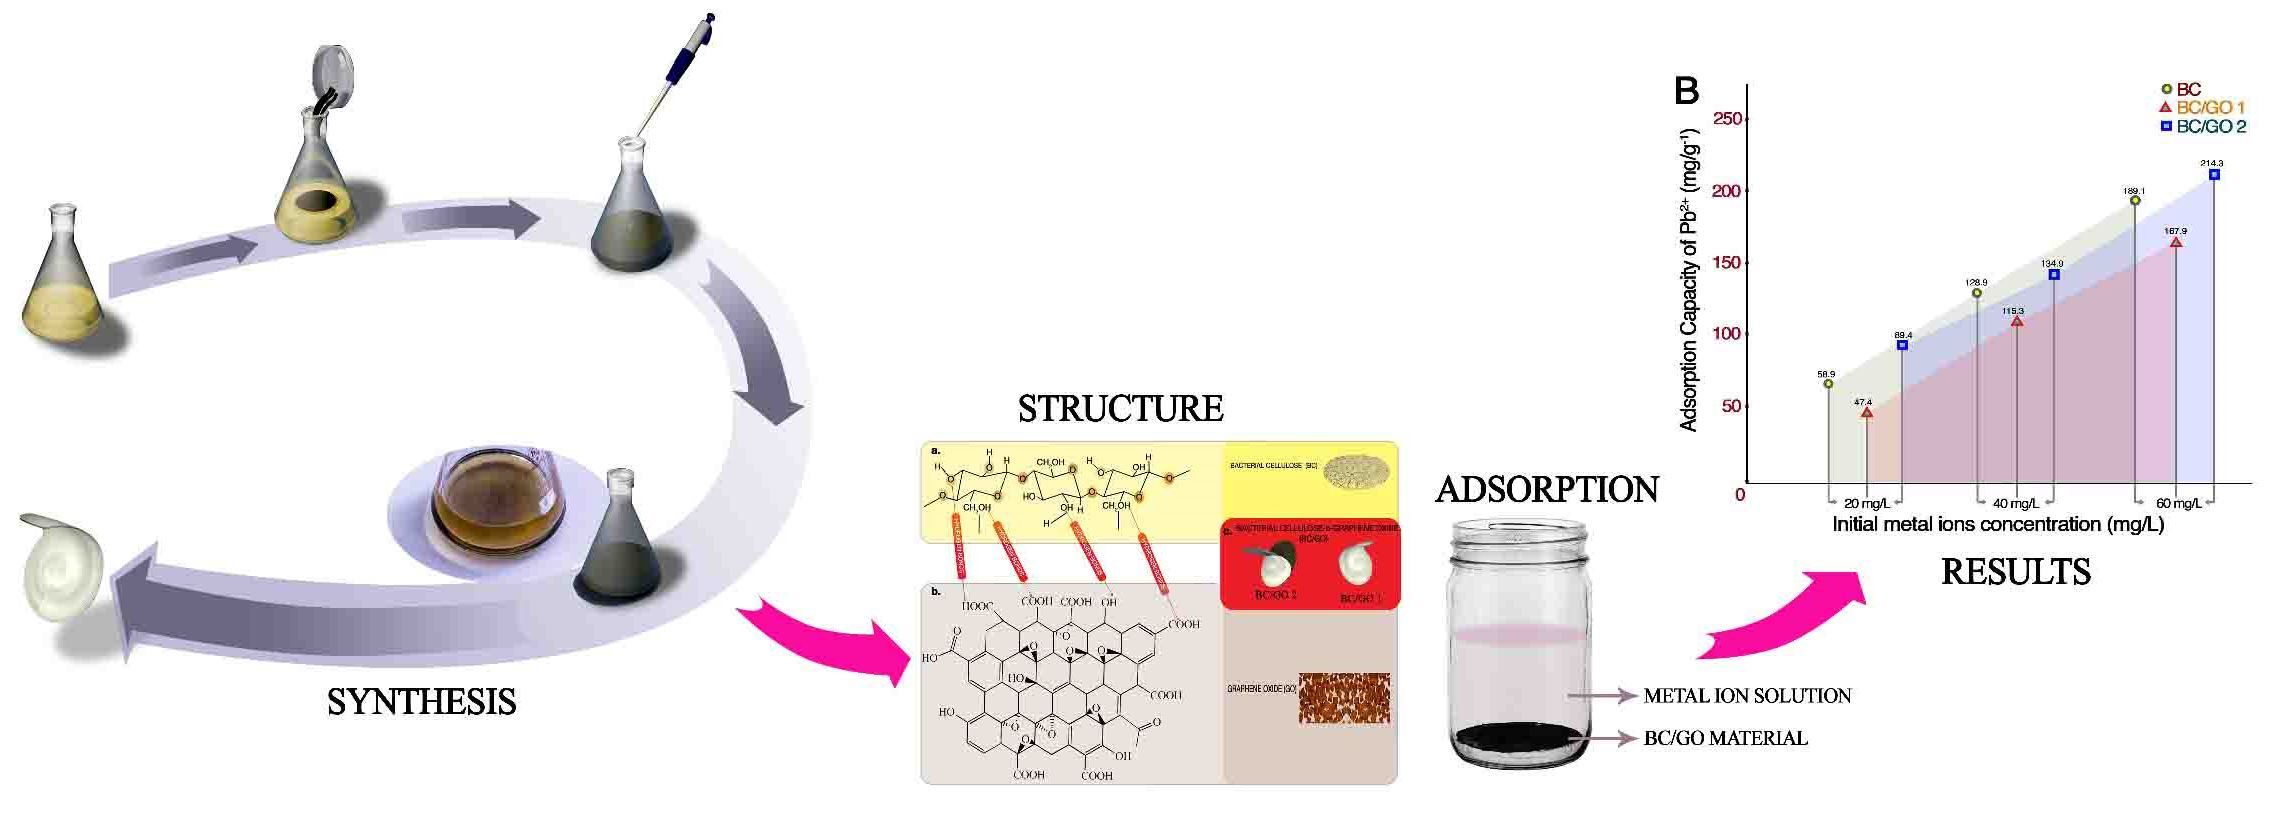
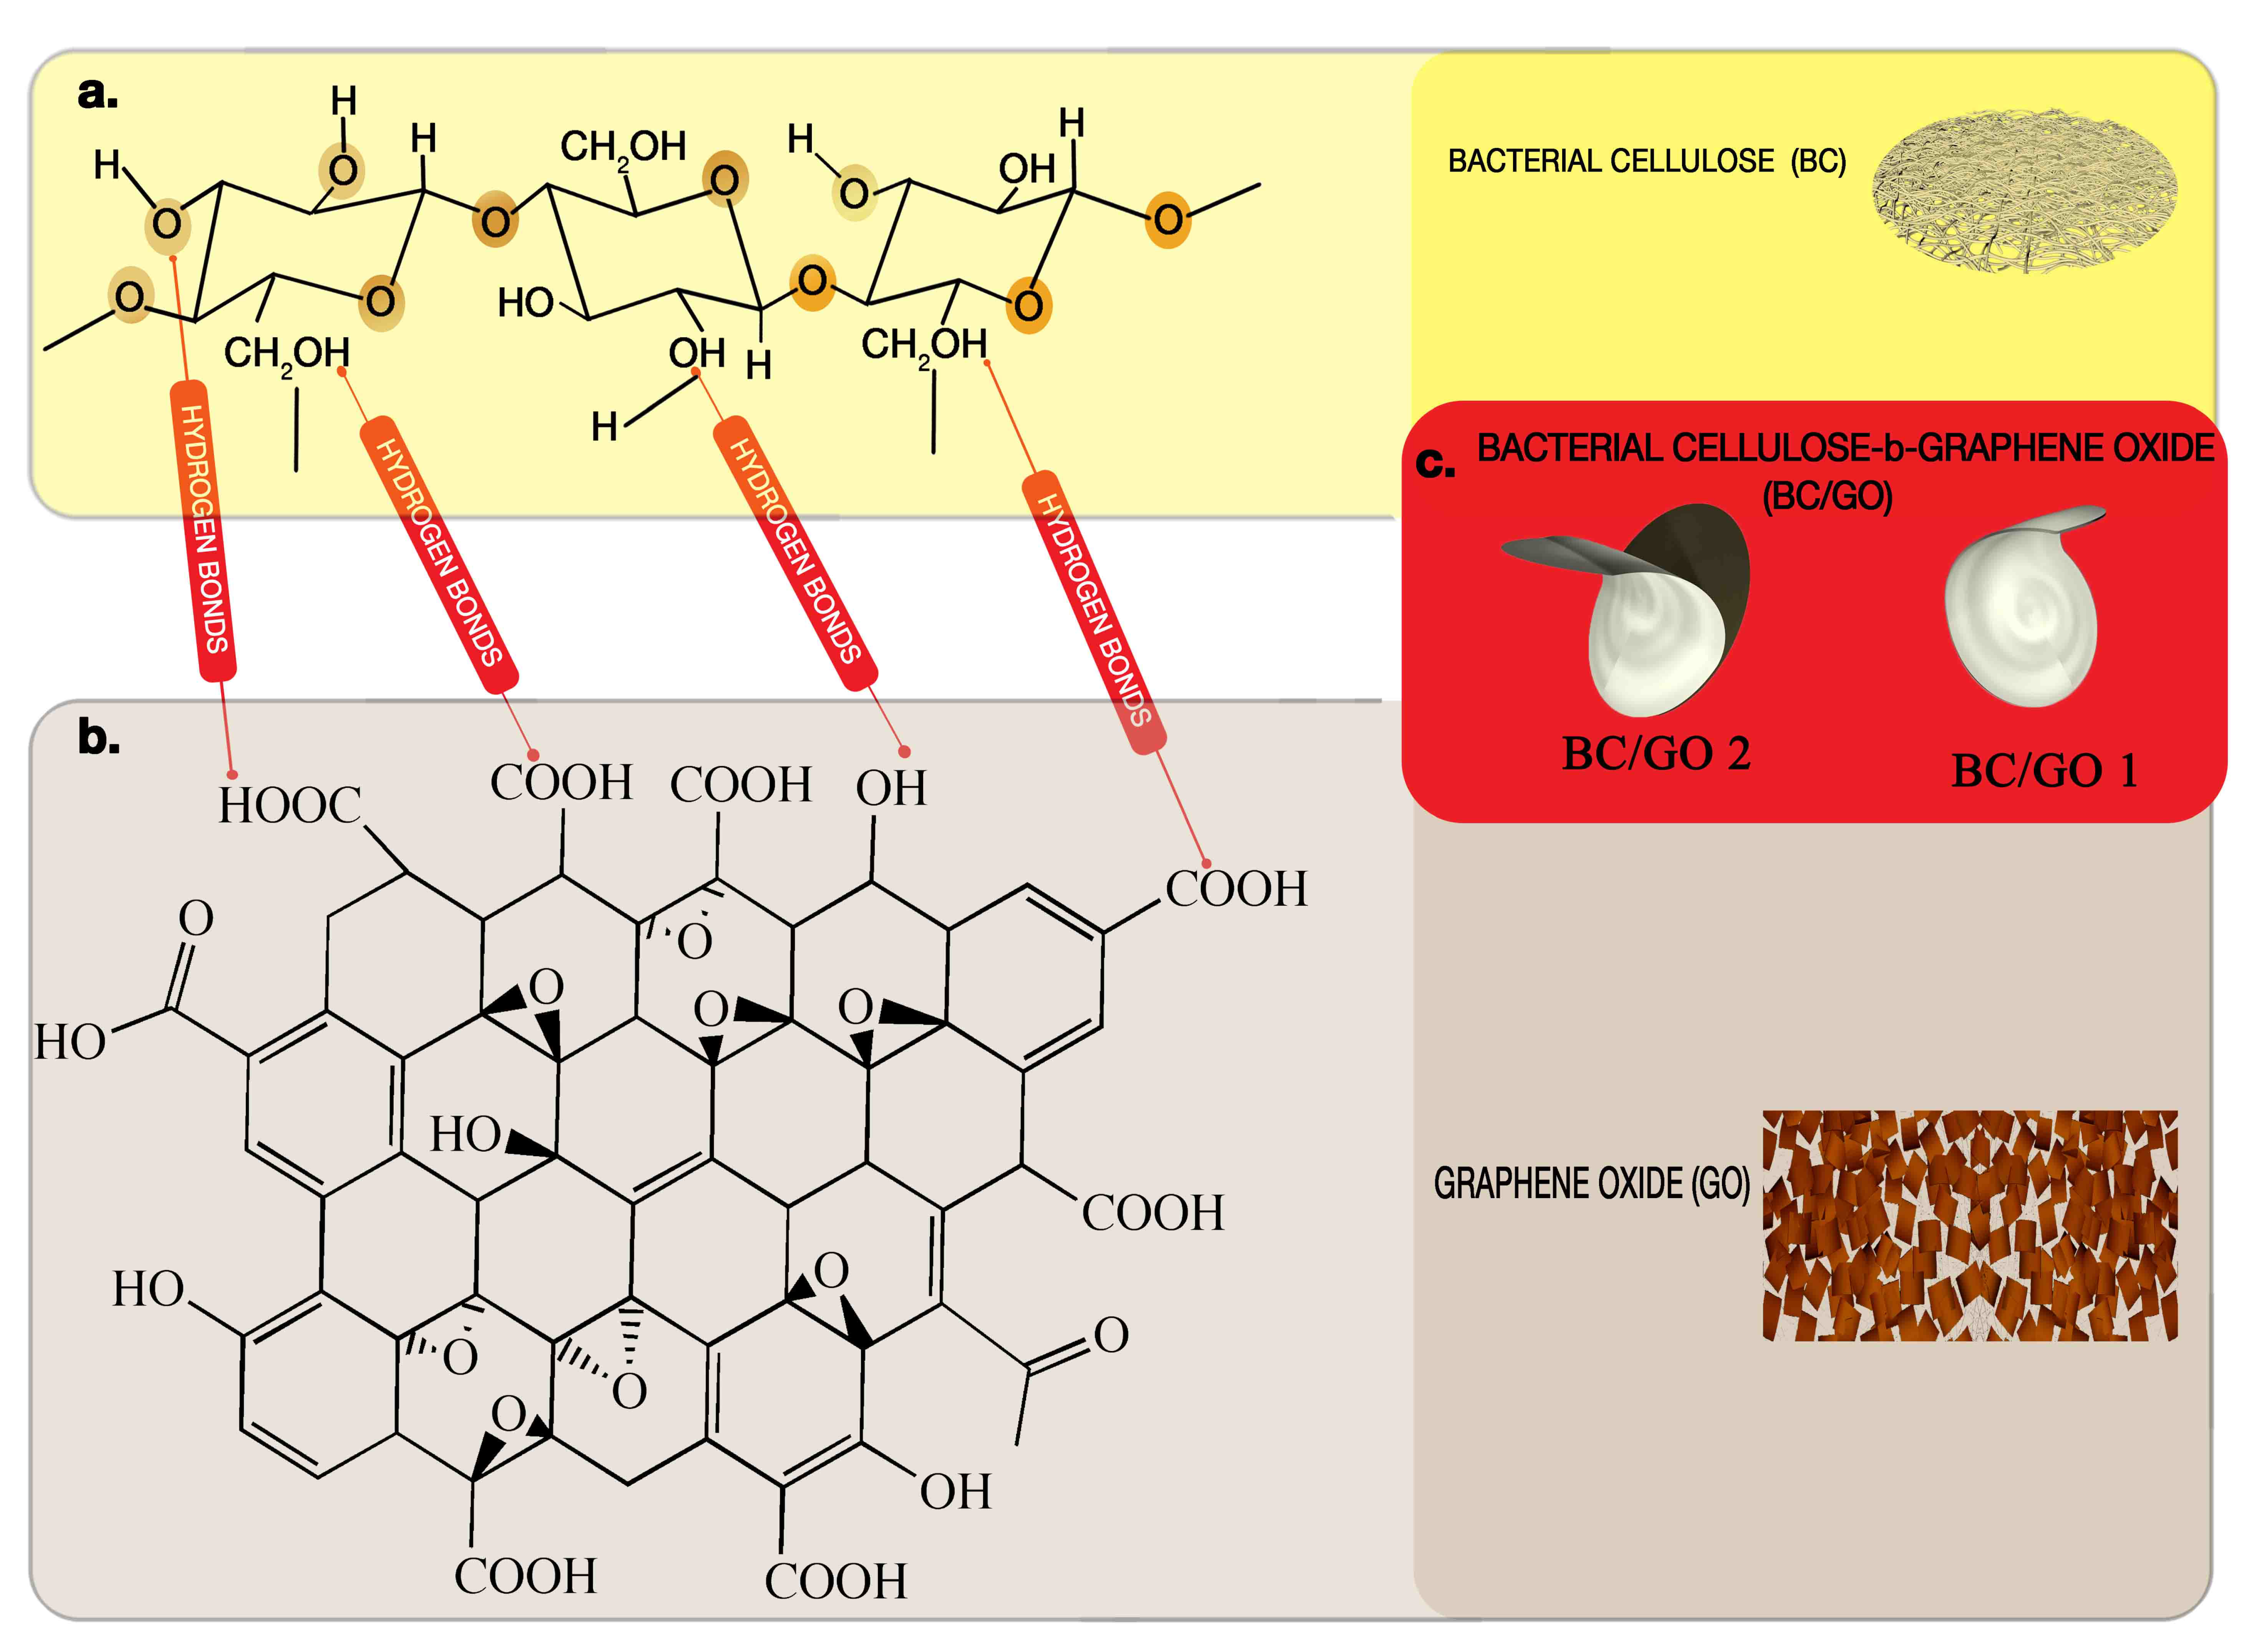
| Code (Name) | GO-Content (% w/v) into Medium | GO% Trapped | Cultivation Period |
|---|---|---|---|
| BC | 0 | 0 | 20 days |
| BC/GO 1 | 0.1 | 40% | 20 days |
| BC/GO 2 | 0.1 | 95% | 20 days |
| Metal Ion/Material | qe ex (mg/g) | Pseudo-First-Order (PFO) Model | Pseudo-Second-Order (PSO) Model | ||||
|---|---|---|---|---|---|---|---|
| K1 (min) | qe (mg/g) | R2 | K2 (min·g/mg) | qe (mg/g) | R2 | ||
| BC | 68.8 | 0.71 | 67.1 | 0.1821 | 1.75 | 68.9 | 0.998 |
| BCGO 1 | 149.5 | 0.73 | 144.7 | 0.2343 | 1.75 | 149.8 | 0.998 |
| BCGO 2 | 220.9 | 0.73 | 220.6 | 0.2976 | 1.75 | 221.8 | 0.999 |
| Isotherm Model | Temperature | R2 Values | Qmax (mg/g) | b (L/mg) | n | Kf |
|---|---|---|---|---|---|---|
| Langmuir | 25 °C | 0.99 | 285.7 | 1.06 | - | - |
| 40 °C | 0.99 | 303.0 | 1.75 | - | - | |
| Freundlich | 25 °C | 0.98 | 294.2 | - | 1.67 | 2.07 |
| 40 °C | 0.98 | 299.9 | - | 1.47 | 2.01 |
| Sorbent Material | Adsorbate/Metal Ion | High Adsorption Capacity (mg/g) | Ref. |
|---|---|---|---|
| Chitosan modified by graphene oxide | Cu(II) | 202.5 | [55] |
| Cross-linked graphene oxide sheets via modified extracted cellulose | Cu(II) and Pb(II) | 46.39 and 186.48 | [29] |
| Polyethylenimine coated bacterial cellulose | Cu(II) and Pb(II) | 61.46 and 116.41 | [56] |
| Chemically modified cellulose (DTD) | Cu(II) and Pb(II) | 157.3 and 153.5 | [57] |
| Modified gum tragacanth/graphene oxide composite | Pb(II), Cd(II), and g(I) | 142.50, 112.50 and 132.12 | [37] |
| Few-layered graphene oxide nanosheets (FGO) | Pb(II) | 842/400 | [31] |
| Carboxymethylated-bacterial cellulose CM-BC | Cu(II) and Pb(II) | 12.63 and 60.42 | [53] |
| GO/cellulose membranes | Pb(II) | 107.9 | [54] |
| This paper | Pb(II) | 303.0 mg/g |
© 2019 by the authors. Licensee MDPI, Basel, Switzerland. This article is an open access article distributed under the terms and conditions of the Creative Commons Attribution (CC BY) license (http://creativecommons.org/licenses/by/4.0/).
Share and Cite
Mensah, A.; Lv, P.; Narh, C.; Huang, J.; Wang, D.; Wei, Q. Sequestration of Pb(II) Ions from Aqueous Systems with Novel Green Bacterial Cellulose Graphene Oxide Composite. Materials 2019, 12, 218. https://doi.org/10.3390/ma12020218
Mensah A, Lv P, Narh C, Huang J, Wang D, Wei Q. Sequestration of Pb(II) Ions from Aqueous Systems with Novel Green Bacterial Cellulose Graphene Oxide Composite. Materials. 2019; 12(2):218. https://doi.org/10.3390/ma12020218
Chicago/Turabian StyleMensah, Alfred, Pengfei Lv, Christopher Narh, Jieyu Huang, Di Wang, and Qufu Wei. 2019. "Sequestration of Pb(II) Ions from Aqueous Systems with Novel Green Bacterial Cellulose Graphene Oxide Composite" Materials 12, no. 2: 218. https://doi.org/10.3390/ma12020218
APA StyleMensah, A., Lv, P., Narh, C., Huang, J., Wang, D., & Wei, Q. (2019). Sequestration of Pb(II) Ions from Aqueous Systems with Novel Green Bacterial Cellulose Graphene Oxide Composite. Materials, 12(2), 218. https://doi.org/10.3390/ma12020218