Article

Effect of Curing Condition on Resistance to Chloride Ingress in Concrete Using Ground Granulated Blast Furnace Slag

1
Architectural Engineering, Hanyang University, Seoul 04763, Korea
2
Concrete Research Office, Technology Research Center, Ssangyong Cement Industrial Co., Ltd., Daejeon 34115, Korea
3
School of Architecture and Architectural Engineering, Hanyang University, ERICA, Ansan 15588, Korea
*
Author to whom correspondence should be addressed.
Materials 2019, 12(19), 3233; https://doi.org/10.3390/ma12193233
Submission received: 4 September 2019 / Revised: 27 September 2019 / Accepted: 28 September 2019 / Published: 2 October 2019
(This article belongs to the Special Issue Concrete and Construction Materials)

Abstract

:
Changes in the salt attack resistance of concrete using ground granulated blast furnace slag (GGBFS) were examined based on different curing conditions. These conditions were divided into air and underwater curing. Three concrete mixes with GGBFS replacement ratios of 0% (control group), 30% and 60% were fabricated. Then, evaluation of concrete compressive strength, evaluation of chloride ion diffusion coefficient and electrochemical impedance spectroscopy (EIS) were performed. As the GGBFS replacement ratio increased, the concrete compressive strength of the air cured specimens decreased compared to the underwater cured specimens. With respect to the chloride ion diffusion coefficient measurements, the coefficient decreased as the GGBFS replacement ratio increased. However, the diffusion coefficient of the air cured specimen relative to the underwater cured ones increased up to two times. The EIS results showed that as the GGBFS replacement ratio increased, |Z| increased in every frequency range. However, the |Z| of the air cured specimen was lower than the underwater cured one. This showed the same tendency as the evaluation results of the chloride ion diffusion coefficient.

1. Introduction

The performance of concrete is determined by its strength and durability. As the durability of concrete has recently emerged as a critical social issue, the development of high-quality concrete with high durability is urgently needed. The most important problem affecting the durability of reinforced concrete is the deterioration of embedded rebars due to corrosion [1,2]. The rebars embedded in concrete are protected from corrosion by stable oxide films that are formed on the surfaces in the strong alkaline (pH between 12.5 and 14) cement environment. However, the rebars are corroded by the reduced pH because of the neutralization of concrete or the penetration of chloride ions. The volume of the rebars thus increases because of the corrosion products resulting from the corrosion of rebars, which causes concrete cracks [3,4,5].
Reinforced concrete structures in areas affected by the marine environment require considerable maintenance costs owing to rebar corrosion caused by chloride ion penetration. The construction of reinforced concrete structures with excellent resistance to the marine environment is critical, not only from the point of view of stability of the structure, but also from the economic aspect [6,7,8]. One method to improve the durability of concrete against salt damage is to use additives such as blast furnace slag fine powder or fly ash, which are known to be effective at blocking intrusion by harmful elements such as chloride ions, by rendering a dense pore structures to concrete [9,10,11,12,13,14,15].
It has been reported in literature that using these additives in concrete is environmentally friendly because it helps reduce CO2 emissions into the atmosphere [16]. Furthermore, it is known that the additives considerably decrease the permeability and diffusion rate of water and chloride ions in hardened concrete, suppress the sulfate and alkali-aggregate reactions and prevent corrosion of the rebars [17,18,19,20,21,22,23,24,25,26,27,28,29,30].
However, one problem that has been continuously noted is that the replacement of cement with ground granulated blast furnace slag (GGBFS) is associated with high variations in quality and high dependency on the curing environment. In particular, with regard to the curing environment, it is reported that when cement is replaced with GGBFS, the pore structure of concrete changes greatly among underwater curing, air dry curing and carbonation [31,32,33,34,35,36,37]. Furthermore, it is reported that the formation of pores is closely related to the material curing environment and the pore size and distribution inside concrete are closely related to the penetration and diffusion of deteriorating factors outside the concrete [28,34,35,38,39,40,41].
Thus, when GGBFS is used in concrete, the curing conditions have a high correlation with resistance performance against the deteriorating factors of concrete. Therefore, systematic research is required on the variation of resistance of concrete with GGBFS to salt damage according to the curing conditions. To evaluate the effects of curing conditions on concrete containing GGBFS, in this study, the chloride ion penetration resistance of concrete was measured and compared for different curing environments for concrete specimens that were further divided as air-dry cured and underwater cured. Furthermore, the impedances of rebars embedded in concrete were measured and compared. The results of this study are expected to provide basic data on the effects of curing conditions on resistance to chloride ingress of concrete with GGBFS.

2. Materials and Specimens

2.1. Materials

Type 1 ordinary Portland cement (OPC) of ASTM C 150 [42] with a density of 3.15 g/cm3 (S Company, Seoul, South Korea) was used in this study. In addition, Grade-80 GGBFS of ASTM C 989 [43] with a Blaine fineness of 4000 cm2/g (S Company, Seoul, South Korea) was used. Table 1 lists the chemical compositions according to the binder.
To reduce the effect of aggregates between the rebar and concrete cover, the maximum size of coarse aggregates was limited to 13 mm and the fine aggregates were prepared by mixing crushed sand and washed sea sand. In South Korea, it is common to use a combination of crushed aggregates and washed (decontaminated chloride) sea sand owing to the depletion of river sand [44,45]. The superplasticizer and air-entering & high-range water reducing agent were used together to secure the fluidity and air contents of concrete. Also, to control the effects of chloride ion in chemical admixture, the admixture from S company (South Korea) were used, which are not contained chloride ions.

2.2. Concrete Mix Proportion

For this experiment, nine types of concrete specimens were prepared according to the GGBFS replacement ratio and W/B ratio: three GGBFS replacement ratios of OPC 100%, OPC 70% + GGBFS 30% and OPC 40% + GGBFS 60% and three W/B ratios of 40%, 50% and 60%. Table 2 lists the concrete mix proportions according to the experiment levels.

2.3. Specimens

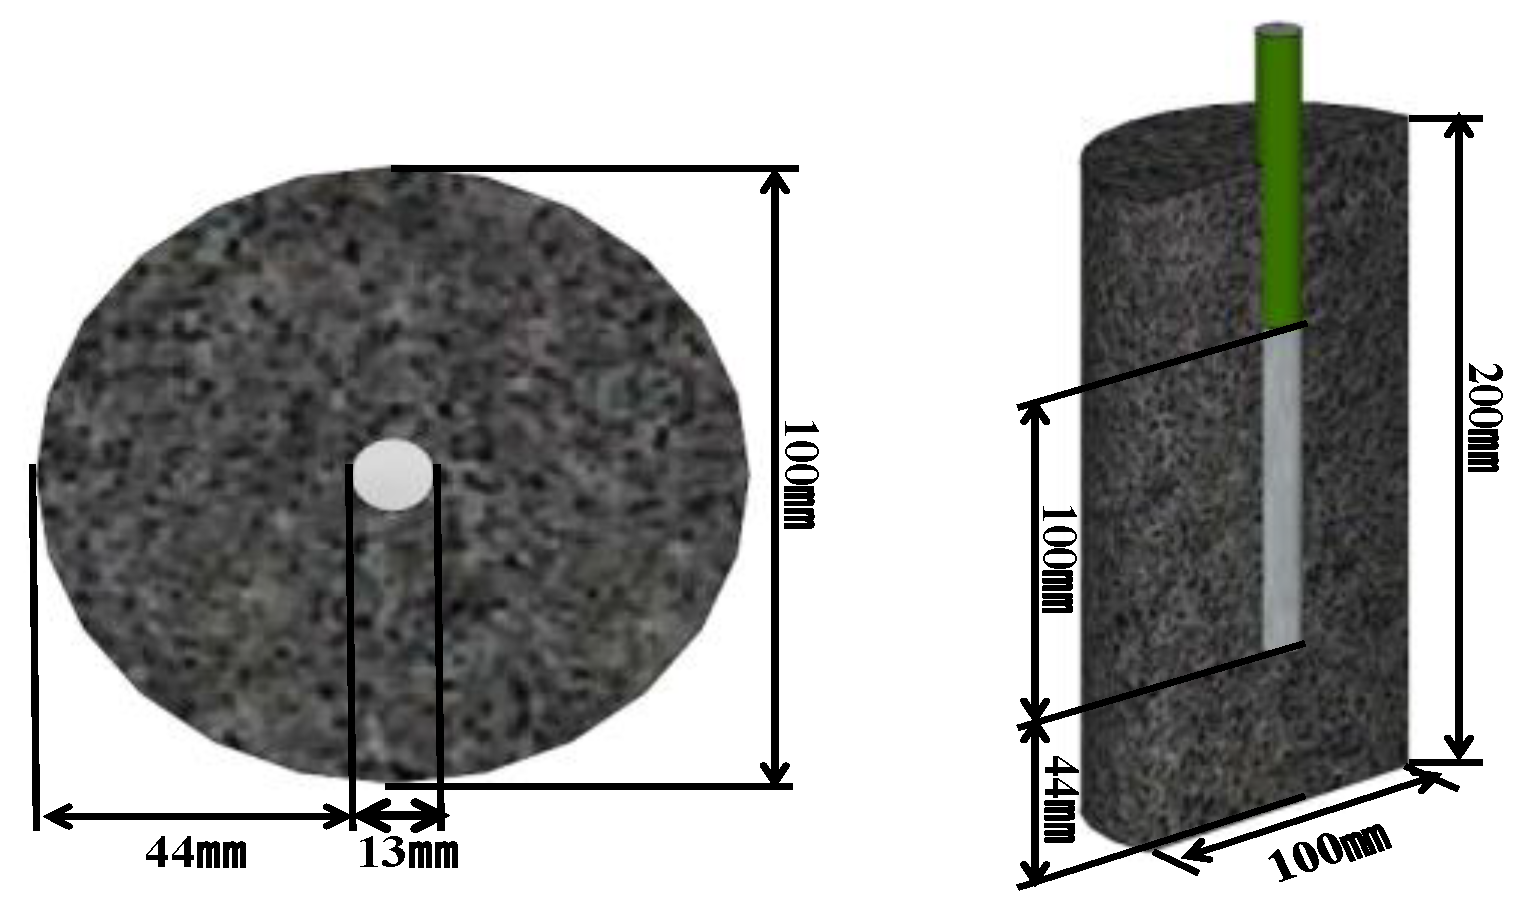
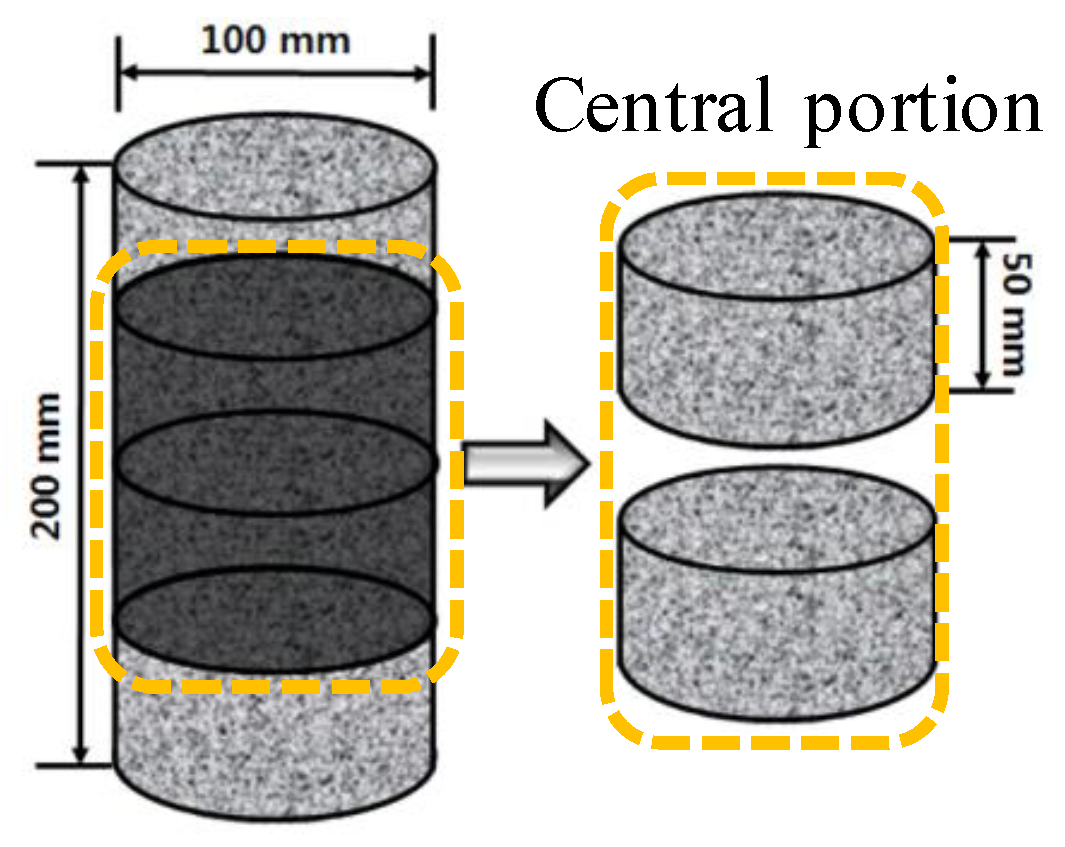
2.3.1. Specimen for Chloride Ion Migration Coefficient of Concrete

Immediately after the concrete was mixed for specimen fabrication, it was poured into a Ø100 × 200 mm cylindrical mold and sealed. The specimen was demolded 24 h later and cured for 28 days. After the curing was complete, the specimen was cut into samples of height 50 mm and the two samples from the middle of the specimen were used. Figure 1 shows the schematic diagram of the concrete specimens for chloride penetration test [46].

2.3.2. Specimen for Electrochemical Measurements

The reinforced concrete specimens were prepared by fixing a ∅13 mm rebar at the center of the Ø100 × 200 mm cylindrical mold and then pouring the concrete into the mold. For the rebar embedded in the concrete, SD-400 deformed rebars were used. After the rebar surface was cleaned by grit blast, an epoxy coating was applied to the surface and only a length of 100 mm at the center of the concrete specimen was exposed. Figure 2 shows a schematic of the fabricated reinforced concrete specimen.

2.3.3. Curing Method

To compare the salt damage resistances of concrete specimens according to the curing conditions, the concrete specimen poured in the mold was demolded after 24 h. Then, the concrete specimens were cured separately for by air and underwater curing for 28 days. The air curing conditions were a temperature of 20 ± 2 °C and relative humidity of 60 ± 5%. For underwater curing, the specimen was completely immersed in water at a temperature of 20 ± 2 °C.

3. Experimental Method

3.1. Evaluation of Concrete Compressive Strength

The concrete compressive strength was evaluated in accordance with ASTM C39 [47] at 3, 7 and 28 days of curing. For each experimental level, nine cylindrical concrete specimens of Ø100 × 200 mm were fabricated. The concrete compressive strengths of three specimens were measured simultaneously and their average value was used.

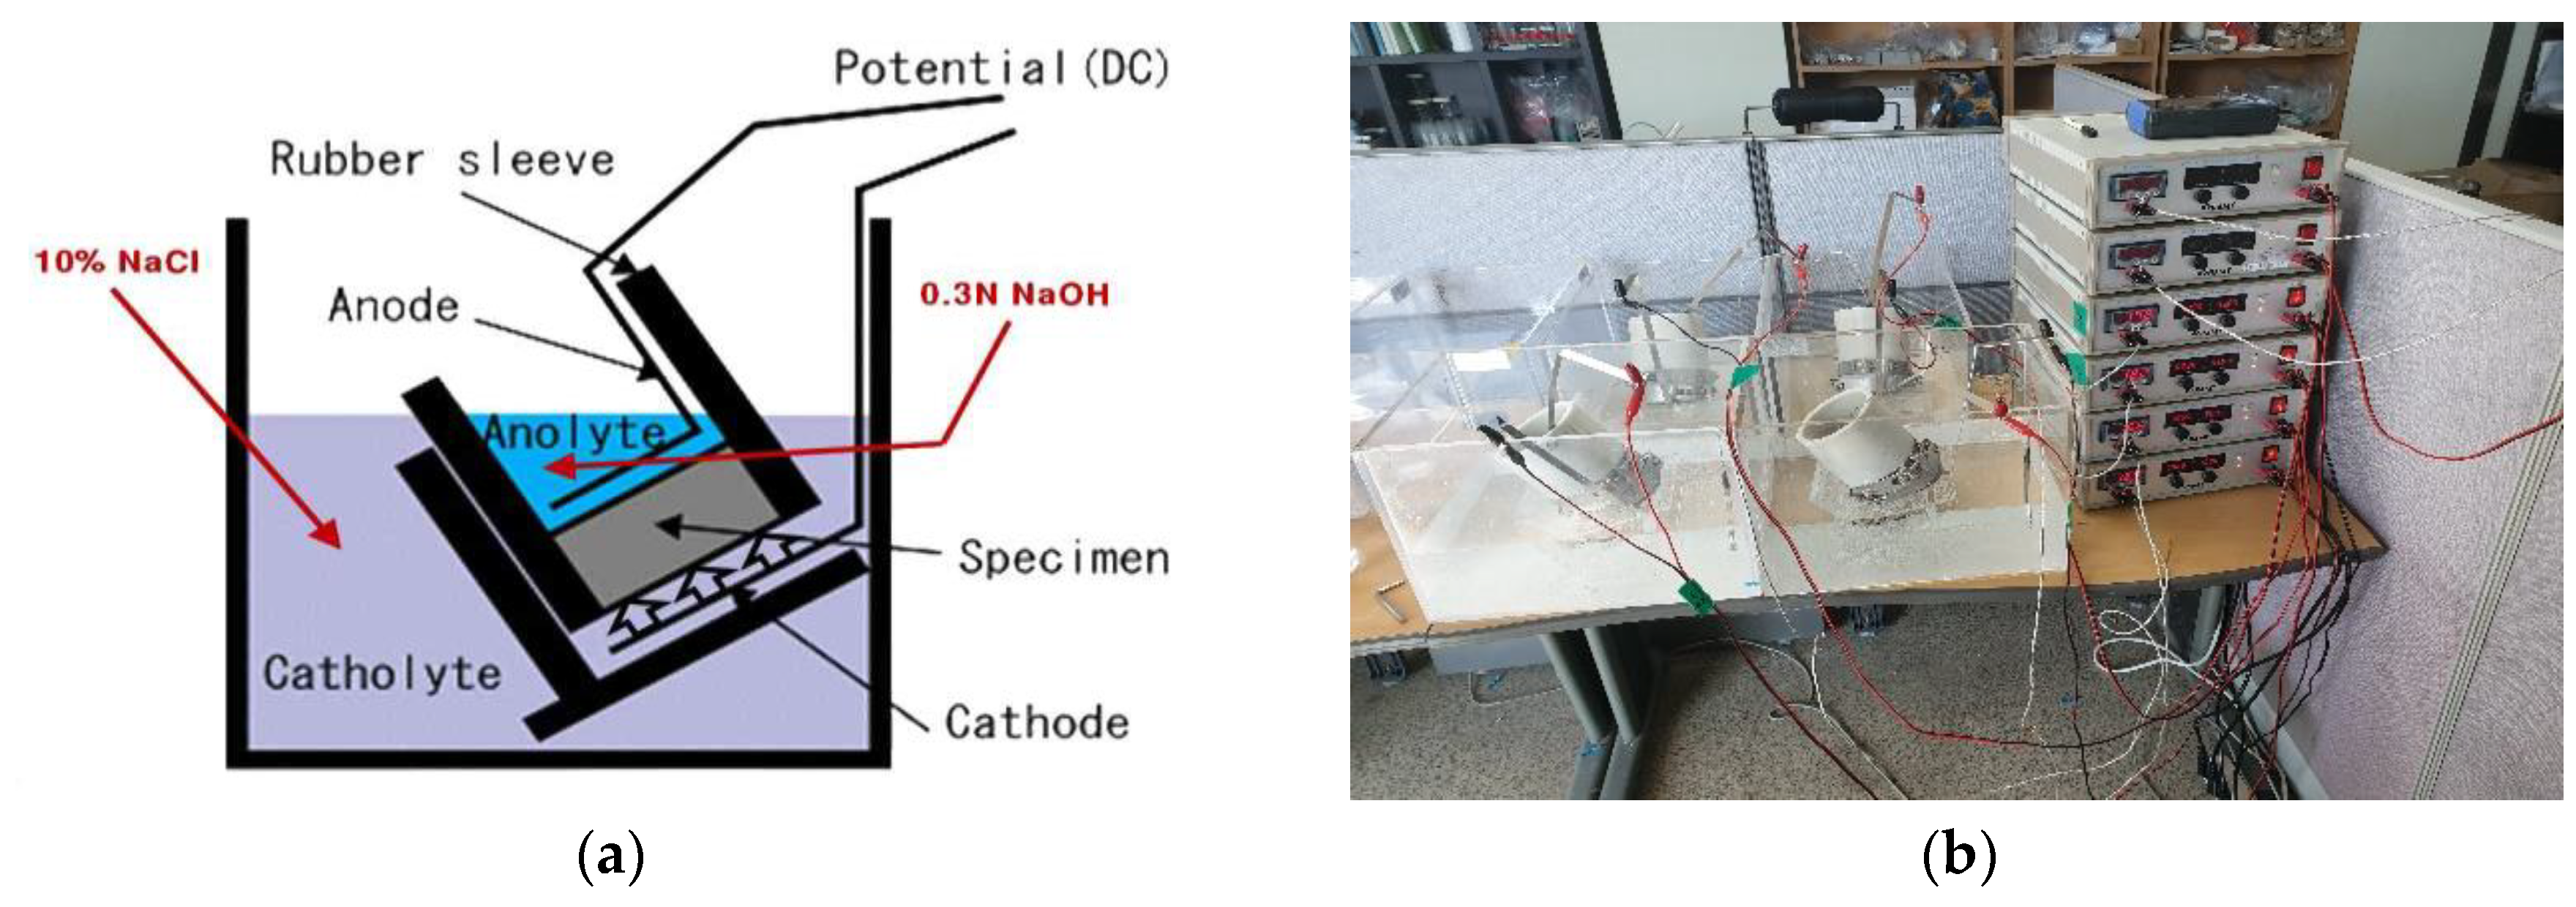
3.2. Evaluation of Resistance to Chloride Ion Penetration of Concrete

To evaluate resistance to chloride ingress of concrete, it is most accurate to conduct exposure test. However, exposure test need a very long time. Therefore, it is common to evaluate the resistance and diffusion coefficient of harmful ions of concrete using electrochemical acceleration. In general, ASTM C 1202 and NT-BUILD 492 are used for evaluating chloride ingress in concrete. In this study, among the chloride ion penetration resistance evaluation methods, the chloride migration coefficient from non-steady-state migration experiments were conducted by NT BUILD 492 [46], which is a northern European regulation often used as a quantitative evaluation method. Figure 3 shows the schematic of the cells configured for this experiment and photographs of the installed experimental setup.
This experiment is a non-steady-state electric migration experiment to determine the chloride migration coefficient of the repair material composed of concrete, mortar and cement. Concrete specimens of size Ø100 × 50 mm were prepared, saturated Ca(OH)2 solution was filled in a desiccator using a vacuum pump and the specimen was immersed in the solution. The inside of the desiccator was maintained in a vacuum state using a vacuum pump and the pores in the concrete were filled with saturated Ca(OH)2 solution. When the pretreatment was complete, chloride ion diffusion cells were prepared as shown in Figure 4. The anode was filled with 0.3M NaOH and the cathode was filled with 10% NaOH solution. Then, the initial current value (l30V) was measured. Next, the actual applied voltage was adjusted by finding the range of current according to the initial value in Table 3. The chloride ion penetration resistance was tested using the potential difference by selecting an appropriate time according to the current.
After the test, the specimen was split in the axial direction into two pieces. When 0.1N AgNO3 solution was sprayed on the split section, discolored parts appeared on the specimen depending on the penetration depth of the chloride ions. The diffusion coefficient was determined using the average of seven measurements in 10 mm intervals of the chloride penetration depth.
Equation (1) is used to estimate the diffusion coefficient from the chloride ion penetration depth [46].
D n s s m   =   0.0239 ( 273 + T ) L ( U 2 ) t ( x d 0.0238 ( 273 + T ) L x d U 2 )
where
  • Dnssm is a non-steady-state migration coefficient (×10−12 m2/s)
  • U is the absolute value of the applied voltage (V)
  • T is the average of the initial and final temperatures in the anolyte solution (°C)
  • L is the thickness of the specimen (mm)
  • x d is the average value of the penetration depths (mm)
  • t is the test duration (hour)

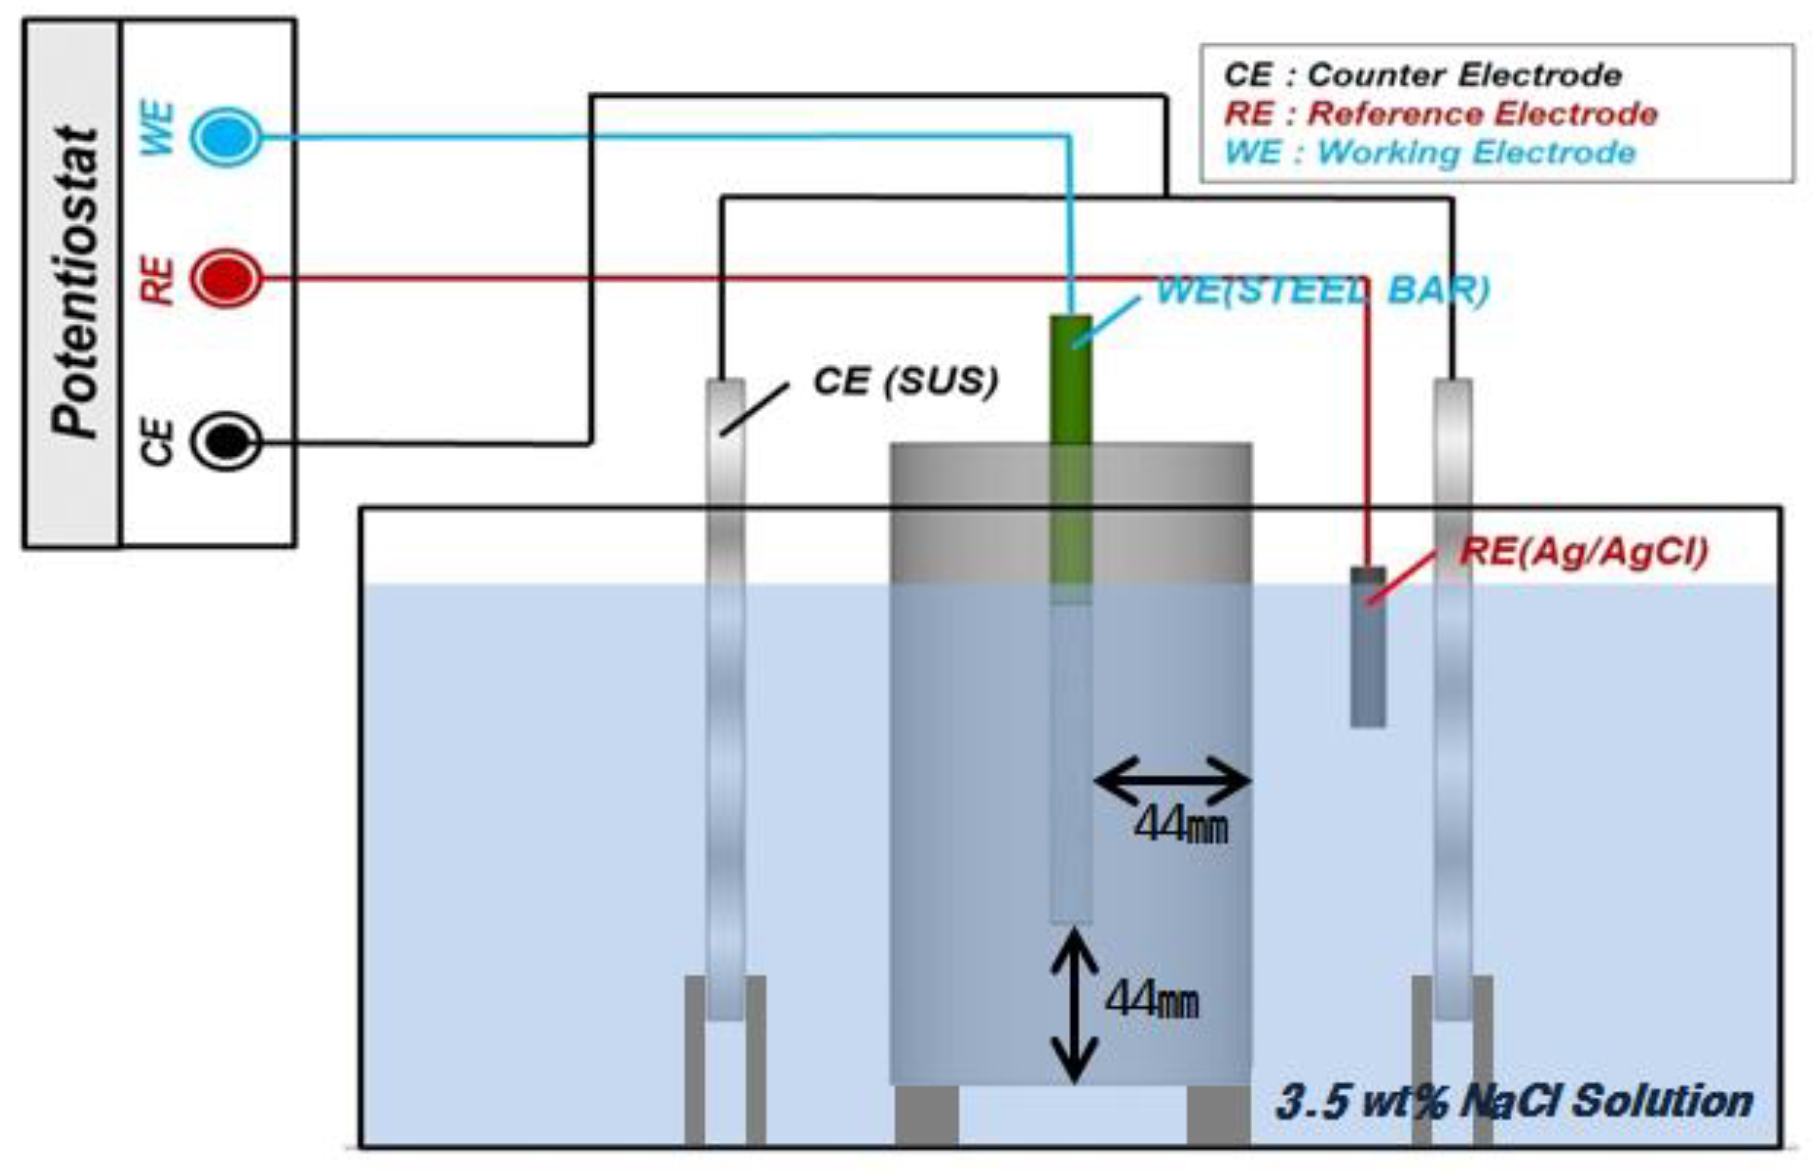
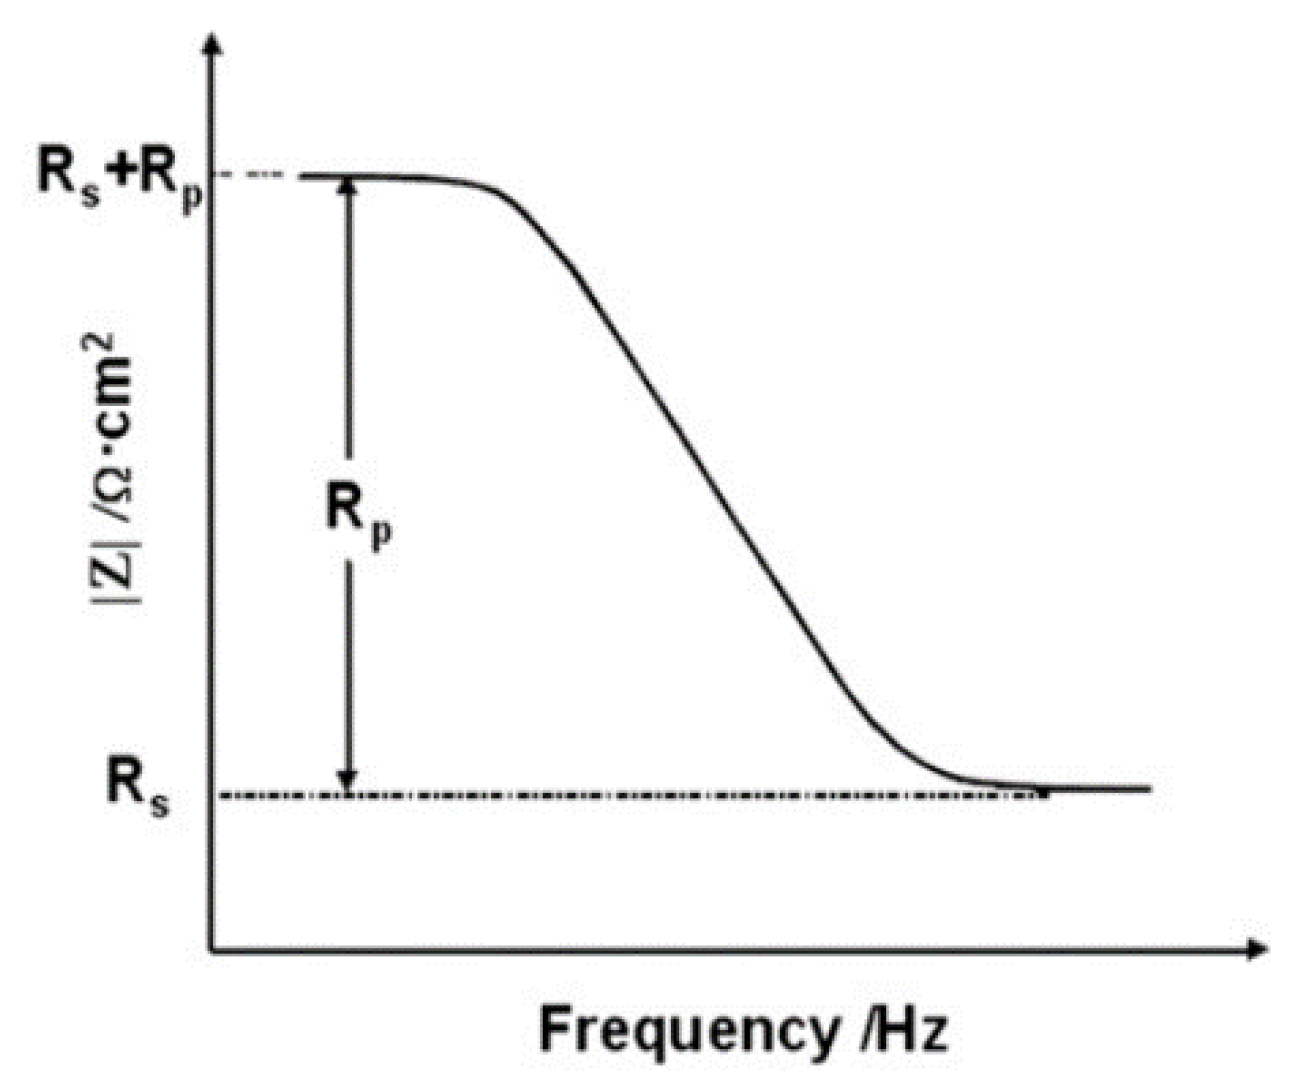
3.3. Electrochemical Measurement

The impedance of the embedded rebar based on the concrete mix and curing conditions was measured using electrochemical impedance spectroscopy (EIS). The experimental apparatus used in this experiment included a Potentiostat (PGSTAT302N, Metrohm Autolab, Kanaalweg, Utrecht, Netherlands). The three-electrode system for the experiment was setup using the rebar as the working electrode (WE), STS304 as the counter electrode (CE) and Ag/AgCl as the reference electrode (RE). Table 4 outlines the EIS experiment and Figure 4 shows a schematic of the cells configured for this experiment [48,49,50].
According to electrochemical theory, a simple electrochemical electrode system can be described by an equivalent circuit [48,49,50], as shown in Figure 5.
Here, Rs denotes the solution resistance, Cdl denotes the capacitance of an electrical double layer and Rp denotes the polarization resistance by charge transfer reaction. Figure 6 shows a Bode plot corresponding to the impedance result graphs for Figure 5.
Rs corresponds to the impedance of the highest frequency and Rs + Rp corresponds to the impedance of the lowest frequency. Regarding the rebars embedded in concrete, the Rp of the rebar is composed of the resistance of the film Rf and the charge transfer resistance Rct [48,49,50,51,52,53]. Therefore, the corrosion resistance performance of the rebars can be represented by Rp. In the EIS experiment, it can be assumed that the value of the Bode plot at 100 kHz is equal to Rs and the value of the plot at 0.1 Hz is equal to Rs + Rp. Therefore, Rp can be calculated.

4. Results and Discussion

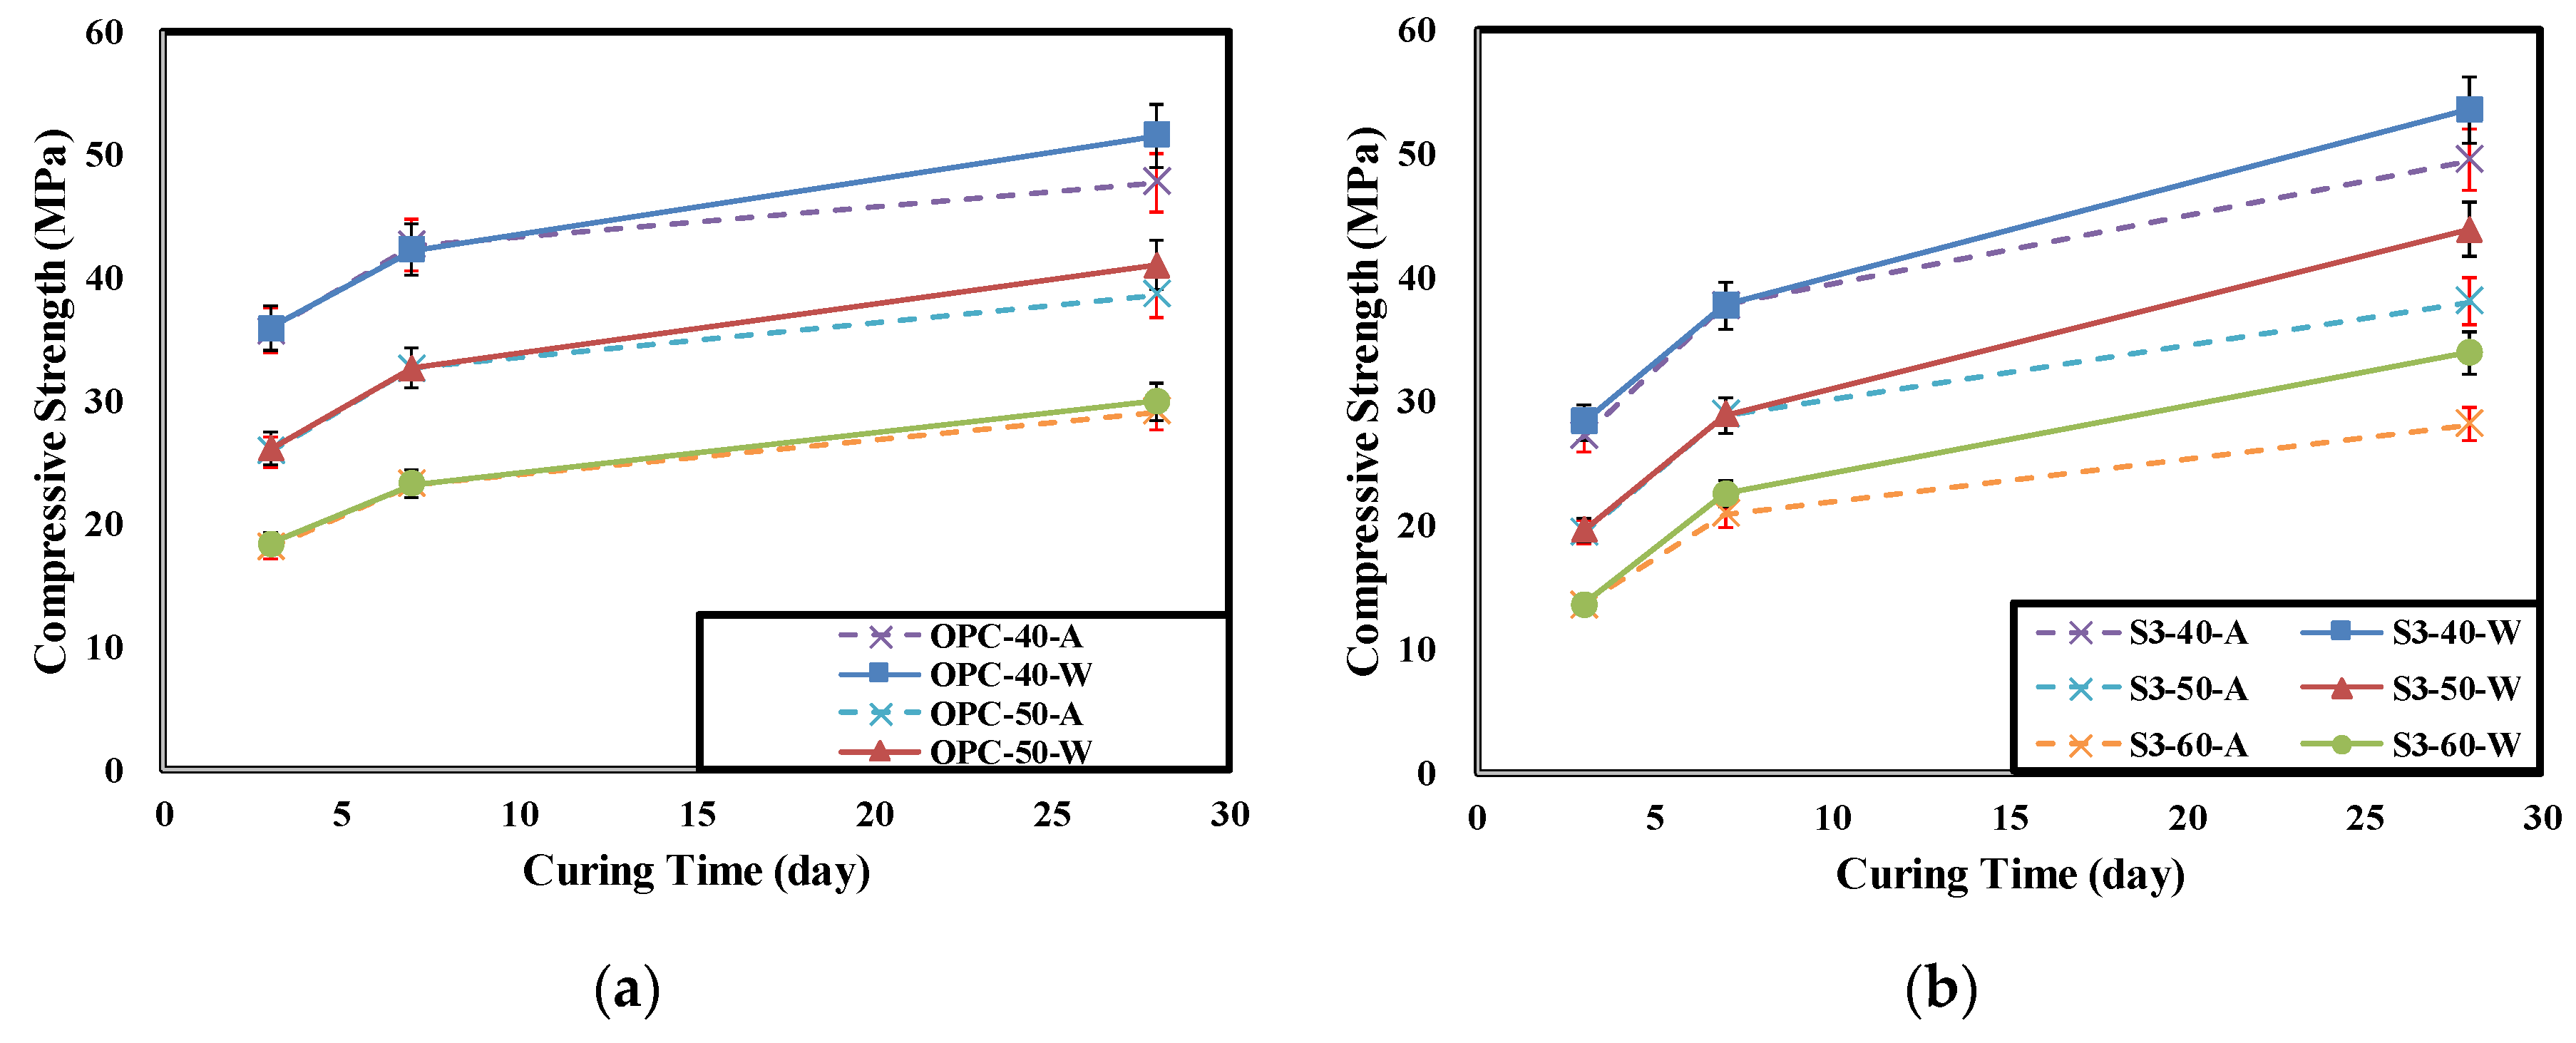
4.1. Result of Concrete Compressive Strength

Table 5 shows the concrete compressive strength for each experimental level according to the curing conditions and age. Figure 7 show the changes in concrete compressive strengths according to the curing conditions and age.
Equation (2) is used for estimating the rate of change for compressive strength by curing condition.
R a t e   o f   c h a n g e ( % ) =   I A U W U W × 100   ( % )
where
  • UW is the result of underwater curing condition
  • IA is the result of air-dry curing condition
The descending order of the measured initial compressive strengths of the concretes is OPC > S3 > S6. However, the 28-day compressive strength of the S3-40-W specimen was 53.6 MPa, which is higher than the 51.7 MPa of the OPC-40-W specimen. The difference was less than 2 MPa, which is not large. This seems to be due to the expression of compressive strength caused by the latent hydraulic activity of the GGBFS. In every specimen, the tendency of decreasing compressive strength with increasing W/B ratio was observed [24,31,39].
In particular, the concrete mixed with GGBFS showed higher dependence on underwater curing for the strength expression than on the OPC. The strength reduction rate of the air-dry cured specimen relative to the underwater cured specimen was less than 8% for the OPC. However, the concrete mixed with additives showed 10–20% strength reduction rates at most levels. The OPC showed a lower strength reduction rate as the W/B increased. This seems to be because many hydration products were generated by the hydration reaction of cement as there was sufficient curing water. The specimen mixed with GGBFS showed a higher strength reduction rate as the W/B increased. This is attributed to the fact that the curing water was insufficient for latent hydraulic activity of the GGBFS and the generation of hydration products decreased owing to the lower absolute quantity of cement. Furthermore, the low age (28 d) was assumed to have had an effect as well. The S3-40 specimen showed a low strength reduction rate. This seems to be because the amount of mix water was sufficient for hydration of the cement and the GGBFS also partially showed latent hydraulic activity [24,39].
Furthermore, the concrete mixed with GGBFS that was air cured showed limited strength expression because the inside of the concrete was not dense owing to slow hydration reaction speed. This is also expected to affect the penetration resistance of chloride ions, which is affected by the porosity. Consequently, as the W/B is lower in the air curing condition, proper mixing of the GGBFS will be more effective in delaying rebar corrosion due to salt damage [24,39].

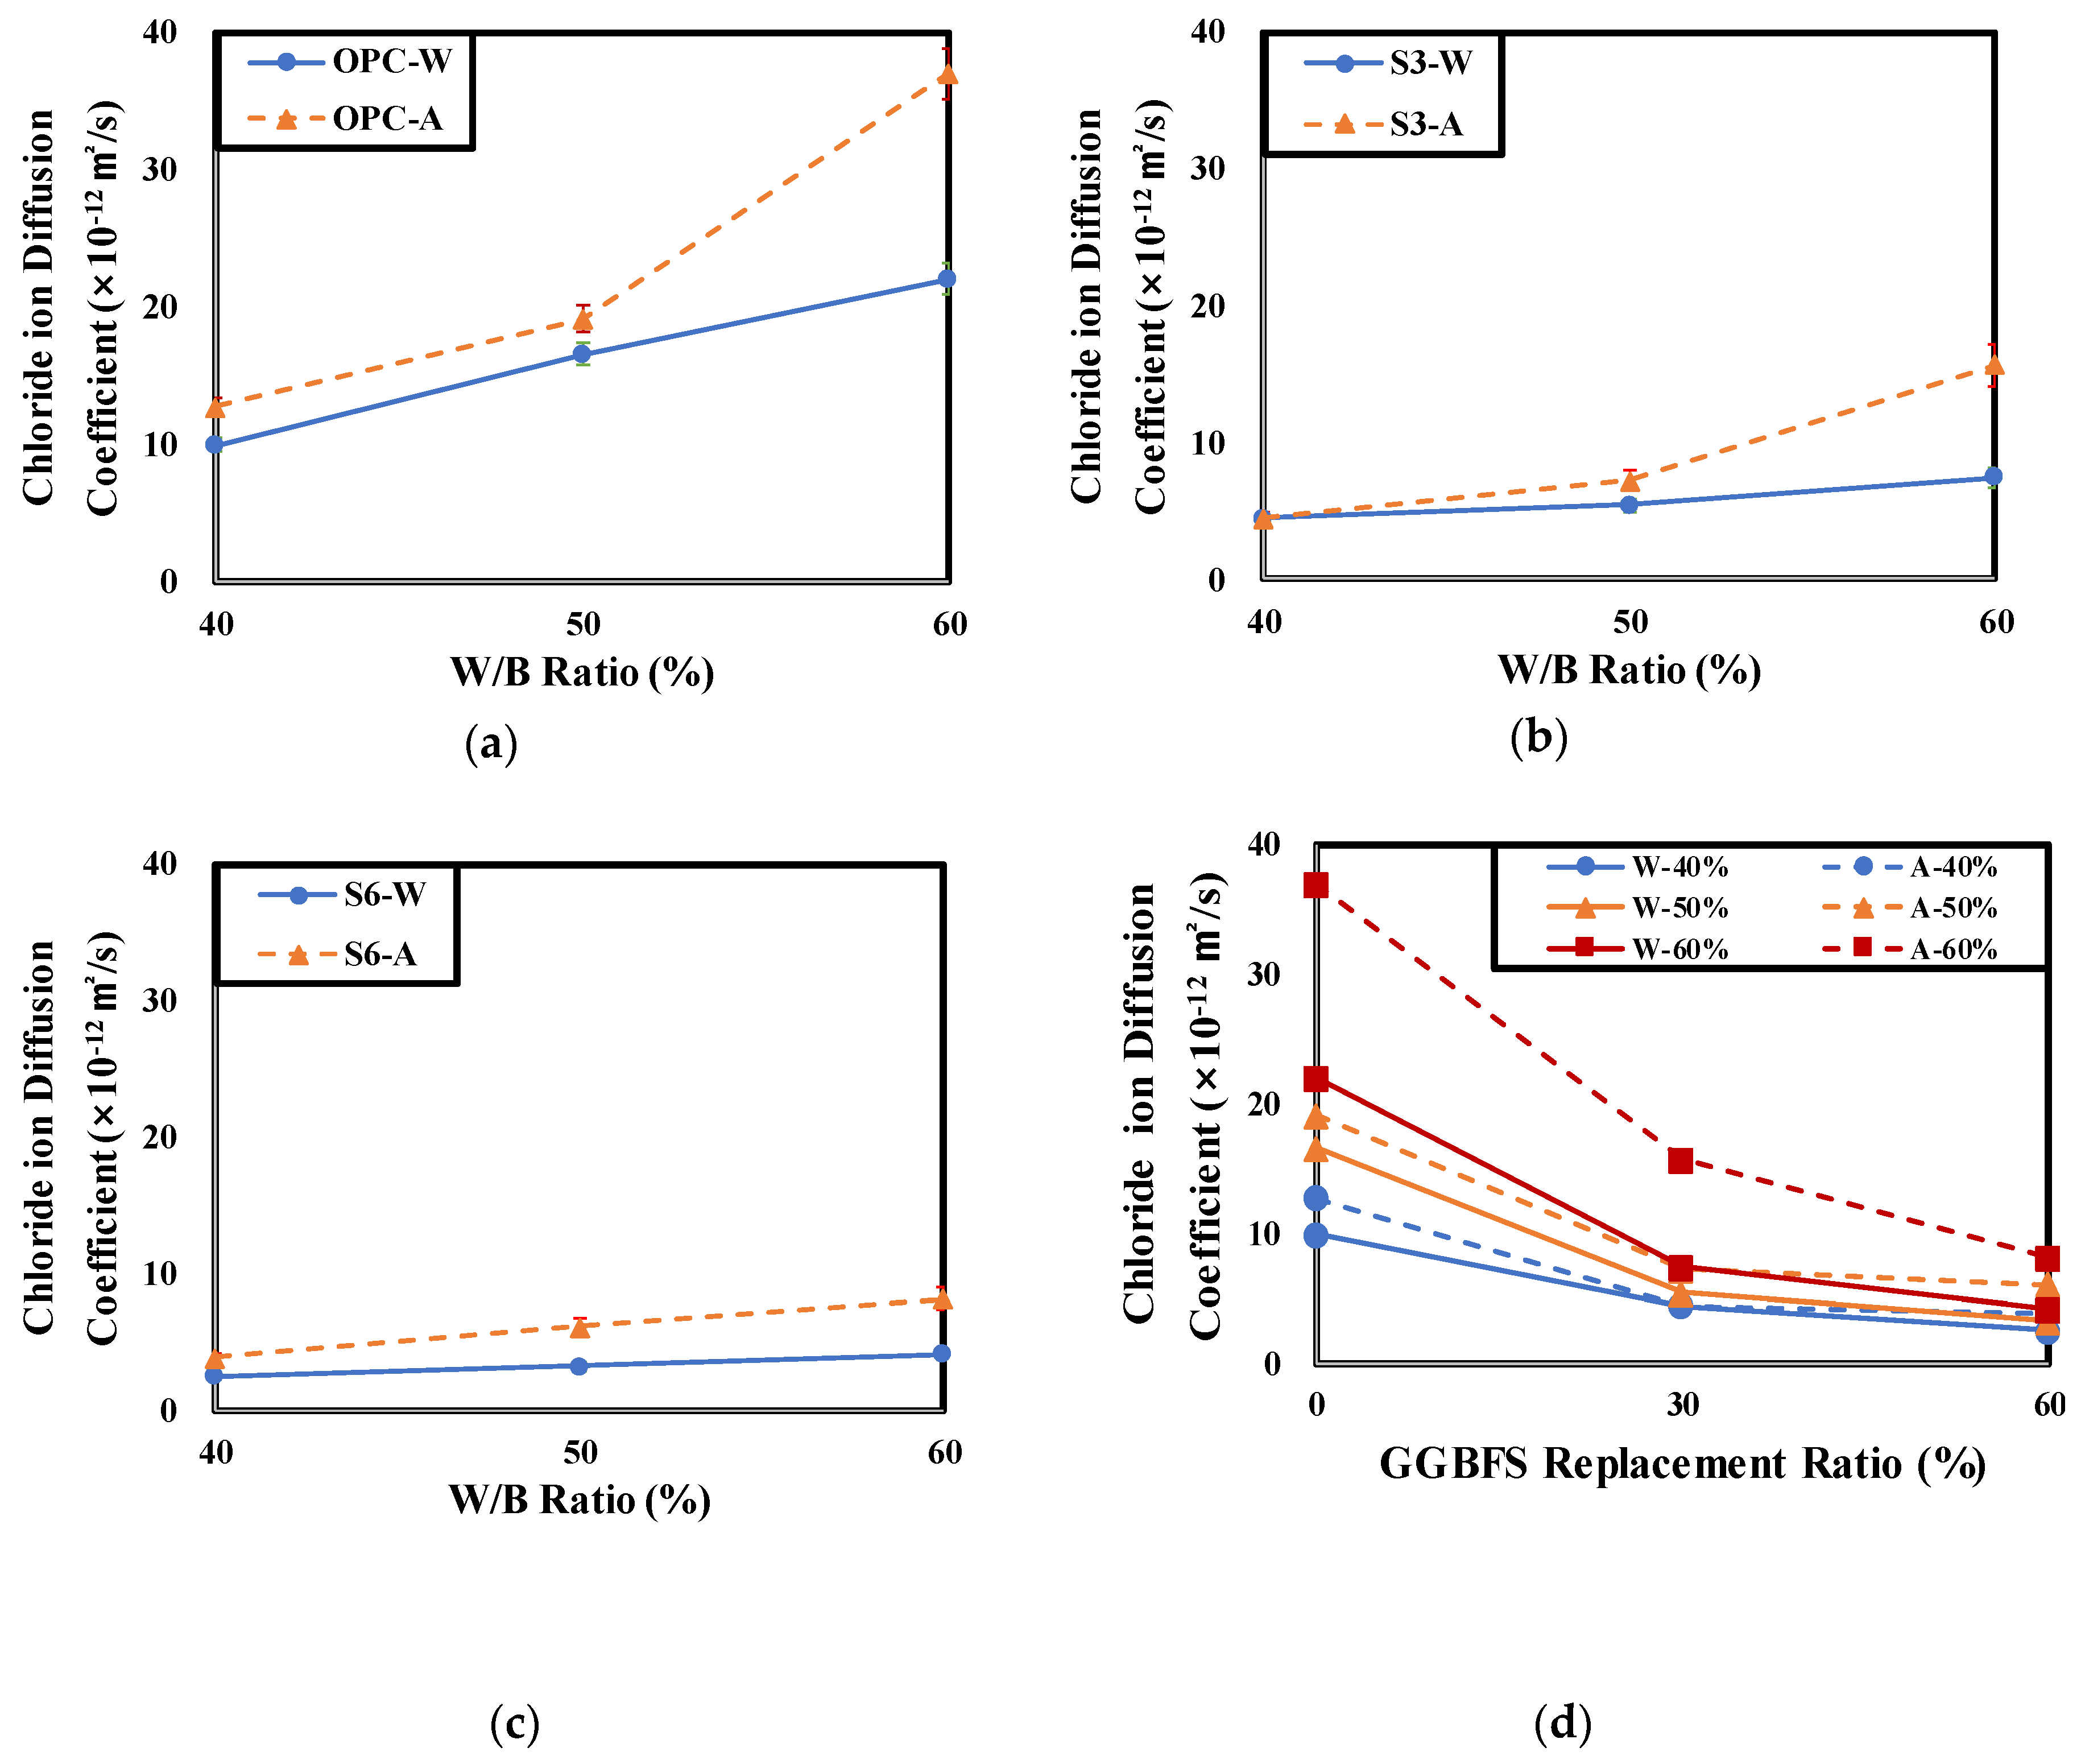
4.2. Results of Chloride Ion Diffusion Coefficient of Concrete

Table 6 and Figure 8 show the chloride ion diffusion coefficient changes of concrete at each experimental level according to the curing conditions and W/B ratio.
As a result of NT BUILD 492 test, Chloride ion diffusion coefficient increase according to W/B ratio increase. All 28-days air-dry cured specimens show higher chloride ion diffusion coefficient than all 28-days under-water cured specimens. Also, Increase rate of chloride ion diffusion coefficient of air-cured specimens by W/B are higher than one of water-cured specimens. Only the S3-40 specimen showed no change in the concrete chloride diffusion coefficient according to curing condition under the condition of W/B 40%. This seems to be because under the air curing condition at GGBFS and W/B replacements of 30% and 40%, dense pore structures were formed by the hydration of concrete and the latent hydraulic activity of GGBFS. In addition, at the W/B of 50% and 60% conditions, the chloride ion diffusion coefficient of the air cured specimen was higher than that of the underwater cured specimen. It was found that as the W/B increased, the chloride diffusion coefficient of the concrete according to the curing conditions increased [39].
In the case of the OPC specimens, the increase rate of the concrete chloride diffusion coefficient decreased by the curing condition as the W/B increased. However, in the case of the OPC with GGBFS specimens, the increase rate of the concrete chloride diffusion by curing condition increased as the W/B increased. The increase rate of OPC was lowest at 17.94% but the increase by absolute value was the highest. The specimen that showed the highest increase rate was S3. The increase rate of the chloride diffusion coefficient of S3 was the lowest at 40% W/B but it was 111% at 60% W/B. All specimens using GGBFS showed high increase rates of chloride diffusion coefficient by the curing conditions as the W/B increased. This is consistent with the tendency of decreasing compressive strength of the air cured concrete relative to the underwater cured concrete mentioned in Section 4.1. This is attributed to the fact that the pore water was not sufficient for the smooth progress of latent hydraulic activity of GGBFS in the air cured condition. Therefore, to secure salt damage resistance of concrete produced by replacing cement with GGBFS, special attention should be paid to the concrete curing condition [54].

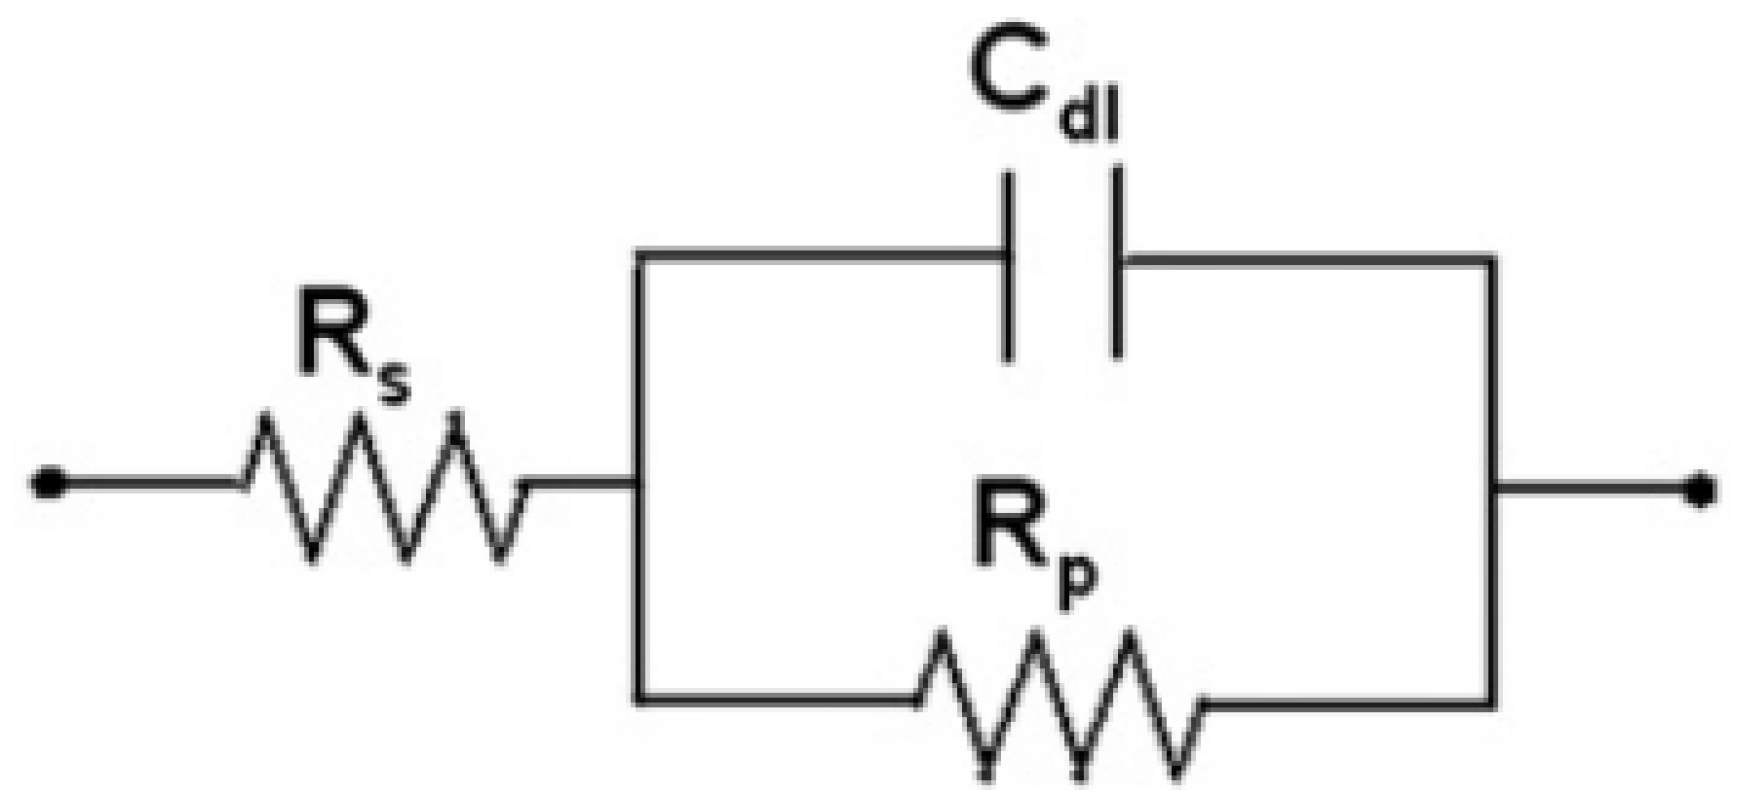
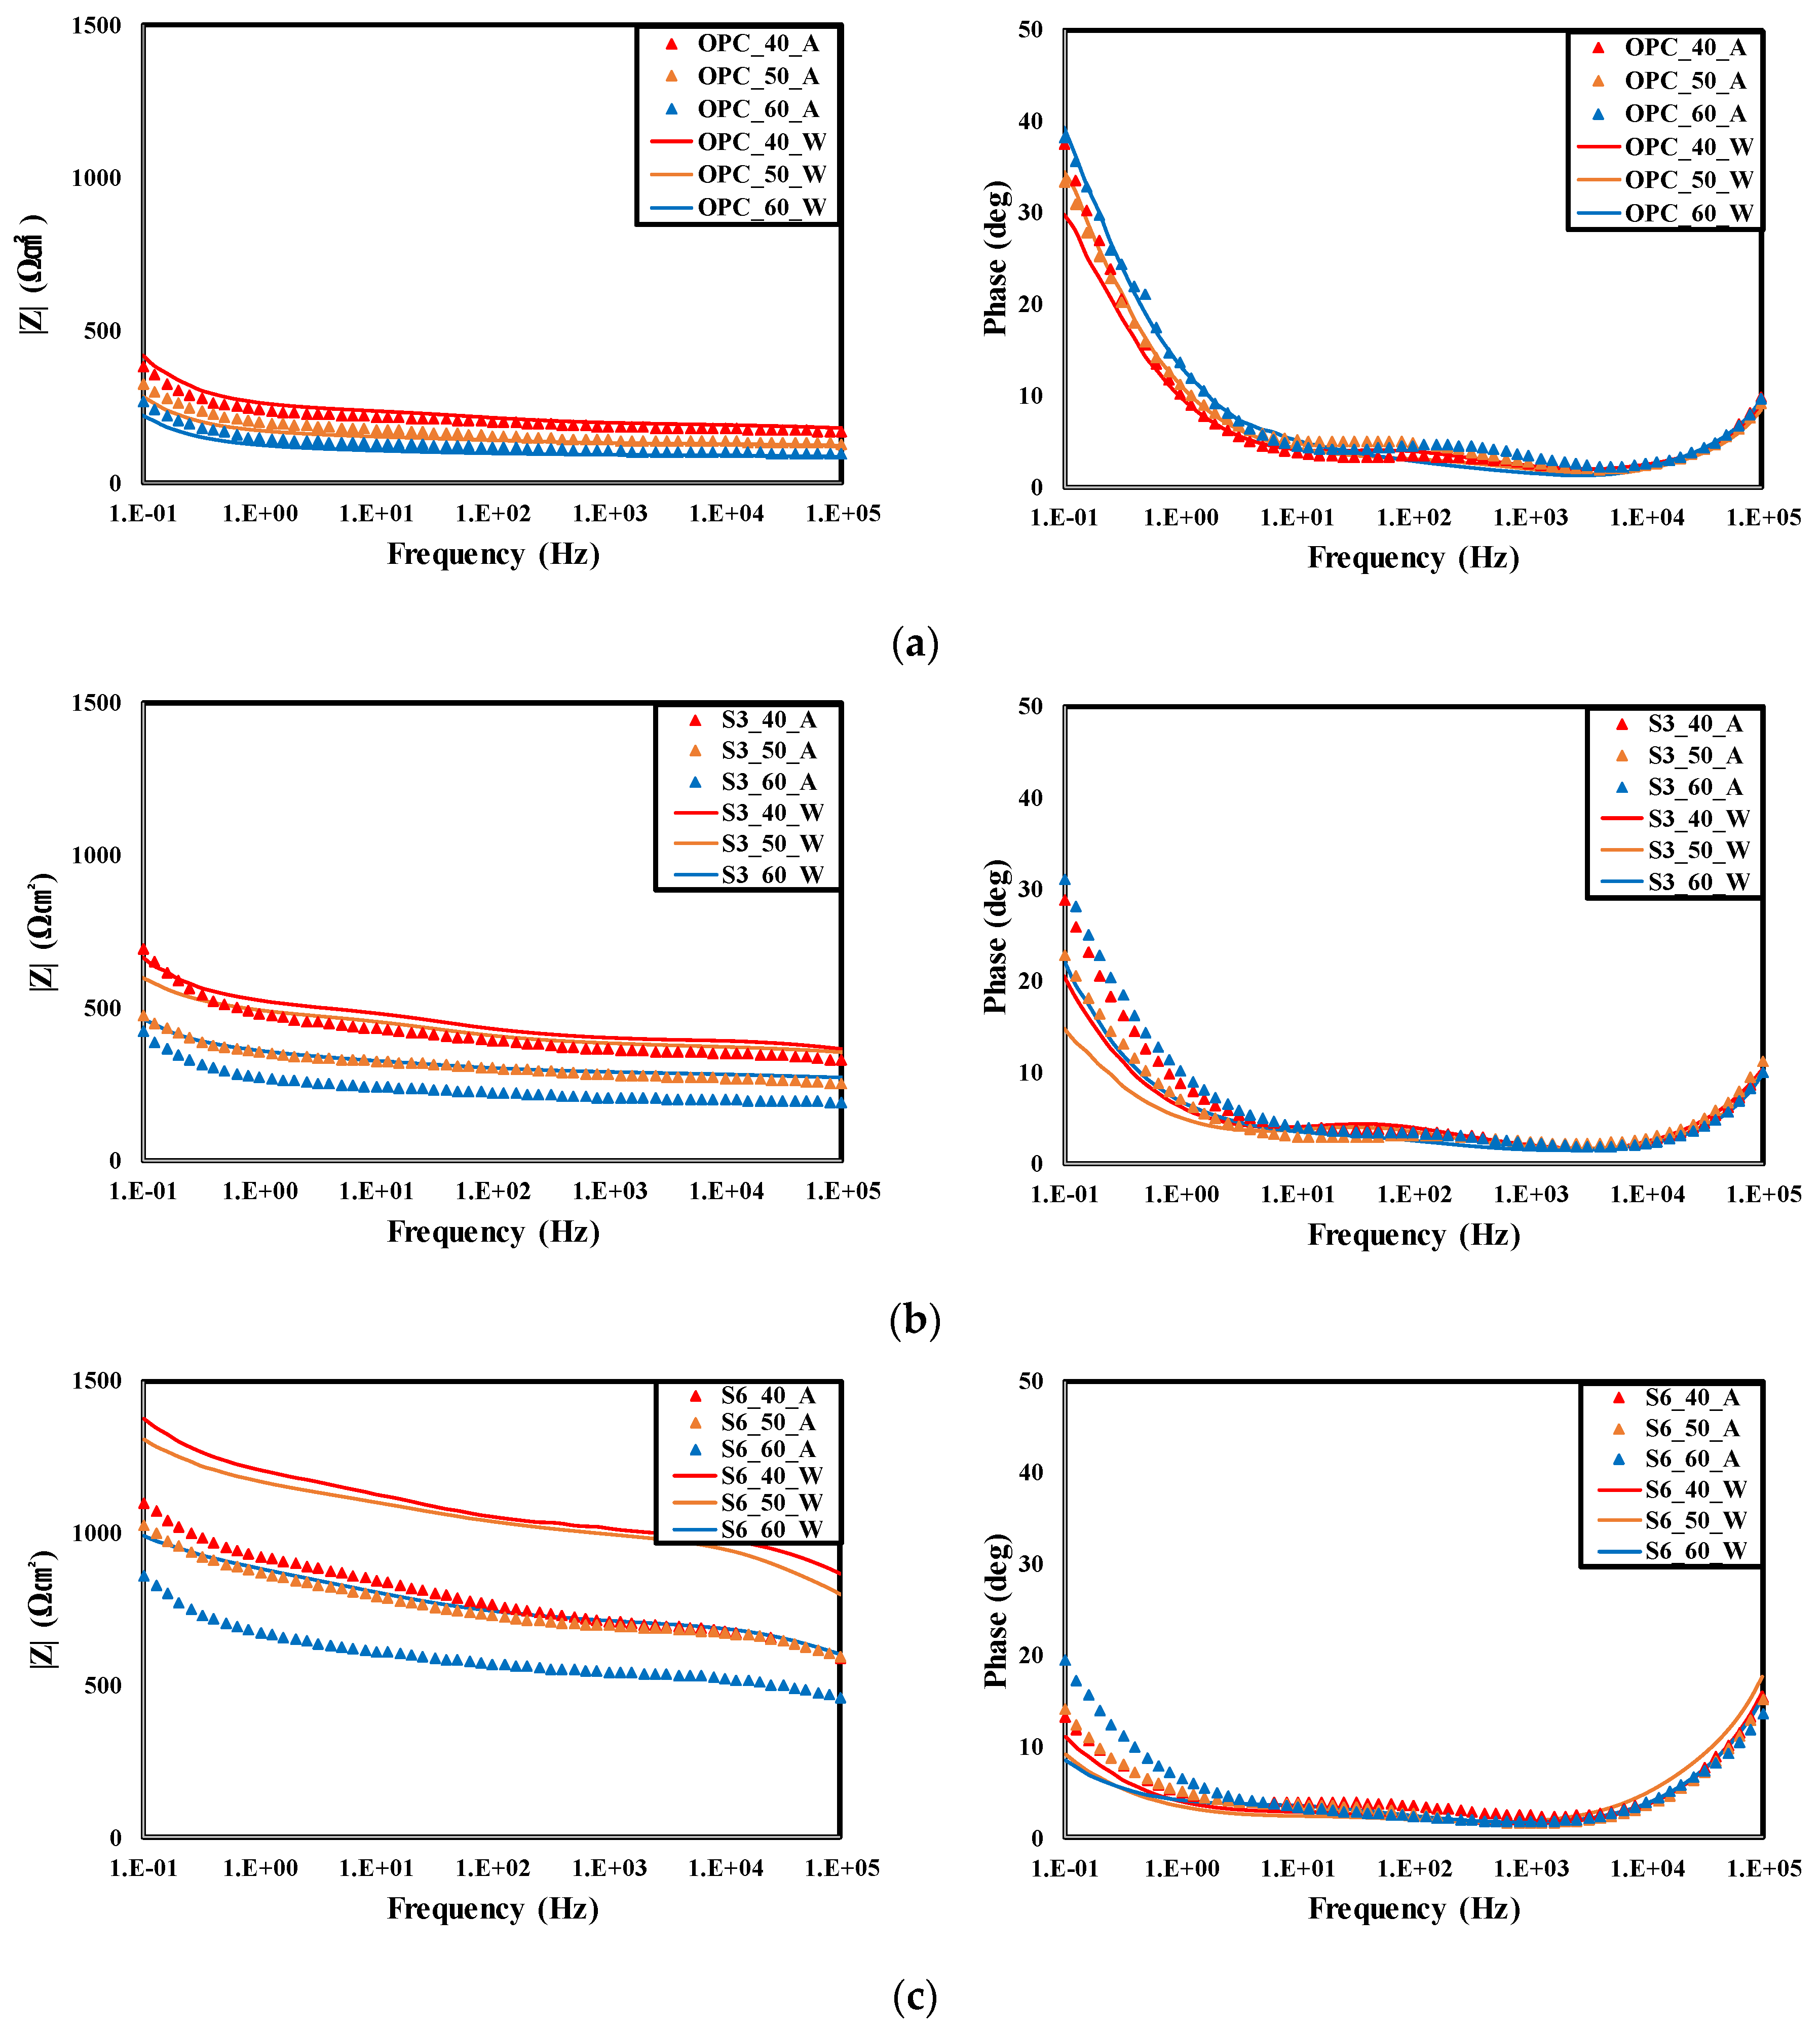
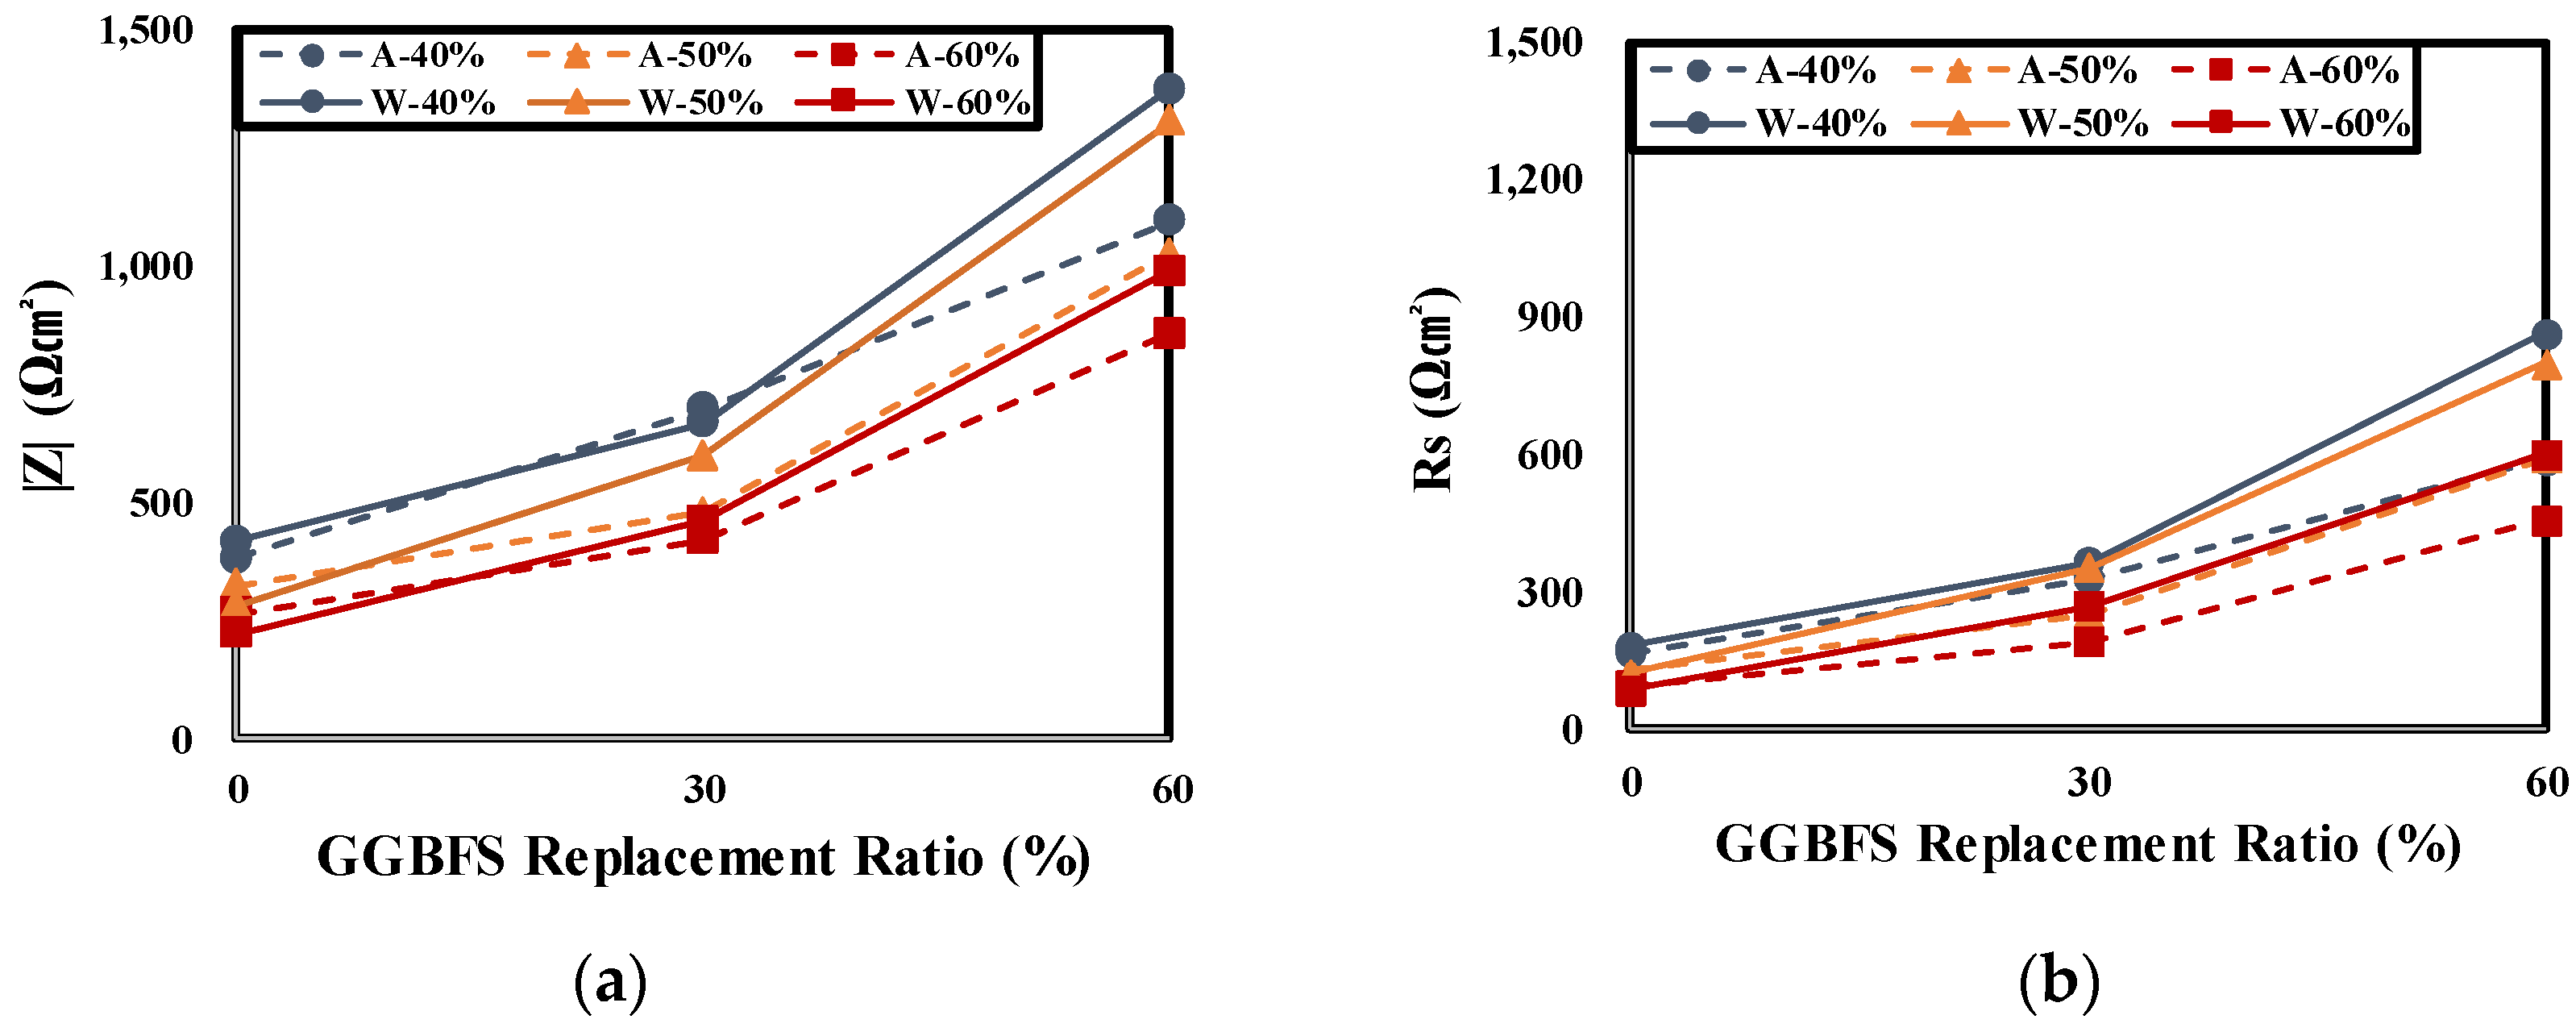
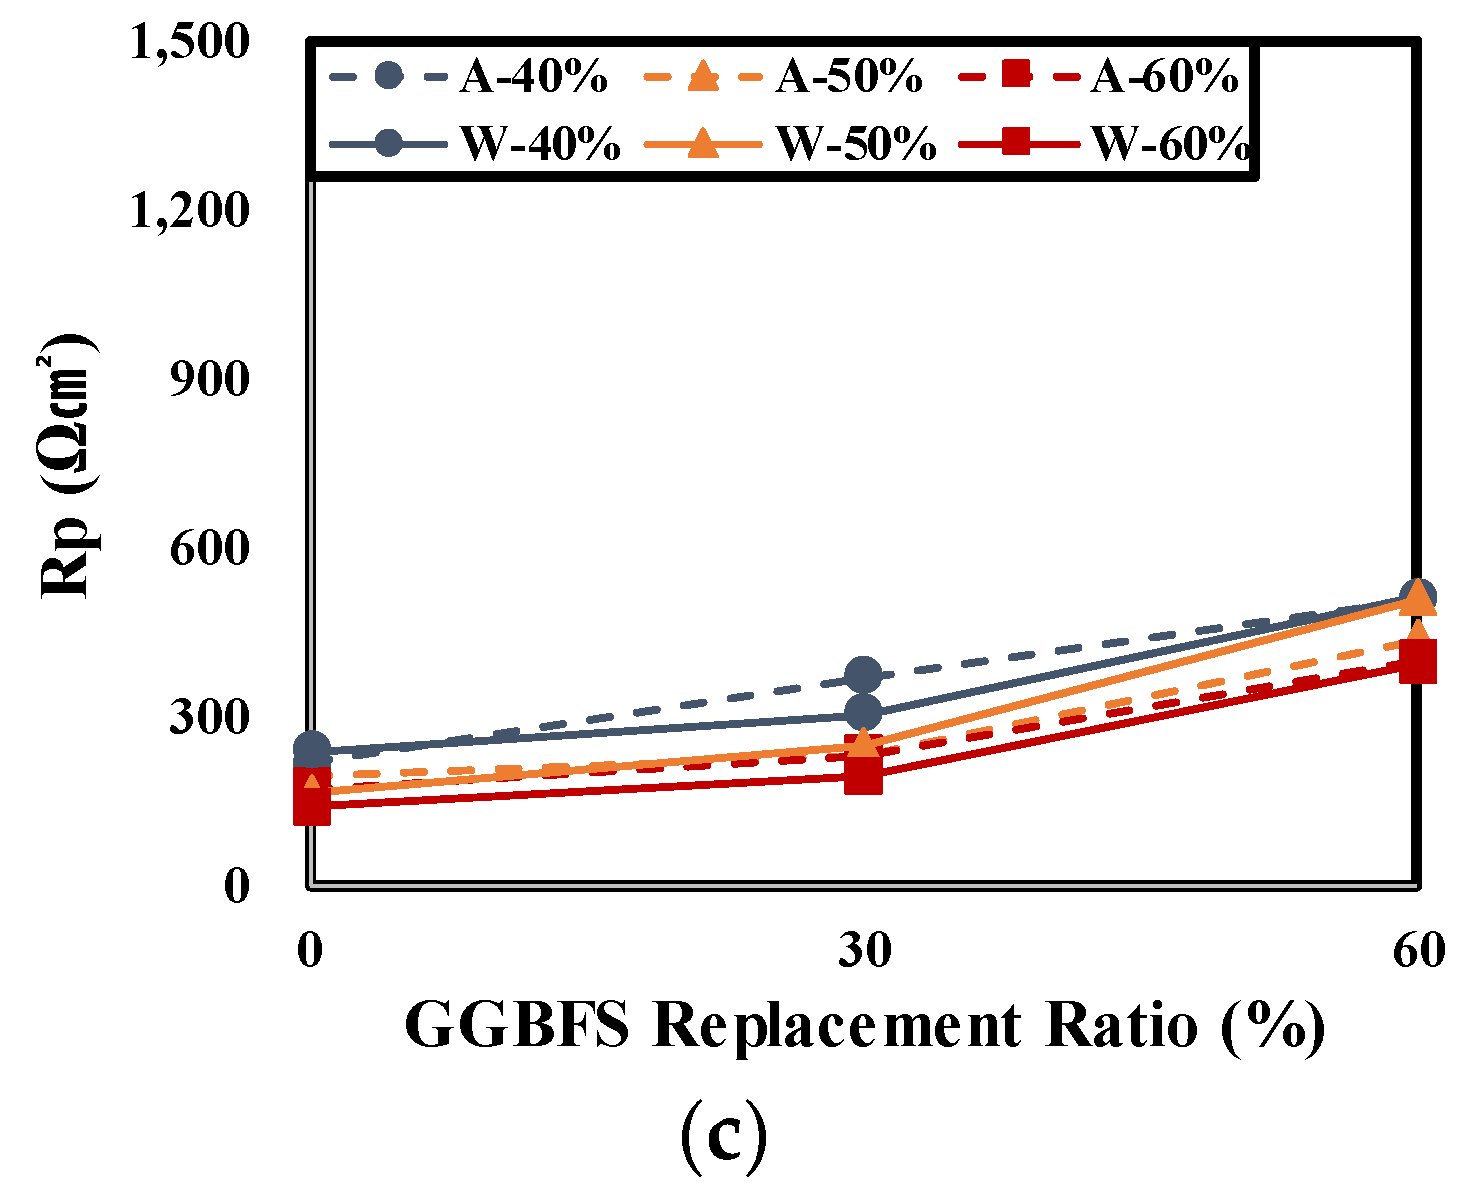
4.3. Result of Electrochemical Measurements

Figure 9 show the Bode Modulus and phase plots for EIS measurement results of rebars embedded in concrete according to the curing conditions.
The descending order of measured impedance |Z| of the rebars embedded in concrete according to the applied frequency range was S6 > S3 > OPC. As the GGBFS replacement ratio of cement increased, the impedances of the rebars embedded in concrete increased [23,52]. For the S6-40-W specimen, which showed the highest |Z|, the |Z| in the low-frequency range was 1374.26 Ωcm2, which is approximately 3.28 times that of the OPC-40-W specimen, 418.46 Ωcm2 and 2.06 times that of the |Z| of the S3-40-W specimen, 668.19 Ωcm2.
Table 7 and Figure 10 show the Rs and Rp for EIS measurement results of rebars embedded in concrete according to the curing conditions and GGBFS replacement ratios.
The OPC specimens showed differences in |Z| depending on W/B and curing conditions but the differences were not large over the entire frequency range. In the case of the OPC specimen, the |Z| values of the rebars embedded in the air cured concrete and underwater cured concrete did not show differences. This suggests that the corrosion resistance performance of the air curing condition is not much different from that of the underwater curing condition. However, the lowest |Z| was observed at every experimental level and the |Z| was low at the low- and high-frequency ranges. This suggests that the |Z|(Rs) in the high-frequency range decreased due to low chloride ion penetration resistance of the concrete of the OPC specimen. This also affects the |Z|(Rs + Rp) in the low-frequency range and shows the same tendency as the measurement results of the concrete chloride diffusion coefficient in the previous experiment [53,54].
However, as the GGBFS replacement ratio increased and W/B decreased, the impedance of the rebars embedded in the air cured specimen decreased compared to the underwater cured specimen. In the case of the S6-40 specimen, the impedance |Z| of the low-frequency range was 1374.26 Ωcm2 for the underwater cured condition and 1095.78 Ωcm2 for the air cured condition. Thus, the |Z| decreased by 20.26% by the curing condition. Furthermore, the impedance |Z| of the high-frequency range was 864.38 Ωcm2 for the underwater cured condition and 588.41 Ωcm2 for the air cured condition. Thus, the |Z| decreased by 31.93% by the curing condition. It is considered that the increase in the chloride ion penetration resistance of concrete caused by the increase in the GGBFS replacement ratio greatly increases the |Z|(Rs) in the high-frequency range, which also affects the |Z| in the low-frequency range. Furthermore, the increase of |Z| of the underwater cured specimen relative to the air cured specimen seems to be due to the dense pore structure of concrete resulting from insufficient pore water for latent hydraulic activity of the GGBFS. As the W/B increases, the amount of pore water increases and the difference of |Z| according to the curing condition decreases. Therefore, this shows the same tendency as that of the chloride diffusion coefficient measurement results of concrete.
Figure 11 shows the relationship between impedance and chloride ion diffusion coefficient.
As the chloride ion diffusion coefficient increases, it was confirmed that the impedance decreased. Results of comparing and evaluating Rs and Rp confirmed that the change of Rs in |Z| is larger than the change of Rp. This is due to the decrease in the chloride ion diffusion coefficient that causes an increase of the solution resistance (Rs) of the concrete. By measuring the impedances of the rebars embedded in concrete, the chloride ion diffusion coefficient of concrete can be determined [55,56]. This relationship is believed to be due to the difference in concrete pore structure according to curing conditions [31,54,55].

5. Conclusions

In this study, the effect of curing conditions on resistance to chloride ingress in concrete using GGBFS was investigated experimentally. Curing conditions were classified into air and underwater curing and cement type of concrete was classified as 0%, 30% and 60% according to the GGBFS replacement ratio. Resistance to chloride ingress was evaluated by measuring the chloride ion diffusion coefficient and impedance. The results are as follows.
  • The evaluation results of the concrete compressive strength showed that the compressive strength of the air cured specimen decreased compared to the underwater cured specimen. As the GGBFS replacement ratio increased, the compressive strength reduction rate increased. The reason for this seems to be that when air curing is performed, pore water is not enough for sufficient exhibition of latent hydraulic activity of the GGBFS and thus, it decreases the generation of hydration products.
  • The evaluation result of the concrete chloride ion diffusion coefficient showed that the chloride ion diffusion coefficient of the air cured specimen was higher than that of the underwater cured specimen. Furthermore, the higher the GGBFS replacement ratio, the lower is the chloride ion diffusion coefficient. The high fineness and latent hydraulic activity reaction of GGBFS decreased the concrete chloride ion diffusion coefficient compared to the OPC but when air curing was performed, the chloride ion diffusion coefficient increased relative to underwater curing.
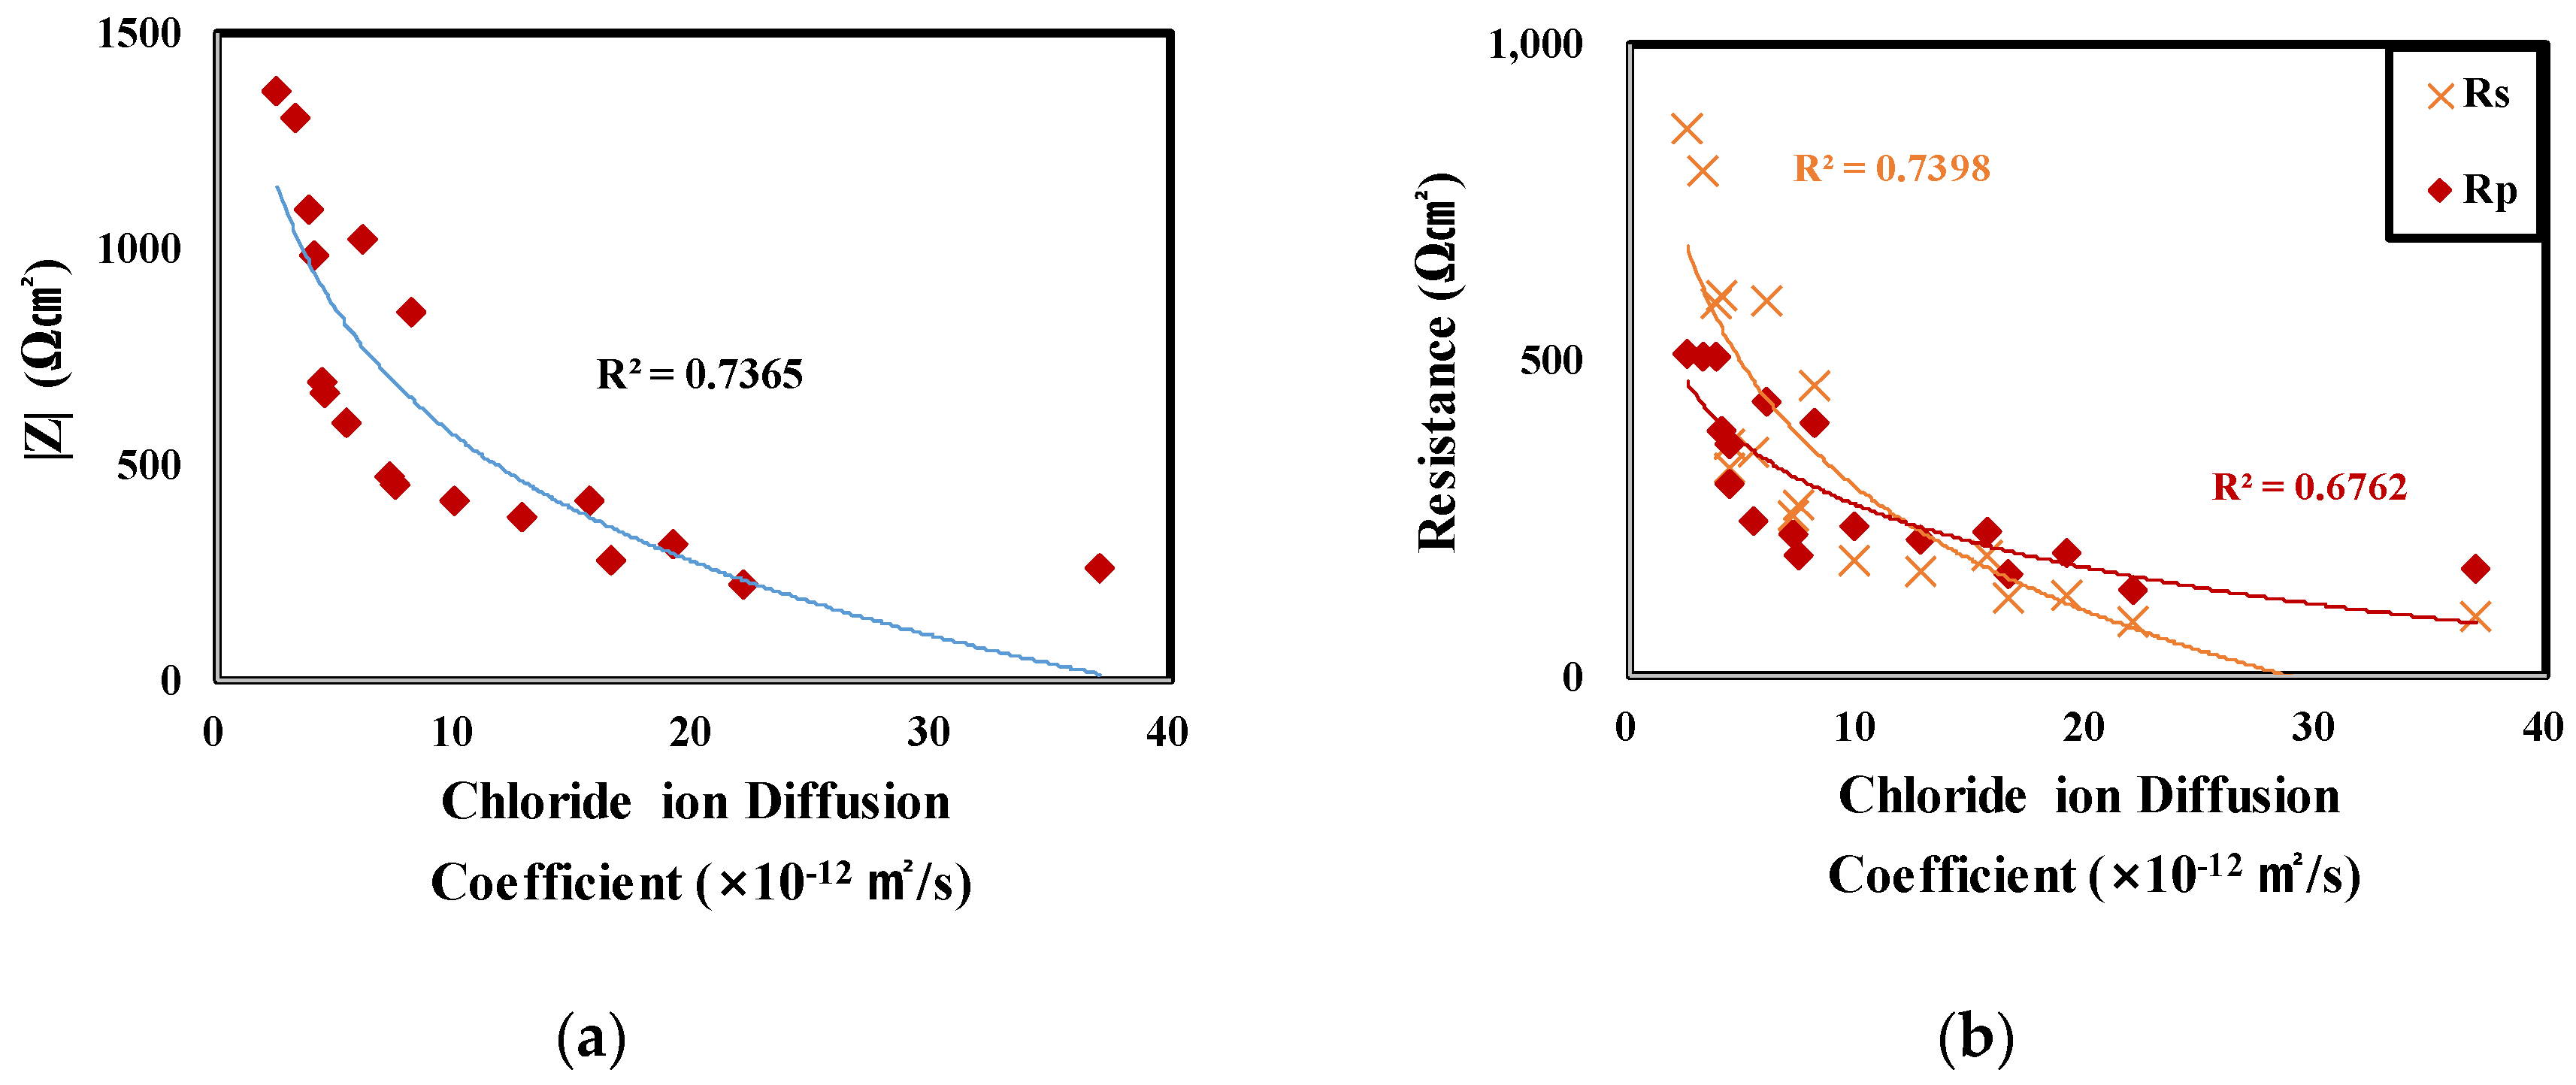
  • The impedance measurement results of rebars embedded in concrete showed that the |Z| of the air cured specimen decreased in every frequency range relative to the underwater cured one at all levels. As the GGBFS replacement ratio increased, |Z| increased in every frequency range. This showed the same tendency as the evaluation result of the concrete chloride ion diffusion coefficient. It is considered that the higher the chloride penetration resistance is, the higher is the |Z| value of the rebars embedded in concrete.
  • As the GGBFS replacement rate increased, the performance of the underwater cured specimen was higher relative to the air cured specimen in every experiment. This suggests a high dependence on underwater curing. Therefore, when concrete is manufactured using GGBFS, special care should be devoted to the curing conditions.

Author Contributions

Conceptualization, H.L. and C.P. and S.J.; methodology, H.L. and C.P.; software, J.P.; validation, H.L. and J.P.; formal analysis, J.P.; investigation, S.J.; resources, J.P.; data curation, J.P.; writing—original draft preparation, J.P.; writing—review and editing, H.L. and J.P.; visualization, J.P.; supervision, H.L.; project administration, J.P.; funding acquisition, H.L.

Funding

This work was supported by a National Research Foundation of Korea (NRF) grant funded by the Korean government (MSIT) (No. 2015R1A5A1037548).

Conflicts of Interest

The authors declare no conflict of interest.

References

  1. Watson, R. Spaghetti Junction lifts off£ 400m repairs. New Civ. Eng. 1990, 28, 7. [Google Scholar]
  2. Wallbank, E.J. The Performance of Concrete in Bridges. A Survey of 200 Highway Bridges; Department of Transport, HMSO: London, UK, 1989; p. 96. [Google Scholar]
  3. Rosenberg, A.; Hanson, C.M.; Andrade, C. Mechanisms of corrosion of steel in concrete. In Material Science of Concrete; Skalny, J., Ed.; American Ceramic Society: Westerville, OH, USA, 1989; pp. 285–313. [Google Scholar]
  4. Kumar, V. Protection of steel reinforcement for concrete—A review. Corrosion Reviewer. 1998, 16, 317–358. [Google Scholar] [CrossRef]
  5. Page, C.L.; Havdahl, J. Electrochemical monitoring of corrosion of steel in microsilica cement pastes. Mater. Struct. 1985, 18, 41–47. [Google Scholar] [CrossRef]
  6. Lomborg, B. The Skeptical Environmentalist: Measuring the Real State of the World; Cambridge University Prdess: Cambridge, UK, 2003. [Google Scholar]
  7. Shi, X.; Xie, N.; Fortune, K.; Gong, J. Durability of steel reinforced concrete in chloride environments: An overview. Constr. Build. Mater. 2012, 30, 125–138. [Google Scholar] [CrossRef]
  8. Jang, S.Y.; Karthick, S.; Kwon, S.J. Investigation on durability performance in early aged high-performance concrete containing GGBFS and FA. Adv. Mater. Sci. Eng. 2017, 2017, 3214696. [Google Scholar] [CrossRef]
  9. Page, C.; Short, N.R.; Tarras, A. Diffusion of chloride ions in hardened cement pastes. Cem. Concr. Res. 1981, 11, 395–406. [Google Scholar] [CrossRef]
  10. Hussain, S.E. In Mechanisms of High Durability Performance Plane and Blended Cements. Ph.D. Thesis, Department Civil Engineering, King Fahd University of Petroleum and Minerals, Dhahran, Saudi Arabia, 1991; pp. 221–228. [Google Scholar]
  11. Al-Amoudi, O.S.B.; Maslehuddin, M.; Al-Mana, A.I. Prediction of long-term corrosion resistance of plain and blended cement concretes. Mater. J. 1993, 90, 564–570. [Google Scholar]
  12. Fulton, F.S. The Properties of Portland Cements Containing Milled Granulated Blast-Furnace Slag; Portland Cement Institute: Johannesburg, South Africa, 1974. [Google Scholar]
  13. Boğa, A.R.; Topçu, I.B. Influence of fly ash on corrosion resistance and chloride ion permeability of concrete. Constr. Build. Mater. 2012, 31, 258–264. [Google Scholar] [CrossRef]
  14. Thomas, M.D.A.; Hooton, R.; Scott, A.; Zibara, H. The effect of supplementary cementitious materials on chloride binding in hardened cement paste. Cem. Concr. Res. 2012, 42, 1–7. [Google Scholar] [CrossRef]
  15. Lee, H.S.; Ismail, M.; Hussin, M.W. Durability Probabilistic Evaluation of RC Structures Subjected to Chloride Ion. Renew. Energy Sustain. Dev. 2015, 1, 160–166. [Google Scholar]
  16. Malhotra, V.M. Role of supplementary cementing materials in reducing greenhouse gas emissions. In Concrete Technology for a Sustainable Development in the 21st Century; E&FN Spon: London, UK, 2000; pp. 226–235. [Google Scholar]
  17. Berke, N.S. Resistance of Microsilica Concrete to Steel Corrosion Erosion and Chemical Attack. Spec. Publ. 1989, 114, 861–886. [Google Scholar]
  18. Swamy, R.N. Blended Cements in Construction; Elsevier Applied Science: London, UK, 1991. [Google Scholar]
  19. Hussain, S.E. Rasheeduzzafar. Corrosion resistance performance of fly ash blended cement concrete. ACI Mater. J. 1994, 91, 264–272. [Google Scholar]
  20. Ozyildirim, C.; Halstead, W.J. Improved concrete quality with combinations of fly ash and silica fume. ACI Mater. J. 1994, 91, 587–594. [Google Scholar]
  21. Güneyisi, E.; Özturan, T.; Gesoğlu, M. Laboratory investigation of chloride permeability for high performance concrete containing fly-ash and silica fume. In Innovations and Developments in Concrete Materials and Construction: Proceedings of the International Conference Held at the University of Dundee, Scotland, UK, 9–11 September 2002; Thomas Telford Publishing: Dundee, UK, 2002; pp. 295–305. [Google Scholar]
  22. Luo, R.; Cai, Y.; Walng, C.; Huang, X. Study of chloride binding and diffusion in GGBS concrete. Cem. Concr. Res. 2003, 33, 1–7. [Google Scholar] [CrossRef]
  23. Cheng, A.; Huang, R.; Wu, J.-K.; Chen, C.-H. Influence of GGBS on durability and corrosion behavior of reinforced concrete. Mater. Chem. Phys. 2005, 93, 404–411. [Google Scholar] [CrossRef]
  24. Song, H.W.; Saraswathy, V. Studies on the corrosion resistance of reinforced steel in concrete with ground granulated blast-furnace slag—An overview. J. Hazard. Mater. 2006, 138, 226–233. [Google Scholar] [CrossRef] [PubMed]
  25. Wei, J.; Dong, J.H.; Ke, W. Corrosion resistant performance of a chemical quenched rebar in concrete. Constr. Build. Mater. 2011, 25, 1243–1247. [Google Scholar] [CrossRef]
  26. Wang, Z.; Zeng, Q.; Wang, L.; Yao, Y.; Li, K. Corrosion of rebar in concrete under cyclic freeze–thaw and Chloride salt action. Constr. Build. Mater. 2014, 53, 40–47. [Google Scholar] [CrossRef]
  27. Topçu, İ.B.; Boğa, A.R. Effect of ground granulate blast-furnace slag on corrosion performance of steel embedded in concrete. Mater. Des. 2010, 31, 3358–3365. [Google Scholar] [CrossRef]
  28. Moreno, M.; Morris, W.; Alvarez, M.G.; Duffó, G.S. Corrosion of reinforcing steel in simulated concrete pore solutions: Effect of carbonation and chloride content. Corros. Sci. 2004, 46, 2681–2699. [Google Scholar] [CrossRef]
  29. Kim, E.K.; Kim, J.-K.; Lete, D.-H.; Kim, Y.-U.; Kim, Y.-C. A Study on Corrosion Resistance of the Reinforement in Concrete Using Blast-Furnace Slag Powder. J. Korea Concr. Inst. 2004, 16, 1–9. [Google Scholar] [CrossRef]
  30. Wang, J.; Liu, E. The relationship between steady-state chloride diffusion and migration coefficients in cementitious materials. Mag. Concr. Res. 2019, 223, 595–604. [Google Scholar] [CrossRef]
  31. Ramezanianpour, A.A.; Malhotra, V.M. Effect of curing on the compressive strength, resistance to chloride-ion penetration and porosity of concretes incorporating slag, fly ash or silica fume. Cem. Concr. Compos. 1995, 17, 125–133. [Google Scholar] [CrossRef]
  32. Aldea, C.M.; Young, F.; Walng, K.; Shah, S.P. Effects of curing conditions on properties of concrete using slag replacement. Cem. Concr. Res. 2000, 30, 465–472. [Google Scholar] [CrossRef]
  33. Papadakis, V.G.; Vayenas, C.G.; Fardis, M.N. Fundamental modeling and experimental investigation of concrete carbonation. Mater. J. 1991, 88, 363–373. [Google Scholar]
  34. Ngala, V.T.; Page, C.L. Effects of carbonation on pore structure and diffusional properties of hydrated cement pastes. Cem. Concr. Res. 1997, 27, 995–1007. [Google Scholar] [CrossRef]
  35. Thiéry, M.; Faure, P.; Morandeau, A.; Platret, G.; Bouteloup, J.F.; Dangla, P.; Baroghel-Bouny, V. Effect of carbonation on the microstructure and moisture properties of cement-based materials. In XII DBMC (12th International Conference on Building Materials and Components); Rilem: Porto, Portugal, 2011; Volume 3, pp. 1–8. [Google Scholar]
  36. Yokozuka, K.; Li, C.; Nakarai, K. Influence of carbonation at early ages on depth distribution of oxygen diffusion coefficient of hardened cement paste. Cem. Sci. Concr. Technol. 2010, 64, 370–376. [Google Scholar] [CrossRef]
  37. Bilim, C.; Karahan, O.; Atis, C.D.; Ilkentapar, S. Influence of admixtures on the properties of alkali-activated slag mortars subjected to different curing conditions. Mater. Des. 2013, 44, 540–547. [Google Scholar] [CrossRef]
  38. Mehta, P.K. Studies on blended Portland cements containing Santorin earth. Cem. Concr. Res. 1981, 11, 507–518. [Google Scholar] [CrossRef]
  39. Güneyisi, E.; Mermerdaş, K. Comparative study on strength, sorptivity, and chloride ingress characteristics of air-cured and water-cured concretes modified with metakaolin. Mater. Struct. 2007, 40, 1161–1171. [Google Scholar] [CrossRef]
  40. Mehta, P.K.; Monteiro, P.J. Concrete: Microstructure, Properties, and Materials; McGraw-Hill: New York, NY, USA, 2005. [Google Scholar]
  41. Goto, S.; Roy, D.M. The effect of w/c ratio and curing temperature on the permeability of hardened cement paste. Cem. Concr. Res. 1981, 11, 575–579. [Google Scholar] [CrossRef]
  42. Astm, C. 150, Standard specification for Portland cement. In Annual Book of ASTM Standards; ASTM International: West Conshohocken, PA, USA, 2001; Volume 4, p. 1. [Google Scholar]
  43. Astm, C. 989, Standard specification for ground granulated blast furnace slag for use in concrete and mortars. In Annual Book of ASTM Standards; ASTM International: West Conshohocken, PA, USA, 1999. [Google Scholar]
  44. Kim, J.-H.; Yoon, S.-C.; Jee, N.-Y. The effect of combined aggregates on fluidity of the high fluid concrete containing GGBFS. J. Korea Inst. Build. Constr. 2003, 3, 79–86. [Google Scholar]
  45. Kang, M.-J.; Lee, P.-K.; Youm, S.-J. Assessment of Environmental Contamination caused by the Stone-dust using Leaching Tests. J. Soil Groundw. Environ. 2010, 15, 52–60. [Google Scholar]
  46. Build, N.T. 492. Concrete, mortar and cement-based repair materials: Chloride migration coefficient from non-steady-state migration experiments. Nord. Method Finland 1999. [Google Scholar]
  47. Astm, A. C39. Standard Test Method for Compressive Strength of Concrete; ASTM International: West Conshohocken, PA, USA, 2012. [Google Scholar]
  48. Cao, C.N.; Zhang, J.Q. Introduction of electrochemical impedance spectra. Beijing Sci. 2002, 21, 37–44. [Google Scholar]
  49. Mansfeld, F. Electrochemical Impedance Spectroscopy (EIS) as a new tool for investigating methods of corrosion protection. Electrochim Acta 1990, 35, 1533–1544. [Google Scholar] [CrossRef]
  50. Lay, P.; Lawrence, P.F.; Wilkins, N.J.M.; Williams, D.E. An ac impedance study of steel in concrete. J. Appl. Electrochem. 1985, 15, 755–766. [Google Scholar] [CrossRef]
  51. Glass, G.K. An assessment of the coulostatic method applied to the corrosion of steel in concrete. Corros. Sci. 1995, 37, 597–605. [Google Scholar] [CrossRef]
  52. Wang, W.; Chen, H.; Li, X.; Zhu, Z. Corrosion behavior of steel bars immersed in simulated pore solutions of alkali-activated slag mortar. Constr. Build. Mater. 2017, 143, 289–297. [Google Scholar] [CrossRef]
  53. Ismail, M.; Ohtsu, M. Corrosion rate of ordinary and high-performance concrete subjected to chloride attack by AC impedance spectroscopy. Constr. Build. Mater. 2006, 20, 458–469. [Google Scholar] [CrossRef]
  54. Ortega, J.M.; Sánchez, I.; Climent, M.A. Impedance spectroscopy study of the effect of environmental conditions in the microstructure development of OPC and slag cement mortars. Arch. Civ. Mech. Eng. 2015, 15, 569–583. [Google Scholar] [CrossRef]
  55. Sánchez, I.; López, M.P.; Ortega, J.M.; Climent, M.A. Impedance spectroscopy: An efficient tool to determine the non-steady-state chloride diffusion coefficient in building materials. Mater. Corros. 2011, 62, 139–145. [Google Scholar] [CrossRef]
  56. Vedalakshmi, R.R.; Devi, R.R.; Emmanuel, B.; Palaniswamy, N. Determination of diffusion coefficient of chloride in concrete: An electrochemical impedance spectroscopic approach. Mater. Struct. 2008, 41, 1315–1326. [Google Scholar] [CrossRef]
Figure 1. Schematic diagram of specimen for chloride penetration test.
Materials 12 03233 g001
Figure 2. Schematic diagram of specimen for electrochemical measurement.
Materials 12 03233 g002
Figure 3. (a) One arrangement of the migration set-up; (b) Photograph image of NT BUILD 492 Test setup.
Materials 12 03233 g003
Figure 4. Schematic diagram of electrochemical impedance spectroscopy (EIS) experiment.
Materials 12 03233 g004
Figure 5. Schematic diagram of a simple electrochemical electrode system.
Materials 12 03233 g005
Figure 6. Bode modulus plot of EIS.
Materials 12 03233 g006
Figure 7. Compressive strength of concrete according to curing day and curing condition. (a) Ordinary Portland cement (OPC), (b) OPC 70% + GGBFS 30%, (c) OPC 40% + GGBFS 60%, (d) Reduction rate of Compressive strength according to W/B(28d).
Materials 12 03233 g007aMaterials 12 03233 g007b
Figure 8. Chloride ion diffusion coefficient of concrete according to curing condition and W/B ratio. (a) OPC, (b) OPC 70% + GGBFS 30%, (c) OPC 40% + GGBFS 60%, (d) Chloride ion diffusion coefficient of all specimens according to GGBFS replacement ratio.
Materials 12 03233 g008
Figure 9. Bode modulus plot and phase plot of rebars embedded in concrete according to the curing condition. (a) OPC, (b) OPC 70% + GGBFS 30%, (c) OPC 40% + GGBFS 60%.
Materials 12 03233 g009
Figure 10. Impedance of rebars embedded in concrete according to the curing condition and GGBFS replacement ratio. (a) |Z| (Ztotal), (b) Rs (Zmin) (c) Rp (Zmax − Zmin).
Materials 12 03233 g010aMaterials 12 03233 g010b
Figure 11. Relationship between impedance and chloride ion diffusion coefficient. (a) |Z| (Ztotal), (b) Rs (Zmin) and Rp (Zmax − Zmin).
Materials 12 03233 g011
Table 1. Chemical compositions of cement and ground granulated blast furnace slag (GGBFS).
NameChemical Compositions (%)
SiO2Al2O3TiO2Fe2O3CaOMgOSO3K2Oetc.L.O.I
OPC19.745.330.302.9361.743.782.470.892.822.3
GGBFS33.3513.360.590.3344.624.122.690.410.530.1
Table 2. Concrete mix proportion.
NameW/B
(%)
Unit Weight
(kg/m3)
Unit Weight
(g/m3)
WCGG
BFS
S1 1S2 2G 3S.P.A.E.
OPC-4040180450-5532408673600150
OPC-5050180360-6072608673240117
OPC-6060180300-640273867300793
S3-40401803151355472408673150157
S3-50501802521086002608672880130
S3-6060180210906402738672400120
S6-40401801802705402338672700430
S6-50501801442166002538672160300
S6-60601801201806332678672100250
1 Crushed Sand, 2 Sea Sand (Washed), 3 Maximum size of coarse aggregate: 13 mm.
Table 3. Test voltage and duration for concrete specimen with normal binder content [46].
Initial Current I30V
(with 30V) (mA)
Applied Voltage U
(after Adjustment) (V)
Possible New Initial
Current I0 (mA)
Test Duration
(Hour)
I0 < 560I0 < 1096
5 ≤ I0 < 106010 ≤ I0 < 2048
10 ≤ I0 < 156020 ≤ I0 < 3024
15 ≤ I0 < 205025 ≤ I0 < 3524
20 ≤ I0 < 30 4025 ≤ I0 < 4024
30 ≤ I0 < 403535 ≤ I0 < 5024
40 ≤ I0 < 603040 ≤ I0 < 6024
60 ≤ I0 < 902550 ≤ I0 < 7524
90 ≤ I0 < 1202060 ≤ I0 < 8024
120 ≤ I0 < 1801560 ≤ I0 < 9024
180 ≤ I0 < 3601060 ≤ I0 < 12024
I0 ≥ 36010I0 ≥ 1206
Table 4. Experimental overview of EIS experiment.
Frequency Range105 ~ 10−2 Hz
Specimen SizeØ100 × 200 mm2
Cover concrete44 mm
WEØ13 mm rebar (SD400)
REAg/AgCl
CESTS 304
Table 5. Result of compressive strength test.
NameCompressive Strength (MPa)Rate of Change
28d (%)
3d7d28d
OPC-40W *35.942.351.7−7.43
A **35.842.747.8
OPC-50W26.132.741.1−5.79
A25.932.738.7
OPC-60W18.423.230.0−2.66
A18.023.229.2
S3-40W28.337.853.6−7.58
A27.237.849.5
S3-50W19.628.943.9−13.28
A19.428.938.1
S3-60W13.622.634.0−17.06
A13.620.928.2
S6-40W25.240.850.7−9.61
A24.737.145.8
S6-50W17.330.142.7−15.85
A16.628.835.9
S6-60W11.822.433.4−17.98
A11.820.927.4
Table 6. Result of Chloride diffusion coefficient of concrete according to curing condition.
NameChloride Diffusion Coefficient
(28d) (×10−12 m2/s)
Rate of Change
(%)
OPC-40W9.9228.53
A12.75
OPC-50W16.5615.70
A19.16
OPC-60W22.0517.94
A37.03
S3-40W4.47−0.45
A4.45
S3-50W5.4133.83
A7.24
S3-60W7.42111.19
A15.67
S6-40W2.5152.99
A3.84
S6-50W3.2487.96
A6.09
S6-60W4.1296.60
A8.10
Table 7. Result of EIS according to curing condition.
Name|Z|max
(Ωcm2)
|Z|min (Rs)
(Ωcm2)
|Z|max − |Z|min (Rp)
(Ωcm2)
OPC-40W418.463181.009237.454
A382.322166.431215.891
OPC-50W281.896121.460160.436
A323.150127.378195.772
OPC-60W223.55487.651135.903
A263.69694.007169.689
S3-40W668.187365.856302.331
A697.065329.151367.914
S3-50W598.828353.875244.953
A478.571252.401226.170
S3-60W460.889270.274190.615
A421.707191.777229.930
S6-40W1374.260864.382509.878
A1095.780588.412507.368
S6-50W1306.230800.663505.567
A1027.270593.435433.835
S6-60W990.183601.283388.900
A857.888458.342399.546

