Crystallization and Quantification of Crystalline and Non-Crystalline Phases in Kaolin-Based Cordierites


Abstract
1. Introduction
2. Material and Methods
2.1. Kaolin Samples
2.2. Kaolin–Vermiculite Ceramic Mixtures
2.3. Methods
3. Results
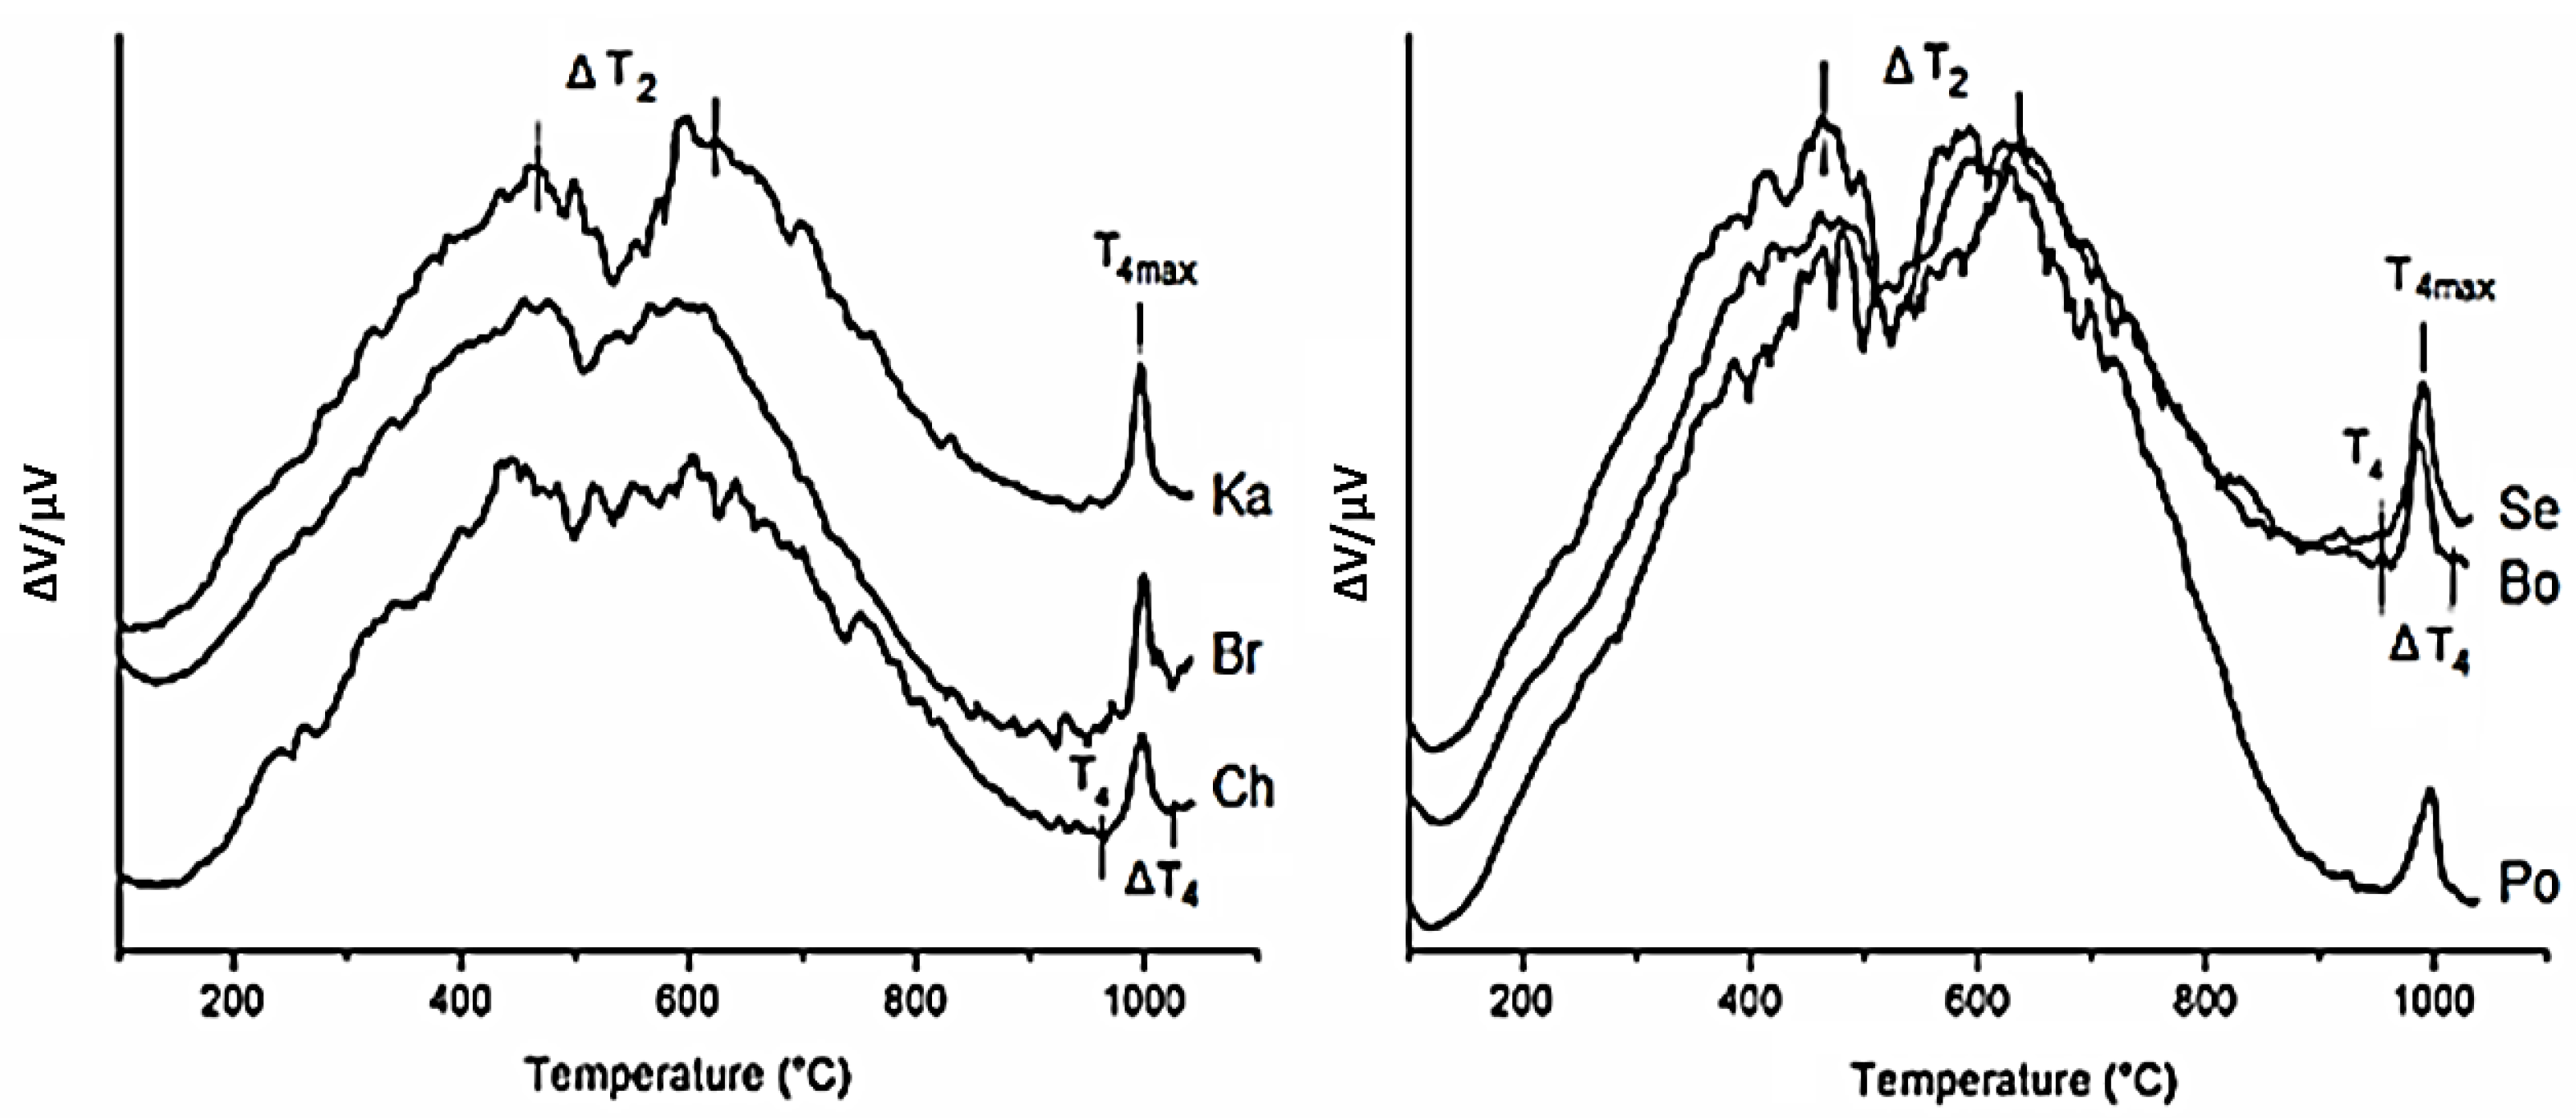
3.1. Kaolin Samples
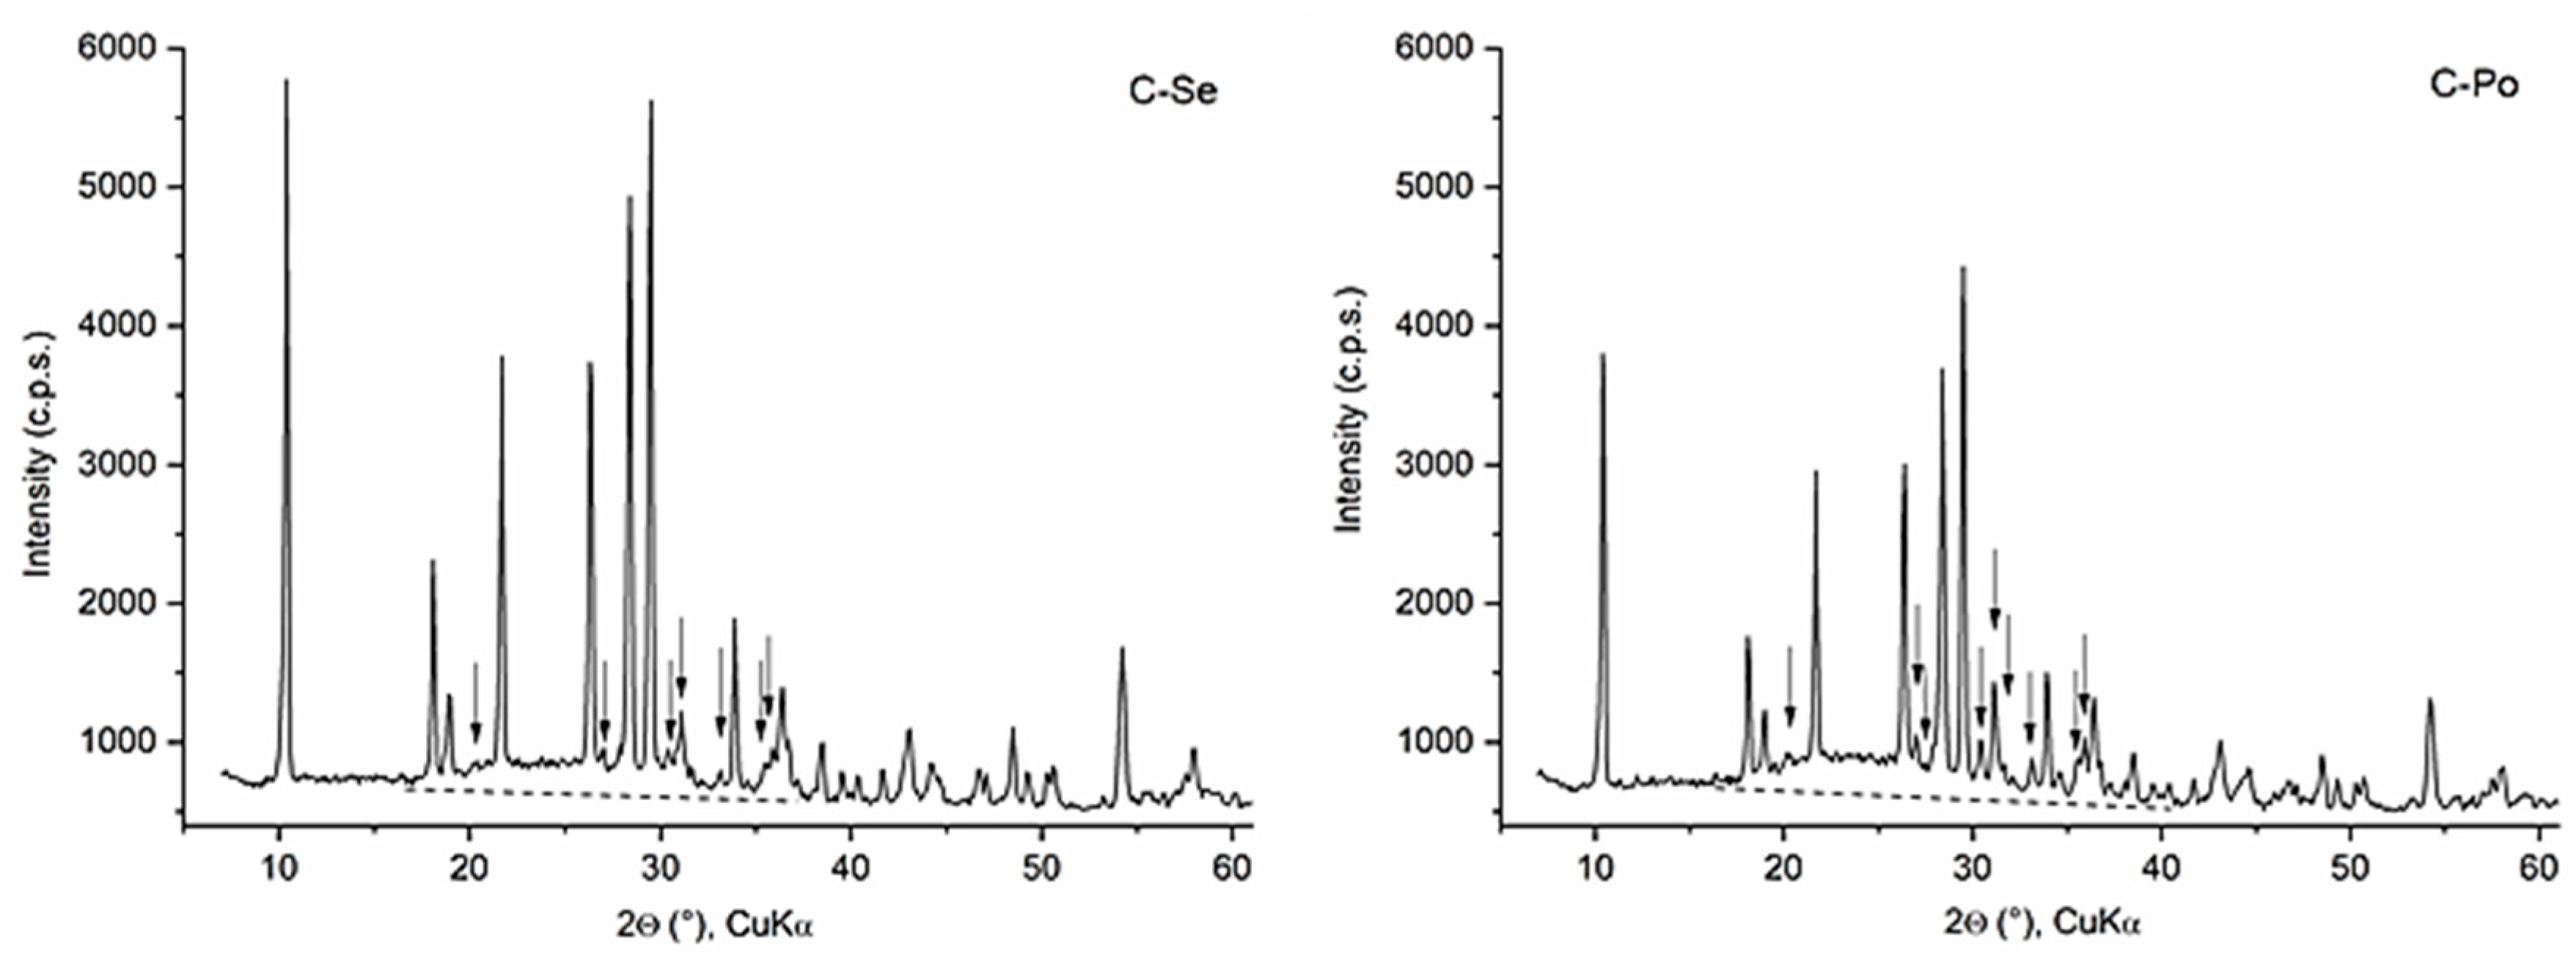
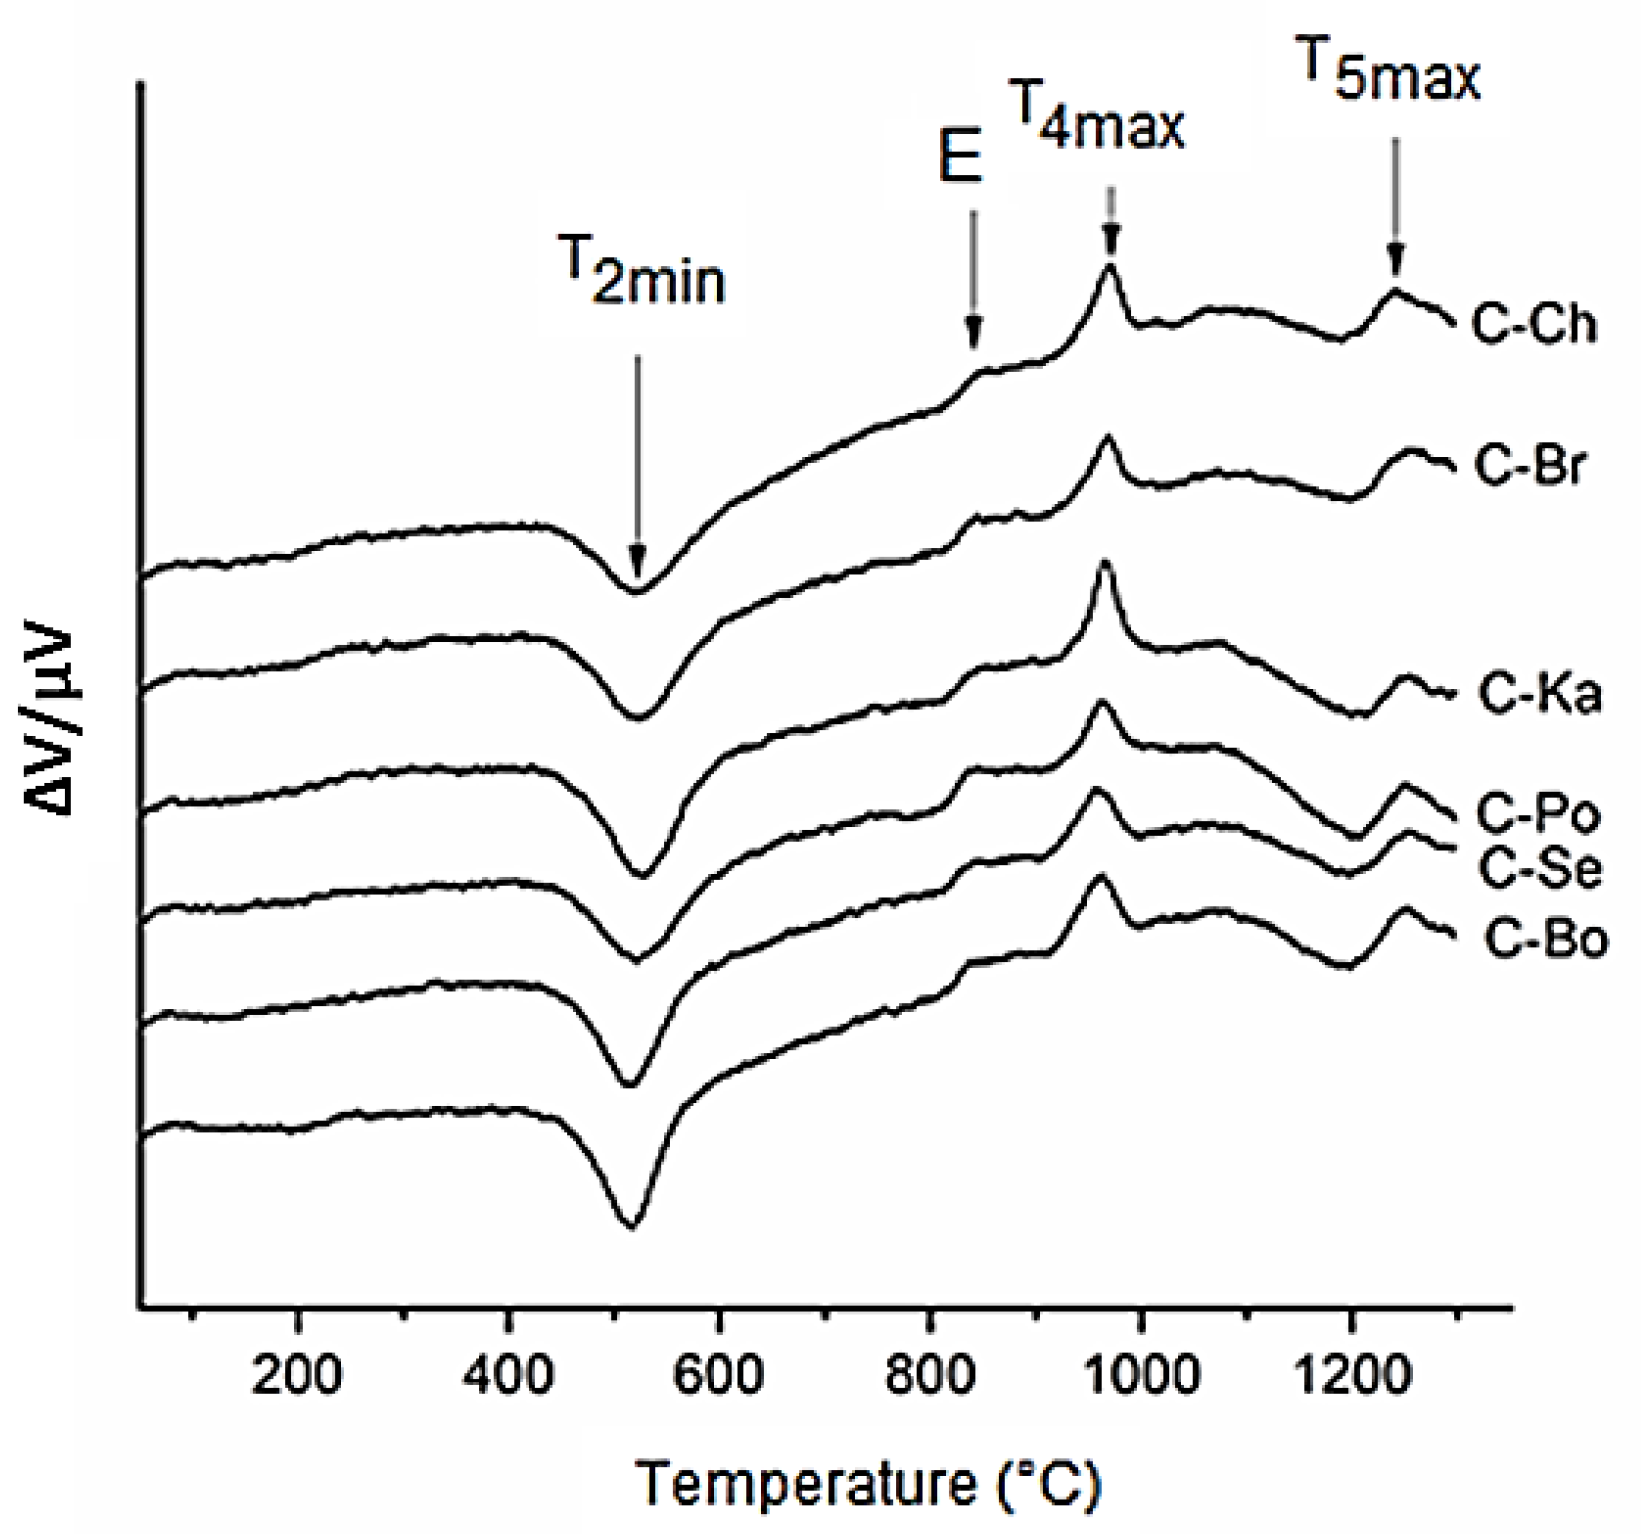
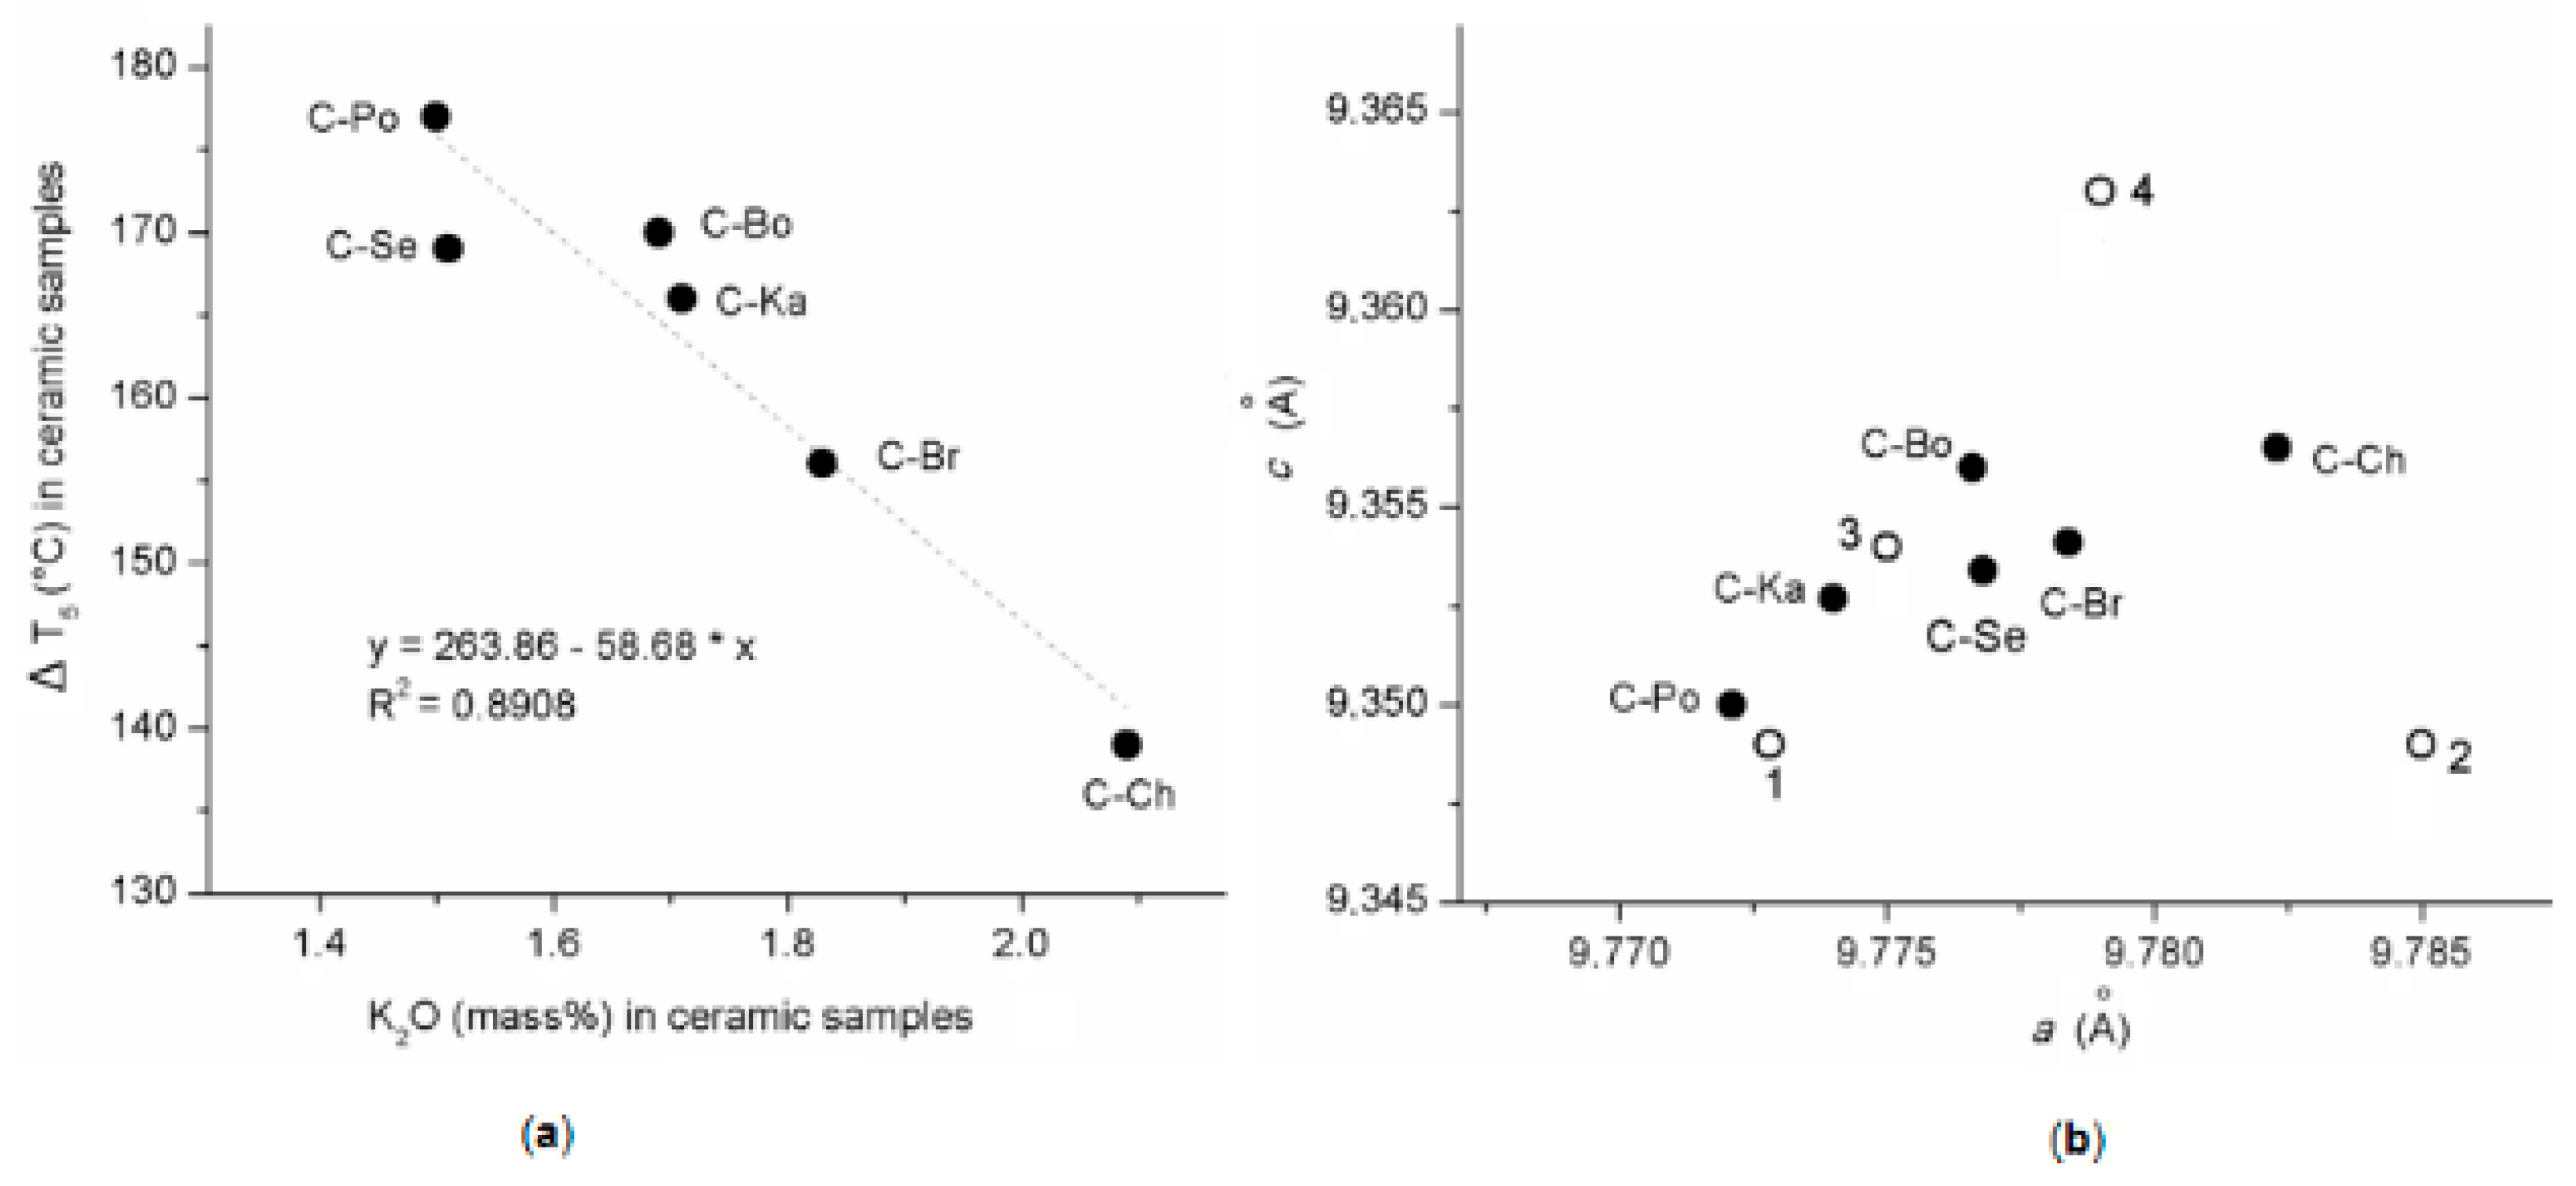
3.2. Cordierite Samples
4. Discussion
5. Conclusions
Author Contributions
Funding
Acknowledgments
Conflicts of Interest
References
- Schreyer, W.; Schairer, J.F. Composition and structural states of anhydrous Mg–cordierites: A re-investigation of the central part of the system MgO–Al2O3–SiO2. J. Petrol. 1961, 2, 324–406. [Google Scholar] [CrossRef]
- Yoder, H.S. The MgO–Al2O3–SiO2–H2O system and the related metamorphic facies. Am. J. Sci. 1952, 250A, 569–627. [Google Scholar]
- Fyfe, C.A.; Gobbi, G.C.; Putnis, A. Elucidation of the mechanism and kinetics of the Si, Al ordering process in synthetic magnesium cordierite by 29Si magic angle spinning NMR spectroscopy. J. Am. Chem. Soc. 1986, 108, 3218–3223. [Google Scholar] [CrossRef]
- Predecki, P.; Haas, J.; Faber, J., Jr.; Hitterman, R.L. Structural aspects of the lattice thermal expansion of hexagonal cordierite. J. Am. Ceram. Soc. 1987, 70, 175–182. [Google Scholar] [CrossRef]
- Valášková, M. Structural characteristics of cordierites based on commercial vermiculites in relation to the natural and synthetic cordierites. Ceram. Silik. 2016, 60, 308–316. [Google Scholar] [CrossRef][Green Version]
- Valášková, M.; Zdrálková, J.; Simha Martynková, G.; Smetana, B.; Vlček, J.; Študentová, S. Structural variability of high purity cordierite/steatite ceramics sintered from mixtures with various vermiculites. Ceram. Int. 2014, 40, 8489–8498. [Google Scholar] [CrossRef]
- Murray, H.H. Industrial application of kaolin. Clays Clay Miner. 1961, 10, 291–298. [Google Scholar] [CrossRef]
- De Aza, A.H.; Turrillas, X.; Rodríguez, M.A.; Duran, T.; Pena, P. Time-resolved powder neutron diffraction study of the phase transformation sequence of kaolinite to mullite. J. Eur. Ceram. Soc. 2014, 341, 409–1421. [Google Scholar] [CrossRef]
- Pascual, J.; Zapatero, J.; de Haro, M.C.J.; Varona, I.; Justo, A.; Pérez-Rodríguez, J.L.; Sánchez-Soto, P.J. Porous mullite and mullite-based composites by chemical processing of kaolinite and aluminium metal wastes. J. Mater. Chem. 2000, 10, 1409–1414. [Google Scholar] [CrossRef]
- Lee, W.E.; Souza, G.P.; McConville, C.J.; Tarvornpanich, T.; Iqbal, Y. Mullite formation in clays and clay-derived vitreous ceramics. J. Eur. Ceram. Soc. 2008, 28, 465–471. [Google Scholar] [CrossRef]
- El Ouahabi, M.; Daoudi, L.; Hatert, F.; Fagel, N. Modified mineral phases during clay ceramic firing. Clays Clay Miner. 2015, 63, 404–413. [Google Scholar] [CrossRef]
- Sánchez-Soto, P.J.; Eliche-Quesada, D.; Martínez-Martínez, S.; Garzón-Garzón, E.; Pérez-Villarejo, L.; Rincón, J.M. The effect of vitreous phase on mullite and mullite-based ceramic composites from kaolin wastes as by-products of mining, sericite clays and kaolinite. Mater. Lett. 2018, 223, 154–158. [Google Scholar] [CrossRef]
- Soro, N.; Aldon, L.; Olivier-Fourcade, J.; Jumas, J.C.; Laval, J.P.; Blanchart, P. Role of iron in mullite formation from kaolins by Mössbauer spectroscopy and Rietveld refinement. J. Am. Ceram. Soc. 2003, 86, 129–134. [Google Scholar] [CrossRef]
- Lecomte, G.L.; Bonnet, J.P.; Blanchart, P. A study of the influence of muscovite on the thermal transformations of kaolinite from room temperature up to 1100 °C. J. Mater. Sci. 2007, 42, 8745–8752. [Google Scholar] [CrossRef]
- Khalfaoui, A.; Hajjaji, M. A chloritic-illitic clay from Morocco: Temperature-time-transformation and neoformation. Appl. Clay Sci. 2009, 45, 83–89. [Google Scholar] [CrossRef]
- Klika, Z.; Kolomazník, I.; Matýsek, D.; Kliková, K. Critical evaluation of a new method for quantitative determination of minerals in solid samples. Cryst. Res. Technol. 2016, 51, 249–264. [Google Scholar] [CrossRef]
- Kužvart, M. Kaolin deposits of Czechoslovakia. Int. Geol. Congr. 23th Prague Proceed. 1968, 15, 47–73. [Google Scholar]
- Hohn, S.; Frimmel, H.E.; Pasava, J. The rare earth element potential of kaolin deposits in the Bohemian Massif (Czech Republic, Austria). Miner. Deposita 2014, 49, 967–986. [Google Scholar] [CrossRef]
- Valášková, M.; Kupková, J.; Simha Martynková, G.; Seidlerová, J.; Tomášek, V.; Ritz, M.; Kočí, K.; Klemm, V.; Rafaja, D. Comparable study of vermiculites from four commercial deposits prepared with fixed ceria nanoparticles. Appl. Clay Sci. 2018, 151, 164–174. [Google Scholar] [CrossRef]
- Valášková, M.; Hundáková, M.; Smetana, B.; Drozdová, L.; Klemm, V.; Rafaja, D. Cordierite/CeO2 ceramic nanocomposites from vermiculite with fixed CeO2 nanoparticles, talc and kaolin. Appl. Clay Sci. 2019, 179, 105150. [Google Scholar]
- Hinckley, D.N. Variability in “crystallinity” values among the kaolin deposits of the Coastal Plain of Georgia and South Carolina. Clays Clay Miner. 1962, 11, 229–235. [Google Scholar] [CrossRef]
- Balek, V.; Murat, M. The emanation thermal analysis of kaolinite clay minerals. Termochim. Acta 1996, 283, 385–397. [Google Scholar] [CrossRef]
- Horváth, E.; Frost, R.L.; Makó, E.; Kristóf, J.; Cseh, T. Thermal treatment of mechanochemically activated kaolinite. Thermochim. Acta 2003, 404, 227–234. [Google Scholar] [CrossRef]
- Sujeong, L.; Youn, J.K.; Hi-Soo, M. Phase transformation sequence from kaolinite to mullite investigated by an energy-filtering transmission electron microscope. J. Am. Ceram. Soc. 1999, 82, 2841–2848. [Google Scholar]
- Murat, M. Hydration reaction and hardening of calcined clays and related minerals 2. Influence of mineralogical properties of the raw-kaolinite on the reactivity of metakaolinite. Cem. Concr. Res. 1983, 13, 511–518. [Google Scholar] [CrossRef]
- Kakali, G.; Perraki, T.; Tsivilis, S.; Badogiannis, E. Thermal treatment of kaolin: The effect of mineralogy on the pozzolanic activity. Appl Clay Sci. 2001, 20, 73–80. [Google Scholar] [CrossRef]
- Guggenheim, S.; Chang, Y.H.; van Groos, A.F.K. Muscovite dehydroxylation: High-temperature studies. Am. Miner. 1987, 72, 537–550. [Google Scholar]
- Gualtieri, A.F. Thermal behavior of the raw materials forming porcelain stoneware mixtures by combined optical and in situ X-ray dilatometry. J. Am. Ceram. Soc. 2007, 90, 1222–1231. [Google Scholar] [CrossRef]
- Pivinskii, Y.E.; Dyakin, P.V. Research in the field of preparing molded and unmolded refractories based on high-alumina HCBS. Part 7, Sintering and secondary mullite formation of materials based on composite composition HCBS during nonisothermal heating and isothermal firing. Refract. Ind. Ceram. 2017, 57, 536–544. [Google Scholar] [CrossRef]
- Ptáček, P.; Kubátová, D.; Havlica, J.; Brandštetr, J.; Šoukal, F.; Opravil, T. Isothermal kinetic analysis of the thermal decomposition of kaolinite: The thermogravimetric study. Termochim. Acta 2010, 501, 24–29. [Google Scholar] [CrossRef]
- Bulens, M.; Delmon, B. Exothermic reaction of metakaolinite in presence of mineralizers—Influence of crystallinity. Clays Clay Miner. 1977, 25, 271–277. [Google Scholar] [CrossRef]
- Rodriguez-Navarro, C.; Cultrone, G.; Sanchez-Navas, A.; Sebastian, E. TEM study of mullite growth after muscovite breakdown. Am. Mineral. 2003, 88, 713–724. [Google Scholar] [CrossRef]
- Balek, V.; Pérez-Rodríguez, J.L.; Pérez-Maqueda, A.; Šubrt, J.; Poyato, J. Thermal behaviour of ground vermiculite. J. Thermal. Anal. Calorim. 2007, 88, 819–823. [Google Scholar] [CrossRef]
- Valášková, M.; Simha Martynková, G.; Smetana, B.; Šudentová, S. Influence of vermiculite on the formation of porous cordierites. Appl. Clay Sci. 2009, 46, 196–201. [Google Scholar] [CrossRef]
- Naskar, M.K.; Chatterjee, M. A novel process for the synthesis of cordierite (Mg2Al4Si5O18) powders from rice husk ash and other sources of silica and their comparative study. J. Eur. Ceram. Soc. 2004, 24, 3499–3508. [Google Scholar] [CrossRef]
- Goren, R.; Gocmez, H.; Ozgur, C. Synthesis of cordierite powder from talc, diatomite and alumina. Ceram. Int. 2006, 32, 407–409. [Google Scholar] [CrossRef]
- Johnson, S.M.; Pask, J.A.; Moya, J.S. Influence of impurities on high-temperature reactions of kaolinite. J. Am. Ceram. Soc. 1982, 65, 31–35. [Google Scholar] [CrossRef]
- Balassone, G.; Franco, E.; Mattia, C.A.; Puliti, R. Indialite in xenolithic rocks from Somma-Vesuvius volcano (Southern Italy): Crystal chemistry and petrogenetic features. Am. Mineral. 2004, 89, 1–6. [Google Scholar] [CrossRef]
- Benito, M.; Turrillas, X.; Cuello, G.J.; De Aza, A.H.; De Aza, S.; Rodríguez, M.A. Cordierite synthesis. A time-resolved neutron diffraction study. J. Eur. Ceram. Soc. 2012, 32, 371–379. [Google Scholar] [CrossRef]
- Redfern, S.A.T.; Salje, E.; Maresch, W.; Schreyer, W. X-ray powder-diffraction and infrared study of the hexagonal to orthorhombic phase transition in K-bearing cordierite. Am. Miner. 1989, 74, 1293–1299. [Google Scholar]
- Mercurio, D.; Thomas, P.; Mercurio, J.P.; Frit, B.; Kim, Y.H.; Roult, G. Powder neutron diffraction study of the thermal expansion of a K-substituted cordierite. J. Mat. Sci. 1989, 24, 3976–3983. [Google Scholar] [CrossRef]
- Daniels, P. Structural effects of the incorporation of large-radius alkalis in high cordierite. Am. Miner. 1992, 77, 407–411. [Google Scholar]
- Gouby, I.; Thomas, P.; Mercurio, D.; Merle-Méjean, T.; Frit, B. Powder X-ray-diffraction and infrared study of the structural evolution in highly K-doped cordierites. Mater. Res. Bull. 1995, 30, 593–599. [Google Scholar] [CrossRef]
- Schwartz, K.B.; Leong, D.B.; McConville, R.L. Structural chemistry of synthetic cordierite: Evidence for solid solutions and disordered compositional domains in bi-flux-grown Mg–cordierites. Phys. Chem. Miner. 1994, 20, 563–574. [Google Scholar] [CrossRef]
- Lecomte-Nana, G.L.; Bonnet, J.P.; Blanchart, P.T. Investigation of the sintering mechanisms of kaolin–muscovite. Appl. Clay Sci. 2011, 51, 445–451. [Google Scholar] [CrossRef]
- Liaw, D.-W.; Tsai, C.-Y.; Wei, W.-C.J. Thermal insulation of muscovite/glass ceramic foam for solid oxide fuel cell. J. Power Sources 2011, 196, 8012–8018. [Google Scholar] [CrossRef]


| Samples Hi 1 | Bo 0.93 | Se 1.08 | Po 1.22 | Ka 1.57 | Br 1.59 | Ch 1.30 |
|---|---|---|---|---|---|---|
| Oxides (mass %) | ||||||
| SiO2 | 49.97 | 49.65 | 56.25 | 49.71 | 50.83 | 50.45 |
| TiO2 | 0.16 | 0.07 | 0.38 | 0.66 | 0.93 | 0.72 |
| Al2O3 | 34.62 | 35.17 | 30.07 | 34.80 | 33.61 | 33.94 |
| Fe2O3 | 1.10 | 0.86 | 0.72 | 0.72 | 0.67 | 0.72 |
| CaO | 0.15 | 0.12 | 0.25 | 0.09 | 0.01 | 0.06 |
| MgO | 0.22 | 0.21 | 0.24 | 0.21 | 0.17 | 0.27 |
| Na2O | 0.03 | 0.03 | 0.03 | 0.06 | 0.08 | 0.07 |
| K2O | 1.18 | 0.93 | 0.84 | 1.21 | 1.41 | 1.88 |
| L.O.I. 2 | 12.21 | 12.26 | 11.15 | 12.26 | 12.01 | 11.63 |
| Sum | 99.66 | 99.30 | 99.94 | 99.72 | 99.72 | 99.75 |
| Ranges: | 1 | 2 | 3 | 4 | Total Mass Loss | |||||||
|---|---|---|---|---|---|---|---|---|---|---|---|---|
| Kaolin Sample | Mass (mg) | ΔT1 (°C) | Δm1 (mg) | ΔT2 (°C) | Δm2 (mg) | T2min (°C) | ΔT3 (°C) | Δm3 (mg) | ΔT4 (mg) | T4max (°C) | ΔmTML (mg) | (%) |
| Bo | 20.20 | 20–175 | 0.04 | 410–730 | 2.36 | 526 | 730–946 | 0.18 | 963–1031 | 988 | 2.58 | 12.8 |
| Se | 21.40 | 20–160 | 0.05 | 403–720 | 2.41 | 528 | 720–946 | 0.13 | 959–1041 | 990 | 2.59 | 12.1 |
| Po | 18.60 | 20–185 | 0.11 | 440–730 | 2.04 | 535 | 730–932 | 0.13 | 955–1041 | 993 | 2.28 | 12.3 |
| Ka | 20.90 | 20–200 | 0.06 | 450–725 | 2.32 | 535 | 750–946 | 0.16 | 961–1041 | 997 | 2.54 | 12.2 |
| Br | 19.90 | 20–170 | 0.01 | 430–720 | 2.19 | 533 | 730–931 | 0.13 | 972–1051 | 999 | 2.33 | 11.7 |
| Ch | 27.90 | 20–160 | 0.12 | 410–715 | 2.88 | 534 | 720–939 | 0.11 | 976–1047 | 997 | 3.11 | 11.1 |
| Oxides | Samples | |||||
|---|---|---|---|---|---|---|
| (mass %) | C-Bo | C-Se | C-Po | C-Ka | C-Br | C-Ch |
| SiO2 | 52.88 | 52.82 | 56.01 | 52.71 | 53.29 | 52.95 |
| TiO2 | 0.57 | 0.52 | 0.62 | 0.87 | 0.89 | 0.81 |
| Al2O3 | 25.76 | 26.13 | 23.00 | 25.77 | 25.15 | 25.27 |
| Fe2O3 | 4.68 | 4.53 | 4.48 | 4.45 | 3.99 | 4.44 |
| MnO | 0.06 | 0.06 | 0.05 | 0.05 | 0.05 | 0.05 |
| CaO | 0.81 | 0.75 | 0.86 | 0.73 | 0.70 | 0.70 |
| MgO | 13.25 | 13.24 | 13.19 | 13.28 | 13.22 | 13.26 |
| Na2O | 0.21 | 0.21 | 0.19 | 0.20 | 0.22 | 0.21 |
| K2O | 1.69 | 1.51 | 1.50 | 1.71 | 1.83 | 2.09 |
| Sum | 99.91 | 99.77 | 99.90 | 99.77 | 99.34 | 99.78 |
| Ranges: | 1 | 2 | 3 | 4 | 5 | Total Mass Loss | |||||||
|---|---|---|---|---|---|---|---|---|---|---|---|---|---|
| Sample | Mass m (mg) | ΔT1 (°C) | Δm1 (mg) | ΔT2 (°C) | Δm2 (mg) | ΔT5 (°C) | ΔT3 (°C) | Δm3 (mg) | ΔT4 (°C) | T4max (°C) | ΔT5 (°C) | ΔmTML | |
| (mg) | (%) | ||||||||||||
| C-Bo | 15.12 | 20–256 | 0.19 | 409–597 | 1.01 | 1084–1254 | 757–836 | 0.18 | 913–999 | 964 | 1084–1254 | 1.38 | 9.1 |
| C-Se | 15.00 | 20–226 | 0.18 | 416–610 | 1.01 | 1086–1255 | 755–843 | 0.19 | 906–1000 | 960 | 1086–1255 | 1.38 | 9.2 |
| C-Po | 15.11 | 20–233 | 0.19 | 407–631 | 0.93 | 1075–1252 | 753–838 | 0.18 | 905–1002 | 964 | 1075–1252 | 1.30 | 8.6 |
| C-Ka | 14.97 | 20–251 | 0.16 | 424–609 | 1.02 | 1080–1246 | 745–848 | 0.16 | 906–1017 | 960 | 1080–1246 | 1.34 | 8.9 |
| C-Br | 15.14 | 20–239 | 0.17 | 434–603 | 0.95 | 1102–1258 | 745–835 | 0.16 | 905–999 | 970 | 1102–1258 | 1.28 | 8.5 |
| C-Ch | 15.15 | 20–265 | 0.17 | 437–650 | 1.04 | 1104–1243 | 748–848 | 0.12 | 907–999 | 972 | 1104–1243 | 1.33 | 8.8 |
| Mineral (mass %) | Samples | |||||
|---|---|---|---|---|---|---|
| Bo | Se | Po | Ka | Br | Ch | |
| Kaolinite | 81.9 | 85.0 | 73.3 | 82.4 | 79.0 | 79.7 |
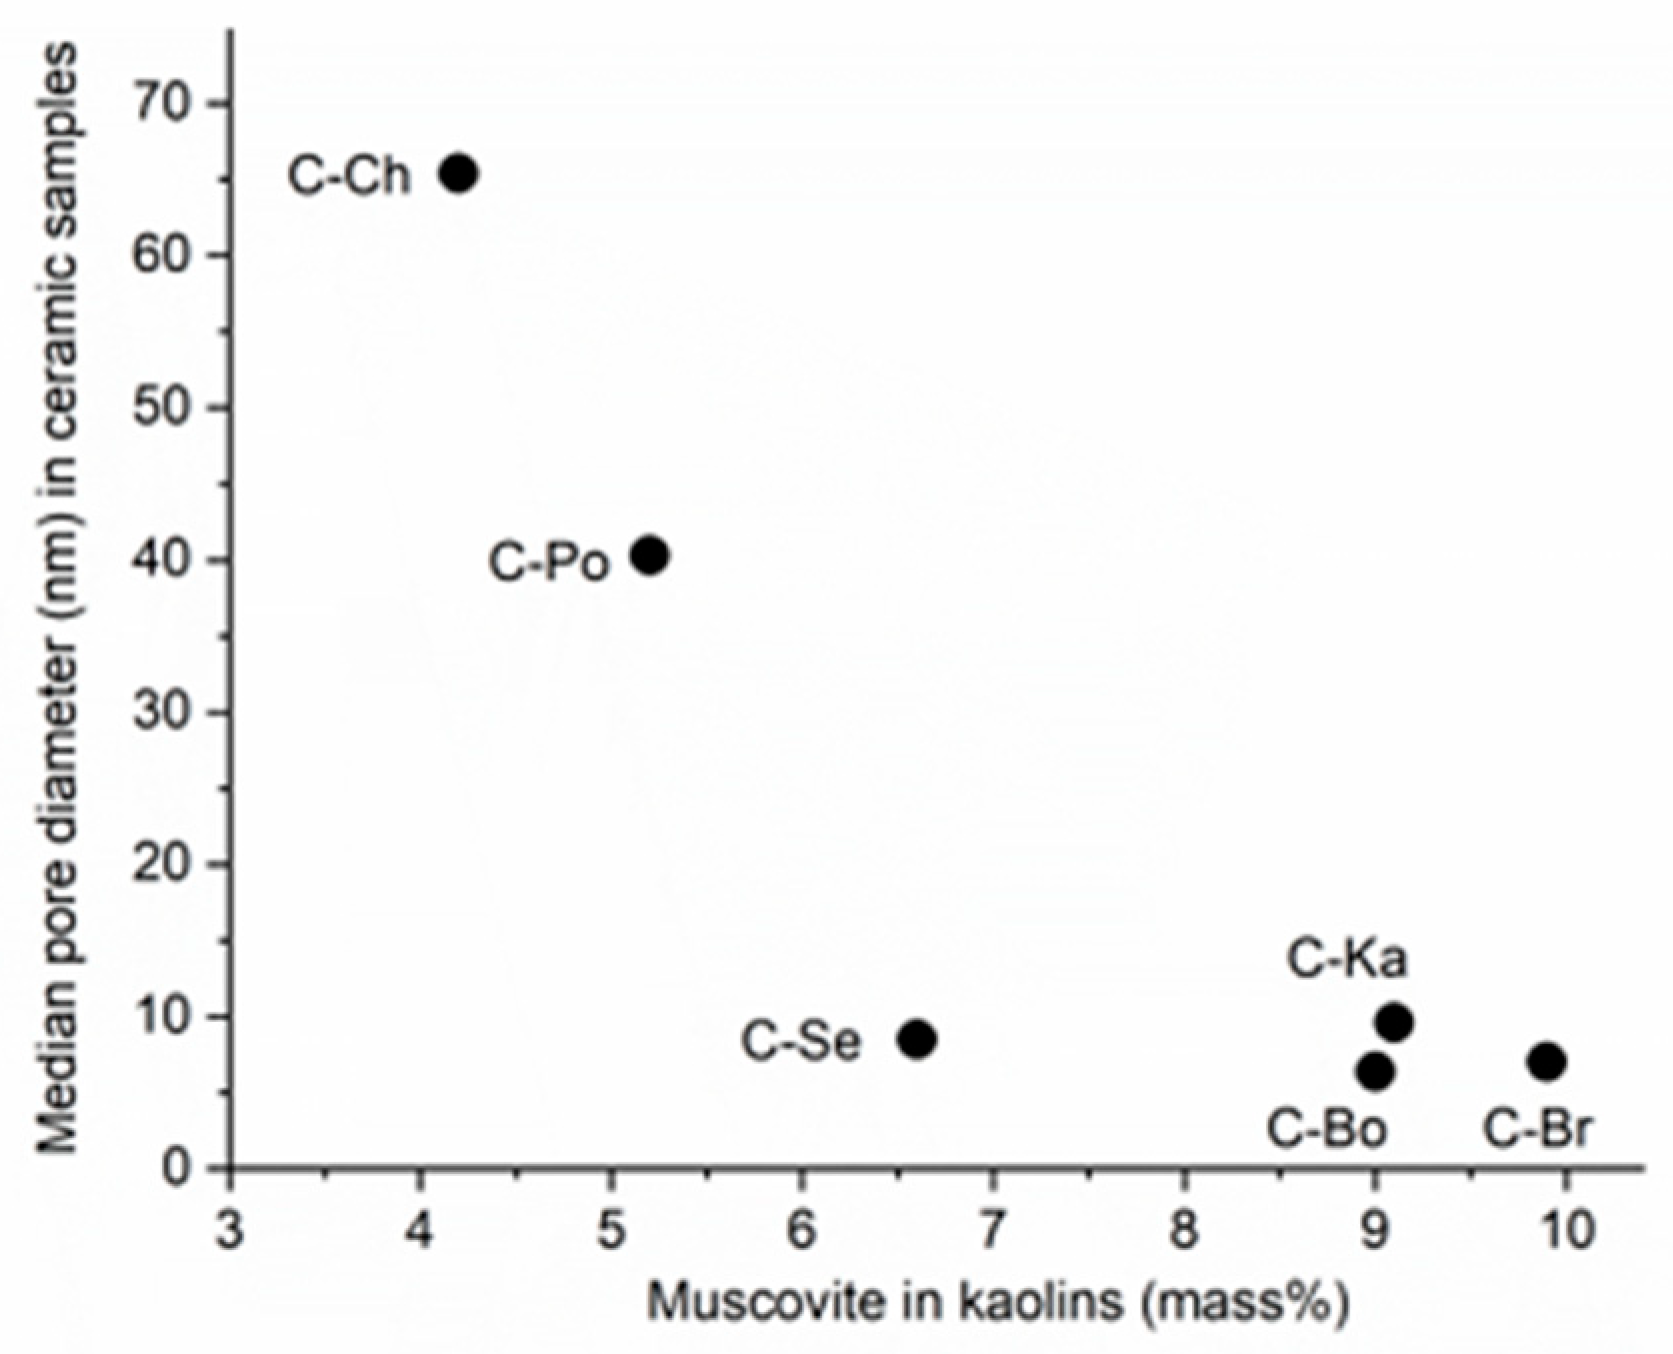
| Muscovite | 9.0 | 6.6 | 5.2 | 9.1 | 9.9 | 4.2 |
| Quartz | 7.2 | 6.7 | 19.5 | 6.7 | 9.0 | 6.0 |
| Limonite | 1.2 | 0.9 | 0.8 | 0.7 | 0.7 | 0.8 |
| Rutile | 0.1 | 0.1 | 0.3 | 0.6 | 0.9 | 0.7 |
| Orthoclase | 0.0 | 0.0 | 0.0 | 0.0 | 0.0 | 8.0 |
| Sum | 99.4 | 99.3 | 99.1 | 99.5 | 99.5 | 99.4 |
| Mineral (mass %) | Samples | |||||
|---|---|---|---|---|---|---|
| C-Bo | C-Se | C-Po | C-Ka | C-Br | C-Ch | |
| Cordierite | 84.0 | 85.1 | 75.2 | 84.1 | 81.7 | 82.3 |
| Enstatite | 6.2 | 5.8 | 8.9 | 6.5 | 6.8 | 6.7 |
| Others (1) | 9.4 | 8.8 | 15.1 | 9.3 | 11.1 | 10.6 |
| Sum | 99.6 | 99.7 | 99.2 | 99.9 | 99.6 | 99.6 |
| Samples | ||||||
|---|---|---|---|---|---|---|
| C-Bo | C-Se | C-Po | C-Ka | C-Br | C-Ch | |
| Porosity (%) | 3.52 | 3.49 | 1.77 | 4.60 | 3.00 | 1.24 |
| MD (nm) (1) | 7.5 | 8.5 | 40.3 | 9.6 | 7.0 | 65.4 |
© 2019 by the authors. Licensee MDPI, Basel, Switzerland. This article is an open access article distributed under the terms and conditions of the Creative Commons Attribution (CC BY) license (http://creativecommons.org/licenses/by/4.0/).
Share and Cite
Valášková, M.; Klika, Z.; Novosad, B.; Smetana, B. Crystallization and Quantification of Crystalline and Non-Crystalline Phases in Kaolin-Based Cordierites. Materials 2019, 12, 3104. https://doi.org/10.3390/ma12193104
Valášková M, Klika Z, Novosad B, Smetana B. Crystallization and Quantification of Crystalline and Non-Crystalline Phases in Kaolin-Based Cordierites. Materials. 2019; 12(19):3104. https://doi.org/10.3390/ma12193104
Chicago/Turabian StyleValášková, Marta, Zdeněk Klika, Boris Novosad, and Bedřich Smetana. 2019. "Crystallization and Quantification of Crystalline and Non-Crystalline Phases in Kaolin-Based Cordierites" Materials 12, no. 19: 3104. https://doi.org/10.3390/ma12193104
APA StyleValášková, M., Klika, Z., Novosad, B., & Smetana, B. (2019). Crystallization and Quantification of Crystalline and Non-Crystalline Phases in Kaolin-Based Cordierites. Materials, 12(19), 3104. https://doi.org/10.3390/ma12193104