Review of Thermophysical Property Data of Octadecane for Phase-Change Studies
Abstract
1. Introduction
2. Literature Review of Thermophysical Properties of Octadecane
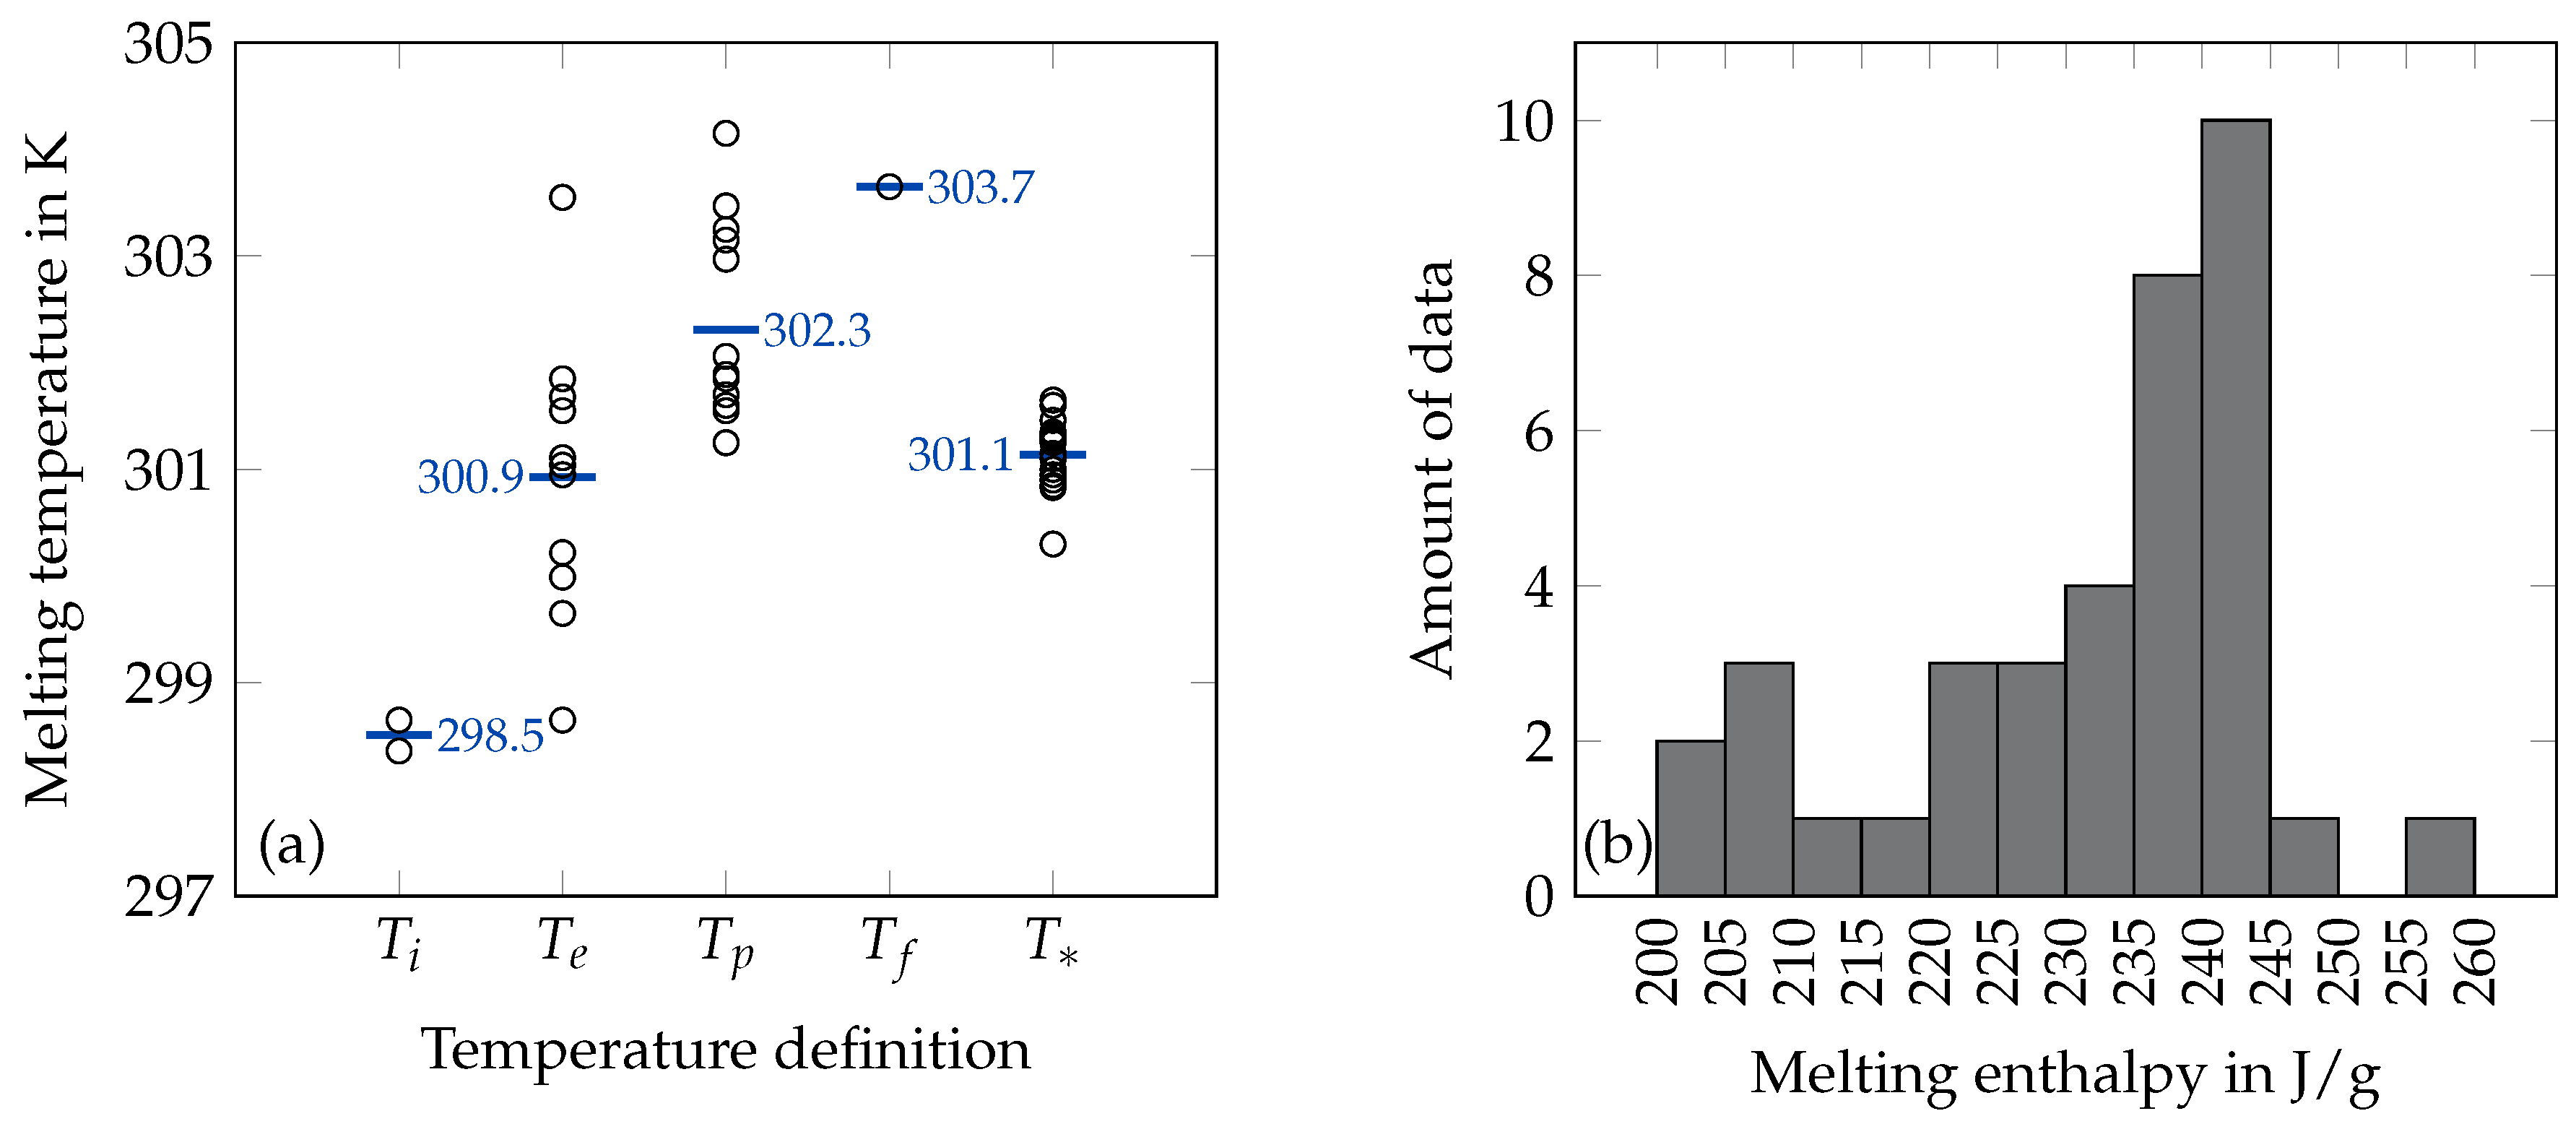
2.1. Melting Temperature
2.2. Melting Enthalpy
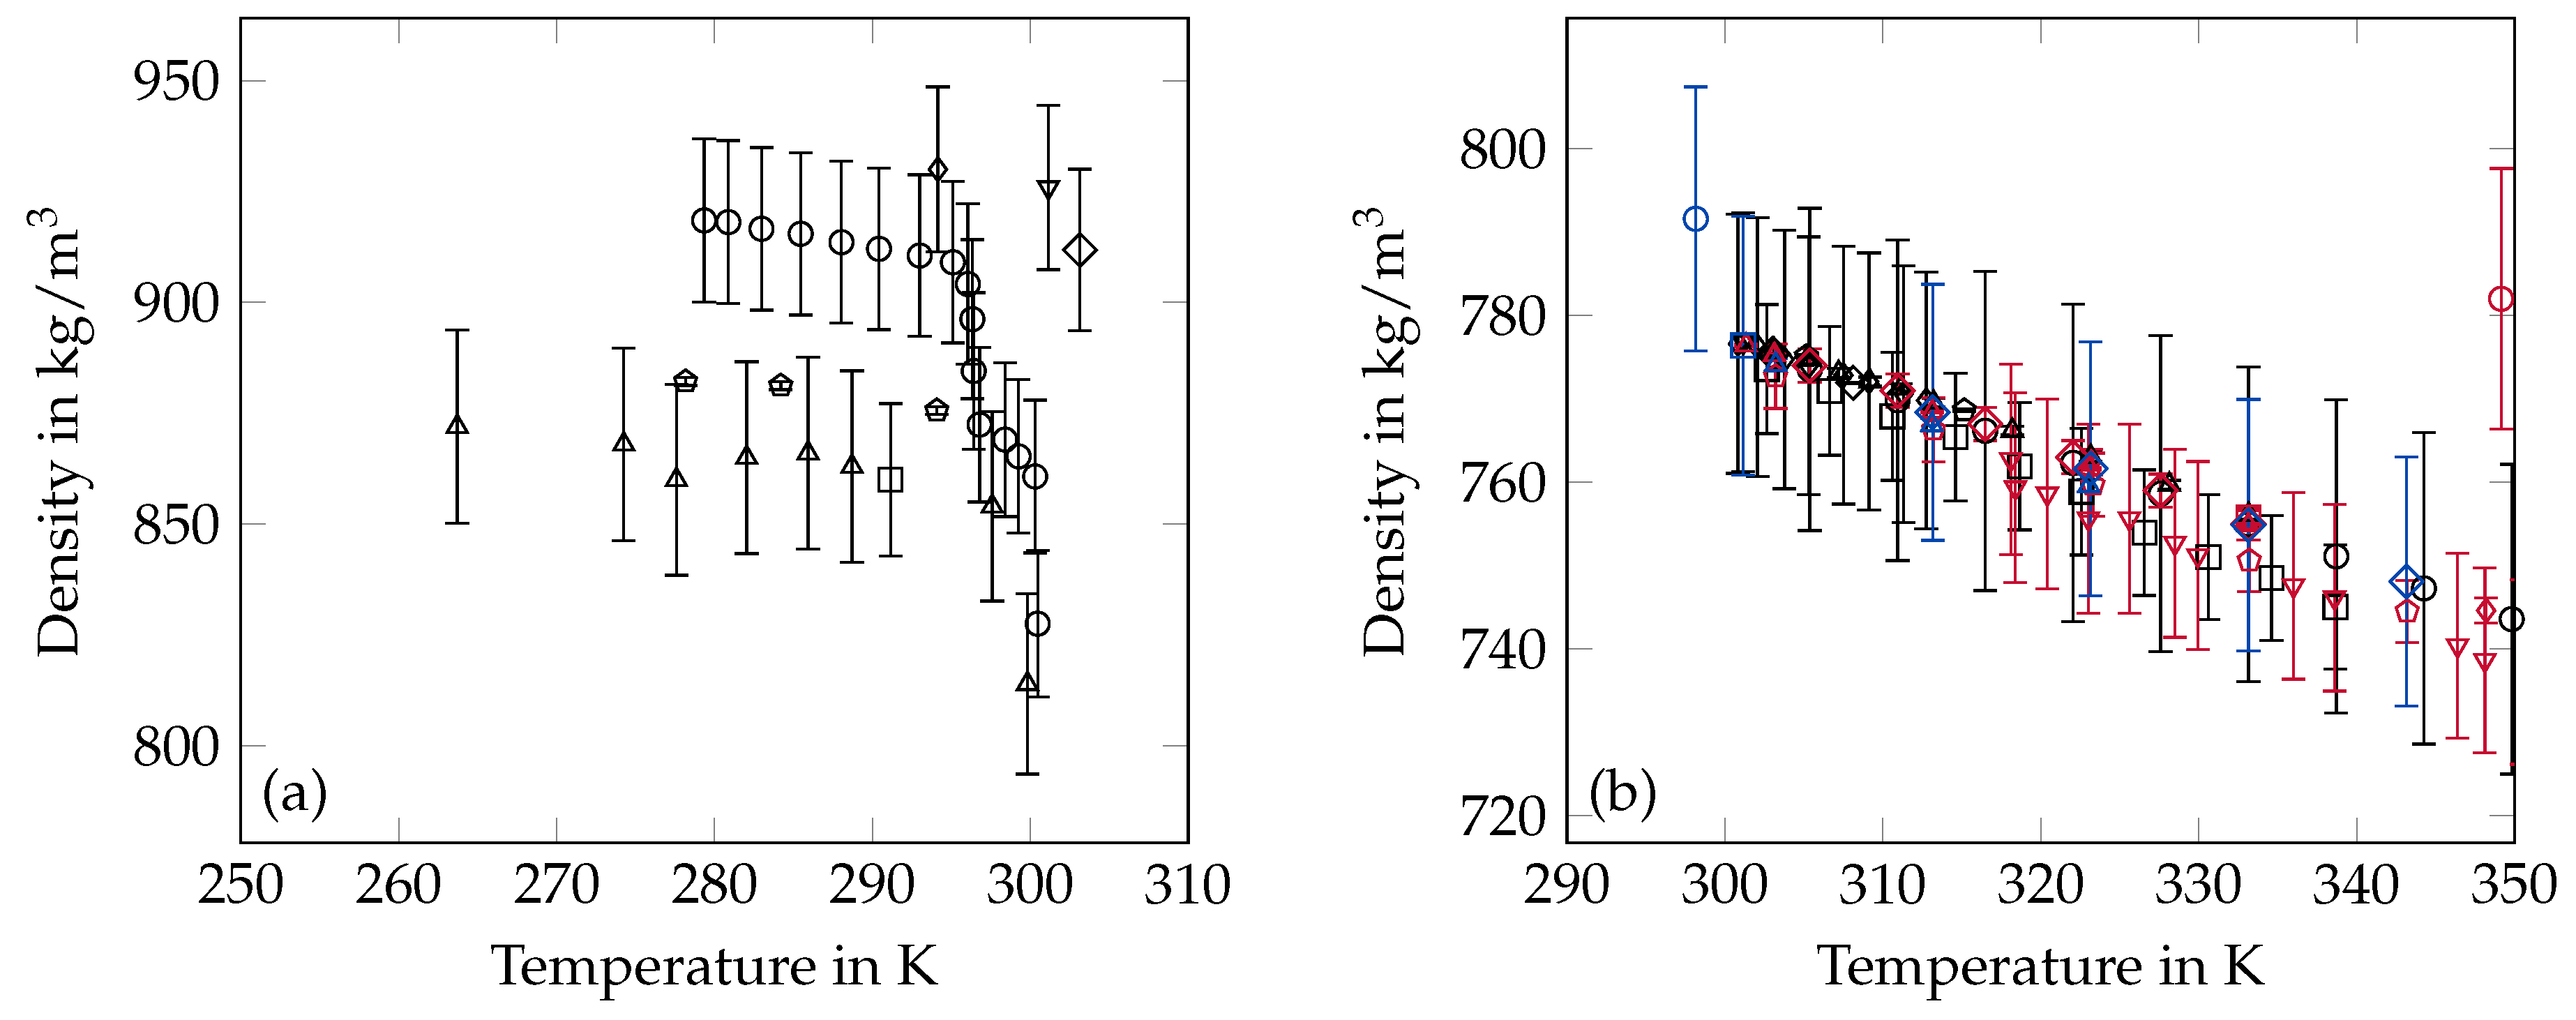
2.3. Density
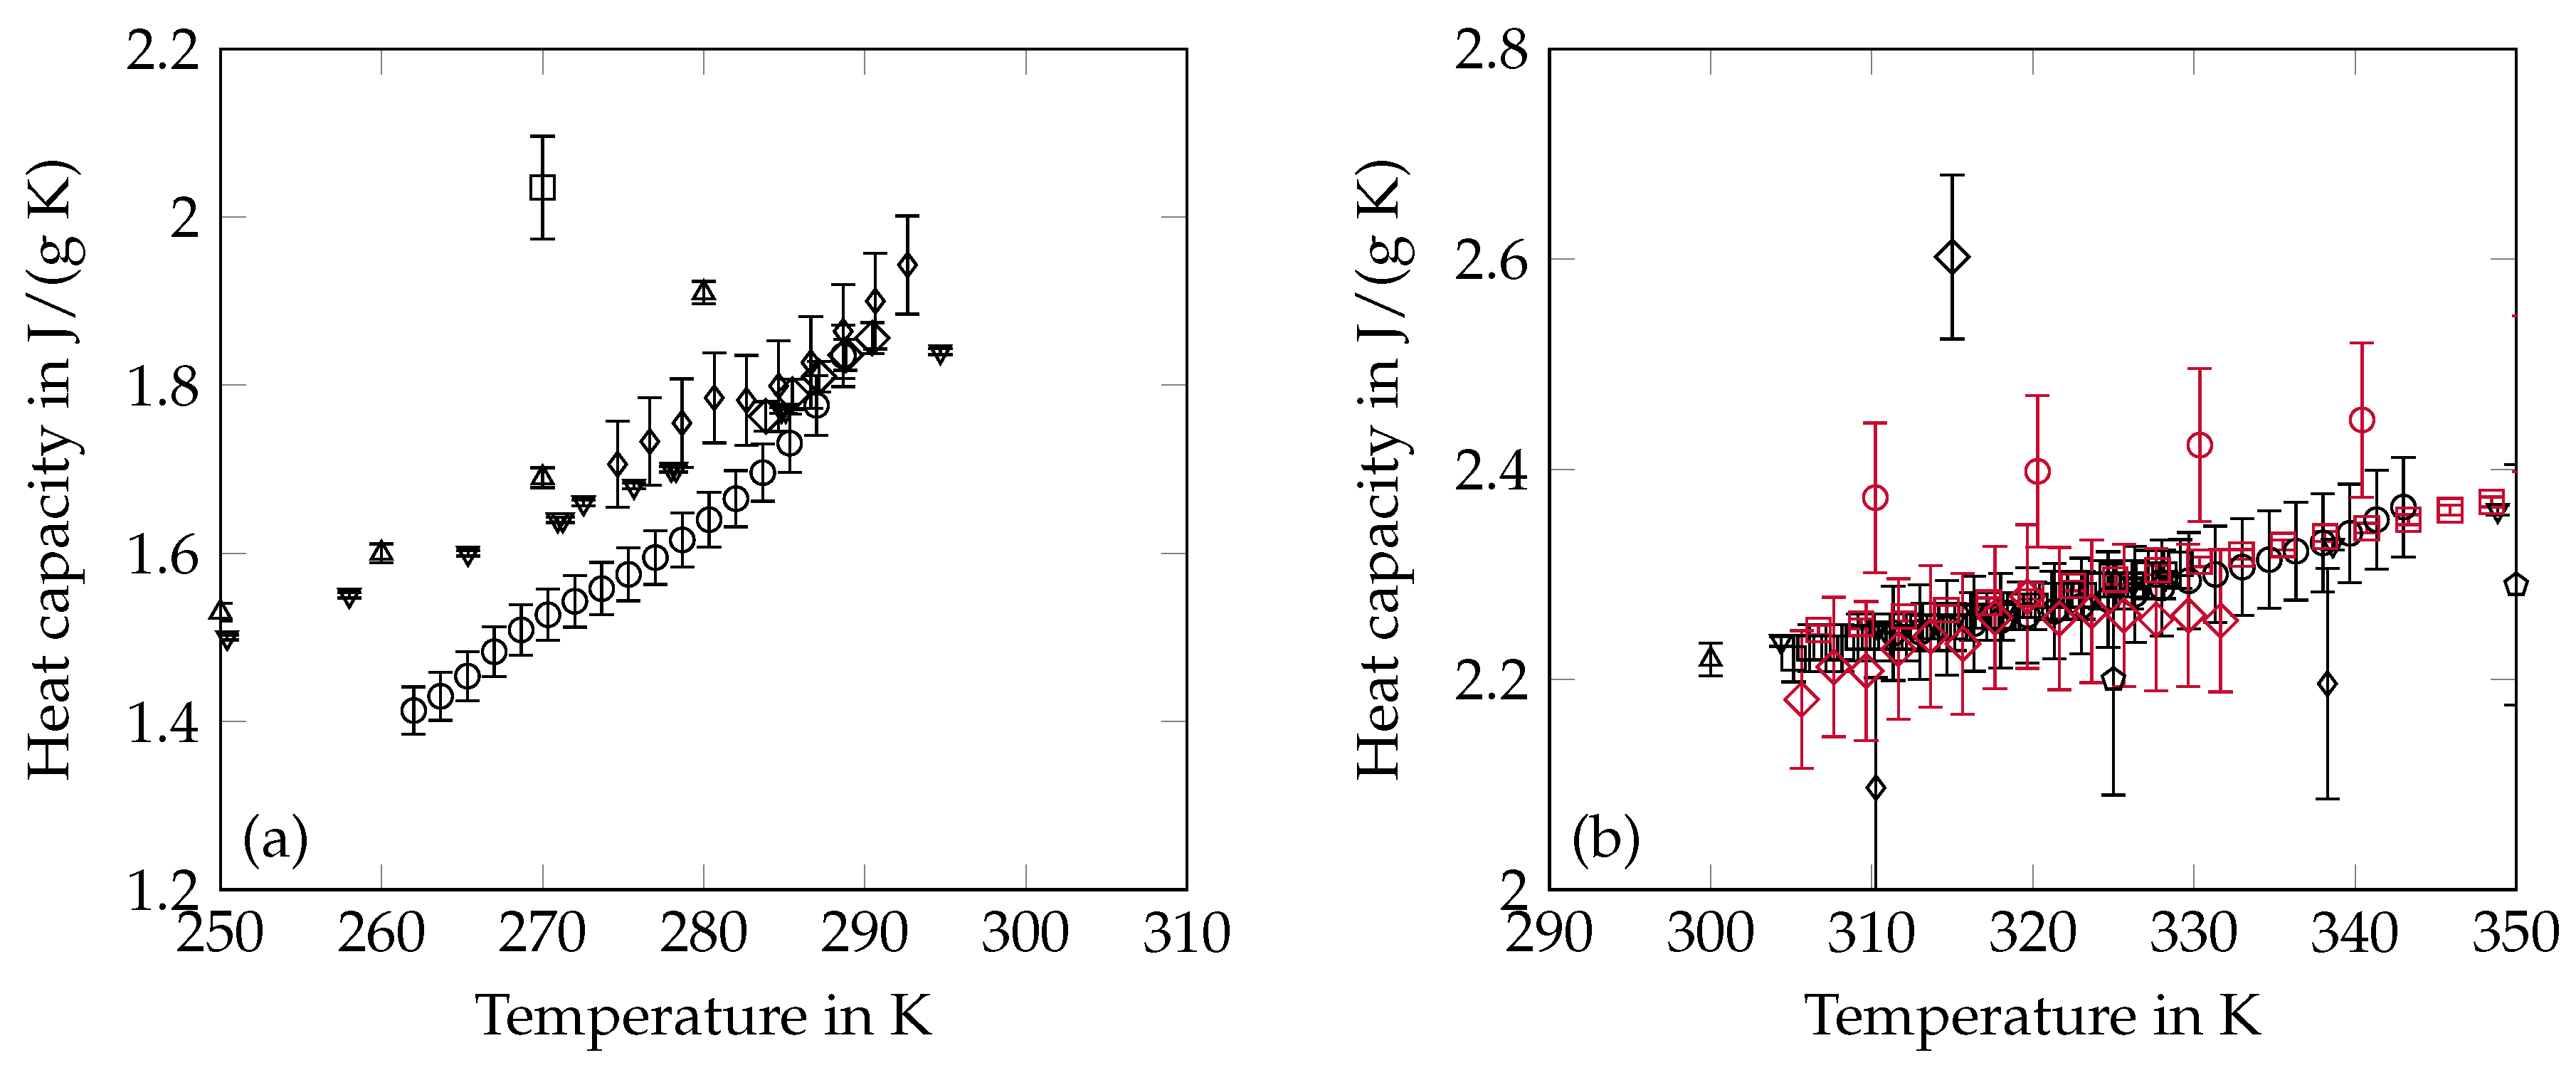
2.4. Heat Capacity
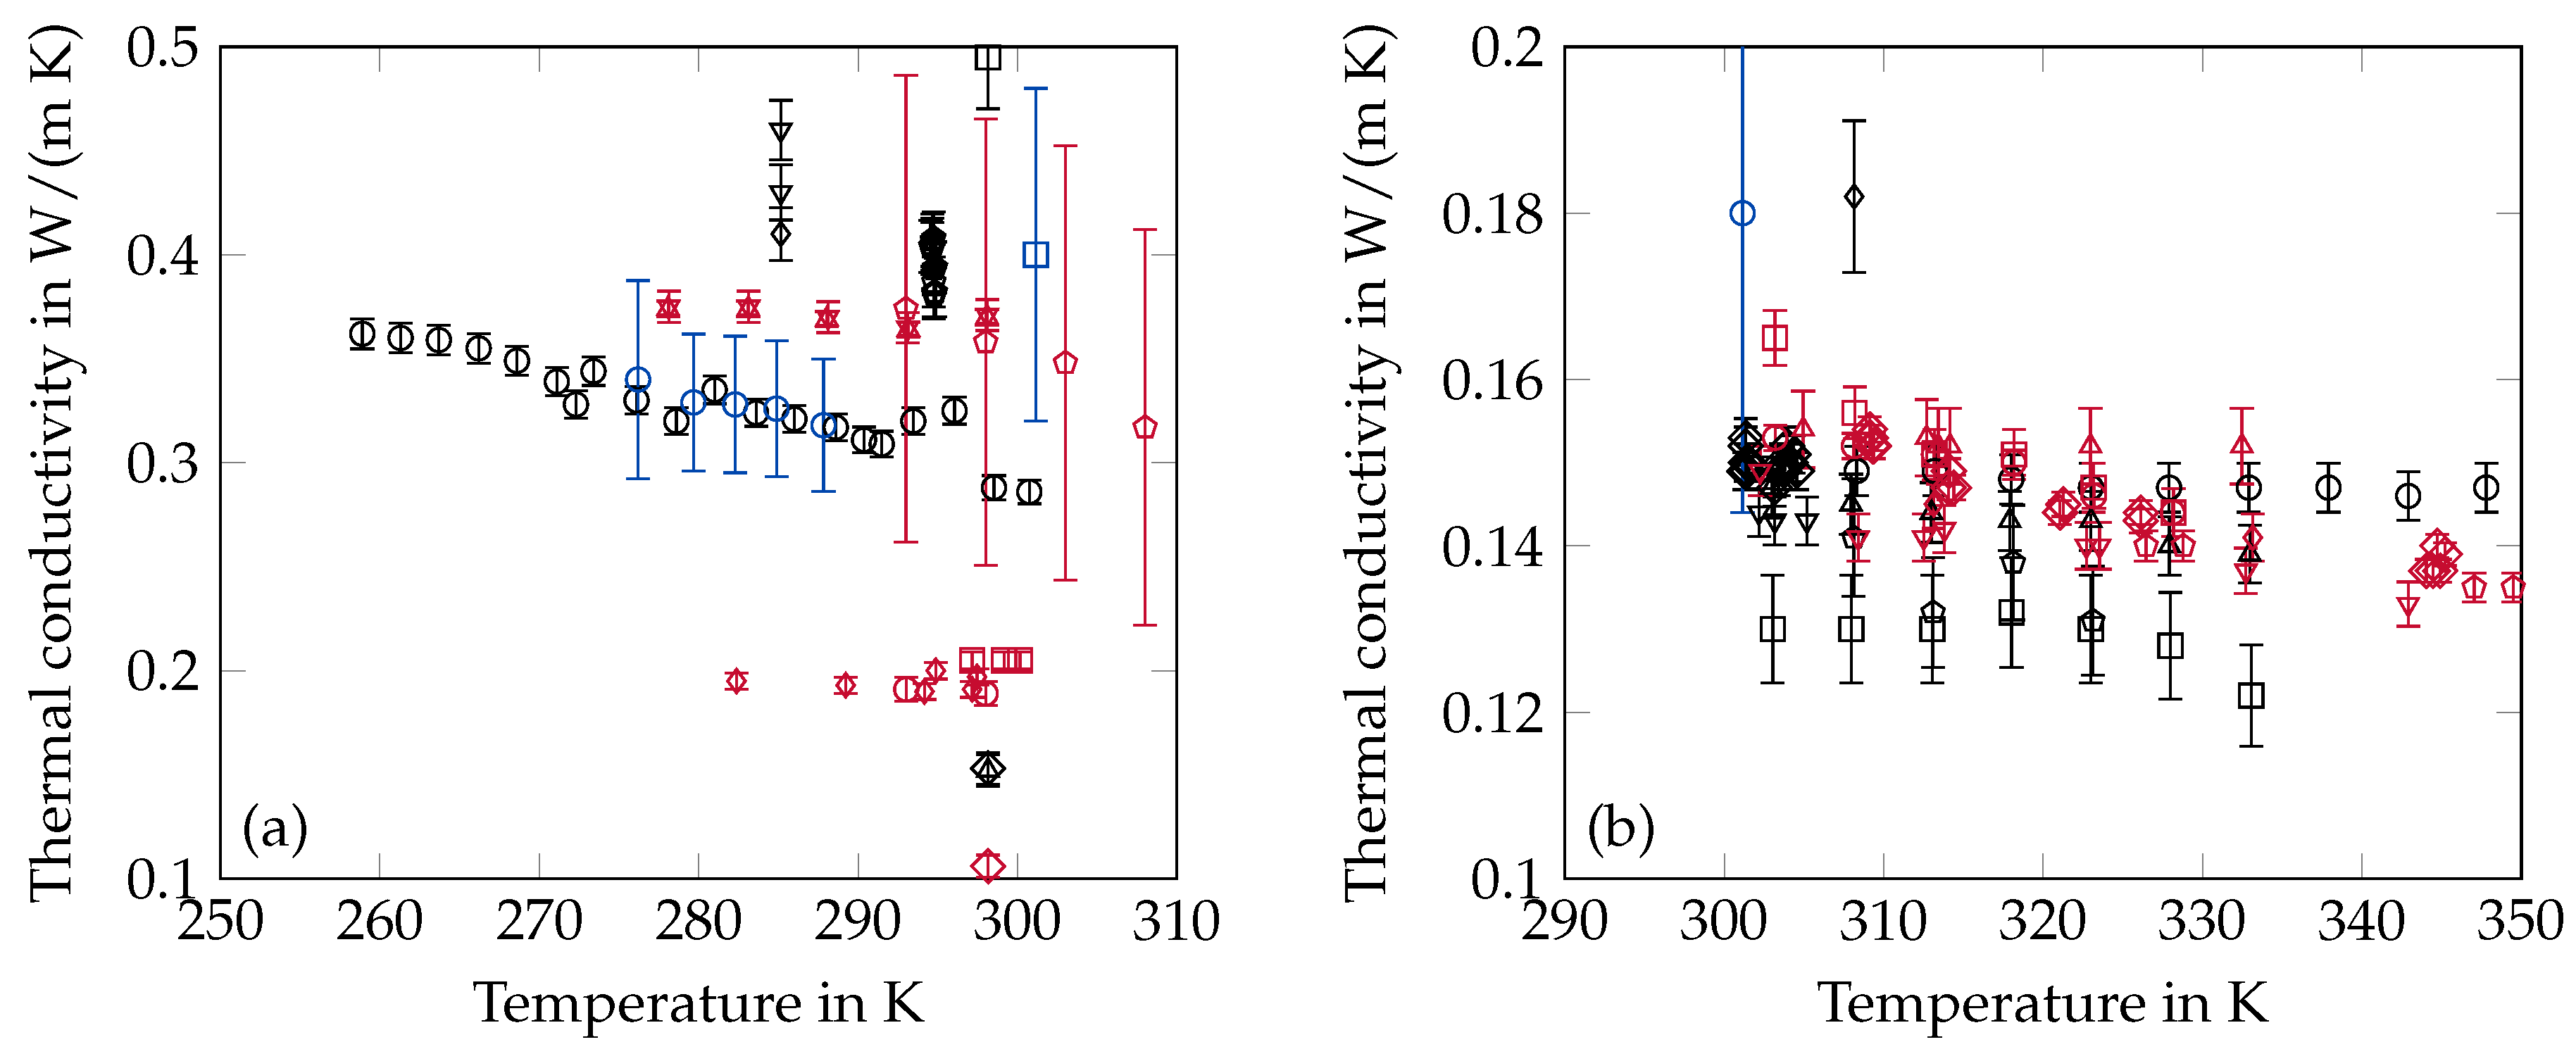
2.5. Thermal Conductivity
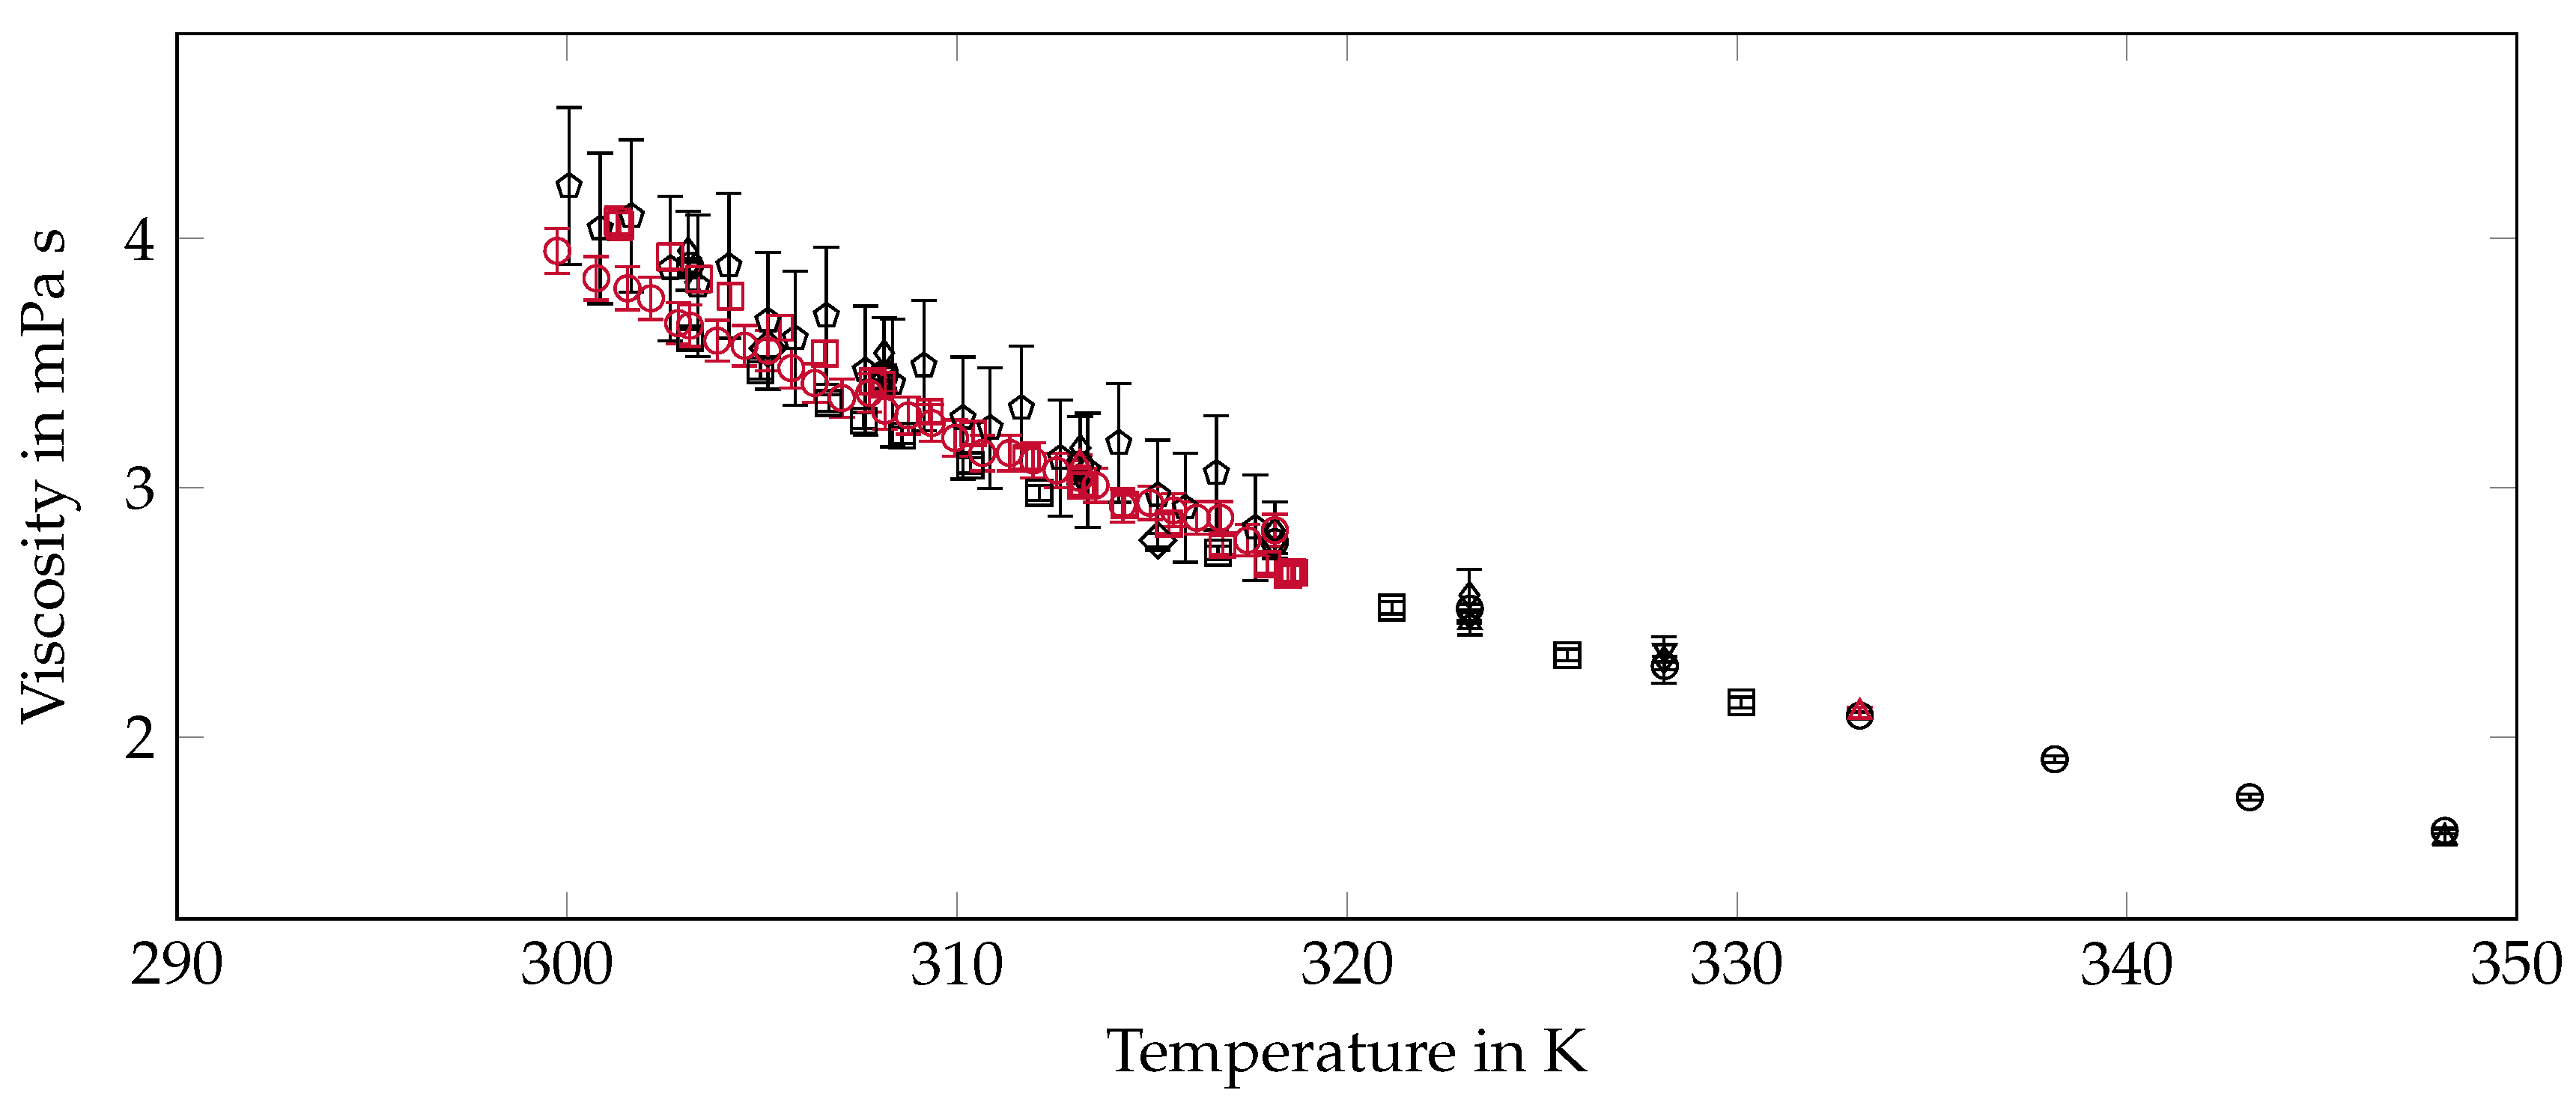
2.6. Viscosity
3. Preselection of Data
3.1. Melting Temperature and Enthalpy
- Only temperature data which were achieved as the extrapolated onset temperature or the temperature (see Section 2.1) are considered since these temperatures seem to represent a realistic melting point of octadecane.
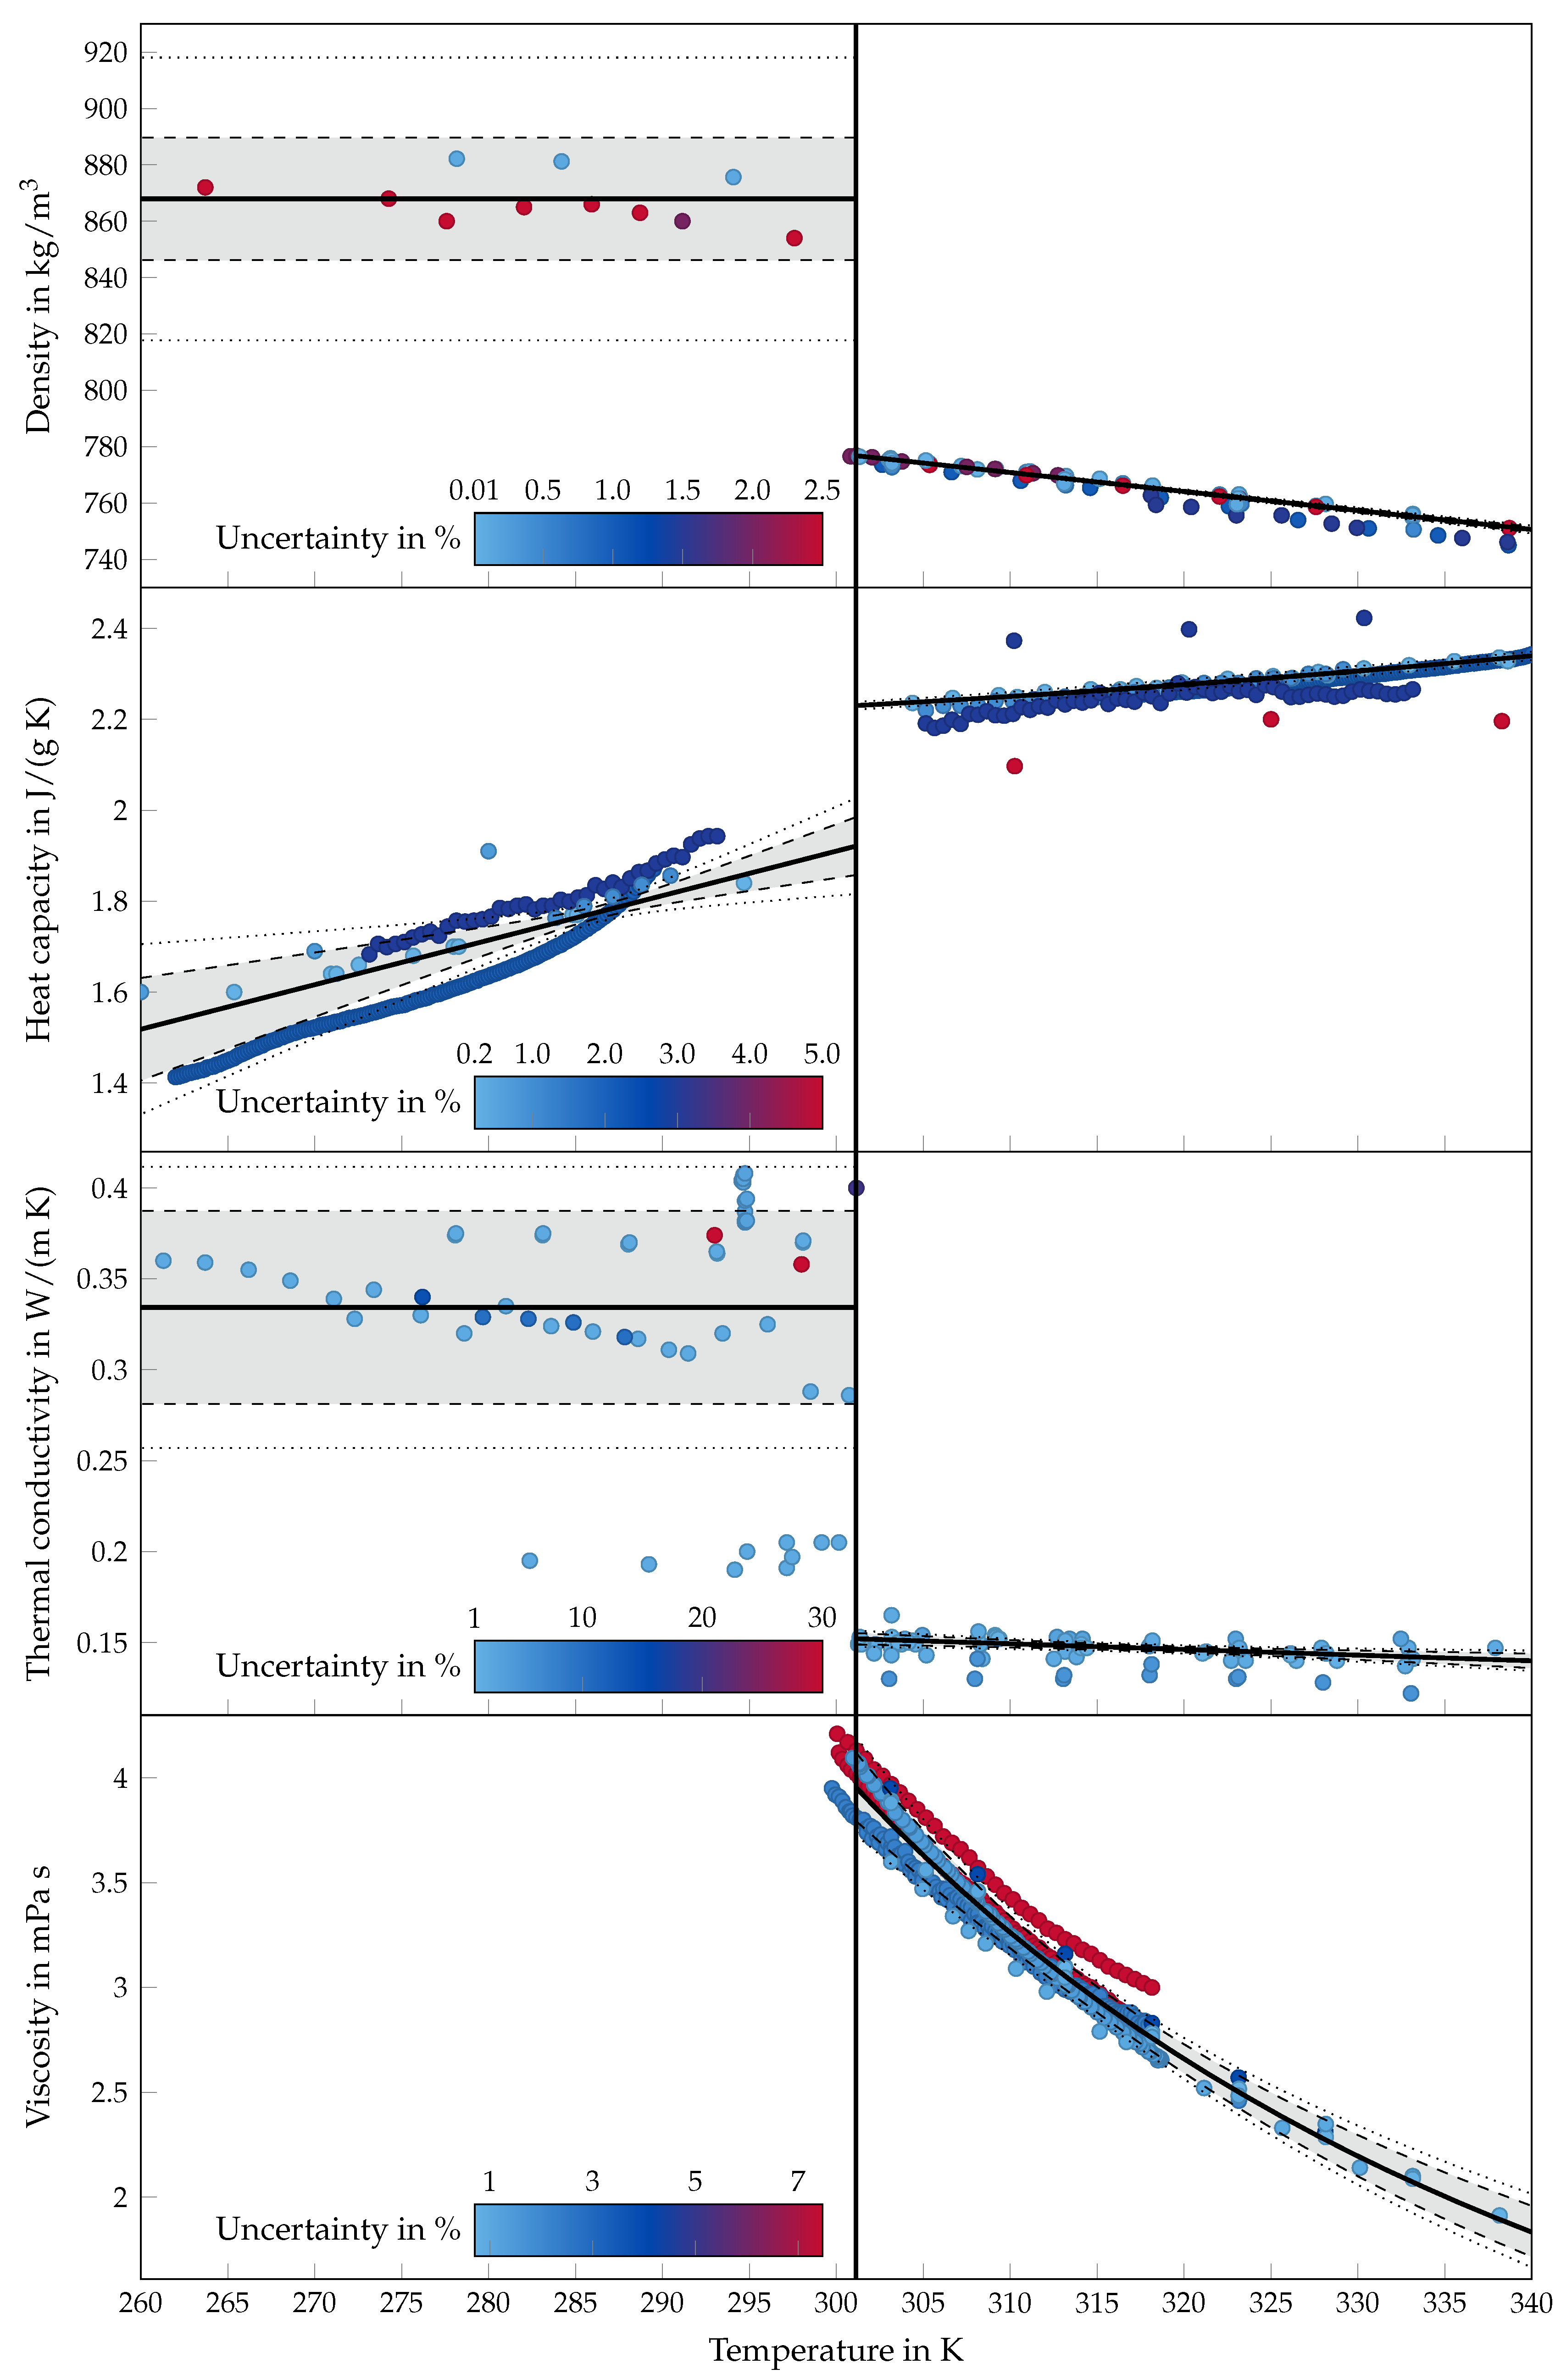
3.2. Density
- One datapoint of Shlosinger and Bentilla [67] was neglected since it was located in the 2-phase-region.
- The whole series of solid state data from Seyer et al. [62] was removed because of the indicated solid-solid transformation.
- All data of Würflinger and Schneider [73] were excluded due to the applied inverse method for determining the solid-state density.
- The data of Müller and Lonsdale [74] were neglected since their results where achieved with X-ray measurements resulting in very high theoretical density calculations based on the distance between the molecules.
- Liquid state densities from van Hook and Silver [64] were excluded because of incomprehensible corrections in their data.
- The liquid state data point of McKinney [72] was removed since it was given at a temperature of 25 C which is obviously in the solid state.
3.3. Thermal Conductivity
3.4. Heat Capacity
- Data points near the phase change temperature were neglected since they may be affected by phase change phenomena and therefore do not describe pure sensible heating of octadecane.
- The liquid state heat capacity of Parks et al. [53] was excluded because the indicated temperature is in the solid state range.
- The data of Djordjevic and Laub [46] were removed in both phases because they were outliers on the high side of values found in the literature.
3.5. Viscosity
4. Statistics
5. Results and Discussion
6. Conclusions
Author Contributions
Funding
Acknowledgments
Conflicts of Interest
Abbreviations
| A | Coefficient |
| B | Coefficient |
| AC | Adiabatic calorimeter |
| CV | Capillary viscometer |
| DM | Dilatometer |
| DSC | Differential scanning calorimetry |
| FV | Falling-body viscometer |
| g | Study/cluster number |
| G | Total number of studies/clusters |
| HM | Hydrometer |
| HW | Hydrostatic weighing |
| Null hypothesis | |
| IM | Inverse method |
| N | Number of observations |
| n/a | Not available |
| NC | Not classified |
| OR | Own research |
| PM | Pycnometer |
| RR | Rotational rheometer |
| SC | Stationary cylinder |
| SP | Stationary plate |
| Critical value from a student t-distribution | |
| T | Temperature |
| TA | Transient thermal analyser |
| Extrapolated offset temperature | |
| Extrapolated onset temperature | |
| Final peak temperature | |
| Initial peak temperature | |
| Peak maximum temperature | |
| TP | Transient plane source |
| Temperature with insufficient information about its determination | |
| TR | Translational rheometer |
| TW | Transient hot wire |
| VE | Vibrating-element |
| VV | Vibrating viscometer |
| Esitmated variance-covariance matrix of the ordinary least squares estimator | |
| Esitmated variance-covariance matrix of the weighted least squares estimator | |
| Weighting matrix | |
| Explanantory variable vector | |
| Explanantory variable matrix | |
| y | Measured values |
| Vector of measured values | |
| Estimated value | |
| Significance level | |
| Parameter | |
| Parameter vector | |
| Estimated parameter vector | |
| Ordinary least squares estimator | |
| Weighted least squares estimator | |
| Random error term | |
| Vector of residuals | |
| Viscosity | |
| Uncertainty of observation |
Appendix A
Appendix A.1. Estimated Fit Functions and Confidence Intervals
Appendix A.1.1. Melting Temperature
Appendix A.1.2. Melting Enthalpy
Appendix A.1.3. Density
Appendix A.1.4. Heat Capacity
Appendix A.1.5. Thermal Conductivity
Appendix A.1.6. Viscosity
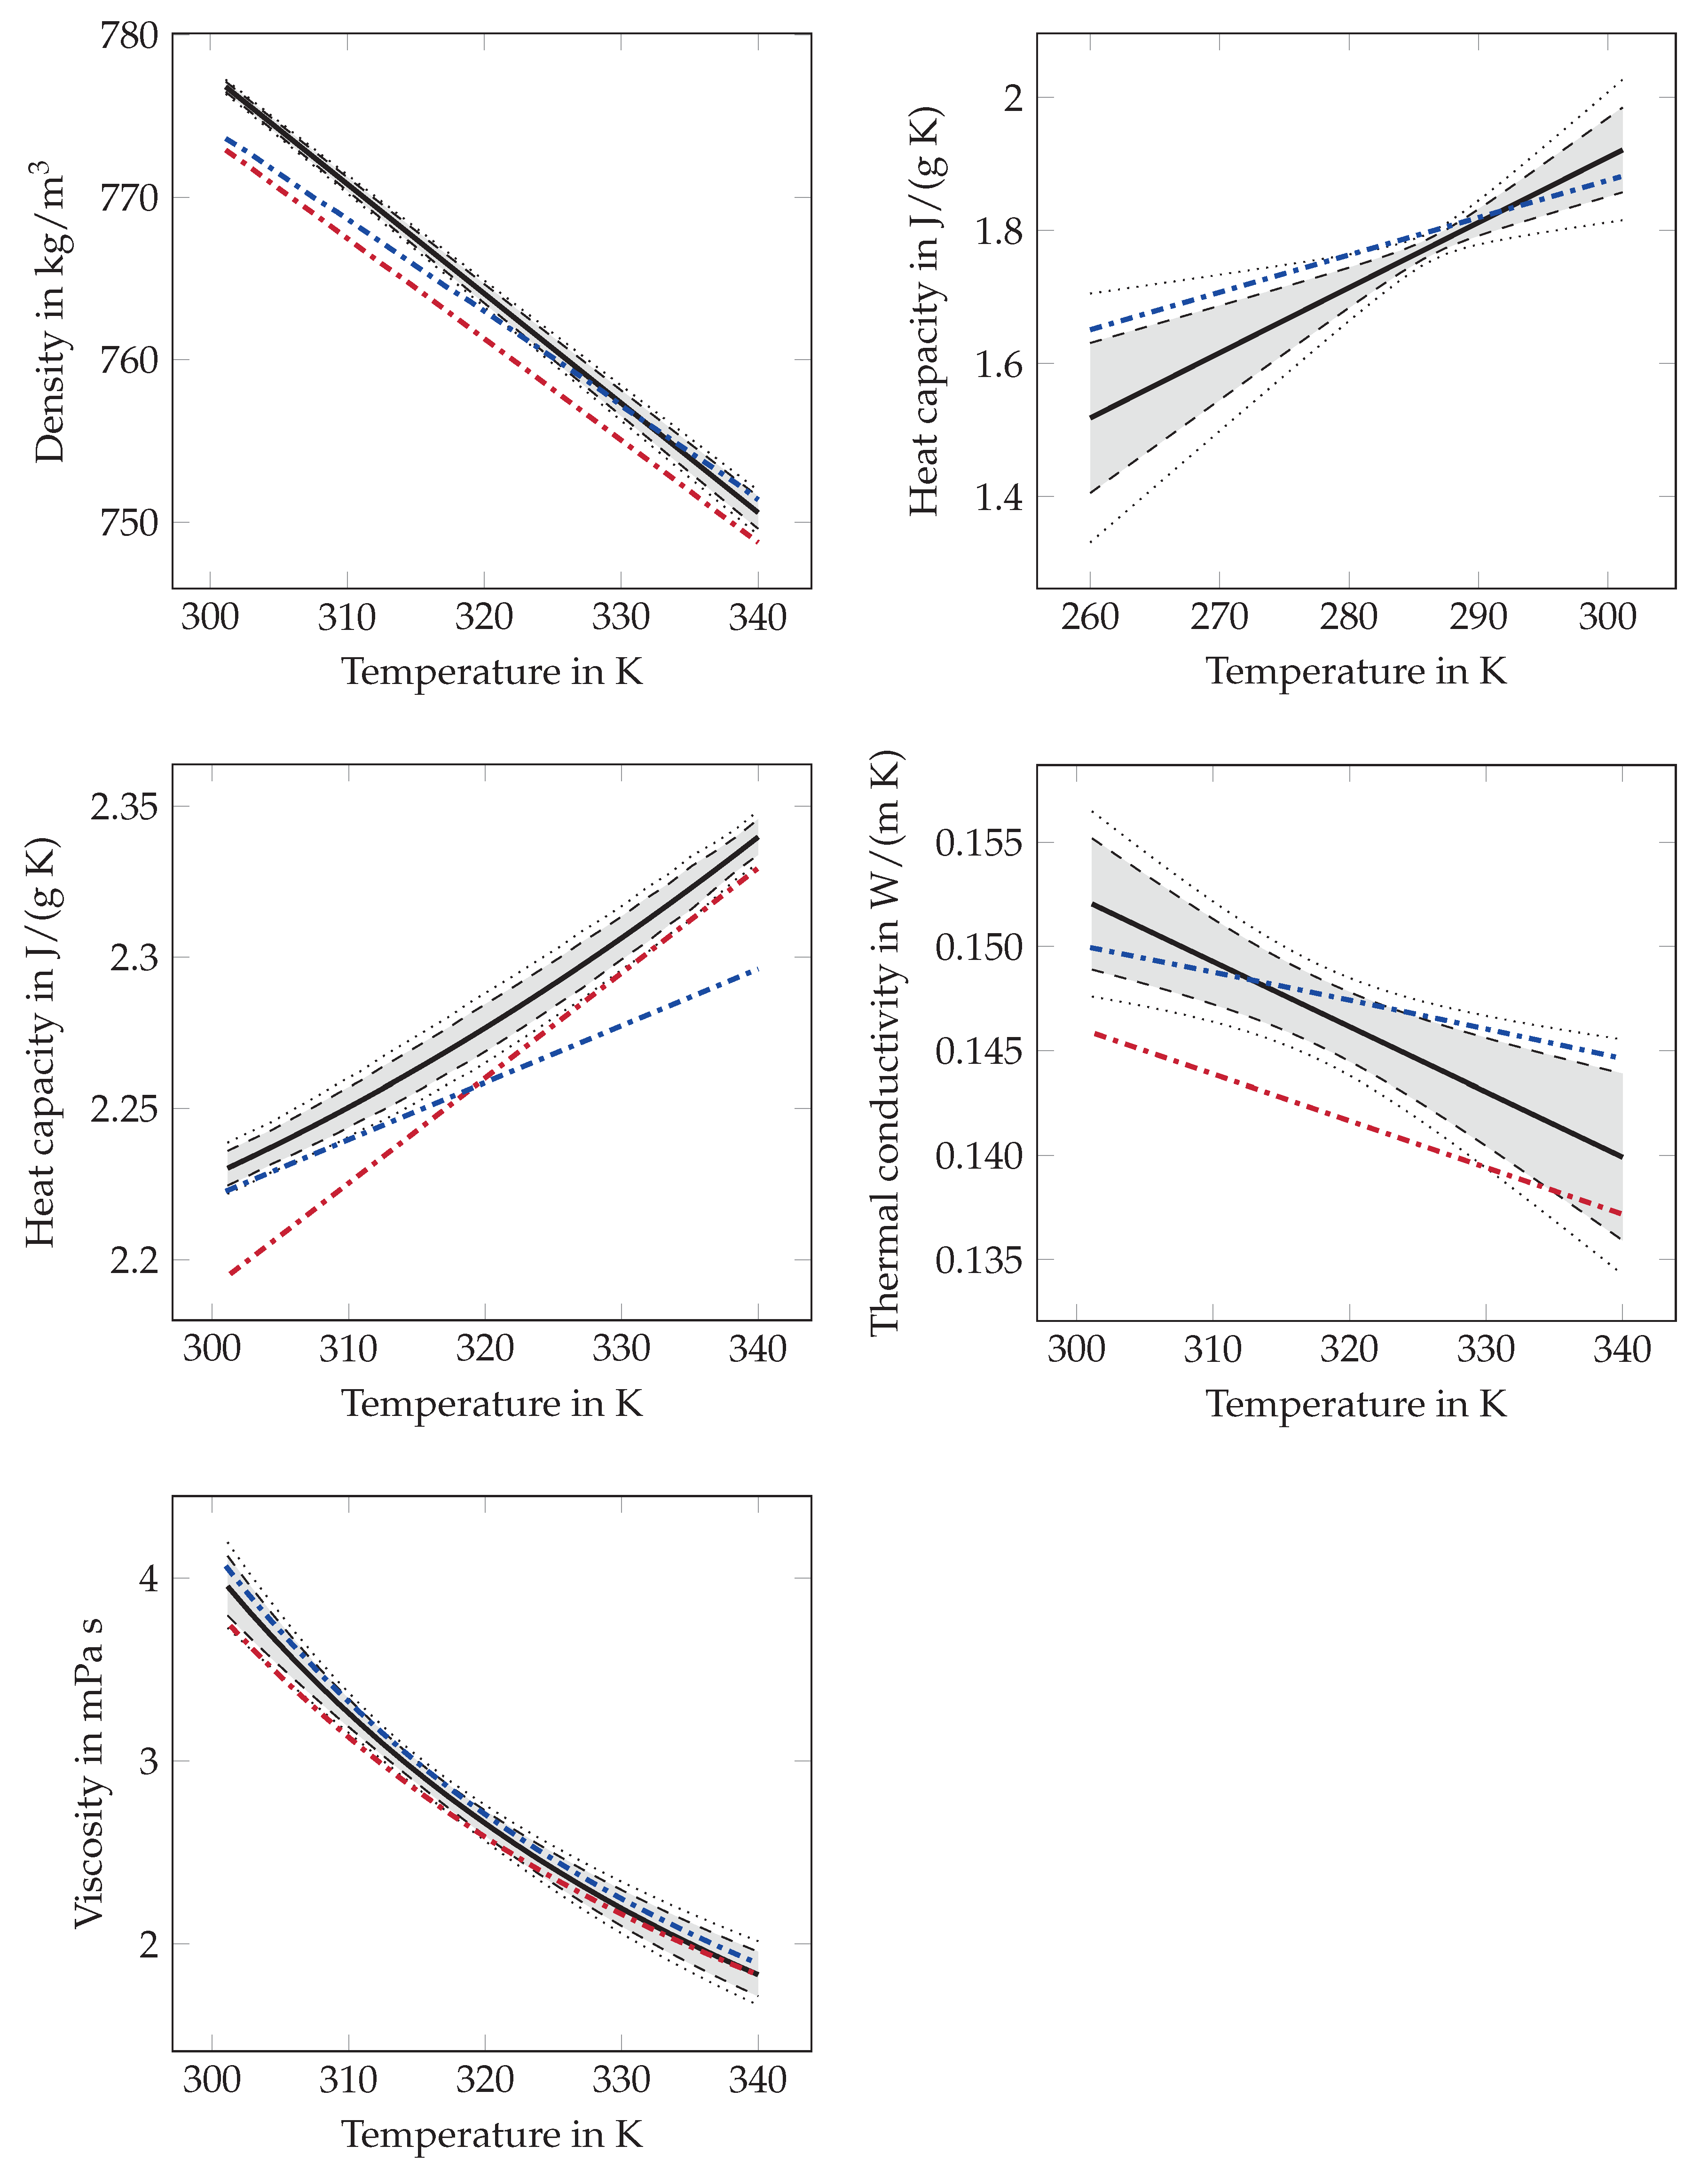
Appendix A.2. Comparison of Estimated Fit Functions with Functions from Literature
References
- Hale, N.W.; Viskanta, R. Photographic observation of the solid-liquid interface motion during melting of a solid heated from an isothermal vertical wall. Lett. Heat Mass Transf. 1978, 5, 329–337. [Google Scholar] [CrossRef]
- Hirata, T.; Makino, Y.; Kaneko, Y. Analysis of close-contact melting for octadecane and ice inside isothermally heated horizontal rectangular capsule. Int. J. Heat Mass Transf. 1991, 34, 3097–3106. [Google Scholar] [CrossRef]
- Faden, M.; Linhardt, C.; Höhlein, S.; König-Haagen, A.; Brüggemann, D. Velocity field and phase boundary measurements during melting of n-octadecane in a cubical test cell. Int. J. Heat Mass Transf. 2019, 135, 104–114. [Google Scholar] [CrossRef]
- Vogel, J.; Thess, A. Validation of a numerical model with a benchmark experiment for melting governed by natural convection in latent thermal energy storage. Appl. Thermal Eng. 2019, 148, 147–159. [Google Scholar] [CrossRef]
- Ho, C.J.; Viskanta, R. Heat Transfer During Melting From an Isothermal Vertical Wall. J. Heat Transf. 1984, 106, 12–19. [Google Scholar] [CrossRef]
- Rossini, F.D.; American Petroleum Institute. Selected Values of Physical and Thermodynamic Properties of Hydrocarbons and Related Compounds: Comprising the Tables of the A.P.I. Research Project 44 Extant As of December 31, 1952; Carnegie Press: Pittsburgh, PA, USA, 1953. [Google Scholar]
- Gschwander, S.; Haussmann, T.; Hagelstein, G.; Barreneche, C.; Ferrer, G.; Cabeza, L.; Diarce, G.; Hohenauer, W.; Lager, D.; Rathgeber, C.; et al. Standardization of pcm characterization via DSC. Refrig. Sci. Technol. 2016, 2016, 70–75. [Google Scholar]
- Delgado, M.; Gschwander, S.; Lázaro, A.; Peñalosa, C.; Zalba, B. Determining the rheological behavior of octadecane as phase change material: First approach. Thermochim. Acta 2012, 548, 81–87. [Google Scholar] [CrossRef]
- Tao, Y.B.; Carey, V.P. Effects of PCM thermophysical properties on thermal storage performance of a shell-and-tube latent heat storage unit. Appl. Energy 2016, 179, 203–210. [Google Scholar] [CrossRef]
- Bertrand, O.; Binet, B.; Combeau, H.; Couturier, S.; Delannoy, Y.; Gobin, D.; Lacroix, M.; Le Quéré, P.; Médale, M.; Mencinger, J.; et al. Melting driven by natural convection A comparison exercise: first results. Int. J. Therm. Sci. 1999, 38, 5–26. [Google Scholar] [CrossRef]
- Wang, S.; Faghri, A.; Bergman, T.L. A comprehensive numerical model for melting with natural convection. Int. J. Heat Mass Transf. 2010, 53, 1986–2000. [Google Scholar] [CrossRef]
- Kozak, Y.; Ziskind, G. Novel enthalpy method for modeling of PCM melting accompanied by sinking of the solid phase. Int. J. Heat Mass Transf. 2017, 112, 568–586. [Google Scholar] [CrossRef]
- Assis, E.; Ziskind, G.; Letan, R. Numerical and Experimental Study of Solidification in a Spherical Shell. Int. J. Heat Mass Transf. 2009, 131, 024502. [Google Scholar] [CrossRef]
- Faden, M.; König-Haagen, A.; Brüggemann, D. An optimum enthalpy approach for melting and solidification with volume change. Energies 2019, 12. [Google Scholar] [CrossRef]
- Tan, F.L.; Hosseinizadeh, S.F.; Khodadadi, J.M.; Fan, L. Experimental and computational study of constrained melting of phase change materials (PCM) inside a spherical capsule. Int. J. Heat Mass Transf. 2009, 52, 3464–3472. [Google Scholar] [CrossRef]
- Madruga, S.; Curbelo, J. Dynamic of plumes and scaling during the melting of a Phase Change Material heated from below. Int. J. Heat Mass Transf. 2018, 126, 206–220. [Google Scholar] [CrossRef]
- Galione, P.A.; Lehmkuhl, O.; Rigola, J.; Oliva, A. Fixed-grid numerical modeling of melting and solidification using variable thermo-physical properties—Application to the melting of n-Octadecane inside a spherical capsule. Int. J. Heat Mass Transf. 2015, 86, 721–743. [Google Scholar] [CrossRef]
- Höhne, G.W.H.; Hemminger, W.F.; Flammersheim, H.J. Differential Scanning Calorimetry; Springer: Berlin/Heidelberg, Germany, 2003. [Google Scholar]
- Qiu, X.; Li, W.; Song, G.; Chu, X.; Tang, G. Microencapsulated n-octadecane with different methylmethacrylate-based copolymer shells as phase change materials for thermal energy storage. Energy 2012, 46, 188–199. [Google Scholar] [CrossRef]
- Li, W.; Song, G.; Tang, G.; Chu, X.; Ma, S.; Liu, C. Morphology, structure and thermal stability of microencapsulated phase change material with copolymer shell. Energy 2011, 36, 785–791. [Google Scholar] [CrossRef]
- Tang, F.; Liu, L.; Alva, G.; Jia, Y.; Fang, G. Synthesis and properties of microencapsulated octadecane with silica shell as shape–stabilized thermal energy storage materials. Sol. Energy Mater. Sol. Cells 2017, 160, 1–6. [Google Scholar] [CrossRef]
- Bayramoglu, E.Ç. Thermal properties and stability of n-octadecane based composites containing multiwalled carbon nanotubes. Polym. Compos. 2011, 32, 904–909. [Google Scholar] [CrossRef]
- Jeong, S.G.; Jeon, J.; Lee, J.H.; Kim, S. Optimal preparation of PCM/diatomite composites for enhancing thermal properties. Int. J. Heat Mass Transf. 2013, 62, 711–717. [Google Scholar] [CrossRef]
- Zhang, Z.; Shi, G.; Wang, S.; Fang, X.; Liu, X. Thermal energy storage cement mortar containing n-octadecane/expanded graphite composite phase change material. Renew. Energy 2013, 50, 670–675. [Google Scholar] [CrossRef]
- Sun, Z.; Kong, W.; Zheng, S.; Frost, R.L. Study on preparation and thermal energy storage properties of binary paraffin blends/opal shape-stabilized phase change materials. Sol. Energy Mater. Sol. Cells 2013, 117, 400–407. [Google Scholar] [CrossRef]
- Wang, H.Y.; Lu, S.S. Study on thermal properties of phase change material by an optical DSC system. Appl. Therm. Eng. 2013, 60, 132–136. [Google Scholar] [CrossRef]
- Vélez, C.; Khayet, M.; Ortiz de Zárate, J.M. Temperature-dependent thermal properties of solid/liquid phase change even-numbered n-alkanes: N-Hexadecane, n-octadecane and n-eicosane. Appl. Energy 2015, 143, 383–394. [Google Scholar] [CrossRef]
- Ho, C.J.; Gao, J.Y. Preparation and thermophysical properties of nanoparticle-in-paraffin emulsion as phase change material. Int. Commun. Heat Mass Transf. 2009, 36, 467–470. [Google Scholar] [CrossRef]
- Li, H.; Liu, X.; Fang, G.Y. Synthesis and characteristics of form-stable n-octadecane/expanded graphite composite phase change materials. Appl. Phys. A 2010, 100, 1143–1148. [Google Scholar] [CrossRef]
- Döğüşcü, D.K.; Kızıl, Ç.; Biçer, A.; Sarı, A.; Alkan, C. Microencapsulated n -alkane eutectics in polystyrene for solar thermal applications. Solar Energy 2018, 160, 32–42. [Google Scholar] [CrossRef]
- Qiu, X.; Lu, L.; Wang, J.; Tang, G.; Song, G. Fabrication, thermal properties and thermal stabilities of microencapsulated n-alkane with poly(lauryl methacrylate) as shell. Thermochim. Acta 2015, 620, 10–17. [Google Scholar] [CrossRef]
- Jeon, J.; Jeong, S.G.; Lee, J.H.; Seo, J.; Kim, S. High thermal performance composite PCMs loading xGnP for application to building using radiant floor heating system. Sol. Energy Mater. Sol. Cells 2012, 101, 51–56. [Google Scholar] [CrossRef]
- Zhang, G.H.; Bon, S.; Zhao, C.Y. Synthesis, characterization and thermal properties of novel nanoencapsulated phase change materials for thermal energy storage. Solar Energy 2012, 86, 1149–1154. [Google Scholar] [CrossRef]
- Shan, X.L.; Wang, J.P.; Zhang, X.X.; Wang, X.C. Formaldehyde-free and thermal resistant microcapsules containing n-octadecane. Thermochim. Acta 2009, 494, 104–109. [Google Scholar] [CrossRef]
- Chaiyasat, A.; Waree, C.; Songkhamrod, K.; Sirithip, P.; Voranuch, V.; Chaiyasat, P. Preparation of polydivinylbenzene/natural rubber capsule encapsulating octadecane: Influence of natural rubber molecular weight and content. Express Polym. Lett. 2012, 6, 70–77. [Google Scholar] [CrossRef]
- Chung, O.; Jeong, S.G.; Kim, S. Preparation of energy efficient paraffinic PCMs/expanded vermiculite and perlite composites for energy saving in buildings. Sol. Energy Mater. Sol. Cells 2015, 137, 107–112. [Google Scholar] [CrossRef]
- He, F.; Wang, X.; Wu, D. New approach for sol–gel synthesis of microencapsulated n-octadecane phase change material with silica wall using sodium silicate precursor. Energy 2014, 67, 223–233. [Google Scholar] [CrossRef]
- Yu, S.; Wang, X.; Wu, D. Microencapsulation of n-octadecane phase change material with calcium carbonate shell for enhancement of thermal conductivity and serving durability: Synthesis, microstructure, and performance evaluation. Appl. Energy 2014, 114, 632–643. [Google Scholar] [CrossRef]
- Zhang, H.; Xu, Q.; Zhao, Z.; Zhang, J.; Sun, Y.; Sun, L.; Xu, F.; Sawada, Y. Preparation and thermal performance of gypsum boards incorporated with microencapsulated phase change materials for thermal regulation. Sol. Energy Mater. Sol. Cells 2012, 102, 93–102. [Google Scholar] [CrossRef]
- Babich, M.W.; Hwang, S.W.; Mounts, R.D. The search for novel energy storage materials using differential scanning calorimetry. Thermochim. Acta 1992, 210, 83–88. [Google Scholar] [CrossRef]
- Zhu, Y.; Liang, S.; Wang, H.; Zhang, K.; Jia, X.; Tian, C.; Zhou, Y.; Wang, J. Morphological control and thermal properties of nanoencapsulated n -octadecane phase change material with organosilica shell materials. Energy Convers. Manag. 2016, 119, 151–162. [Google Scholar] [CrossRef]
- Wei, D.; Han, S.; Wang, B. Solid–liquid phase equilibrium study of binary mixtures of n-octadecane with capric, and lauric acid as phase change materials (PCMs). Fluid Phase Equilib. 2014, 373, 84–88. [Google Scholar] [CrossRef]
- Chang, S.S.; Maurey, J.R.; Pummer, W.J. Solubilities of two n-alkanes in various solvents. J. Chem. Eng. Data 1983, 28, 187–189. [Google Scholar] [CrossRef]
- Kolesnikov, S.; Syunyaev, Z. Calorimetric study of the phase-transitions of solid hydrocarbons. 1. phase-transitions in the melting and crystallization of n-c18h38 and n-c20h42. J. Appl. Chem. USSR 1985, 58, 2097–2101. [Google Scholar]
- Huang, D.; Simon, S.L.; McKenna, G.B. Chain length dependence of the thermodynamic properties of linear and cyclic alkanes and polymers. J. Chem. Phys. 2005, 122, 84907. [Google Scholar] [CrossRef] [PubMed]
- Djordjevic, N.M.; Laub, R.J. Mutual solubilities of components of binary blends of n-octadecane, DI-n-octyl ether, and N,N-dioctylamine. Thermochim. Acta 1986, 107, 227–238. [Google Scholar] [CrossRef]
- Fonseca, J.M.; Gushterov, N.; Dohrn, R. Vapour pressures of selected organic compounds down to 1mPa, using mass-loss Knudsen effusion method. J. Chem. Thermodyn. 2014, 73, 148–155. [Google Scholar] [CrossRef]
- Boudouh, I.; Hafsaoui, S.L.; Mahmoud, R.; Barkat, D. Measurement and prediction of solid–liquid phase equilibria for systems containing biphenyl in binary solution with long-chain n-alkanes. J. Therm. Anal. Calorim. 2016, 125, 793–801. [Google Scholar] [CrossRef]
- Mondieig, D.; Rajabalee, F.; Metivaud, V.; Oonk, H.A.J.; Cuevas-Diarte, M.A. n-Alkane Binary Molecular Alloys. Chem. Mater. 2004, 16, 786–798. [Google Scholar] [CrossRef]
- Robles, L.; Mondieig, D.; Haget, Y.; Cuevas-Diarte, M.A.; Alcobe, X. Non Isomorphism and Miscibility in The Solid State: Determination of The Equilibrium Phase Diagram n-Octadecane C 18 H 38 + n-Nonadecane C 19 H 40. Mol. Cryst. Liquid Cryst. Sci. Technol. Sect. A 1996, 281, 279–290. [Google Scholar] [CrossRef]
- Wei, D.; Zhang, X.; Li, H. Solid–liquid phase equilibrium study of n-octadecane+lauryl alcohol binary mixtures. J. Chem. Thermodyn. 2013, 60, 94–97. [Google Scholar] [CrossRef]
- Schaerer, A.A.; Busso, C.J.; Smith, A.E.; Skinner, L.B. Properties of Pure Normal Alkanes in the C 17 to C 36 Range. J. Am. Chem. Soc. 1955, 77, 2017–2019. [Google Scholar] [CrossRef]
- Parks, G.S.; Moore, G.E.; Renquist, M.L.; Naylor, B.F.; McClaine, L.A.; Fujii, P.S.; Hatton, J.A. Thermal Data on Organic Compounds. XXV. Some Heat Capacity, Entropy and Free Energy Data for Nine Hydrocarbons of High Molecular Weight. J. Am. Chem. Soc. 1949, 71, 3386–3389. [Google Scholar] [CrossRef]
- Messerly, J.F.; Guthrie, G.B., Jr.; Todd, S.S.; Finke, H.L. Low-temperature thermal data for pentane, n-heptadecane, and n-octadecane. Revised thermodynamic functions for the n-alkanes, C5-C18. J. Chem. Eng. Data 1967, 1967, 338–346. [Google Scholar] [CrossRef]
- Meyer, E.F.; Meyer, M.C. Solid-liquid phase behavior of nonadecylcyclohexane and nonadecylbenzene. J. Chem. Eng. Data 1983, 28, 148–150. [Google Scholar] [CrossRef]
- Ksiażczak, A. Vapour pressures of binary three-phase (solid + liquid + vapour) mixtures IV. Melting temperatures of the solid phases of n-octadecane and of n-nonadecane. J. Chem. Thermodyn. 1989, 21, 1231–1236. [Google Scholar] [CrossRef]
- Carey, P.C.; Smith, J.C. 92. Higher aliphatic compounds. Part III. The preparation of paraffins. J. Chem. Soc. 1933, 346. [Google Scholar] [CrossRef]
- Domańska, U.; Łachwa, J.; Morawski, P.; Malanowski, S.K. Phase Equilibria and Volumetric Properties in Binary Mixtures Containing Branched Chain Ethers (Methyl 1,1-Dimethylethyl Ether or Ethyl 1,1-Dimethylethyl Ether or Methyl 1,1-Dimethylpropyl Ether or Ethyl 1,1-Dimethylpropyl Ether). J. Chem. Eng. Data 1999, 44, 974–984. [Google Scholar] [CrossRef]
- Levene, P.; West, C.; van der Scheer, J. The preparation and melting points of the higher aliphatic hydrocarbons. Stud. Repr. 1915, 22, 239. [Google Scholar]
- Parks, G.S.; West, T.J.; Naylor, B.F.; Fujii, P.S.; McClaine, L.A. Thermal Data on Organic Compounds. XXIII. Modern Combustion Data for Fourteen Hydrocarbons and Five Polyhydroxy Alcohols. J. Am. Chem. Soc. 1946, 68, 2524–2527. [Google Scholar] [CrossRef]
- Krafft, F. Ueber neunzehn höhere Normalparaffine Cn H2n + 2 und ein einfaches Volumgesetz für den tropfbar flüssigen Zustand. II. Berichte der deutschen chemischen Gesellschaft 1882, 15, 1711–1727. [Google Scholar] [CrossRef]
- Seyer, W.F.; Patterson, R.F.; Keays, J.L. The Density and Transition Points of the n-Paraffin Hydrocarbons. J. Am. Chem. Soc. 1944, 66, 179–182. [Google Scholar] [CrossRef]
- Dover, M.V.; Hensley, W.A. Properties of 1-Octadecene, n-Octadecane, and Di-m-tolylethane. Ind. Eng. Chem. 1935, 27, 337–339. [Google Scholar] [CrossRef]
- Van Hook, A.; Silver, L. Premelting Anomalies of Some Long Chain Normal Paraffin Hydrocarbons. J. Chem. Phys. 1942, 10, 686–690. [Google Scholar] [CrossRef]
- Cutler, W.G.; McMickle, R.H.; Webb, W.; Schiessler, R.W. Study of the Compressions of Several High Molecular Weight Hydrocarbons. J. Chem. Phys. 1958, 29, 727–740. [Google Scholar] [CrossRef]
- Nelson, R.R.; Webb, W.; Dixon, J.A. First–Order Phase Transitions of Six Normal Paraffins at Elevated Pressures. J. Chem. Phys. 1960, 33, 1756–1764. [Google Scholar] [CrossRef]
- Shlosinger, A.P.; Bentilla, E.W. Research and Development Study on Thermal Control by Use of Fusible Materials. Available online: https://ntrs.nasa.gov/archive/nasa/casi.ntrs.nasa.gov/19660017401.pdf (accessed on 16 January 2019).
- Findenegg, G.H. Dichte und Ausdehnungskoeffizient einiger flüssiger Alkane. Monatshefte für Chemie 1970, 101, 1081–1088. [Google Scholar] [CrossRef]
- Espeau, P.; Céolin, R. A simple method to determine the specific volumes of liquids and melts as a function of the temperature. Thermochim. Acta 2006, 445, 32–35. [Google Scholar] [CrossRef]
- Caudwell, D.R.; Trusler, J.P.M.; Vesovic, V.; Wakeham, W.A. The Viscosity and Density of n-Dodecane and n-Octadecane at Pressures up to 200 MPa and Temperatures up to 473 K. Int. J. Thermophys. 2004, 25, 1339–1352. [Google Scholar] [CrossRef]
- Graaf, G.H.; Smit, H.J.; Stamhuis, E.J.; Beenackers, A.A.C.M. Gas-liquid solubilities of the methanol synthesis components in various solvents. J. Chem. Eng. Data 1992, 37, 146–158. [Google Scholar] [CrossRef]
- McKinney, J.W. THE CONSTITUTION OF KEROGEN. J. Am. Chem. Soc. 1924, 46, 968–979. [Google Scholar] [CrossRef]
- Würflinger, A.; Schneider, G.M. Differential Thermal Analysis under High Pressures II: Investigation of the Rotational Transition of Several n–Alkanes. Berichte der Bunsengesellschaft für physikalische Chemie 1973, 77, 121–128. [Google Scholar] [CrossRef]
- Müller, A.; Lonsdale, K. The low-temperature form of C 18 H 38. Acta Crystallogr. 1948, 1, 129–131. [Google Scholar] [CrossRef]
- Dutour, S.; Daridon, J.L.; Lagourette, B. Pressure and Temperature Dependence of the Speed of Sound and Related Properties in Normal Octadecane and Nonadecane. Int. J. Thermophys. 2000, 21, 173–184. [Google Scholar] [CrossRef]
- Höhne, G.W.H. Transitions of n-Alkanes Above the Melting Point. Polym. Bull. 1981, 1981, 41–46. [Google Scholar] [CrossRef]
- Durupt, N.; Aoulmi, A.; Bouroukba, M.; Rogalski, M. Heat capacities of liquid long-chain alkanes. Thermochim. Acta 1996, 274, 73–80. [Google Scholar] [CrossRef]
- Van Miltenburg, J.C. Fitting the heat capacity of liquid n-alkanes: new measurements of n-heptadecane and n-octadecane. Thermochim. Acta 2000, 343, 57–62. [Google Scholar] [CrossRef]
- Czichos, H.; Saito, T.; Smith, L. Springer Handbook of Materials Measurement Methods; Springer handbooks; Springer: Berlin, Germany, 2006. [Google Scholar] [CrossRef]
- Irby, R.G.; Parsons, J.R.; Keshock, E.G. An investigation of the thermal transport properties of octadecane, a material used in thermal energy storage systems. In Thermal Conductivity 19; Yarbrough, D.W., Ed.; Plenum Press: New York, NY, USA, 1988. [Google Scholar]
- Harish, S.; Orejon, D.; Takata, Y.; Kohno, M. Thermal conductivity enhancement of lauric acid phase change nanocomposite with graphene nanoplatelets. Appl. Therm. Eng. 2015, 80, 205–211. [Google Scholar] [CrossRef]
- Wu, Y.; Yan, X.; Meng, P.; Sun, P.; Cheng, G.; Zheng, R. Carbon black/octadecane composites for room temperature electrical and thermal regulation. Carbon 2015, 94, 417–423. [Google Scholar] [CrossRef]
- Khadiran, T.; Hussein, M.Z.; Zainal, Z.; Rusli, R. Shape-stabilised n-octadecane/activated carbon nanocomposite phase change material for thermal energy storage. J. Taiwan Inst. Chem. Eng. 2015, 55, 189–197. [Google Scholar] [CrossRef]
- Águila V, B.; Vasco, D.A.; Galvez P, P.; Zapata, P.A. Effect of temperature and CuO-nanoparticle concentration on the thermal conductivity and viscosity of an organic phase-change material. Int. J. Heat Mass Transf. 2018, 120, 1009–1019. [Google Scholar] [CrossRef]
- Motahar, S.; Nikkam, N.; Alemrajabi, A.A.; Khodabandeh, R.; Toprak, M.S.; Muhammed, M. A novel phase change material containing mesoporous silica nanoparticles for thermal storage: A study on thermal conductivity and viscosity. Int. Commun. Heat Mass Transf. 2014, 56, 114–120. [Google Scholar] [CrossRef]
- Motahar, S.; Alemrajabi, A.A.; Khodabandeh, R. Enhanced thermal conductivity of n-octadecane containing carbon-based nanomaterials. Heat Mass Transf. 2016, 52, 1621–1631. [Google Scholar] [CrossRef]
- Sakiadis, B.C.; Coates, J. Studies of thermal conductivity of liquids: Part III. AIChE J. 1957, 3, 121–126. [Google Scholar] [CrossRef]
- Powell, R.W.; Challoner, A.R.; Seyer, W.F. Correspondence. Measurement of Thermal Conductivity of n-Octadecane. Ind. Eng. Chem. 1961, 53, 581–582. [Google Scholar] [CrossRef]
- Ziebland, H.; Patient, J.E. Communication. Thermal Conductivity of n-Octadecane. New Measurements and a Critical Appraisal of the Article by Sutherland, Davis, and Seyer. J. Chem. Eng. Data 1962, 7, 530–531. [Google Scholar] [CrossRef]
- Griggs, E.I.; Yarbrough, D.W. Thermal conductivity of solid unbranched alkanes from n-hexadecane to n-eicosane. In Proceedings of the 14th Southeastern Seminar on Thermal Sciences, Raleigh, NC, USA, 6–7 April 1978; pp. 256–267. [Google Scholar]
- Yarbrough, D.W.; Kuan, C.N. The Thermal Conductivity of Solid N-Eicosane, N-Octadecane, N-Heptadecane, N-Pentadecane, and N-Tetradecane. In Thermal Conductivity 17; Hust, J.G., Ed.; Springer: Boston, MA, USA, 1983; pp. 265–274. [Google Scholar] [CrossRef]
- Mustafaev, R.A. Thermal conductivity of higher saturated n-hydrocarbons over wide ranges of temperature and pressure. J. Eng. Phys. 1973, 24, 465–469. [Google Scholar] [CrossRef]
- Rastorguev, Y.L.; Bogatov, G.F. Thermal conductivity of n-heptadecane and n-octadecane at high pressures and temperatures. Chem. Technol. Fuels Oils 1972, 8, 176–179. [Google Scholar] [CrossRef]
- Holmen, R.; Lamvik, M.; Meldus, O. Measurements of the Thermal Conductivities of Solid and Liquid Unbranched Alkanes in the C16-to-C19 Range During Phase Transition. Int. J. Thermophys. 2002, 2002, 27–39. [Google Scholar] [CrossRef]
- C-Therm Technologies Ltd. TCi Thermal Conductivity Analyzer. Available online: https://ctherm.com/products/tci_thermal_conductivity/specifications/ (accessed on 18 October 2018).
- EKO Instruments B.V. HC-10 Thermal Conductivity Tester. Available online: https://eko-eu.com/products/material-analysis/thermal-conductivity-testers/hc-10-thermal-conductivity-tester (accessed on 18 October 2018).
- Rastorguev, Y.L.; Grigor’ev, B.A.; Bogatov, G.F. Experimental study of the thermal conductivity of toluene at high pressures. J. Eng. Phys. 1969, 17, 1370–1376. [Google Scholar] [CrossRef]
- Delgado, M.; Lázaro, A.; Biedenbach, M.; Gamisch, S.; Gschwander, S.; Höhlein, S.; König-Haagen, A.; Brüggemann, D. Intercomparative tests on viscosity measurements of phase change materials. Thermochim. Acta 2018, 668, 159–168. [Google Scholar] [CrossRef]
- Hogenboom, D.L.; Webb, W.; Dixon, J.A. Viscosity of Several Liquid Hydrocarbons as a Function of Temperature, Pressure, and Free Volume. J. Chem. Phys. 1967, 46, 2586–2598. [Google Scholar] [CrossRef]
- Ducoulombier, D.; Zhou, H.; Boned, C.; Peyrelasse, J.; Saint-Guirons, H.; Xans, P. Pressure (1-1000 bars) and temperature (20-100.degree.C) dependence of the viscosity of liquid hydrocarbons. J. Phys. Chem. 1986, 90, 1692–1700. [Google Scholar] [CrossRef]
- Verein deutscher Ingenieure. VDI-Wärmeatlas, 11st ed.; Springer: Berlin/Heidelberg, Germany, 2013. [Google Scholar] [CrossRef]
- Cameron, A.C.; Miller, D.L. A Practitioner’s Guide to Cluster-Robust Inference. J. Hum. Resour. 2015, 50, 317–372. [Google Scholar] [CrossRef]
- Hemberger, F.; Brütting, M.; Göbel, A.; Vidi, S.; Ebert, H.P. Determination of thermal diffusivity of different crystal structures of phase change materials by means of the flash method. In Proceedings of the 34th International Thermal Conductivity Conference (ITCC), Wilmington, DE, USA, 17–20 June 2019. [Google Scholar]
- Yaws, C.L. Yaws’ Handbook of Thermodynamic and Physical Properties of Chemical Compounds: Physical, Thermodynamic and Transport Properties for 5.000 Organic Chemical Compounds; [Interactive Table], electronic ed.; Knovel: Norwich, NY, USA, 2004. [Google Scholar]
| Reference | Purity in % | Year | Method | Temperature in K | Uncert. in K | Enthalpy in J/g | Uncert. in % |
|---|---|---|---|---|---|---|---|
| Rossini [6] | n/a | 1952 | NC | = 301.34 | 0.02 | 243.6 | 0.3 |
| Qiu et al. [19] | 99 | 2012 | DSC, 5 K/min | = 298.65 | n/a | 223.1 | n/a |
| = 301.55 | n/a | ||||||
| = 303.65 | n/a | ||||||
| Li et al. [20] | 99 | 2011 | DSC, 10 K/min | = 298.36 | n/a | 235.9 | n/a |
| = 302.97 | n/a | ||||||
| Tang et al. [21] | 97 | 2017 | DSC, 5 K/min | = 301.68 | 0.2 | 239.32 | 5 |
| Bayramoglu [22] | 100 | 2011 | DSC, 10 K/min | = 301.11 | n/a | 239.89 | n/a |
| Jeong et al. [23] | n/a | 2013 | DSC, 5 K/min | = 303.55 | n/a | 247.6 | n/a |
| Zhang et al. [24] | n/a | 2013 | DSC, 5 K/min | = 299.99 | n/a | 207.2 | n/a |
| Sun et al. [25] | n/a | 2013 | DSC, 10 K/min | = 301.04 | n/a | 218.8 | n/a |
| Wang and Lu [26] | 99 | 2013 | DSC, 0.5-1.5 K/min | = 301.55 | n/a | 230.5 | n/a |
| Vélez et al. [27] | 99 | 2015 | DSC, 2 K/min | = 300.22 | 0.095 | 243.68 | 0.04 |
| Ho and Gao [28] | 99.9 | 2009 | DSC, 2 K/min | = 299.65 | n/a | 243.1 | n/a |
| Li et al. [29] | 97 | 2010 | DSC, 5 K/min | = 301.85 | 0.2 | 232.49 | 5 |
| = 303.47 | 0.2 | ||||||
| Döğüşcü et al. [30] | n/a | 2018 | DSC, 3 K/min | = 300.95 | n/a | 226.2 | n/a |
| Qiu et al. [31] | 99 | 2015 | DSC, 5 K/min | = 298.65 | n/a | 227.1 | n/a |
| = 301.55 | n/a | ||||||
| Jeon et al. [32] | n/a | 2012 | DSC, 5 K/min | = 302.06 | n/a | 241.97 | n/a |
| Zhang et al. [33] | 99.9 | 2012 | DSC, 0.2 K/min | = 303.25 | n/a | 220.4 | n/a |
| Shan et al. [34] | 95 | 2009 | DSC, 10 K/min | = 304.15 | n/a | 222 | n/a |
| Chaiyasat et al. [35] | 99.5 | 2012 | DSC, 5 K/min | = 303.15 | n/a | 241.7 | n/a |
| Chung et al. [36] | n/a | 2015 | DSC, 10 K/min | = 301.85 | n/a | 226 | n/a |
| He et al. [37] | 90 | 2014 | DSC, 10 K/min | = 301.89 | n/a | 209.1 | n/a |
| Yu et al. [38] | 98.5 | 2014 | DSC, 10 K/min | = 301.89 | n/a | 209.1 | n/a |
| Zhang et al. [39] | 90 | 2012 | DSC, 10 K/min | = 301.25 | n/a | 212.6 | n/a |
| Babich et al. [40] | n/a | 1992 | DSC, 2 K/min | = 301.6 | n/a | 200 | n/a |
| Zhu et al. [41] | 90 | 2016 | DSC, 10 K/min | = 301.7 | n/a | 204.4 | 6 |
| Wei et al. [42] | 99 | 2014 | DSC, 1 K/min | = 300.95 | 0.2 | 242.24 | 1 |
| Chang et al. [43] | 97 | 1983 | DSC, 5 K/min | = 301.1 | n/a | 233.4 | n/a |
| Kolesnikov and Syunyaev [44] | n/a | 1985 | DSC, 8 and 1 K/min | = 301.00 | n/a | 238.7 | n/a |
| Huang et al. [45] | 99 | 2005 | DSC | = 300.83 | n/a | 232.3 | n/a |
| Djordjevic and Laub [46] | n/a | 1986 | DSC | = 301.6 | n/a | ||
| Fonseca et al. [47] | 99.5 | 2014 | DSC, 0.48 K/min | = 301.46 | 0.1 | 241.02 | 1 |
| Boudouh et al. [48] | 99 | 2016 | DSC, 0.8 K/min | = 300.3 | 0.1 | 256.7 | 0.5 |
| Mondieig et al. [49] | 99 | 2004 | DSC, 2 K/min | = 301.1 | n/a | 236.1 | n/a |
| Robles et al. [50] | 99.4 | 1996 | DSC, 2 K/min | = 301.1 | 0.6 | 235.0 | 7 |
| Wei et al. [51] | 99.5 | 2013 | DSC, 1 K/min | = 300.9 | 0.2 | 242.2 | 1 |
| Schaerer et al. [52] | 99.9 | 1955 | AC | = 301.35 | n/a | 241.3 | n/a |
| Parks et al. [53] | 96 | 1949 | AC | = 301.3 | n/a | 237.8 | n/a |
| Messerly et al. [54] | 99.98 | 1967 | AC | = 301.33 | n/a | 242.5 | n/a |
| Meyer and Meyer [55] | 99.9 | 1983 | AC | = 301.27 | n/a | 236.5 | n/a |
| Ksiazczak [56] | 99.7 | 1989 | NC | = 301.27 | 0.02 | ||
| Carey and Smith [57] | 97 | 1933 | NC | = 300.85 | n/a | ||
| Domańska et al. [58] | n/a | 1999 | NC | = 301.65 | n/a | ||
| Levene et al. [59] | n/a | 1915 | NC | = 301.15 | n/a | ||
| Parks et al. [60] | 95 | 1946 | NC | = 300.85 | n/a | ||
| Krafft [61] | n/a | 1882 | NC | = 301.15 | n/a | ||
| Seyer et al. [62] | n/a | 1944 | NC | = 301.25 | n/a |
| Reference | Purity in % | Year | Method | Uncertainty in % | Observations | |
|---|---|---|---|---|---|---|
| Solid | Liquid | |||||
| Rossini [6] | n/a | 1944 | NC | 2.5 | 0 | 52 |
| Vélez et al. [27] | 99 | 2015 | HM/VE | 1/0.01 | 0 | 10/2 |
| Ho and Gao [28] | 99.9 | 2009 | HM | 0.07 | 0 | 10 |
| Krafft [61] | n/a | 1882 | NC | 2 | 0 | 1 |
| Seyer et al. [62] | n/a | 1944 | DM | 2 | 16 | 8 |
| Dover and Hensley [63] | n/a | 1934 | PM | 0.02 | 0 | 2 |
| van Hook and Silver [64] | 99 | 1942 | DM | 2 | 1 | 1 |
| Cutler et al. [65] | high purity | 1958 | DM | 0.1 | 0 | 5 |
| Nelson et al. [66] | n/a | 1960 | DM | 2 | 1 | 0 |
| Shlosinger and Bentilla [67] | n/a | 1965 | PM | 2.5 (s)/0.26 (l) | 8 | 6 |
| Findenegg [68] | 99 | 1970 | PM | 0.02 | 0 | 6 |
| Espeau and Céolin [69] | n/a | 2006 | PM and DM | 1.5 | 0 | 99 |
| Caudwell et al. [70] | 99 | 2004 | VE | 0.20 | 0 | 7 |
| Graaf et al. [71] | n/a | 1992 | HW | 0.5 | 0 | 10 |
| McKinney [72] | n/a | 1923 | NC | 2 | 0 | 1 |
| Würflinger and Schneider [73] | 99 | 1973 | NC | 2 | 1 | 1 |
| Müller and Lonsdale [74] | n/a | 1948 | NC | 2 | 1 | 0 |
| Dutour et al. [75] | 99 | 2000 | VE | 2 | 0 | 8 |
| Own research (OR) | 97 | 2018 | HW | 0.1 | 3 | 3 |
| Reference | Purity in % | Year | Method | Uncertainty in % | Observations | |
|---|---|---|---|---|---|---|
| Solid | Liquid | |||||
| Vélez et al. [27] | 99 | 2015 | DSC, 5 K/min | 2 | 166 | 198 |
| Huang et al. [45] | 99 | 2005 | DSC, 1 K | 1 | 0 | 25 |
| Djordjevic and Laub [46] | n/a | 1983 | DSC, 5 K/min | 3 | 1 | 1 |
| Fonseca et al. [47] | 99.5 | 2014 | DSC, 0.48 K/min | 1 | 5 | 0 |
| Parks et al. [53] | 96 | 1949 | AC | 0.7 | 21 | 1 |
| Messerly et al. [54] | 99.98 (mol) | 1967 | AC | 0.2 | 77 | 11 |
| Shlosinger and Bentilla [67] | n/a | 1965 | NC | 5 | 0 | 5 |
| Höhne [76] | very pure | 1981 | DSC, 10 K/min | 5 | 0 | 3 |
| Durupt et al. [77] | 99 | 1996 | DSC | 3 | 0 | 9 |
| van Miltenburg [78] | 99.8 | 1999 | AC | 0.2 | 0 | 38 |
| Own research (OR) | 97 | 2018 | DSC, 1 K/min | 3 | 41 | 57 |
| Reference | Purity in % | Year | Method | Uncertainty in % | Observations | |
|---|---|---|---|---|---|---|
| Solid | Liquid | |||||
| Vélez et al. [27] | 99 | 2015 | TW | 2 | 20 | 10 |
| Ho and Gao [28] | 99.9 | 2009 | TA | 5 | 0 | 7 |
| Jeon et al. [32] | n/a | 2012 | TP | 5 | 1 | 0 |
| Yu et al. [38] | 98.5 | 2014 | TP | 5 | 1 | 0 |
| Zhang et al. [39] | 90 | 2012 | TP | 5 | 1 | 0 |
| Irby et al. [80] | n/a | 1988 | TW/IM | 1.5-3 | 15/3 | 13 |
| Harish et al. [81] e | n/a | 2015 | TW | 3 | 2 | 7 |
| Wu et al. [82] | 99 | 2015 | TW | 2 | 3 | 3 |
| Khadiran et al. [83] | n/a | 2015 | TW | 5 | 1 | 1 |
| Águila V et al. [84] | 99 | 2018 | TW | 5 | 0 | 4 |
| Motahar et al. [85] | 99 | 2014 | TP | 1 | 5 | 6 |
| Motahar et al. [86] | 99 | 2016 | TP | 2 | 5 | 6 |
| Sakiadis and Coates [87] | 95 | 1957 | SP | 1 | 0 | 17 |
| Powell et al. [88] | n/a | 1961 | SP | 2 | 6 | 6 |
| Ziebland and Patient [89] | n/a | 1962 | SC | 2 | 0 | 8 |
| Griggs and Yarbrough [90] | 99 | 1978 | SC | 30 | 4 | 0 |
| Yarbrough and Kuan [91] | n/a | 1981 | SC | 10-14 | 5 | 0 |
| Mustafaev [92] | n/a | 1973 | NC | 2 | 0 | 4 |
| Rastorguev and Bogatov [93] | n/a | 1972 | NC | 1.3 | 0 | 4 |
| Holmen et al. [94] | 99 | 2002 | NC | 20 | 1 | 1 |
| Reference | Purity in % | Year | Method | Uncertainty in % | Observations Liquid |
|---|---|---|---|---|---|
| Rossini [6] | n/a | 1952 | NC | 0.7 | 58 |
| Ho and Gao [28] | 99.9 | 2009 | RR | 1 | 11 |
| Dover and Hensley [63] | n/a | 1934 | CV | 1 | 2 |
| Caudwell et al. [70] | 99 | 2004 | VV | 2 | 7 |
| Águila V et al. [84] | 99 | 2018 | RR | 1 | 6 |
| Motahar et al. [85] | 99 | 2014 | RR | 4 | 6 |
| Delgado et al. [98] | 97 | 2018 | TR/RR/RR | 1.38/7.74/2.27 | 103/110 /148 |
| Hogenboom et al. [99] | high purity | 1967 | FV | 5 | 3 |
| Ducoulombier et al. [100] | purum | 1986 | FV | 1 | 4 |
| Property | Solid State | Liquid State | |
|---|---|---|---|
| (261.13 K–301.13 K) | (301.13 K–341.13 K) | ||
| Density in kg/m | |||
| Heat capacity in J/(g K) | |||
| Thermal conductivity in W/(m K) | |||
| Viscosity in mPa s | - | ||
| Melting temperature in K | - | 301.13 | - |
| Melting enthalpy in J/g | - | 236.98 | - |
© 2019 by the authors. Licensee MDPI, Basel, Switzerland. This article is an open access article distributed under the terms and conditions of the Creative Commons Attribution (CC BY) license (http://creativecommons.org/licenses/by/4.0/).
Share and Cite
Faden, M.; Höhlein, S.; Wanner, J.; König-Haagen, A.; Brüggemann, D. Review of Thermophysical Property Data of Octadecane for Phase-Change Studies. Materials 2019, 12, 2974. https://doi.org/10.3390/ma12182974
Faden M, Höhlein S, Wanner J, König-Haagen A, Brüggemann D. Review of Thermophysical Property Data of Octadecane for Phase-Change Studies. Materials. 2019; 12(18):2974. https://doi.org/10.3390/ma12182974
Chicago/Turabian StyleFaden, Moritz, Stephan Höhlein, Joschka Wanner, Andreas König-Haagen, and Dieter Brüggemann. 2019. "Review of Thermophysical Property Data of Octadecane for Phase-Change Studies" Materials 12, no. 18: 2974. https://doi.org/10.3390/ma12182974
APA StyleFaden, M., Höhlein, S., Wanner, J., König-Haagen, A., & Brüggemann, D. (2019). Review of Thermophysical Property Data of Octadecane for Phase-Change Studies. Materials, 12(18), 2974. https://doi.org/10.3390/ma12182974


