Article

Correlations of Equilibrium Properties and Electronic Structure of Pure Metals

1
School of Materials Science and Engineering, Harbin Institute of Technology at Weihai, 2 West Wenhua Road, Weihai 264209, China
2
School of Materials Science and Engineering, Jilin University, 5988 Renmin Street, Changchun 130025, China
*
Author to whom correspondence should be addressed.
Materials 2019, 12(18), 2932; https://doi.org/10.3390/ma12182932
Submission received: 9 August 2019 / Revised: 31 August 2019 / Accepted: 9 September 2019 / Published: 11 September 2019
(This article belongs to the Section Materials Physics)

Abstract

:
First principles calculations were carried out to study the equilibrium properties of metals, including the electrons at bonding critical point; ebcp; cohesive energy; Ecoh; bulk modulus; B; and, atomic volume; V. 44 pure metals, including the s valence (alkali), p valence (groups III to V), and d valence (transition) metals were selected. In the present work, the electronic structure parameter ebcp has been considered to be a bridge connecting with the equilibrium properties of metals, and relationships between ebcp and equilibrium properties (V; Ecoh; and B) are established. It is easy to estimate the equilibrium properties (Ecoh; V, and B) of pure metals through proposed formulas. The relationships that were derived in the present work might provide a method to study the intrinsic mechanisms of the equilibrium properties of alloys and to develop new alloys.

1. Introduction

The design of materials with desirable properties associating with computational simulations has currently become a normal approach. It is well known that the physical properties are controlled by the bonding between atoms, which is strictly determined by the electronic structure of the materials. Although the mechanical properties of materials, such as the elastic modulus, strength, toughness, and ductility are macro-properties, they are all related to the breaking and reforming of interatomic bonds, and therefore determined by the characteristics of electronic structures [1,2,3,4]. The understanding of electronic factors that affect the mechanical properties can boost these search processes. So far, efforts have been made to build a relationship between these atomistic-scale parameters and the macroscopic mechanical behaviors, such as between bulk modulus of metals and their lattice volume [5]. It is very convenient to evaluate the bulk modulus of materials by fitting the energy-strain or stress-strain curve that was obtained via first principles calculations [6,7]. Metal crystals are combined by the attractions of Coulomb forces between the metal cations and electrons. The attractions have no directions, the closer between the metal cations, the stronger of the attractions are. The energy of crystals will be gradually increased with the compression of crystal cell (such as under the hydrostatic pressures). In general, the electrons in metal crystals move freely, and the repulsive force between them can resist the compression of crystals due to the affection of Pauli’s exclusion principle. Therefore, the distributions of electrons in metal are correlated with the bulk modulus of metals.
Many methods were proposed to analyze the distributions of electrons in materials, such as Mulliken population analysis [8], Natural Population Analysis (NPA) [9], and Topology analysis, the Atoms In Molecules theory (AIM), as proposed by Bader et al. [10,11,12,13]. The Mulliken population analysis is a familiar method for analyzing the electrons with an atom, which simply separate the electrons in crystal and help us to estimate the bonding properties of atom in molecule. However, it is arbitrary and strongly dependent on the employed particular basis set. The NPA of electron density is based on the orthonormal natural atomic orbitals [9]. It improves the numerical stability and overcomes the basis set dependence problem of Mulliken population analysis, which is better than the Mulliken method in describing the electron distribution in metals. In AIM [10,11,12,13], molecules are divided into atoms by the gradient of electron density. The gradient of electron density has no flux in the surfaces of atoms. The critical points can be found by calculating the Laplacian value of electron density. The AIM theory has been successfully applied to describe the bonding properties between the atoms in molecule. The critical points are classified by the eigenvalues of the Hessian matrix at the point. The bonding critical point (bcp) is a first-order saddle point in the electron density distribution. The Hessian matrix at a bonding critical point has two negative and one positive eigenvalues, which can be denoted as (3, −1). The bonding strength between atoms can be explained by the charge distributions.
There are some works that have been concentrated in building the relationship between the charge distributions and the bulk properties of materials. Segall et al. established the correlations of overlap population with covalence of bonding and bond strength, and of the effective valence charge with ionicity of bonding by means of Mulliken analysis [14], and found that the bulk modulus increases with the overlap populations [14]. Al-Douri et al. built an empirical model between the bulk modulus and the charge density in semiconductors, where the bulk modulus relates with the area of the cation side of the total valence pseudo-charge density [15]. Miedema et al. introduced an empirical relationship between the bulk modulus (B) of several pure metals and electronic density nWS at the boundary of the Wigner–Seitz cell: nWS = 0.82 × (B/Vm)1/2, where Vm is atomic volume [16]. Cheng et al. calculated the values of nWS of fcc and bcc metals firstly by first principles calculations [17]. They modified the empirical relationship of Miedema et al. to B = (1.487 × 10⁸) Vmn2WS. Although their calculated values of nWS are consistent well with the values of Miedema et al., it is very hard to evaluate the nWS values for complex metals or alloys. Li et al. [18,19] derived a simple empirical model for estimating the bulk modulus of binary intermetallic compounds and alloys from the Miedema’s model. They found that the bulk moduli of binary systems can be predicted (with an average error limit of 11%). However, the average numbers of electrons at the boundary of the Wigner–Seitz cell hardly show the detailed bonding information between atoms, and the simple average of electrons might lose some important information, especially for the crystals with different elements.
Besides applying the first principles calculations, Wills et al. predicted the total energy of transition metal as a function of volume and ionic configuration by extending the nearly-free-electron theory to include the effects of transition-metal d bands, which provides a qualitative prediction of the elastic and bonding properties of transition metals. They found that the total energy can be used to describe the cohesive and elastic properties of metals. However, their methods included many approximations, such as Thomas–Fermi approximation, and only empty-core pseudo-potentials are considered in treating the conduction electrons [20]. Makino et al. found that the bulk modulus of an elemental substance can be empirically related with the effective pseudopotential radius. Although he attempted to consider the effects of sd and sp hybridizations in his work, the empirical parameters are, however, different with the different types of metals. There was not a general and effective way to build clear empirical relationship based on this work [21]. Raju et al. [22] studied the pressure derivative of bulk modulus calculated for the entire block of d-transition metals while using a modified form of the recipe that was proposed by Wills and Harrison [20] to represent the effective interatomic interaction. A global correlation between the pressure derivative of bulk modulus and the bonding or the interstitial electron density was proposed [22]. Goble et al. [23] established empirical equations between the mineral hardness, bulk modulus, the volumetric cohesive energy (Ecoh/V), and the hardness. Singh et al. [24] calculated the elastic constants of nine transition metals and four rare-earths and actinides while using the ion–ion interaction. They found that the contributions of volume to bulk modulus varied between 17.1% and 62.4%, which are quite significant and important in quantitatively describing the Cauchy ratio for the considered metals.
So far, the bonding characteristics are generally based on “atomistic level” but not “electronic level”, since the energy, forces, and stress parameters are usually described based on chemical element types and positions of each atom involved in deformation. The lack of fundamental understanding on their electronic features increases the complexity for search in the large composition parameters to design the advanced alloys with improved mechanical properties, especially for multicomponent alloy systems, such as high entropy alloys and many commercial alloys [25,26].
Although many works have been concentrated on studying the bulk modulus of materials, other equilibrium properties (such as volume, cohesive energy, and structural parameters) have been rarely referred. Furthermore, it is important to build the relationships between the electronic structures and the macro properties of materials. Therefore, in this work, the electronic structures and the correlations with equilibrium properties of metals are studied in detail.

2. Methodology

First-principles total energy calculations were performed for 44 pure metals with bcc, fcc, and hcp structures within the framework of Kohn−Sham density functional theory (DFT) [27,28,29,30] while using the projector augmented wave (PAW) approach [31,32] for the description of ion-electron interaction, as implemented in the Vienna ab initio simulation package (VASP). Electron exchange–correlation was treated within the generalized gradient approximation (GGA) using the PW91 functional [33] according to the reports of Shang et al [5]. A cutoff energy of 450 eV and a Gaussian smearing method with an energy broadening of 0.15 eV were used throughout. Self-consistent field convergence was considered for a total energy difference of less than 10−5 eV between iterations. The conjugate gradient algorithm was used to relax ions and the ionic relaxation was stopped when the forces acting on ions dropped below 0.01 eV/Å. The k-points are carefully checked in the optimization of the lattice structure of pure metals. The optimized structures are well consistent with theoretical calculations [5]. The electronic structures of the optimized structures were recalculated by the full potential linearized augmented plane-wave code WIEN2K [34] under the framework of generalized gradient approximation (PBE-GGA) using the Perdew-Burke-Ernzerhof exchange-correlation potential in order to obtain the values of electrons at the bcp. The self-consistency procedure was performed with 2000 k points in the irreducible part of the Brillouin zone. The criterion for energy convergence is set to be 0.0001 Ry.

3. Results and Discussions

The phase stability of crystals is evaluated by the cohesive energy defined by:
E c o h = N · E a E M N
where N is the number of atoms in the unit cell. EM and Ea denote the energies of crystal and atom, respectively. The energy of metal atom is evaluated by putting it in a 1 × 1 × 1 nm3 cell and the calculated total energy of the cell is regarded as the energy of a metal atom. Table 1 shows the evaluated cohesive energies and the experimental values [35] of studied metals. Furthermore, the atomic volume of metal is chosen to examine the accuracy of the calculations by comparing them with experimental measurements, as shown in Figure 1a. A strictly linear relationship, with a slope closing to unity (1.02), between the theoretical and experimental values is illustrated in this figure. Although most of the calculated values are much closed to the experimental values, there are some discrepancies between theoretical and experimental values. Therefore, both the experimental and theoretical values of volumes, cohesive energies and bulk modulus (from Ref. [5]) were used in this work to improve the precision of our empirical formula.
Besides the above calculations, we also evaluate the numbers of electrons at the bcp, ebcp, of studied metals, which are also listed in Table 1. As mentioned above in AIM theory the ebcp correlates with the bond interaction between atoms in molecule. In general, the ebcp of alkali metals are very small, while the values are much larger in transition metals, which might be related with the difference structures of valence electrons in them. The relationships between the ebcp and micro-properties, such as the cohesive energy, atomic volume of metal, and bulk modulus were further analyzed.
Shang et al. have calculated the equations of state (EOS) of pure elements, and they found that the PAW-GGA could correctly describe the volume and elastic stiffness constants of most pure elements. However, there are large differences (>3%) for the rare earth elements (Ce, Ac, and Eu), and heavy transition metals (Ag, Au, Pb, Pd, and Pt) [5]. It is worth noting that the van der Waals corrections should be considered for these systems in order to obtain accurate calculation results [36].
The ebcp is slightly affected by the calculation details, such as the smearing method, k-mesh, and exchange–correlation functionals. The calculated ebcp of vanadium using PBE-GGA, LSDA, WC-GGA (Wu-Cohen 2006), and PBEsol-GGA (Perdew et al. 2008) are 0.2900, 0.2913, 0.2911, and 0.2914, respectively.
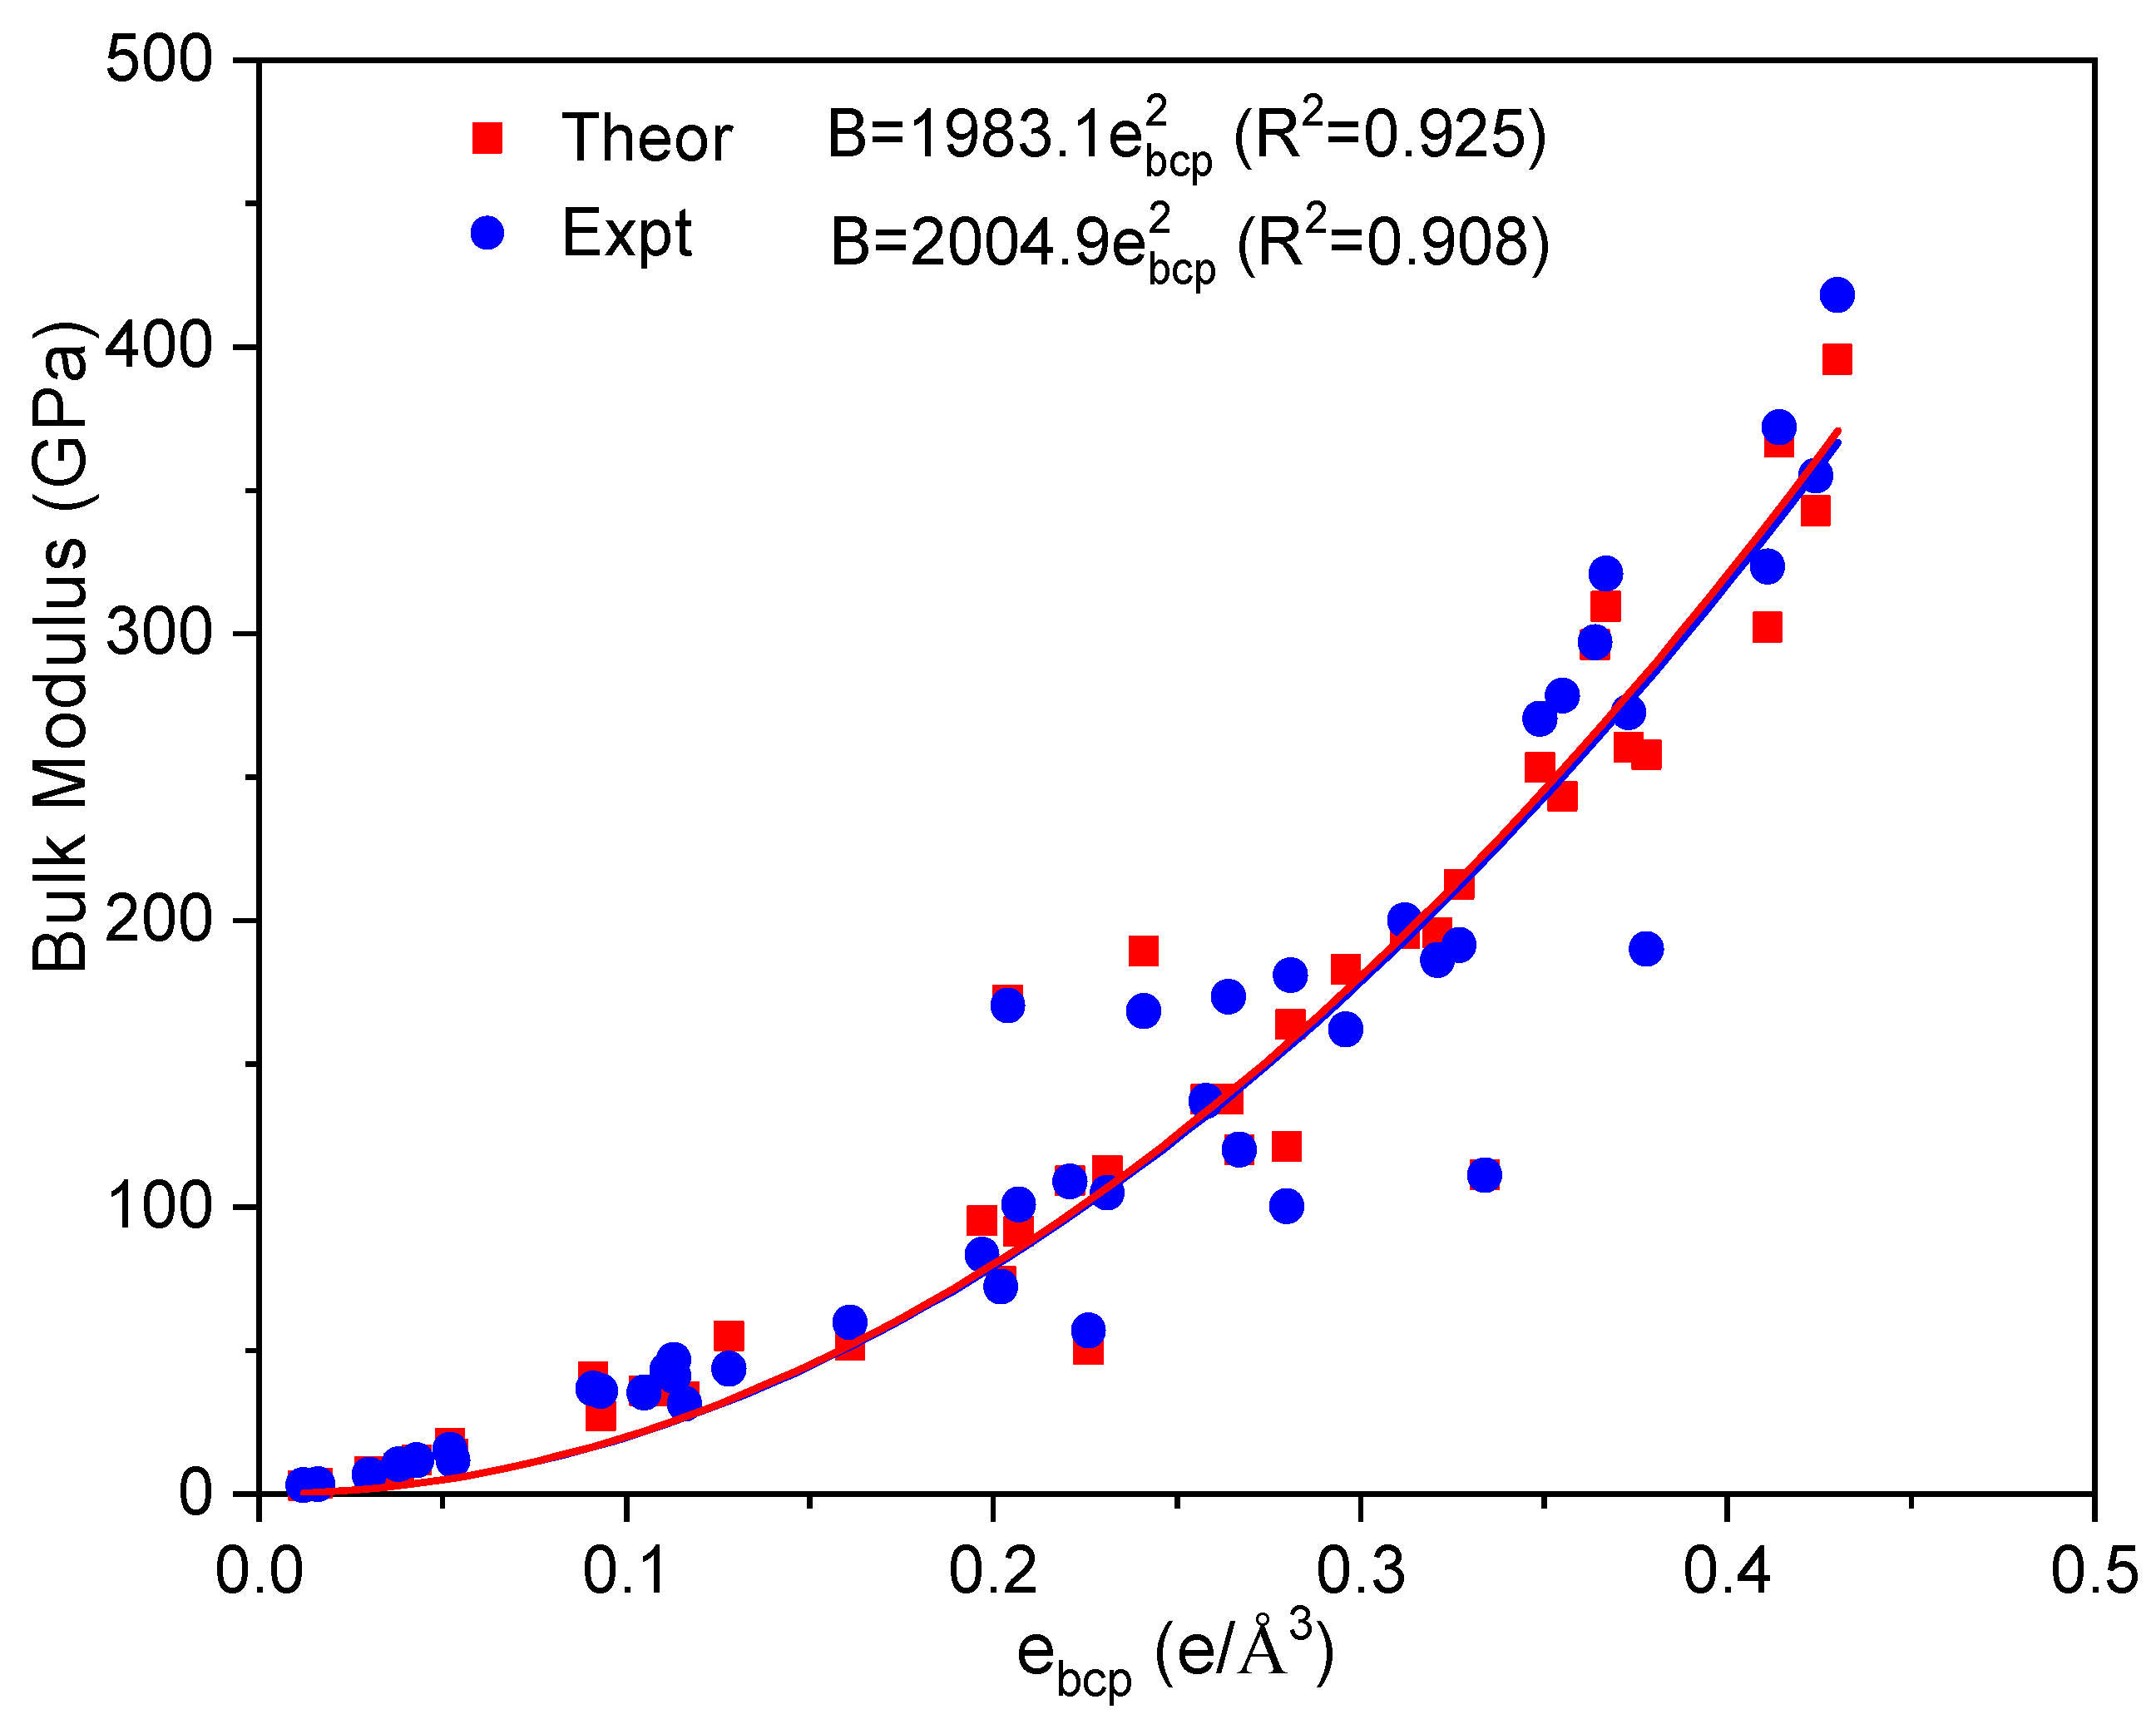
Figure 2 shows the relationship between ebcp and bulk modulus. The black and purple dots are the calculated and experimental values, respectively. By fitting bulk modulus against ebcp with a parabolic function, a relationship between them was obtained, as in Equation (2), with a coefficient, k1, around 2000 (GPa). The fitting curves overlap very well.
B = k 1 e b c p 2
It is worth noting that the experimental bulk modulus is temperature dependent. Theoretically, one of methods to account the temperature effect to improve the calculation accuracy is to consider the zero-point energy and thermal phonon energy. Janthon et al. reported that the temperature effects on the lattice parameter, cohesive energy, and bulk modulus of transition metals are about 0.003−0.022 Å, 0.01−0.06 eV, and 1−17 GPa [37], respectively. We also estimate the difference between the calculated and experimental values of atomic volume and cohesive energy, as shown in Figure 1 and Figure 2. We used the experimental values of the equilibrium parameters in order to obtain more accurate correlations between ebcp and equilibrium properties. However, the resulted fitting parameters are close using calculated and experimental data, as shown in Figure 2. To explore the possible relationship between ebcp and equilibrium properties of metals, we have calculated the electronic parameters and equilibrium properties of 24 binary compounds as shown in Figure S1 and Table S1. There is linear relationship between their bulk modulus and ebcp.
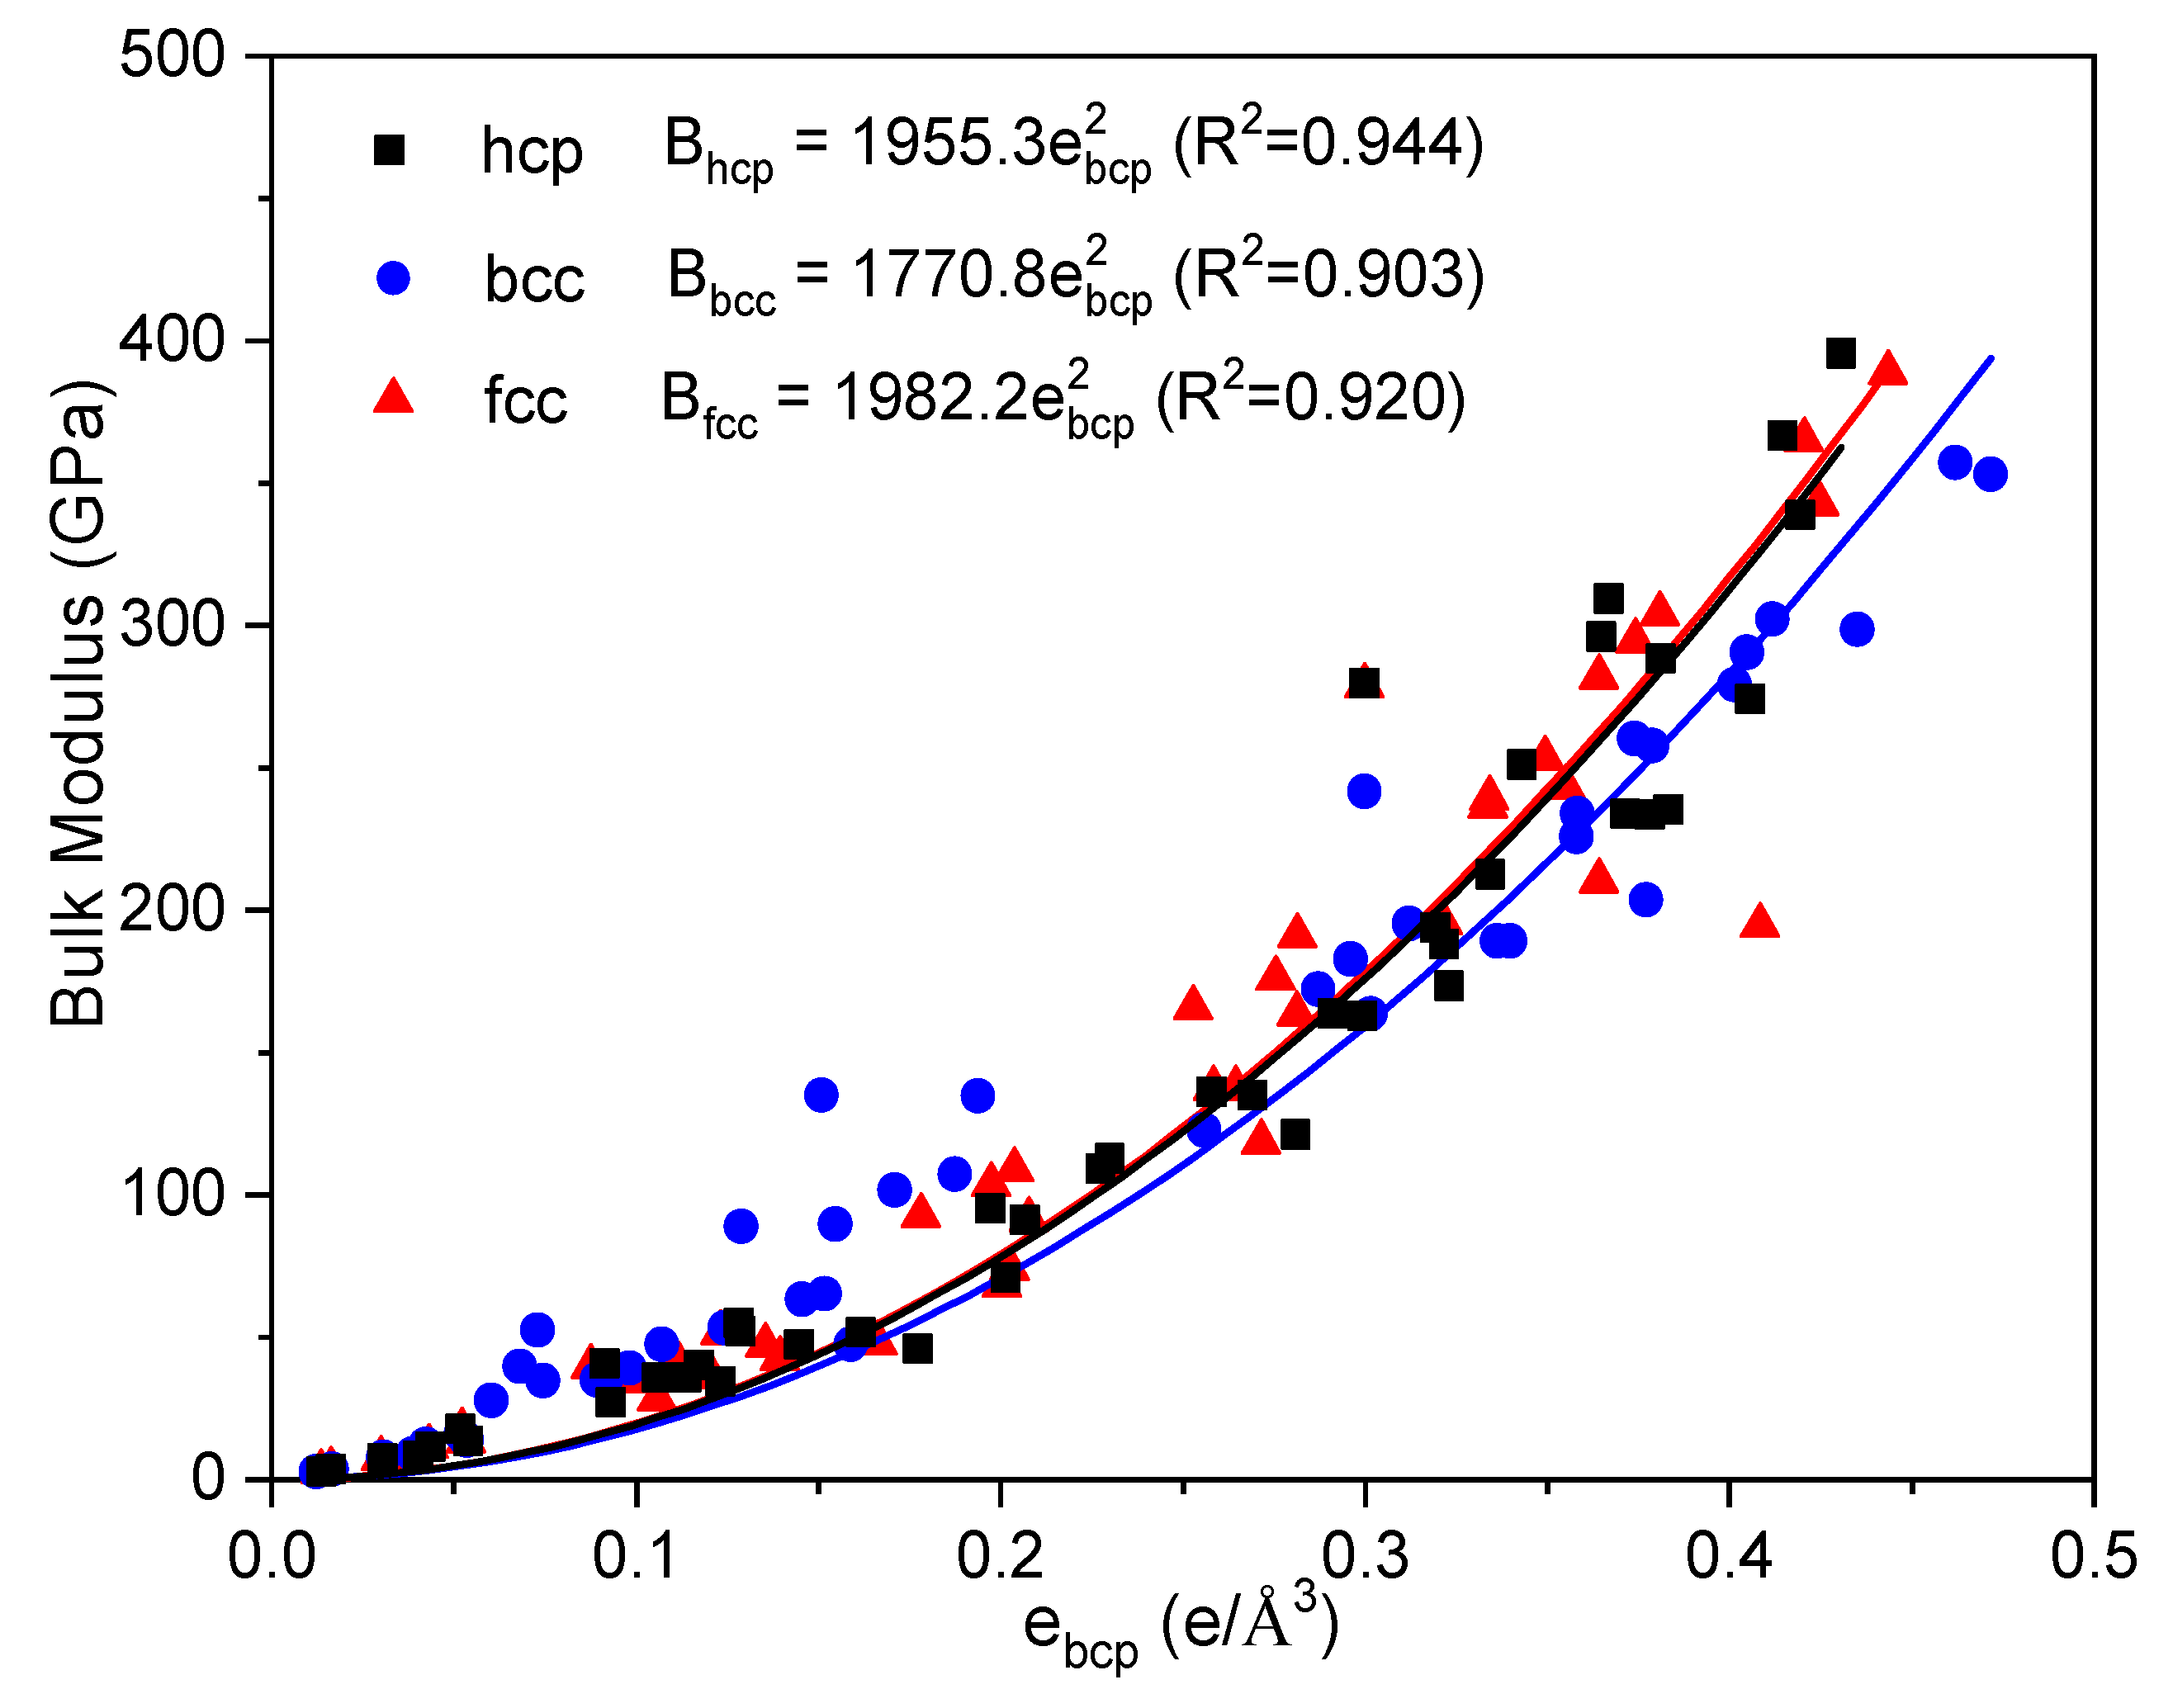
To further clarify the influence of crystal structure, common crystal structures (hcp, bcc, and fcc,) are employed to check and extend the empirical relationship between ebcp and bulk modulus of metals and listed in Table 2. It should point out that, for specific metal, the crystal structure of its ground state is affirmatory; the other two structures are hypothetical at the same equilibrium conditions. As experimental bulk modulus is measured in the ground state of metals, here we used the theoretical values of bulk modulus from Ref. [5]. Figure 3 shows ebcp and bulk modulus of metals in hcp, bcc, and fcc structures. The black, blue, and red dots denote the bulk moduli for the hcp, bcc, and fcc structures, respectively. Generally, the parabolic relationships between ebcp and bulk modulus of metals present in Figure 3. Although the fitting for bcc structure (purple line) is somehow a bit separation than other two structures, the relationship between the numbers of electrons at the bcp and bulk modulus of metals approximately obey the expression of Equation (2) with a mean squared error around 0.92, as shown in Figure 3, building a connection between the macro bulk modulus and micro electron numbers.
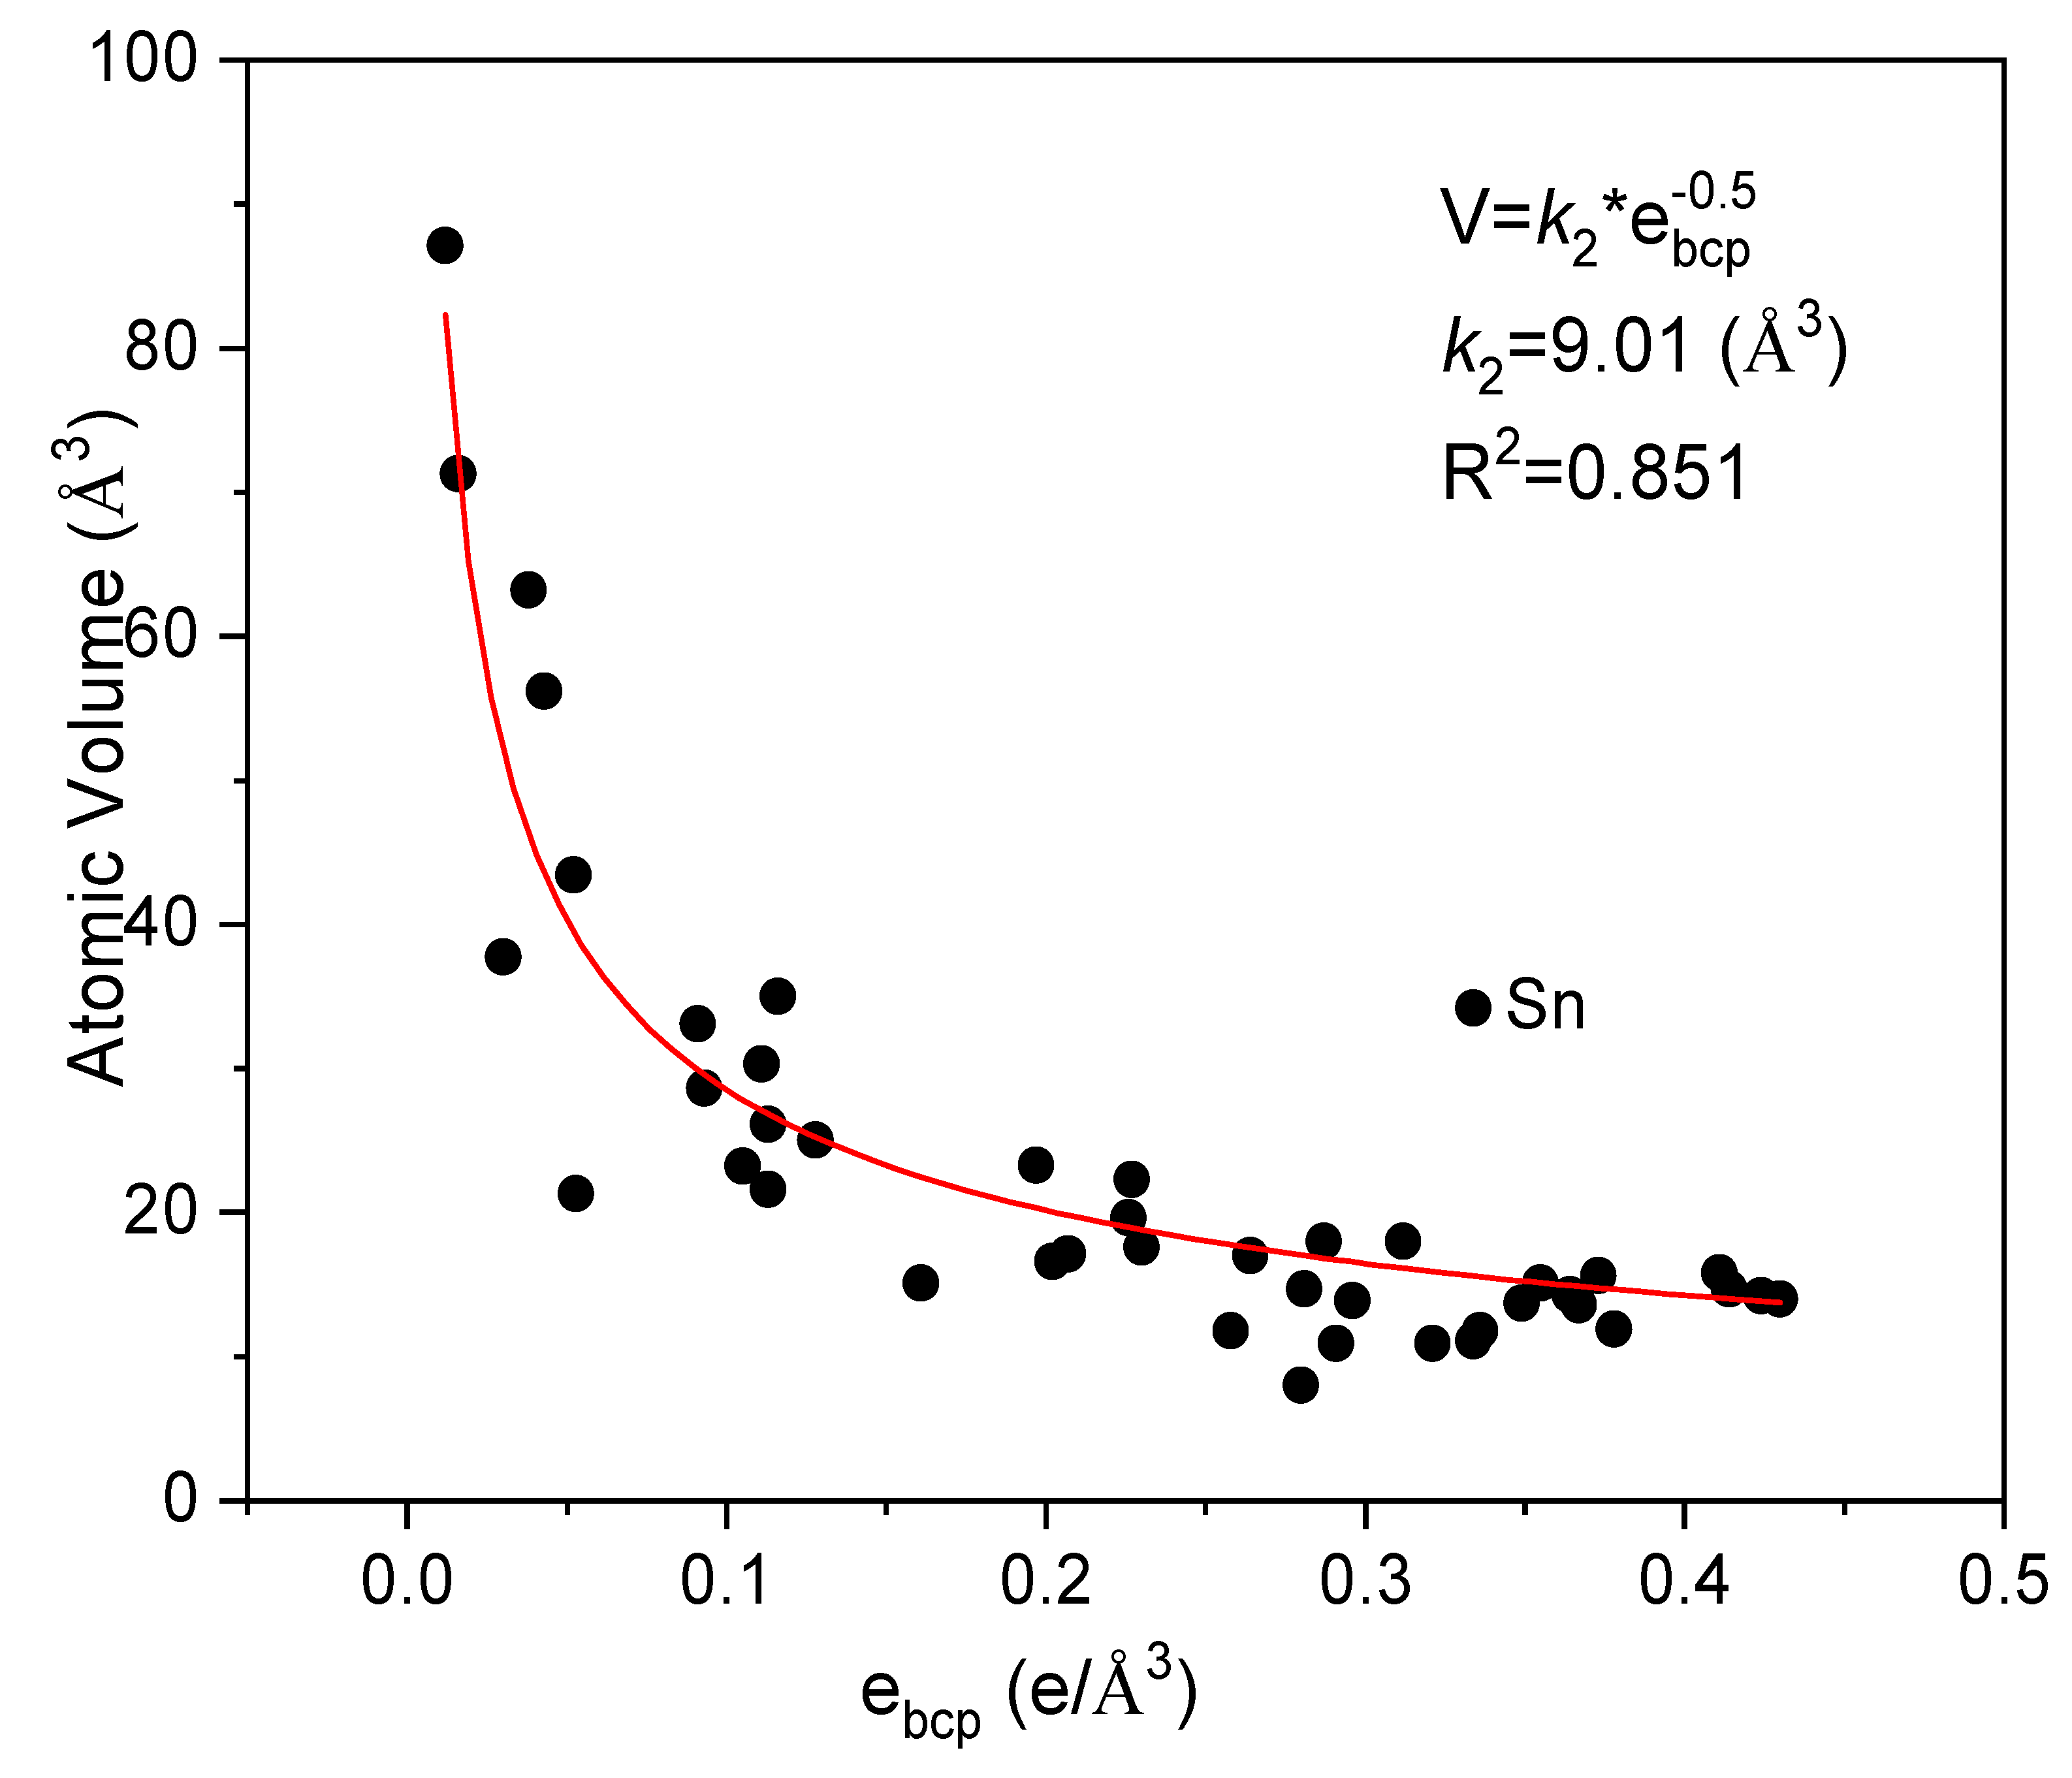
Atomic volume is a characteristic parameter of materials. It has been illustrated that there is a strong correlation between the bulk modulus and atomic volume of pure metals [5]. Here, we further explore the relationship between ebcp and atomic volume of metals. Figure 4 presents the relationship of the experimental values of atomic volume against ebcp. It could be fitted via an equation of
V = k 2 e b c p 1 / 2
where the coefficient k2 equals to 9.01 Å3. It is noted that point of metal Sn does not quite match Equation (3). It may be mainly because metal Sn has a diamond cubic crystal structure with relatively larger atomic volume. This phenomenon also appears in following volume related fittings (Figure 5 and Figure 6).
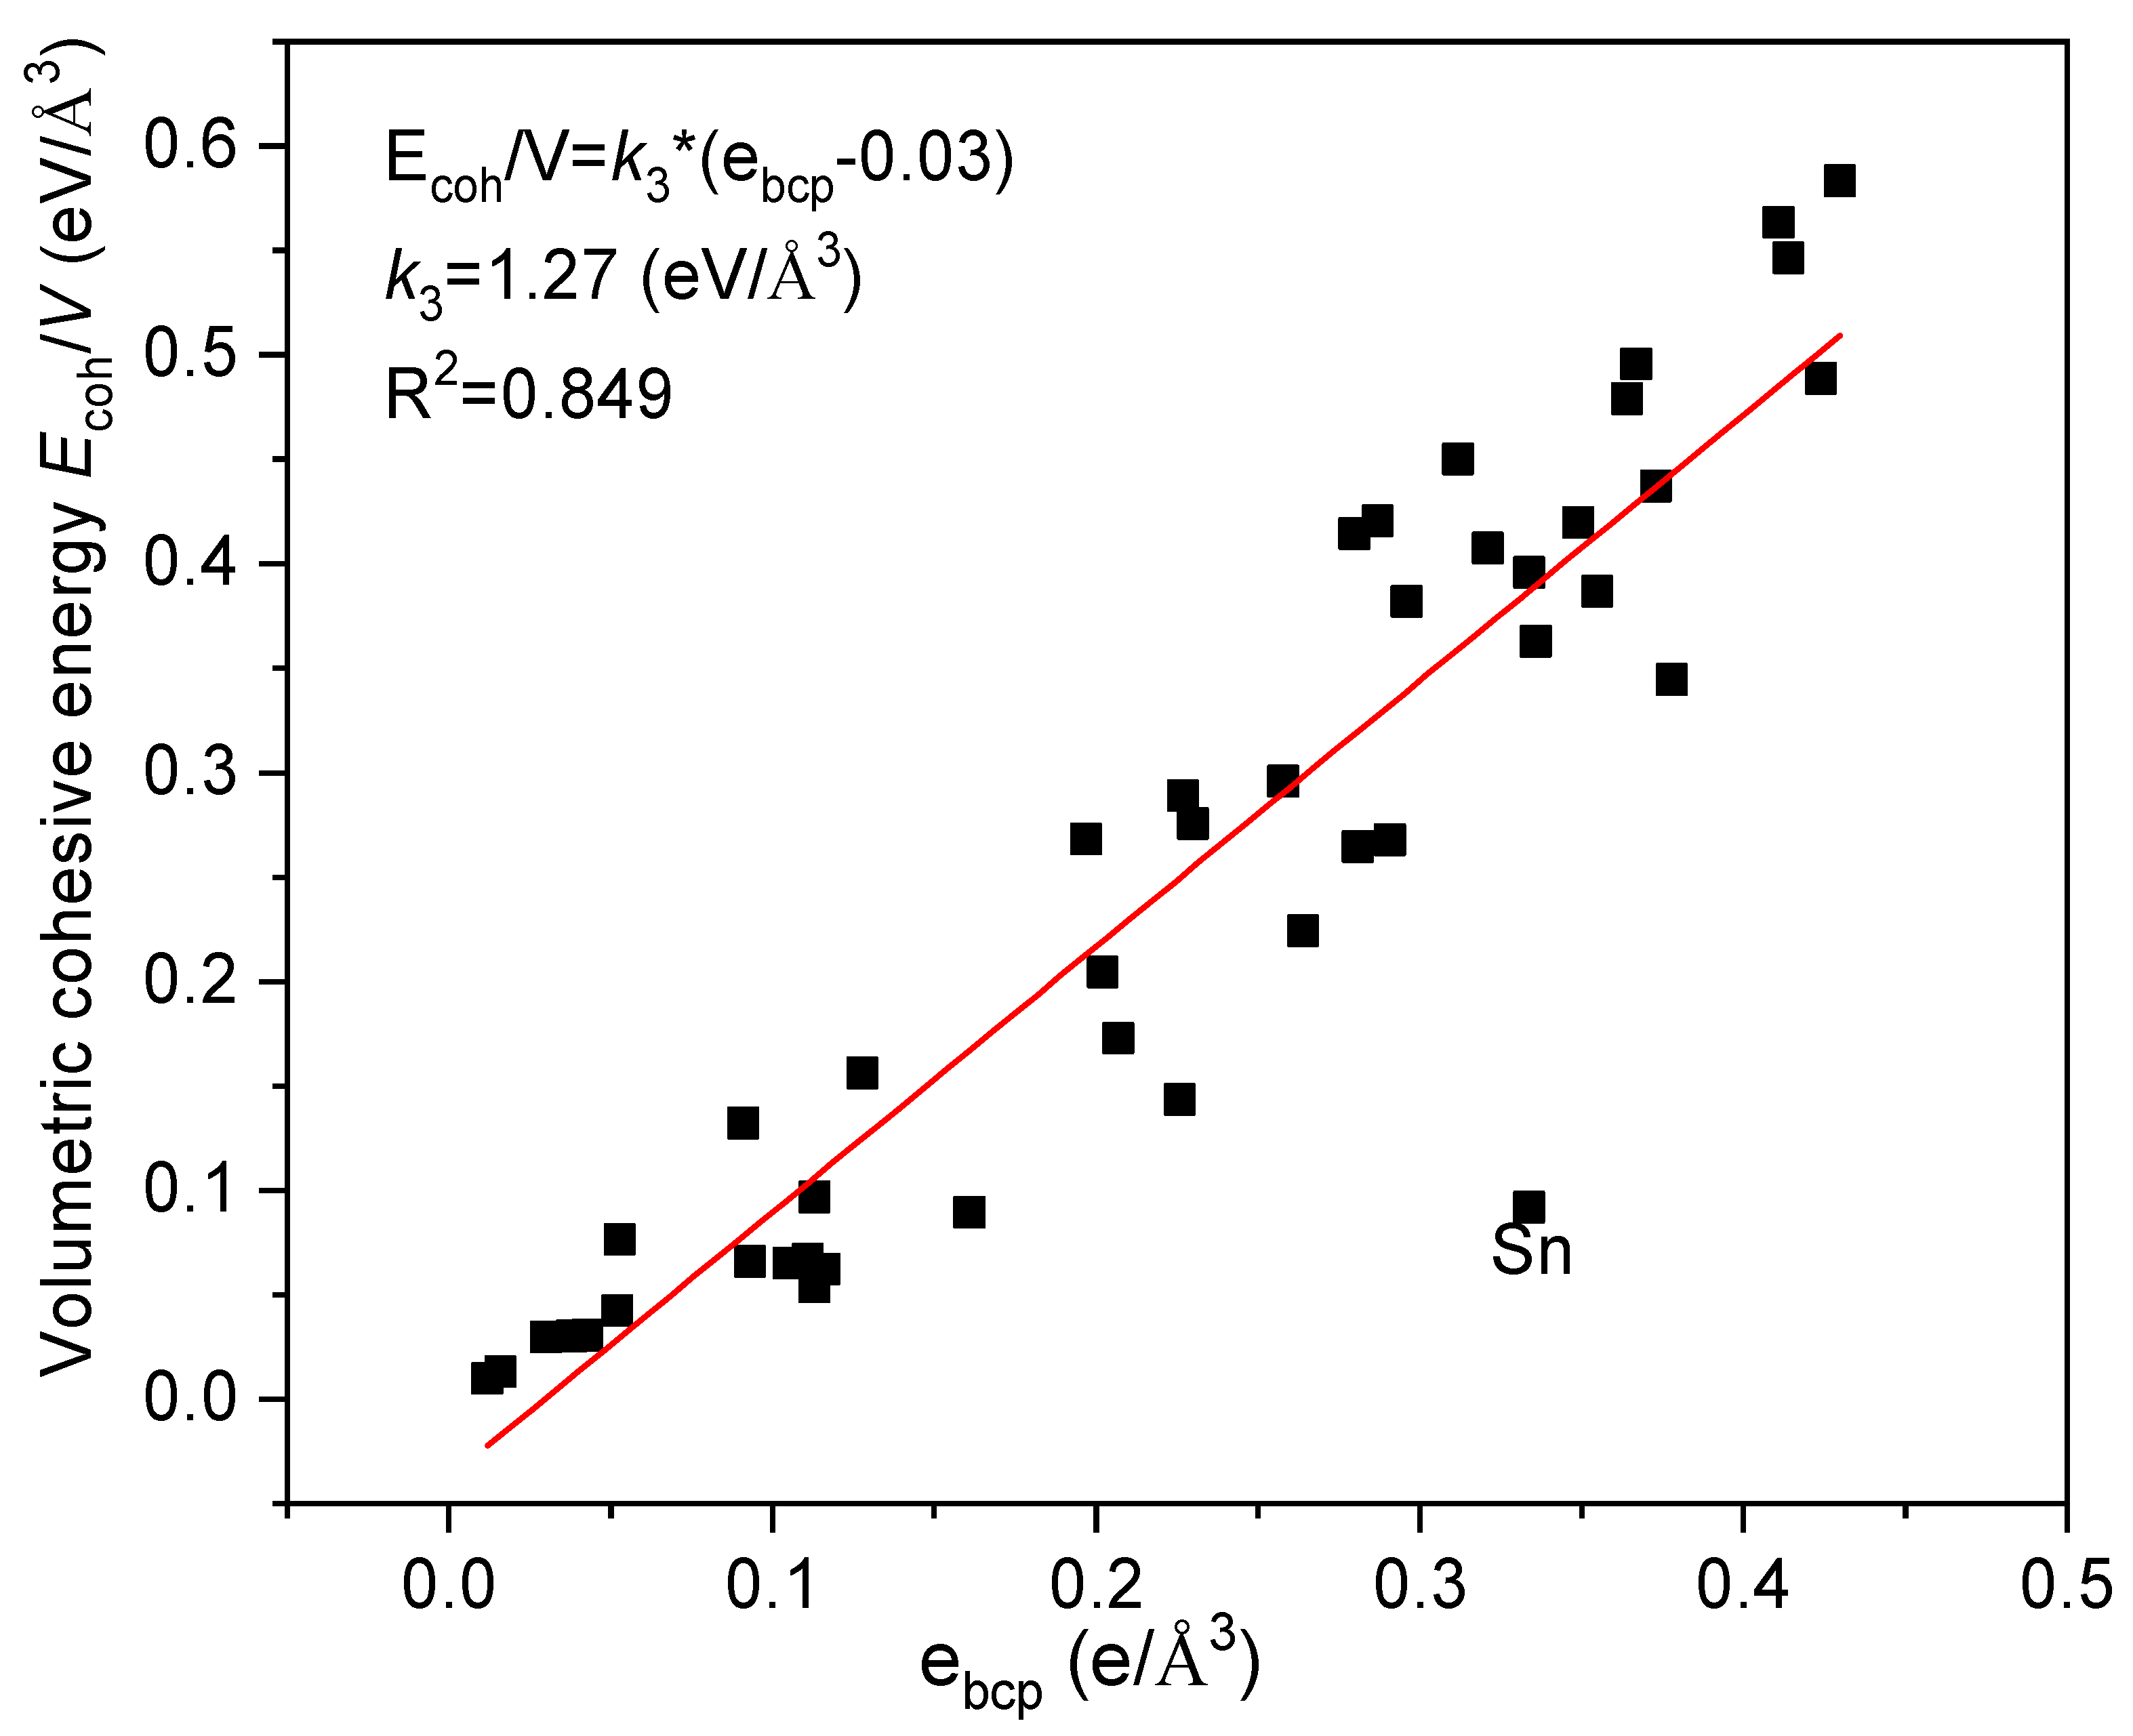
The bulk modulus is the second derivative of cohesive energy to volume. Therefore, many correlations exist among the cohesive energy, Ecoh, volume, V, and bulk modulus, B. However, the relationship between Ecoh and B of metals has not been studied directly. The volumetric cohesive energy Ecoh/V denotes the average cohesive energy of crystal, which has correlations with the bulk modulus and hardness [23]. It is interesting to explore the relationship between Ecoh/V and ebcp for metals due to the ebcp shows strong correlation with bulk modulus (Equation (2)). Figure 5 clearly shows a monotonic characteristic between ebcp and Ecoh/V, which delivers a linear relationship of
E c o h / V = k 3 ( e b c p 0.03 )
where k3 = 1.27 eV/Å3.
As both Ecoh/V and B have correlated with ebcp (Figure 2 and Figure 5), the relationship between the ebcp and the products of Ecoh/V and B might be expected. Figure 6 shows the relationship between B·Ecoh/V and ebcp. The value of B·Ecoh/V fitted well with the value of ebcp, the relationship between them is very clear, which can be described by:
B E c o h V = k 4 e b c p 3
with k4 = 2540 (GPa*eV/Å3).
From above analysis, ebcp communicates the relationships of the equilibrium properties, such as bulk modulus (B), atomic volume (V), and Ecoh/V. Furthermore, if one of above parameters is known, others can be estimated through the bridge of ebcp, as shown in Table 3. The equations that are shown in Table 3 are derived from Equations (2) to (5). It is very convenient to estimate the equilibrium properties of simple metals. Due to the relationships between the volume and the structural parameters are definitely for the simple metals, the structural parameters can be derived from atomic volume. Furthermore, the atomic volume of metal strongly correlates with other parameters, such as ebcp, Ecoh/V, and B. Therefore, the structural parameters of simple metals correlate with the four equilibrium parameters ebcp, Ecoh, V, and B.
Some studies have built relationships between the electronic parameters and equilibrium parameters of metals. Shang et al. fitted a relationship between the bulk modulus and atomic volume B = 20,422V−1.868 [5]. Miedema et al. introduced an empirical relationship of nWS = 0.82 × (B/V)1/2 [16]. Cheng et al. reported a similar relationship [17]. Dolocan et al. derived a correlation of B = −ΔEcoh/V, in which the Au, Cd, Ir, Pb, Pd, Pt, Re, Ru, and Zn have ∆ > 4 and the Ce, Cs, Gd, K, Li, Rb, and Zr have ∆ < 2 [38]. Tal proposed a direct relation between the charge density of a free atom, ρ, and the cohesive energy of the corresponding metal, Ecoh ~ ρ5/3, the bulk moduli of metals are also proportional to ρ5/3, however they do not work well for small values of cohesive energy and bulk modulus [39]. Our derived bulk modulus B is proportional to V−4, (Ecoh/V)2, and ebcp2. They are similar with reported relationships, except the larger weight of volume in our derived relationships.

4. Conclusions

First principles calculations have been taken to study the equilibrium properties of pure metals in this work. The equilibrium properties of metals, such as V and Ecoh, have been estimated based on first principles total energy calculation and an electronic structure parameter, the number of electrons at the bonding critical point, ebcp, was evaluated under AIM theory. In the present work, this parameter acts as the bridge communicating with the equilibrium properties of metals. The relationships between ebcp and equilibrium properties have been obtained through the fitting equilibrium properties against ebcp. Strong correlations have been achieved in these fittings. The bulk modulus obeys a parabolic relationship with ebcp, Ecoh/V linearly follows the variation of ebcp, and V varies via ebcp in the manner of e b c p 0.5 . This work builds a connection between the macro properties of metals and their micro bonding characteristics and provides a new way to estimate the bulk modulus (B) and volumetric cohesive energy (Ecoh/V) of pure metals.

Supplementary Materials

The following are available online at https://www.mdpi.com/1996-1944/12/18/2932/s1, Figure S1: The relationship between bulk modulus and ebcp of binary compounds. Table S1: Values of Ecoh, V, ebcp, and B of alloys in ground state.

Author Contributions

J.D.: Investigation, Visualization, Data curation. D.H.: Investigation, Validation, Methodology. Y.S.: Analysis, Writing—review& editing.

Funding

This research was funded by the National Basic Research Programme of China, grant number 2016YFB0701301, and the National Natural Science Foundation of China, grant number 51675225. And the APC was funded by [the National Basic Research Programme of China].

Acknowledgements

This work was supported by the National Basic Research Programme of China, Grant No. 2016YFB0701301 and the National Natural Science Foundation of China, Grant No. 51675225.

Conflicts of Interest

The authors declare no conflict of interest.

References

  1. Trinkle, D.; Woodward, C.F. The chemistry of deformation: How solutes soften pure metals. Science 2005, 310, 1665–1667. [Google Scholar] [CrossRef] [PubMed]
  2. Leyson, G.P.M.; Curtin, W.A.; Hector, L.G., Jr.; Woodward, C.F. Quantitative prediction of solute strengthening in aluminium alloys. Nat. Mater. 2010, 9, 750–755. [Google Scholar] [CrossRef] [PubMed]
  3. Varvenne, C.; Luque, A.; Curtin, W.A. Theory of strengthening in fcc high entropy alloys. Acta Mater. 2016, 118, 264–276. [Google Scholar] [CrossRef]
  4. Aagesen, L.K.; Adams, J.F.; Allison, J.E.; Andrews, W.B.; Araullo-Peters, V.; Berman, T.; Chen, Z.; Daly, S.; Das, S.; DeWitt, S.; et al. Prisms: An integrated, open-source framework for accelerating predictive structural materials science. JOM 2018, 70, 2298–2314. [Google Scholar] [CrossRef]
  5. Shang, S.L.; Saengdeejing, A.; Mei, Z.G.; Kim, D.E.; Zhang, H.; Ganeshan, S.; Wang, Y.; Liu, Z.K. First-principles calculations of pure elements: Equations of state and elastic stiffness constants. Comput. Mater. Sci. 2010, 48, 813–826. [Google Scholar] [CrossRef]
  6. Rodney, D.; Ventelon, L.; Clouet, E.; Pizzagalli, L.; Willaime, F. Ab initio modeling of dislocation core properties in metals and semiconductors. Acta Mater. 2017, 124, 633–659. [Google Scholar] [CrossRef]
  7. Song, Y.; Yang, R.; Li, D.; Wu, W.T.; Guo, Z.X. Calculation of theoretical strengths and bulk moduli of bcc metals. Phys. Rev. B 1999, 59, 14220. [Google Scholar] [CrossRef]
  8. Mulliken, R.S. Electronic population analysis on LCAO-MO molecular wave functions. I. J. Chem. Phys. 1955, 23, 1833. [Google Scholar] [CrossRef]
  9. Foster, J.P.; Wenhold, F. Natural hybrid orbitals. J. Am. Chem. Soc. 1980, 102, 7211–7218. [Google Scholar] [CrossRef]
  10. Bader, R.F.W.; Essén, H. The characterization of atomic interactions. J. Chem. Phys. 1984, 80, 1943–1984. [Google Scholar] [CrossRef]
  11. Cremer, D.; Kraka, E. A description of the chemical bond in terms of local properties of electron density and energy. Croat. Chem. Soc. 1984, 57, 1259–1281. [Google Scholar]
  12. Feth, S.; Gibbs, G.V.; Boisen, M.B.; Hill, F.C. A study of the bonded interactions in nitride molecules in terms of bond critical point properties and relative electronegatives. Phys. Chem. Miner. 1998, 25, 234–241. [Google Scholar] [CrossRef]
  13. Louit, G.; Hocquet, A.; Ghomi, M.; Meyer, M.; Suehnel, J. An AIM topological analysis of Guanine tetrads interacting with metals. PhysChemComm 2003, 6, 1–5. [Google Scholar] [CrossRef]
  14. Segall, M.D.; Shah, R.; Pickard, C.J.; Payne, M.C. Population analysis of plane-wave electronic structure calculations of bulk materials. Phys. Rev. B 1996, 54, 16317–16320. [Google Scholar] [CrossRef] [PubMed] [Green Version]
  15. Al-Douri, Y.; Abid, H.; Aourag, H. Correlation between the bulk modulus and the charge density in semiconductors. Phys. B 2001, 305, 186–190. [Google Scholar] [CrossRef]
  16. Miedema, A.R.; de Boer, F.R.; de Chatel, P.F. Empirical description of the role of electronegativity in alloy formation. J. Phys. F Met. Phys. 1973, 3, 1558–1576. [Google Scholar] [CrossRef]
  17. Cheng, D.Y.; Wang, S.Q.; Ye, H.Q. Calculations showing a correlation between electronic density and bulk modulus in fcc and bcc metals. Phys. Rev. B 2001, 64, 024107. [Google Scholar] [CrossRef]
  18. Li, C.H.; Wu, P. Correlation of Bulk Modulus and the Constituent Element Properties of Binary Intermetallic Compounds. Chem. Mater. 2001, 13, 4642–4648. [Google Scholar] [CrossRef]
  19. Li, C.H.; Chin, Y.L.; Wu, P. Correlation between bulk modulus of ternary intermetallic compounds and atomic properties of their constituent elements. Intermetallics 2004, 12, 103–109. [Google Scholar] [CrossRef]
  20. Wills, J.M.; Harrison, W.A. Interionic interactions in transition metals. Phys. Rev. B 1983, 28, 4363. [Google Scholar] [CrossRef]
  21. Makino, Y. Empirical determination of bulk moduli of elemental substances by pseudopotential radius. J. Alloys Compd. 1996, 242, 122–128. [Google Scholar] [CrossRef]
  22. Raju, S.; Mohandas, E.; Raghunathan, V.S. The pressure derivative of bulk modulus of transition metals: An estimation using the method of model potentials and a study of the systematics. J. Phys. Chem. Solids 1997, 58, 1367–1373. [Google Scholar] [CrossRef]
  23. Goble, R.J.; Scott, S.D. The relationship between mineral hardness and compressibility (or bulk modulus). Can. Mineral. 1985, 23, 273–285. [Google Scholar]
  24. Singh, N.; Yadav, B.S. The elastic moduli, the volume contribution and the Cauchy ratio ford andf shell metals. Pramana-J. Phys. 1994, 42, 387–394. [Google Scholar] [CrossRef]
  25. Miracle, D.B.; Senkov, O.N. A critical review of high entropy alloys and related concepts. Acta Mater. 2017, 122, 448–511. [Google Scholar] [CrossRef] [Green Version]
  26. Tanaka, I.; Rajan, K.; Wolverton, C. Data-centric science for materials innovation. MRS Bull. 2018, 43, 659–663. [Google Scholar] [CrossRef] [Green Version]
  27. Kresse, G.; Hafner, J. Ab initio molecular dynamics for liquid metals. Phys. Rev. B 1993, 47, 558–561. [Google Scholar] [CrossRef] [PubMed]
  28. Kresse, G.; Furthmüller, J. Efficient iterative schemes for ab initio total-energy calculations using a plane-wave basis set. Phys. Rev. B 1996, 54, 11169–11186. [Google Scholar] [CrossRef]
  29. Perdew, J.P.; Chevary, J.A.; Vosko, S.H.; Jackson, K.A.; Pederson, M.R.; Singh, D.J.; Fiolhais, C. Atoms, molecules, solids, and surfaces: Applications of the generalized gradient approximation for exchange and correlation. Phys. Rev. B 1992, 46, 6671–6687. [Google Scholar] [CrossRef]
  30. Kresse, G.; Furthmüller, J. Efficiency of ab-initio total energy calculations for metals and semiconductors using a plane-wave basis set. Comput. Mater. Sci. 1996, 6, 15–50. [Google Scholar] [CrossRef]
  31. Kresse, G.; Joubert, D. From ultrasoft pseudopotentials to the projector augmented-wave method. Phys. Rev. B 1999, 59, 1758–1775. [Google Scholar] [CrossRef]
  32. Blöchl, P.E. Projector augmented-wave method. Phys. Rev. B 1994, 50, 17953. [Google Scholar] [CrossRef] [PubMed]
  33. Perdew, J.P.; Wang, Y. Accurate and simple analytic representation of the electron-gas correlation energy. Phys. Rev. B 1992, 45, 13244–13249. [Google Scholar] [CrossRef] [PubMed]
  34. Blaha, P.; Schwarz, K.; Luitz, J. Computer Code WIEN2K; Vienna University of Technology: Vienna, Austria, 2000. [Google Scholar]
  35. Kittel, C. Introduction to Solid State Physics; John Wiley & Sons Inc.: New York, NY, USA, 2005. [Google Scholar]
  36. Ambrosetti, A.; Silvestrelli, P.L. Cohesive properties of noble metals by van der Waals–corrected density functional theory: Au, Ag, and Cu as case studies. Phys. Rev. B 2016, 94, 045124. [Google Scholar] [CrossRef]
  37. Janthon, P.; Luo, S.J.; Kozlov, S.M.; Viñes, F.; Limtrakul, J.; Truhlar, D.G.; Illas, F. Bulk properties of transition metals: A challenge for the design of universal density functionals. J. Chem. Theory Comput. 2014, 10, 3832–3839. [Google Scholar] [CrossRef]
  38. Dolocan, V.; Dolocan, A.; Dolocan, V.O. Relation of inter-atomic forces in solids to bulk modulus, cohesive energy and thermal expansion. Mod. Phys. Lett. B 2008, 22, 2481–2492. [Google Scholar] [CrossRef]
  39. Tal, Y. Cohesive properties of metals as determined from atomic charge densities. Can. J. Chem. 1996, 74, 870–874. [Google Scholar] [CrossRef]
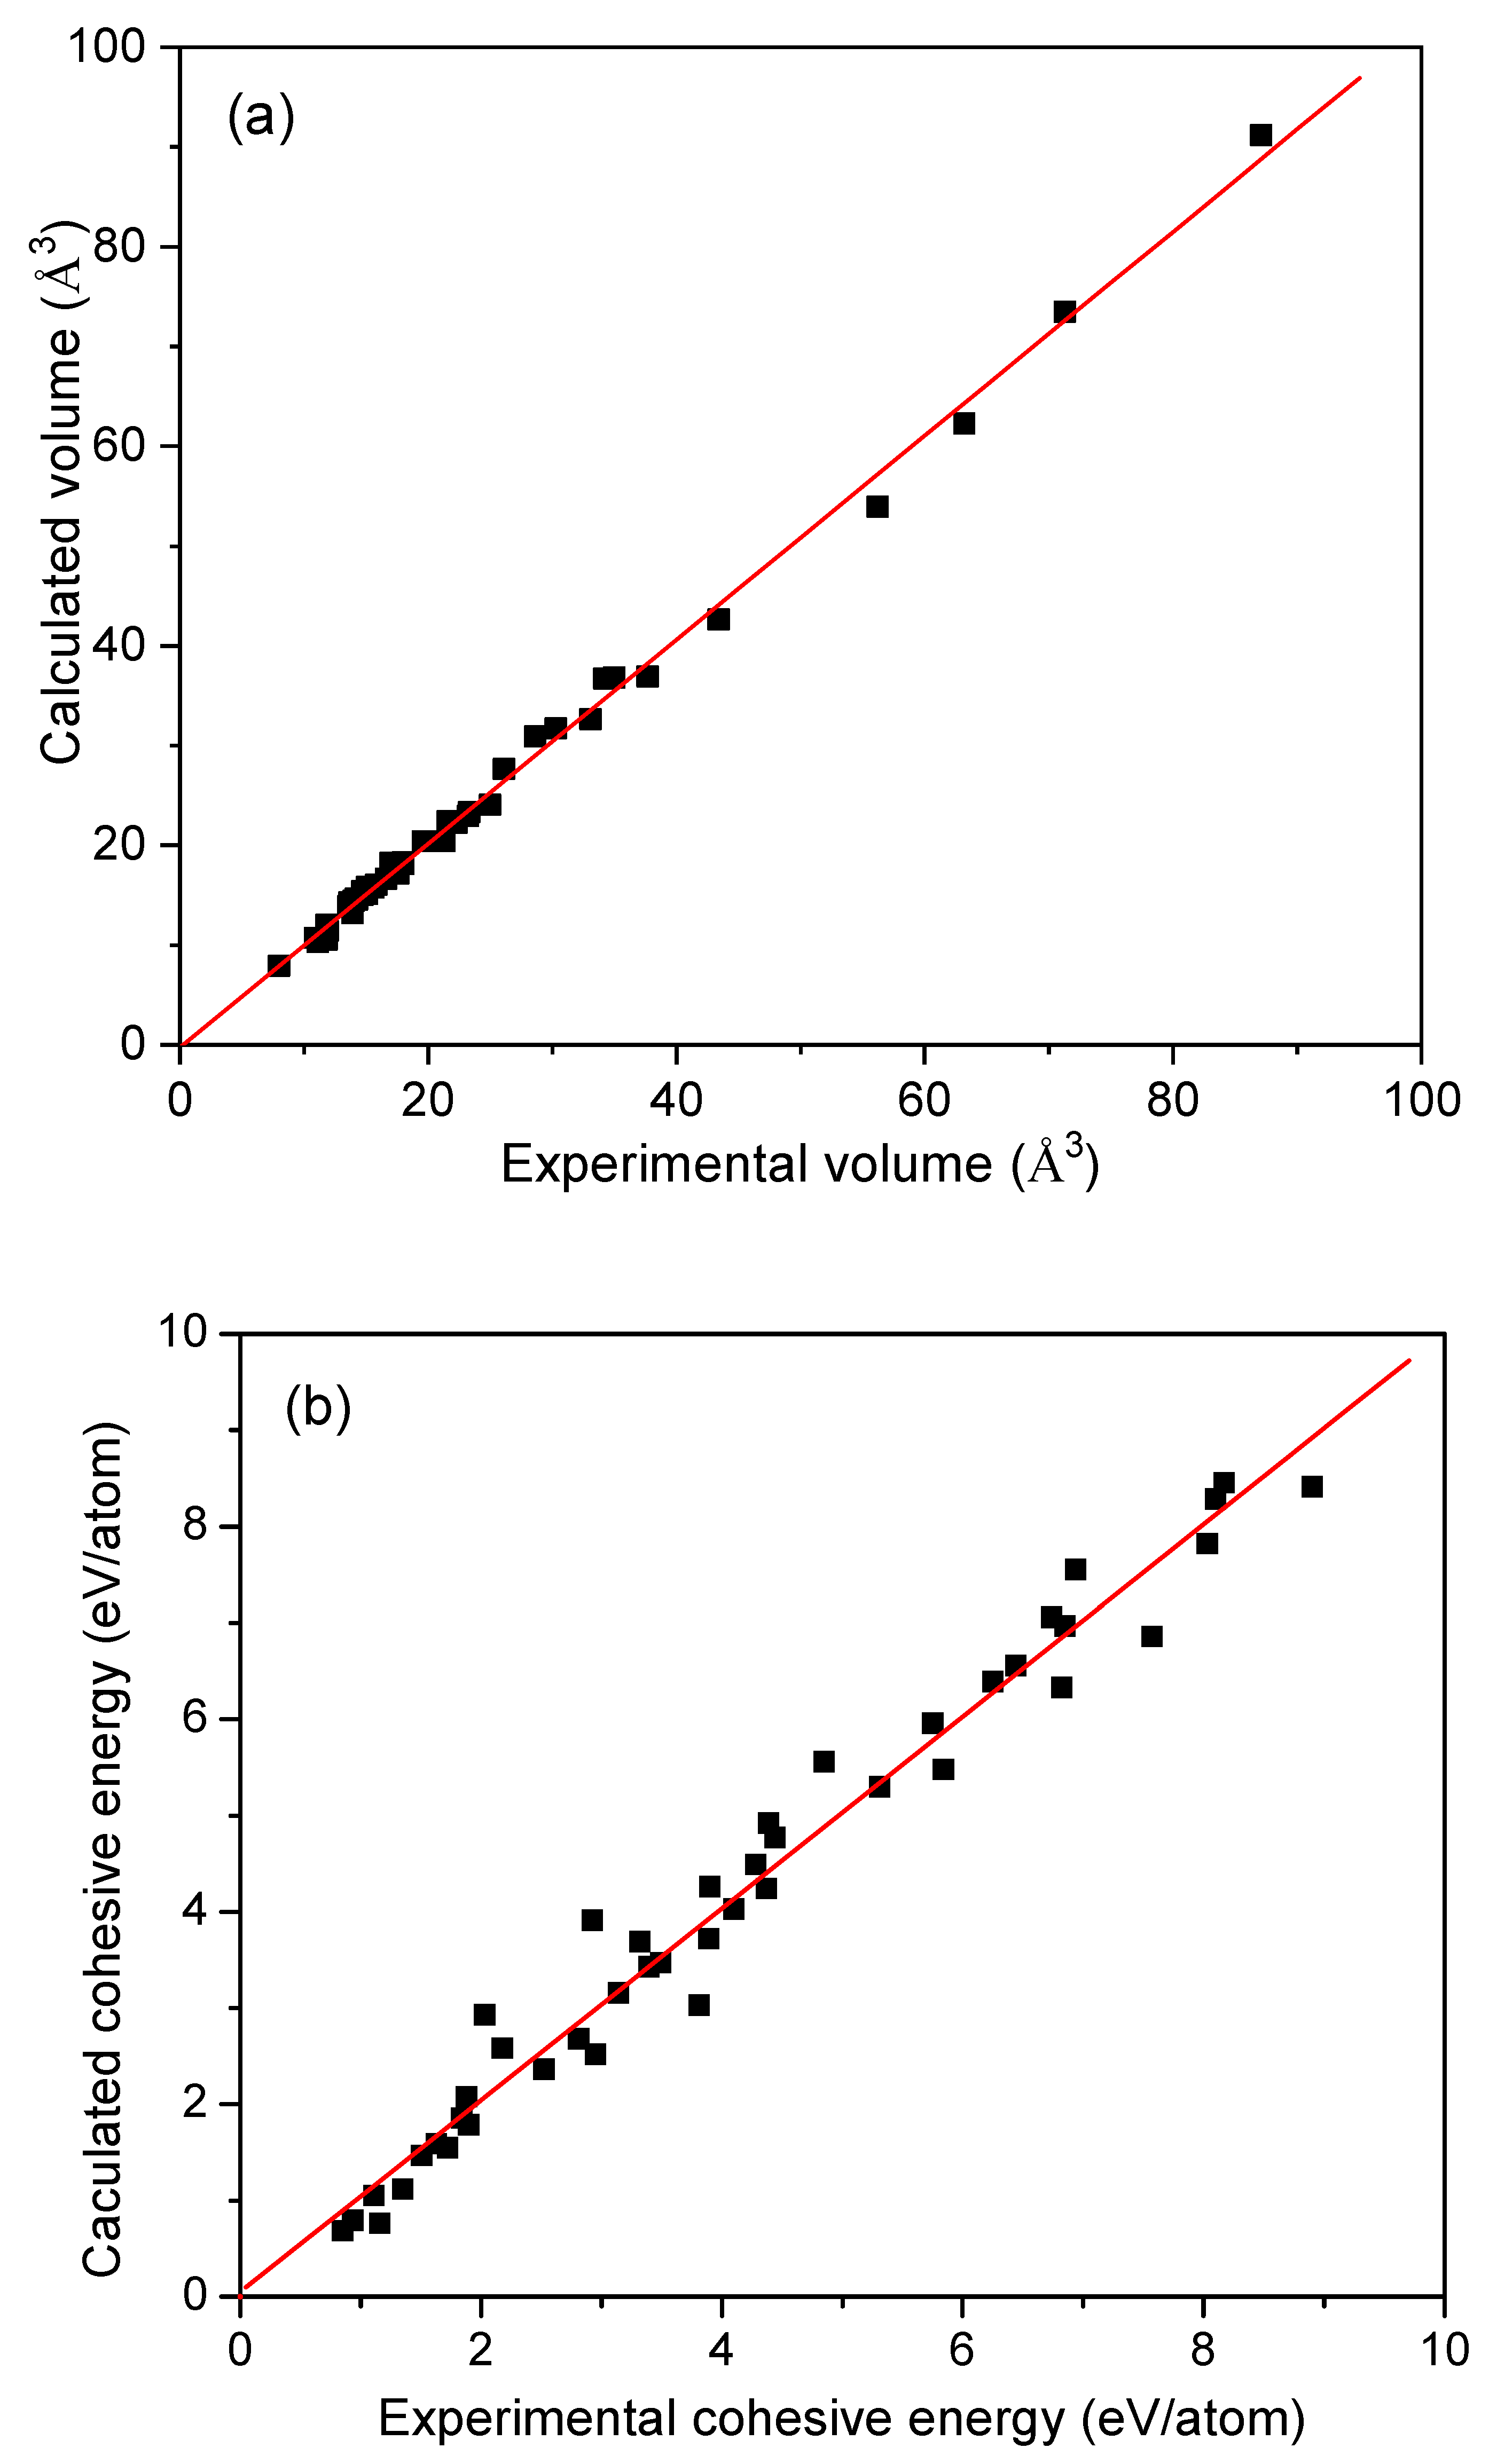
Figure 1. The relationships between calculated values and experimental values of (a) atomic volume of metal and (b) cohesive energy Ecoh.
Materials 12 02932 g001
Figure 2. The relationship between ebcp and the bulk modulus of metals in ground state.
Materials 12 02932 g002
Figure 3. The relationship between the bulk modulus and ebcp of metals with hcp, bcc, and fcc structures.
Materials 12 02932 g003
Figure 4. The relationship between atomic volume of metal and ebcp.
Materials 12 02932 g004
Figure 5. The relationship between the volumetric cohesive energy and ebcp.
Materials 12 02932 g005
Figure 6. The relationship between the B·Ecoh/V and ebcp.
Materials 12 02932 g006
Table 1. Values of valence electrons Z, Ecoh, V, ebcp, and B of pure metals in ground state.
MetalsZEcoh (eV/atom)V3/atom)ebcp (e/Å3)B (GPa)
PresentExp **PresentShang *Exp **PresentShang *Exp **
Lib31.591.6320.420.321.30.05313.911.6
Nab91.051.11336.937.137.70.0307.96.8
Kb90.7950.93473.573.771.30.0163.53.2
Rbb90.6820.85291.290.887.10.0122.73.1
Beh23.693.327.97.98.010.280121.1100.3
Mgh101.471.5122.922.923.20.10535.735.4
Caf101.861.8442.641.843.40.05217.415.2
Srf101.551.7253.953.956.20.04311.811.6
Bab101.791.9062.362.563.20.0389.010.3
Sch114.263.9024.024.525.00.12854.943.5
Tih125.564.8517.117.317.60.230112.8105.1
Vb135.305.3113.213.513.90.290182.9161.9
Crb144.034.1011.411.611.90.378257.7190.1
Mnc133.912.9210.7--10.90.291120.0120.0
Feb144.494.2810.511.411.80.336189.3168.3
Coh154.924.3910.310.911.10.334212.5191.4
Nif164.774.4410.710.910.90.321195.6186.0
Cuf173.473.4912.012.011.80.258137.5137.0
Znh121.121.3515.115.415.10.16151.859.8
Yh114.244.3732.632.733.10.09140.836.6
Zrh126.396.2523.323.423.30.19795.383.3
Nbb136.867.5718.318.318.00.287172.3170.2
Mob146.336.8215.716.015.60.373260.4272.5
Tch156.976.8514.514.614.30.364296.1297.0
Ruh167.066.7413.913.913.60.367309.4320.8
Rhf155.965.7514.214.213.70.349253.4270.4
Pdf163.723.8915.415.514.70.281163.7180.8
Agf172.522.9517.918.017.10.20791.3100.7
Cdh180.7641.1622.423.021.60.11335.846.7
Hfh266.566.4422.222.422.30.227109.1109.0
Tab278.288.1018.118.318.00.312195.3200.0
Wb268.418.9016.016.215.80.411302.2323.2
Reh277.828.0315.015.014.70.414366.8372.0
Osh288.458.1714.414.414.00.430395.5418.0
Irf297.556.9414.614.614.20.424342.8355.0
Ptf305.485.8415.815.815.10.355243.4278.3
Auf173.033.8118.218.217.00.264137.6173.2
Alf93.433.3916.616.616.60.20274.372.2
Gac132.682.8120.4--19.60.22650.356.9
Inc132.362.5227.6--26.10.11337.441.1
Tlh132.081.8830.931.328.60.09327.235.9
Snc143.163.1436.7--34.20.334111.0111.0
Pbf142.932.0331.731.930.30.11140.643.0
Bic152.582.1836.8--35.00.11634.031.5
* Ref. [5]; ** Ref. [35]; The superscripts, b, f, h, and c stand for the bcc, fcc, hcp, and cubic structures, respectively.
Table 2. Calculated ebcp and theoretical bulk modulus of pure metals with hcp, bcc, and fcc structures.
Metal.ebcp (e/Å3)B * (GPa)
hcpbccfcchcpbccfcc
Li0.05390.05350.053413.513.913.5
Na0.03040.03060.03017.67.97.5
K0.01630.01650.01633.53.53.5
Rb0.01380.01220.01362.72.72.7
Be0.28090.25580.2714121.1122.9118.5
Mg0.10590.08920.097935.734.934.7
Ca0.05180.05200.052317.716.017.4
Sr0.04350.04240.043111.412.211.8
Ba0.04010.03880.03908.49.08.3
Sc0.12820.12440.123254.953.251.8
Ti0.23000.18740.2037112.8107.3109.0
V0.32320.29000.2755173.2182.9176.0
Cr0.37820.37880.3337233.5257.7236.7
Mn0.29980.29980.2998279.7241.8278.9
Fe0.38100.33620.4084288.3189.3194.6
Co0.33430.37700.3641212.5203.6210.2
Ni0.31940.33990.3214193.8189.1195.6
Cu0.25800.19390.2584136.1134.6137.5
Zn0.16160.14560.200451.863.368.4
Y0.09150.09810.087640.839.339.7
Zr0.19720.15460.178195.389.792.9
Nb0.29920.28710.2529162.8172.3165.7
Mo0.37130.37380.3342233.8260.4239.4
Tc0.36480.40480.3740296.1290.6294.7
Ru0.36700.40150.3809309.4279.1304.2
Rh0.34310.35810.3493251.1225.9253.4
Pd0.29120.30160.2813163.6163.5163.7
Ag0.20670.12890.207891.188.991.3
Cd0.11390.09200.139535.835.842.6
Hf0.22740.17090.1974109.1101.8103.6
Ta0.32160.31220.2815188.0195.3191.2
W0.40570.41180.3641274.3302.2281.9
Re0.41460.46190.4205366.8357.2365.2
Os0.43050.47170.4435395.5353.0388.8
Ir0.41930.43510.4247339.0298.6342.8
Pt0.38320.35830.3550235.2233.8243.4
Au0.26910.15080.2646135.0134.9137.6
Al0.20140.15180.202470.865.274.3
Ga0.17730.10700.166445.947.448.0
In0.12310.07450.120634.434.736.2
Tl0.09310.06030.105727.227.928.4
Sn0.14480.15900.135547.647.547.2
Pb0.11730.06820.111840.239.840.6
Bi0.12860.07300.126952.052.651.9
* Ref. [5].
Table 3. Empirical relationships between ebcp (e/Å3), atomic volume of metal, V3), bulk modulus, B (GPa), and volumetric cohesive energy, Ecoh/V (eV/Å3).
ebcpVBEcoh/V
ebcp--(k2/V)2B0.5/k1Ecoh/(Vk3) + 0.03
V k 2 e b c p 0.5 -- k 2 k 1 0.25 B 0.25 k 2 ( E c o h k 3 V + 0.03 ) 0.5
B k 1 e b c p 2 k 1 k 2 4 V 4 -- k 1 ( E c o h k 3 V + 0.03 ) 2
Ecoh/Vk3(ebcp − 0.03) k 3 ( k 2 2 V 2 0.03 ) k 3 ( k 1 0.5 B 0.5 0.03 ) --
k1 = 2005 GPa obtained by fitting experimental bulk modulus; k2 = 9.01 Å3; k3 = 1.27 eV/Å3.