Effect of Freeze-Thaw Cycles on Triaxial Strength Property Damage to Cement Improved Aeolian Sand (CIAS)


Abstract
:1. Introduction
2. Test Program
2.1. Materials
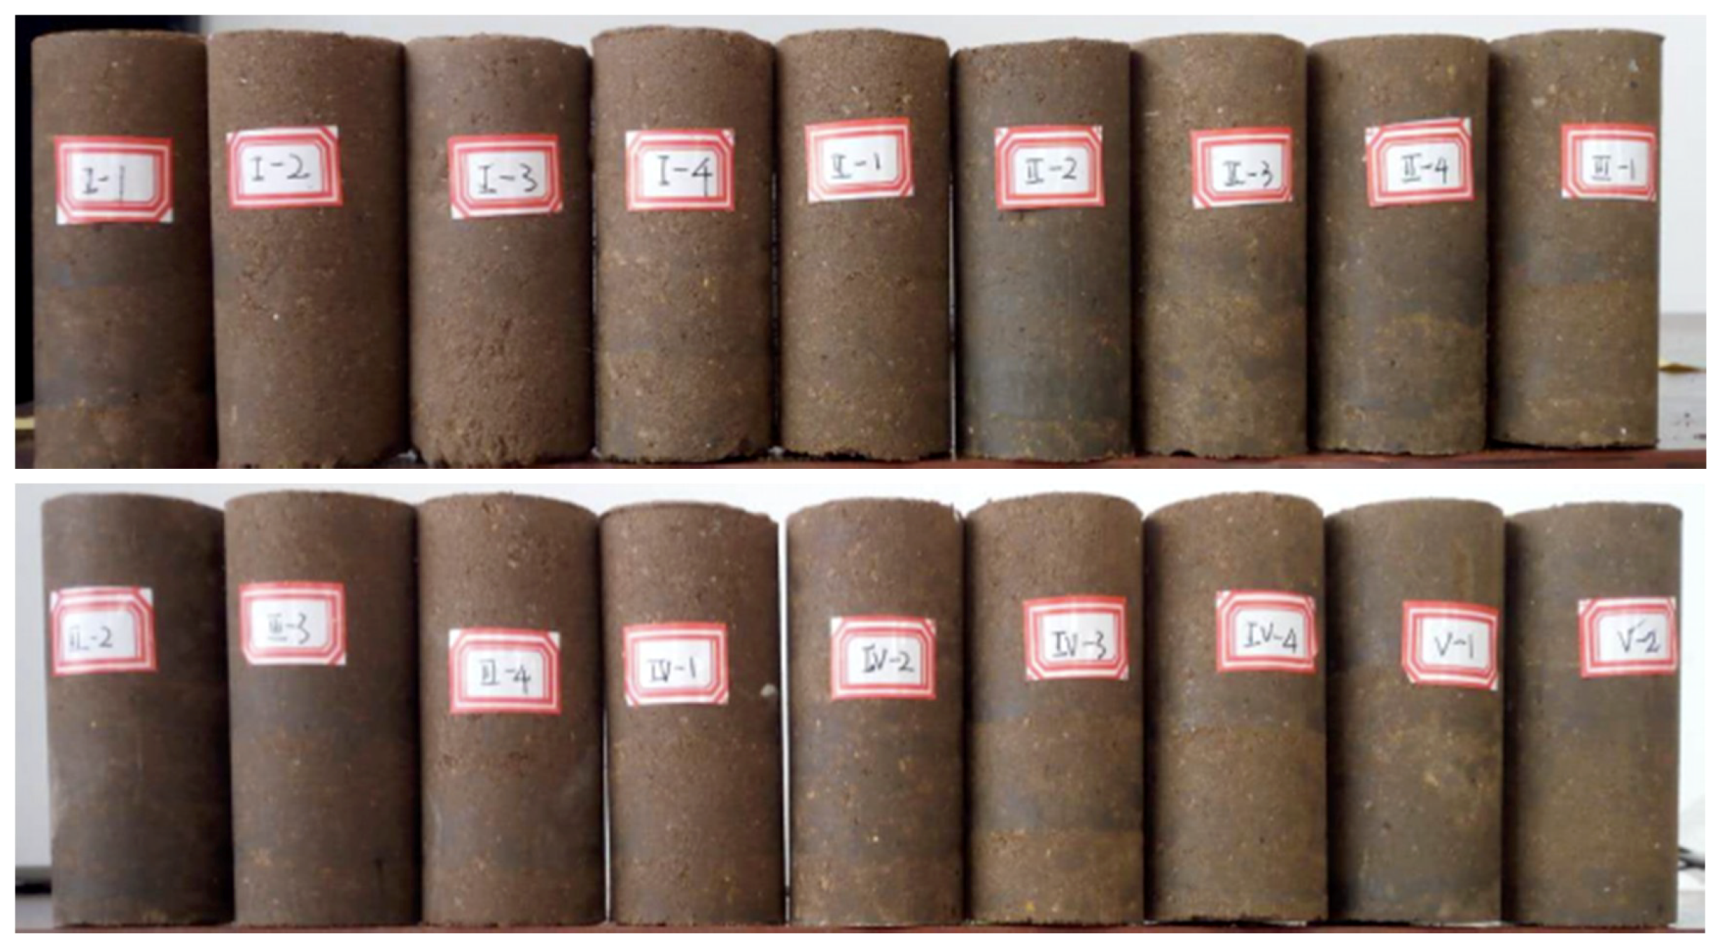
2.2. Preparation
2.3. Experimental Design
3. Test Results and Analysis
3.1. Effect of Freeze-Thaw Cycles on Physical Properties
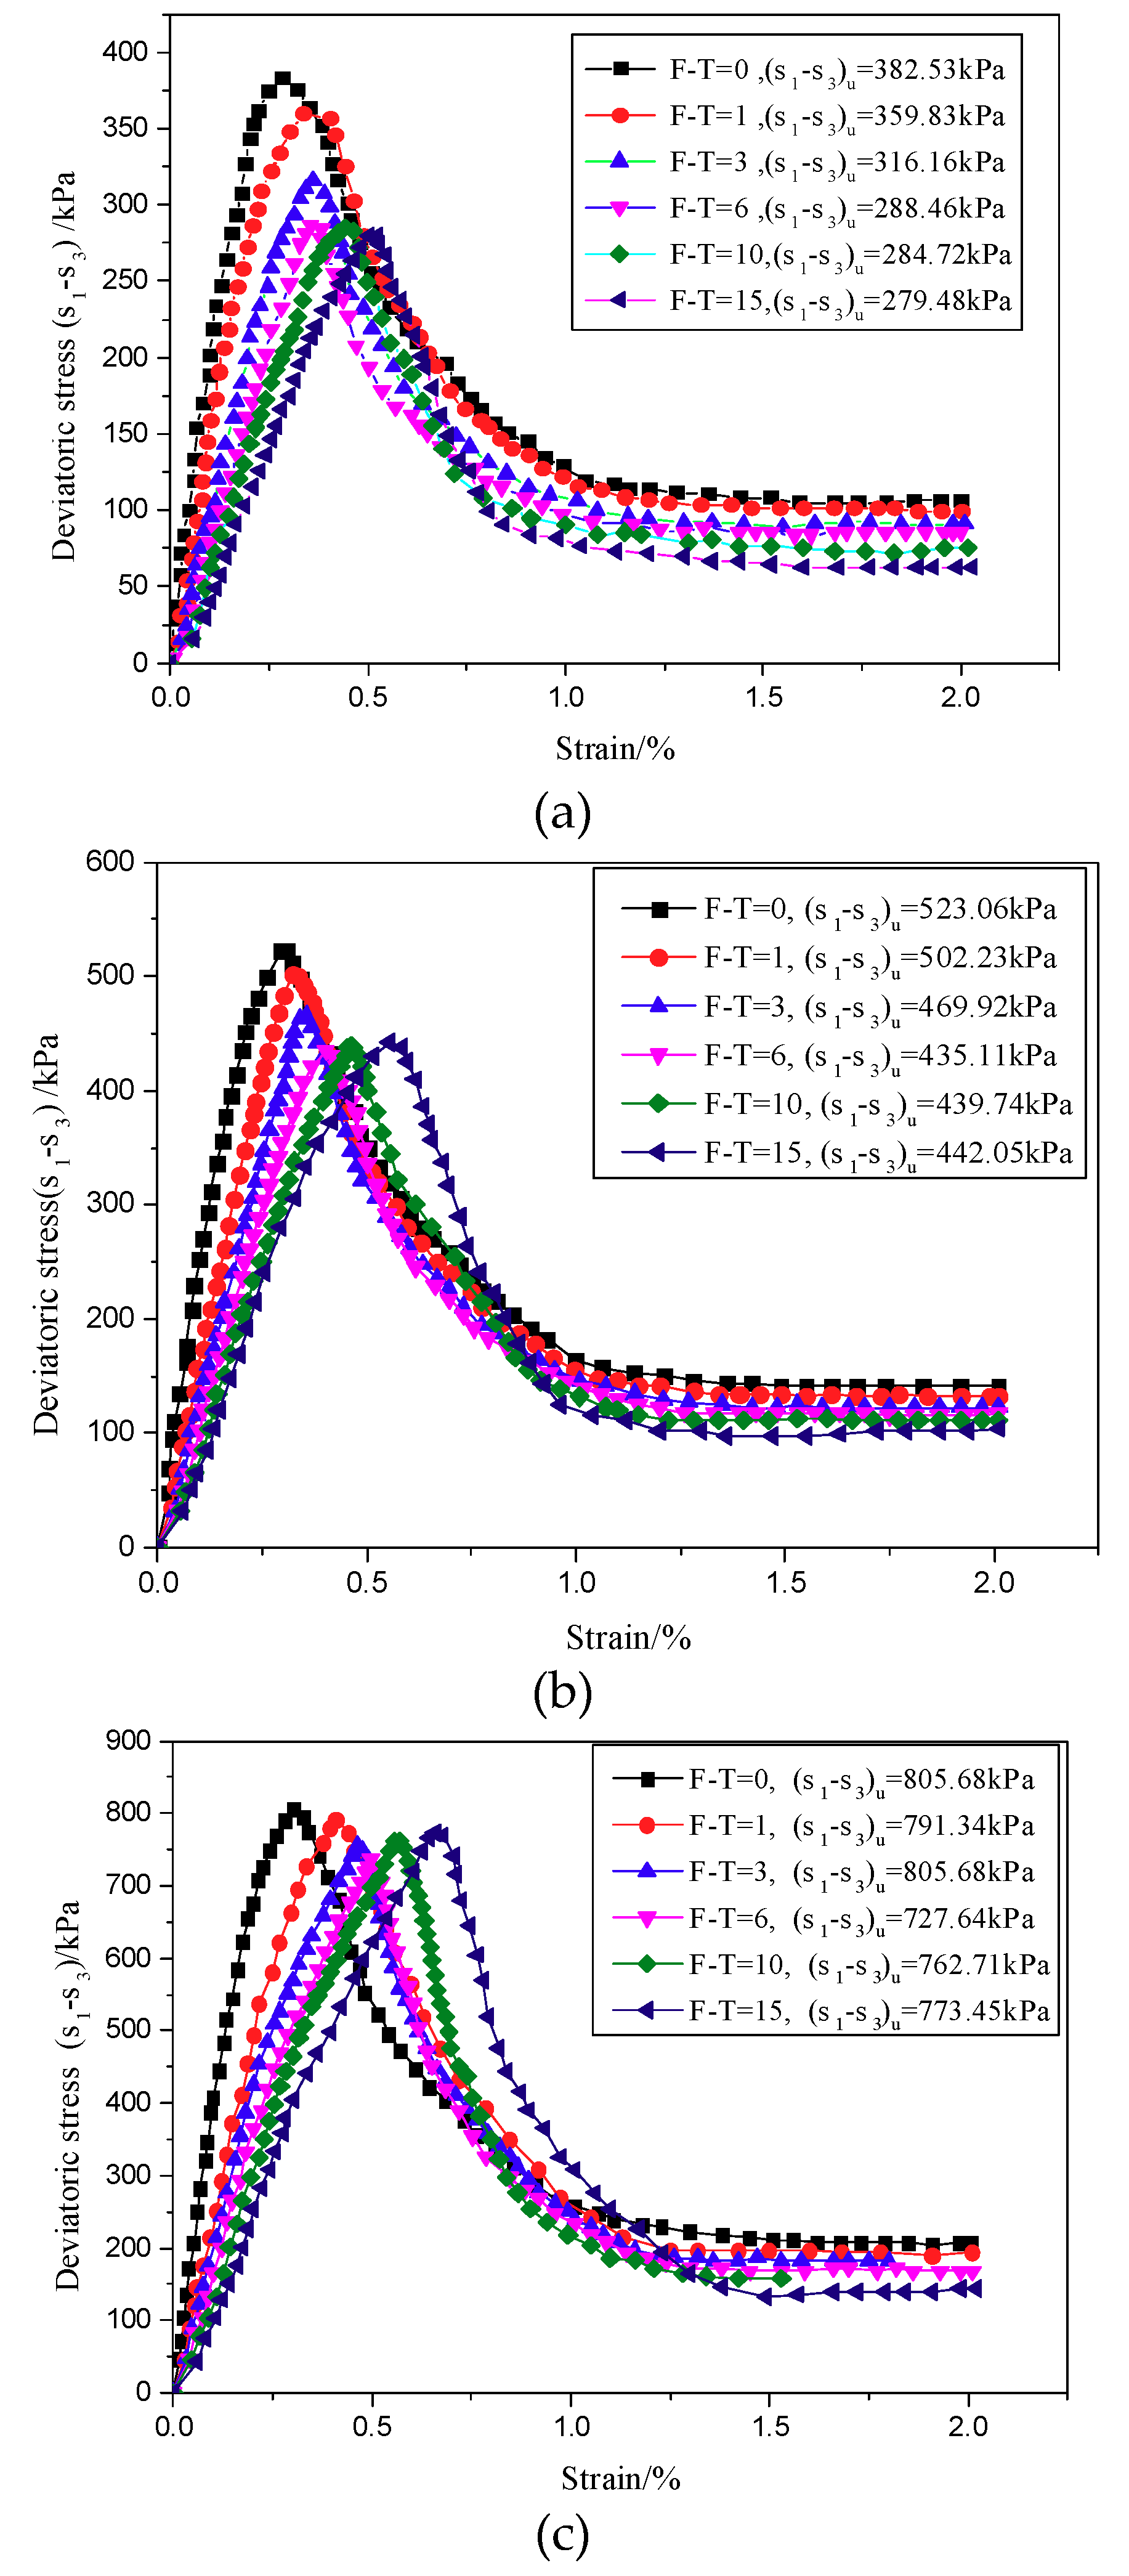
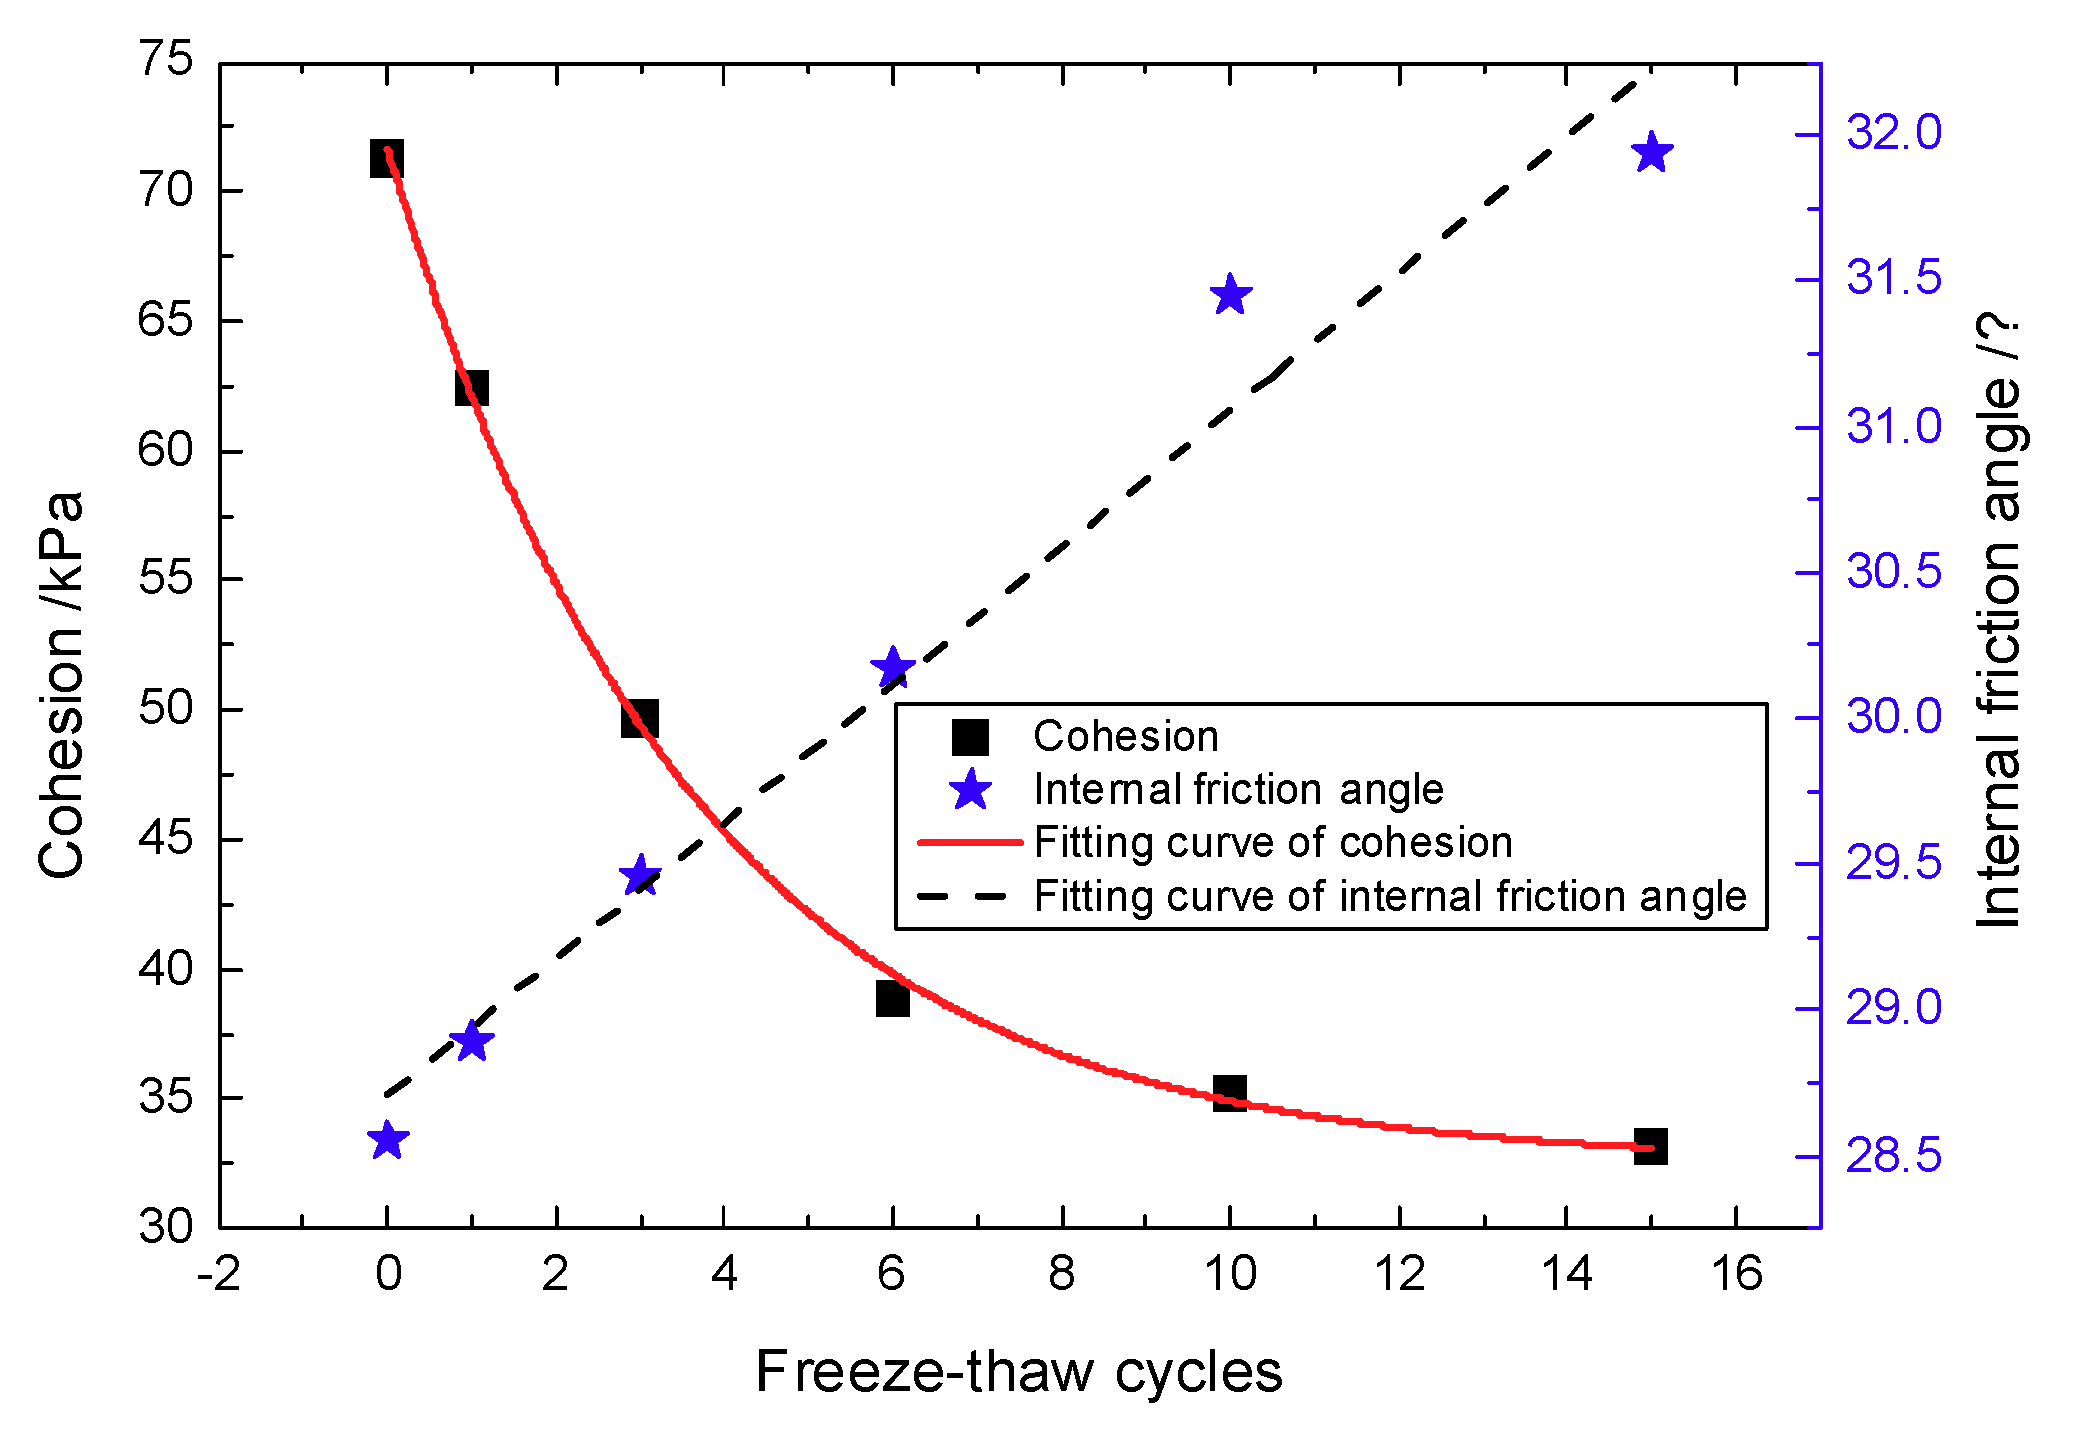
3.2. Effect of Freeze-Thaw Cycles on Shear Strength
4. CT Scanning of Pore Evolution
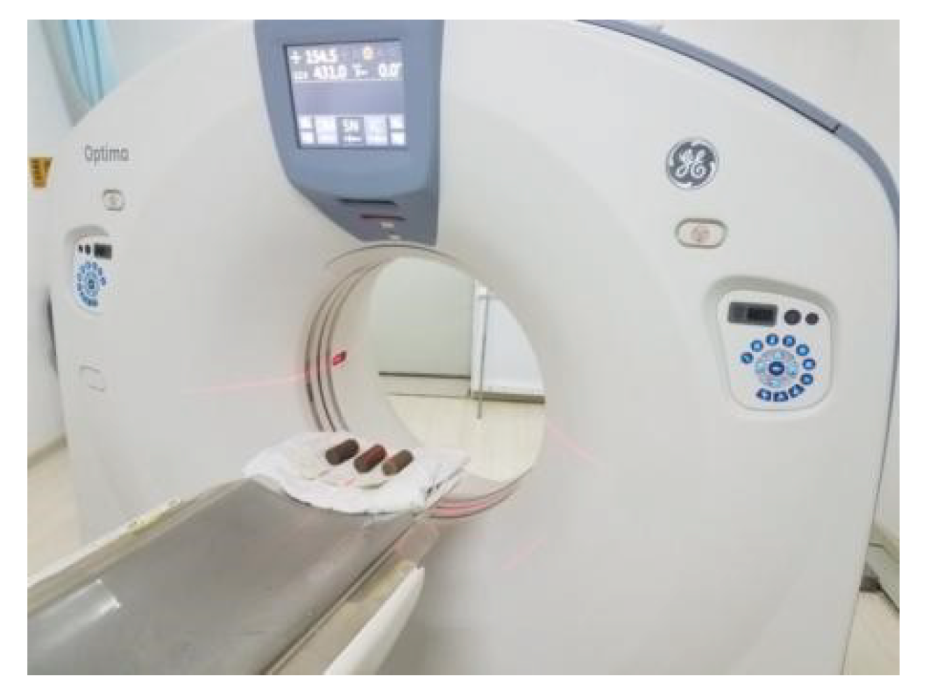
4.1. CT Scanning Technology
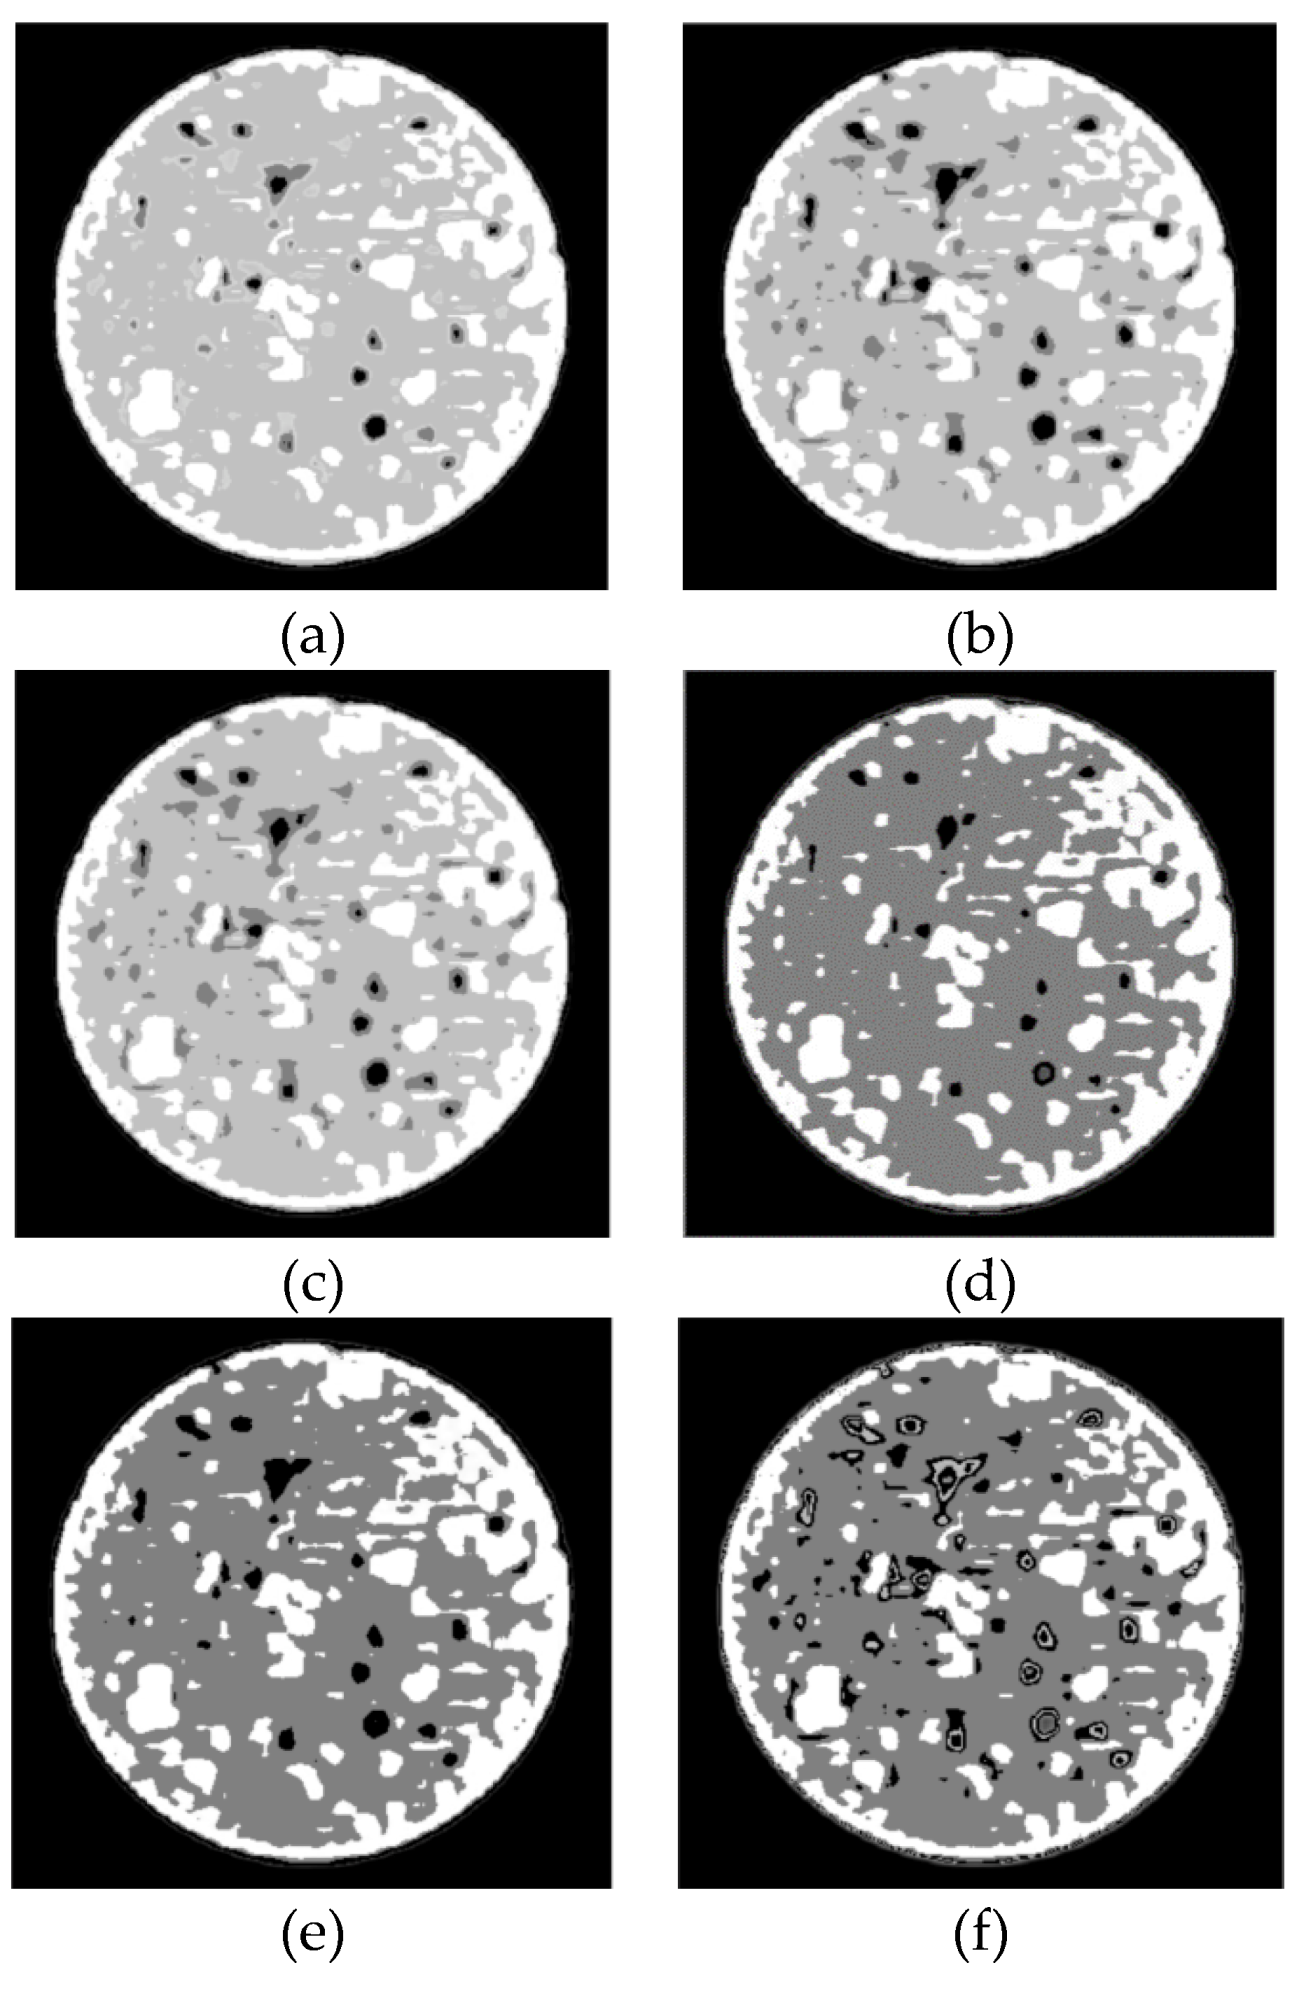
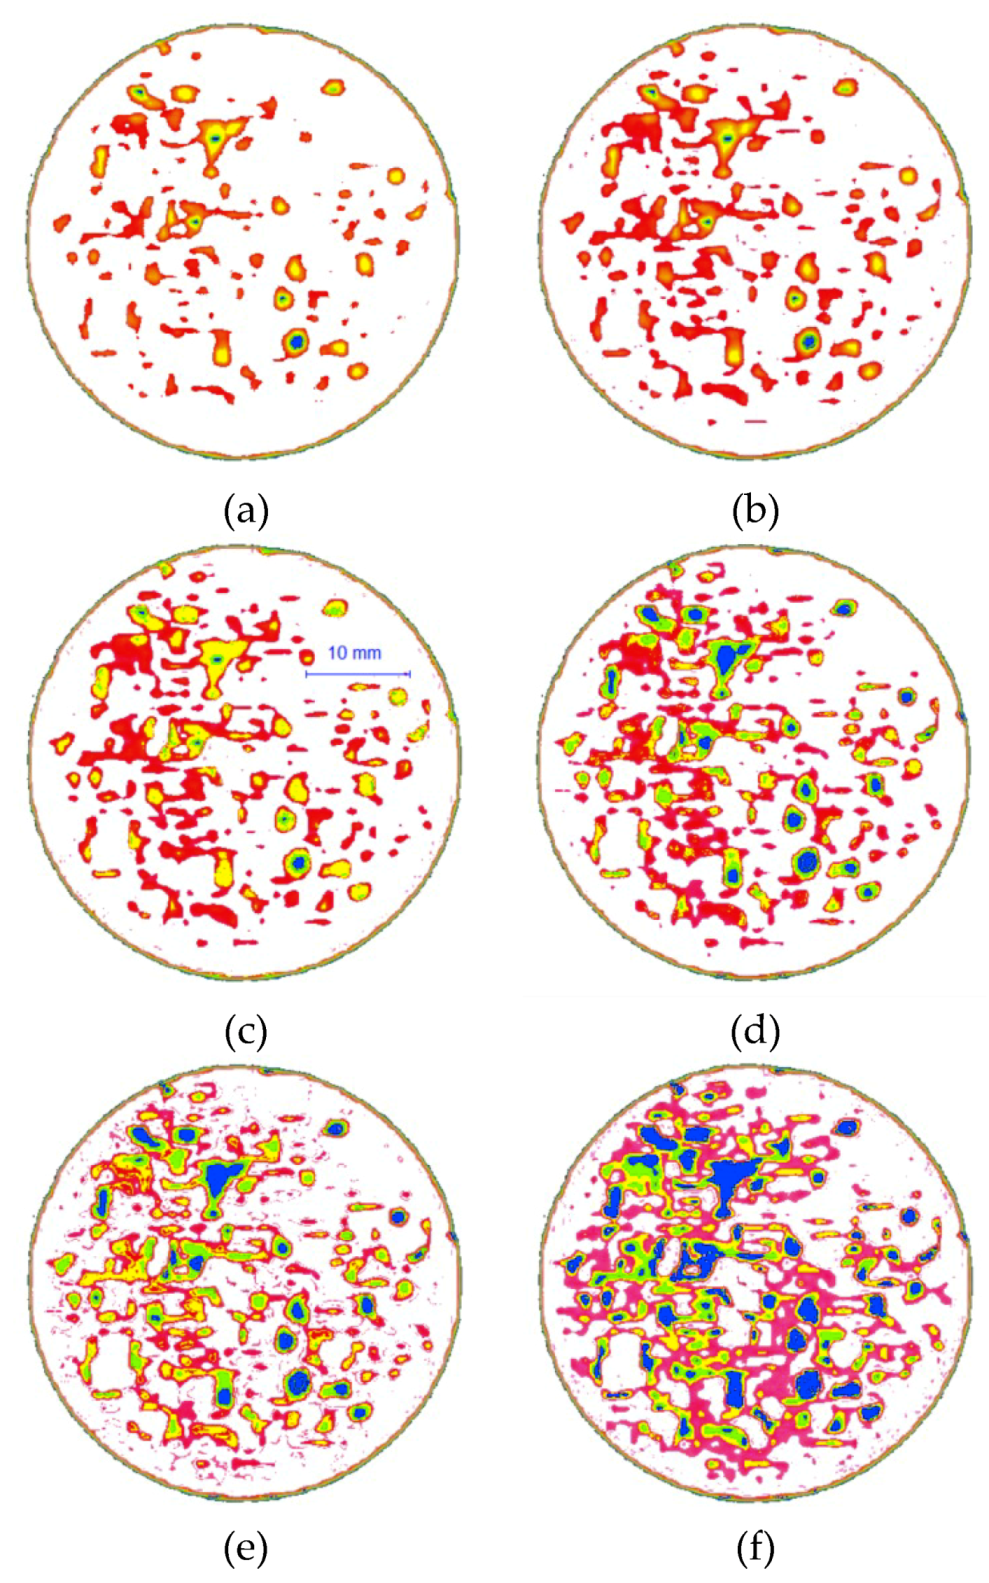
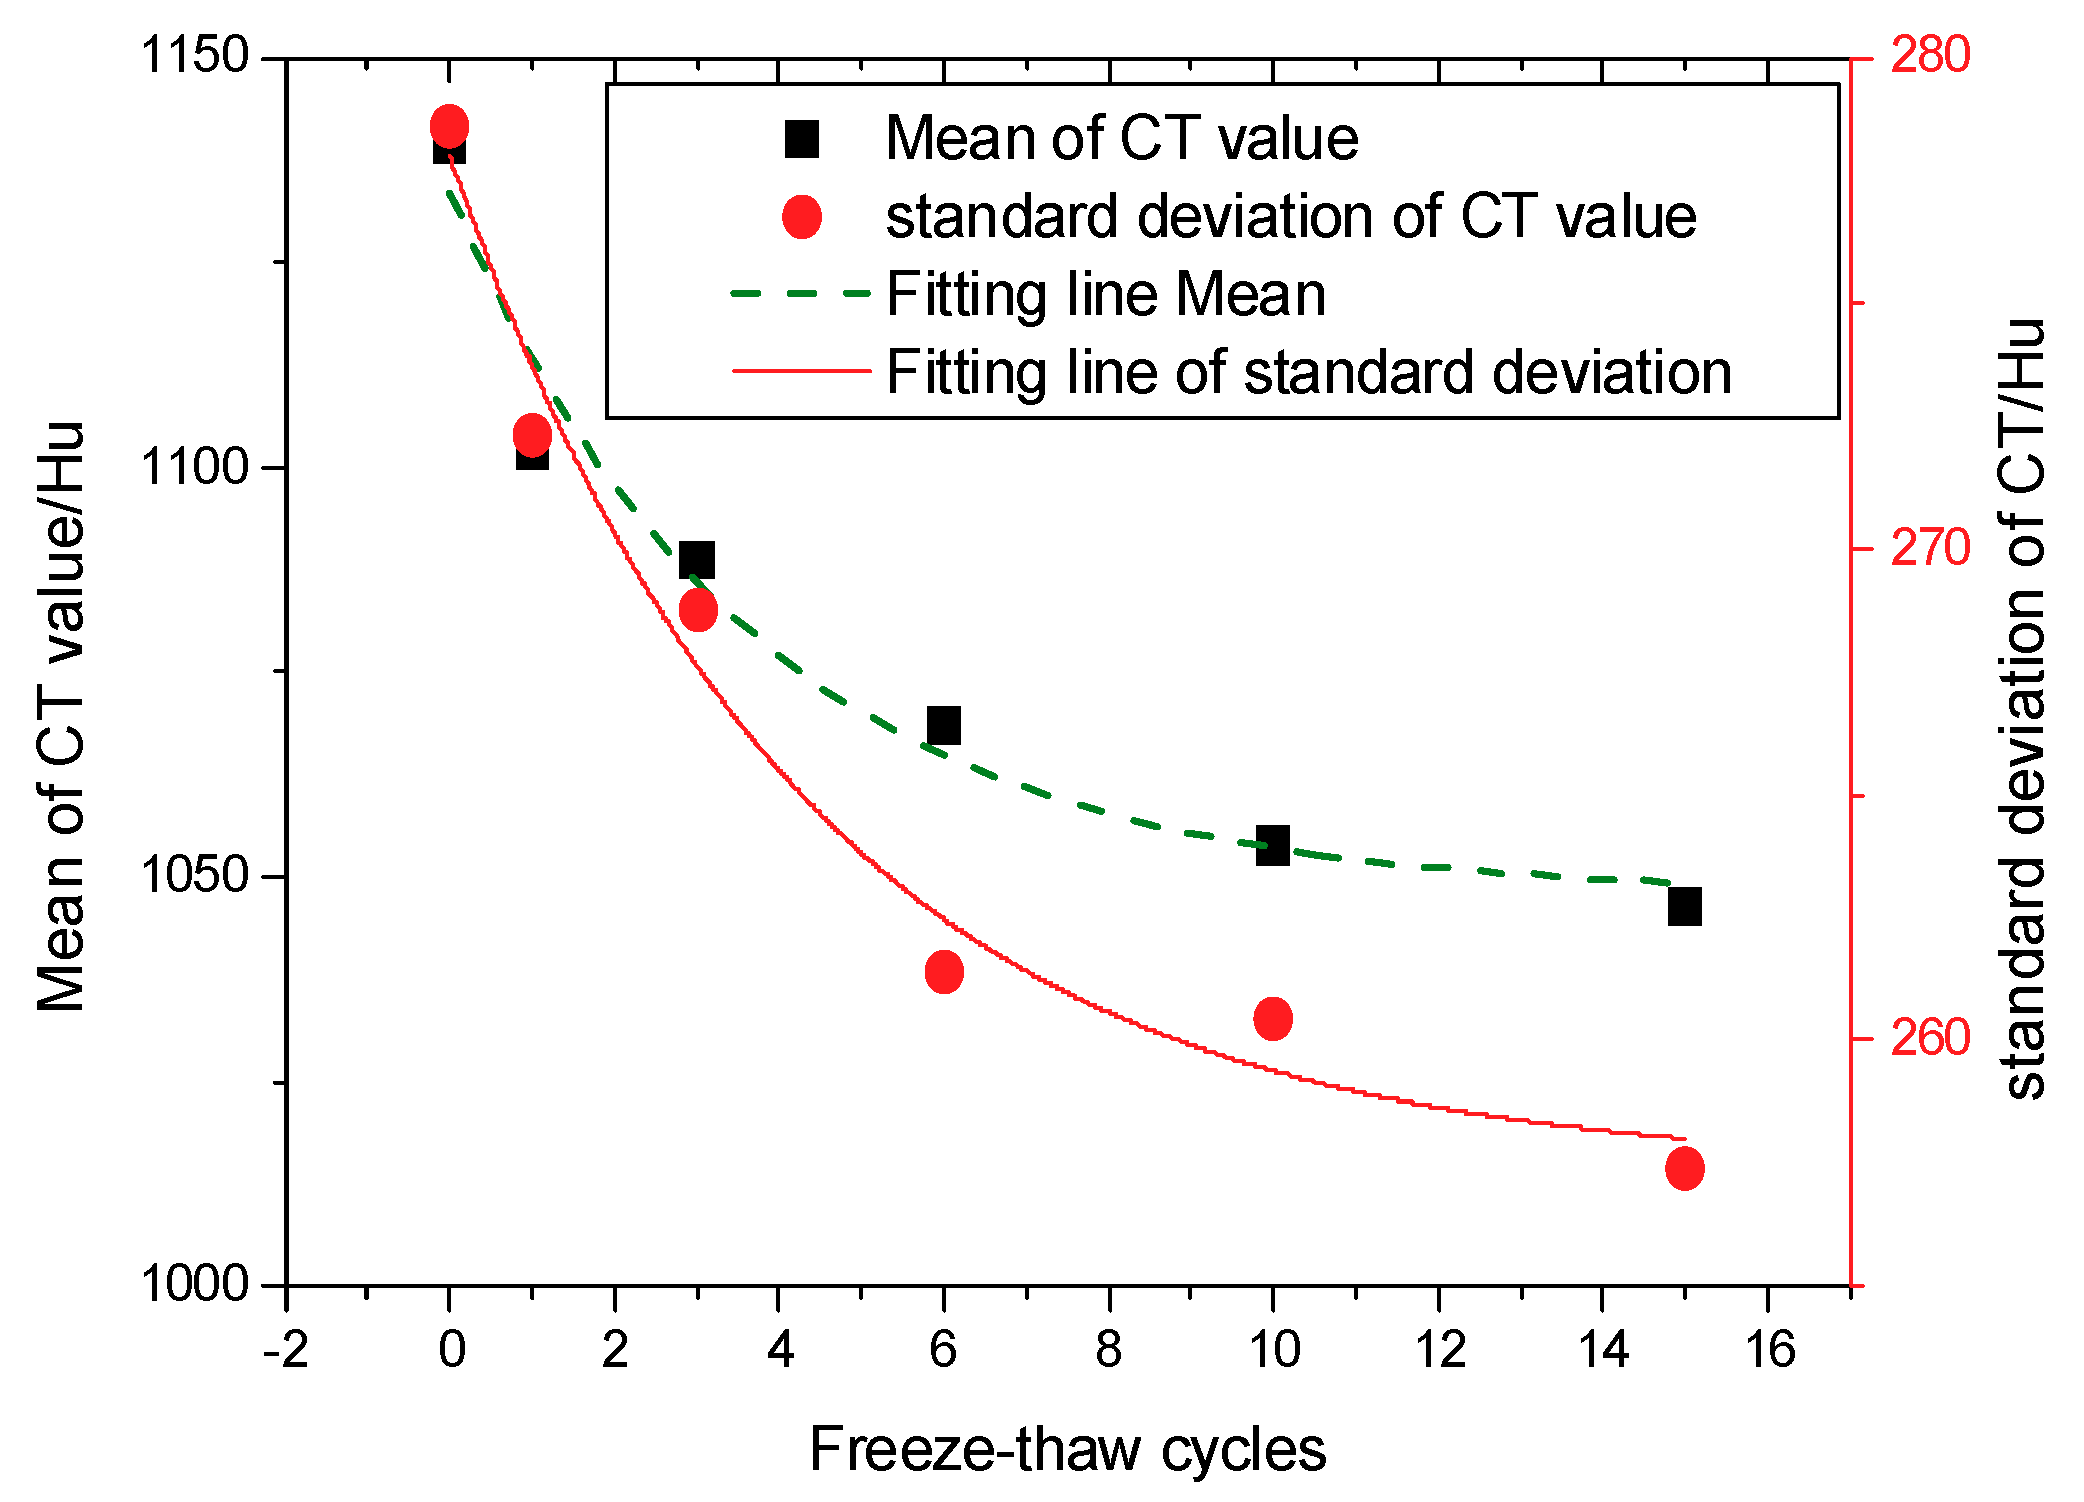
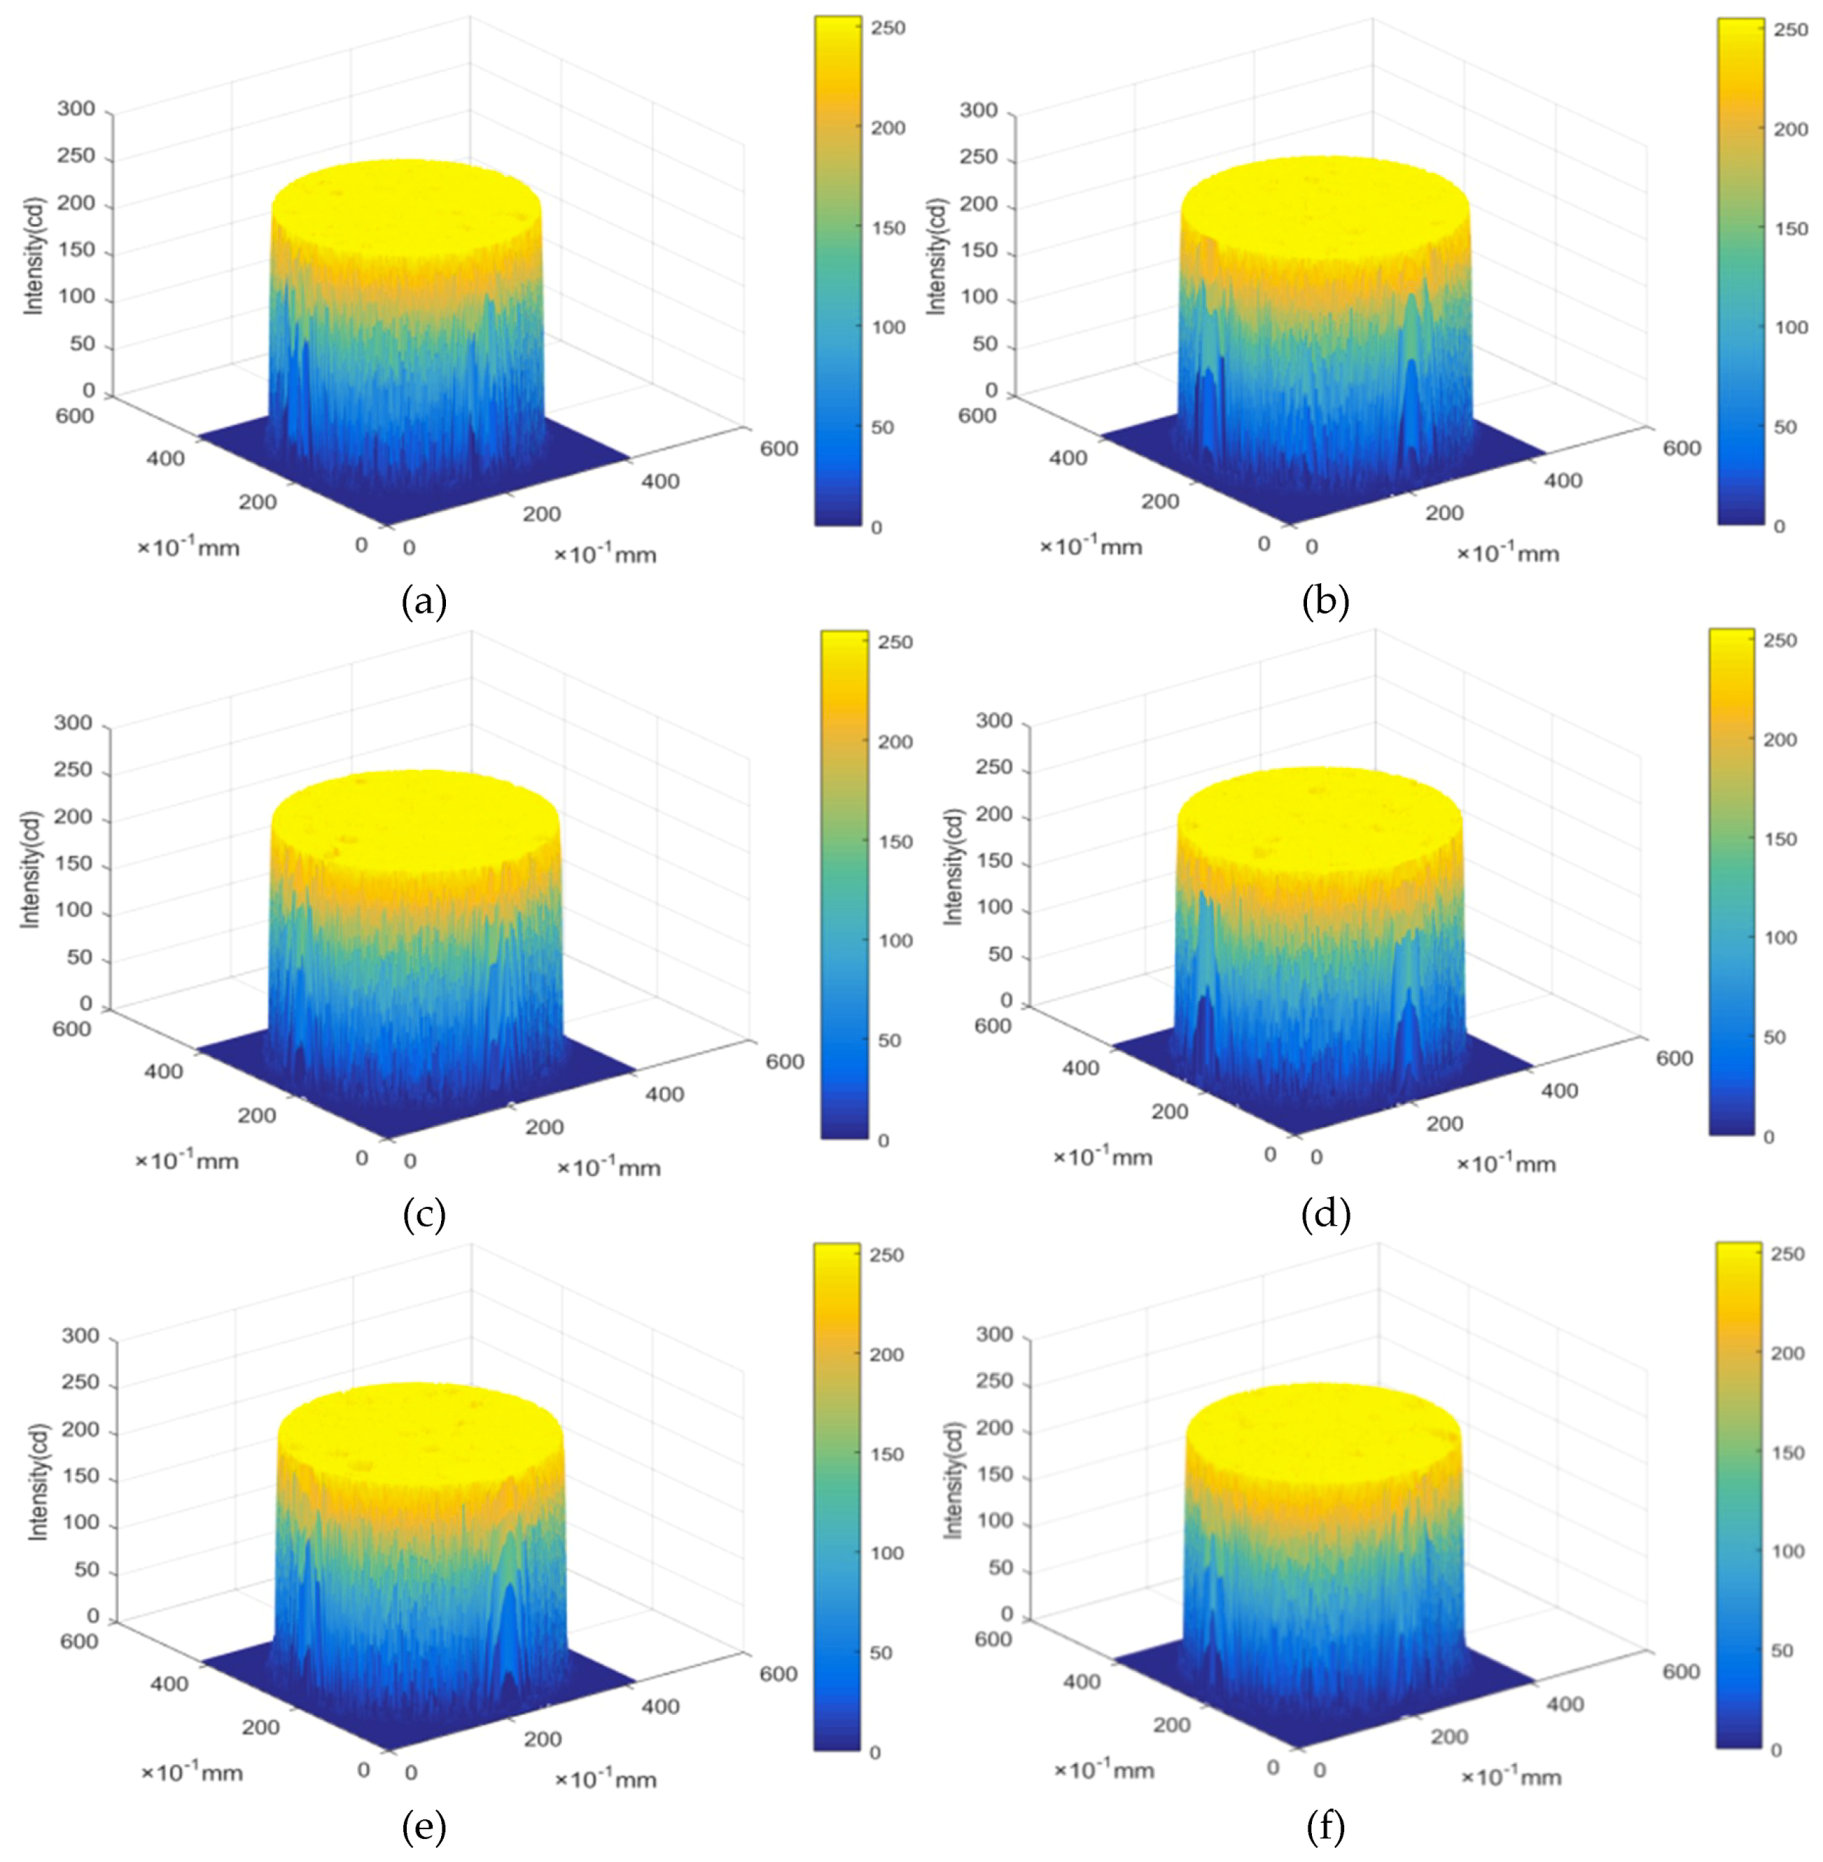
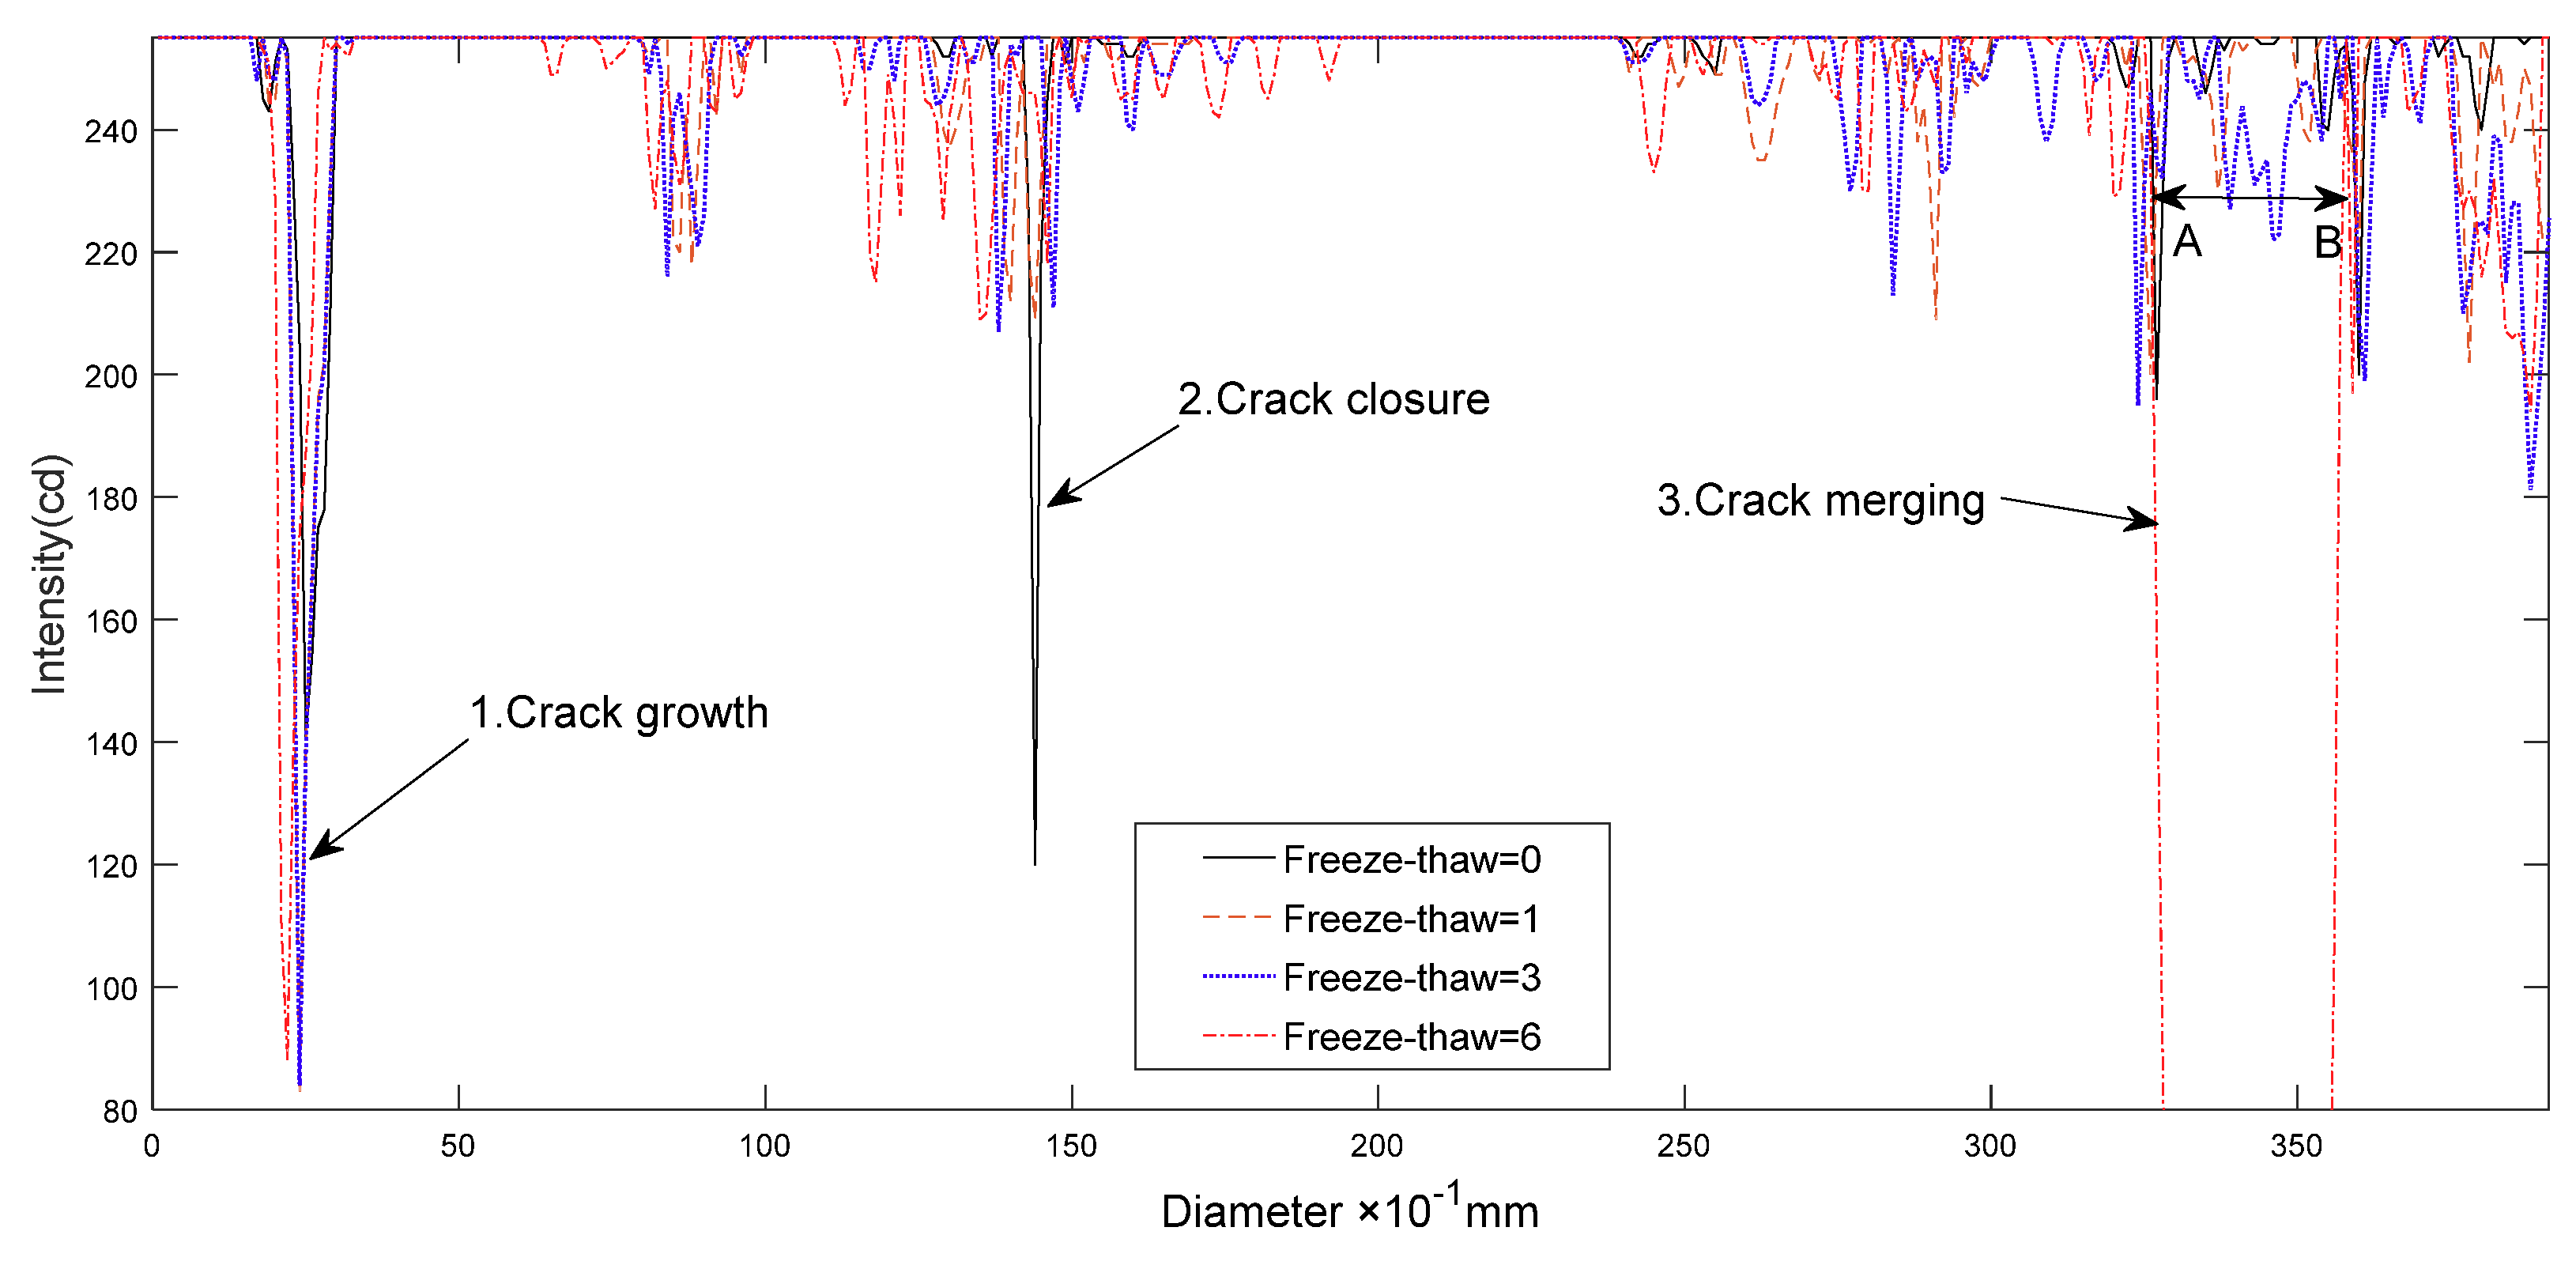
4.2. Analysis of Light Intensity after Freeze-Thaw Cycling
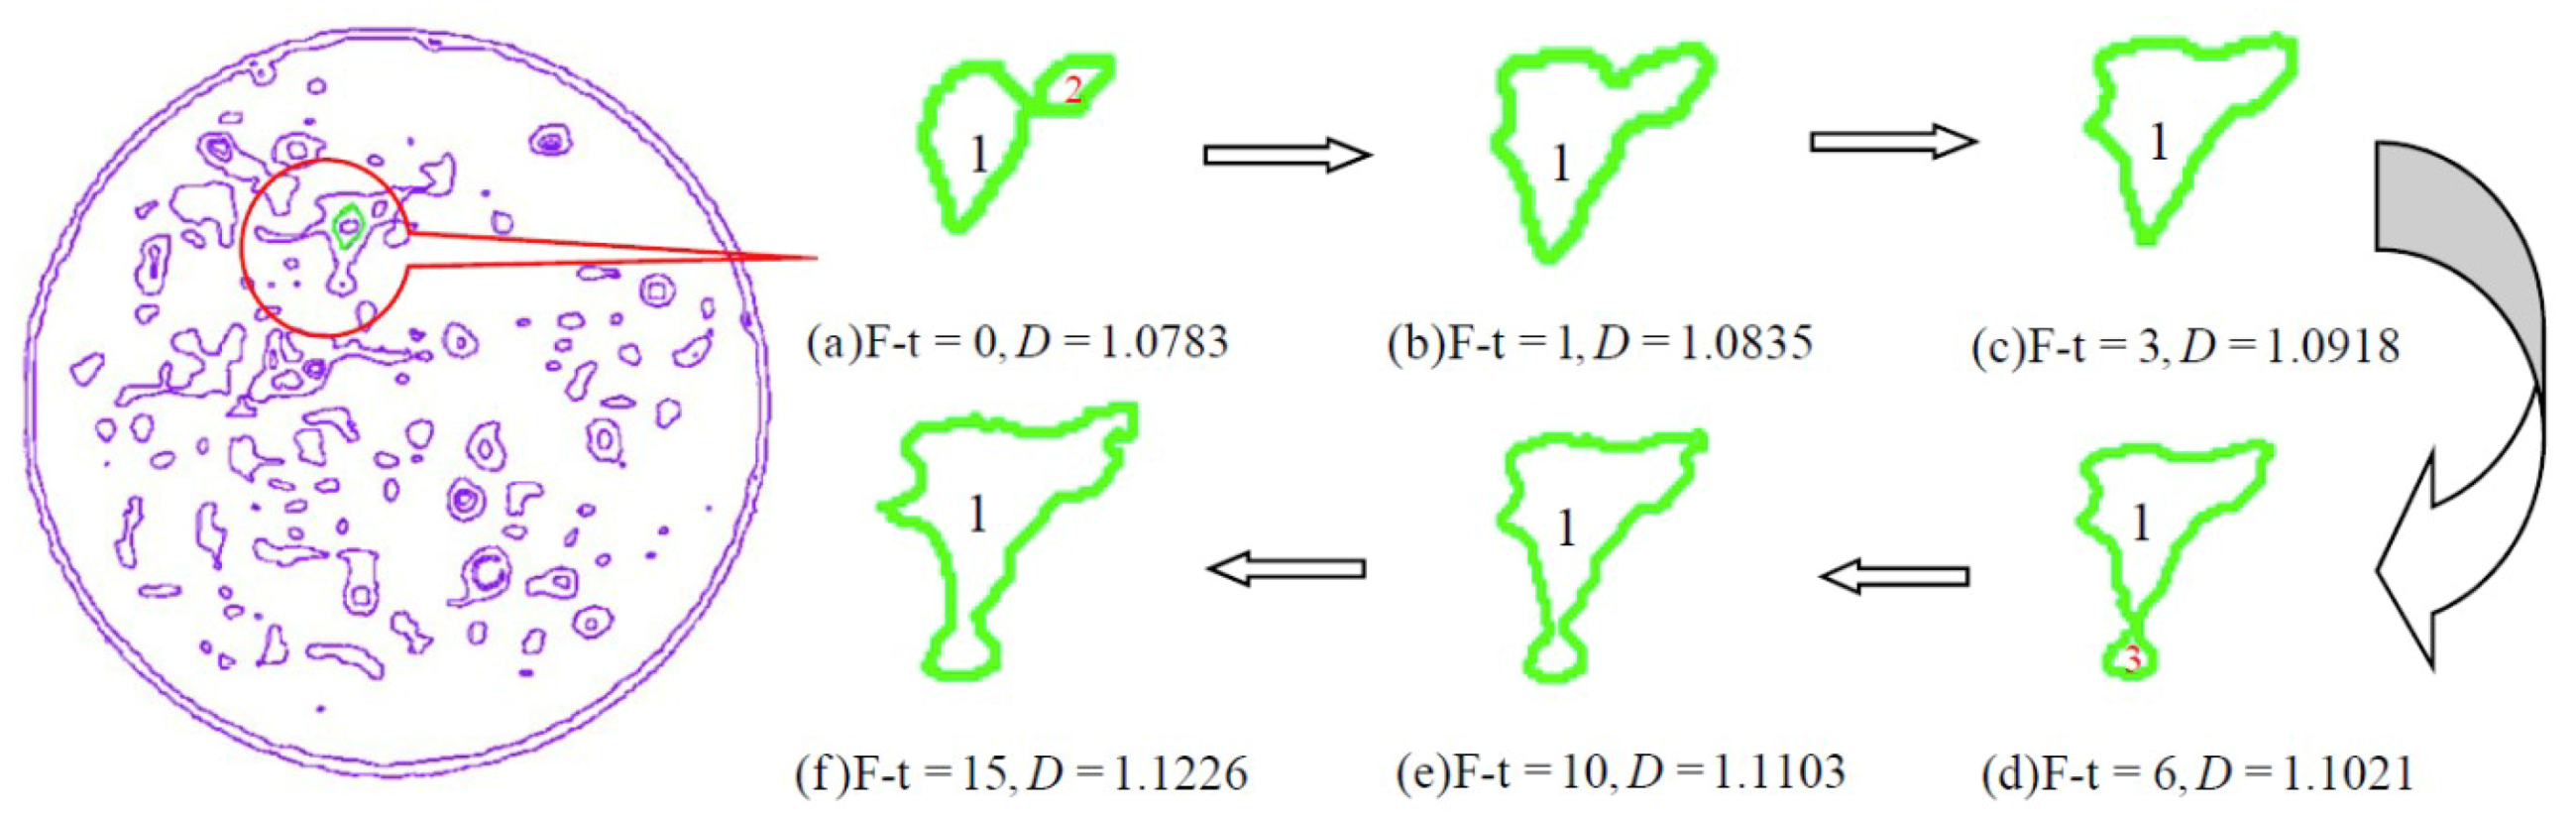
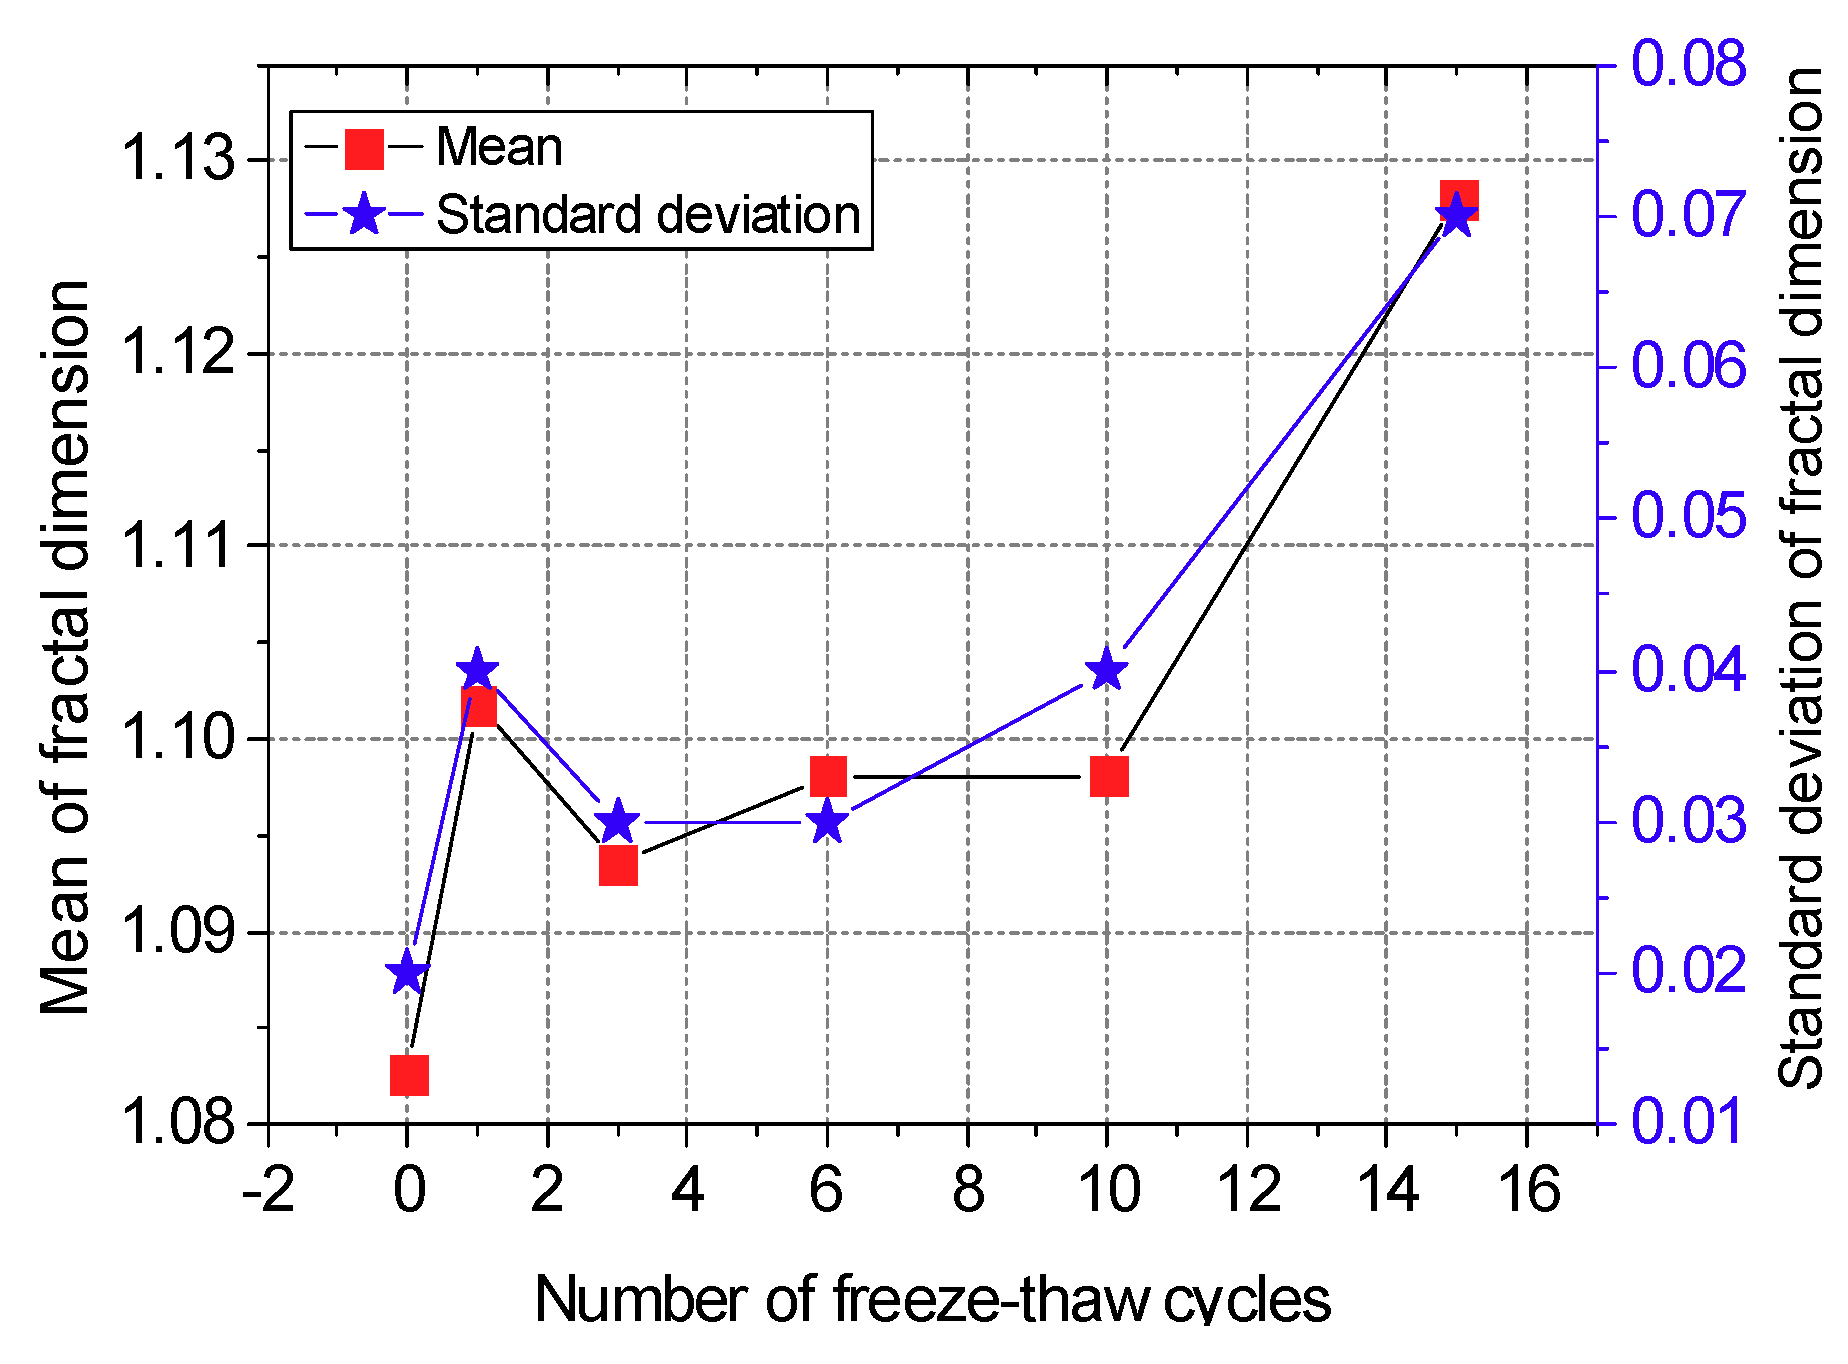
4.3. Trend of Fractal Dimensions of Pore Evolution
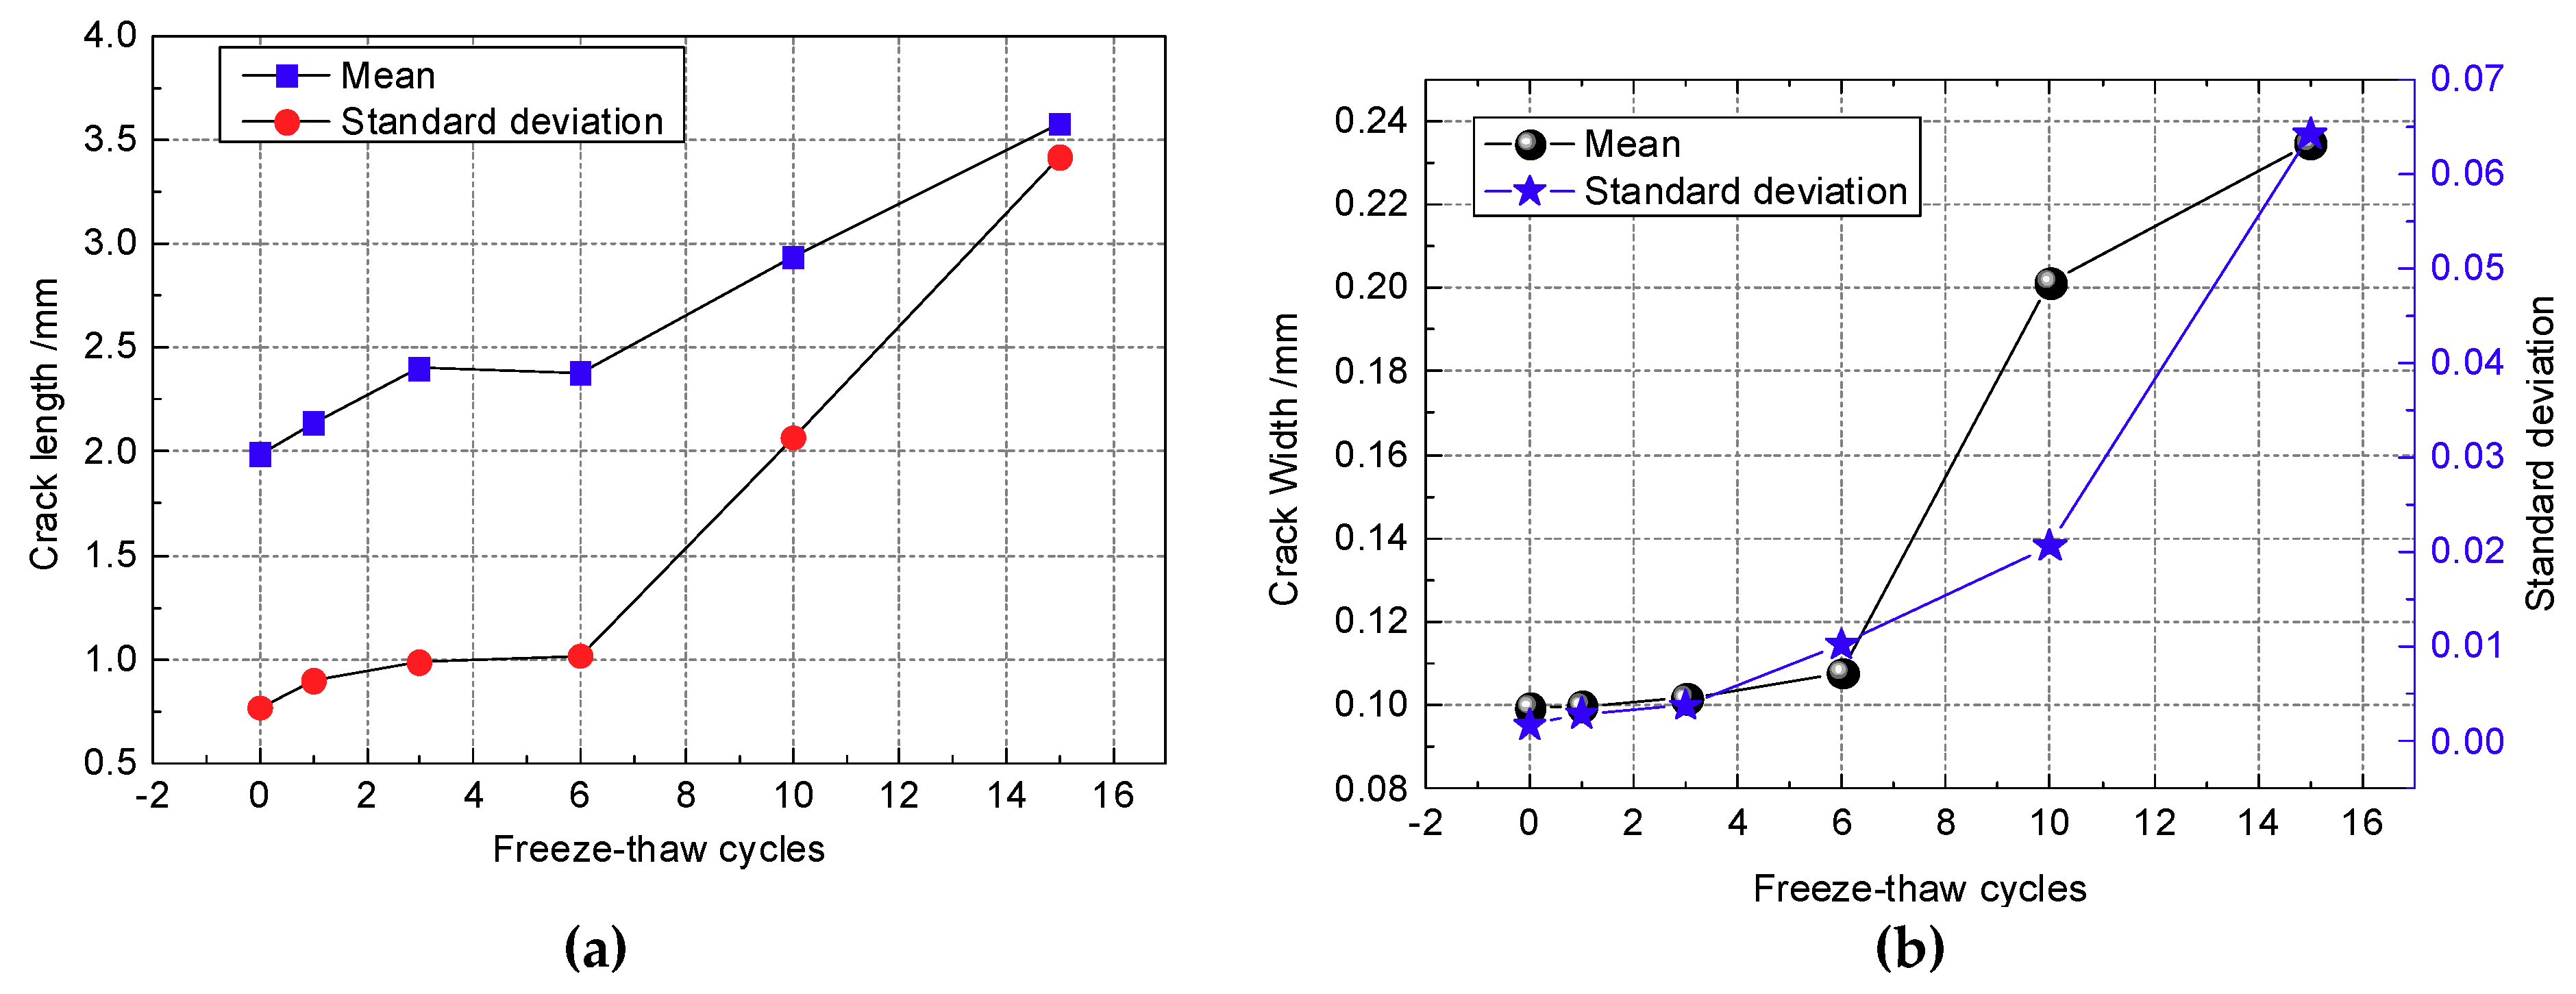
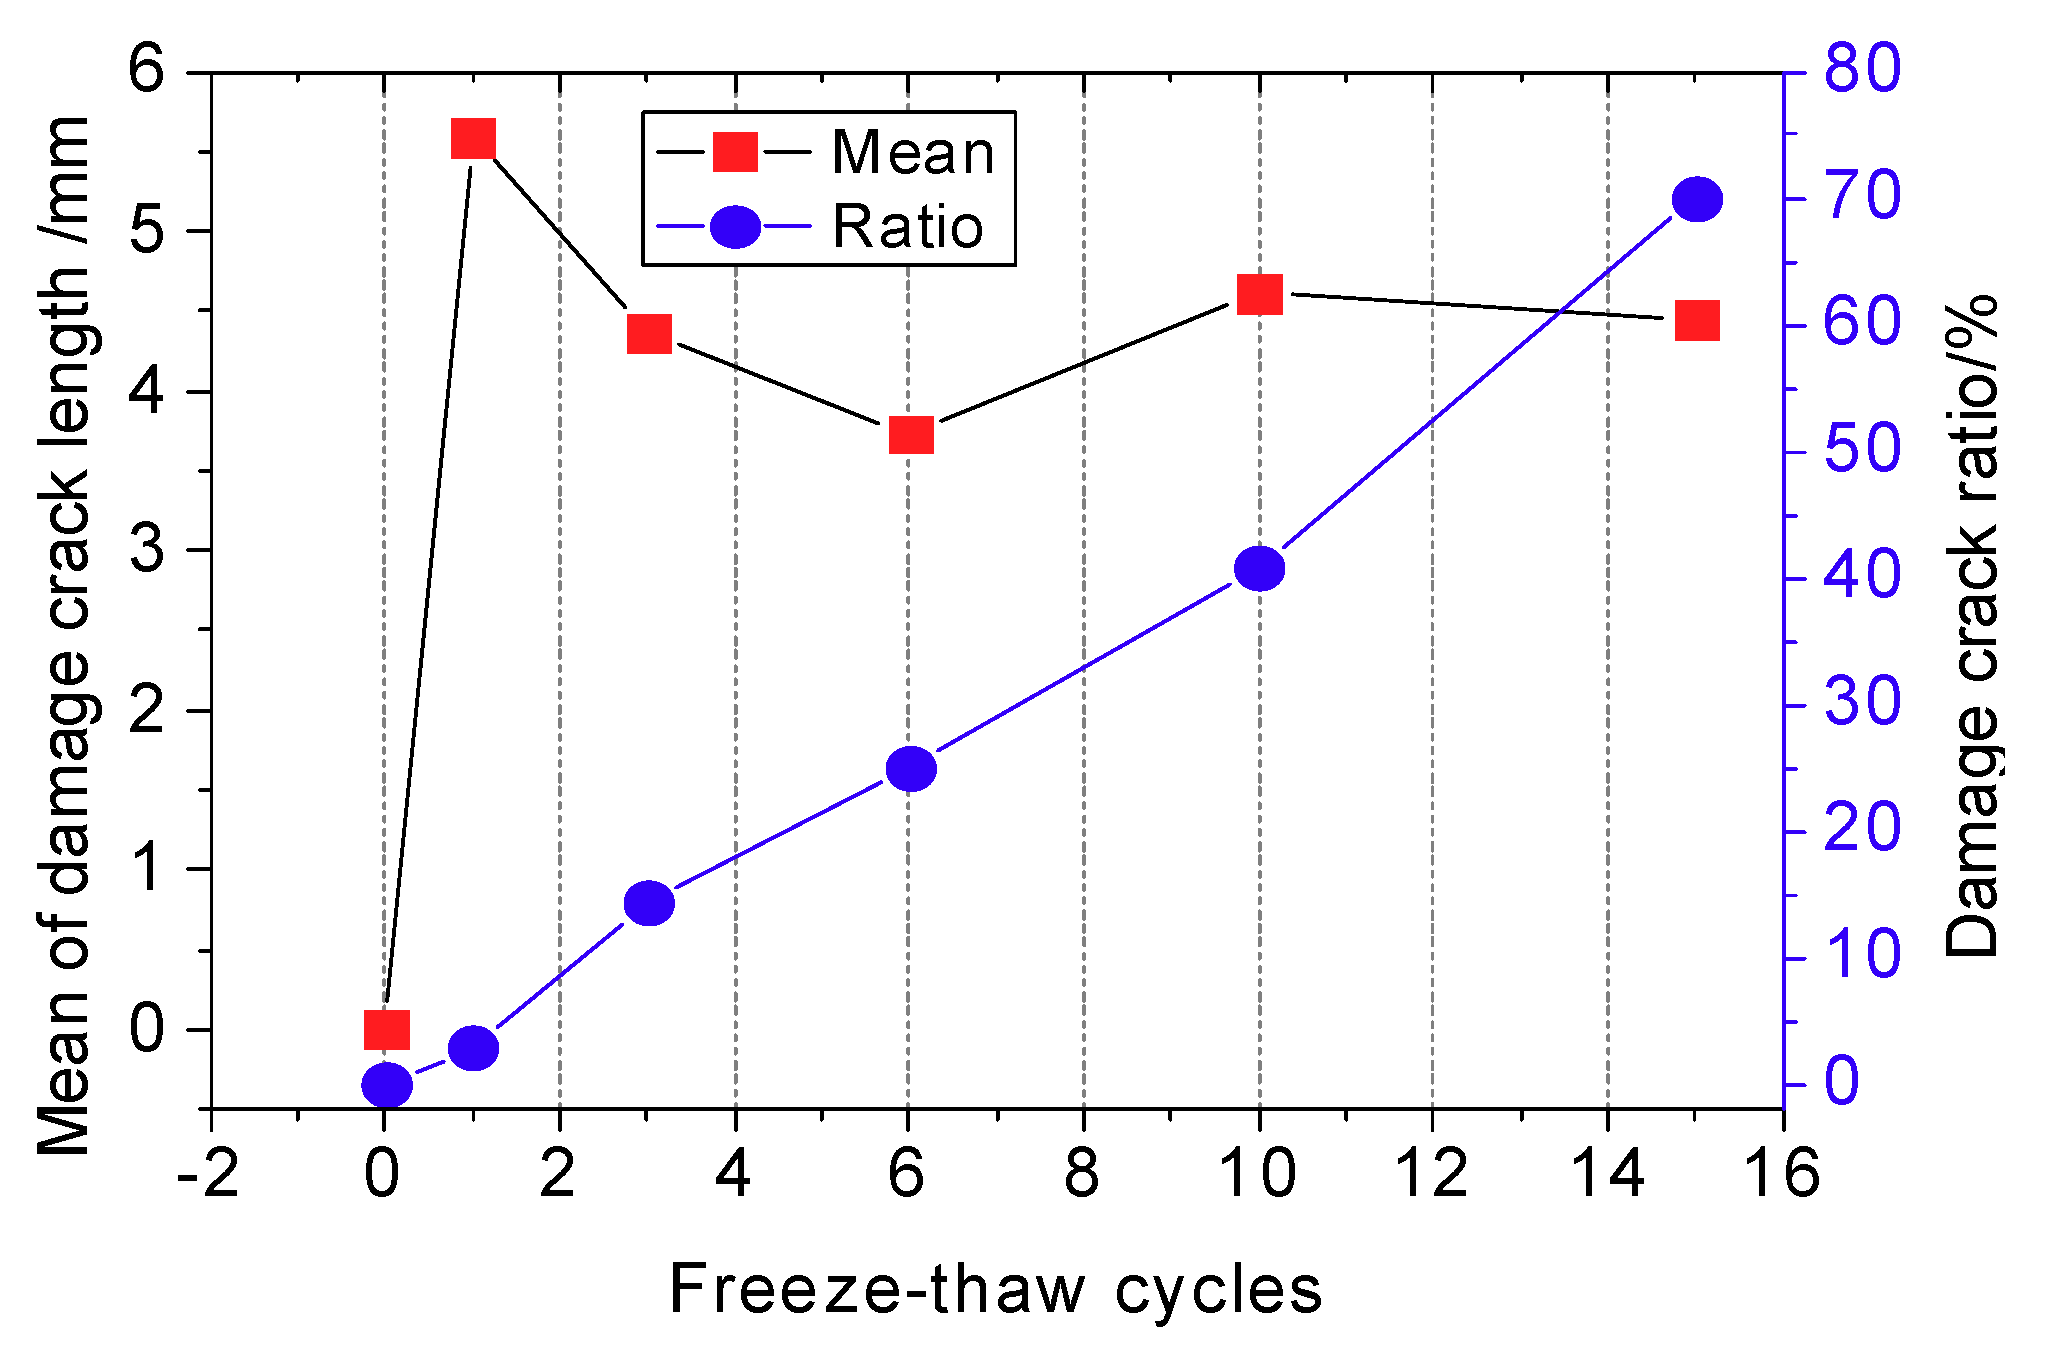
4.4. Evolution of Critical Crack Length
5. Evolution of Freeze-Thaw Damage
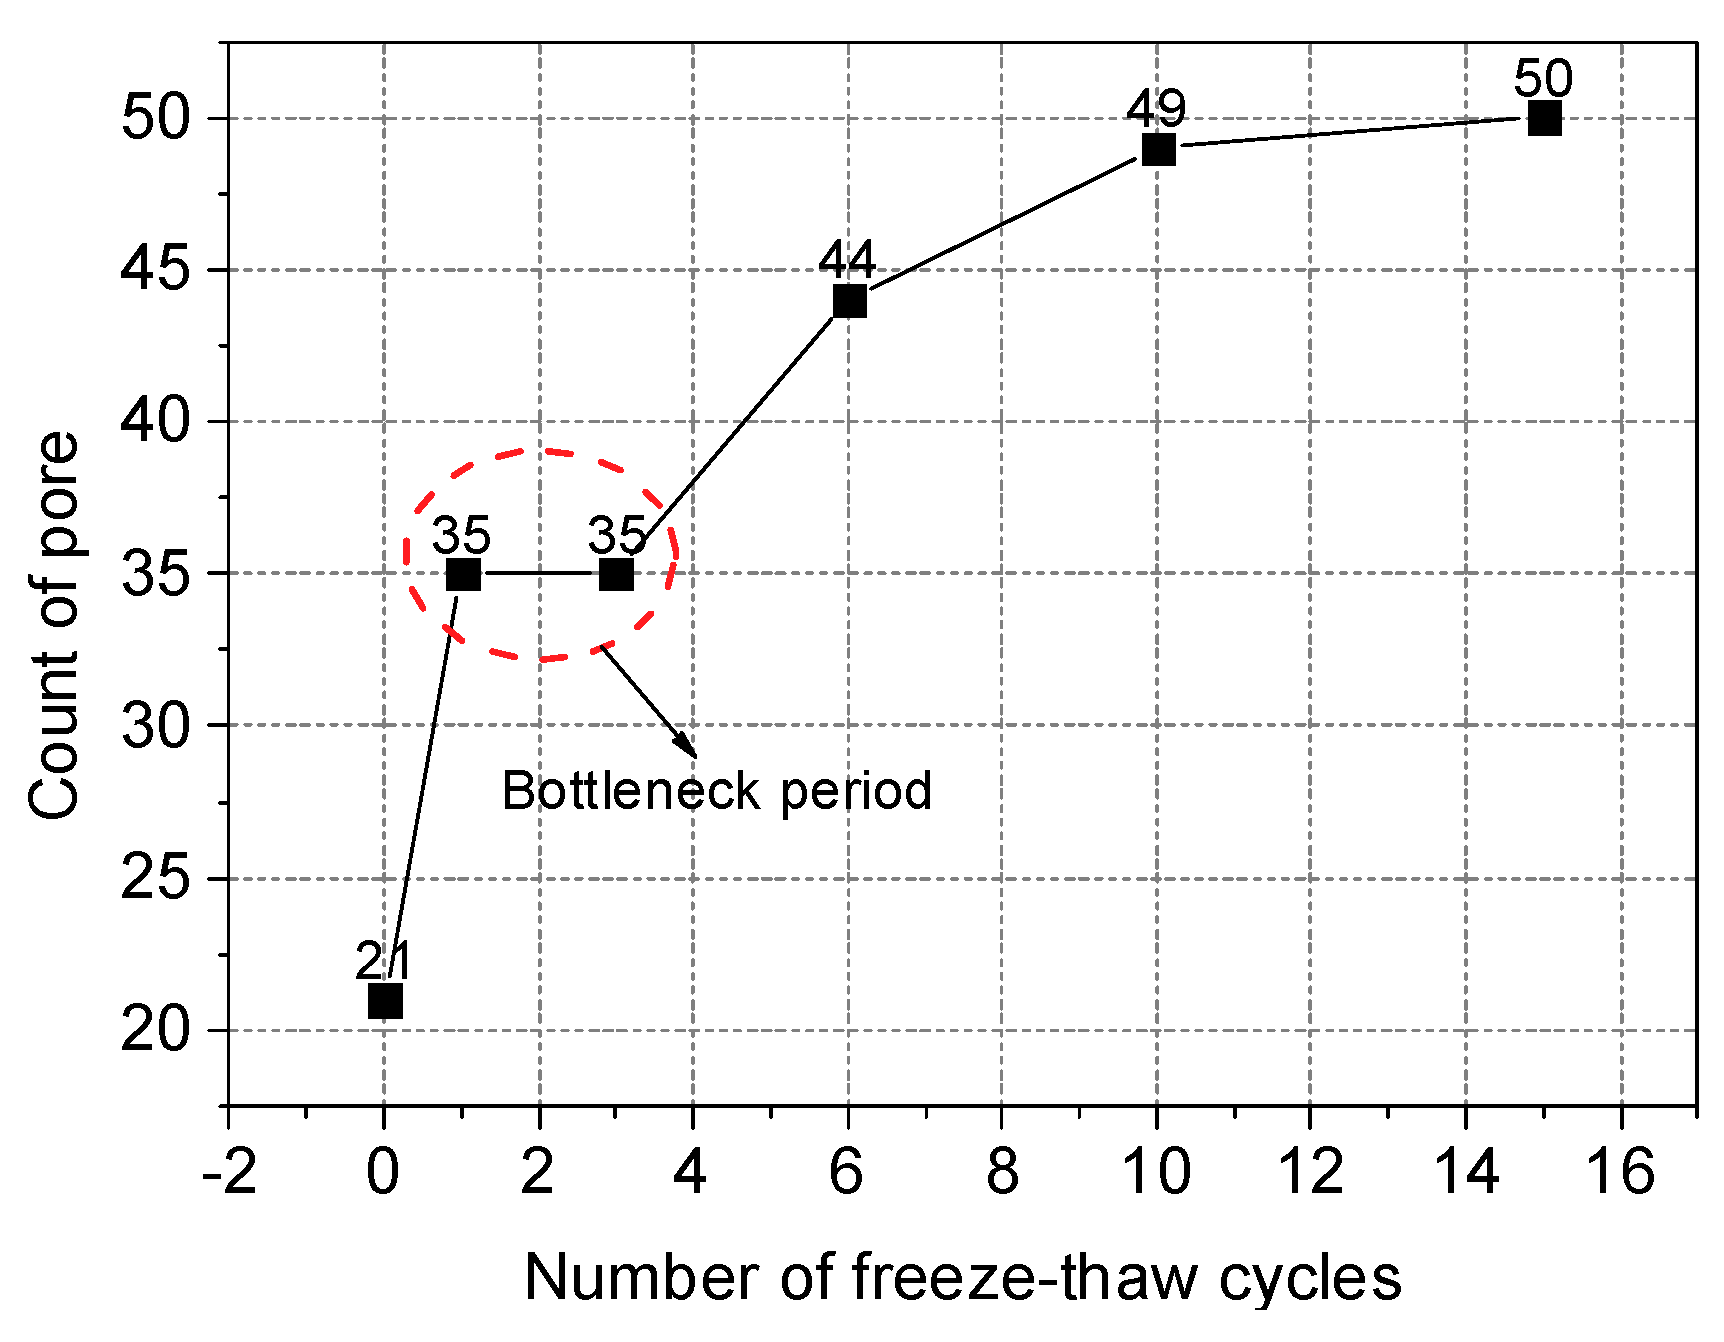
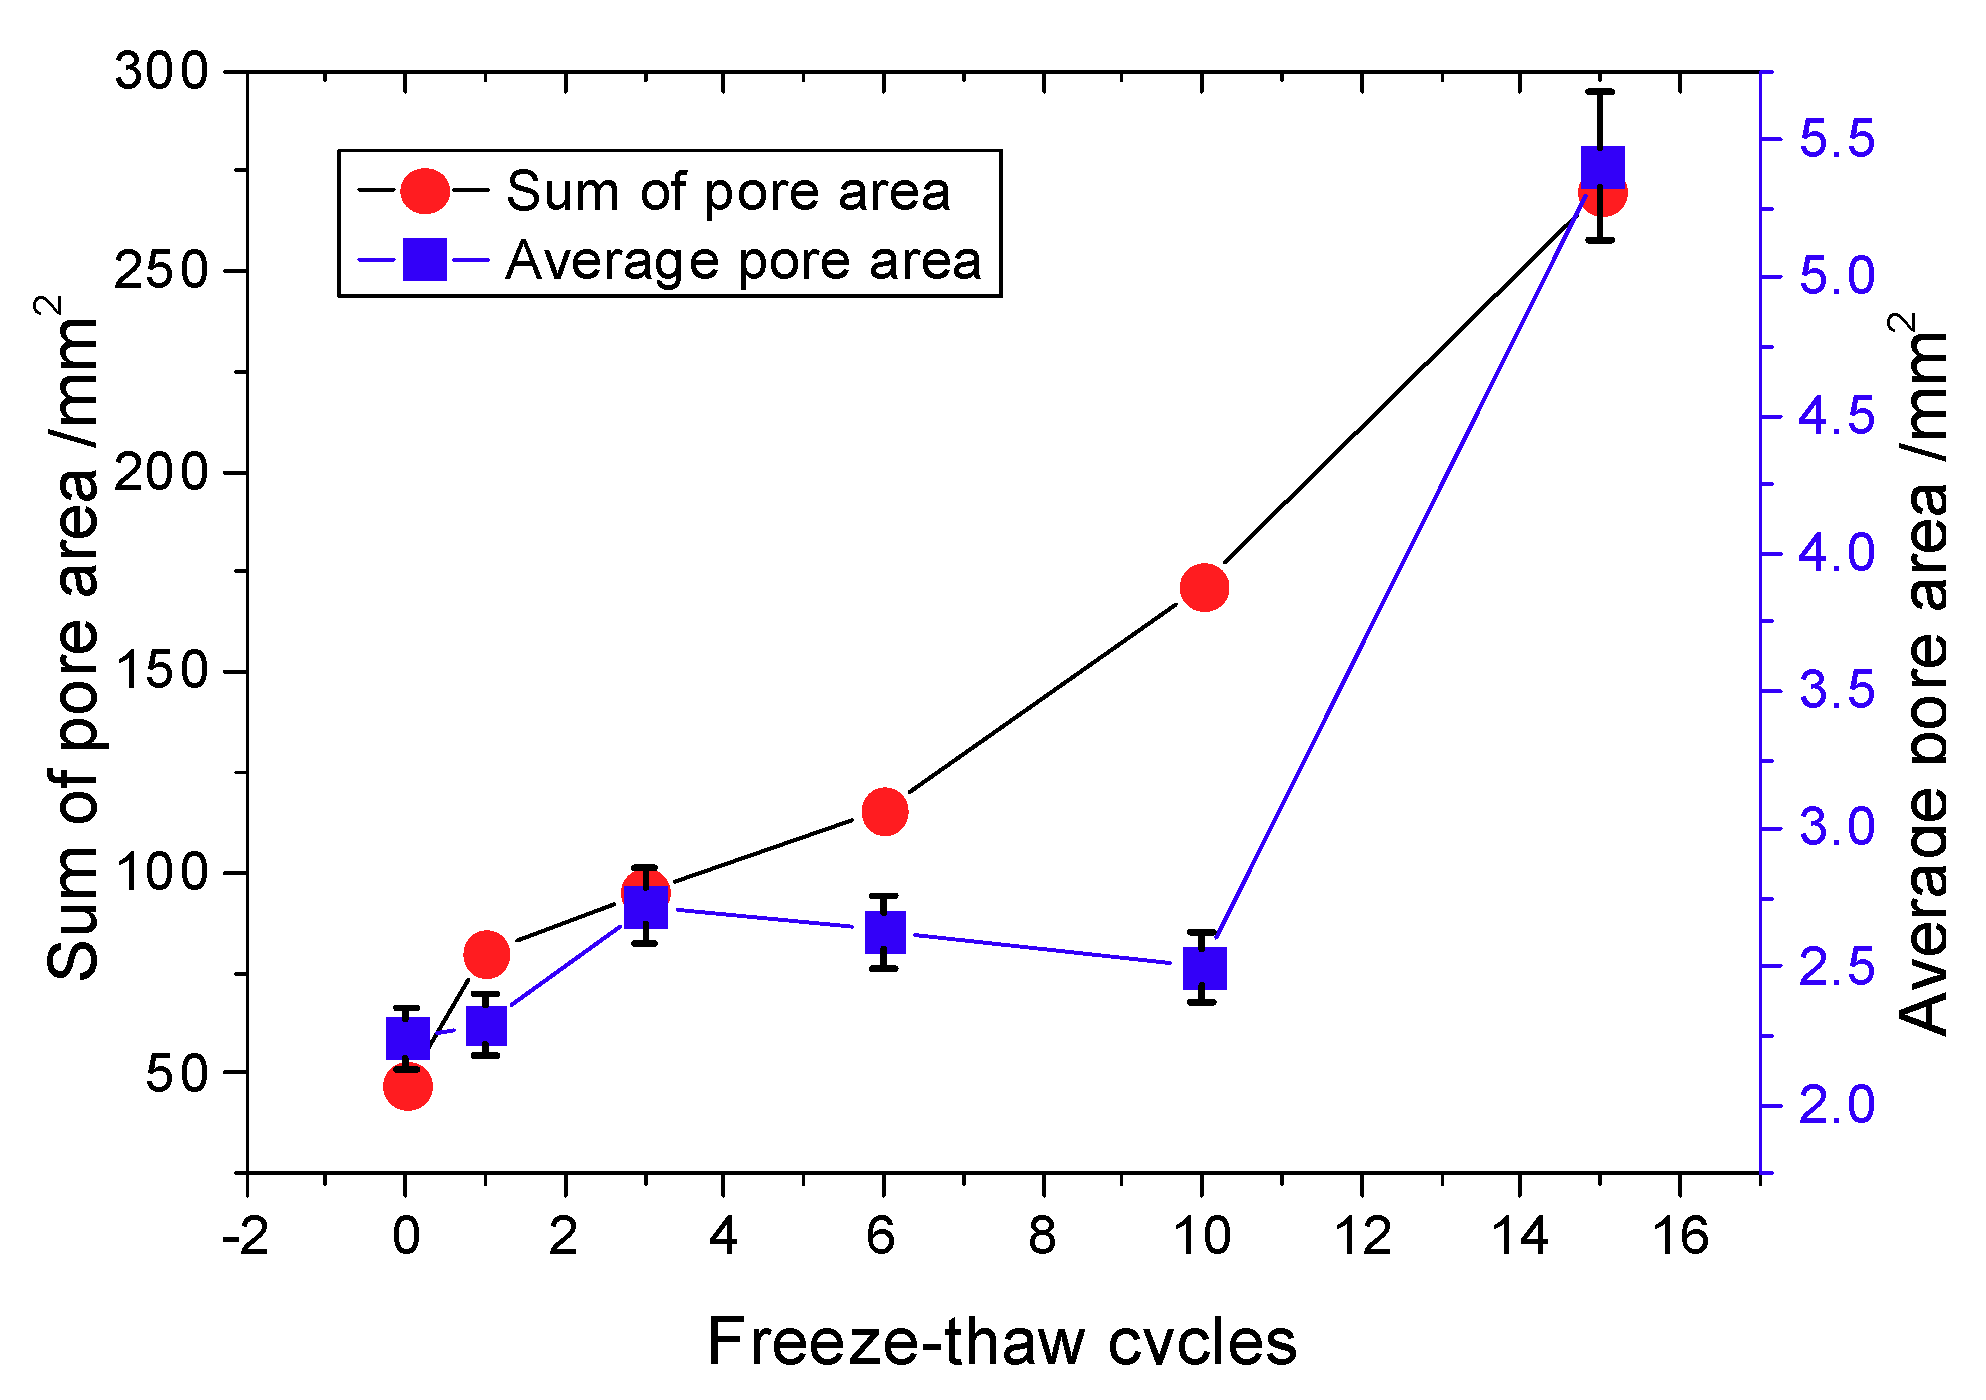
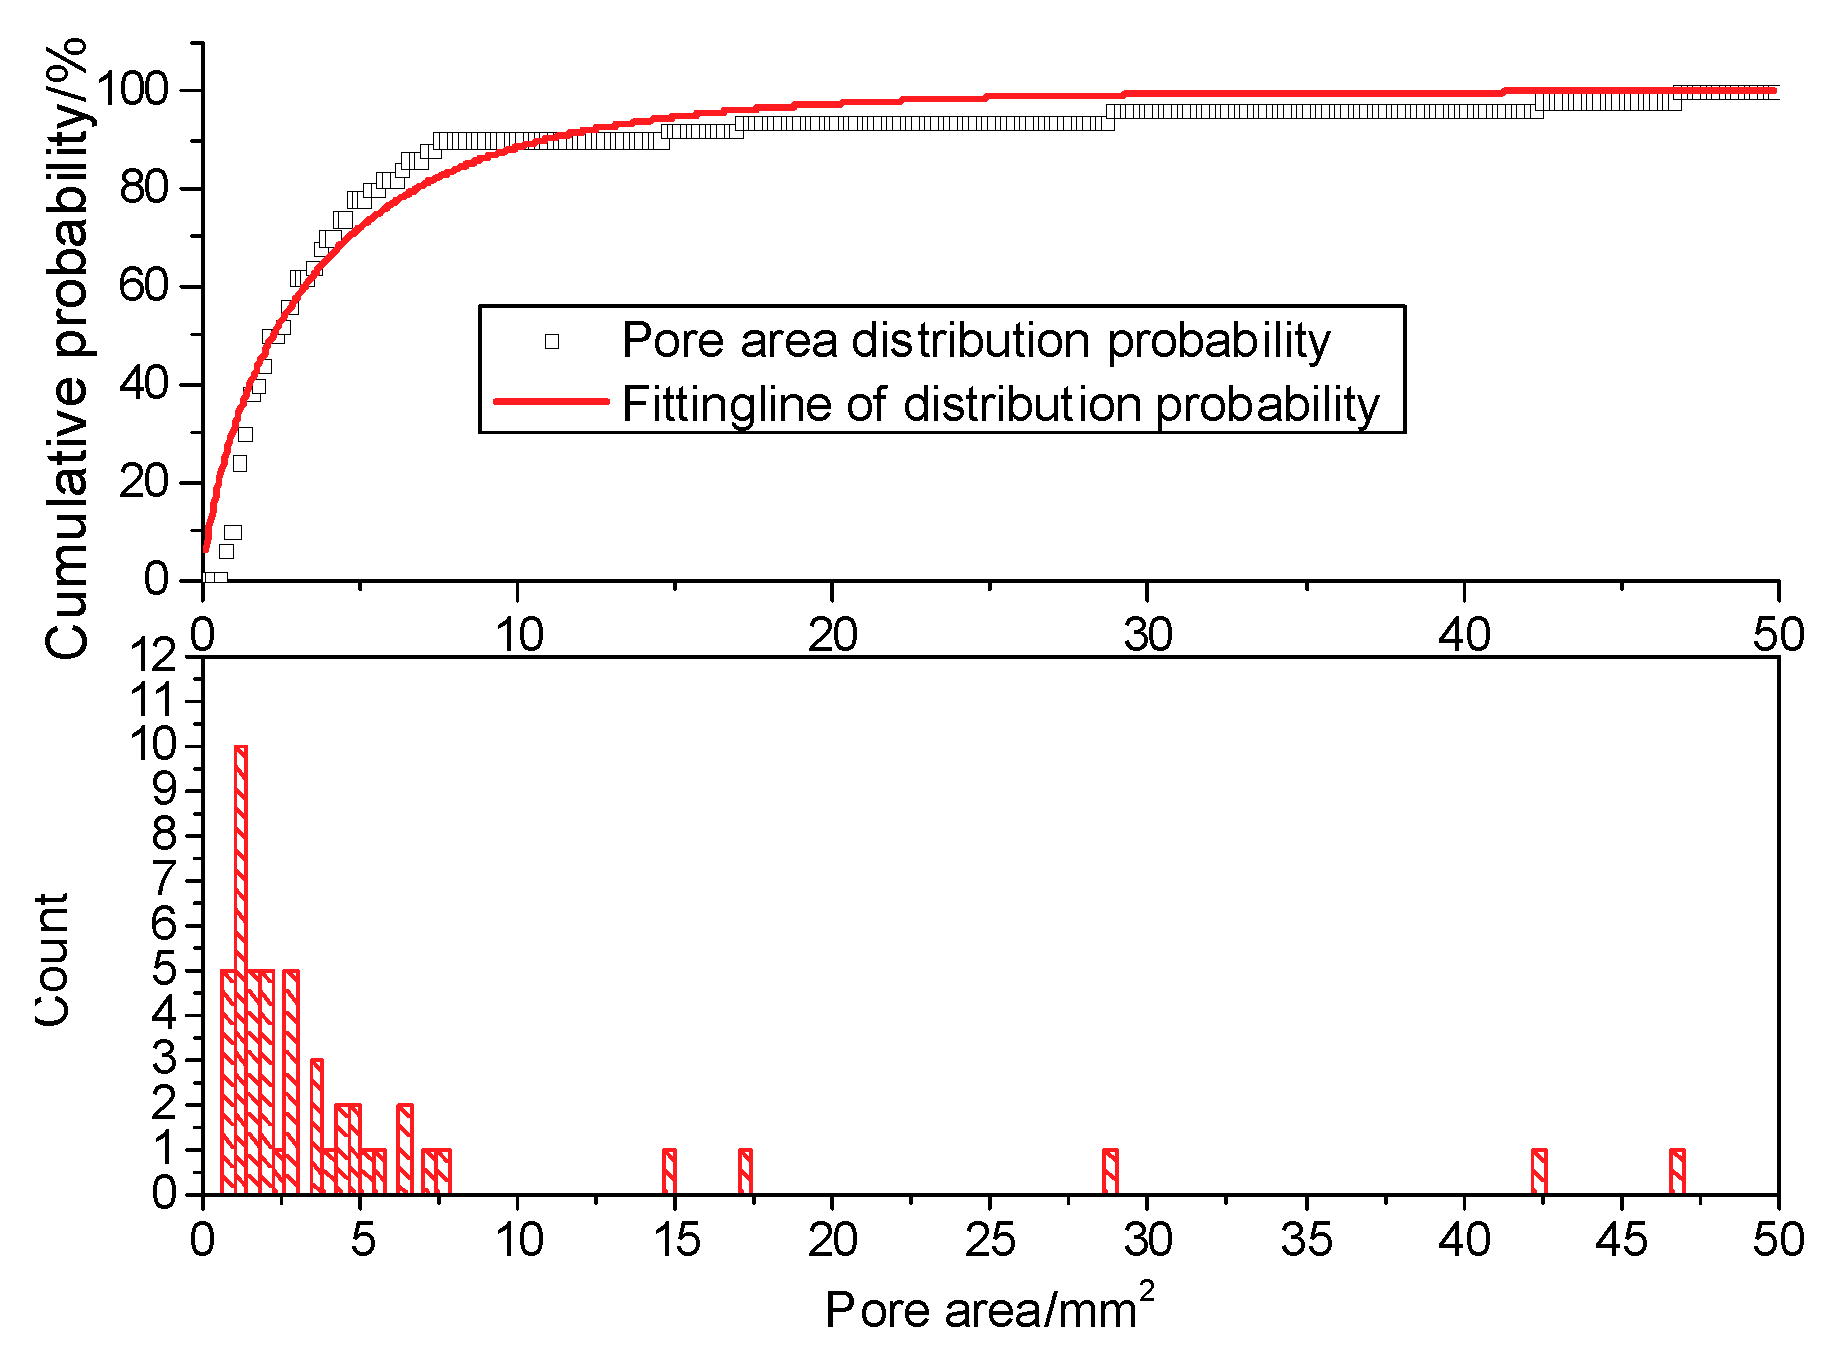
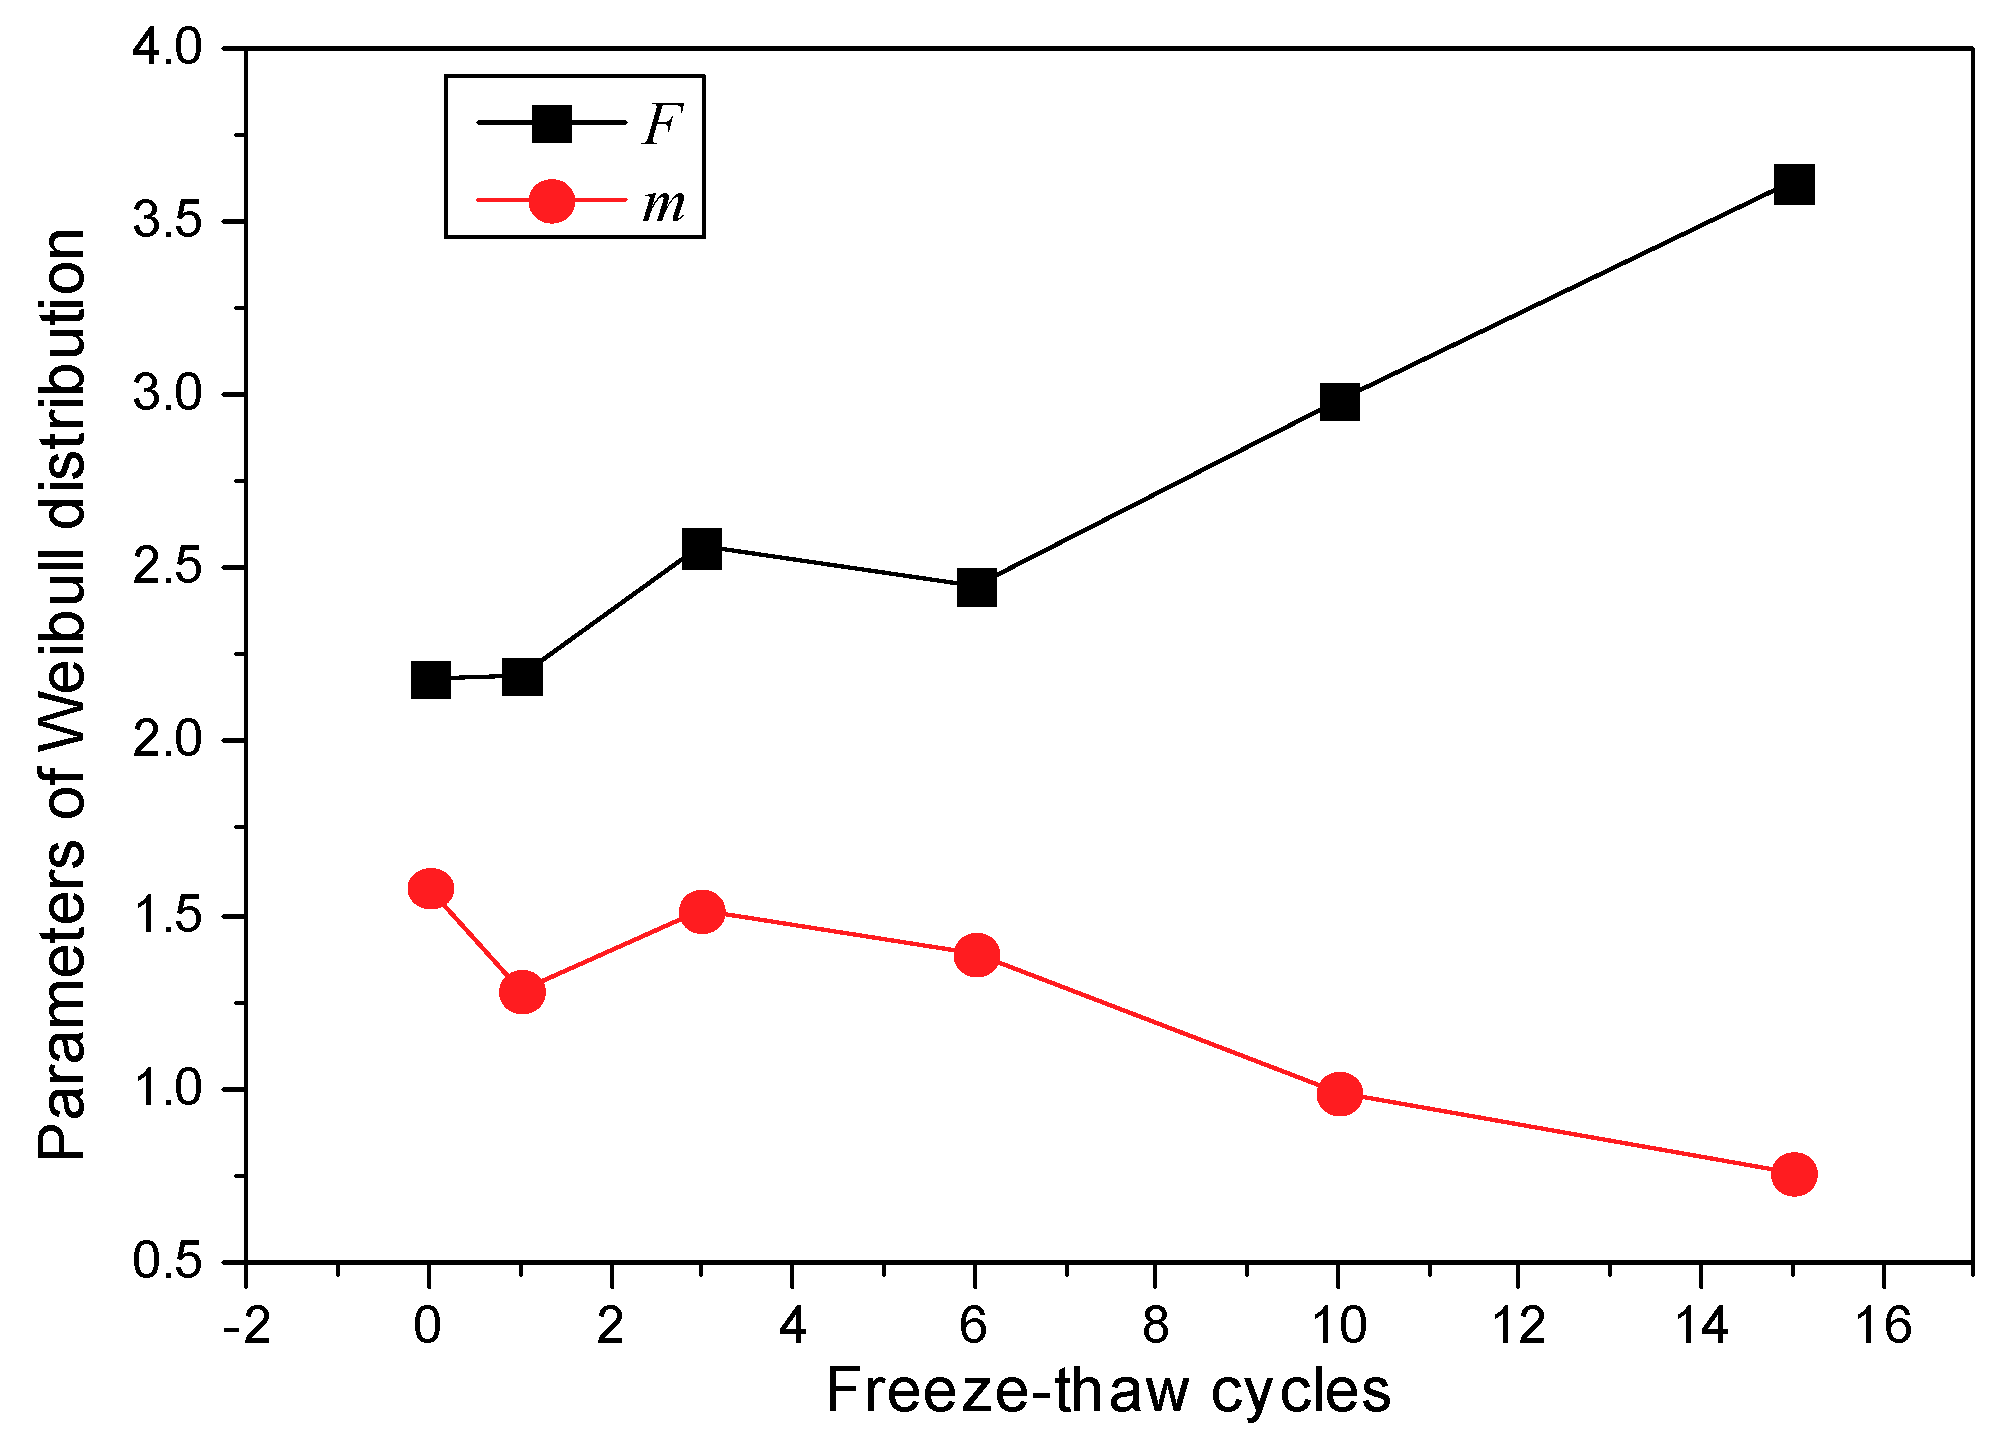
5.1. Statistical Distribution of Pore Area
5.2. Evolution of Freeze-Thaw Damage
- (a)
- The freeze-thaw damage is caused by the development of pore expansion due to the frost heaving force;
- (b)
- The density around the pore changes uniformly and continuously; and
- (c)
- The mechanical properties of the undamaged zone are isotropic.
6. Conclusions
- (1)
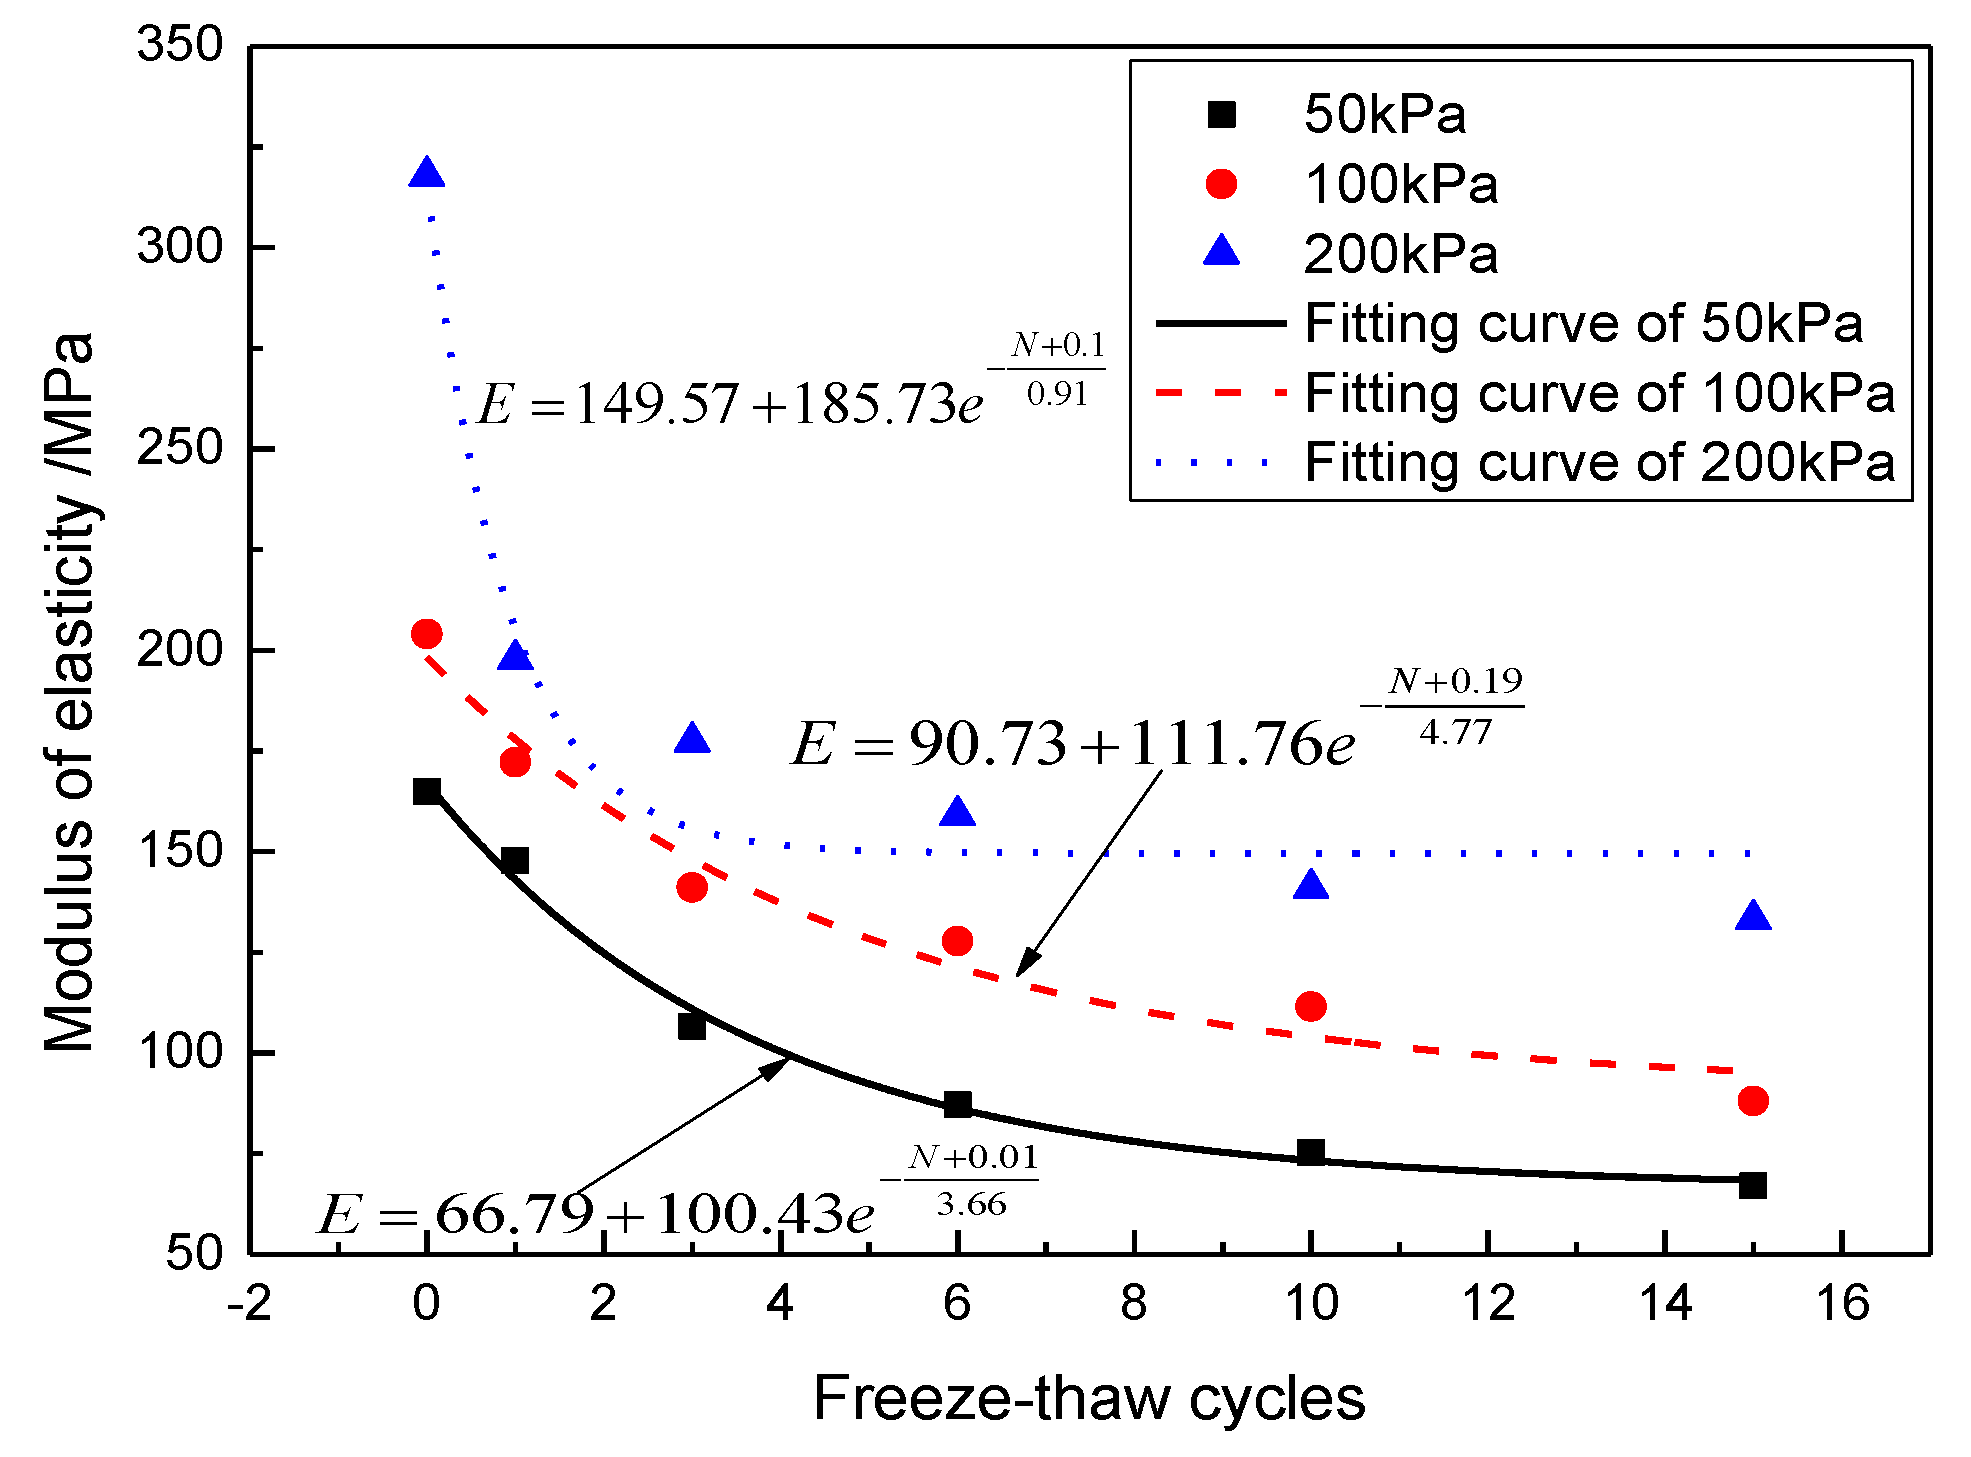
- Cohesion decreases with the increase of freeze-thaw cycle number, whereas the angle of internal friction increases with the increase of freeze-thaw cycle number. Under the confining pressure of 50 kPa, the shear strength decreases with the increase of freeze-thaw cycle number. In contrast, under the confining pressures of 100 and 200 kPa, the shear strength first decreases and then increases with the increase of freeze-thaw cycle number. The modulus of elasticity decreases with the increase of freeze-thaw cycle number at all of the three confining pressures studied here and follows the negative exponent attenuation law.
- (2)
- The range of low-density area in the CT scan images continuously expands during the freeze-thaw cycling process, and the expansion process is associated with a fractal characteristic. Specifically, the mean fractal dimension of the pore edge is between 1.08 and 1.13, and the standard deviation of fractal dimension of the pore edge is between 0.01 and 0.08.
- (3)
- The critical length of unstable cracks decreases gradually with the increase of freeze-thaw cycle number and follows the attenuation law of a negative exponential function. The coefficient of determination is up to 0.9243. The average length of damaged cracks increases predominantly after the first freeze-thaw cycle and then fluctuates during subsequent freeze-thaw cycles.
- (4)
- The total pore area increases with the increase of freeze-thaw cycle number, and the degree of freeze-thaw damage accumulates during this time. During freeze-thaw cycling, the occurrence of three distinct growth modes leads to the fluctuation of the mean pore area. The damage mechanics model reasonably describes the attenuation law of the elastic modulus after freeze-thaw cycling.
Author Contributions
Funding
Conflicts of Interest
References
- Huo, R.; Wang, Q.; Yan, J.; Li, J. Study on the Failure Mechanism of Sandstone under Freeze-Thaw Cycles Based on the Ultrasonic Test. J. Shenyang Jianzhu Univ. 2016, 32, 17–24. [Google Scholar]
- Lee, J.; Son, D.; Kwon, S.; Ryu, S.W. Evaluation of Methods to Prevent Soil on a Box Culvert from Freezing-heaving. KSCE J. Civ. Eng. 2016, 21, 1–6. [Google Scholar] [CrossRef]
- Song, S.H.; Lee, J.M. Methods of carrying out and reporting freeze thaw tests on concrete with de-icing chemicals. Matér. Constr. 1977, 10, 213–215. [Google Scholar]
- Bakholdin, B.V.; Kolesnikov, L.I.; Shikalovich, N.S. Effect of frost-heave forces of soils on the bearing capacity of pyramidal piles. Soil Mech. Found. Eng. 1989, 26, 243–248. [Google Scholar] [CrossRef]
- Uzer, A.U. Evaluation of Freezing-Thawing Cycles for Foundation Soil Stabilization. Soil Mech. Found. Eng. 2016, 53, 202–209. [Google Scholar] [CrossRef]
- Niu, F.; Luo, J.; Lin, Z.; Fang, J.; Liu, M. Thaw-induced slope failures and stability analyses in permafrost regions of the Qinghai-Tibet Plateau, China. Landslides 2016, 13, 55–65. [Google Scholar] [CrossRef]
- Luo, X.; Jiang, N.; Zuo, C.; Dai, Z.; Yan, S. Damage Characteristics of Altered and Unaltered Diabases Subjected to Extremely Cold Freeze–Thaw Cycles. Rock Mech. Rock Eng. 2014, 47, 1997–2004. [Google Scholar] [CrossRef]
- Shoukai, C.; Yongjie, Z. Study on the Evolutionary Model and Structural Simulation of the Freeze–Thaw Damage of Cemented Sand and Gravel (CSG). J. Inst. Eng. India Ser. A 2018, 99, 699–704. [Google Scholar]
- Wang, F.; Xiang, W.; Corely, T.; Yeh TC, J.; Yuan, Y. The Influences of Freeze-Thaw Cycles on the Shear Strength of Expansive Soil Treated with Ionic Soil Stabilizer. Soil Mech. Found. Eng. 2018, 55, 195–200. [Google Scholar] [CrossRef]
- Wang, S.; Ding, J.; Xu, J.; Ren, J.; Yang, Y. Shear Strength Behavior of Coarse-Grained Saline Soils after Freeze-Thaw. KSCE J. Civ. Eng. 2019, 23, 2437–2452. [Google Scholar] [CrossRef]
- Qi, J.; Yao, X.; Yu, F. Consolidation of thawing permafrost considering phase change. KSCE J. Civ. Eng. 2013, 17, 1293–1301. [Google Scholar] [CrossRef]
- Orakoglu, M.E.; Liu, J. Effect of freeze-thaw cycles on triaxial strength properties of fiber-reinforced clayey soil. KSCE J. Civ. Eng. 2017, 21, 2128–2140. [Google Scholar] [CrossRef]
- Wardeh, G.; Ghorbel, E. Prediction of fracture parameters and strain-softening behavior of concrete: Effect of frost action. Mater. Struct. 2015, 48, 123–138. [Google Scholar] [CrossRef]
- Subramaniam, K.V.; Ali-Ahmad, M.; Ghosn, M. Freeze–thaw degradation of FRP–concrete interface: Impact on cohesive fracture response. Eng. Fract. Mech. 2008, 75, 3924–3940. [Google Scholar] [CrossRef]
- Subramaniam, K.V.; Ghosn, M.; Ali-Ahmad, M. Impact of Freeze-Thaw Degradation on FRP-Concrete Interface Fracture. In Advances in Construction Materials; Springer: Berlin/Heidelberg, Germany, 2007; pp. 419–426. [Google Scholar]
- Jiang, J.; Xiang, W.; Rohn, J.; Schleier, M.; Pan, J.; Zhang, W. Research on mechanical parameters of coarse-grained sliding soil based on CT scanning and numerical tests. Landslides 2015, 13, 1261–1272. [Google Scholar] [CrossRef]
- Consoli, N.C.; Godoy, V.B.; Rosenbach, C.M.; da Silva, A.P. Effect of Sodium Chloride and Fibre-Reinforcement on the Durability of Sand–Coal Fly Ash–Lime Mixes Subjected to Freeze-Thaw Cycles. Geotech. Geol. Eng. 2019, 37, 107–120. [Google Scholar] [CrossRef]
- Wang, Y.; An, M.Z.; Yu, Z.R.; Han, S.; Ji, W.Y. Durability of reactive powder concrete under chloride-salt freeze–thaw cycling. Mater. Struct. 2017, 50, 16–24. [Google Scholar] [CrossRef]
- Molero, M.; Al-Assadi, G.; Aparicio, S.; Casati, M.J.; Hernández, M.G. Damage Assessment by Ultrasonic Images in Concrete Subjected to Freeze-Thaw Cycles. Nondestruct. Test. Mater. Struct. 2011, 6, 219–225. [Google Scholar]
- Wang, L.; Li, N.; Qi, J.; Tian, Y.; Xu, S. Study on Changes in Integrity Decay of Sandstone Subjected to Freeze-thaw Cycling. In Proceedings of China-Europe Conference on Geotechnical Engineering; Wu, W., Yu, H.S., Eds.; Springer: Cham, Switzerland, 2018. [Google Scholar]
- Guo, S.; Dai, Q.; Hiller, J. Investigation on the freeze-thaw damage to the jointed plain concrete pavement under different climate conditions. Front. Struct. Civ. Eng. 2018, 12, 227–238. [Google Scholar] [CrossRef]
- Todak, H.N.; Tsui, M.; Ley, M.T.; Weiss, W.J. Evaluating Freeze-Thaw Damage in Concrete with Acoustic Emissions and Ultrasonics. In Advances in Acoustic Emission Technology; Springer: Cham, Switzerland, 2017; Volume 179, pp. 175–189. [Google Scholar]
- Ludwik, G.G. The influence of microcrack width on the mechanical parameters in concrete with the addition of fly ash: Consideration of technological and ecological benefits. Constr. Build. Mater. 2018, 197, 849–861. [Google Scholar]
- Golewski, G.L.; Sadowski, T. A failure analysis of concrete composites incorporating fly ash during torsional loading. Compos. Struct. 2017, 183, 527–535. [Google Scholar]
- Wang, S.; Liu, B.; Zhao, P.; Lu, L.; Cheng, X. Effect of early-strength-enhancing agents on setting time and early mechanical strength of belite–barium calcium sulfoaluminate cement. J. Therm. Anal. Calorim. 2017, 131, 2337–2343. [Google Scholar] [CrossRef]
- Quiroga, A.J.; Thompson, Z.M.; Muraleetharan, K.K.; Miller, G.A.; Cerato, A.B. Stress-strain behavior of cement-improved clays: Testing and modeling. Acta Geotech. 2017, 12, 1003–1020. [Google Scholar] [CrossRef]
- Chen, J.; Bharata, R.; Yin, T.; Wang, Q.; Wang, H.; Zhang, T. Assessment of sulfate attack and freeze–thaw cycle damage of cement-based materials by a nonlinear acoustic technique. Mater. Struct. 2017, 50, 949–958. [Google Scholar] [CrossRef]
- Zhang, X.B.; Shang, J.Z.; Chen, X.; Zhang, C. Statistical Inference of Varying-stress Accelerated Life Test with Competing Failures Based on Three-parameter Weibull Distribution. J. Mech. Eng. 2014, 50, 42–49. (In Chinese) [Google Scholar] [CrossRef]
- Goi, Y.; Kim, C.W. Damage detection of a truss bridge utilizing a damage indicator from multivariate autoregressive model. J. Civ. Struct. Health Monit. 2017, 7, 153–162. [Google Scholar] [CrossRef]
- Badrkhani Ajaei, B.; Ghassemieh, M. Reinforcing fillet welds preventing cracks in partial joint penetration welds. Int. J. Steel Struct. 2015, 15, 487–497. [Google Scholar] [CrossRef]


| Moisture Content (%) | Gravity (kN·m−3) | Liquid Limit (%) | Plastic Limit (%) | Maximum Dry Weight (kN·m−3) | Compressive Modulus (MPa) | Cohesive Force (kPa) | Internal Friction Angle (°) |
|---|---|---|---|---|---|---|---|
| 21.2 | 20.1 | 48.3 | 22.6 | 18.1 | 19.8 | 0.2 | 31.4 |
| Chemical Composition | Na2O | MgO | Al2O3 | SiO2 | CaO | K2O | Others |
|---|---|---|---|---|---|---|---|
| Content/% | 2.16 | 1.34 | 24.45 | 63.5 | 3.51 | 2.09 | 2.95 |
| Freeze-Thaw Cycles | Height/mm | Volume/mm3 | Mass/g |
|---|---|---|---|
| 0 | 80.00 | 96,009.27 | 182.41 |
| 1 | 80.36 | 96,030.12 | 179.85 |
| 3 | 80.74 | 96,060.85 | 177.59 |
| 6 | 80.89 | 96,084.21 | 176.76 |
| 10 | 80.98 | 96,093.65 | 176.51 |
| 15 | 81.02 | 96,102.31 | 175.81 |
| Color | Intensity | CT Value (Hu) | Medium |
|---|---|---|---|
 | High | 1400–2500 | Particle skeleton |
 | Relatively high | 700–1400 | Transitional area |
 | Medium | 0–700 | Pore water |
 and and  | Low | −700–0 | Pore |
| Freeze-Thaw Cycles | m | F | R2 |
|---|---|---|---|
| 0 | 2.18 | 1.58 | 0.9874 |
| 1 | 2.19 | 1.28 | 0.9817 |
| 3 | 2.56 | 1.51 | 0.9817 |
| 6 | 2.45 | 1.39 | 0.9839 |
| 10 | 2.98 | 0.99 | 0.9597 |
| 15 | 3.61 | 0.76 | 0.9326 |
© 2019 by the authors. Licensee MDPI, Basel, Switzerland. This article is an open access article distributed under the terms and conditions of the Creative Commons Attribution (CC BY) license (http://creativecommons.org/licenses/by/4.0/).
Share and Cite
Li, J.; Wang, F.; Yi, F.; Wu, F.; Liu, J.; Lin, Z. Effect of Freeze-Thaw Cycles on Triaxial Strength Property Damage to Cement Improved Aeolian Sand (CIAS). Materials 2019, 12, 2801. https://doi.org/10.3390/ma12172801
Li J, Wang F, Yi F, Wu F, Liu J, Lin Z. Effect of Freeze-Thaw Cycles on Triaxial Strength Property Damage to Cement Improved Aeolian Sand (CIAS). Materials. 2019; 12(17):2801. https://doi.org/10.3390/ma12172801
Chicago/Turabian StyleLi, Jun, Fengchi Wang, Fu Yi, Fengyuan Wu, Jiashun Liu, and Zhenhuan Lin. 2019. "Effect of Freeze-Thaw Cycles on Triaxial Strength Property Damage to Cement Improved Aeolian Sand (CIAS)" Materials 12, no. 17: 2801. https://doi.org/10.3390/ma12172801
APA StyleLi, J., Wang, F., Yi, F., Wu, F., Liu, J., & Lin, Z. (2019). Effect of Freeze-Thaw Cycles on Triaxial Strength Property Damage to Cement Improved Aeolian Sand (CIAS). Materials, 12(17), 2801. https://doi.org/10.3390/ma12172801