Effect of Fiber Hybridization, Strain Rate and w/c Ratio on the Impact Behavior of Hybrid FRC

Abstract
1. Introduction
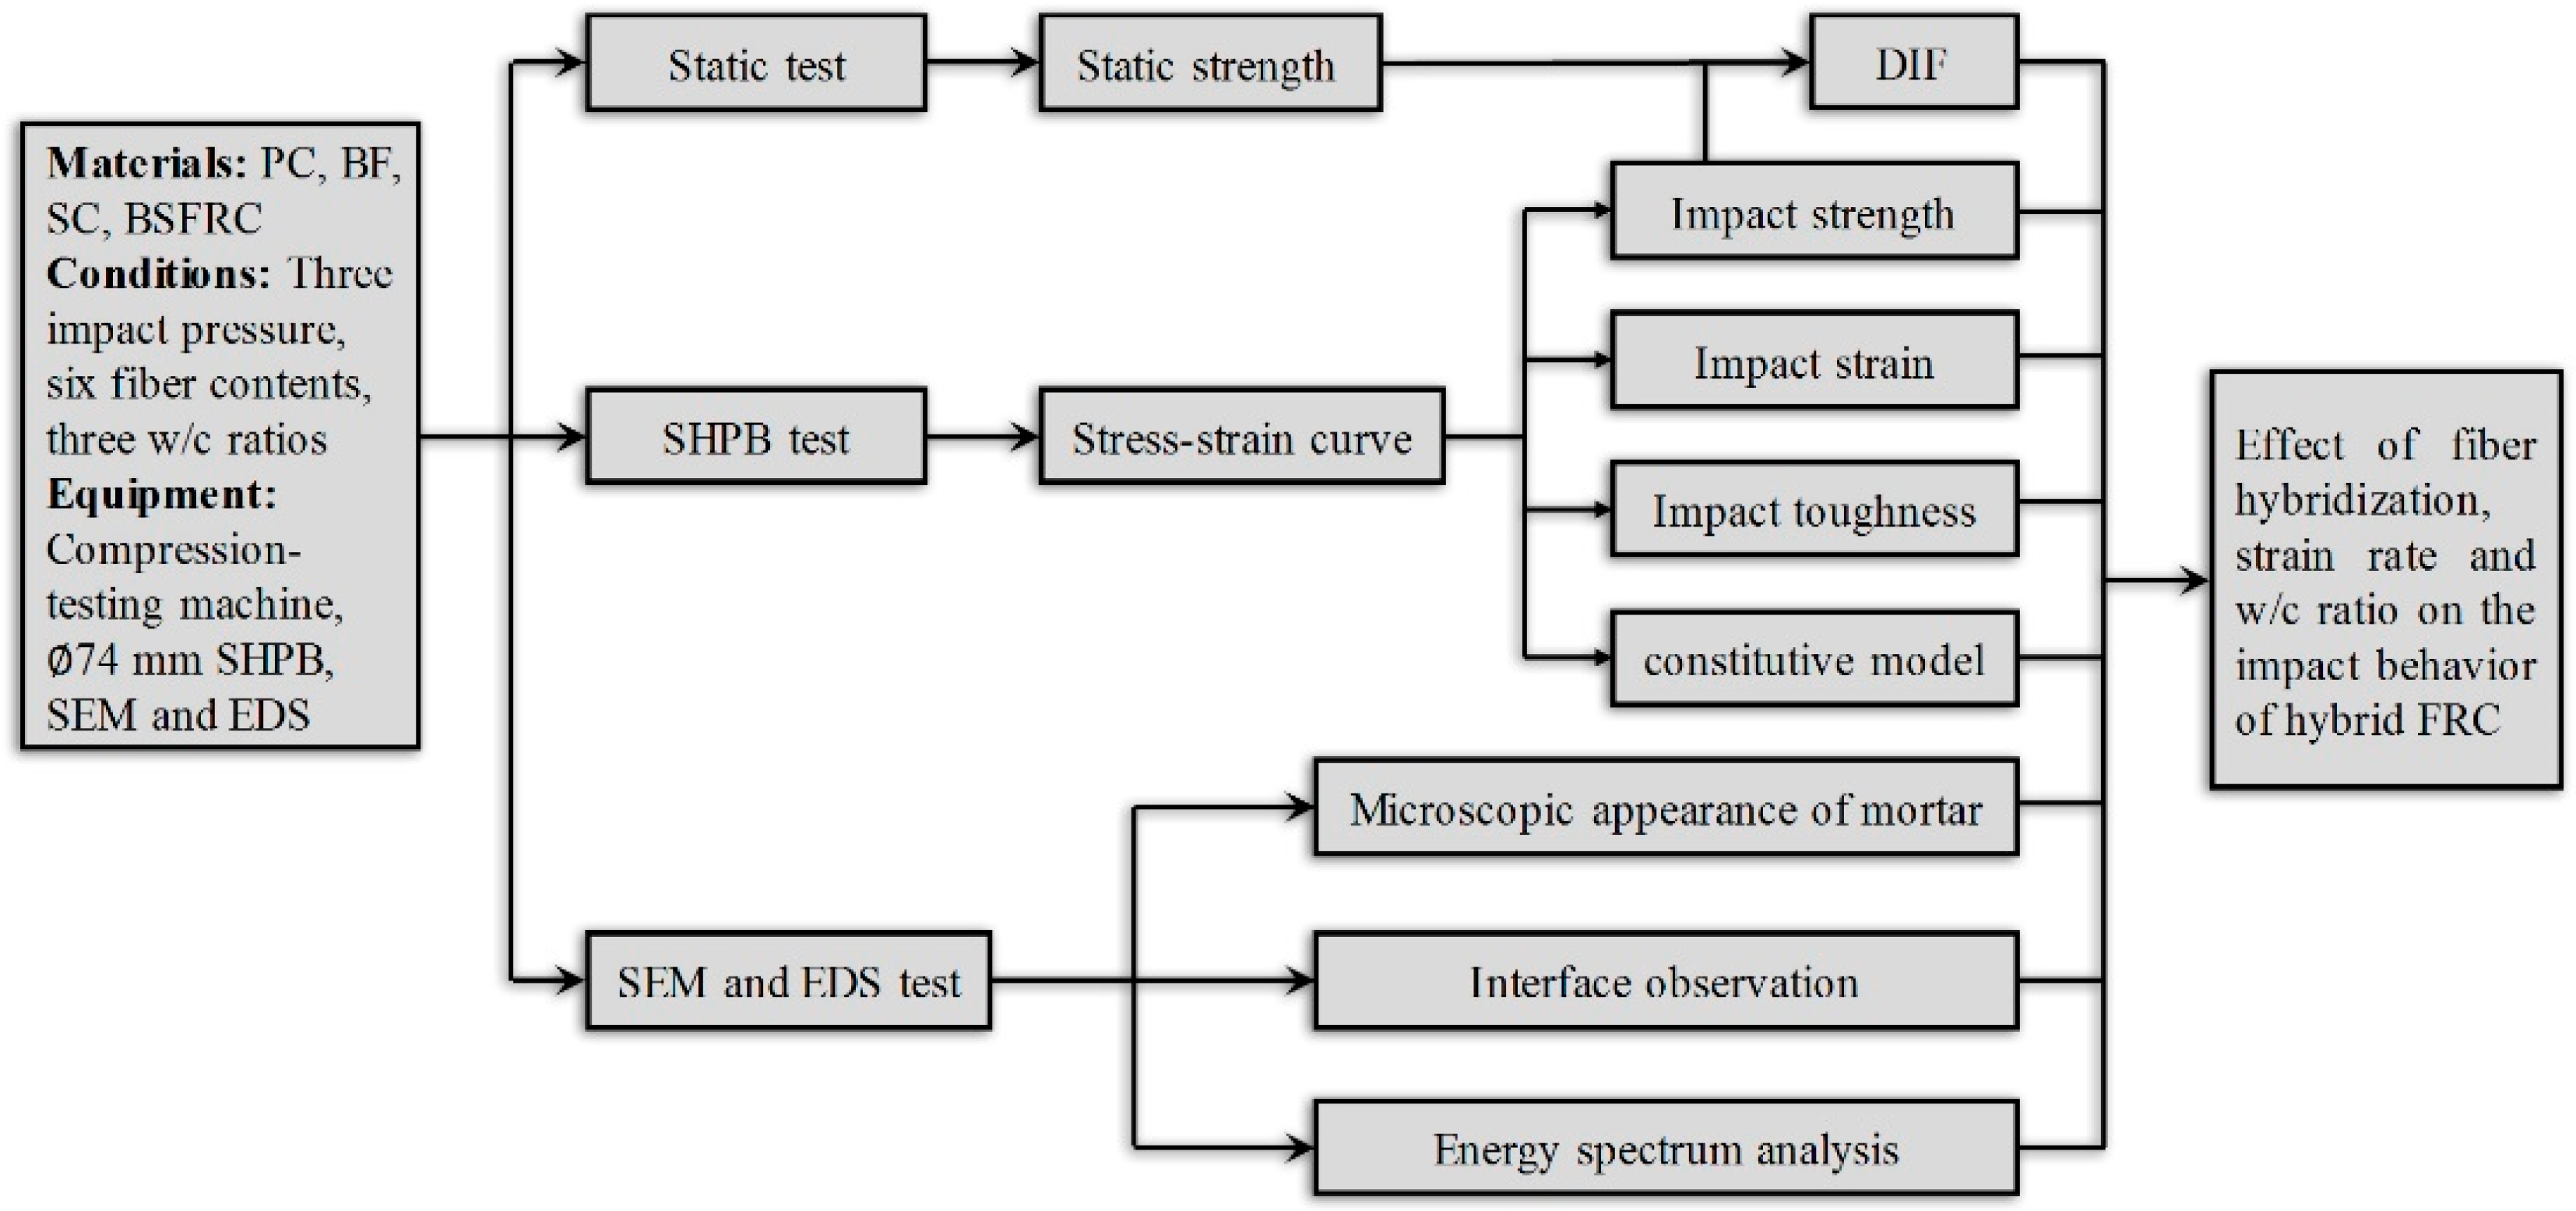
2. Experiment Framework
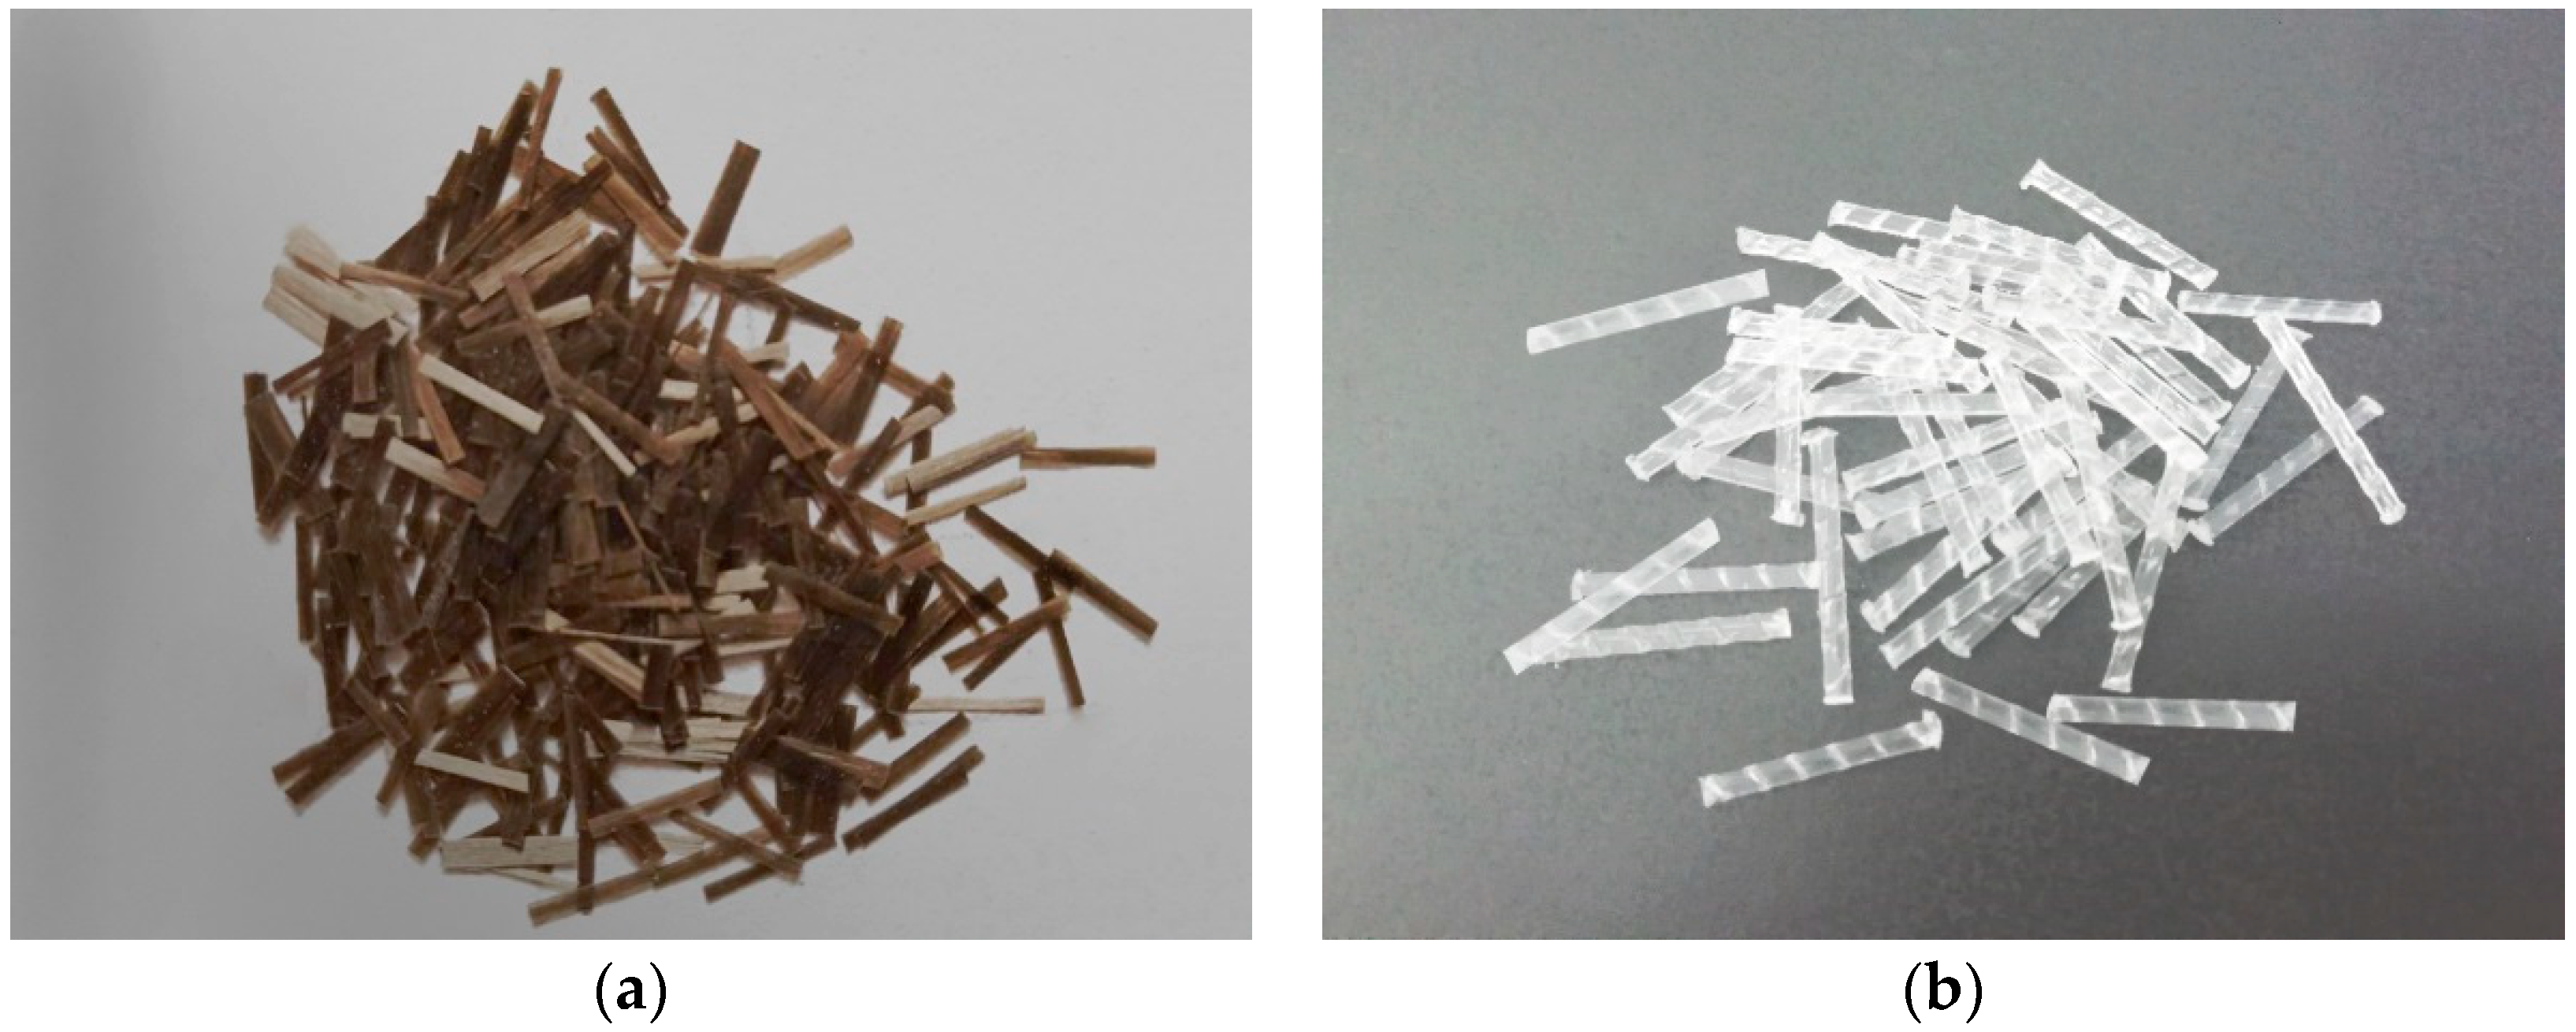
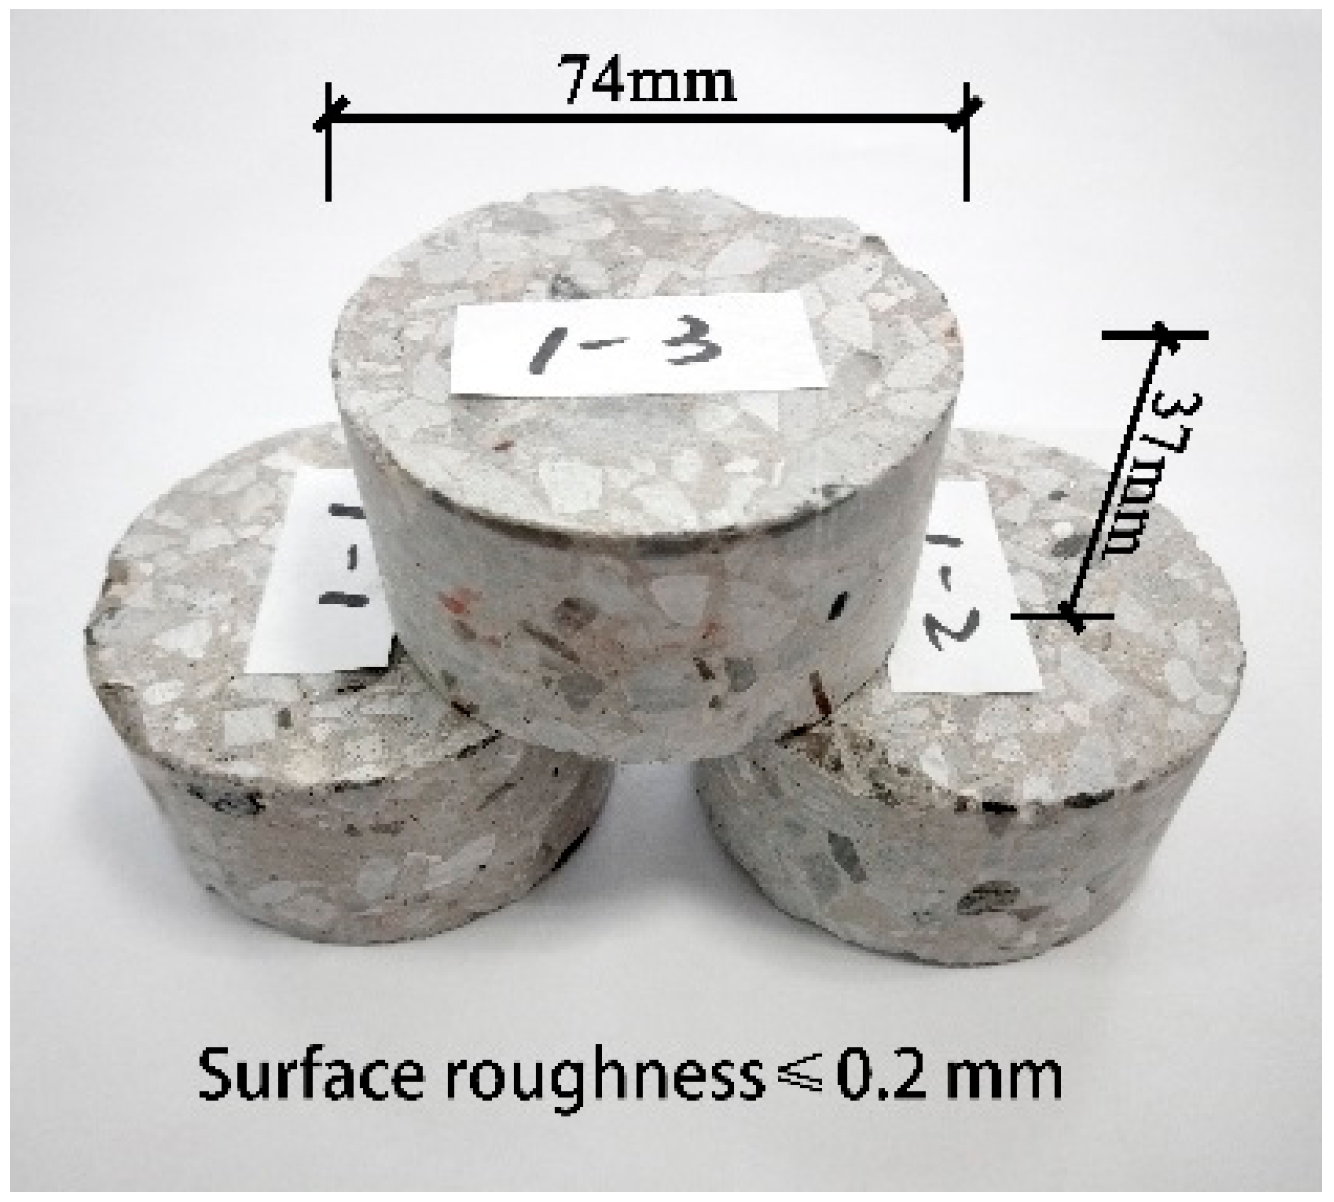
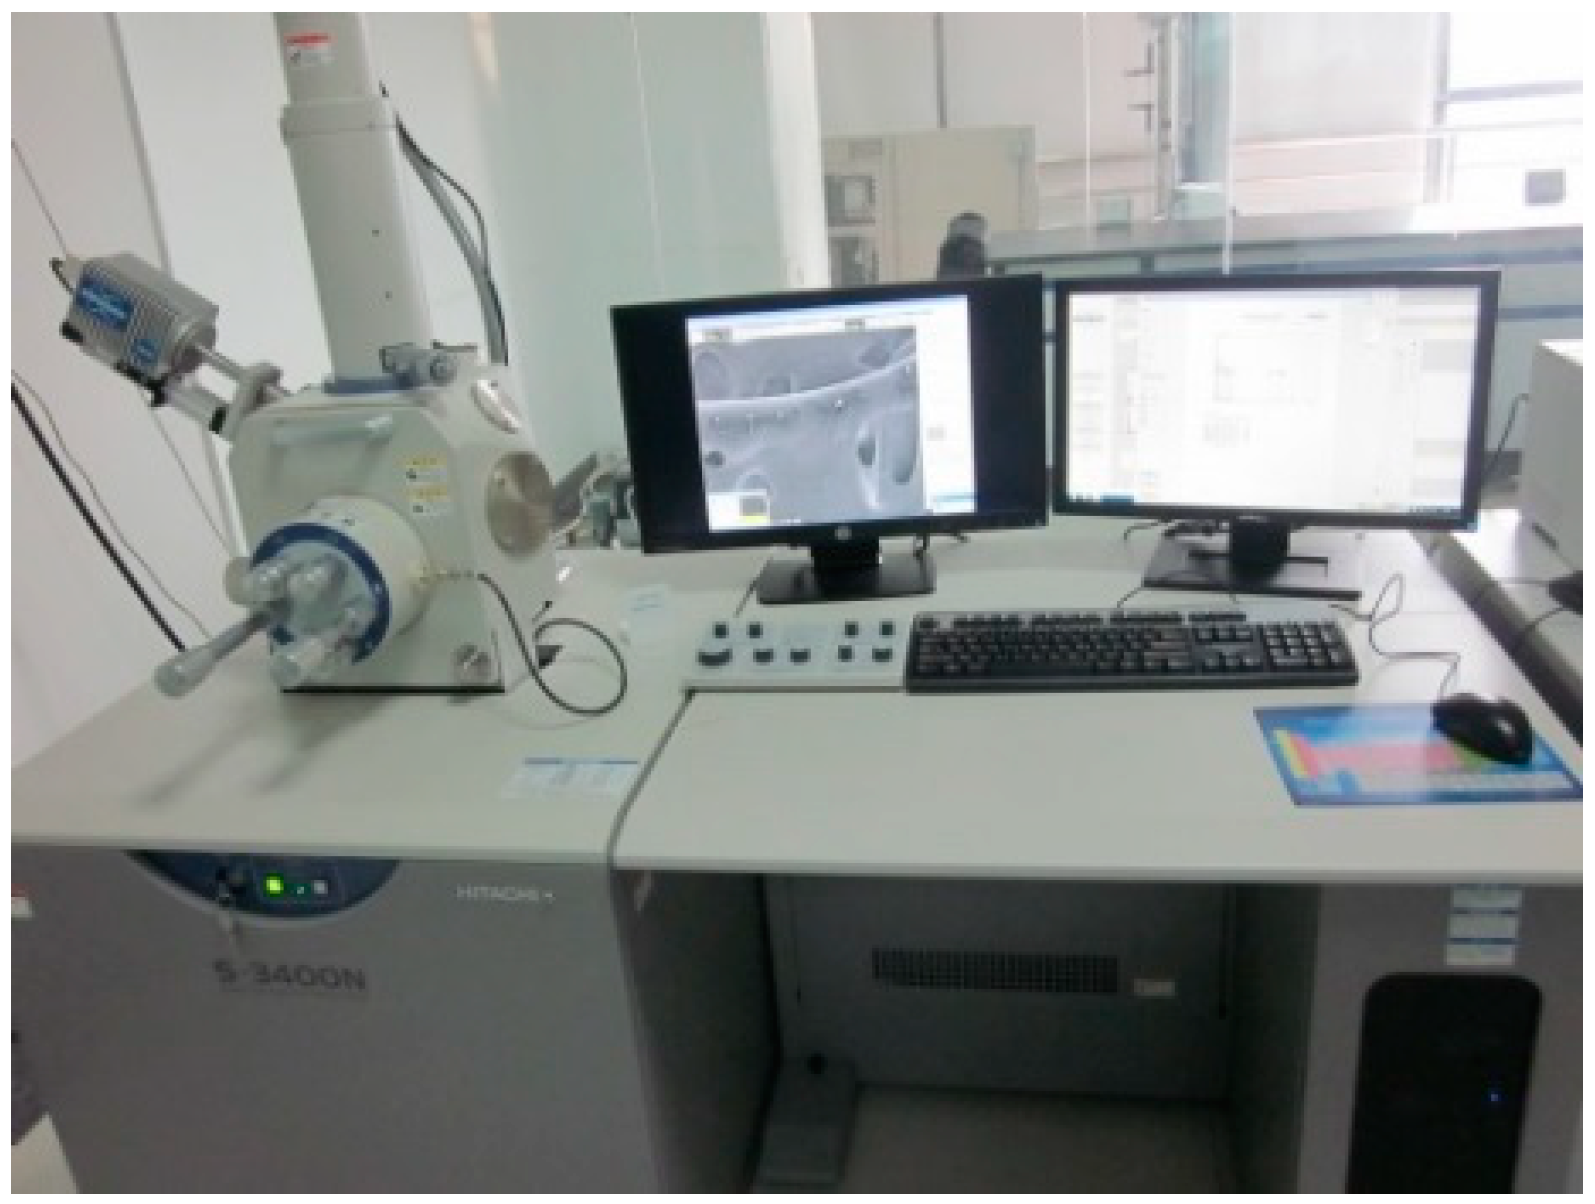
2.1. Materials and Specimens Preparation
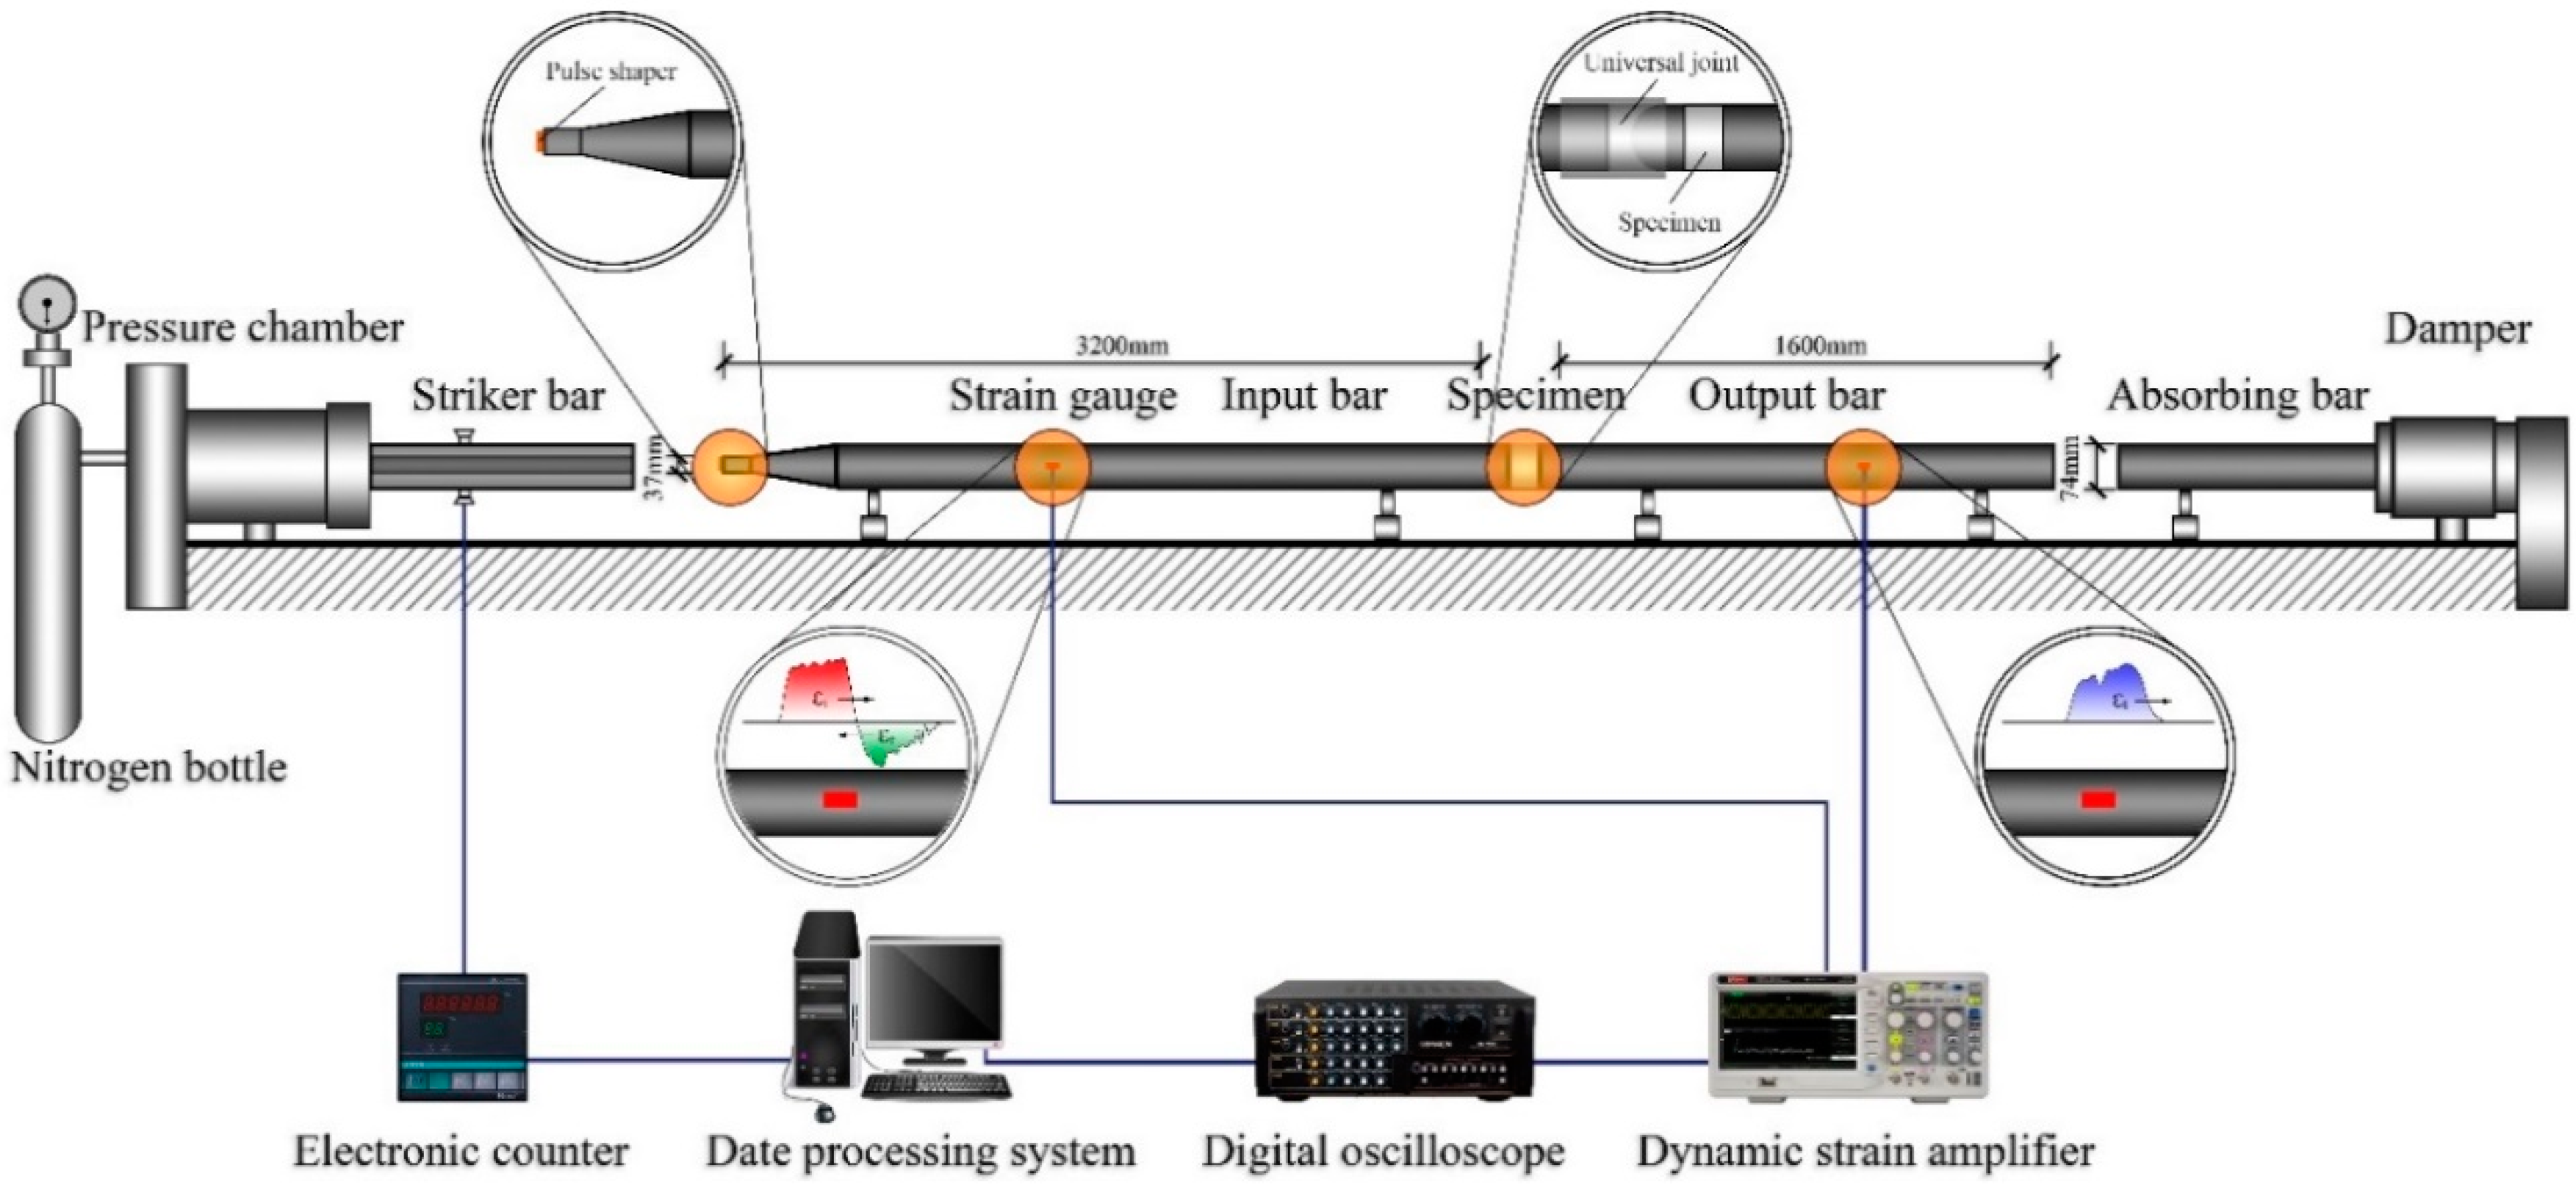
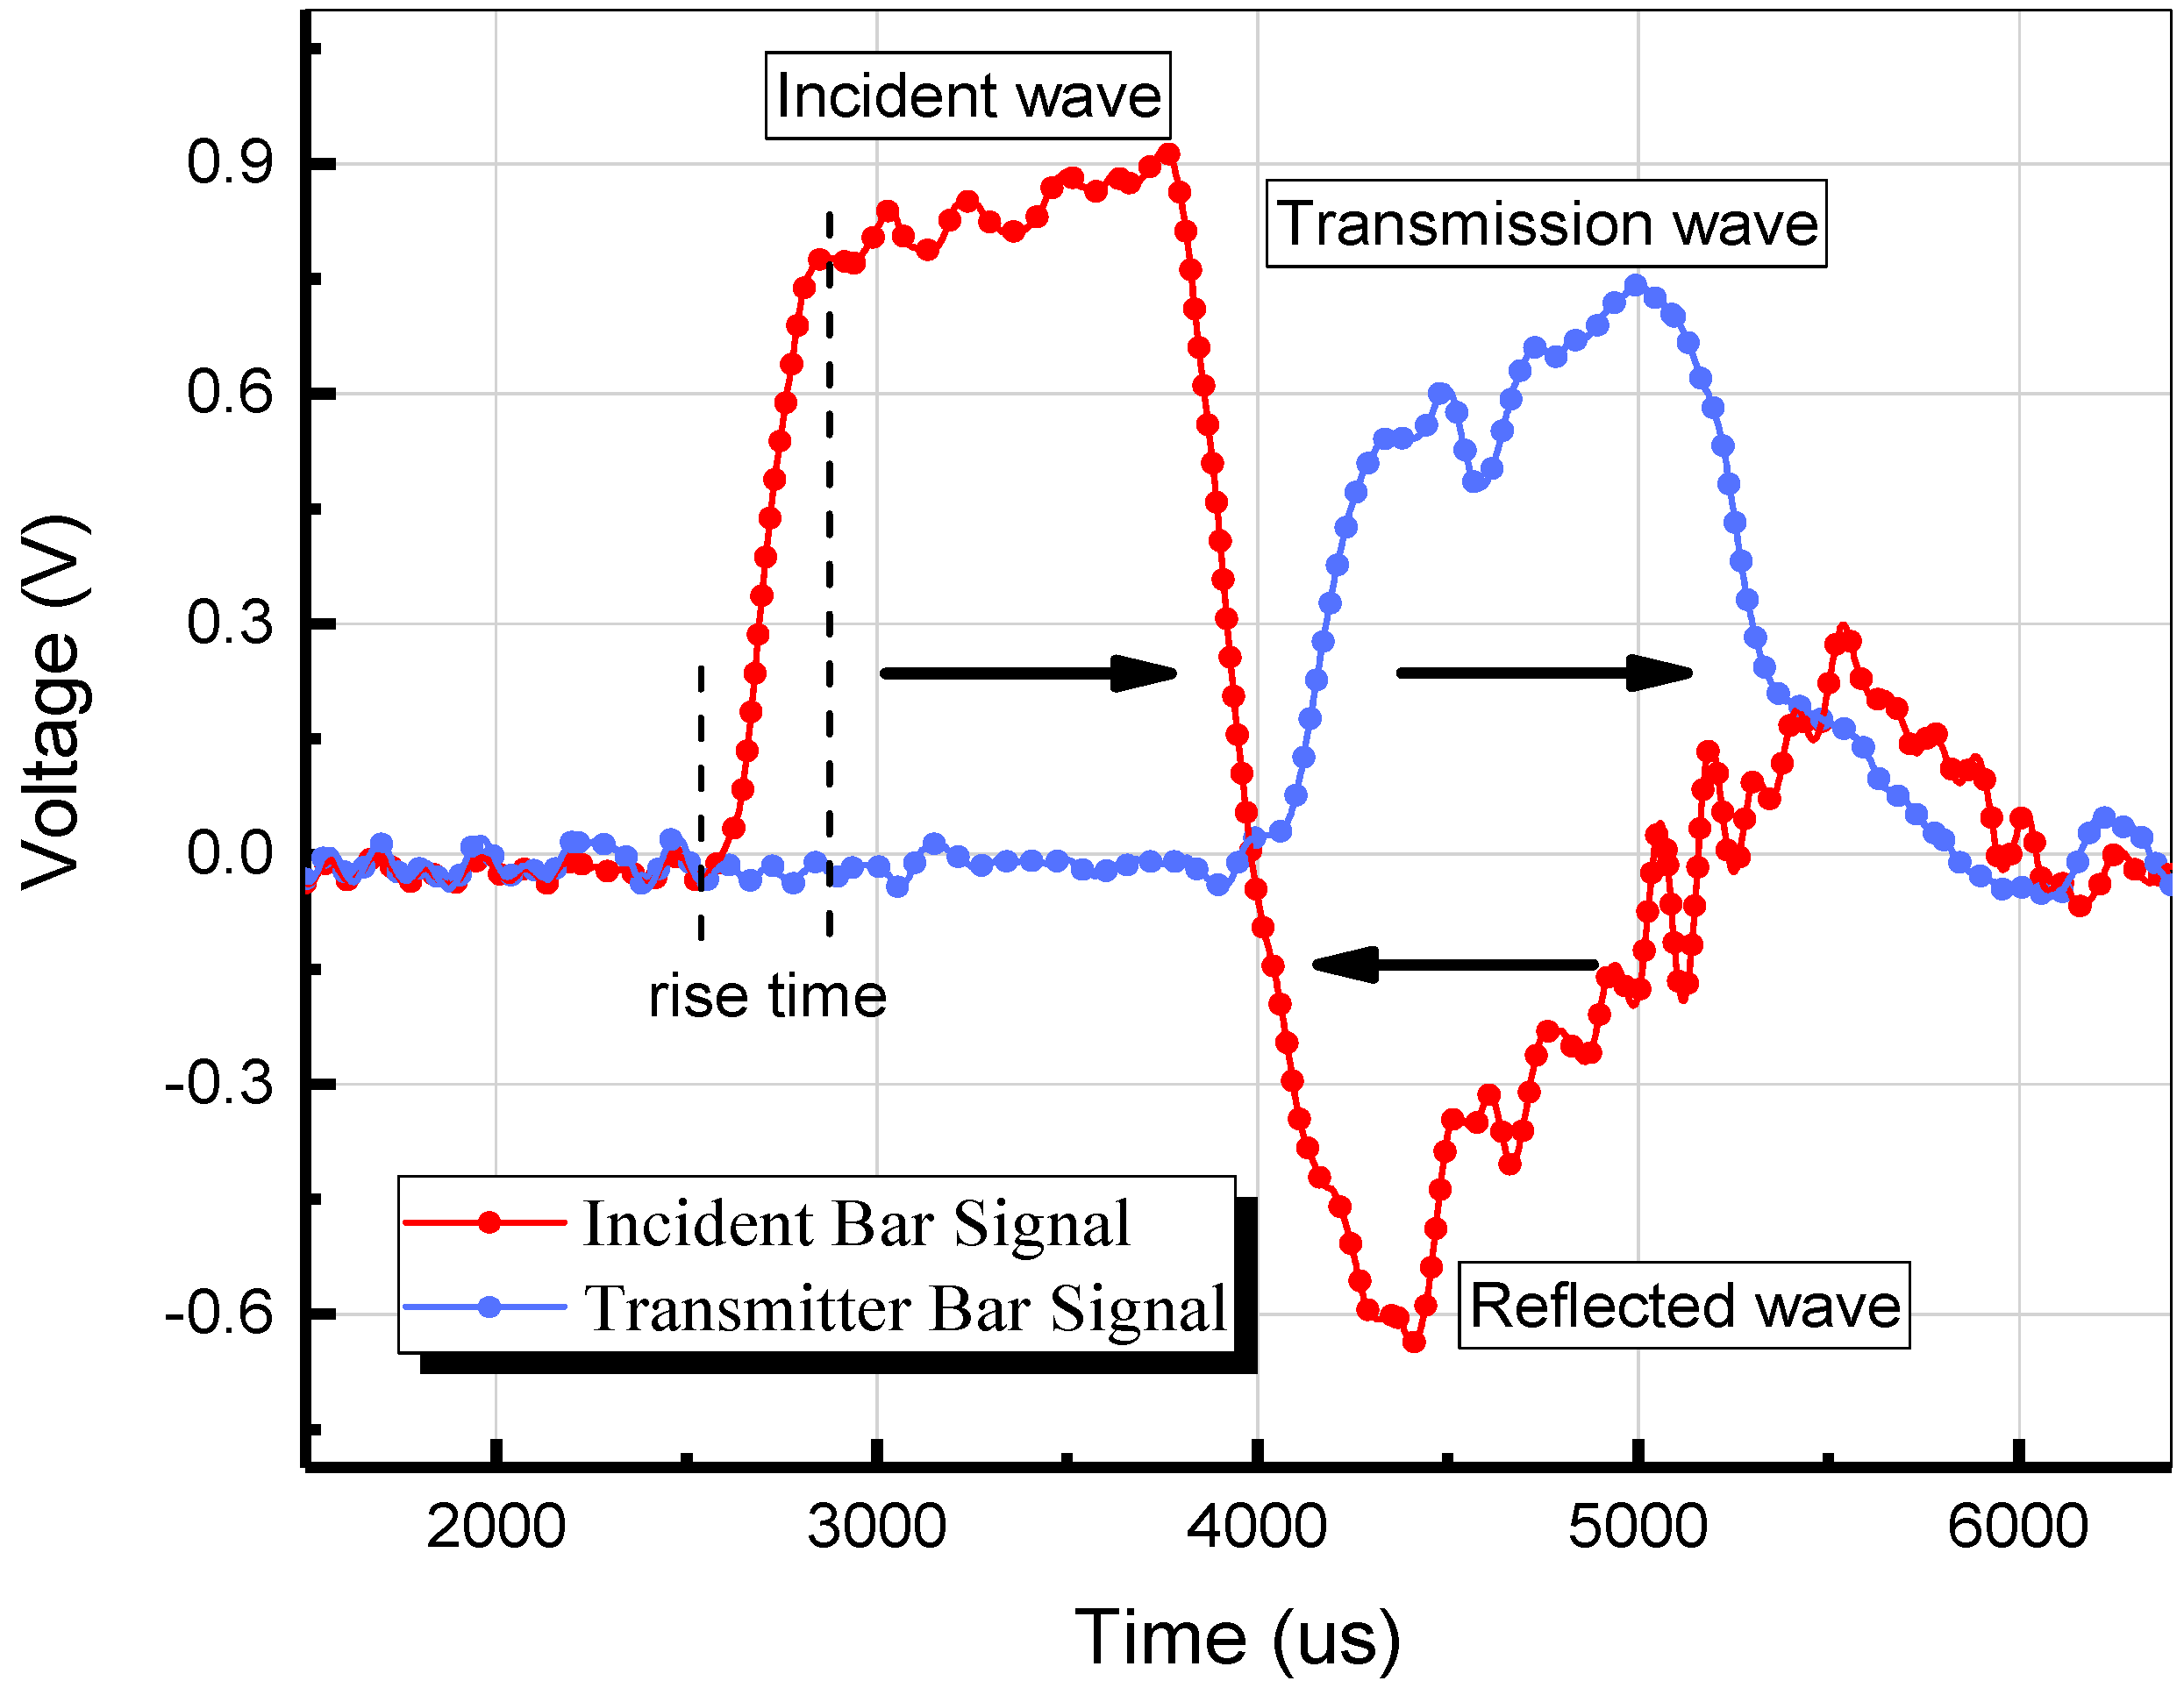
2.2. Basic Principle of SHPB Test
3. Discussions
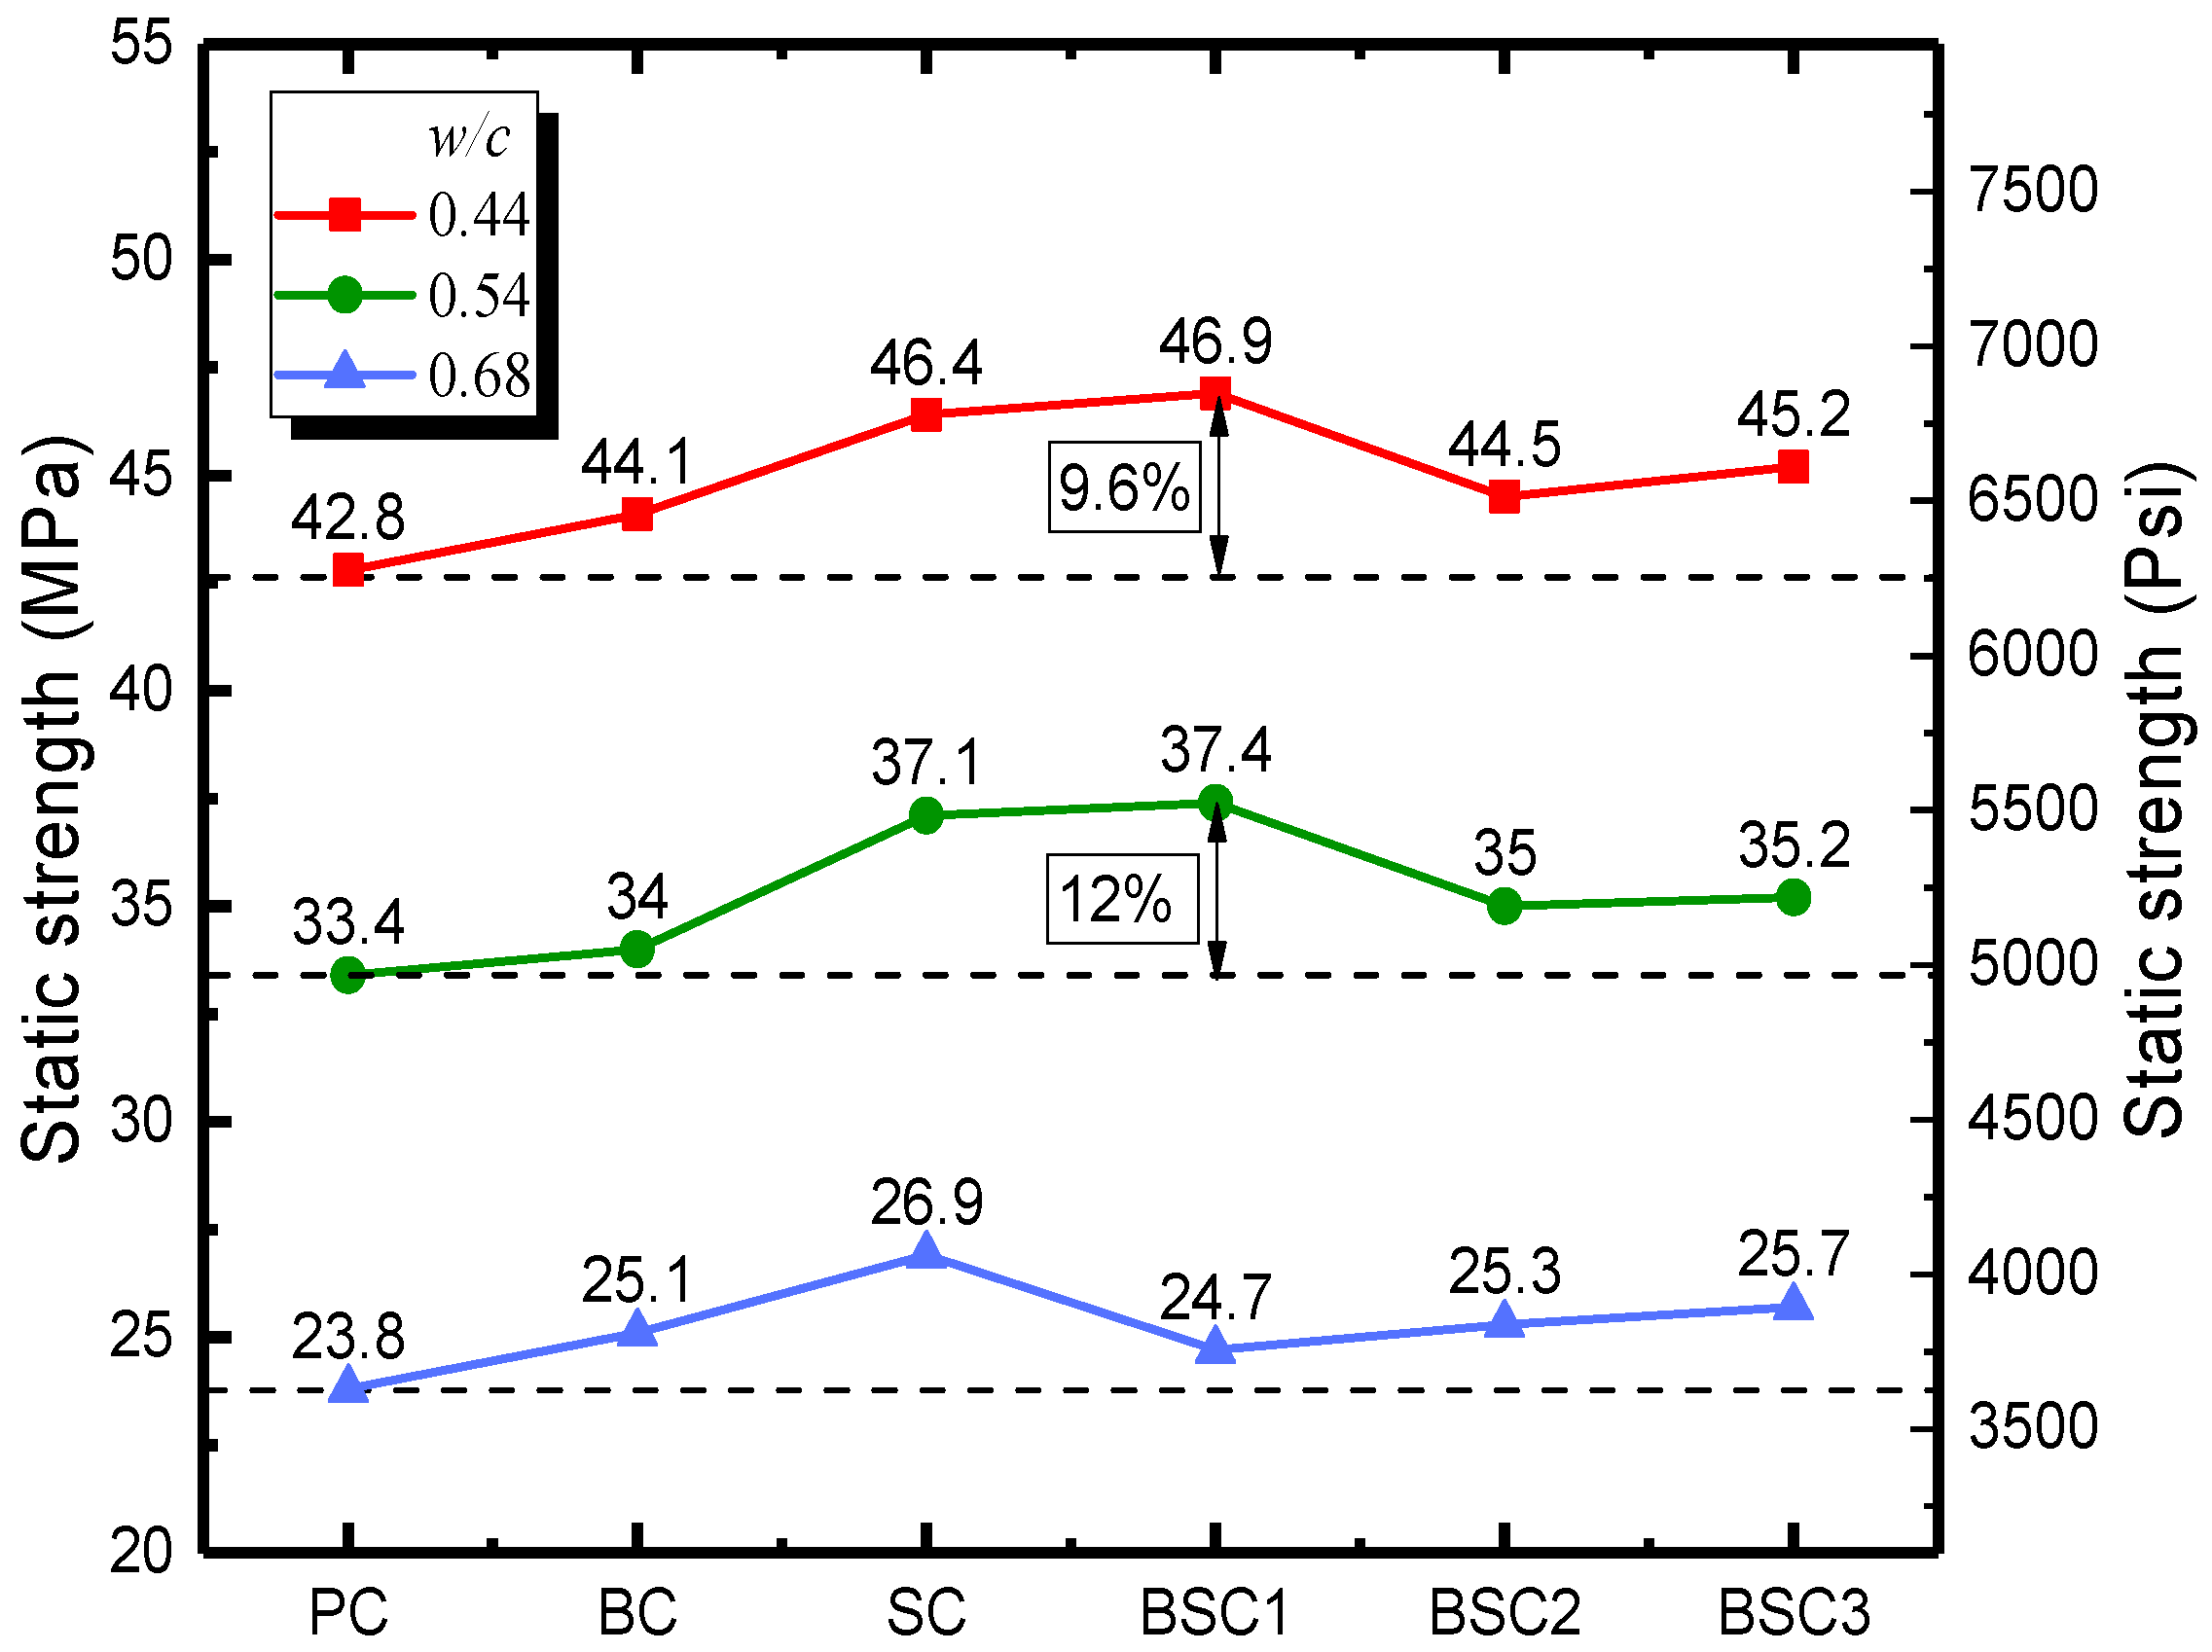
3.1. Static Test
3.2. Impact Test
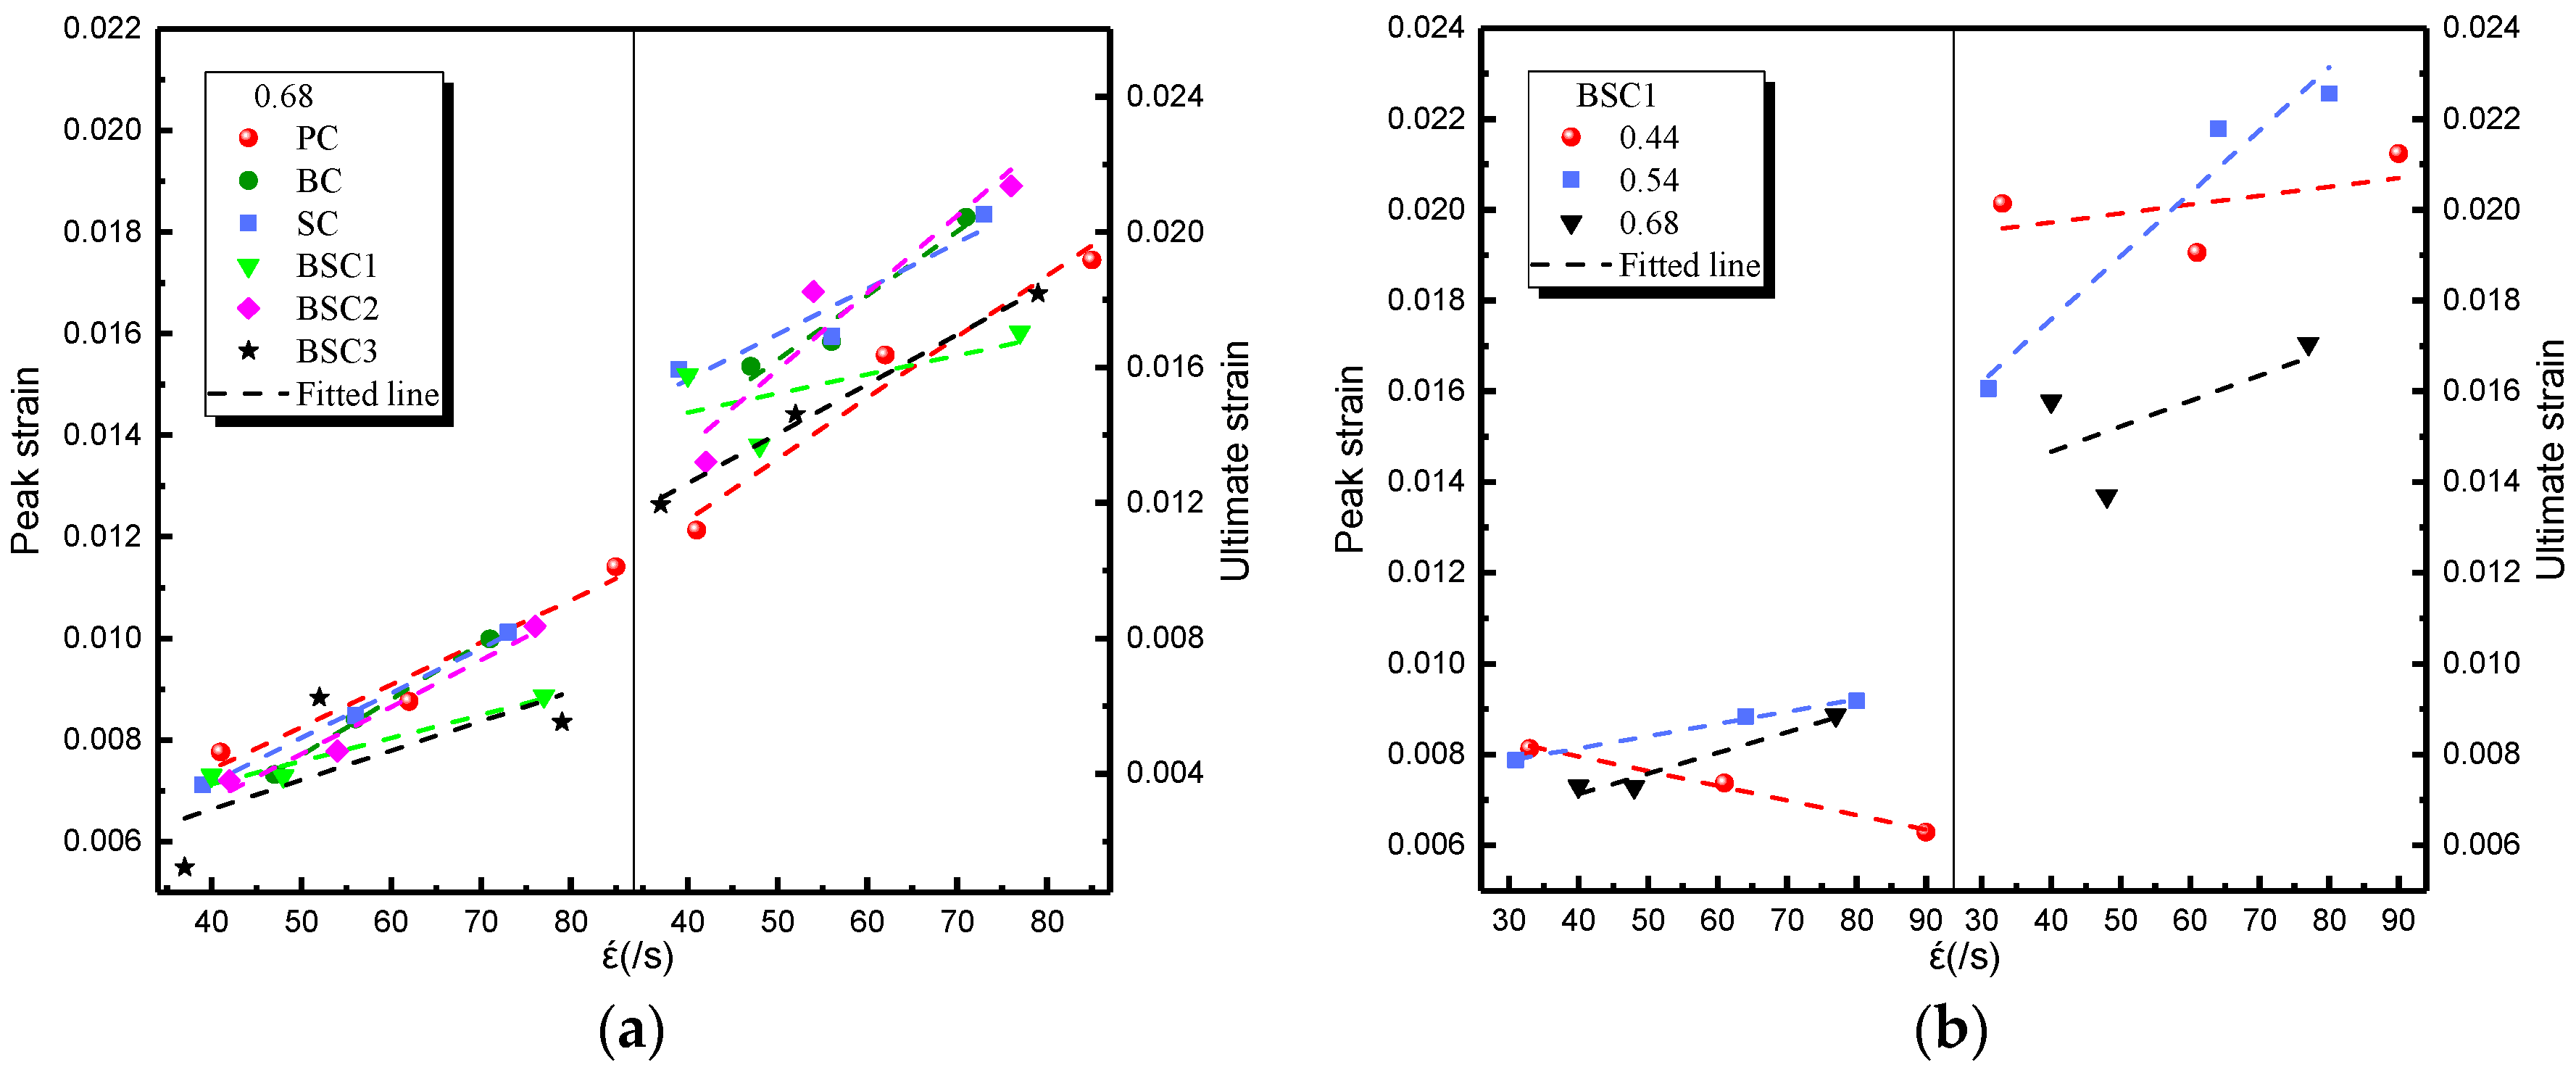
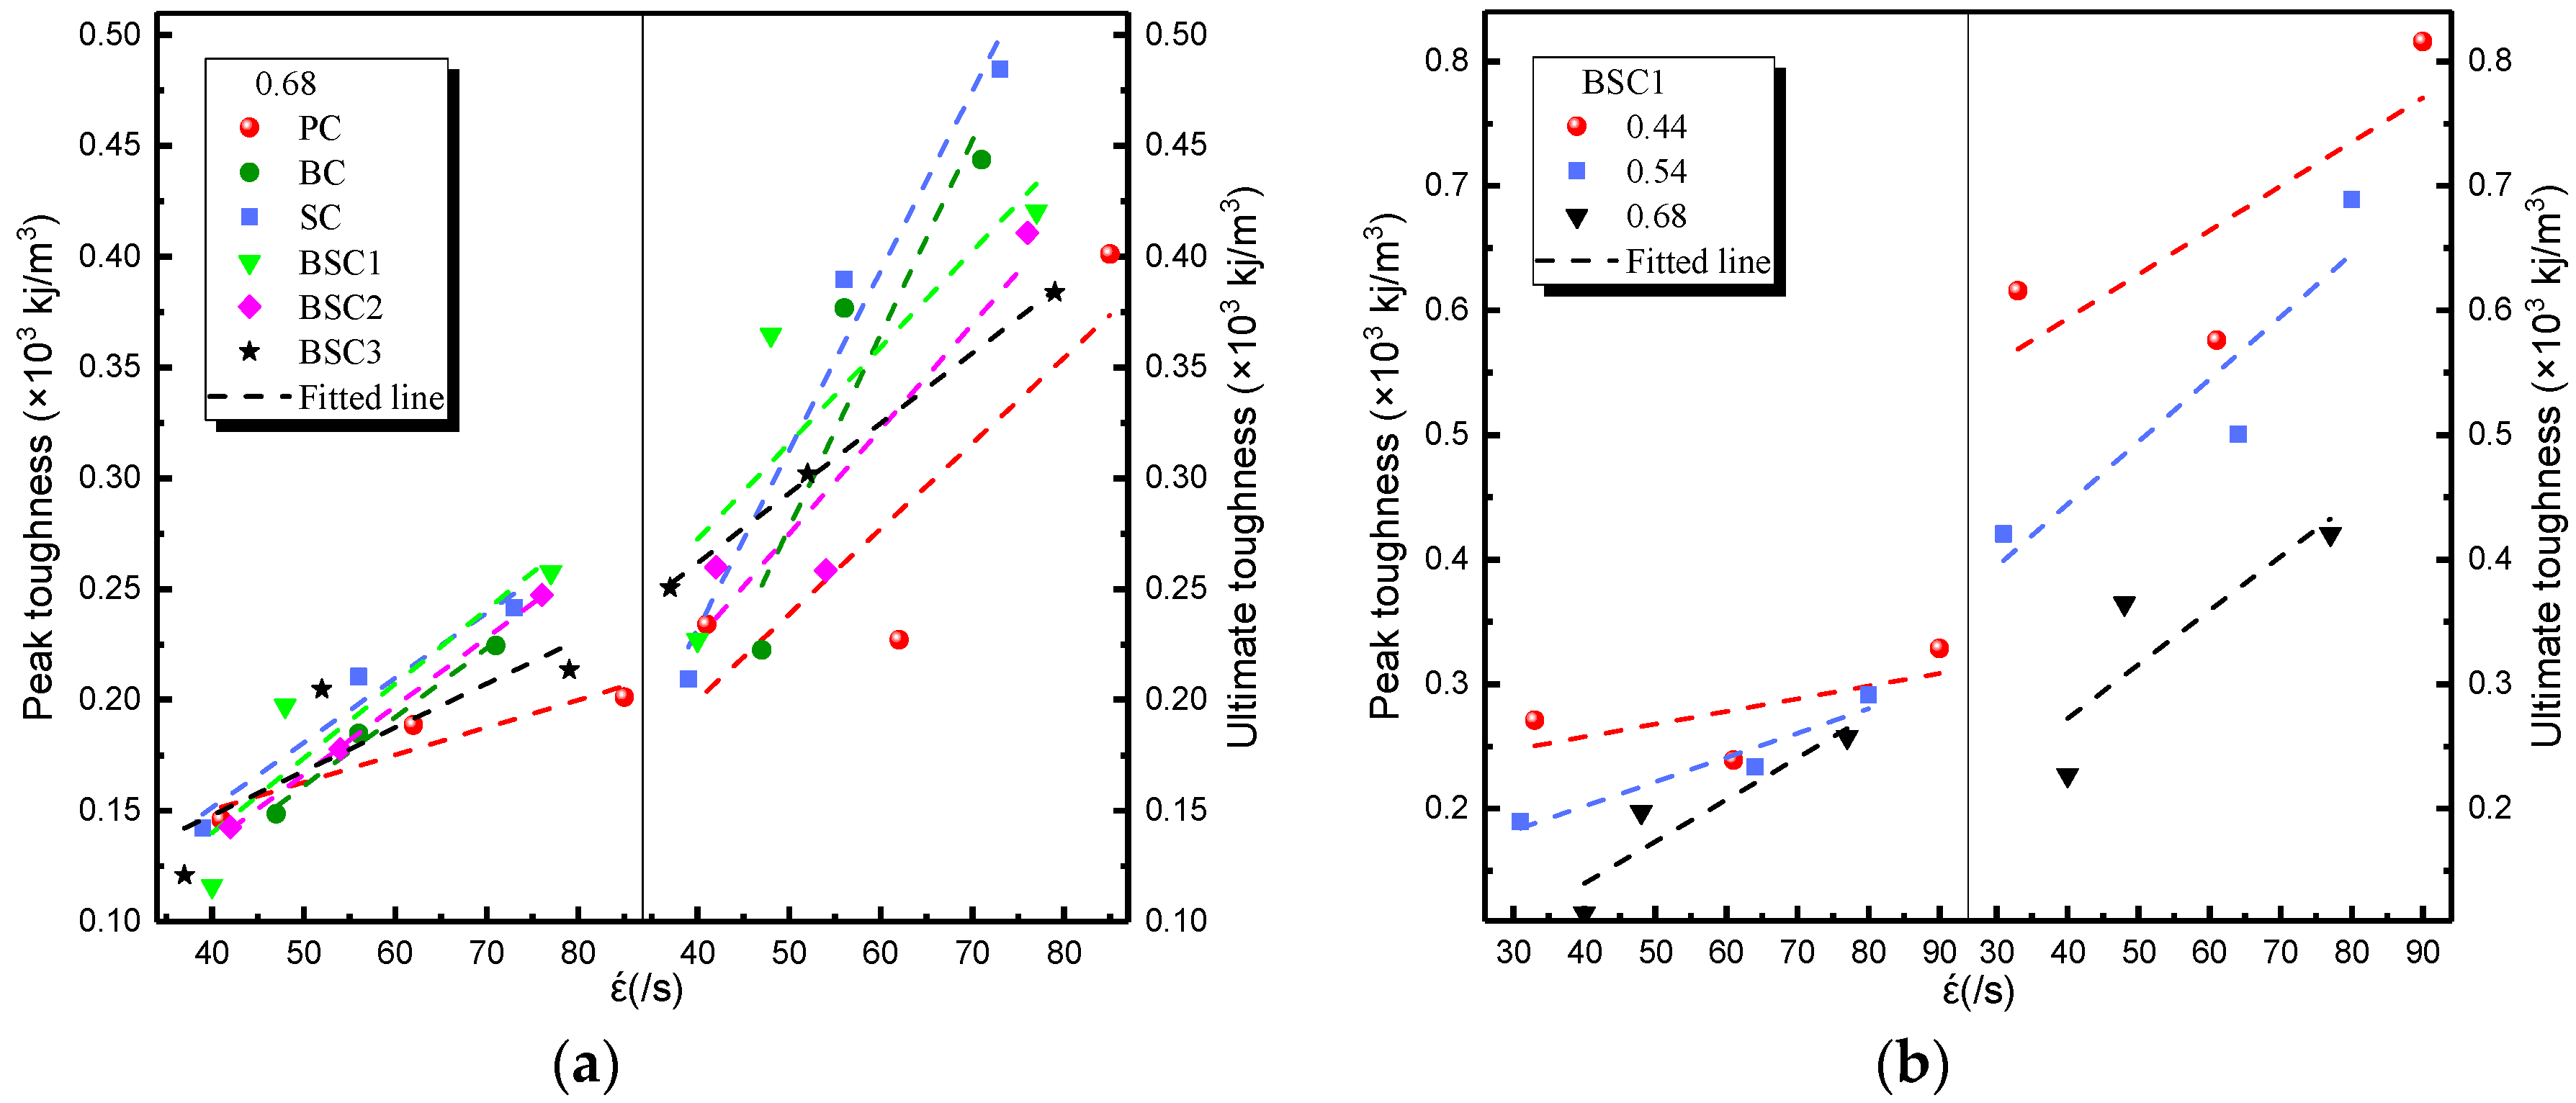
3.2.1. Strain Rate Effect
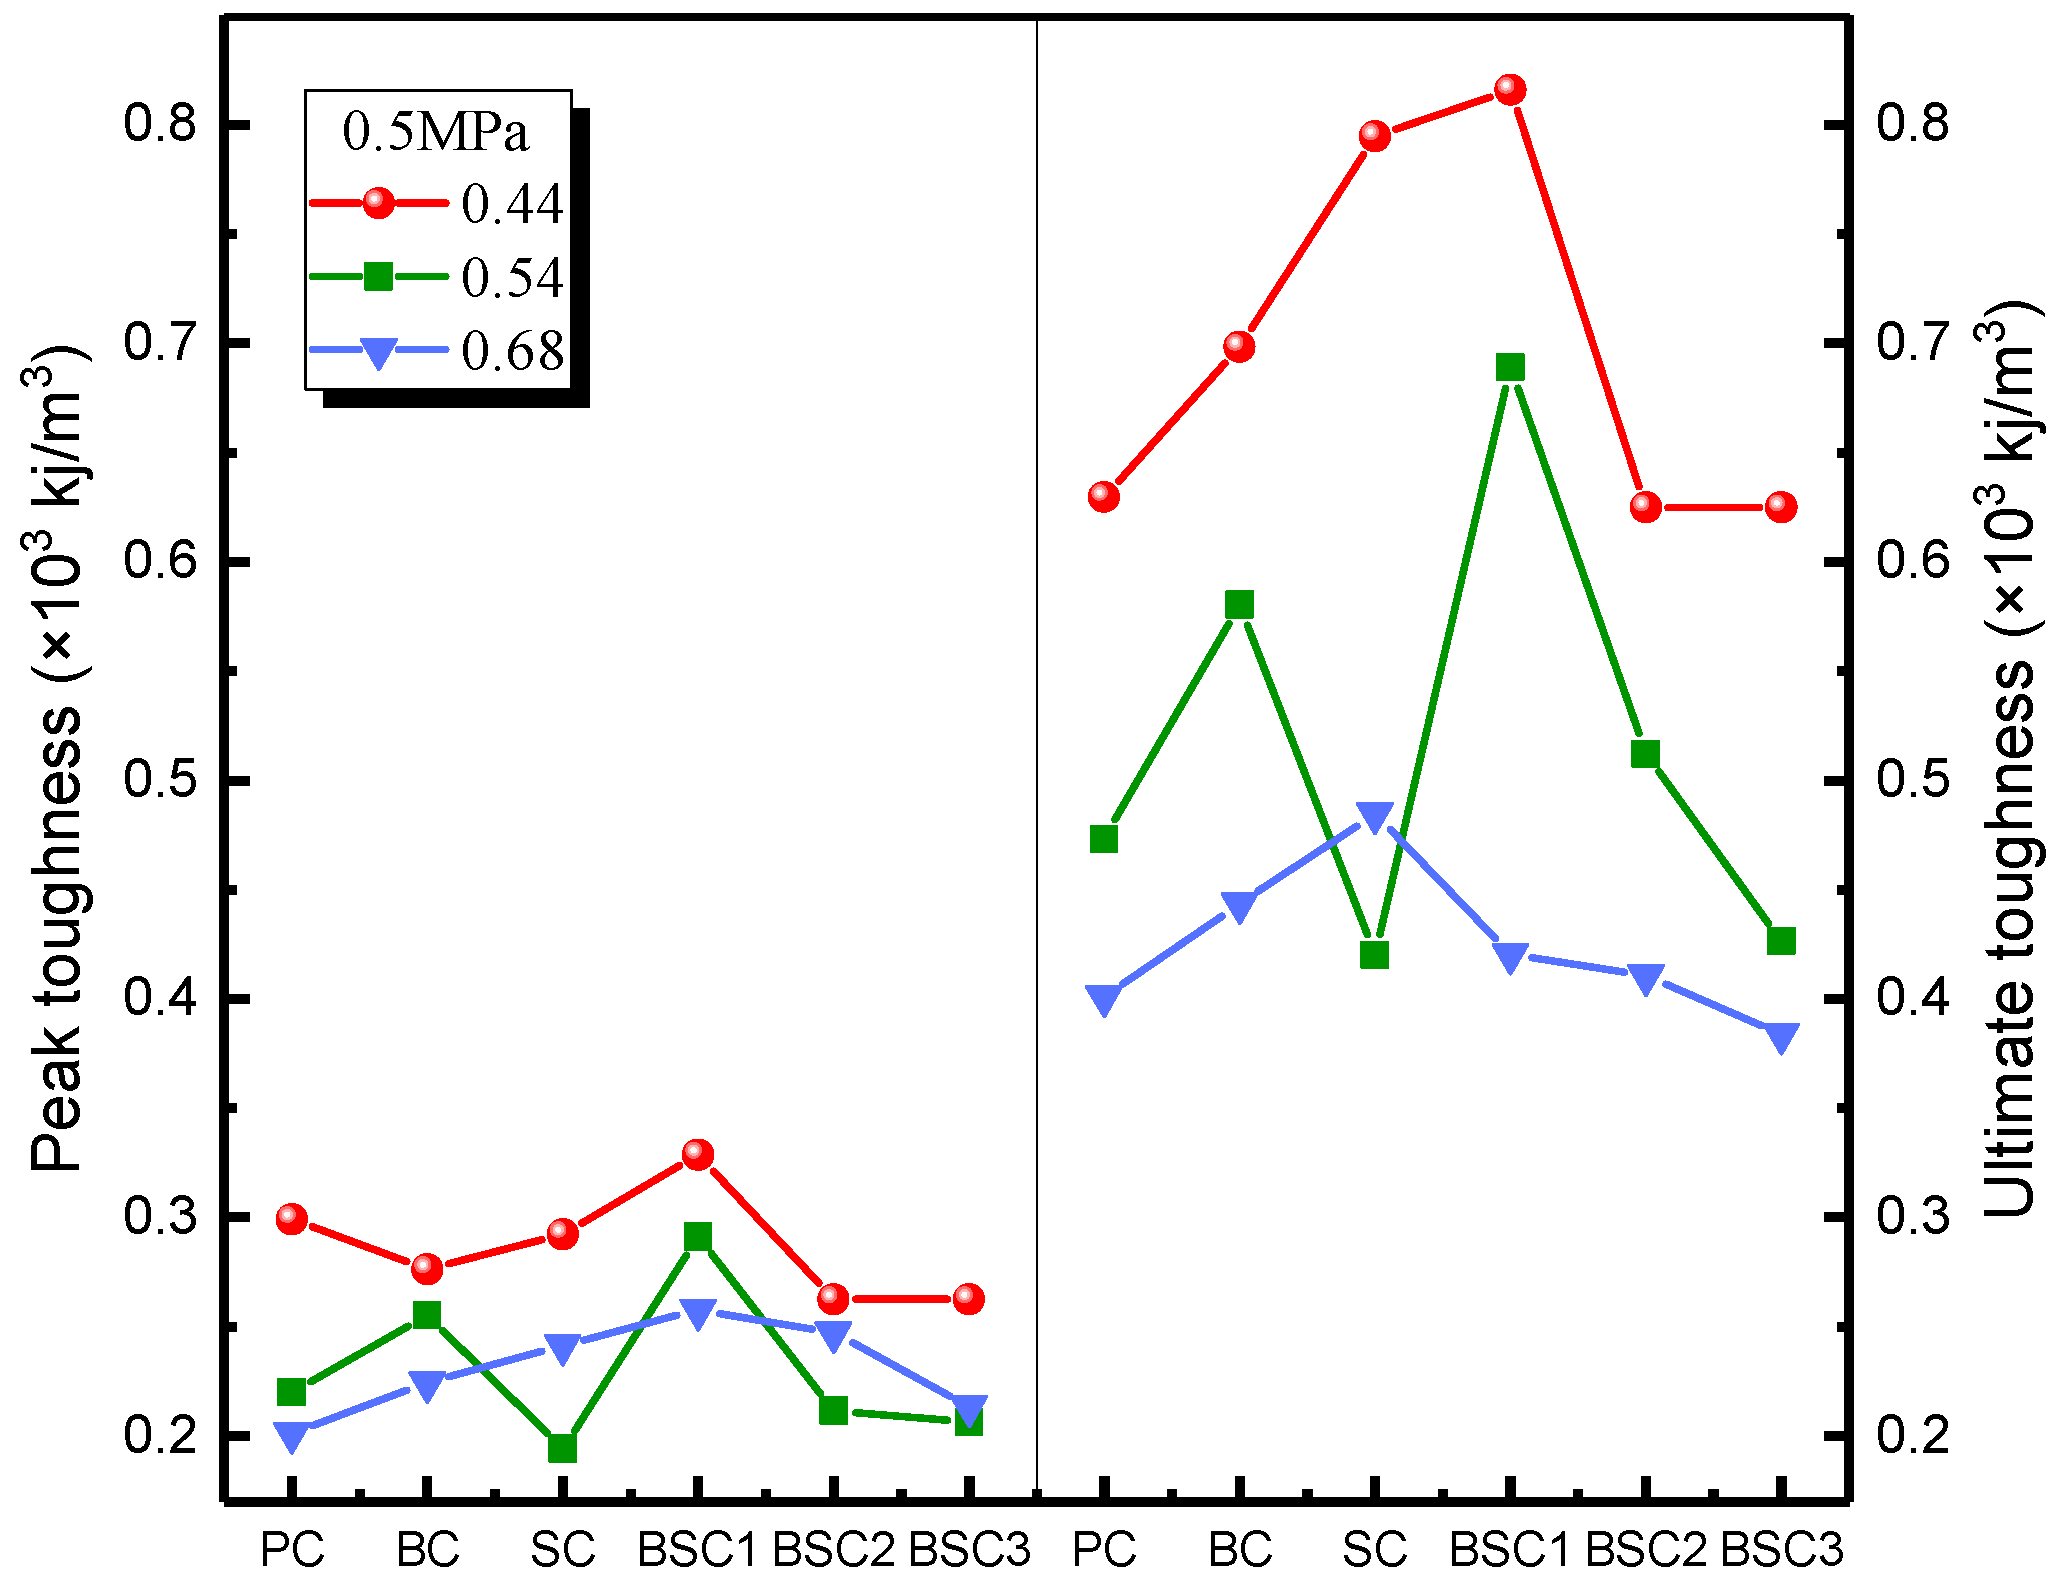
3.2.2. Fiber Hybridization Effect
4. Damage Dynamic Constitutive Model
4.1. Equation Establishment
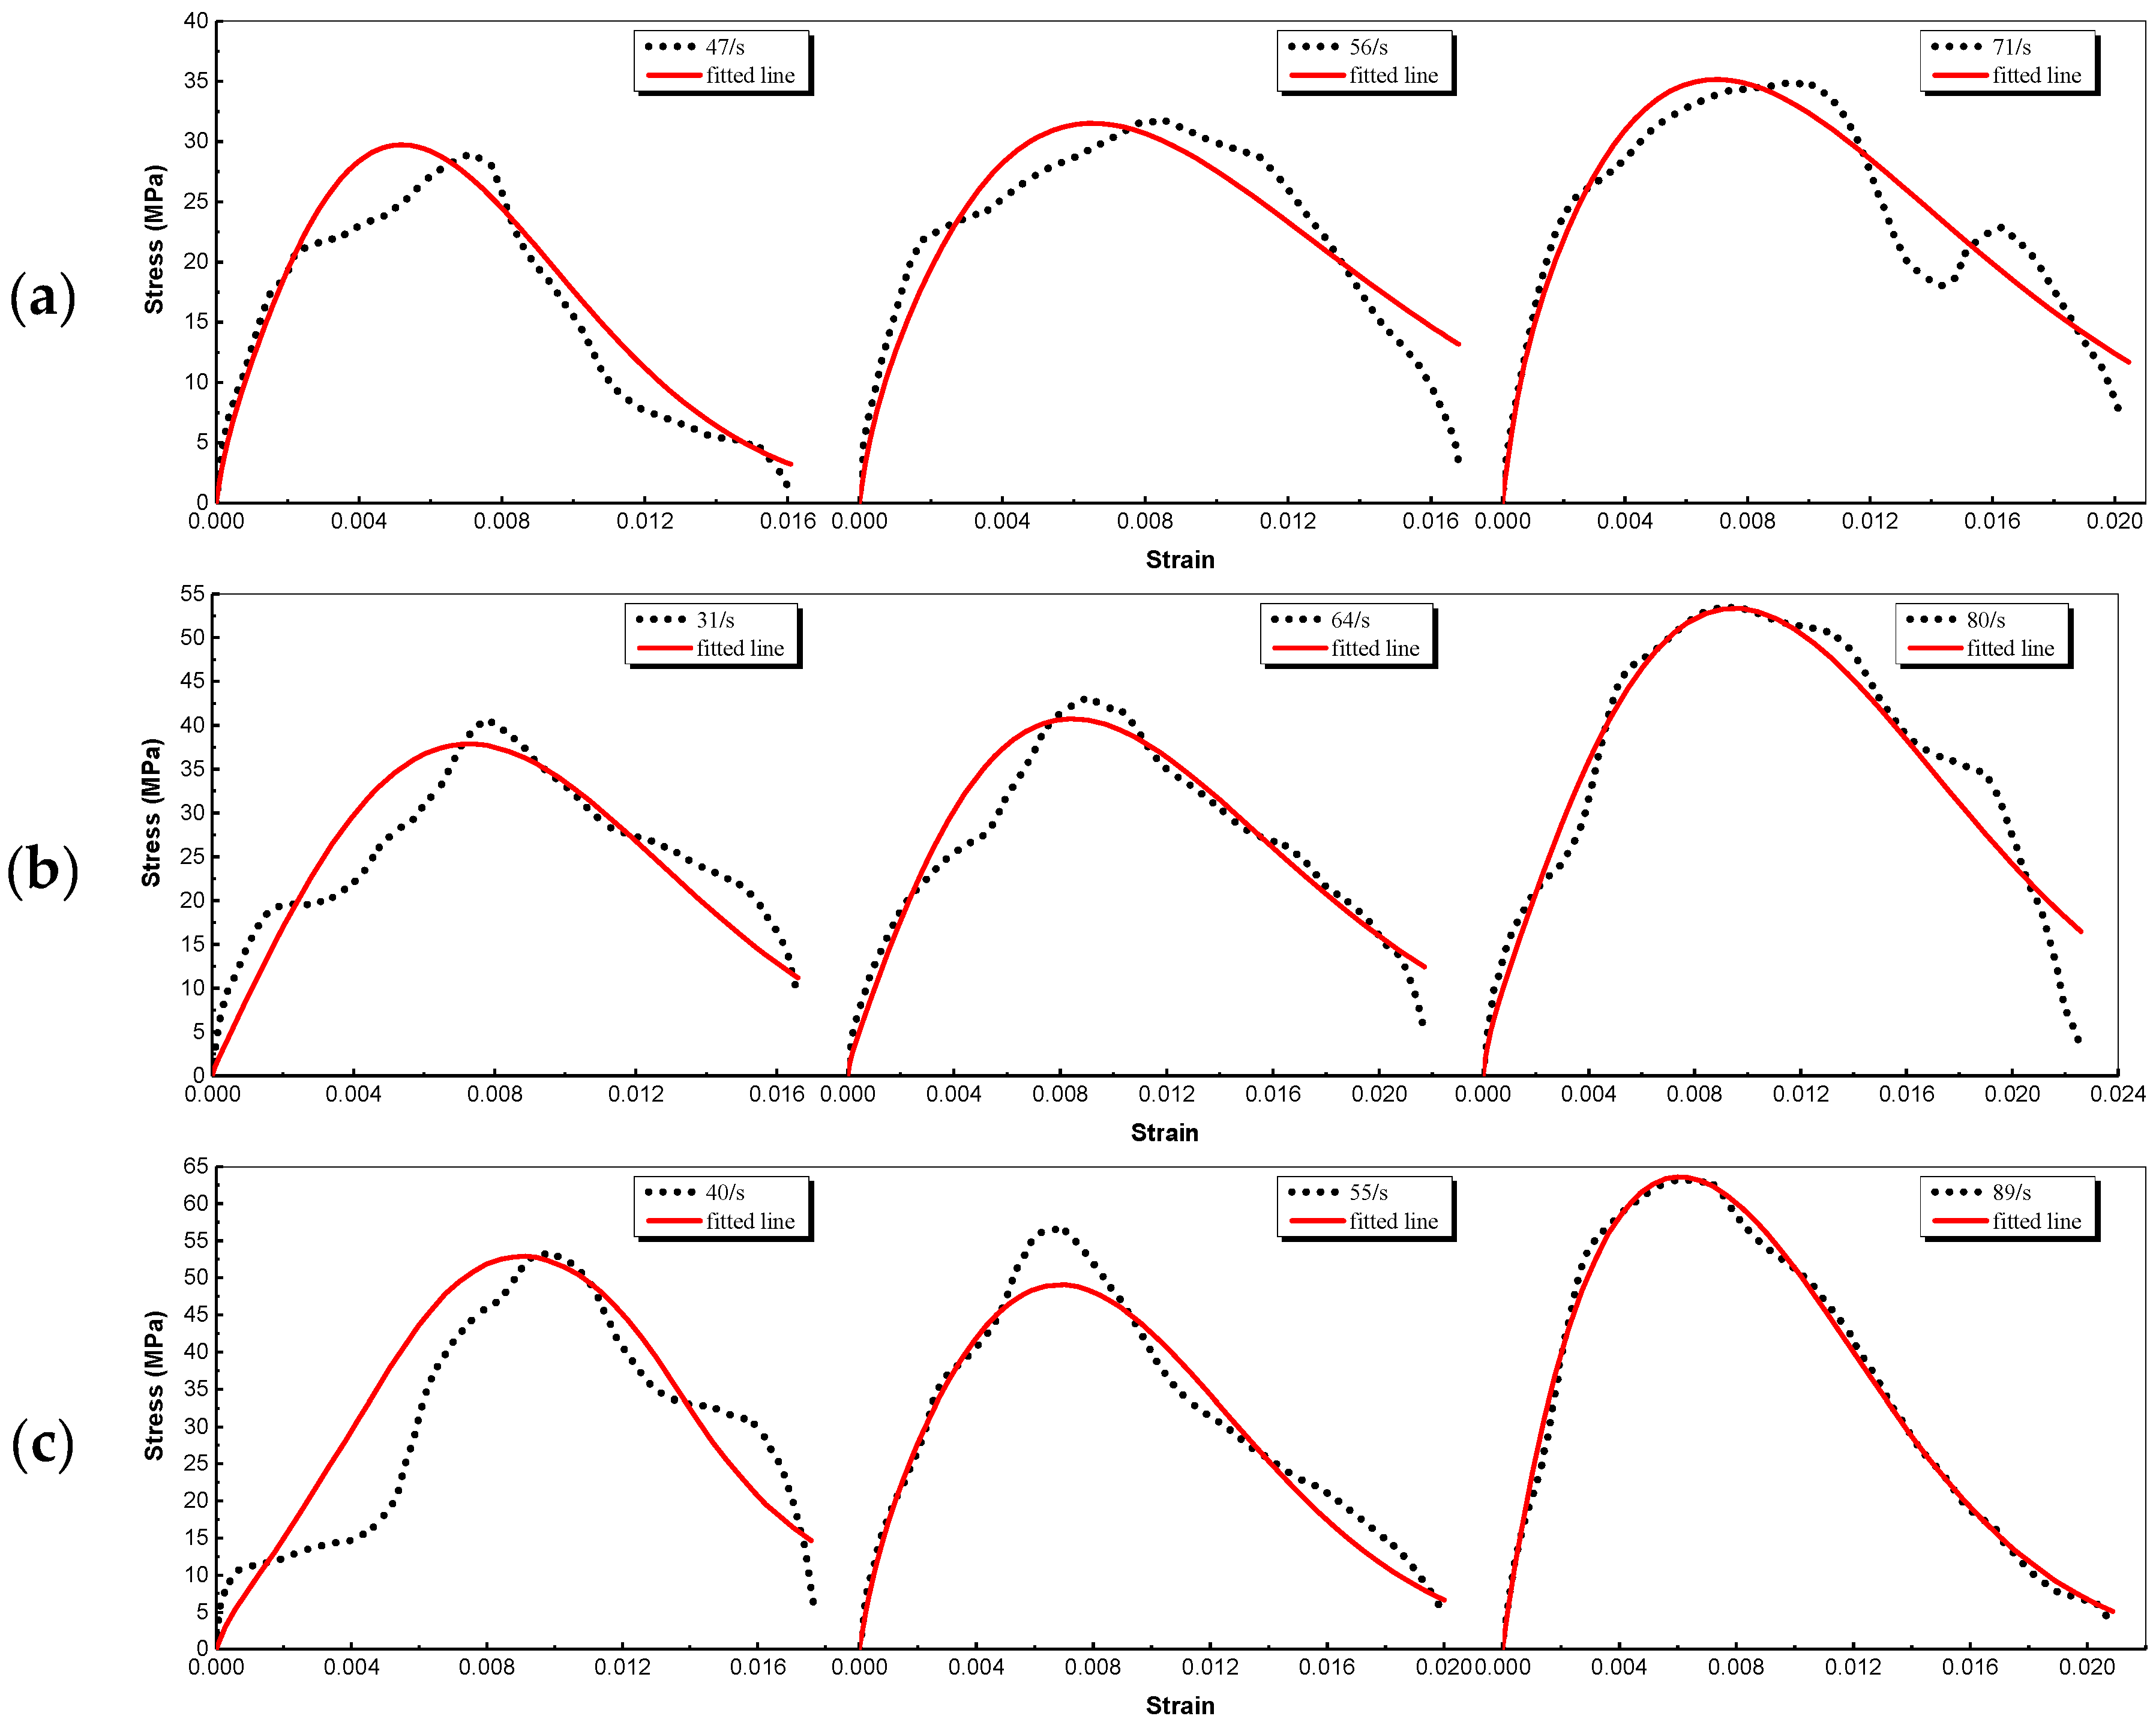
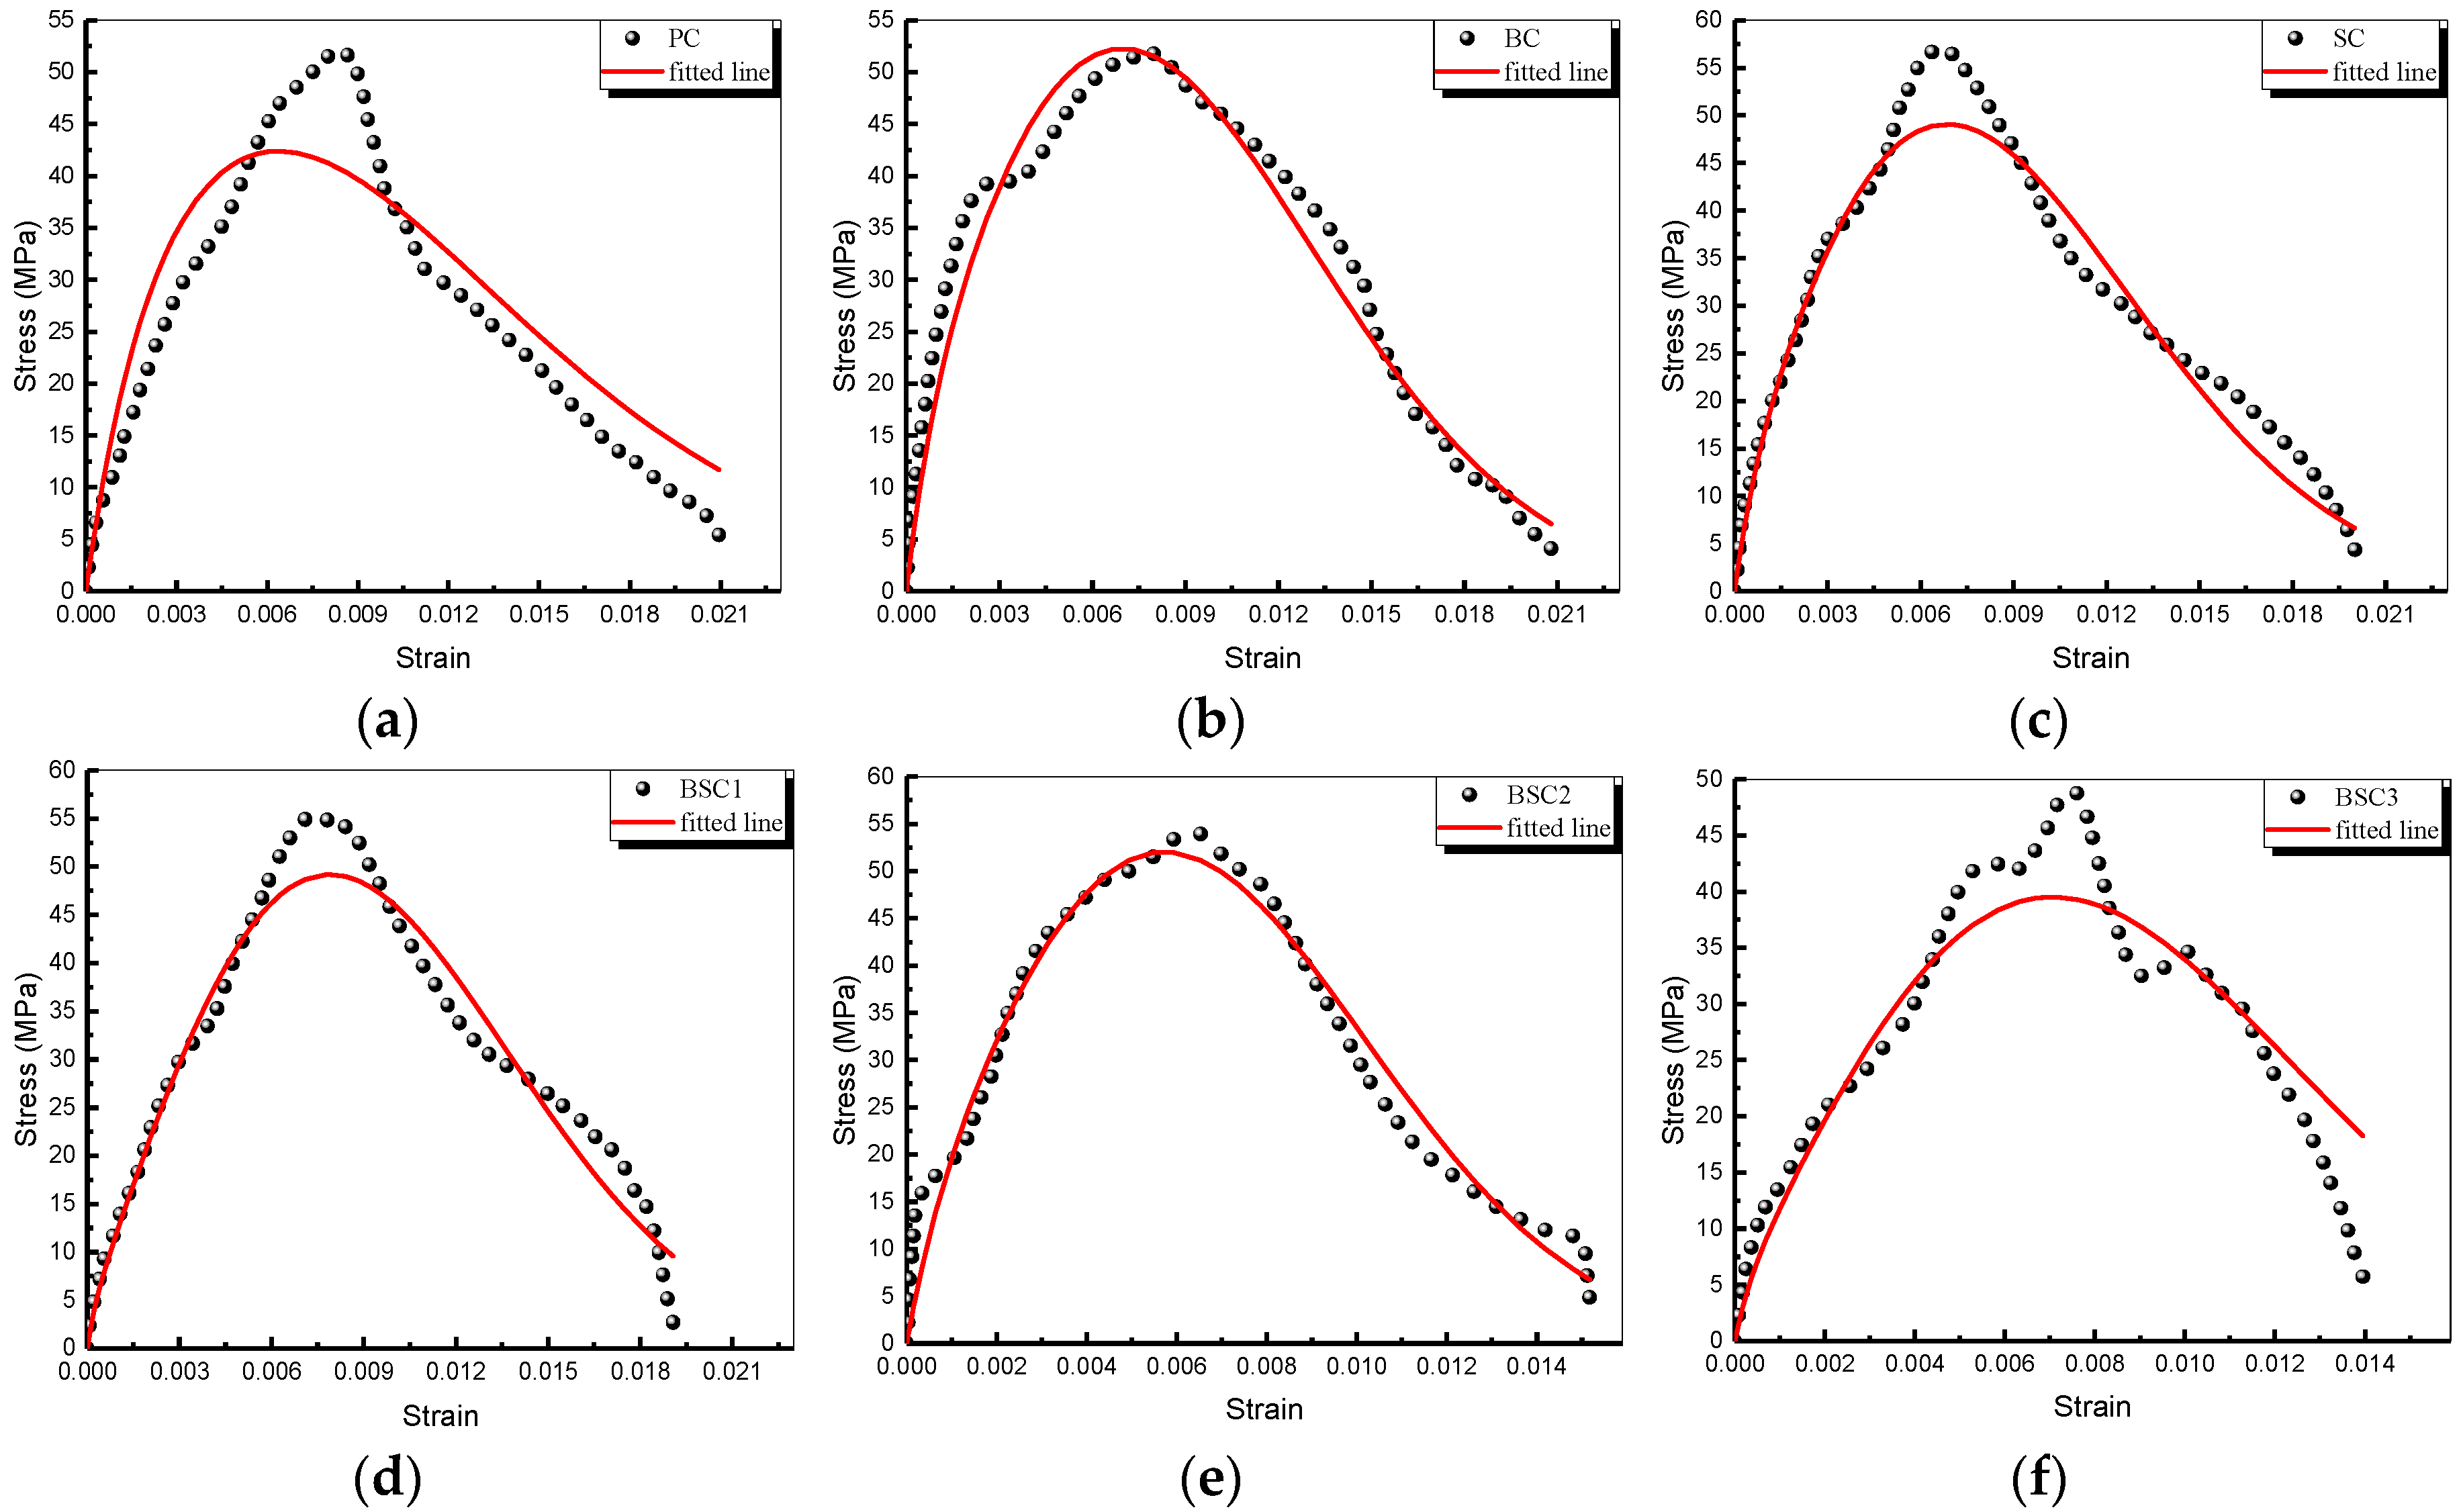
4.2. Analysis of Fitting
5. Microstructure Characteristics Analysis
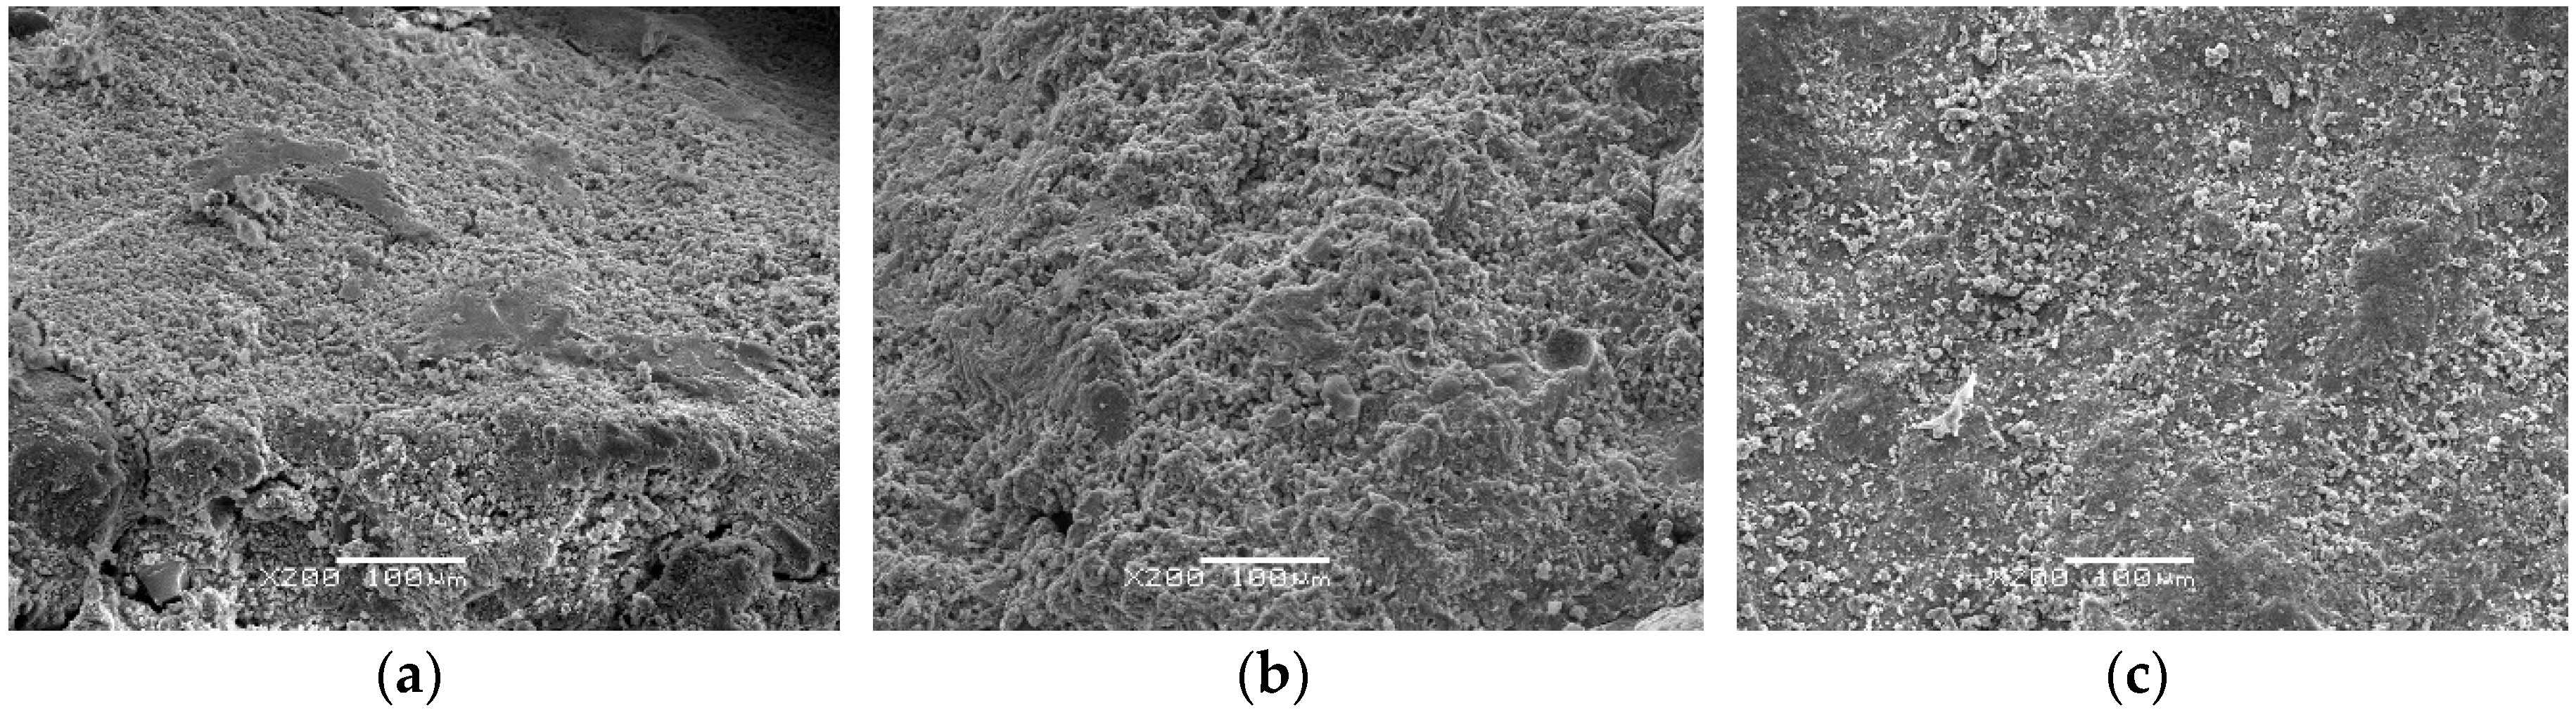
5.1. Microscopic Appearance of Mortar
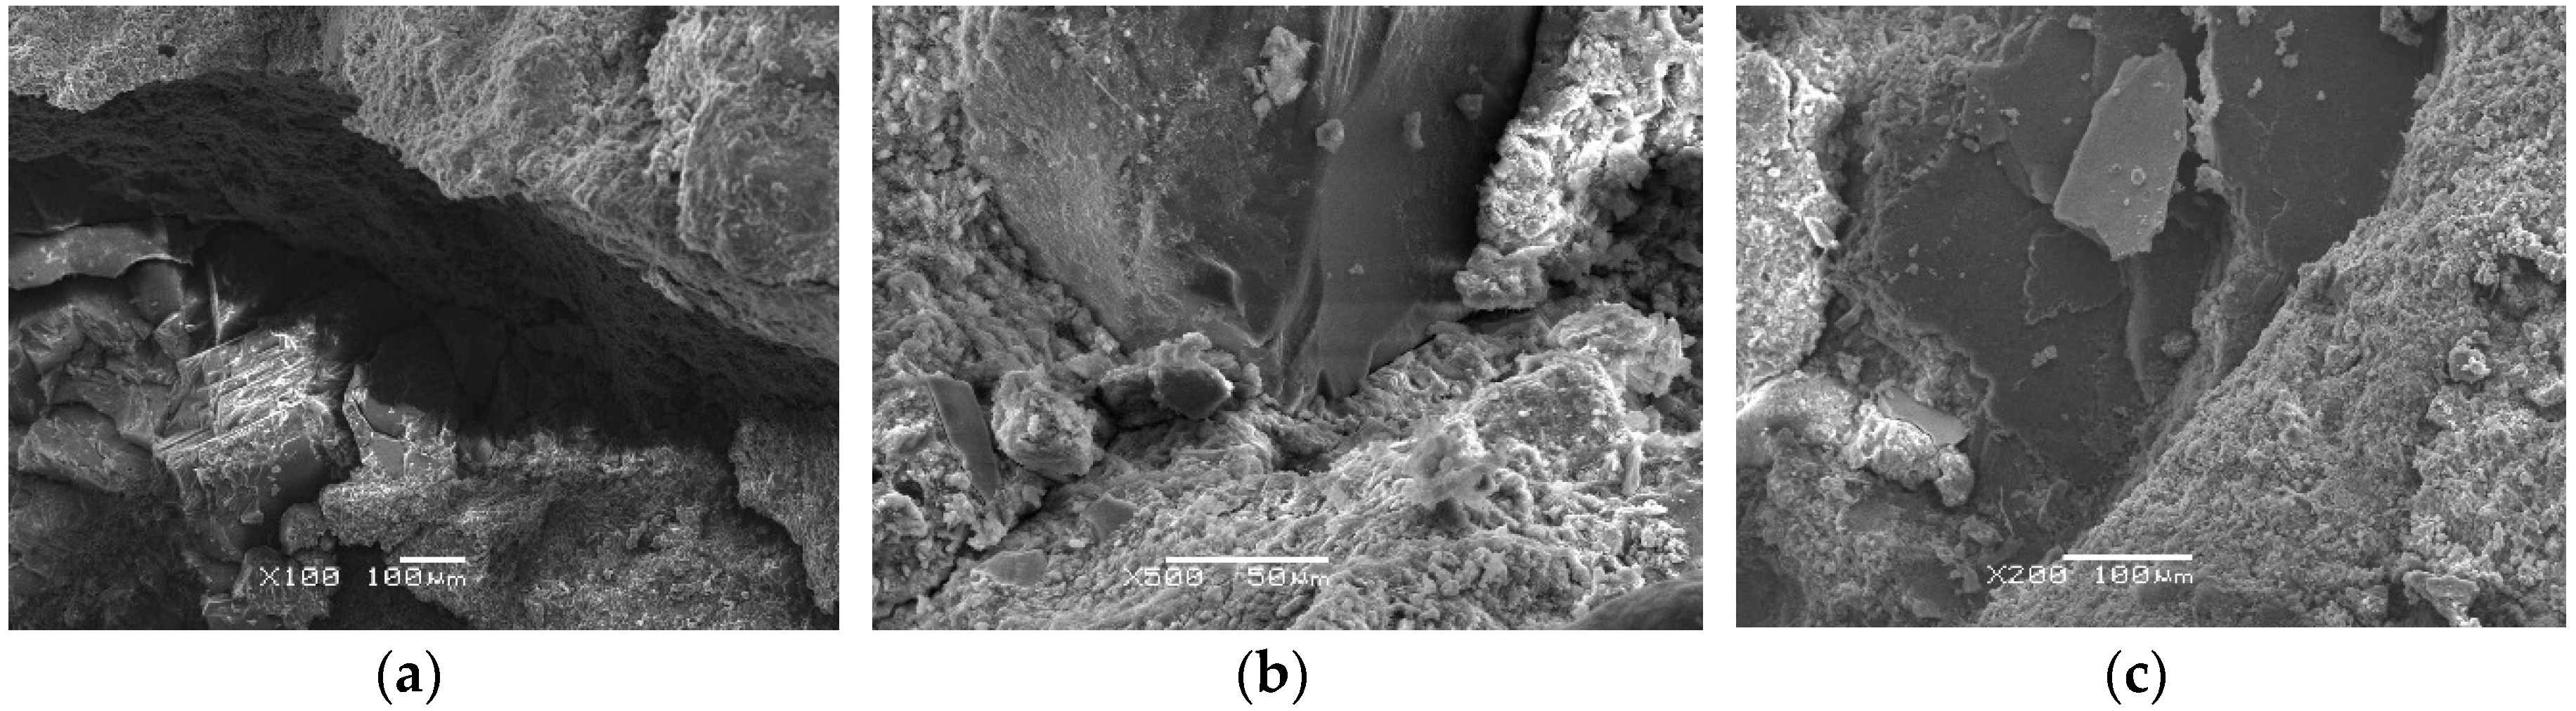
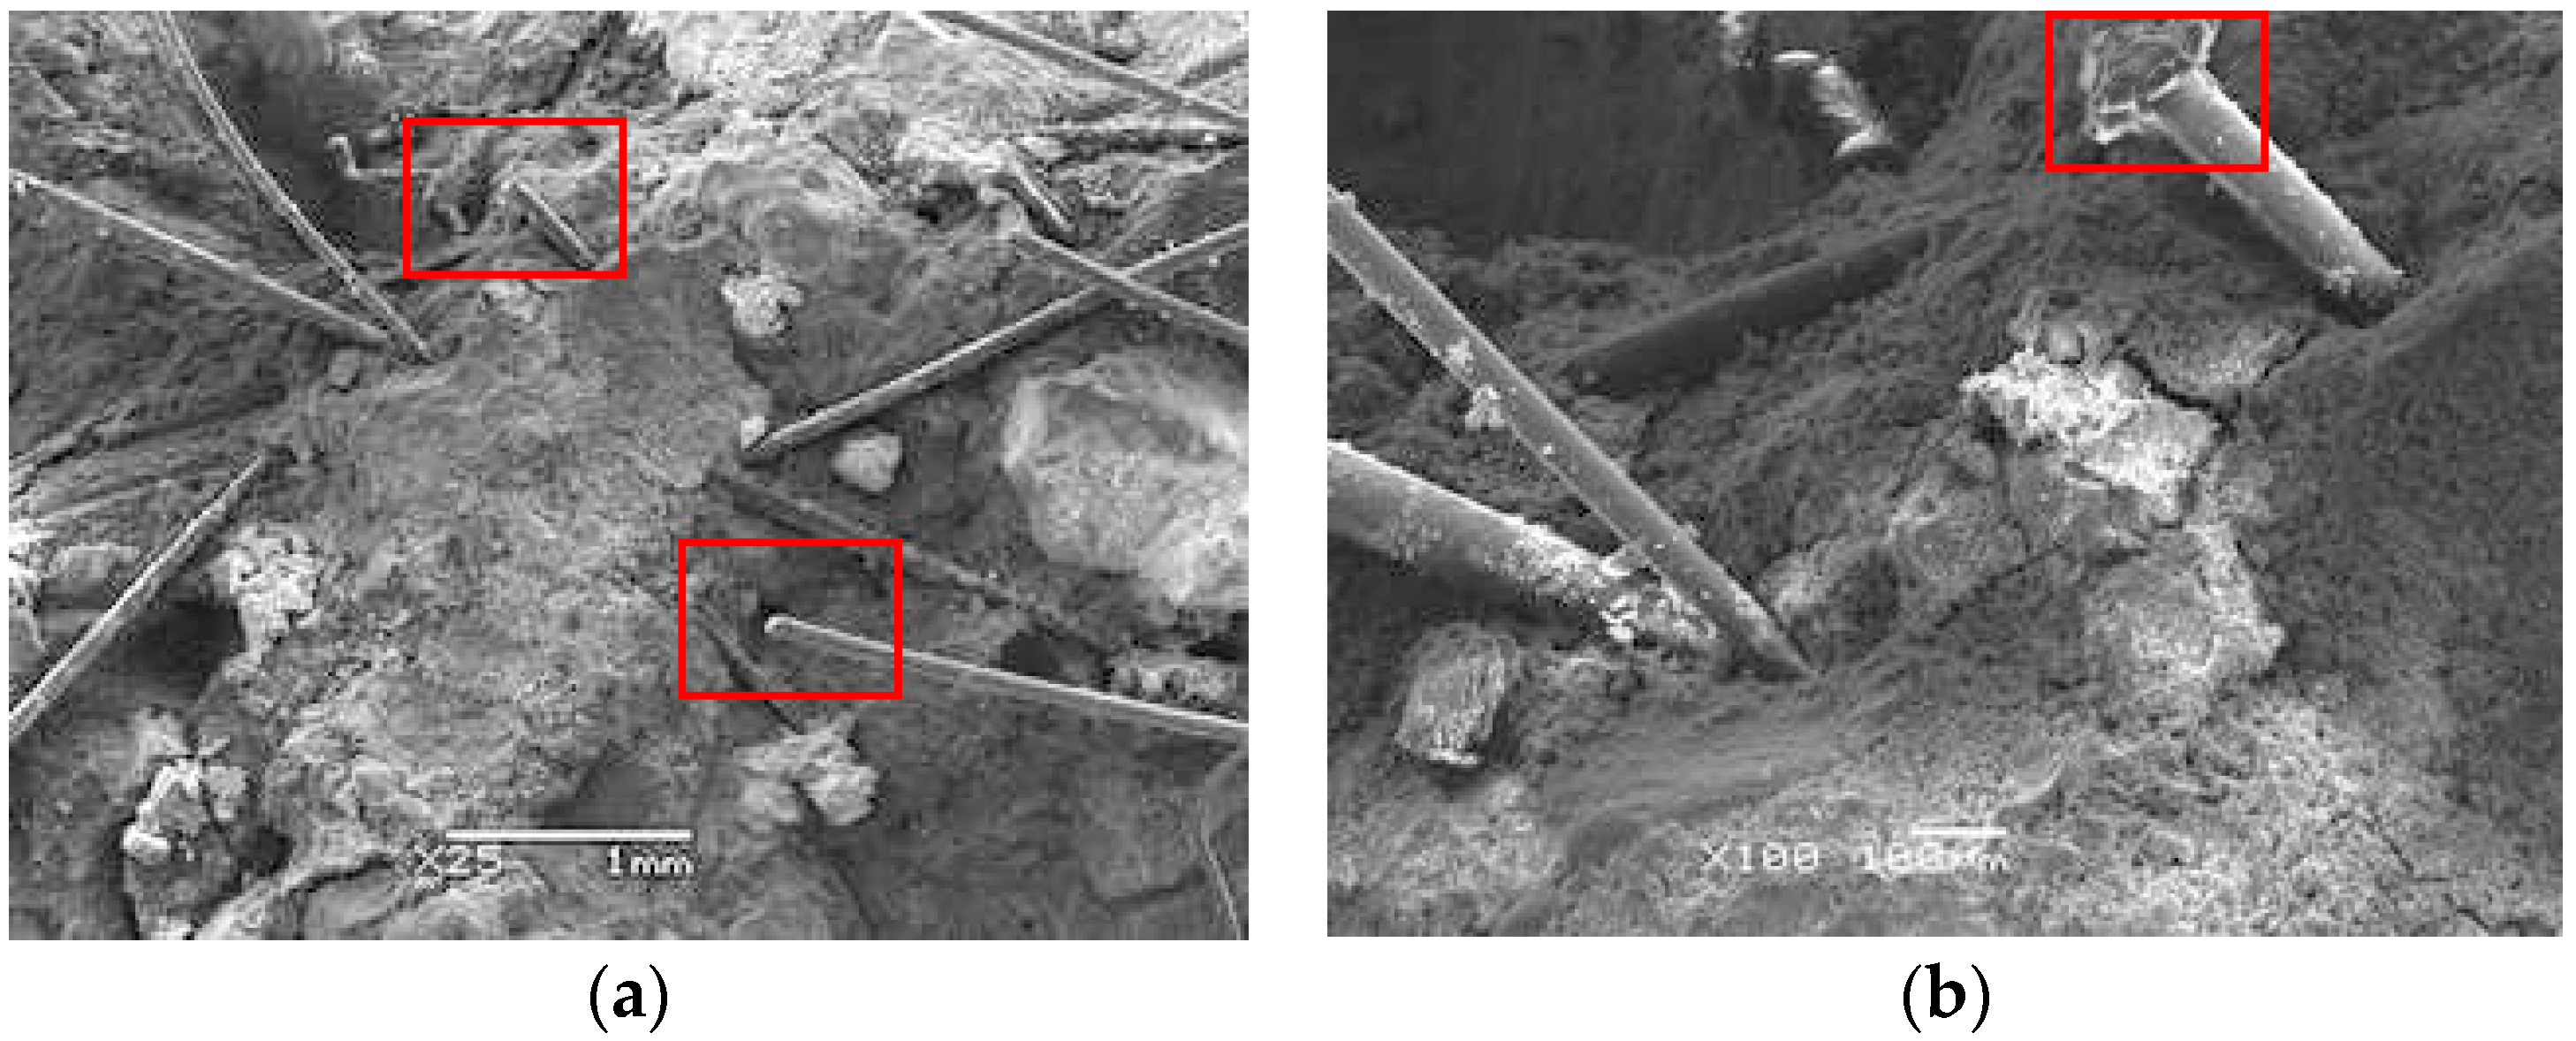
5.2. Interface Observation
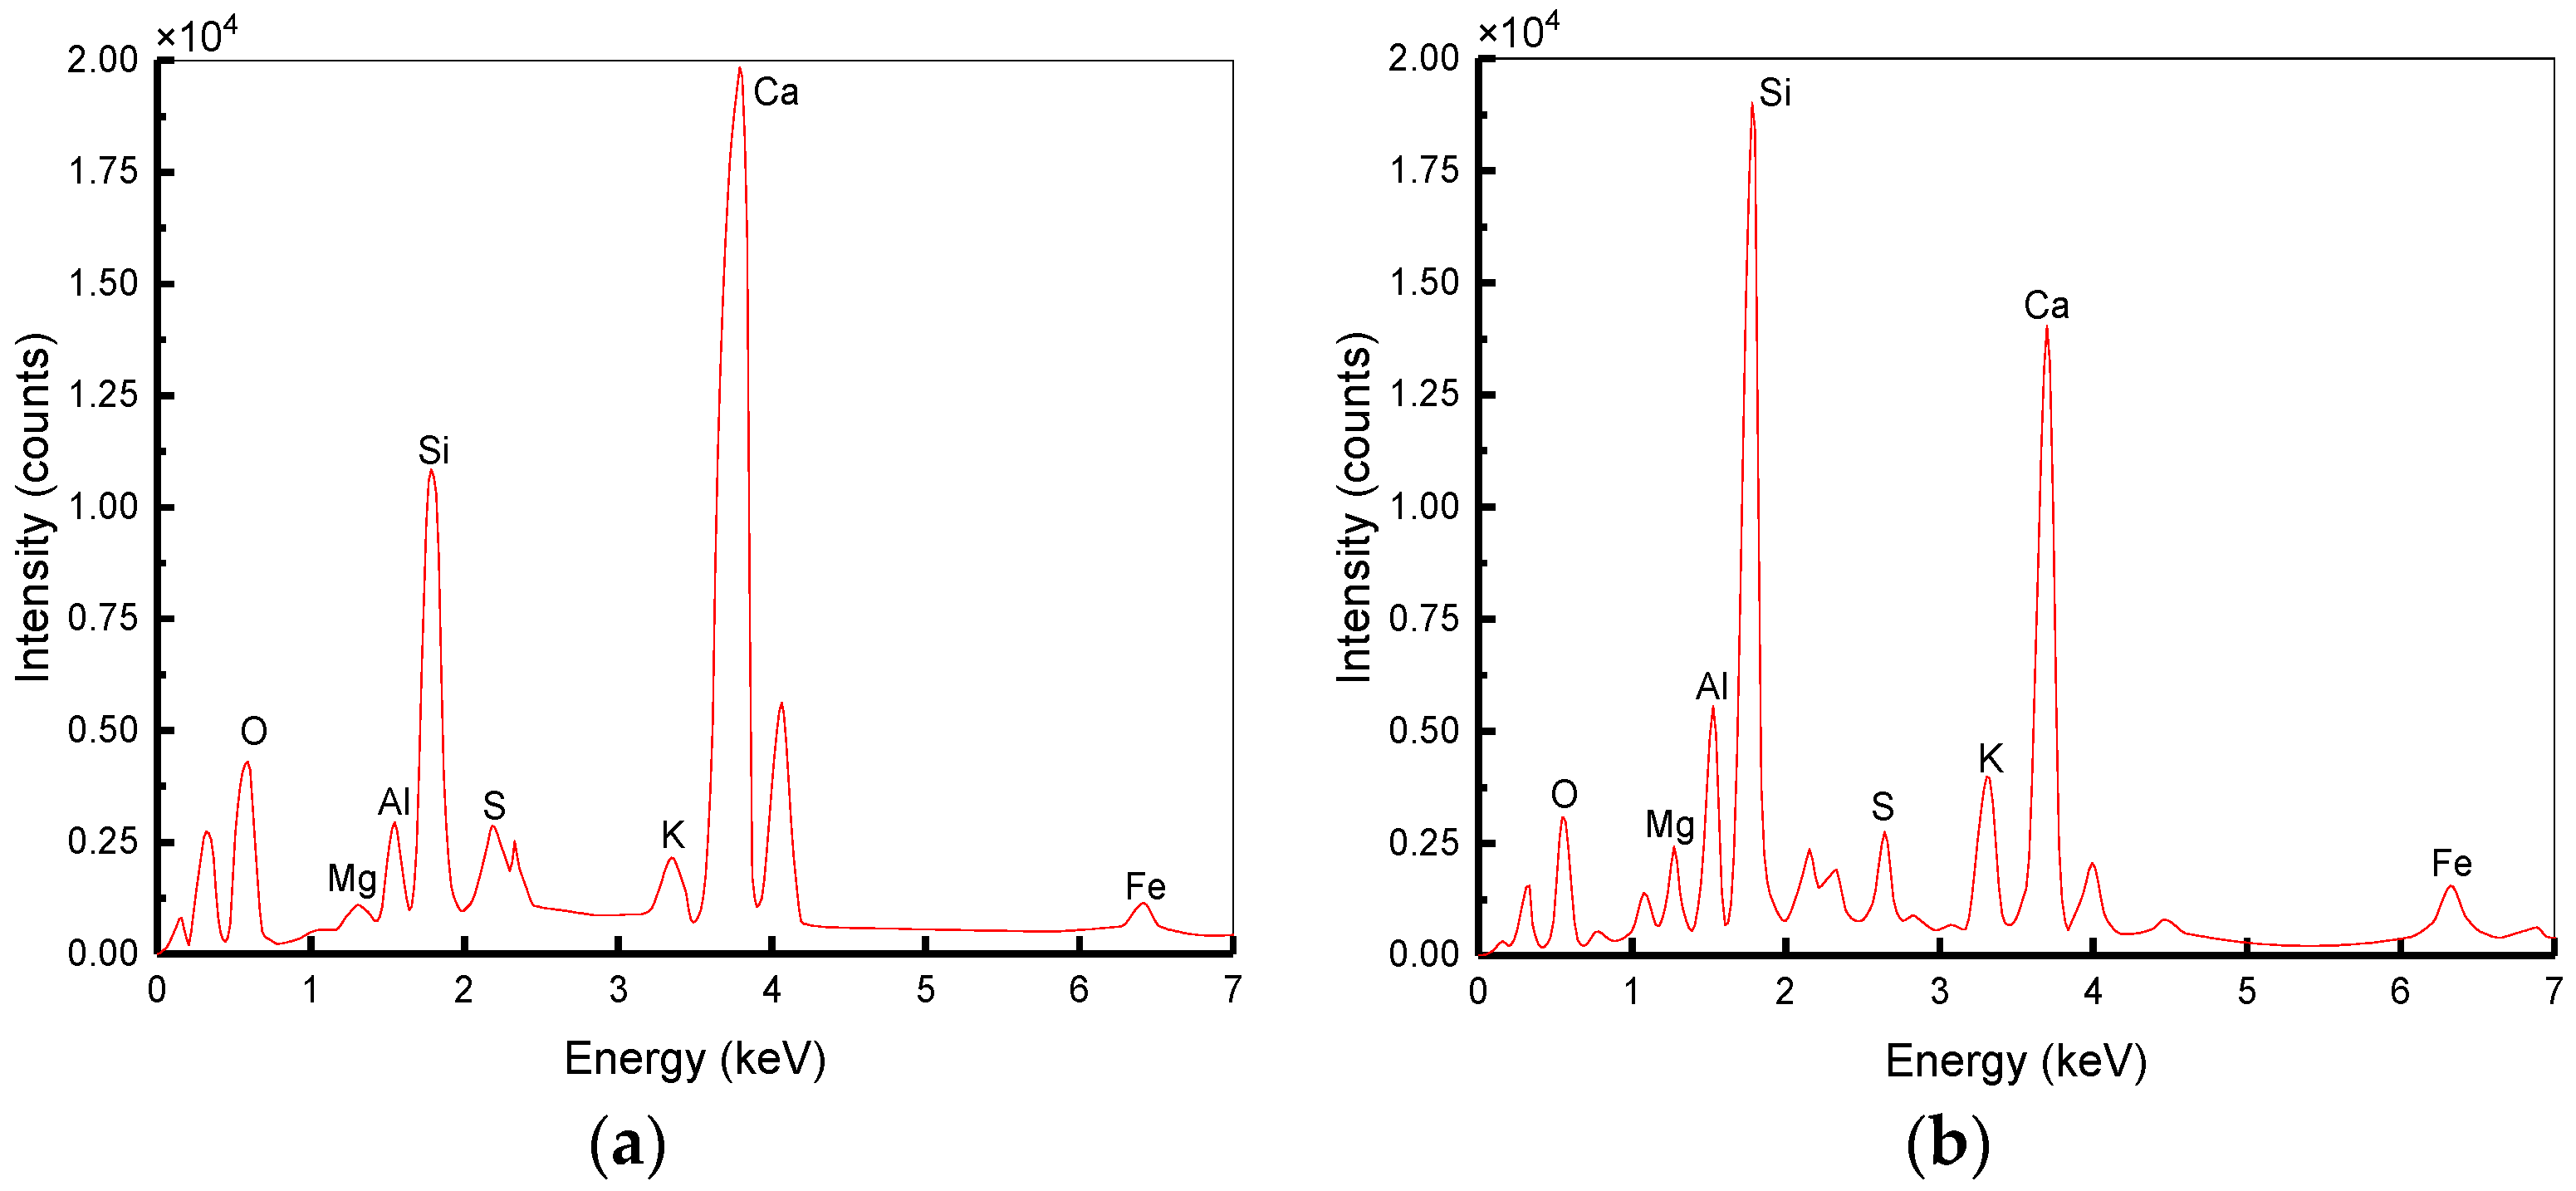
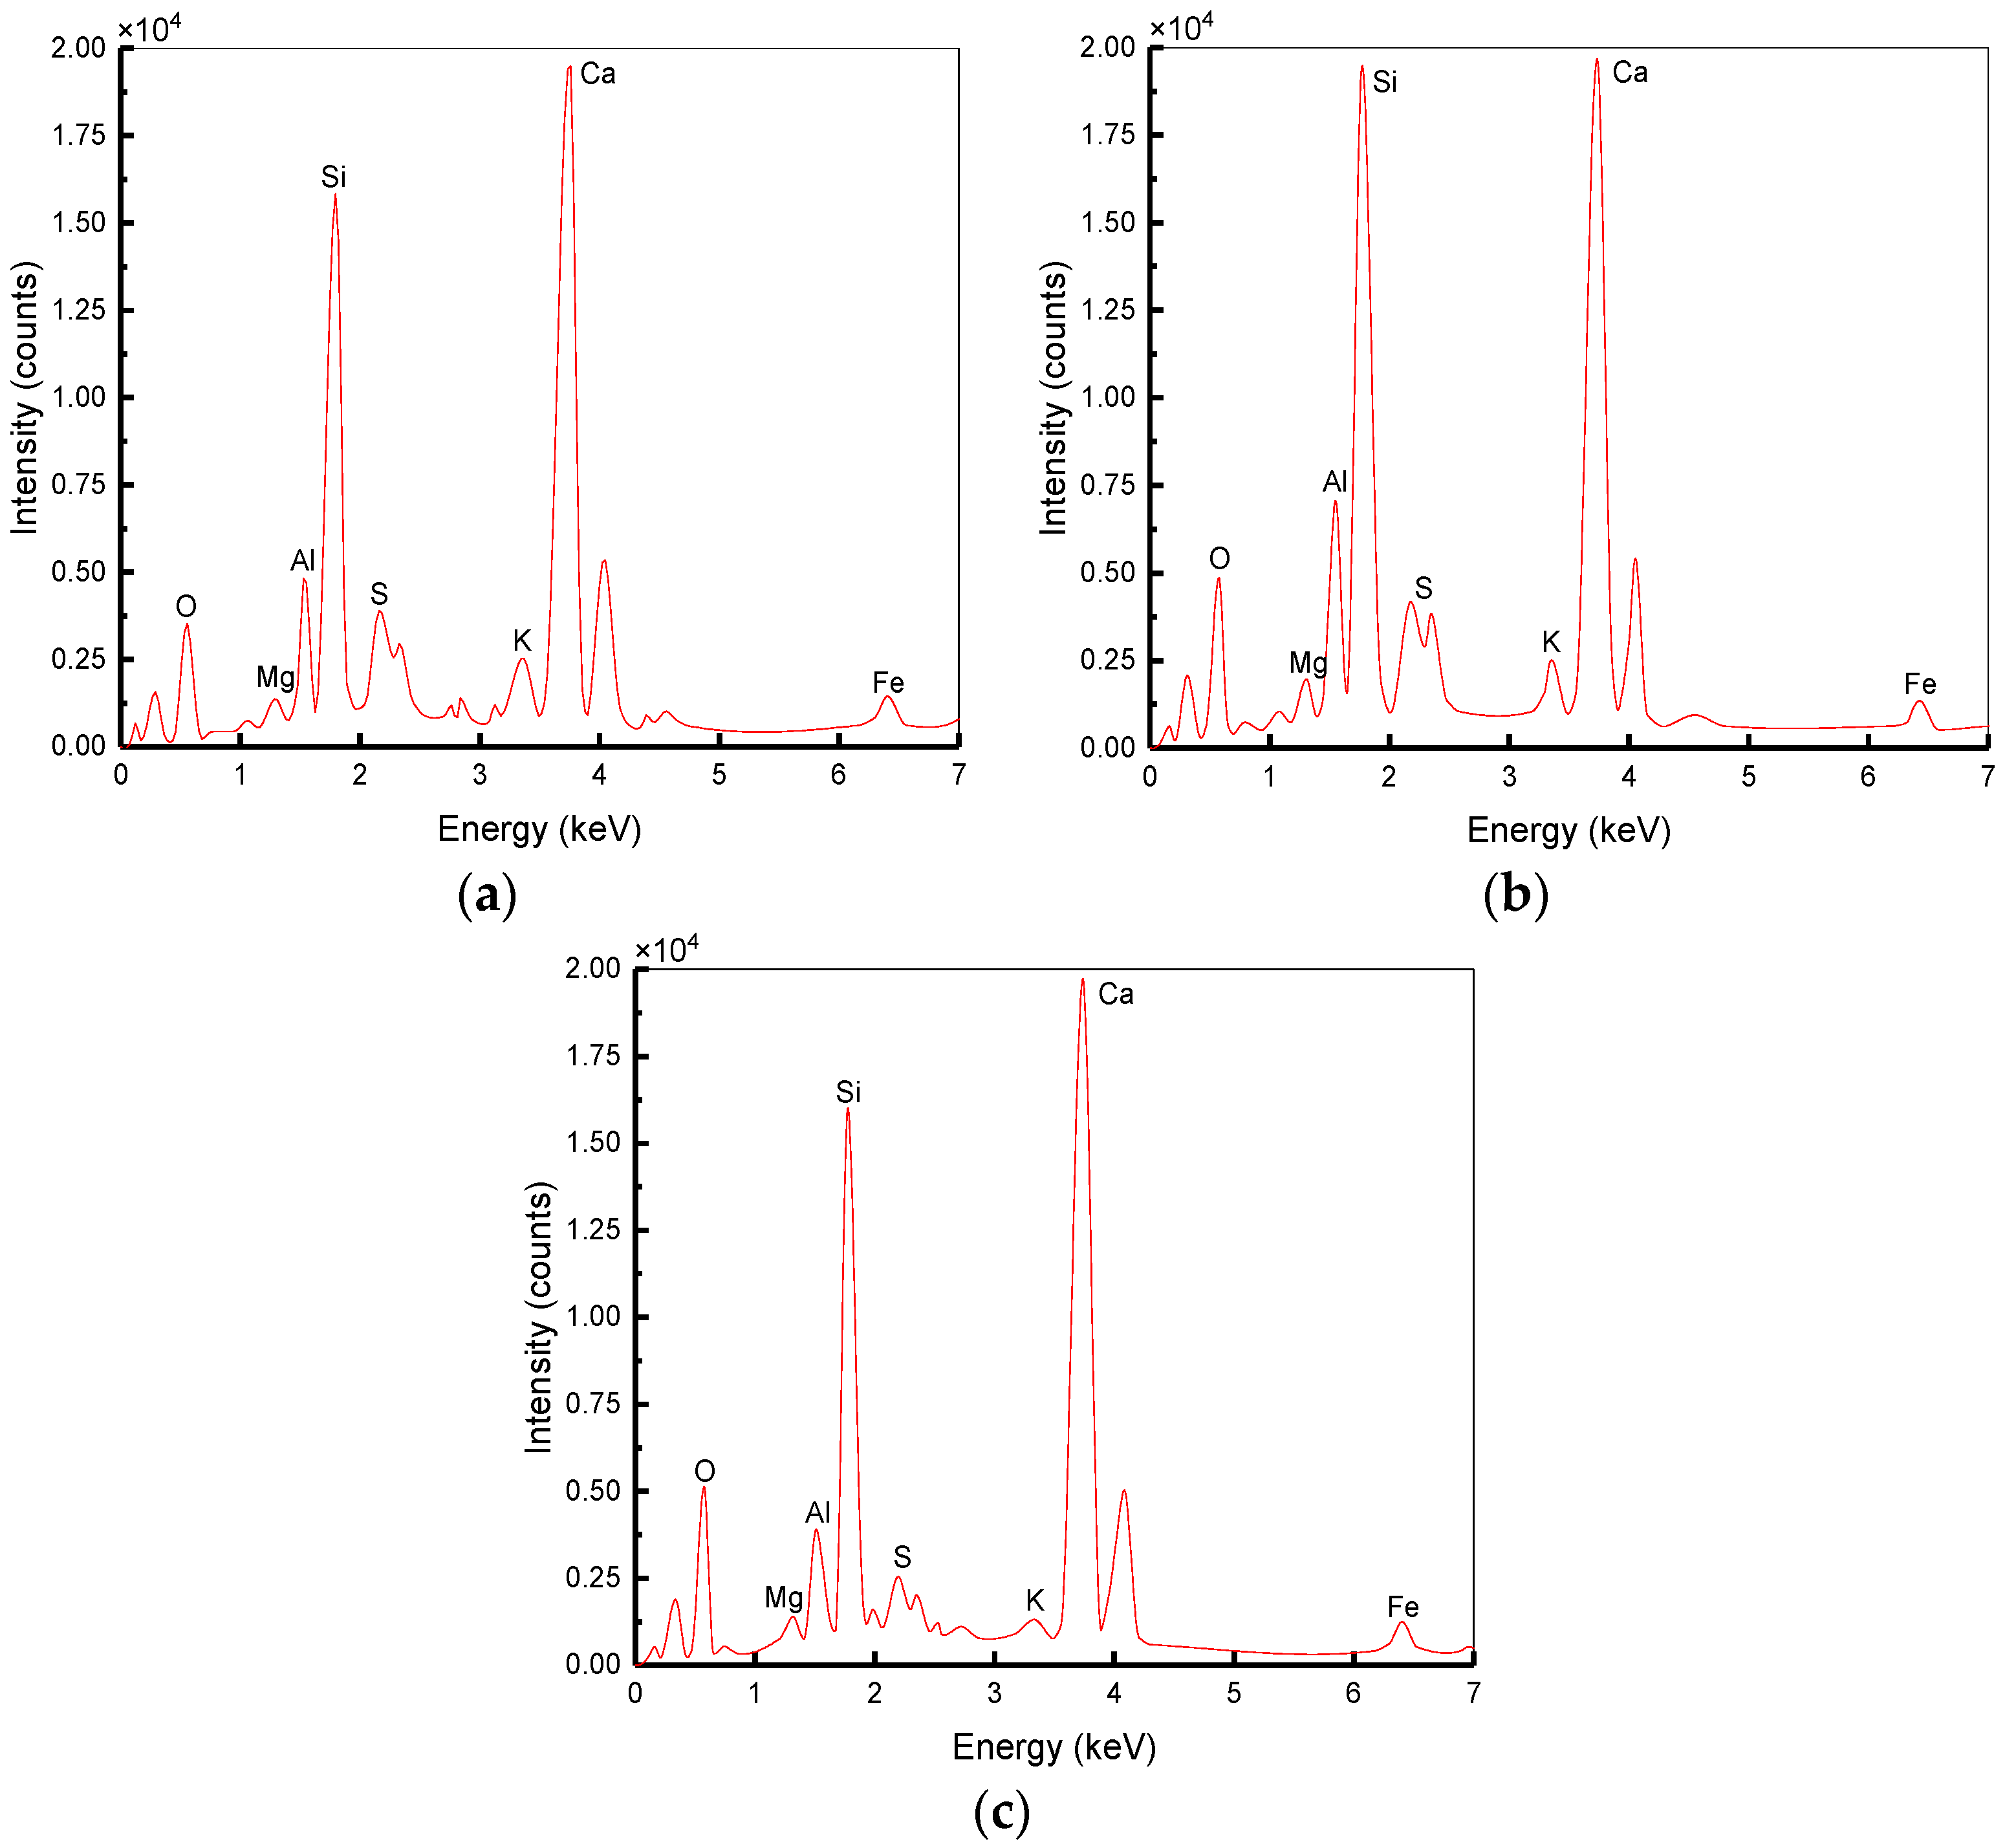
5.3. Energy Spectrum Analysis
6. Conclusions
- BF and SF are able to increase the static strength and their hybridization has a greater strengthening effect. The best hybrid ratio is 0.05% (BF)–0.25% (SF) for w/c ratios of 0.44 and 0.54, but higher fiber hybrid content is demanded for w/c ratio of 0.68.
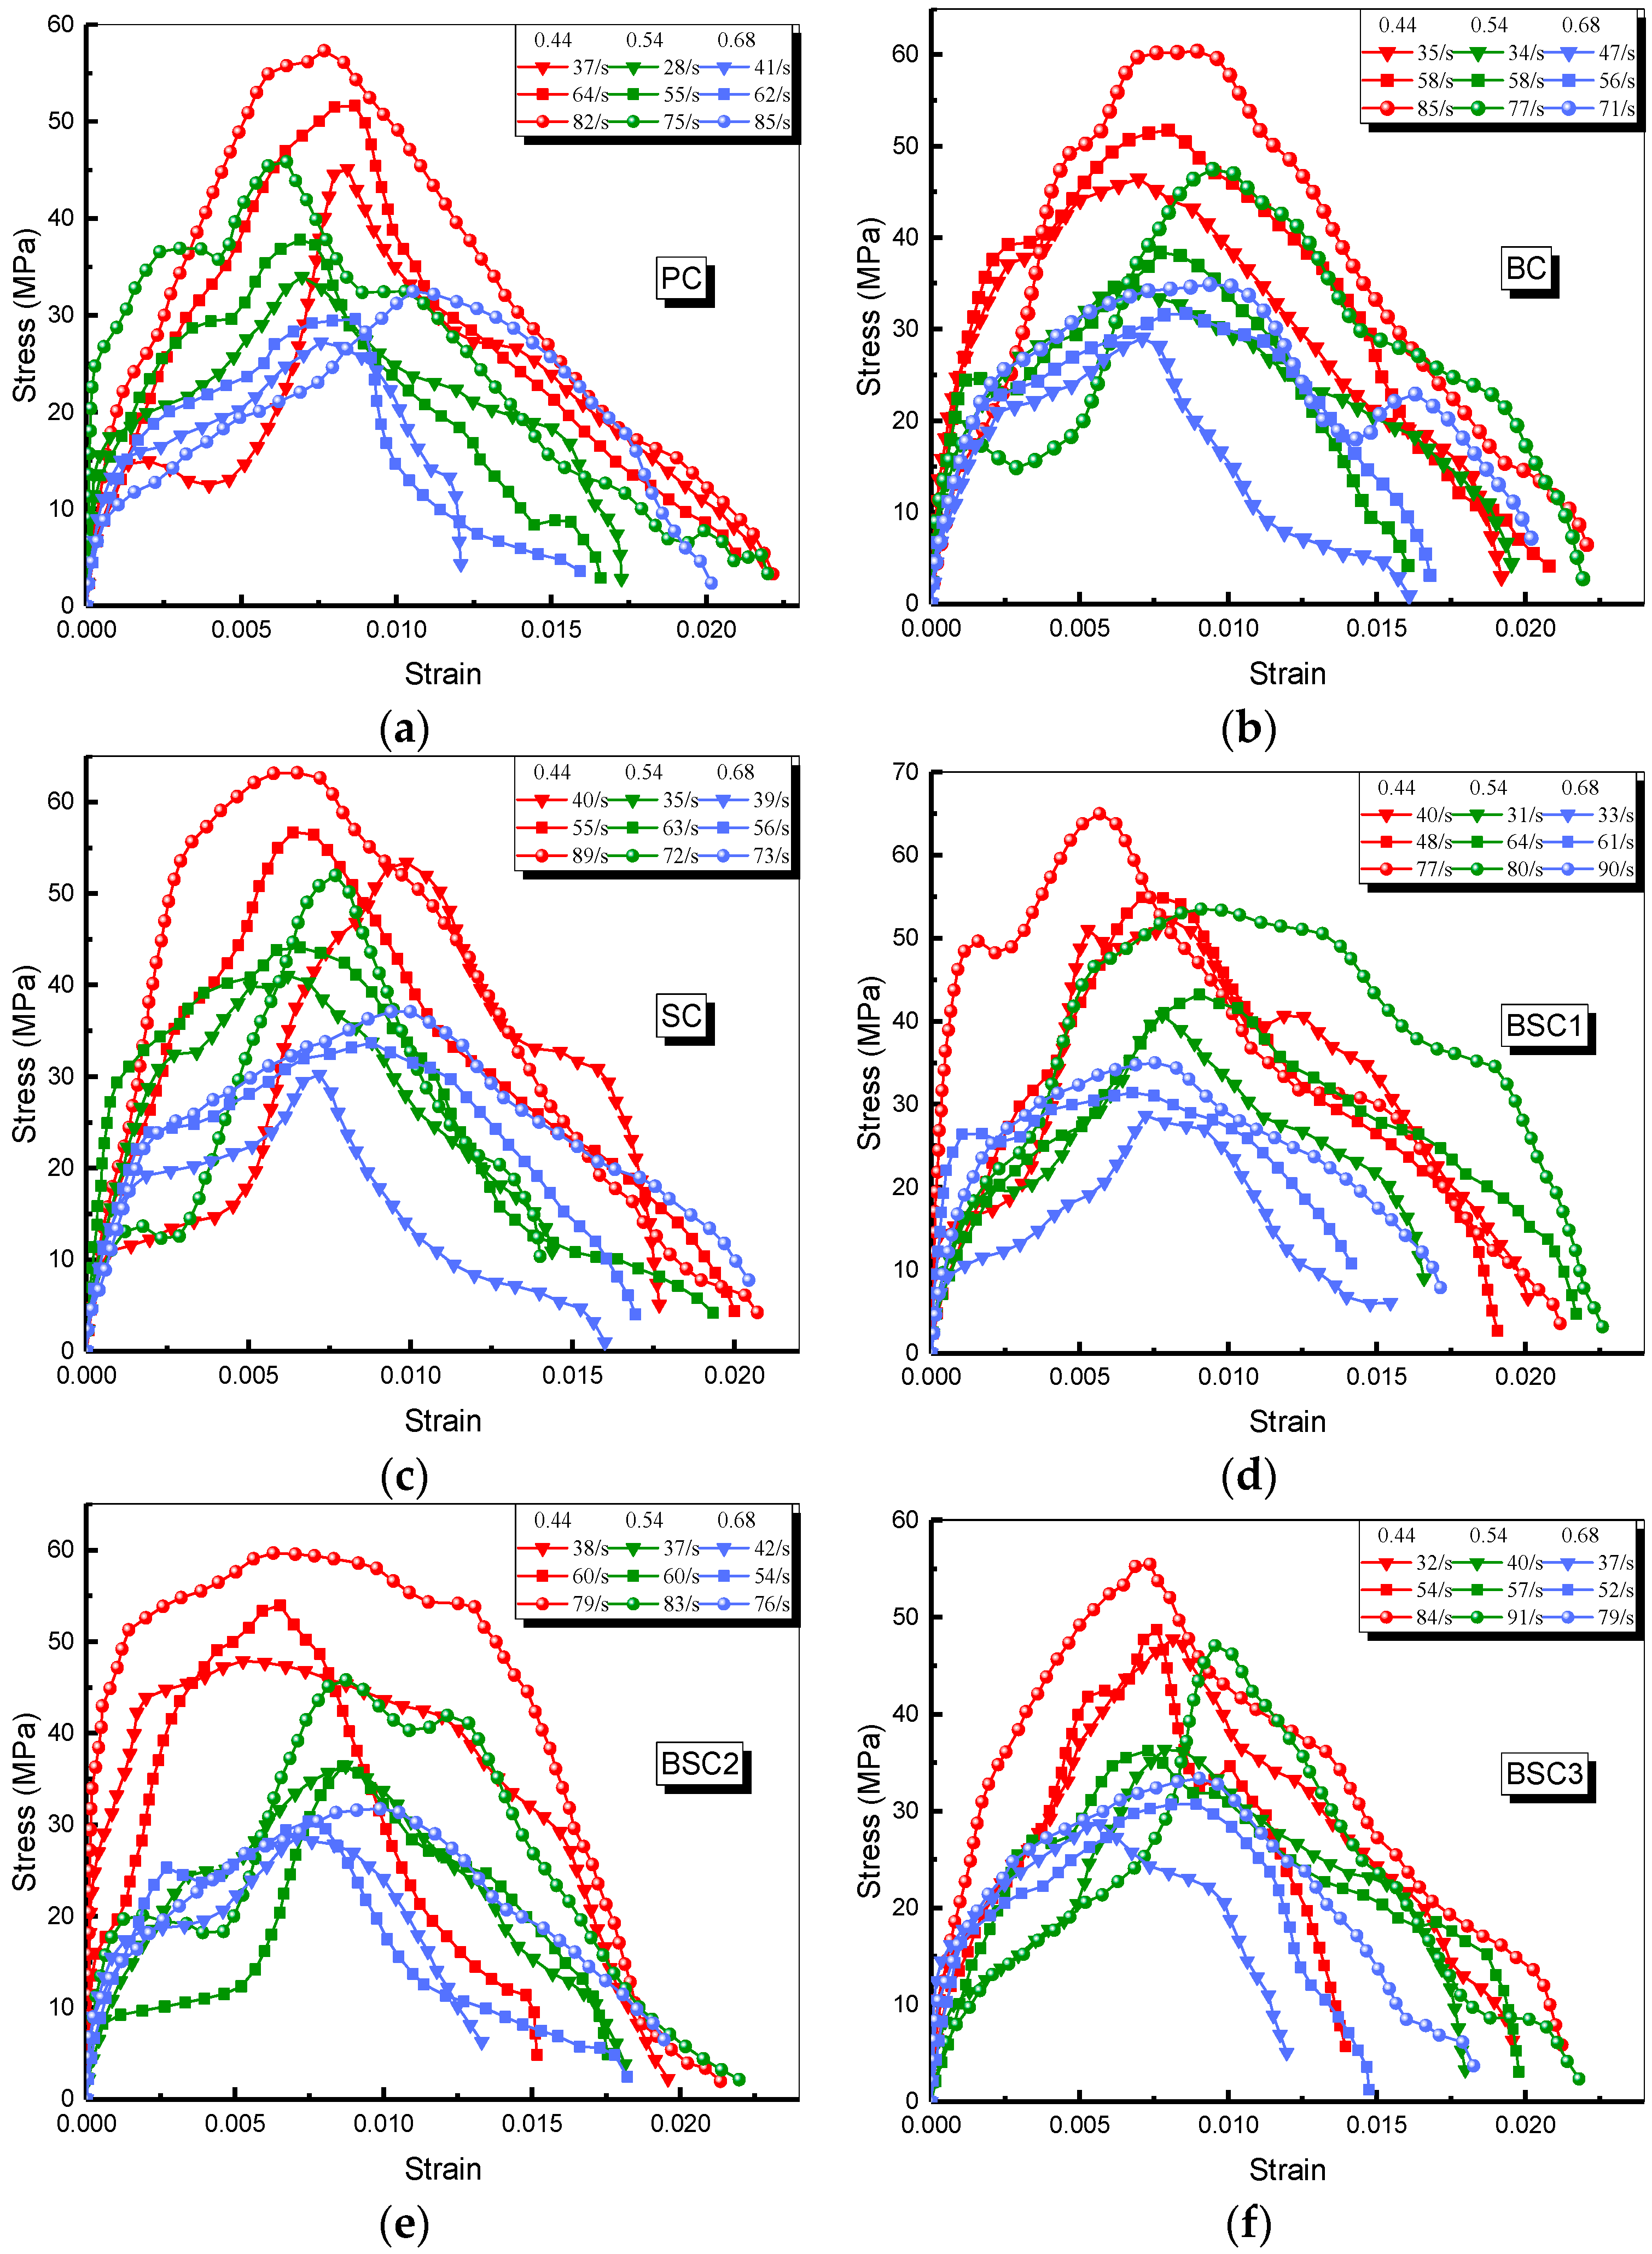
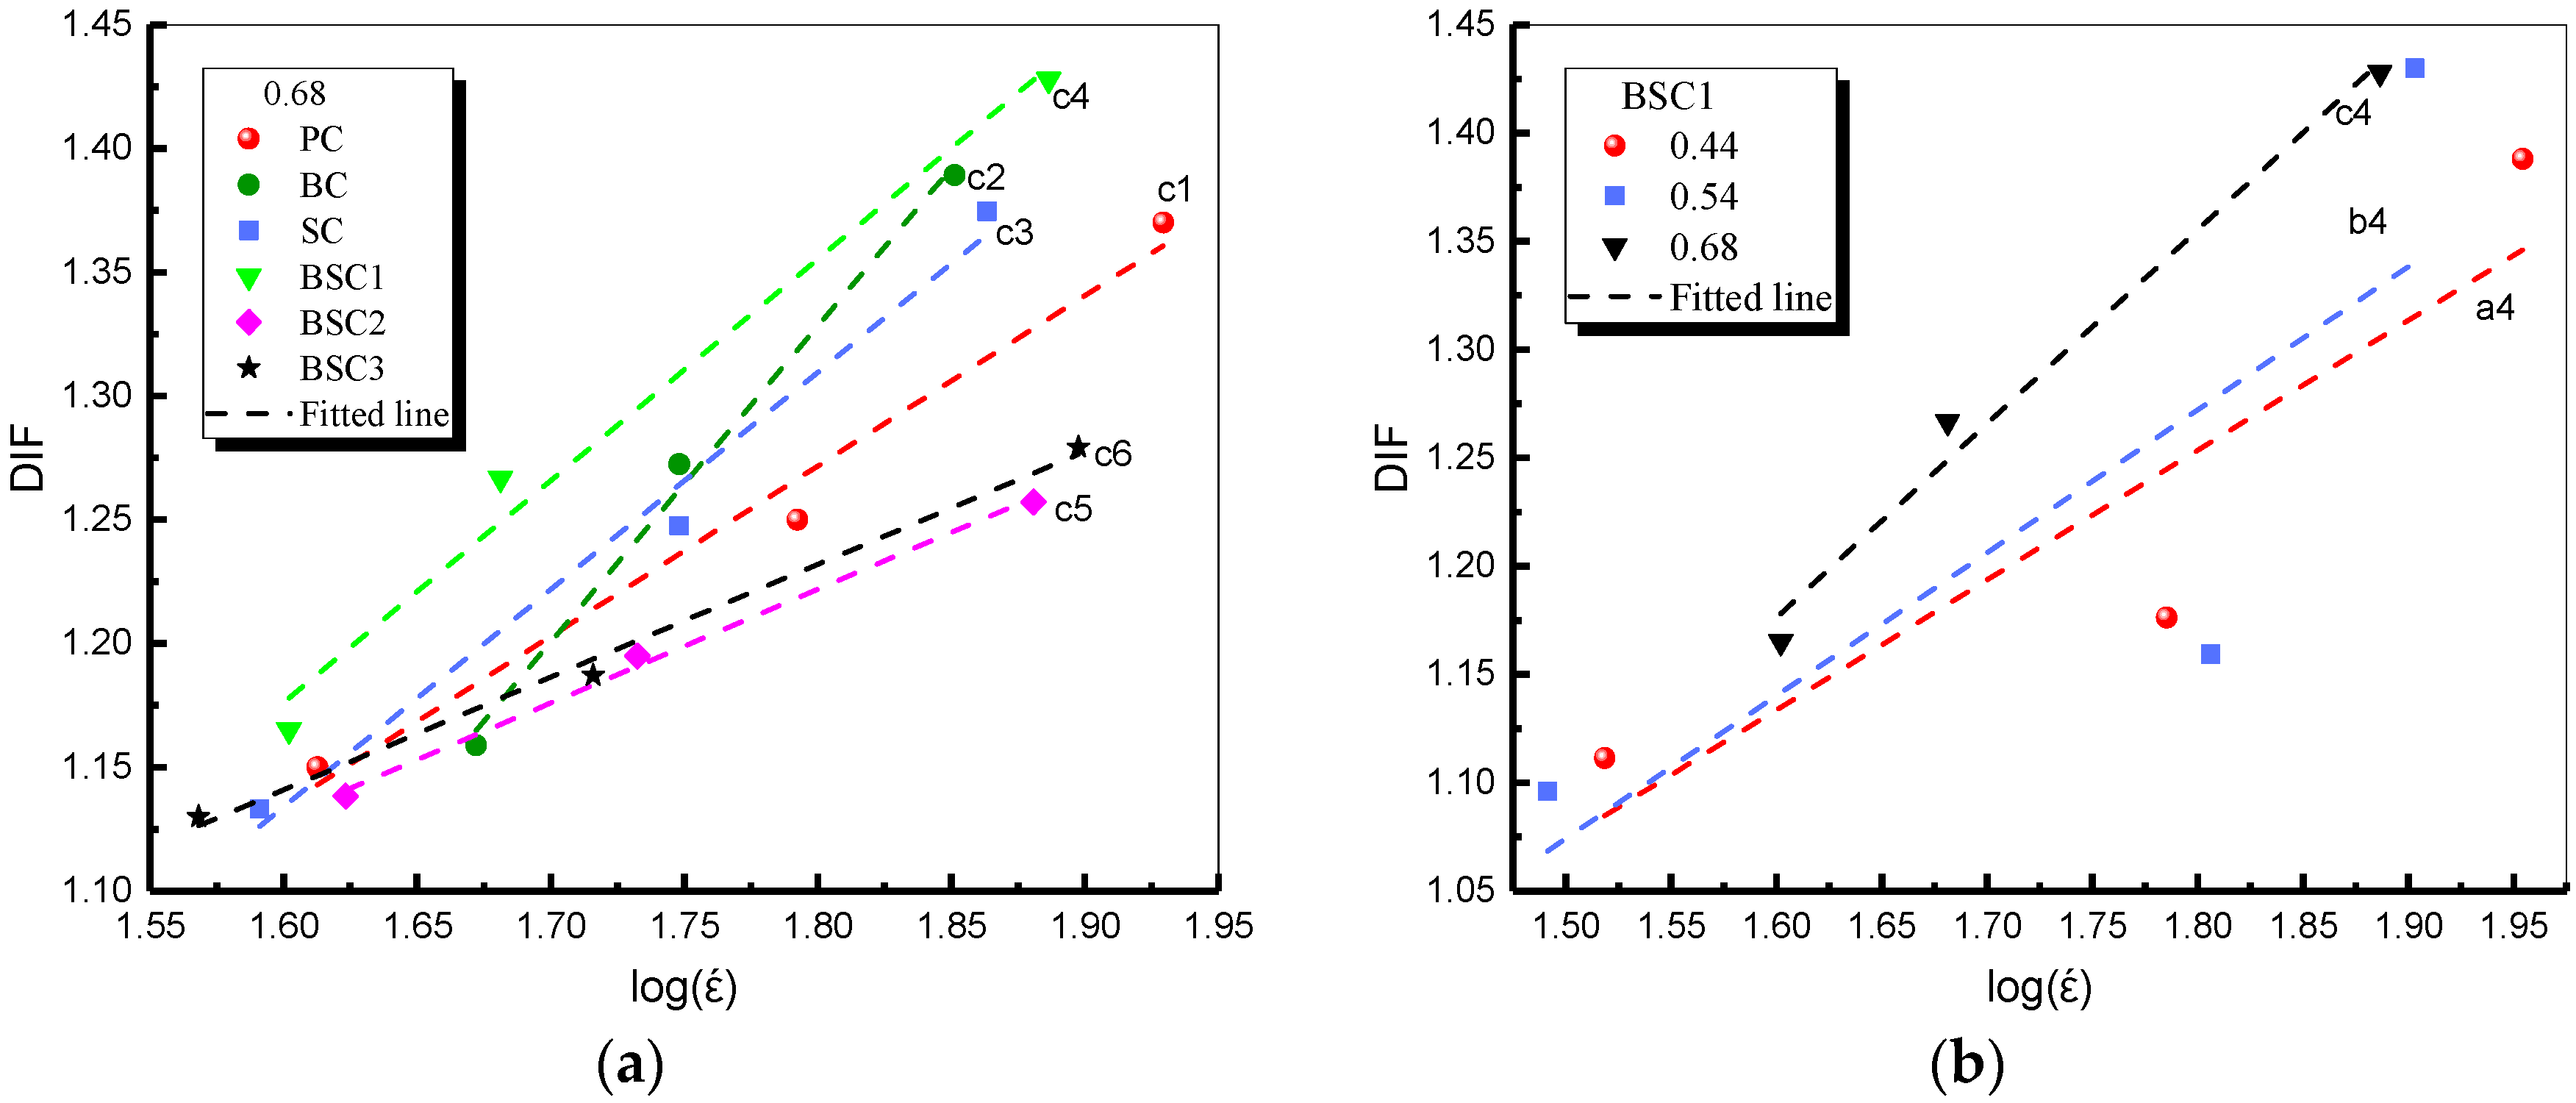
- The impact test results indicate that BSFRC material is significantly affected by strain rate which can improve the dynamic mechanical parameters of BSFRC. The results show that DIF and are linearly related. BSFRC with higher w/c ratio has a higher strain rate effect. As the strength of concrete decreases with increasing w/c ratio, the research indicates that the reduction of the concrete strength increases its strain rate sensitivity.
- Both fibers can improve the impact strength and toughness. Their hybridization has similar improvement effects on impact strength but can further increase the impact toughness and the best hybrid ratio is 0.05% (BF)–0.25% (SF). Higher w/c ratio will weaken the effect of fiber hybridization.
- The proposed model can well describe the impact behavior of BSFRC. The fitted parameters of , , and m are sensitive to strain rate. The static and dynamic elastic constant of BSFRC are improved compared to plain concrete. The BF and SF hybridization can restrain the damage evolution of concrete more obviously.
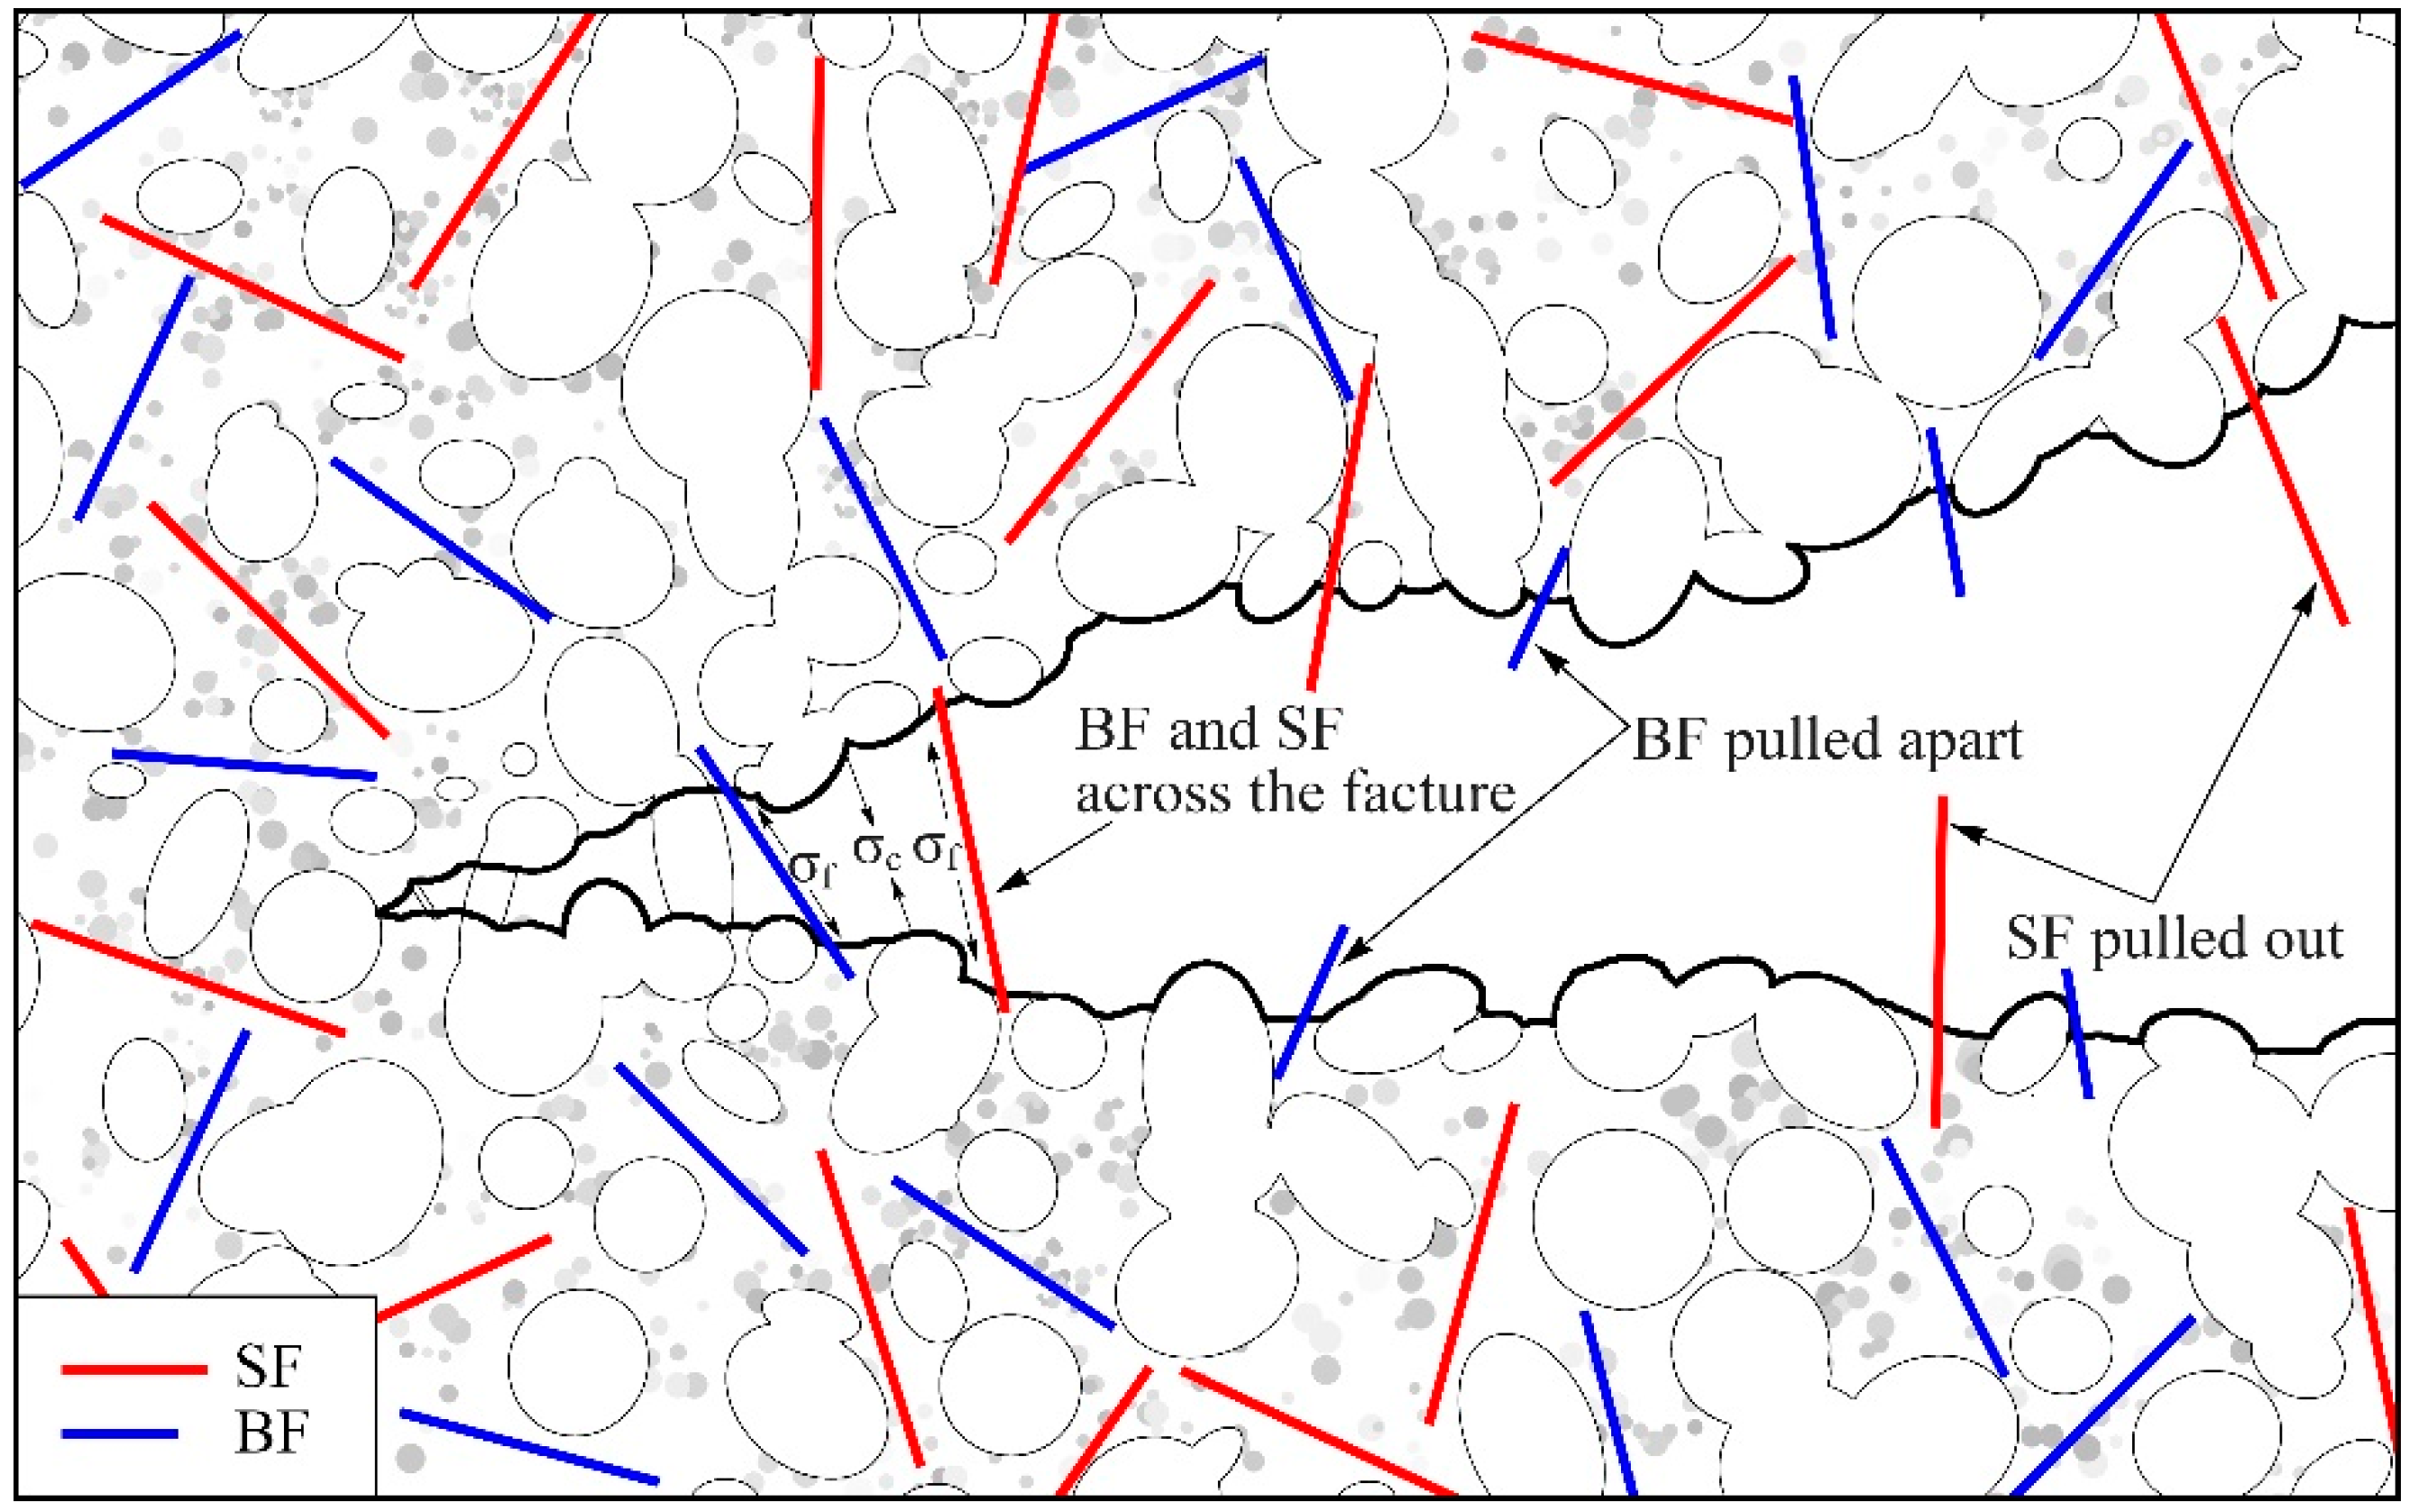
- The mortar structure gets more compact with more C–S–H and less with the decrease of w/c ratio. Besides, degree of damage in the ITZ of PC decreases as well but is worse than that in the CM. BF and SF with proper fiber content can be evenly distributed in concrete. BF are mostly pulled apart while SF are mostly pulled out in fracture areas. The energy spectrum results show that the hydration of cement in the ITZ is lower with more C–S–H and less than CM. However, the addition of BF and SF can promote the hydration of cement in the ITZ and improve the performance of ITZ.
Author Contributions
Funding
Conflicts of Interest
References
- Afroughsabet, V.; Biolzi, L.; Ozbakkaloglu, T. High-performance fiber-reinforced concrete: A review. J. Mater. Sci. 2016, 51, 6517–6551. [Google Scholar] [CrossRef]
- Zhang, H.; Wang, L.; Bai, L.; Addae, M.; Neupane, A. Research on the impact response and model of hybrid basalt-macro synthetic polypropylene fiber reinforced concrete. Constr. Build. Mater. 2019, 204, 303–316. [Google Scholar] [CrossRef]
- Li, Z.; Li, C.; Shi, Y.; Zhou, X. Experimental investigation on mechanical properties of Hybrid Fibre Reinforced Concrete. Constr. Build. Mater. 2017, 157, 930–942. [Google Scholar] [CrossRef]
- Forgeron, D.; Omer, A. Flow characteristics of macro-synthetic fiber-reinforced self-consolidating concrete. Spec. Publ. 2010, 274, 1–14. [Google Scholar]
- Ralegaonkar, R.; Gavali, H.; Aswath, P.; Abolmaali, S. Application of chopped basalt fibers in reinforced mortar: A review. Constr. Build. Mater. 2018, 164, 589–602. [Google Scholar] [CrossRef]
- CECS 38:2004 Technical Specification for Fiber Reinforced Concrete Structures; China Planning Press: Beijing, China, 2004.
- Hasan, M.J.; Afroz, M.; Mahmud, H.M.I. An Experimental Investigation on Mechanical Behavior of Macro Synthetic Fiber Reinforced Concrete. Int. J. Civ. Environ. Eng. 2011, 11, 18–23. [Google Scholar]
- Bolat, H.; Şimşek, O.; Çullu, M.; Durmuş, G.; Can, Ö. The effects of macro synthetic fiber reinforcement use on physical and mechanical properties of concrete. Compos. Part B Eng. 2014, 61, 191–198. [Google Scholar] [CrossRef]
- Gao, R.; Xiangmin, L.I.; Qingfeng, X.U.; Minshan, D.U. Experimental research on pervious concrete mixed with polypropylene thick fiber(PPTF). New Build. Mater. 2014, 1065, 1894–1898. [Google Scholar]
- Krassowska, J.; Kosior-Kazberuk, M. Shear behavior of steel or basalt fiber reinforced concrete beams without stirrup reinforcement. Tech. Sci. Univ. Warmia Mazury Olsztyn 2017, 20, 391–404. [Google Scholar]
- Cao, H. Experimental investigation on the static and impact behaviors of basalt fiber-reinforced concrete. Open Civ. Eng. J. 2017, 11, 14–21. [Google Scholar] [CrossRef]
- Yin, Y. Experimental study on mechanical properties and durability of basalt fiber reinforced concrete. Master’s Thesis, Chongqing Jiaotong University, Chongqing, China, 2015. [Google Scholar]
- Zhu, H. Study on Durability of Basalt Fiber Reinforced Concrete. Master’s Thesis, Wuhan University of Technology, Wuhan, China, 2009. [Google Scholar]
- Larrinaga, P.; Chastre, C.; Biscaia, H.C.; San-José, J.T.J.M. Experimental and numerical modeling of basalt textile reinforced mortar behavior under uniaxial tensile stress. Mater. Des. 2014, 55, 66–74. [Google Scholar] [CrossRef]
- Portal, N.W. Sustainability and flexural behaviour of textile reinforced concrete. Licentiate Thesis, Chalmers University of Technology, Gothenburg, Sweden, 2013. [Google Scholar]
- Yu, R.; Spiesz, P.; Brouwers, H. Static properties and impact resistance of a green Ultra-High Performance Hybrid Fibre Reinforced Concrete (UHPHFRC): Experiments and modeling. Constr. Build. Mater. 2014, 68, 158–171. [Google Scholar] [CrossRef]
- Ali, M.A.E.M.; Soliman, A.M.; Nehdi, M.L. Hybrid-fiber reinforced engineered cementitious composite under tensile and impact loading. Mater. Des. 2017, 117, 139–149. [Google Scholar] [CrossRef]
- Pakravan, H.R.; Latifi, M.; Jamshidi, M. Hybrid short fiber reinforcement system in concrete: A review. Constr. Build. Mater. 2017, 142, 280–294. [Google Scholar] [CrossRef]
- Henning, S.; Adhikari, R. Chapter 1—Scanning Electron Microscopy, ESEM, and X-ray Microanalysis. In Microscopy Methods in Nanomaterials Characterization; Thomas, S., Thomas, R., Zachariah, A.K., Mishra, R.K., Eds.; Elsevier: Amsterdam, The Netherlands, 2017; pp. 1–30. [Google Scholar]
- Zhang, H.; Wang, B.; Xie, A.; Qi, Y. Experimental study on dynamic mechanical properties and constitutive model of basalt fiber reinforced concrete. Constr. Build. Mater. 2017, 152, 154–167. [Google Scholar] [CrossRef]
- Behfarnia, K.; Rostami, M. Mechanical properties and durability of fiber reinforced alkali activated slag concrete. J. Mater. Civ. Eng. 2017, 29, 04017231. [Google Scholar] [CrossRef]
- GB175-2009. Common Portland Cement; China Standard Press: Beijing, China, 2009. [Google Scholar]
- Li, X.; Hong, L.; Yin, T.; Zhou, Z.; Ye, Z. Relationship between diameter of split Hopkinson pressure bar and minimum loading rate under rock failure. J. Cent. South Univ. Technol. 2008, 15, 218–223. [Google Scholar] [CrossRef]
- Chinese Standard GB/T 50081. Standard for Test Method of Mechanical Properties on Ordinary Concrete; China Architecture and Building Press: Beijing, China, 2016. [Google Scholar]
- Pacheco, J.; Çopuroğlu, O.; Šavija, B.; Schlangen, E.; Polder, R. Assessment of critical chloride content in reinforced concrete by Energy Dispersive Spectrometry (EDS) revisited. In Proceedings of the 3rd International Conference on Concrete Repair, Rehabilitation and Retrofitting, Cape Town, South Africa, 21 August 2012. [Google Scholar]
- Wang, G.C. The utilization of slag in civil infrastructure construction; Woodhead Publishing: Cambridge, UK, 2016. [Google Scholar]
- Hopkinson, B. A method of measuring the pressure produced in the detonation of high explosives or by the impact of bullets. Philos. Trans. R. Soc. London Ser. A Contain. Papers Math. Phys. Charact. 1914, 213, 437–456. [Google Scholar] [CrossRef]
- Kolsky, H. An investigation of the mechanical properties of materials at very high rates of loading. Proc. Phys. Soc. Sec. B 1949, 62, 676. [Google Scholar] [CrossRef]
- Frew, D.; Forrestal, M.J.; Chen, W. Pulse shaping techniques for testing brittle materials with a split Hopkinson pressure bar. Exp. Mech. 2002, 42, 93–106. [Google Scholar] [CrossRef]
- Grote, D.; Park, S.; Zhou, M. Dynamic behavior of concrete at high strain rates and pressures: I. experimental characterization. Int. J. Impact Eng. 2001, 25, 869–886. [Google Scholar] [CrossRef]
- Giner, V.T.; Baeza, F.J.; Ivorra, S.; Zornoza, E.; Galao, Ó. Effect of steel and carbon fiber additions on the dynamic properties of concrete containing silica fume. Mater. Des. 2012, 34, 332–339. [Google Scholar] [CrossRef]
- Li, Q.; Meng, H. About the dynamic strength enhancement of concrete-like materials in a split Hopkinson pressure bar test. Int. J. Solid. Struct. 2003, 40, 343–360. [Google Scholar] [CrossRef]
- Hao, H.; Hao, Y.; Li, J.; Chen, W. Review of the current practices in blast-resistant analysis and design of concrete structures. Adv. Struct. Eng. 2016, 19, 1193–1223. [Google Scholar] [CrossRef]
- Yang, L.; Fan, J.; Vu-Bac, N.; Rabczuk, T. A nanoscale study of the negative strain rate dependency of the strength of metallic glasses by molecular dynamics simulations. Phys. Chem. Chem. Phys. 2018, 20, 26552–26557. [Google Scholar] [CrossRef]
- FIB-Special Activity Group 5. FIB Bulletin 65: Model Code 2010—Final Draft; International Federation for Structural Concrete (FIB): Lausanne, Switzerland, 2012. [Google Scholar]
- Fujikake, K.; Uebayashi, K.; Ohno, T.; Mizuno, J.; Suzuki, A. Formulation of orthotropic constitutive model for concrete materials under high strain-rates and triaxial stress states. Doboku Gakkai Ronbunshu 2001, 50, 109–123. [Google Scholar] [CrossRef][Green Version]
- Tedesco, J.; Ross, C. Strain-rate-dependent constitutive equations for concrete. J. Press. Vessel Technol. 1998, 120, 398–405. [Google Scholar] [CrossRef]
- Ross, C.A.; Tedesco, J. Split-Hopkinson pressure-bar tests on concrete and mortar in tension and compression. Mater. J. 1989, 86, 475–481. [Google Scholar]
- Al-Salloum, Y.; Almusallam, T.; Ibrahim, S.M.; Abbas, H.; Alsayed, S. Rate dependent behavior and modeling of concrete based on SHPB experiments. Cem. Concr. Compos. 2015, 55, 34–44. [Google Scholar] [CrossRef]
- Jiao, C.; Sun, W.; Huan, S.; Jiang, G. Behavior of steel fiber-reinforced high-strength concrete at medium strain rate. Front. Architect. Civ. Eng. China 2009, 3, 131–136. [Google Scholar] [CrossRef]
- Foote, R.M.; Mai, Y.-W.; Cotterell, B. Crack growth resistance curves in strain-softening materials. J. Mech. Phys. Solid. 1986, 34, 593–607. [Google Scholar] [CrossRef]
- Zhang, H.; Wang, L.; Zheng, K.; Bakura, T.J.; Totakhil, P.G. Research on compressive impact dynamic behavior and constitutive model of polypropylene fiber reinforced concrete. Constr. Build. Mater. 2018, 187, 584–595. [Google Scholar] [CrossRef]
- Wang, Y.M.; Liu, K.; Yang, W.W.; Sun, J.Z. Properties of flexible fiber and rigid fiber reinforced cement concrete used on surface layer of wharf pavement. Adv. Mater. Res. 2011, 224, 70–78. [Google Scholar] [CrossRef]
- Fu, Q.; Niu, D.; Zhang, J.; Huang, D.; Hong, M. Impact response of concrete reinforced with hybrid basalt-polypropylene fibers. Powder Technol. 2018, 326, 411–424. [Google Scholar] [CrossRef]
- Zhou, F.H.; Wang, L.L.; Hu, S.S. A damage-modified nonlinear visco-elastic constitutive relation and failure criterion of PMMA at high strain-rates. Explos. Shock Waves 1992, 12, 333–342. [Google Scholar]
- Wang, Z.; Li, Y.; Wang, J.G. A damage-softening statistical constitutive model considering rock residual strength. Comput. Geosci. 2007, 33, 1–9. [Google Scholar] [CrossRef]
- Pacewska, B.; Wilińska, I. Hydration of cement composites containing large amount of waste materials. Procedia Eng. 2013, 57, 53–62. [Google Scholar] [CrossRef]
- Jakobsen, U.H.; De Weerdt, K.; Geiker, M.R. Elemental zonation in marine concrete. Cem. Concr. Res. 2016, 85, 12–27. [Google Scholar] [CrossRef]
- Ouyang, L.; An, Z.; Yang, W.; Ding, B.; Zhen, B. Research progress in microscopic characteristics of concrete interface transition zone (ITZ). China Concr. Cem. Prod. 2018, 7–12. [Google Scholar]


| w/c Ratio | Proportion (kg/m3) | |||
|---|---|---|---|---|
| Water | Cement | Sand | Detritus | |
| 0.44 | 225 | 511 | 525 | 1120 |
| 0.54 | 225 | 417 | 589 | 1169 |
| 0.68 | 225 | 331 | 728 | 1116 |
| Fiber | Diameter (μm) | Fiber Length (mm) | Density (g/cm3) | Modulus of Elasticity (GPa) | Tensile Trength (GPa) | Elongation (%) |
|---|---|---|---|---|---|---|
| BF | 15 | 12 | 2.65 | 93–110 | 4.5 | 3.15 |
| SF | 800 | 15 | 0.91 | 9 | 0.45 | 15 |
| Group | BF | SF | w/c: 0.44 | w/c: 0.54 | w/c: 0.68 | |||
|---|---|---|---|---|---|---|---|---|
| % | % | IP(MPa) | Label | IP(MPa) | Label | IP(MPa) | Label | |
| PC | 0 | 0 | 0 | S-1 | 0 | S-7 | 0 | S-13 |
| 0.3 | 1 | 0.3 | 19 | 0.3 | 37 | |||
| 0.4 | 2 | 0.4 | 20 | 0.4 | 38 | |||
| 0.5 | 3 | 0.5 | 21 | 0.5 | 39 | |||
| BC | 0.1 | 0 | 0 | S-2 | 0 | S-8 | 0 | S-14 |
| 0.3 | 4 | 0.3 | 22 | 0.3 | 40 | |||
| 0.4 | 5 | 0.4 | 23 | 0.4 | 41 | |||
| 0.5 | 6 | 0.5 | 24 | 0.5 | 42 | |||
| SC | 0 | 0.5 | 0 | S-3 | 0 | S-9 | 0 | S-15 |
| 0.3 | 7 | 0.3 | 25 | 0.3 | 43 | |||
| 0.4 | 8 | 0.4 | 26 | 0.4 | 44 | |||
| 0.5 | 9 | 0.5 | 27 | 0.5 | 45 | |||
| BSC1 | 0.05 | 0.25 | 0 | S-4 | 0 | S-10 | 0 | S-16 |
| 0.3 | 10 | 0.3 | 28 | 0.3 | 46 | |||
| 0.4 | 11 | 0.4 | 29 | 0.4 | 47 | |||
| 0.5 | 12 | 0.5 | 30 | 0.5 | 48 | |||
| BSC2 | 0.05 | 0.5 | 0 | S-5 | 0 | S-11 | 0 | S-17 |
| 0.3 | 13 | 0.3 | 31 | 0.3 | 49 | |||
| 0.4 | 14 | 0.4 | 32 | 0.4 | 50 | |||
| 0.5 | 15 | 0.5 | 33 | 0.5 | 51 | |||
| BSC3 | 0.1 | 0.25 | 0 | S-6 | 0 | S-12 | 0 | S-18 |
| 0.3 | 16 | 0.3 | 34 | 0.3 | 52 | |||
| 0.4 | 17 | 0.4 | 35 | 0.4 | 53 | |||
| 0.5 | 18 | 0.5 | 36 | 0.5 | 54 | |||
| Label | Strain Rate (/s) | Peak Stress (MPa) | Peak Strain | Ultimate Strain | Peak Toughness ×103 kJ/m3 | Ultimate Toughness ×103 kJ/m3 |
|---|---|---|---|---|---|---|
| 1 | 37 | 45.71 | 0.00820 | 0.0218 | 0.1509 | 0.4112 |
| 2 | 64 | 52.00 | 0.00852 | 0.02104 | 0.2813 | 0.4965 |
| 3 | 82 | 57.36 | 0.00771 | 0.02201 | 0.2992 | 0.6296 |
| 4 | 35 | 46.54 | 0.00692 | 0.01922 | 0.2498 | 0.5616 |
| 5 | 58 | 51.80 | 0.00789 | 0.02099 | 0.3098 | 0.6268 |
| 6 | 85 | 60.25 | 0.00754 | 0.02224 | 0.2763 | 0.6983 |
| 7 | 40 | 53.04 | 0.00812 | 0.01770 | 0.2586 | 0.5240 |
| 8 | 55 | 56.83 | 0.00667 | 0.02021 | 0.2359 | 0.5576 |
| 9 | 89 | 62.99 | 0.00624 | 0.02086 | 0.2923 | 0.7947 |
| 10 | 33 | 52.12 | 0.00813 | 0.02014 | 0.2711 | 0.6157 |
| 11 | 61 | 55.17 | 0.00737 | 0.01906 | 0.2389 | 0.5760 |
| 12 | 90 | 65.10 | 0.00629 | 0.02124 | 0.3287 | 0.8159 |
| 13 | 38 | 47.83 | 0.00582 | 0.01958 | 0.2411 | 0.5826 |
| 14 | 60 | 54.09 | 0.00628 | 0.02044 | 0.2369 | 0.4834 |
| 15 | 79 | 59.57 | 0.00711 | 0.02138 | 0.2626 | 0.6249 |
| 16 | 32 | 48.32 | 0.00838 | 0.01856 | 0.2630 | 0.5238 |
| 17 | 54 | 48.94 | 0.00737 | 0.01709 | 0.2157 | 0.4678 |
| 18 | 84 | 55.86 | 0.00688 | 0.02128 | 0.2626 | 0.6249 |
| 19 | 28 | 34.12 | 0.00683 | 0.01722 | 0.1558 | 0.3736 |
| 20 | 55 | 38.06 | 0.00722 | 0.01663 | 0.1948 | 0.3283 |
| 21 | 75 | 46.27 | 0.00620 | 0.02201 | 0.2201 | 0.4732 |
| 22 | 34 | 34.41 | 0.00676 | 0.01764 | 0.1733 | 0.4482 |
| 23 | 58 | 38.72 | 0.00795 | 0.01868 | 0.2172 | 0.3898 |
| 24 | 77 | 47.57 | 0.00973 | 0.02196 | 0.2552 | 0.5805 |
| 25 | 35 | 40.80 | 0.00642 | 0.01432 | 0.1935 | 0.3922 |
| 26 | 63 | 44.23 | 0.00618 | 0.01782 | 0.2134 | 0.4820 |
| 27 | 72 | 51.89 | 0.00768 | 0.01985 | 0.1942 | 0.4201 |
| 28 | 31 | 40.99 | 0.00788 | 0.01606 | 0.1895 | 0.4205 |
| 29 | 64 | 43.36 | 0.00884 | 0.02179 | 0.2335 | 0.5006 |
| 30 | 80 | 53.48 | 0.00918 | 0.02256 | 0.2912 | 0.6891 |
| 31 | 37 | 36.54 | 0.00860 | 0.01823 | 0.2052 | 0.3826 |
| 32 | 60 | 36.78 | 0.00867 | 0.01757 | 0.1669 | 0.3927 |
| 33 | 83 | 45.87 | 0.00850 | 0.02232 | 0.2116 | 0.5121 |
| 34 | 40 | 36.82 | 0.00804 | 0.01798 | 0.1622 | 0.4052 |
| 35 | 57 | 36.35 | 0.00728 | 0.01975 | 0.1725 | 0.4525 |
| 36 | 91 | 47.20 | 0.00938 | 0.02196 | 0.2065 | 0.4265 |
| 37 | 41 | 27.37 | 0.00776 | 0.01120 | 0.1461 | 0.2340 |
| 38 | 62 | 29.75 | 0.00876 | 0.01637 | 0.1887 | 0.2271 |
| 39 | 85 | 32.61 | 0.01141 | 0.01918 | 0.2013 | 0.4012 |
| 40 | 47 | 29.09 | 0.00732 | 0.01604 | 0.1486 | 0.2225 |
| 41 | 56 | 31.94 | 0.00841 | 0.01677 | 0.1848 | 0.3768 |
| 42 | 71 | 34.87 | 0.00999 | 0.02044 | 0.2245 | 0.4437 |
| 43 | 39 | 30.48 | 0.00712 | 0.01594 | 0.1420 | 0.2094 |
| 44 | 56 | 33.56 | 0.00848 | 0.01692 | 0.2105 | 0.3898 |
| 45 | 73 | 36.98 | 0.01012 | 0.02053 | 0.2415 | 0.4847 |
| 46 | 40 | 28.78 | 0.00730 | 0.01578 | 0.1160 | 0.2271 |
| 47 | 48 | 31.29 | 0.00728 | 0.01370 | 0.1973 | 0.3648 |
| 48 | 77 | 35.27 | 0.00886 | 0.01705 | 0.2576 | 0.4204 |
| 49 | 42 | 28.80 | 0.00720 | 0.01321 | 0.1425 | 0.2599 |
| 50 | 54 | 30.23 | 0.00778 | 0.01824 | 0.1778 | 0.2585 |
| 51 | 76 | 31.81 | 0.01024 | 0.02136 | 0.2474 | 0.4107 |
| 52 | 37 | 29.04 | 0.00549 | 0.01196 | 0.1209 | 0.2506 |
| 53 | 52 | 30.51 | 0.00883 | 0.01462 | 0.2047 | 0.3021 |
| 54 | 79 | 32.88 | 0.00835 | 0.01819 | 0.2135 | 0.3840 |
| w/c Ratio | Group | Label | Functions | R | R2 |
|---|---|---|---|---|---|
| 0.44 | BSC1 | a4 | 0.91064 | 0.82926 | |
| 0.54 | BSC1 | b4 | 0.80177 | 0.64283 | |
| 0.68 | PC | c1 | 0.99152 | 0.98311 | |
| BC | c2 | 0.99690 | 0.99381 | ||
| SC | c3 | 0.99293 | 0.98591 | ||
| BSC1 | c4 | 0.99275 | 0.98555 | ||
| BSC2 | c5 | 0.99826 | 0.99652 | ||
| BSC3 | c6 | 0.99717 | 0.99434 |
| w/c Ratio | Group | Strain Rate (/s) | m | a (×10−3) | |||||
|---|---|---|---|---|---|---|---|---|---|
| 0.44 | SC | 40 | 0.538 | 8.7 | 10.4 | 1.37 | 5.992 | 2.154 | 14.23 |
| SC | 55 | 1.512 | 8.7 | 14.3 | 2.15 | 11.56 | 1.982 | 10.22 | |
| SC | 89 | 0.376 | 8.7 | 18.4 | 2.37 | 2.225 | 1.933 | 10.53 | |
| 0.54 | BSC1 | 31 | 0.694 | 7.9 | 13.4 | 1.35 | 1.181 | 1.954 | 10.28 |
| BSC1 | 64 | 1.013 | 7.9 | 14.8 | 1.56 | 1.225 | 1.865 | 11.36 | |
| BSC1 | 80 | 1.410 | 7.9 | 15.9 | 1.97 | 2.348 | 1.800 | 13.40 | |
| 0.68 | BC | 47 | 1.265 | 8.1 | 11.8 | 1.18 | 5.188 | 1.730 | 7.36 |
| BC | 56 | 0.793 | 8.1 | 12.8 | 1.26 | 6.44 | 1.350 | 8.62 | |
| BC | 71 | 0.792 | 8.1 | 14.4 | 1.32 | 7.244 | 1.310 | 9.36 |
| w/c Ratio | Group | Strain Rate (/s) | m | a (×10−3) | |||||
|---|---|---|---|---|---|---|---|---|---|
| 0.44 | PC | 64 | 1.545 | 7.5 | 11.8 | 4.84 | 23.96 | 1.350 | 9.58 |
| BC | 58 | 0.765 | 8.5 | 16.9 | 1.92 | 15.34 | 1.928 | 10.92 | |
| SC | 55 | 1.512 | 8.7 | 14.3 | 2.15 | 11.56 | 1.852 | 10.22 | |
| BSC1 | 61 | 1.480 | 7.9 | 12.5 | 4.32 | 4.163 | 2.129 | 11.48 | |
| BSC2 | 60 | 2.790 | 8.8 | 15.3 | 2.68 | 11.78 | 2.186 | 8.77 | |
| BSC3 | 54 | 0.787 | 7.4 | 11.5 | 3.22 | 6.297 | 2.103 | 10.37 |
| Element | Atomic Percentage (%) | |||||||
|---|---|---|---|---|---|---|---|---|
| O | Mg | Al | Si | S | K | Ca | Fe | |
| Spectrum 1 | 45.88 | 0.65 | 2.49 | 8.96 | 1.39 | 1.19 | 38.04 | 1.40 |
| Spectrum 2 | 34.13 | 2.79 | 6.67 | 15.51 | 1.64 | 4.63 | 30.69 | 3.94 |
| Spectrum 3 | 36.44 | 0.66 | 4.29 | 14.21 | 2.12 | 1.52 | 39.13 | 1.63 |
| Spectrum 4 | 38.84 | 1.29 | 5.25 | 11.52 | 2.21 | 0.95 | 38.11 | 1.83 |
| Spectrum 5 | 45.56 | 0.98 | 2.92 | 11.70 | 0.98 | 0.37 | 35.86 | 1.63 |
© 2019 by the authors. Licensee MDPI, Basel, Switzerland. This article is an open access article distributed under the terms and conditions of the Creative Commons Attribution (CC BY) license (http://creativecommons.org/licenses/by/4.0/).
Share and Cite
Wang, L.; Zhang, H.; Bai, L.; Hong, H.; Tao, J.; Addae, M. Effect of Fiber Hybridization, Strain Rate and w/c Ratio on the Impact Behavior of Hybrid FRC. Materials 2019, 12, 2780. https://doi.org/10.3390/ma12172780
Wang L, Zhang H, Bai L, Hong H, Tao J, Addae M. Effect of Fiber Hybridization, Strain Rate and w/c Ratio on the Impact Behavior of Hybrid FRC. Materials. 2019; 12(17):2780. https://doi.org/10.3390/ma12172780
Chicago/Turabian StyleWang, Lei, Hua Zhang, Lingyu Bai, Heang Hong, Jie Tao, and Maxwell Addae. 2019. "Effect of Fiber Hybridization, Strain Rate and w/c Ratio on the Impact Behavior of Hybrid FRC" Materials 12, no. 17: 2780. https://doi.org/10.3390/ma12172780
APA StyleWang, L., Zhang, H., Bai, L., Hong, H., Tao, J., & Addae, M. (2019). Effect of Fiber Hybridization, Strain Rate and w/c Ratio on the Impact Behavior of Hybrid FRC. Materials, 12(17), 2780. https://doi.org/10.3390/ma12172780