Plasma Treating Mixed Metal Oxides to Improve Oxidative Performance via Defect Generation


Abstract
:
1. Introduction
2. Experimental
2.1. Mixed Metal Oxide Preparation
2.2. Catalyst Characterization
2.3. Catalyst Activity Testing
3. Results and Discussion
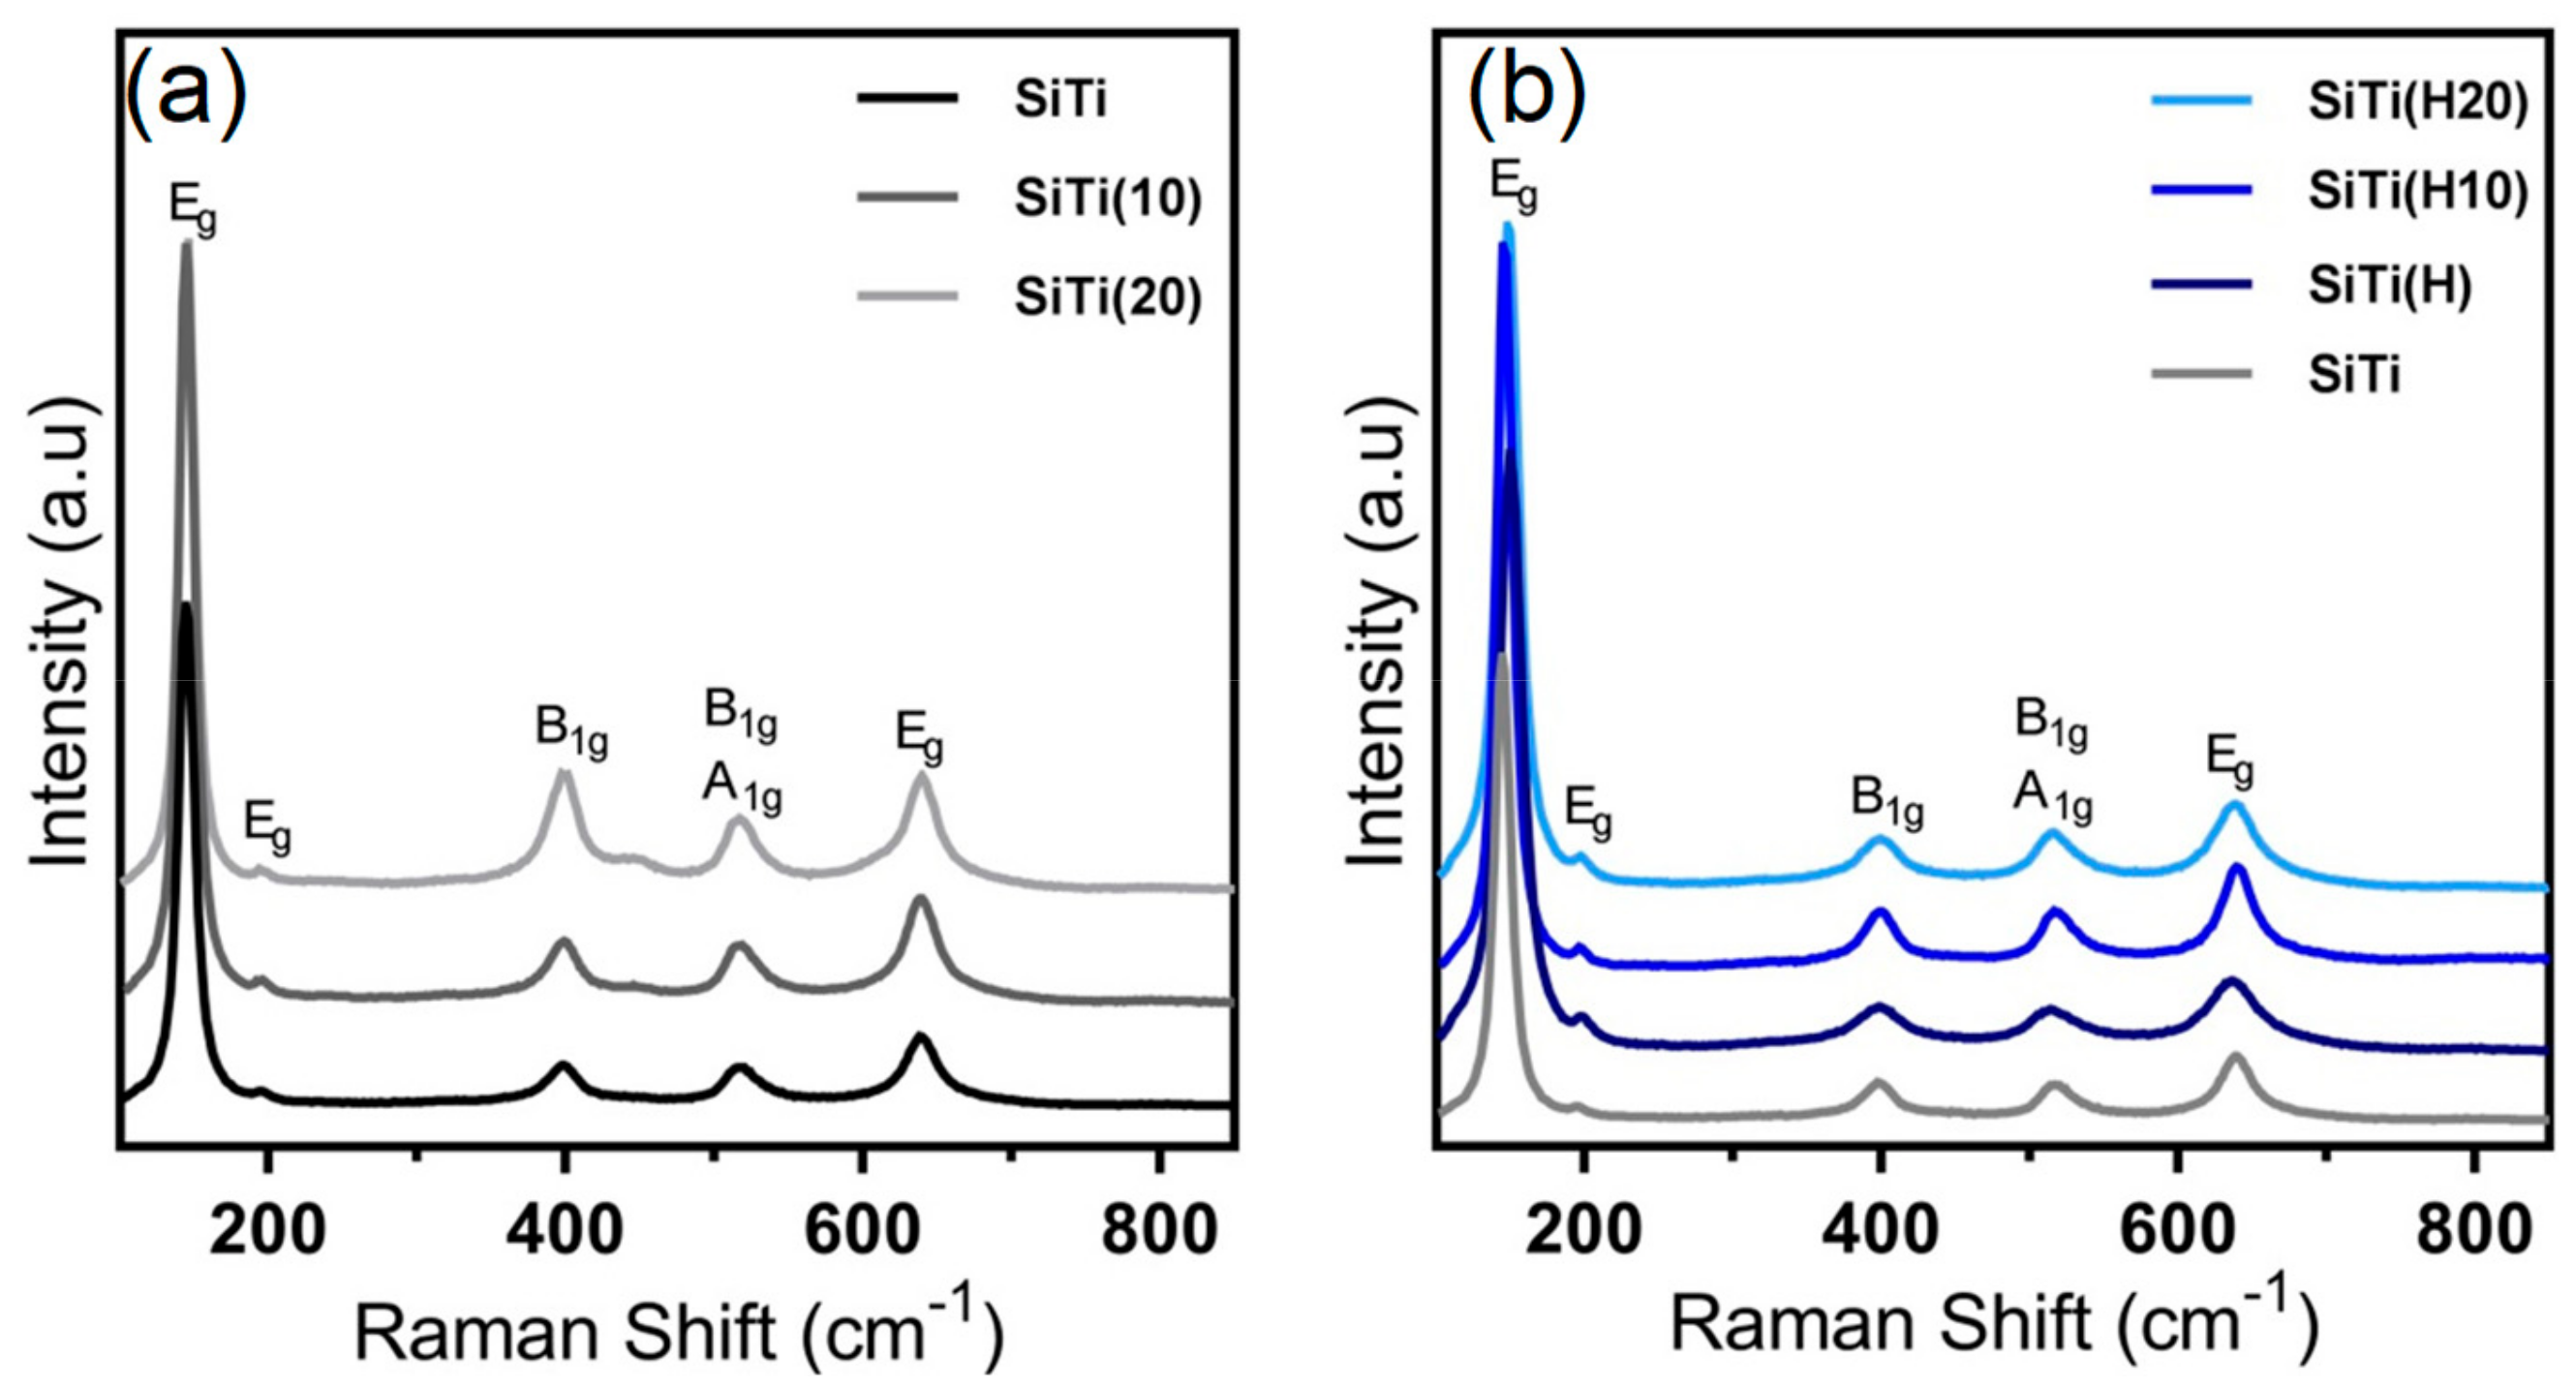
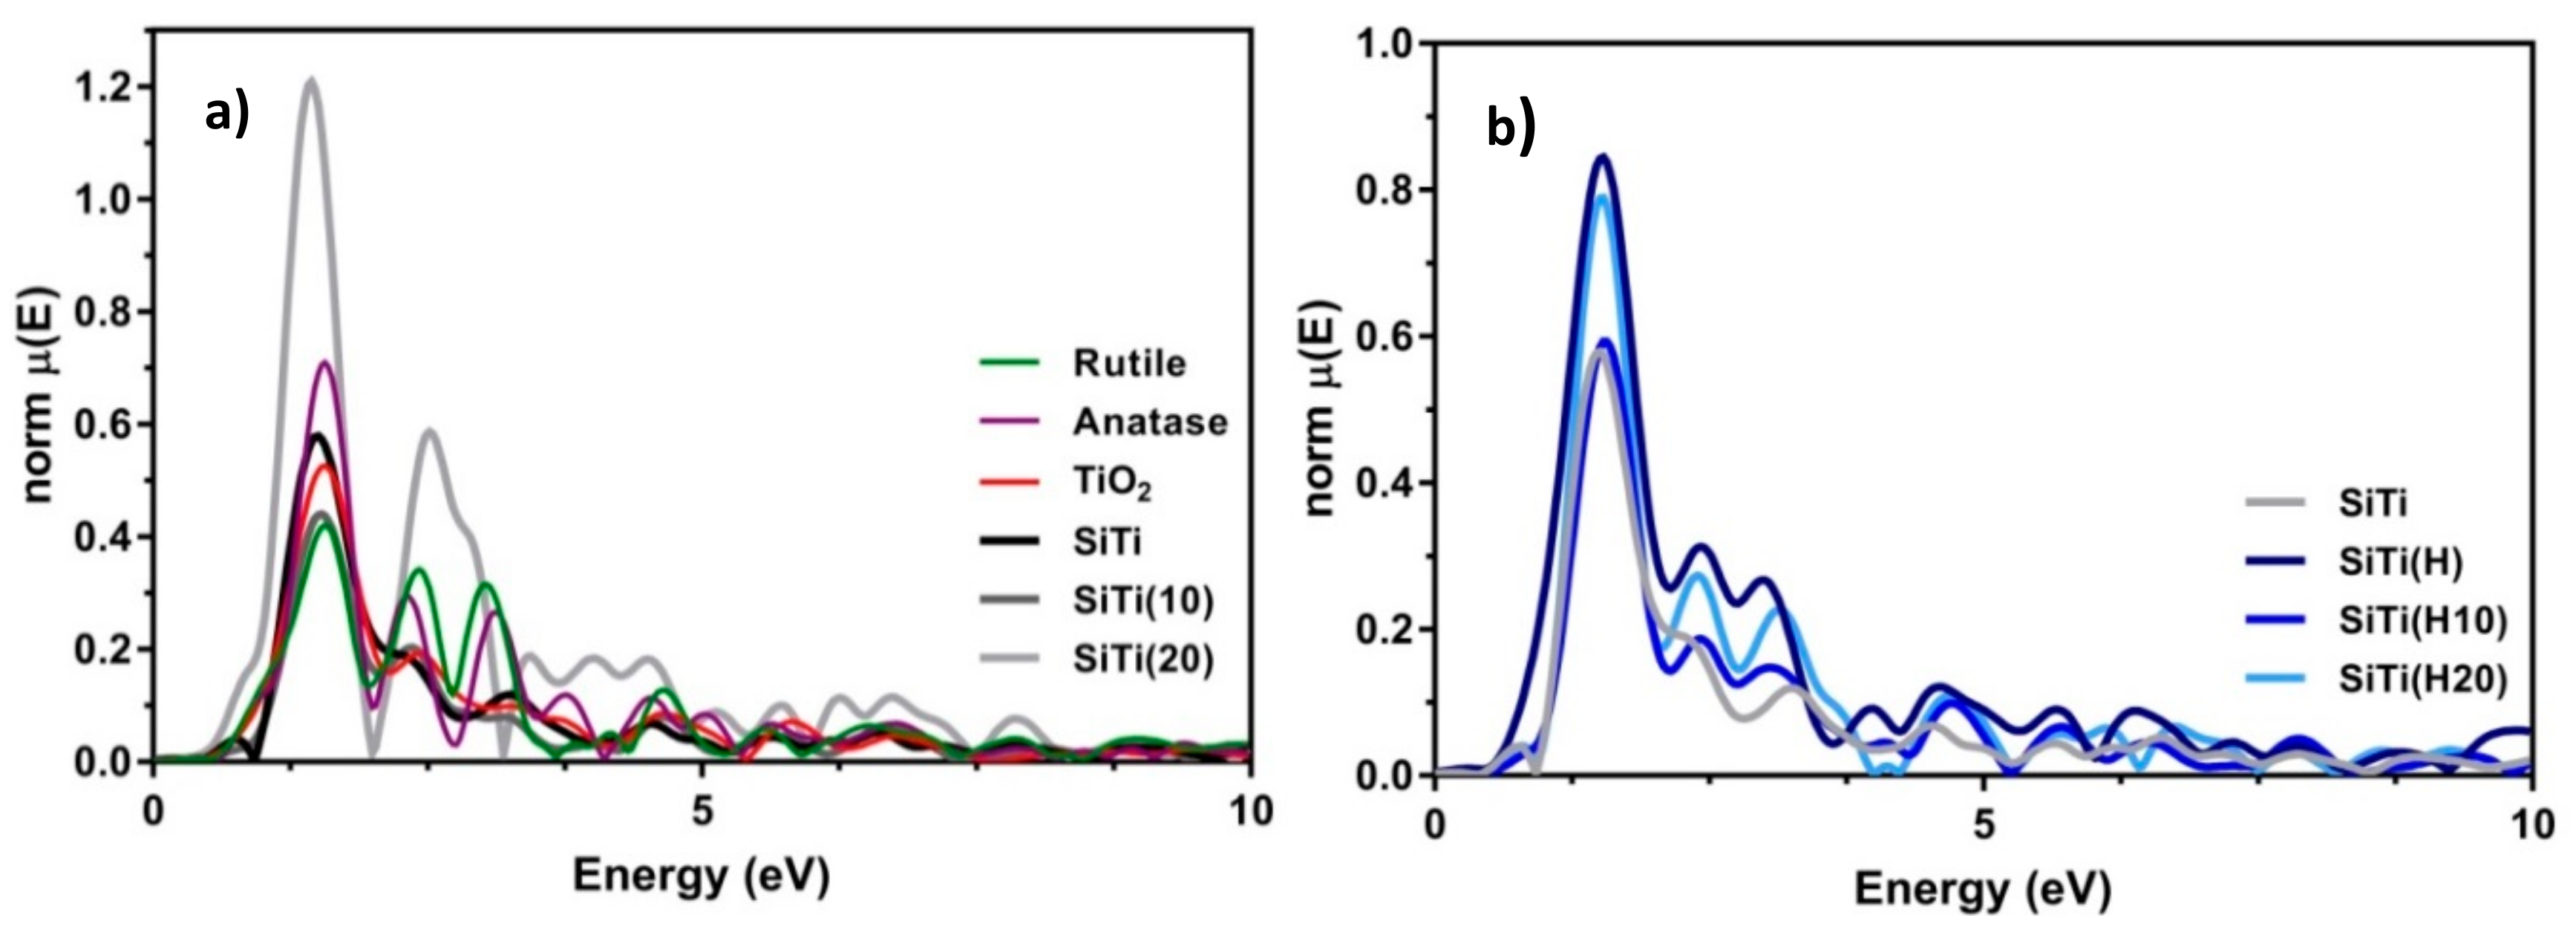
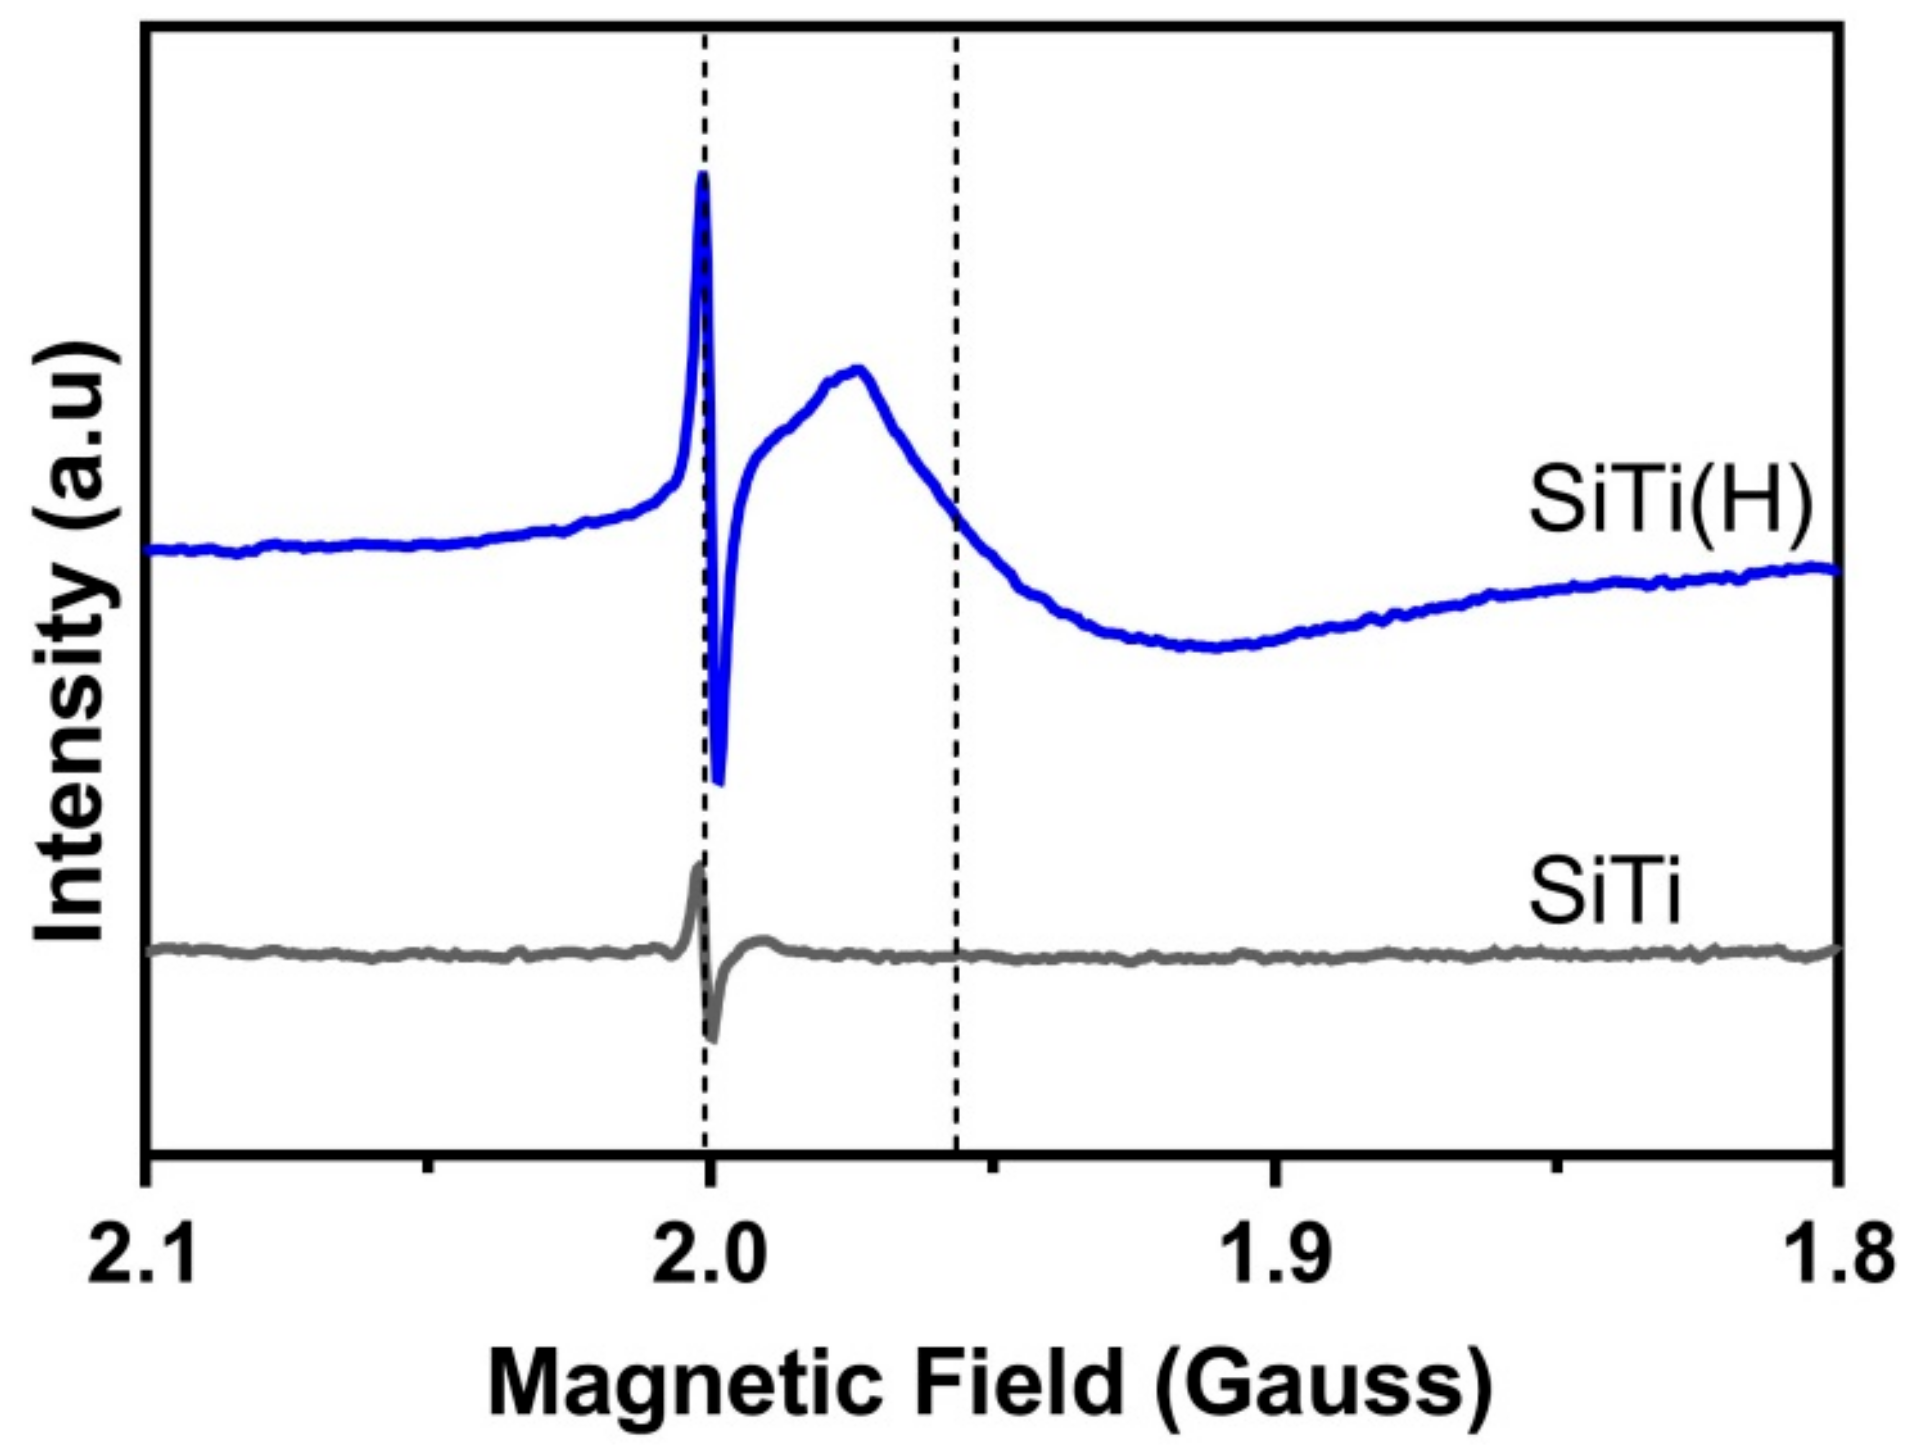
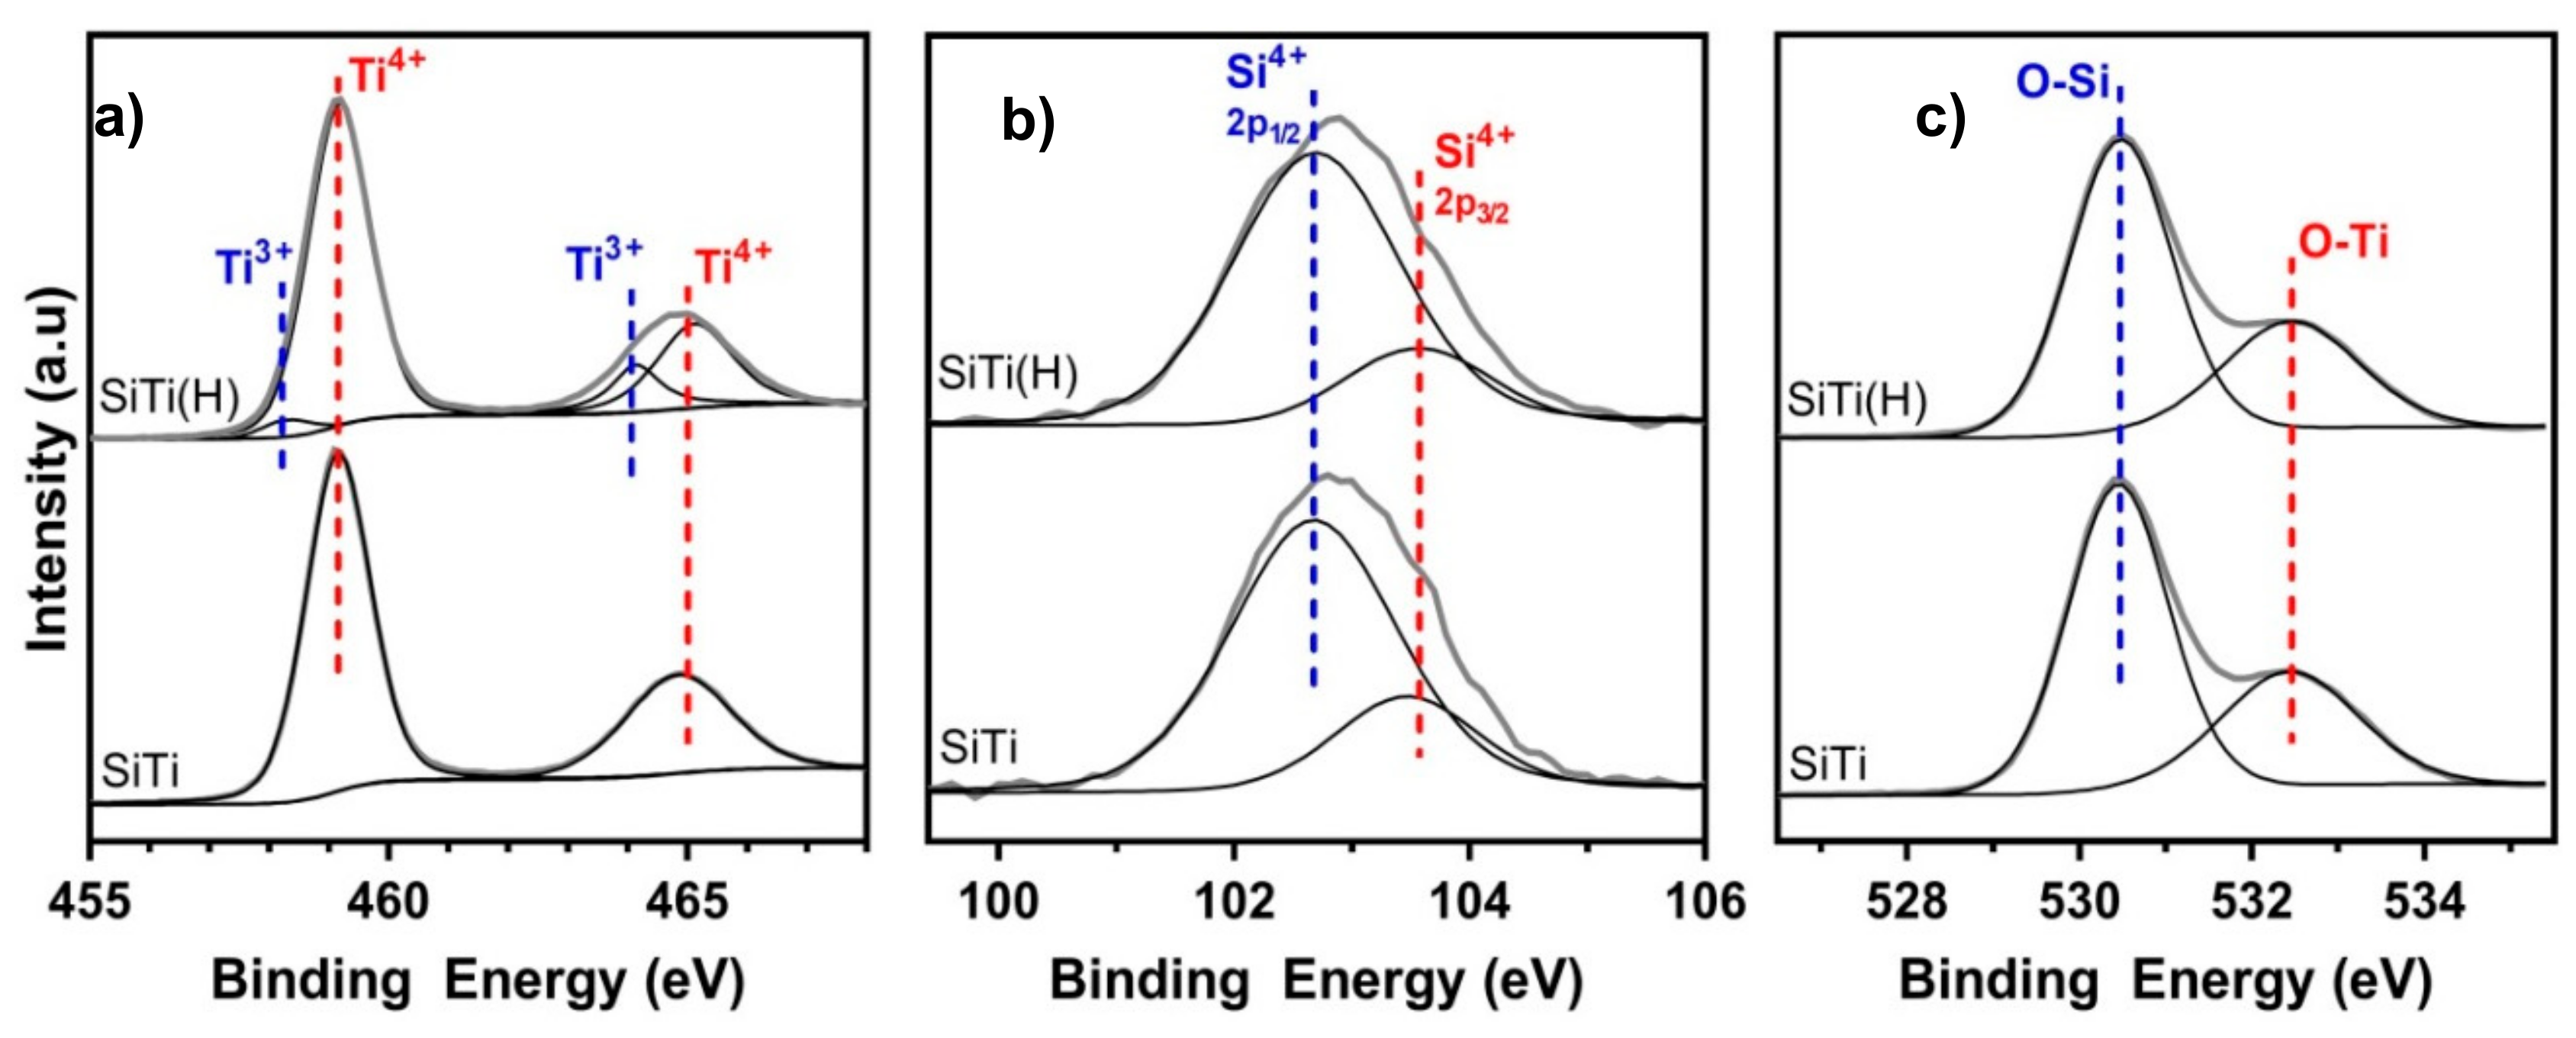
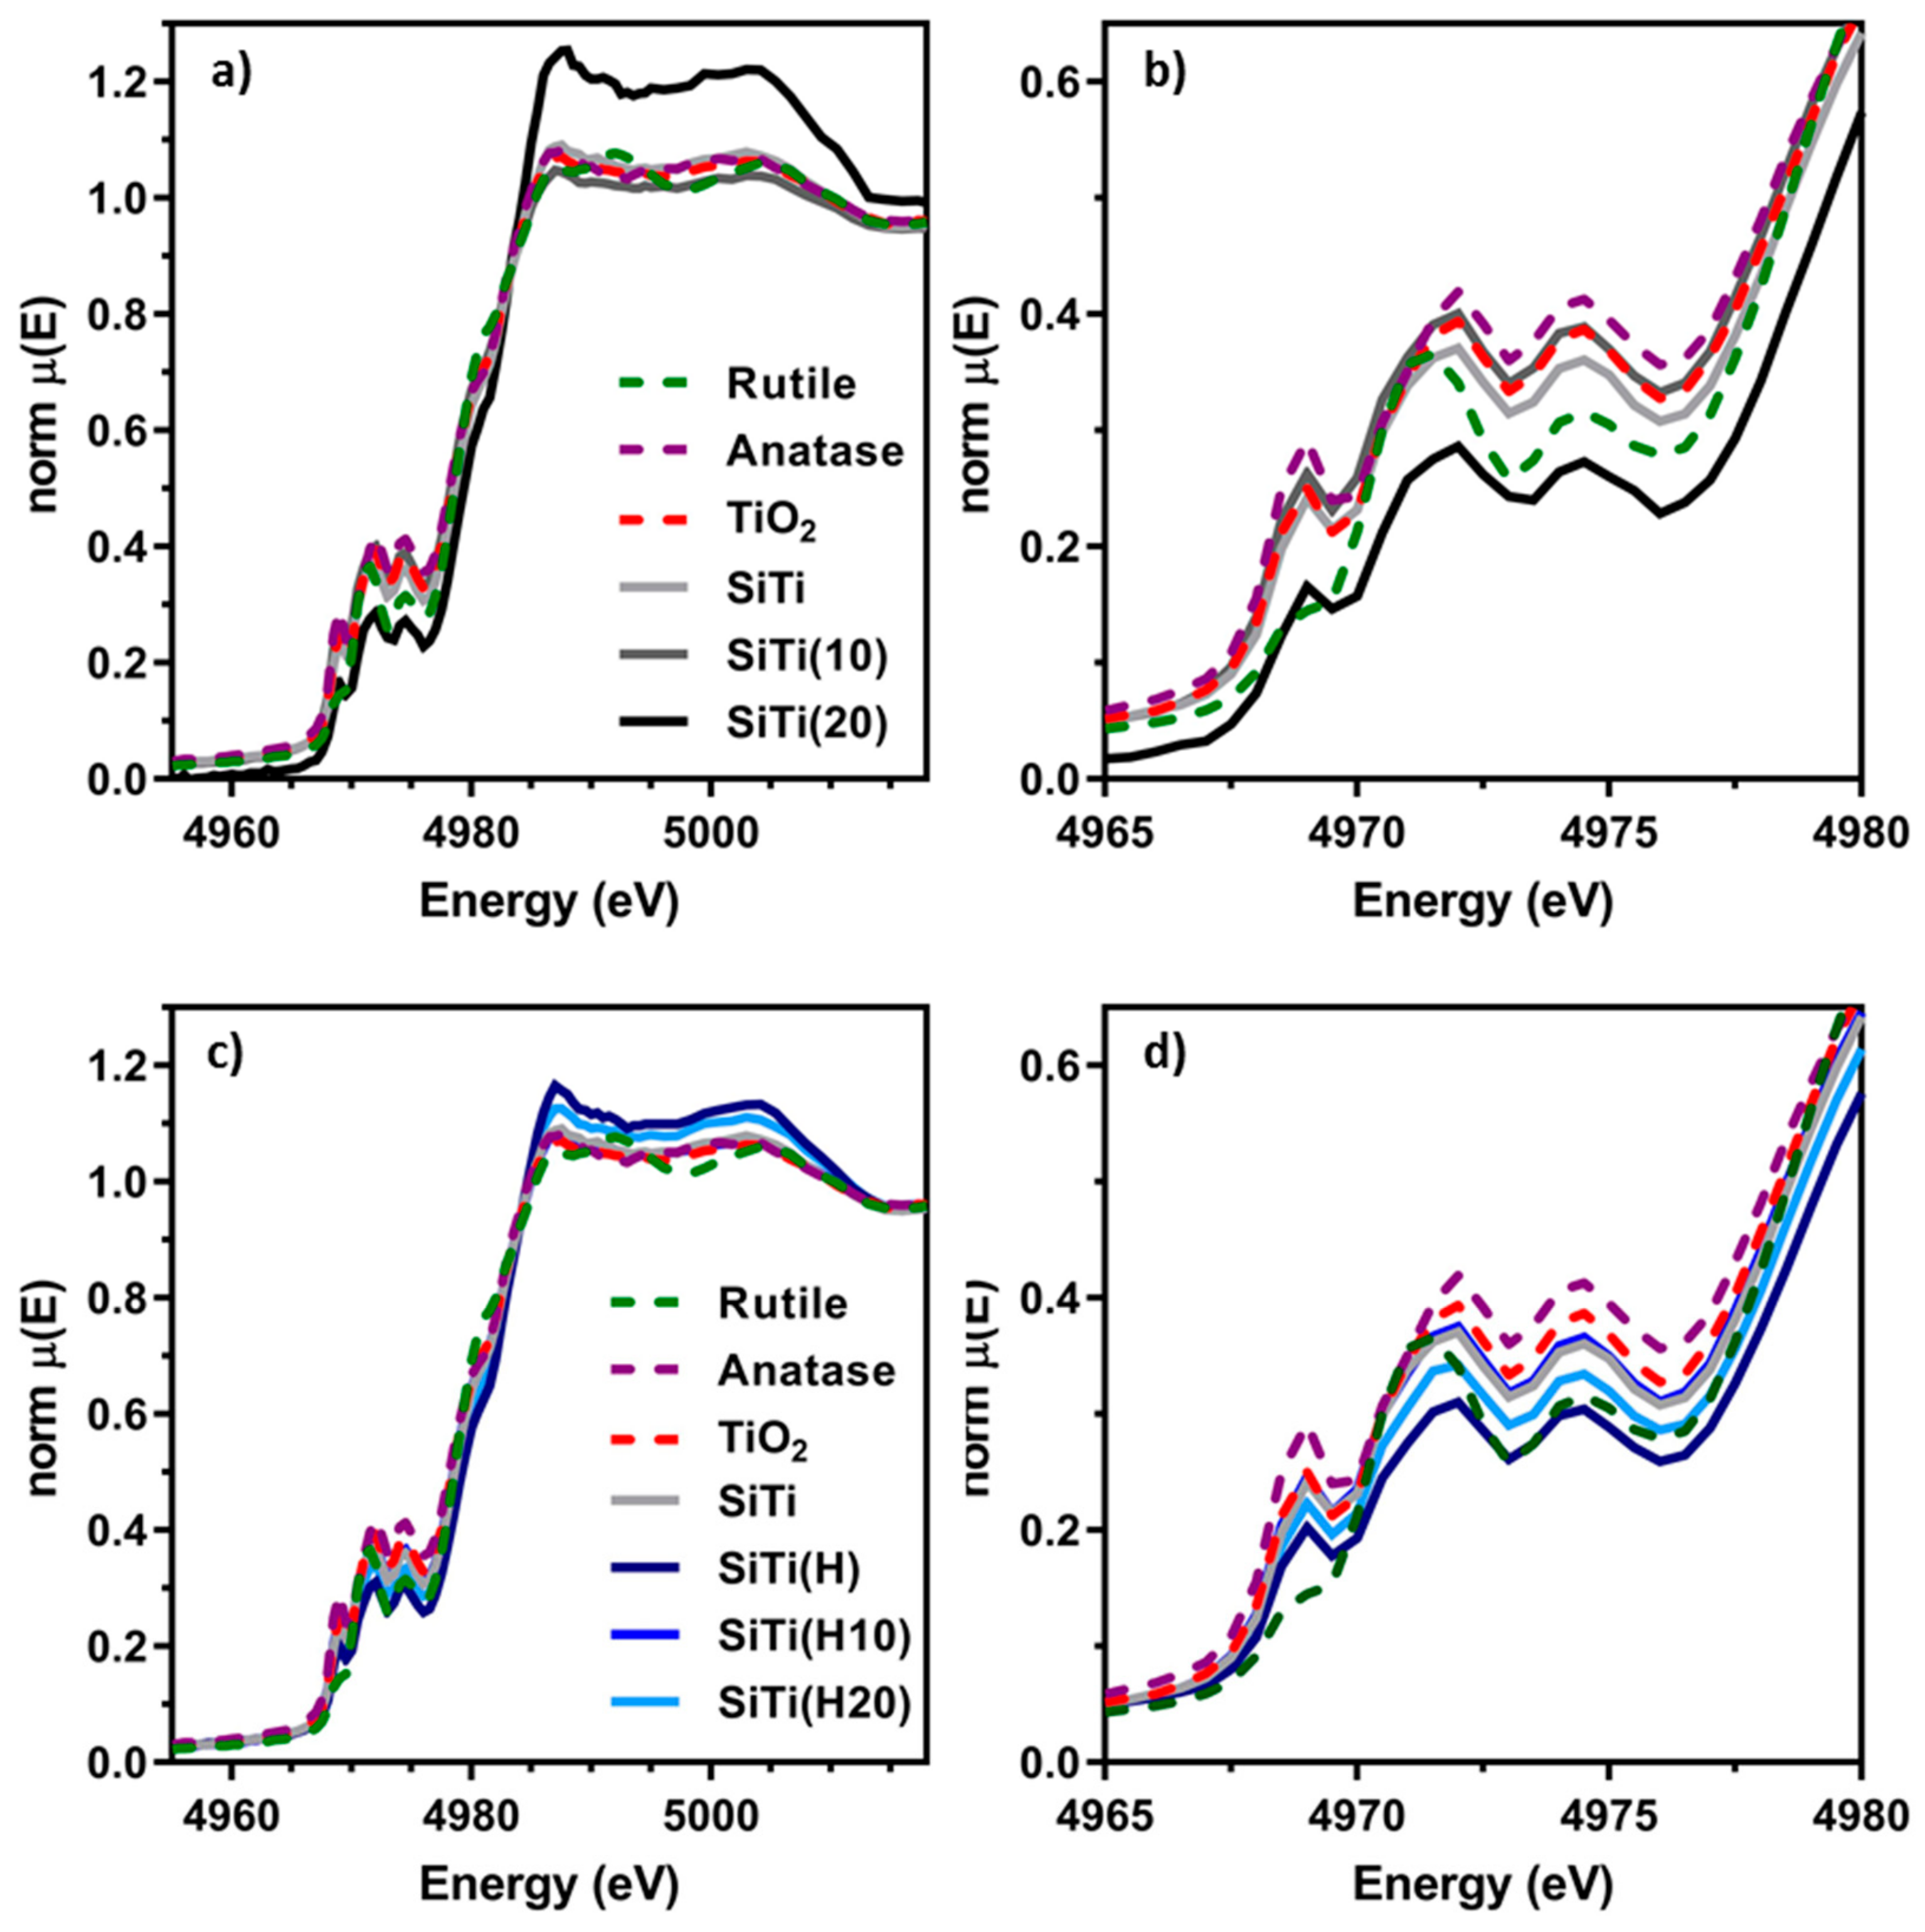
3.1. Effect of Hydrogenation
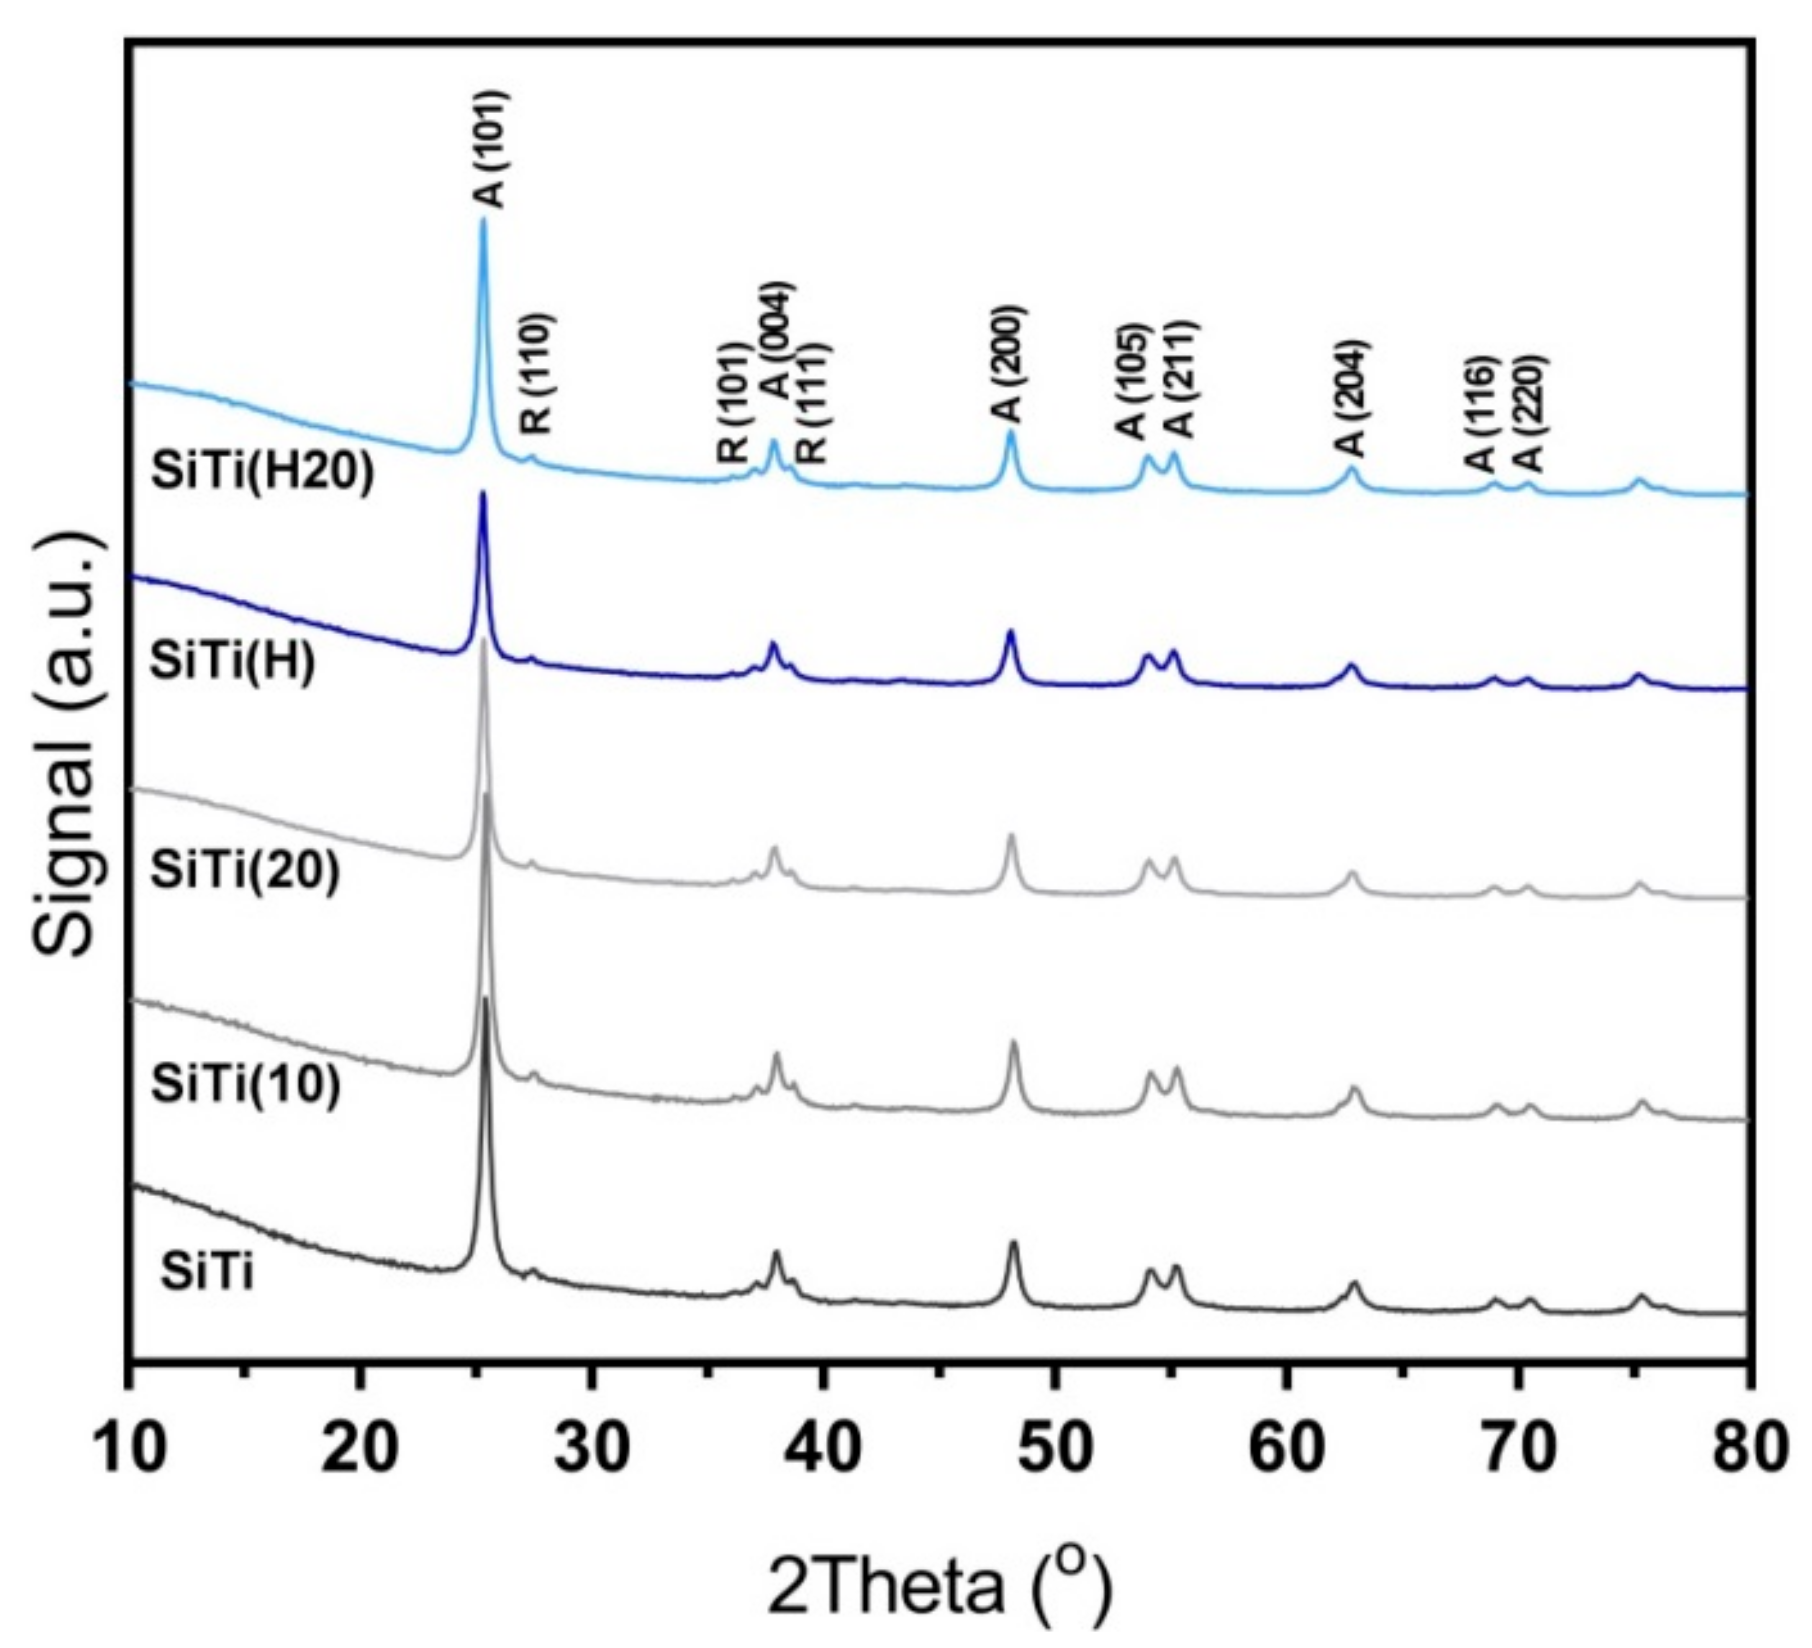
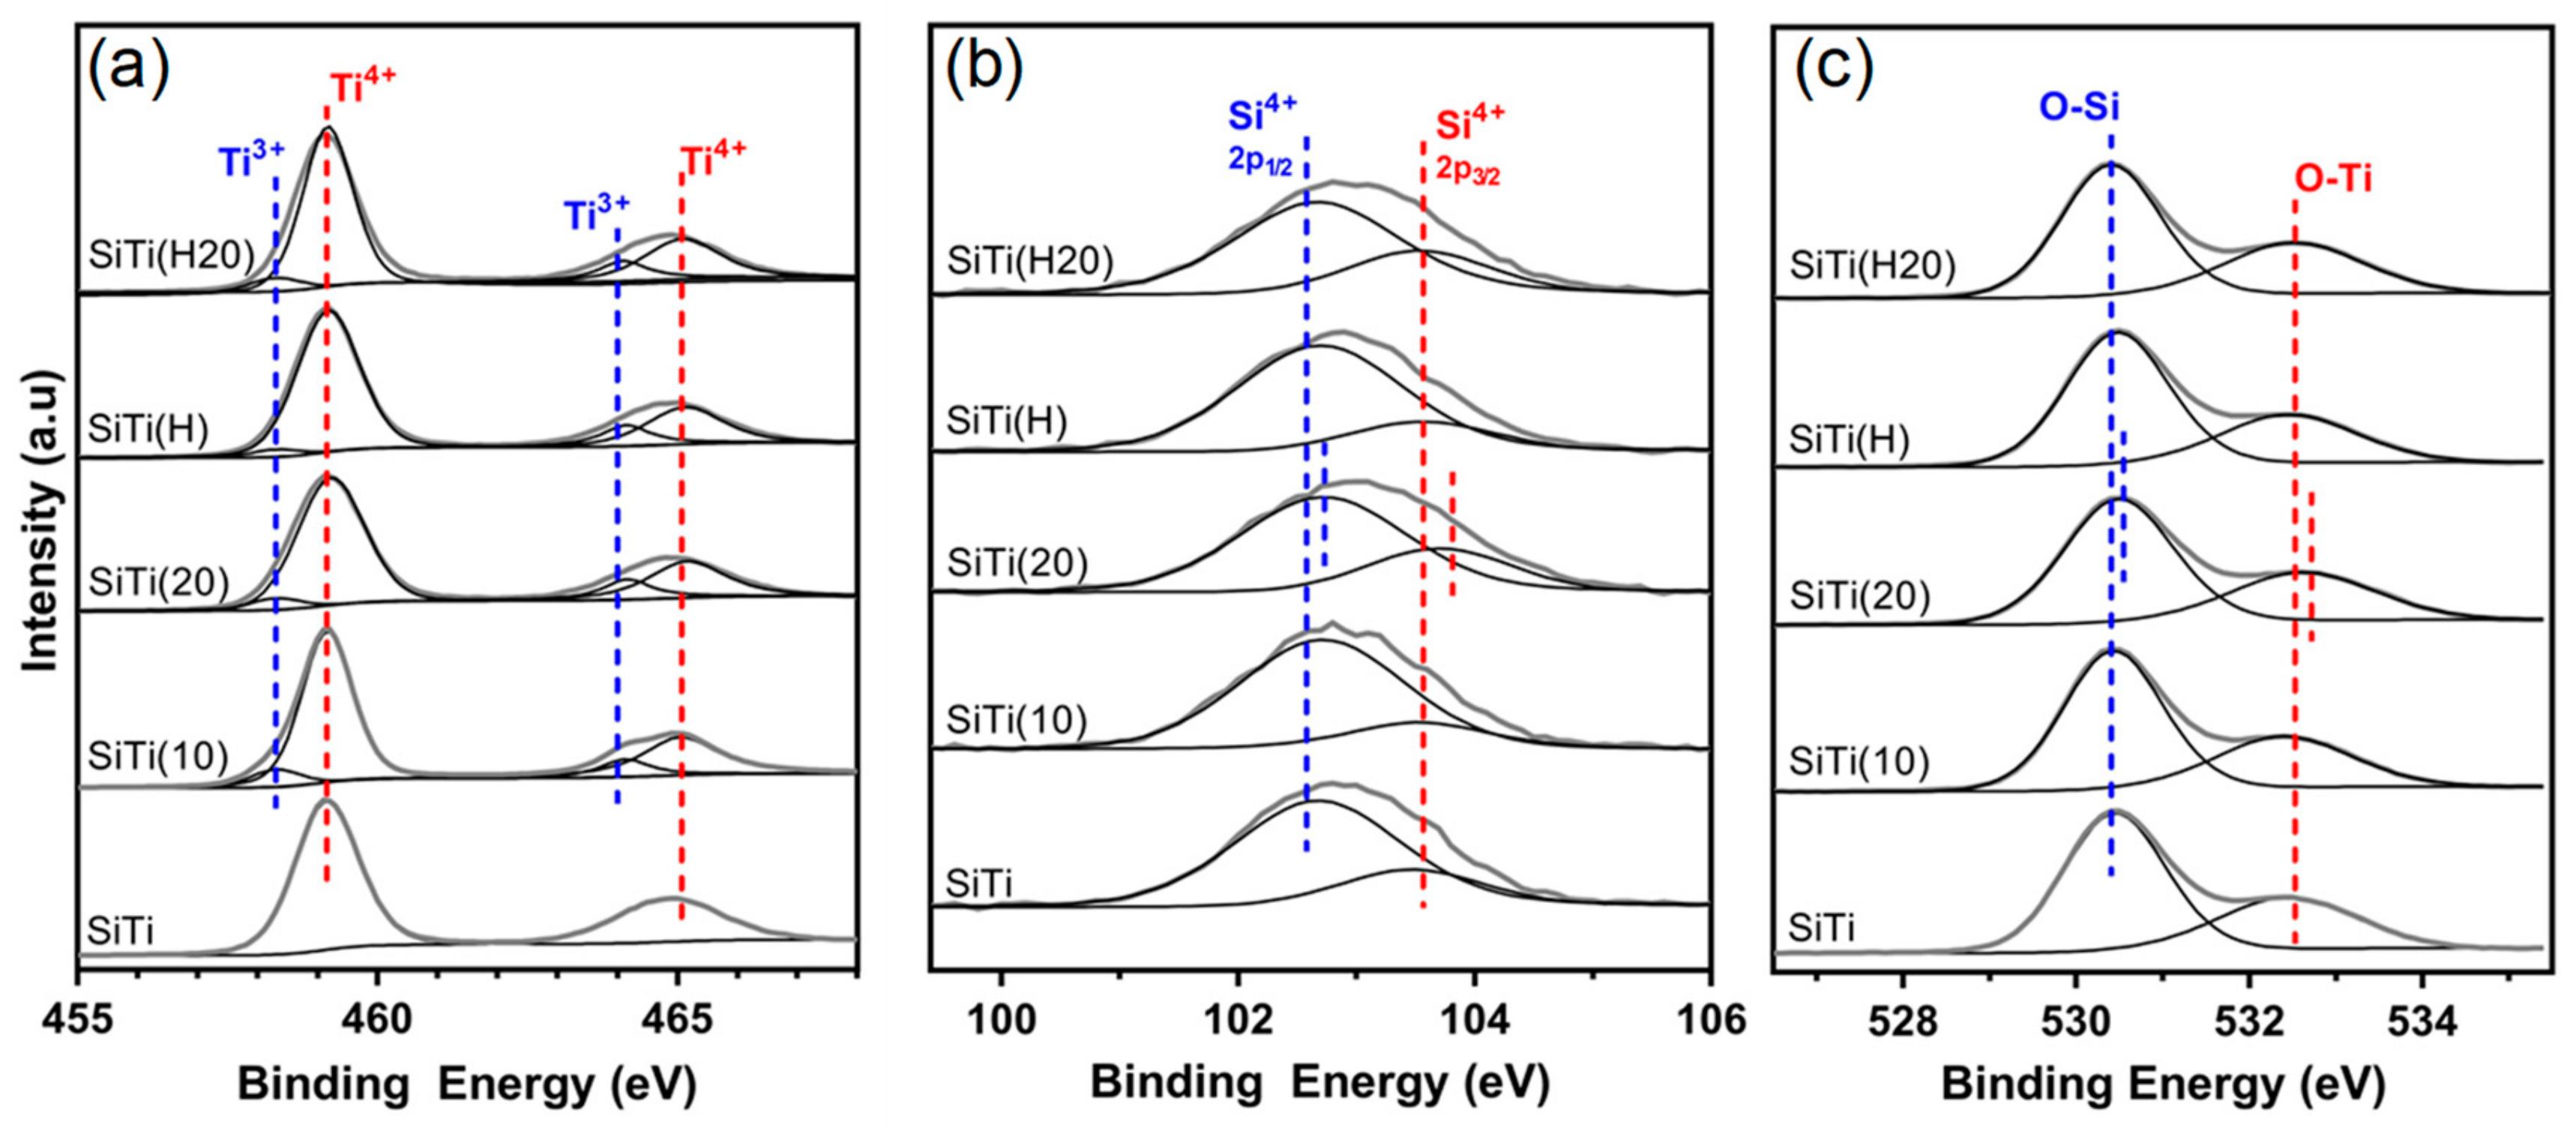
3.2. Effect of Plasma Treatment
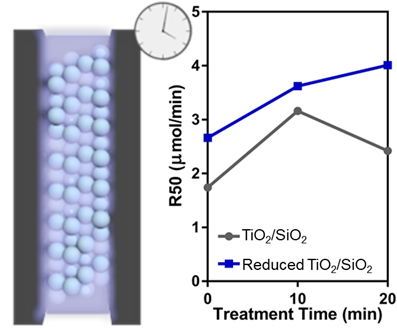
3.3. Photocatalytic Formic Acid Oxidation
4. Conclusions
Supplementary Materials
Author Contributions
Funding
Acknowledgments
Conflicts of Interest
References
- Bion, N.; Epron, F.; Moreno, M.; Mariño, F.; Duprez, D. Preferential Oxidation of Carbon Monoxide in the Presence of Hydrogen (PROX) over Noble Metals and Transition Metal Oxides: Advantages and Drawbacks. Top. Catal. 2008, 51, 76. [Google Scholar] [CrossRef]
- Lawrence, N.J.; Brewer, J.R.; Wang, L.; Wu, T.-S.; Wells-Kingsbury, J.; Ihrig, M.M.; Wang, G.; Soo, Y.-L.; Mei, W.-N.; Cheung, C.L. Defect Engineering in Cubic Cerium Oxide Nanostructures for Catalytic Oxidation. Nano Lett. 2011, 11, 2666–2671. [Google Scholar] [CrossRef] [PubMed]
- Li, Y.; Wei, Z.; Gao, F.; Kovarik, L.; Baylon, R.A.L.; Peden, C.H.F.; Wang, Y. Effect of Oxygen Defects on the Catalytic Performance of VOx/CeO2 Catalysts for Oxidative Dehydrogenation of Methanol. ACS Catal. 2015, 5, 3006–3012. [Google Scholar] [CrossRef]
- Kandiel, T.A.; Ahmed, A.Y.; Bahnemann, D. TiO2 (B)/anatase heterostructure nanofibers decorated with anatase nanoparticles as efficient photocatalysts for methanol oxidation. J. Mol. Catal. A Chem. 2016, 425, 55–60. [Google Scholar] [CrossRef]
- Sihaib, Z.; Puleo, F.; Garcia-Vargas, J.M.; Retailleau, L.; Descorme, C.; Liotta, L.F.; Valverde, J.L.; Gil, S.; Giroir-Fendler, A. Manganese oxide-based catalysts for toluene oxidation. Appl. Catal. B Environ. 2017, 209, 689–700. [Google Scholar] [CrossRef]
- Carabineiro, S.A.C.; Chen, X.; Konsolakis, M.; Psarras, A.C.; Tavares, P.B.; Órfão, J.J.M.; Pereira, M.F.R.; Figueiredo, J.L. Catalytic oxidation of toluene on Ce-Co and La-Co mixed oxides synthesized by exotemplating and evaporation methods. Catal. Today 2015, 244, 161–171. [Google Scholar] [CrossRef]
- Quiroz, J.; Giraudon, J.-M.; Gervasini, A.; Dujardin, C.; Lancelot, C.; Trentesaux, M.; Lamonier, J.-F. Total Oxidation of Formaldehyde over MnOx-CeO2 Catalysts: The Effect of Acid Treatment. ACS Catal. 2015, 5, 2260–2269. [Google Scholar] [CrossRef]
- Zhang, G.; Sun, Z.; Duan, Y.; Ma, R.; Zheng, S. Synthesis of nano-TiO2/diatomite composite and its photocatalytic degradation of gaseous formaldehyde. Appl. Surf. Sci. 2017, 412, 105–112. [Google Scholar] [CrossRef]
- Wang, G.; Yang, Y.; Han, D.; Li, Y. Oxygen defective metal oxides for energy conversion and storage. Nano Today 2017, 13, 23–39. [Google Scholar] [CrossRef]
- Zhu, Y.; Zhou, W.; Yu, J.; Chen, Y.; Liu, M.; Shao, Z. Enhancing Electrocatalytic Activity of Perovskite Oxides by Tuning Cation Deficiency for Oxygen Reduction and Evolution Reactions. Chem. Mater. 2016, 28, 1691–1697. [Google Scholar] [CrossRef]
- Jia, J.; Qian, C.; Dong, Y.; Li, Y.F.; Wang, H.; Ghoussoub, M.; Butler, K.T.; Walsh, A.; Ozin, G.A. Heterogeneous catalytic hydrogenation of CO2 by metal oxides: Defect engineering–perfecting imperfection. Chem. Soc. Rev. 2017, 46, 4631–4644. [Google Scholar] [CrossRef]
- Saputera, W.H.; Mul, G.; Hamdy, M.S. Ti3+-containing titania: Synthesis tactics and photocatalytic performance. Catal. Today 2015, 246, 60–66. [Google Scholar] [CrossRef]
- Li, Y.; Wang, W.; Wang, F.; Di, L.; Yang, S.; Zhu, S.; Yao, Y.; Ma, C.; Dai, B.; Yu, F. Enhanced Photocatalytic Degradation of Organic Dyes via Defect-Rich TiO2 Prepared by Dielectric Barrier Discharge Plasma. Nanomaterials 2019, 9, 720. [Google Scholar] [CrossRef]
- Gao, L.; Li, Y.; Ren, J.; Wang, S.; Wang, R.; Fu, G.; Hu, Y. Passivation of defect states in anatase TiO2 hollow spheres with Mg doping: Realizing efficient photocatalytic overall water splitting. Appl. Catal. B Environ. 2017, 202, 127–133. [Google Scholar] [CrossRef]
- Saputera, W.H.; Tahini, H.A.; Lovell, E.C.; Tan, T.H.; Rawal, A.; Aguey-Zinsou, K.-F.; Friedmann, D.; Smith, S.C.; Amal, R.; Scott, J. Cooperative defect-enriched SiO2 for oxygen activation and organic dehydrogenation. J. Catal. 2019, 376, 168–179. [Google Scholar] [CrossRef]
- Fujishima, A.; Zhang, X.; Tryk, D.A. TiO2 photocatalysis and related surface phenomena. Surf. Sci. Rep. 2008, 63, 515–582. [Google Scholar] [CrossRef]
- Yoshihara, T.; Katoh, R.; Furube, A.; Tamaki, Y.; Murai, M.; Hara, K.; Murata, S.; Arakawa, H.; Tachiya, M. Identification of Reactive Species in Photoexcited Nanocrystalline TiO2 Films by Wide-Wavelength-Range (400–2500 nm) Transient Absorption Spectroscopy. J. Phys. Chem. B 2004, 108, 3817–3823. [Google Scholar] [CrossRef]
- Chen, X.; Liu, L.; Peter, Y.Y.; Mao, S.S. Increasing solar absorption for photocatalysis with black hydrogenated titanium dioxide nanocrystals. Science 2011, 331, 746–750. [Google Scholar] [CrossRef]
- Saputera, W.H.; Tahini, H.A.; Sabsabi, M.; Tan, T.H.; Bedford, N.M.; Lovell, E.; Cui, Y.; Hart, J.N.; Friedmann, D.; Smith, S.C.; et al. Light-Induced Synergistic Multidefect Sites on TiO2/SiO2 Composites for Catalytic Dehydrogenation. ACS Catal. 2019, 9, 2674–2684. [Google Scholar] [CrossRef]
- Kong, X.; Xu, Y.; Cui, Z.; Li, Z.; Liang, Y.; Gao, Z.; Zhu, S.; Yang, X. Defect enhances photocatalytic activity of ultrathin TiO2(B) nanosheets for hydrogen production by plasma engraving method. Appl. Catal. B Environ. 2018, 230, 11–17. [Google Scholar] [CrossRef]
- Neyts, E.C.; Ostrikov, K.; Sunkara, M.K.; Bogaerts, A. Plasma Catalysis: Synergistic Effects at the Nanoscale. Chem. Rev. 2015, 115, 13408–13446. [Google Scholar] [CrossRef]
- Li, B.; Zhao, Z.; Zhou, Q.; Meng, B.; Meng, X.; Qiu, J. Highly Efficient Low-Temperature Plasma-Assisted Modification of TiO2 Nanosheets with Exposed {001} Facets for Enhanced Visible-Light Photocatalytic Activity. Chem. A Eur. J. 2014, 20, 14763–14770. [Google Scholar] [CrossRef]
- Wang, N.; Shen, K.; Huang, L.; Yu, X.; Qian, W.; Chu, W. Facile Route for Synthesizing Ordered Mesoporous Ni-Ce-Al Oxide Materials and Their Catalytic Performance for Methane Dry Reforming to Hydrogen and Syngas. ACS Catal. 2013, 3, 1638–1651. [Google Scholar] [CrossRef]
- Jedsukontorn, T.; Ueno, T.; Saito, N.; Hunsom, M. Narrowing band gap energy of defective black TiO2 fabricated by solution plasma process and its photocatalytic activity on glycerol transformation. J. Alloys Compd. 2018, 757, 188–199. [Google Scholar] [CrossRef]
- Horlyck, J.; Sara, M.; Lovell, E.C.; Amal, R.; Scott, J.A. Effect of metal-support interactions in mixed Co/Al catalysts for dry reforming of methane. ChemCatChem 2019, 11, 3432. [Google Scholar] [CrossRef]
- Ravel, B.; Newville, M. ATHENA, ARTEMIS, HEPHAESTUS: Data analysis for x-ray absorption spectroscopy using IFEFFIT. J. Synchrotron Radiat. 2005, 12, 537–541. [Google Scholar] [CrossRef]
- Abdullah, M.; Low, G.K.C.; Matthews, R.W. Effects of common inorganic anions on rates of photocatalytic oxidation of organic carbon over illuminated titanium dioxide. J. Phys. Chem. 1990, 94, 6820–6825. [Google Scholar] [CrossRef]
- Kruk, M.; Jaroniec, M. Gas adsorption characterization of ordered organic-inorganic nanocomposite materials. Chem. Mater. 2001, 13, 3169–3183. [Google Scholar] [CrossRef]
- Tok, A.I.Y.; Boey, F.Y.C.; Du, S.W.; Wong, B.K. Flame spray synthesis of ZrO2 nano-particles using liquid precursors. Mater. Sci. Eng. B 2006, 130, 114–119. [Google Scholar] [CrossRef]
- Teoh, W.Y.; Amal, R.; Mädler, L. Flame spray pyrolysis: An enabling technology for nanoparticles design and fabrication. Nanoscale 2010, 2, 1324–1347. [Google Scholar] [CrossRef]
- Yin, G.; Huang, X.; Chen, T.; Zhao, W.; Bi, Q.; Xu, J.; Han, Y.; Huang, F. Hydrogenated Blue Titania for Efficient Solar to Chemical Conversions: Preparation, Characterization, and Reaction Mechanism of CO2 Reduction. ACS Catal. 2018, 8, 1009–1017. [Google Scholar] [CrossRef]
- Scanlon, D.O.; Dunnill, C.W.; Buckeridge, J.; Shevlin, S.A.; Logsdail, A.J.; Woodley, S.M.; Catlow, C.R.A.; Powell, M.J.; Palgrave, R.G.; Parkin, I.P. Band alignment of rutile and anatase TiO2. Nat. Mater. 2013, 12, 798. [Google Scholar] [CrossRef]
- Howe, R.F.; Gratzel, M. EPR observation of trapped electrons in colloidal titanium dioxide. J. Phys. Chem. 1985, 89, 4495–4499. [Google Scholar] [CrossRef]
- Emeline, A.V.; Sheremetyeva, N.V.; Khomchenko, N.V.; Kuzmin, G.N.; Ryabchuk, V.K.; Teoh, W.Y.; Amal, R. Spectroscopic Studies of Pristine and Fluorinated Nano-ZrO2 in Photostimulated Heterogeneous Processes. J. Phys. Chem. C 2009, 113, 4566–4574. [Google Scholar] [CrossRef]
- Kho, E.T.; Lovell, E.; Wong, R.J.; Scott, J.; Amal, R. Manipulating ceria-titania binary oxide features and their impact as nickel catalyst supports for low temperature steam reforming of methane. Appl. Catal. A Gen. 2017, 530, 111–124. [Google Scholar] [CrossRef]
- Chiarello, G.L.; Selli, E.; Forni, L. Photocatalytic hydrogen production over flame spray pyrolysis-synthesised TiO2 and Au/TiO2. Appl. Catal. B Environ. 2008, 84, 332–339. [Google Scholar] [CrossRef]
- Zhuang, J.; Dai, W.; Tian, Q.; Li, Z.; Xie, L.; Wang, J.; Liu, P.; Shi, X.; Wang, D. Photocatalytic degradation of RhB over TiO2 bilayer films: Effect of defects and their location. Langmuir 2010, 26, 9686–9694. [Google Scholar] [CrossRef]
- Ohsaka, T.; Izumi, F.; Fujiki, Y. Raman spectrum of anatase, TiO2. J. Raman Spectrosc. 1978, 7, 321–324. [Google Scholar] [CrossRef]
- Parker, J.C.; Siegel, R.W. Raman microprobe study of nanophase TiO2 and oxidation-induced spectral changes. J. Mater. Res. 1990, 5, 1246–1252. [Google Scholar] [CrossRef]
- Lan, T.; Tang, X.; Fultz, B. Phonon anharmonicity of rutile TiO2 studied by Raman spectrometry and molecular dynamics simulations. Phys. Rev. B Condens. Matter Mater. Phys. 2012, 85, 1–11. [Google Scholar] [CrossRef]
- Oh, S.-M.; Ishigaki, T. Preparation of pure rutile and anatase TiO2 nanopowders using RF thermal plasma. Thin Solid Films 2004, 457, 186–191. [Google Scholar] [CrossRef]
- Watts, J.F. X-ray photoelectron spectroscopy. Vacuum 1994, 45, 653–671. [Google Scholar] [CrossRef]
- Boutonnet Kizling, M.; Järås, S.G. A review of the use of plasma techniques in catalyst preparation and catalytic reactions. Appl. Catal. A Gen. 1996, 147, 1–21. [Google Scholar] [CrossRef]
- Lovell, E.; Horlyck, J.; Scott, J.; Amal, R. Flame spray pyrolysis-designed silica/ceria-zirconia supports for the carbon dioxide reforming of methane. Appl. Catal. A Gen. 2017, 546, 47–57. [Google Scholar] [CrossRef]
- Farges, F.; Brown, G.E.; Rehr, J.J. Coordination chemistry of Ti(IV) in silicate glasses and melts: I. XAFS study of titanium coordination in oxide model compounds. Geochim. Cosmochim. Acta 1996, 60, 3023–3038. [Google Scholar] [CrossRef]
- Li, K.; Gao, S.; Wang, Q.; Xu, H.; Wang, Z.; Huang, B.; Dai, Y.; Lu, J. In-Situ-Reduced Synthesis of Ti3+ Self-Doped TiO2/g-C3N4 Heterojunctions with High Photocatalytic Performance under LED Light Irradiation. ACS Appl. Mater. Interfaces 2015, 7, 9023–9030. [Google Scholar] [CrossRef] [PubMed]
- Liu, M.; Qiu, X.; Miyauchi, M.; Hashimoto, K. Cu(II) Oxide Amorphous Nanoclusters Grafted Ti3+ Self-Doped TiO2: An Efficient Visible Light Photocatalyst. Chem. Mater. 2011, 23, 5282–5286. [Google Scholar] [CrossRef]


© 2019 by the authors. Licensee MDPI, Basel, Switzerland. This article is an open access article distributed under the terms and conditions of the Creative Commons Attribution (CC BY) license (http://creativecommons.org/licenses/by/4.0/).
Share and Cite
Horlyck, J.; Nashira, A.; Lovell, E.; Daiyan, R.; Bedford, N.; Wei, Y.; Amal, R.; Scott, J. Plasma Treating Mixed Metal Oxides to Improve Oxidative Performance via Defect Generation. Materials 2019, 12, 2756. https://doi.org/10.3390/ma12172756
Horlyck J, Nashira A, Lovell E, Daiyan R, Bedford N, Wei Y, Amal R, Scott J. Plasma Treating Mixed Metal Oxides to Improve Oxidative Performance via Defect Generation. Materials. 2019; 12(17):2756. https://doi.org/10.3390/ma12172756
Chicago/Turabian StyleHorlyck, Jonathan, Alimatun Nashira, Emma Lovell, Rahman Daiyan, Nicholas Bedford, Yuexing Wei, Rose Amal, and Jason Scott. 2019. "Plasma Treating Mixed Metal Oxides to Improve Oxidative Performance via Defect Generation" Materials 12, no. 17: 2756. https://doi.org/10.3390/ma12172756
APA StyleHorlyck, J., Nashira, A., Lovell, E., Daiyan, R., Bedford, N., Wei, Y., Amal, R., & Scott, J. (2019). Plasma Treating Mixed Metal Oxides to Improve Oxidative Performance via Defect Generation. Materials, 12(17), 2756. https://doi.org/10.3390/ma12172756