Effect of Biodegradable Binder Properties and Operating Conditions on Growth of Urea Particles in a Fluidized Bed Granulator

 , ,
, ,  ,
,
Abstract
1. Introduction
2. Materials and Methods
2.1. Materials
2.2. Methods
2.2.1. Binder Properties
Binder Viscosity and Density
Binder Surface Tension
Binder Contact Angle
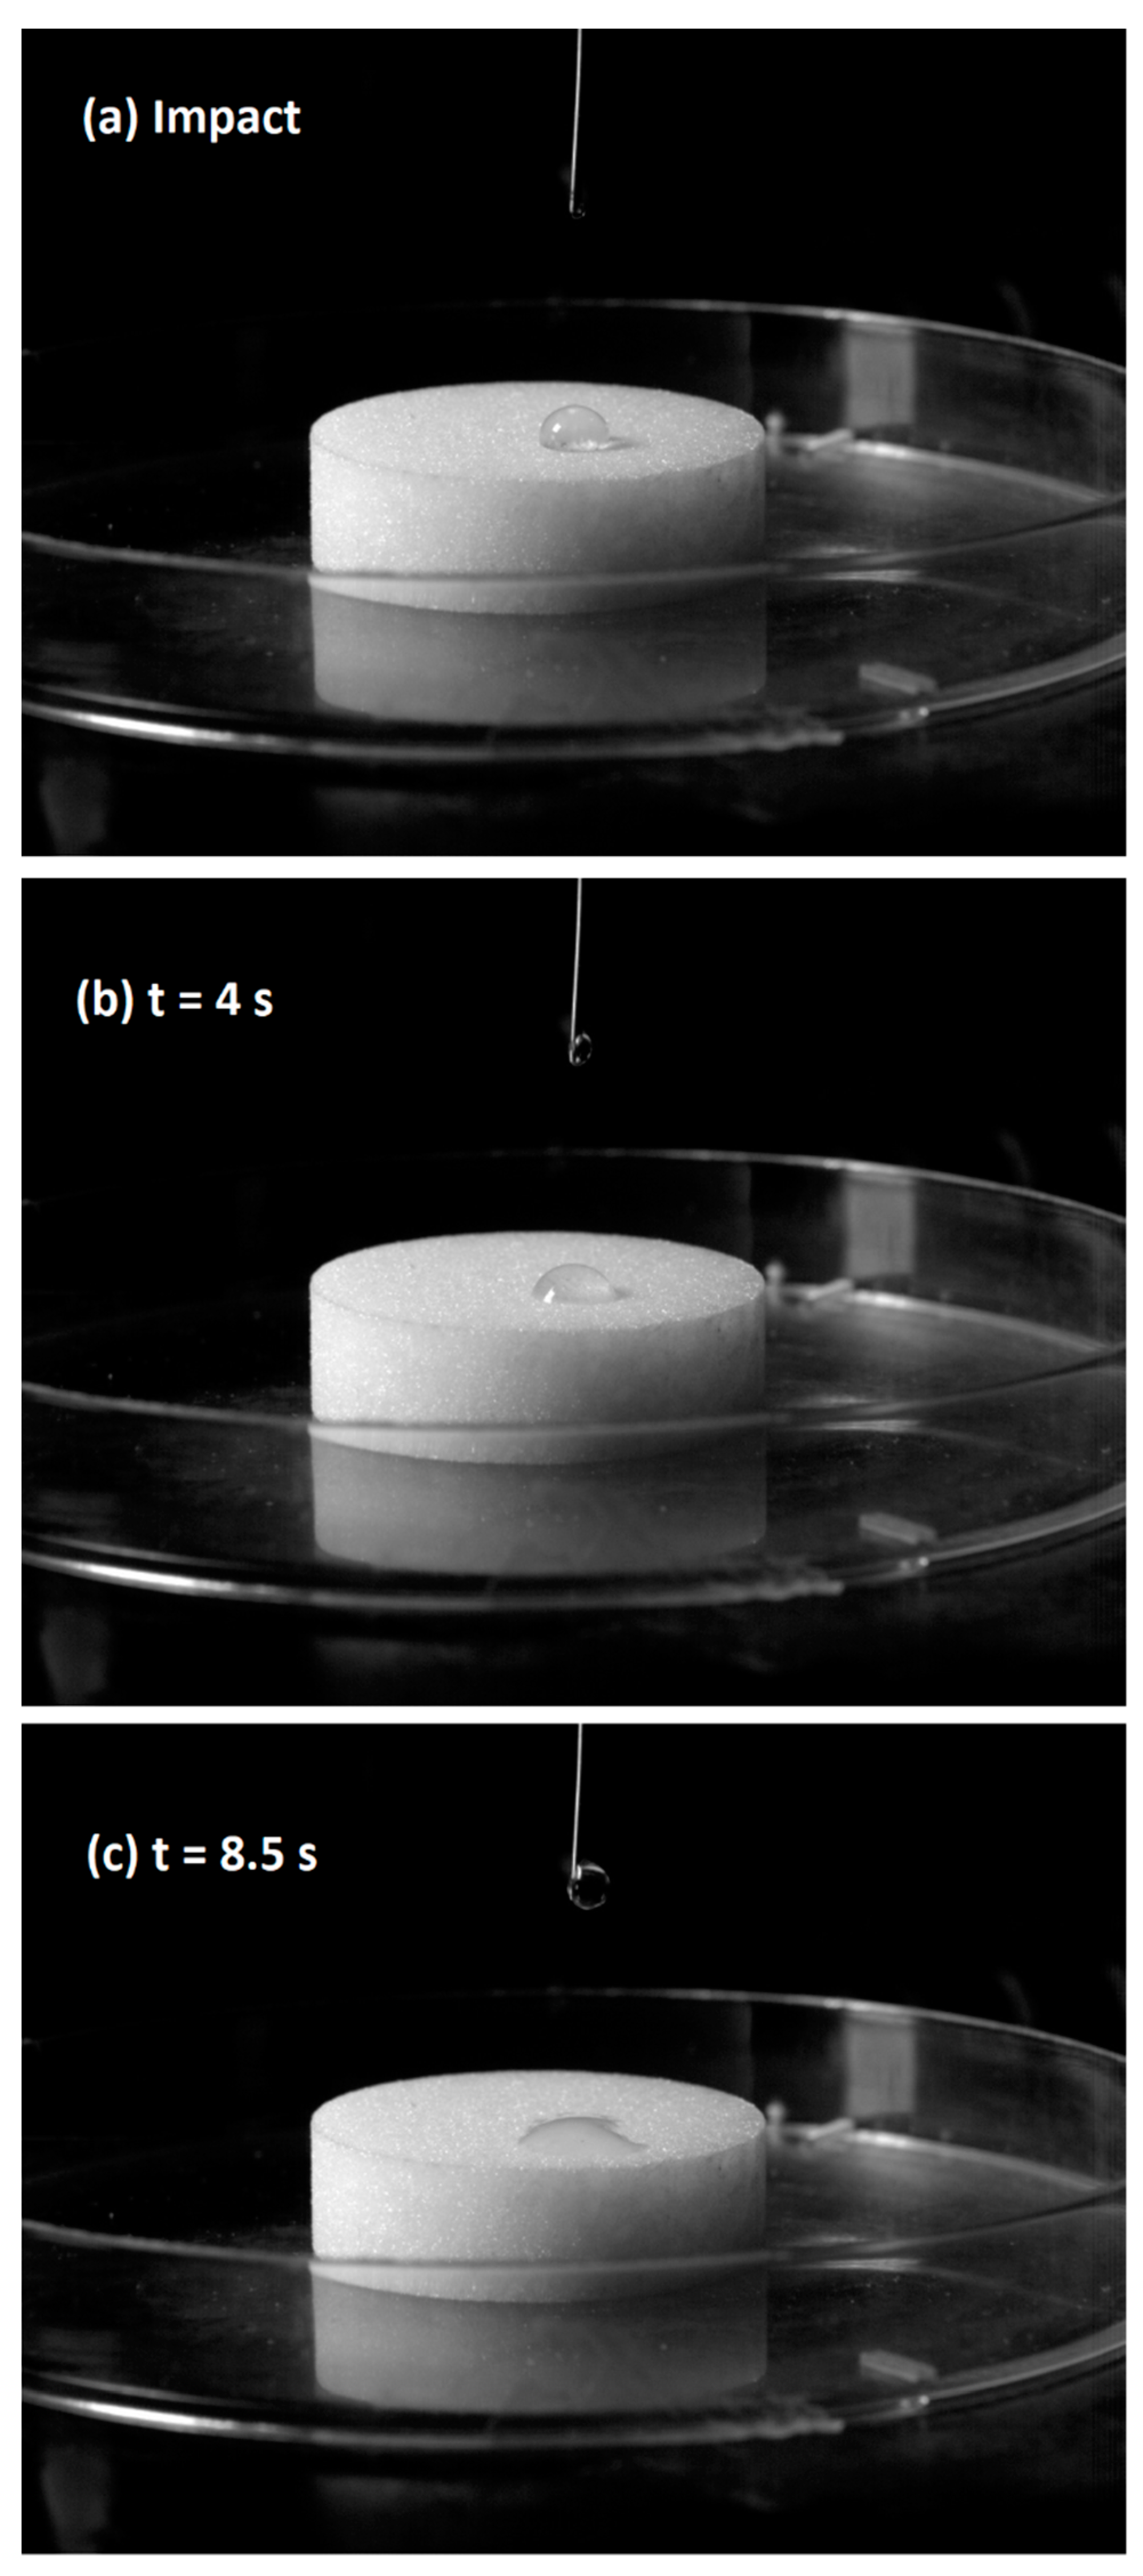
Droplet Penetration Time
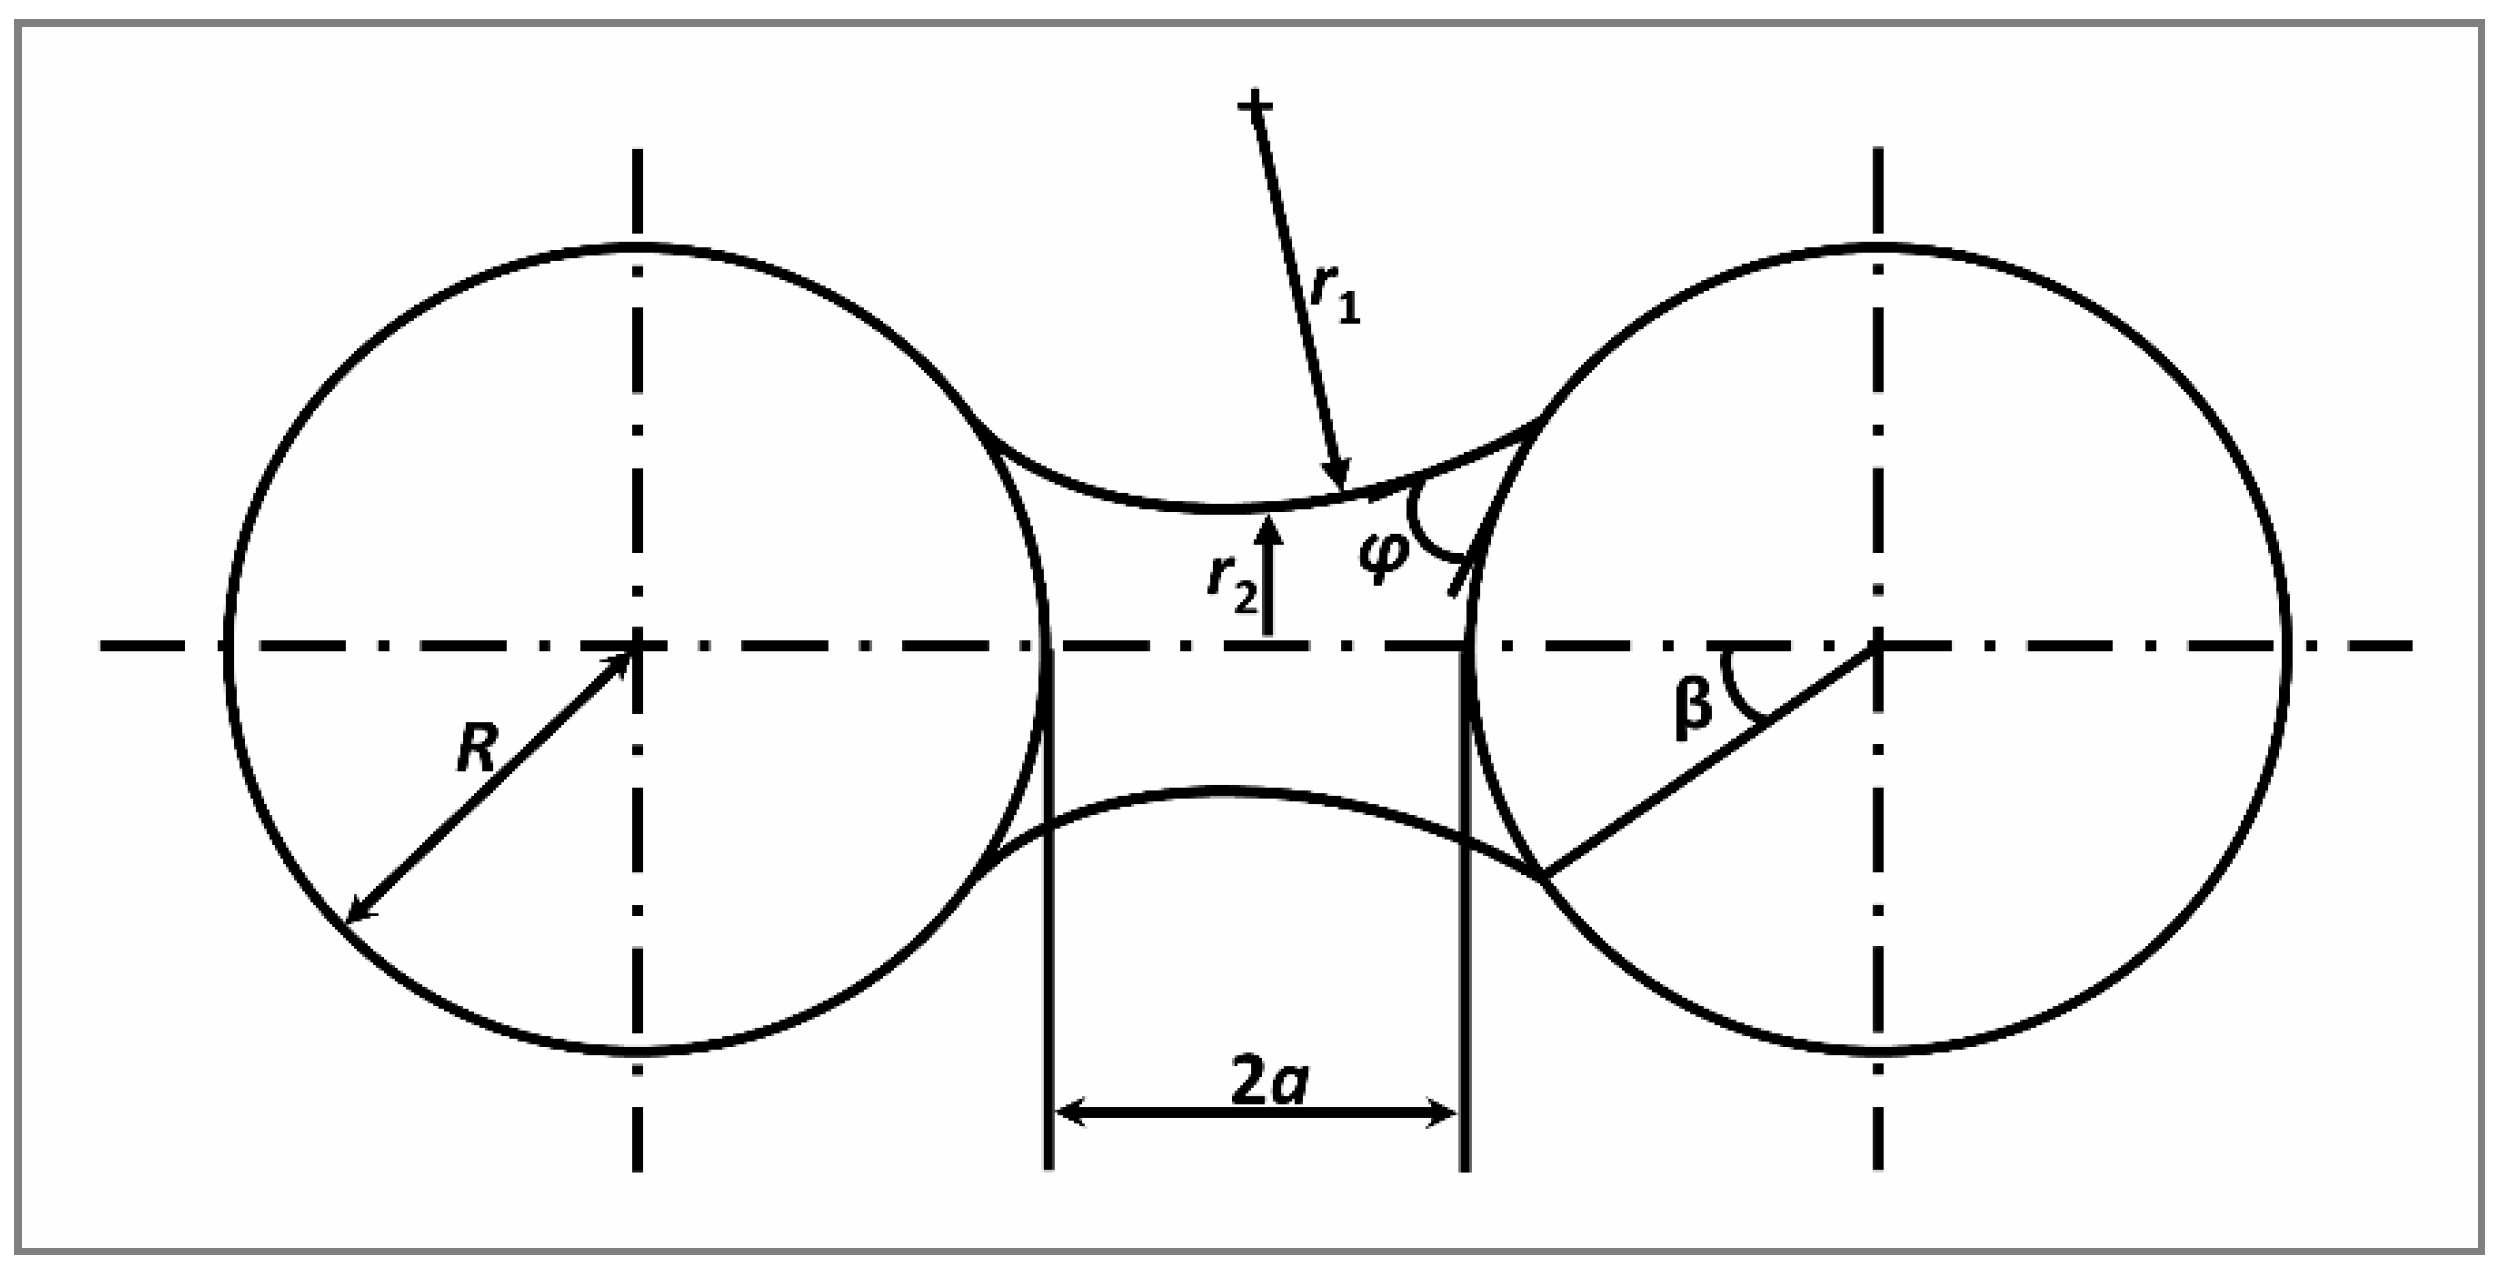
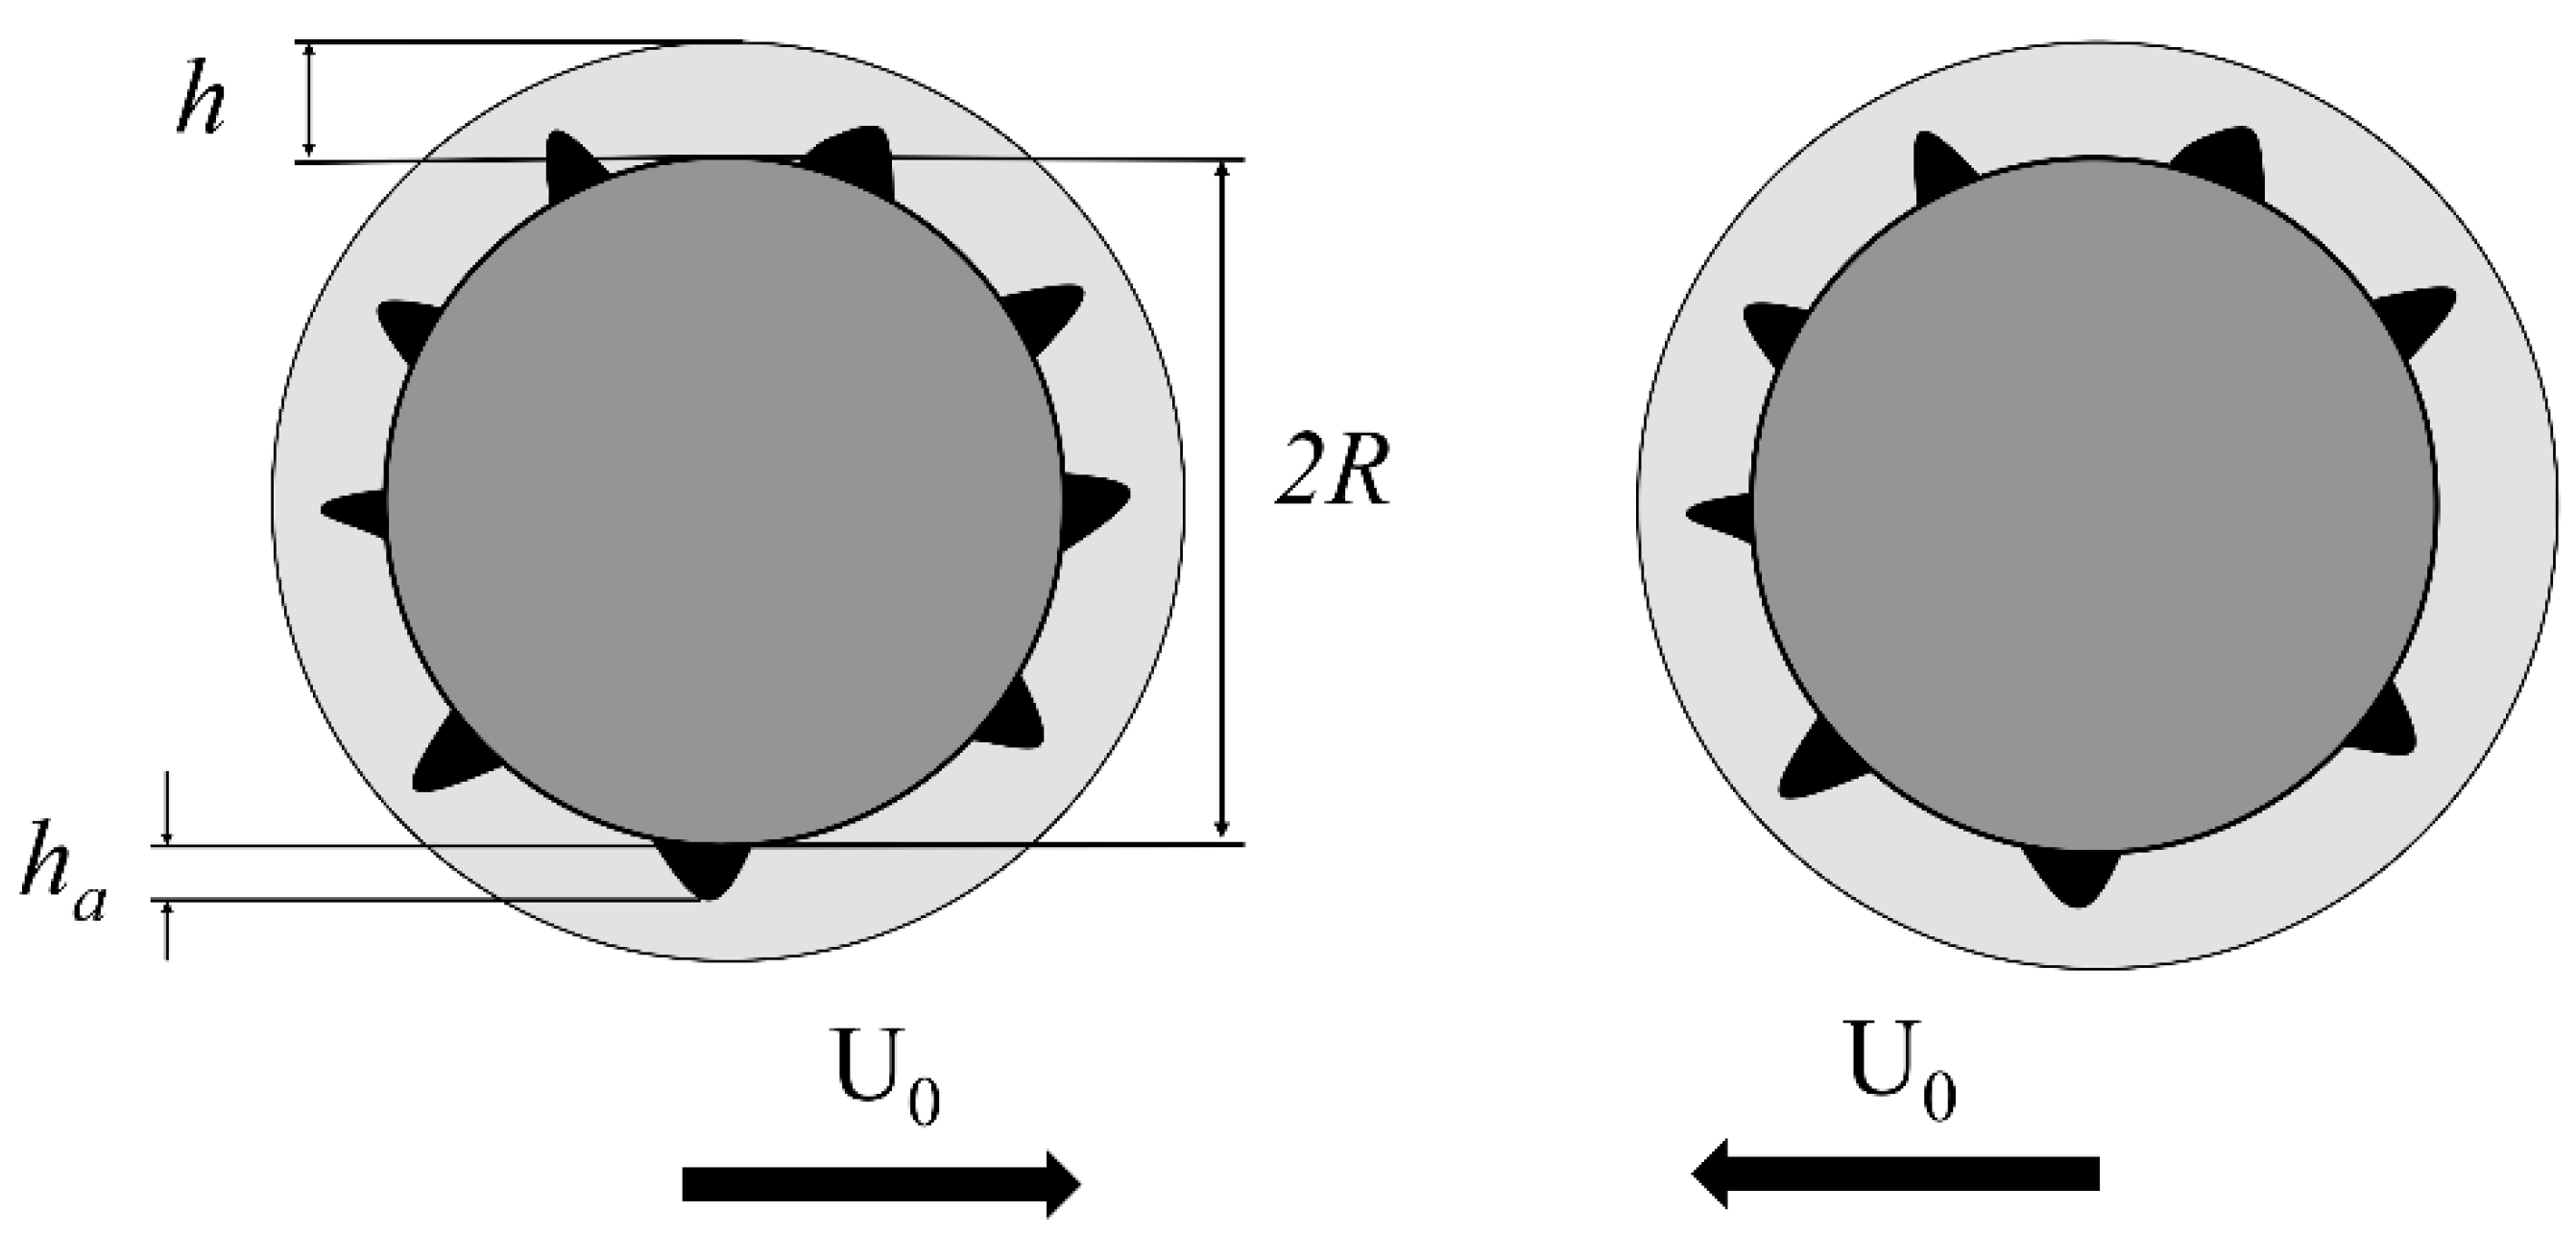
Liquid Bridge Bonding Forces
- non inertial regime (all collisions successful)
- inertial regime (some collisions successful)
- coating regime (no collisions successful)
2.2.2. Fluidization Experiments for Urea Granulation
Primary Particle Size
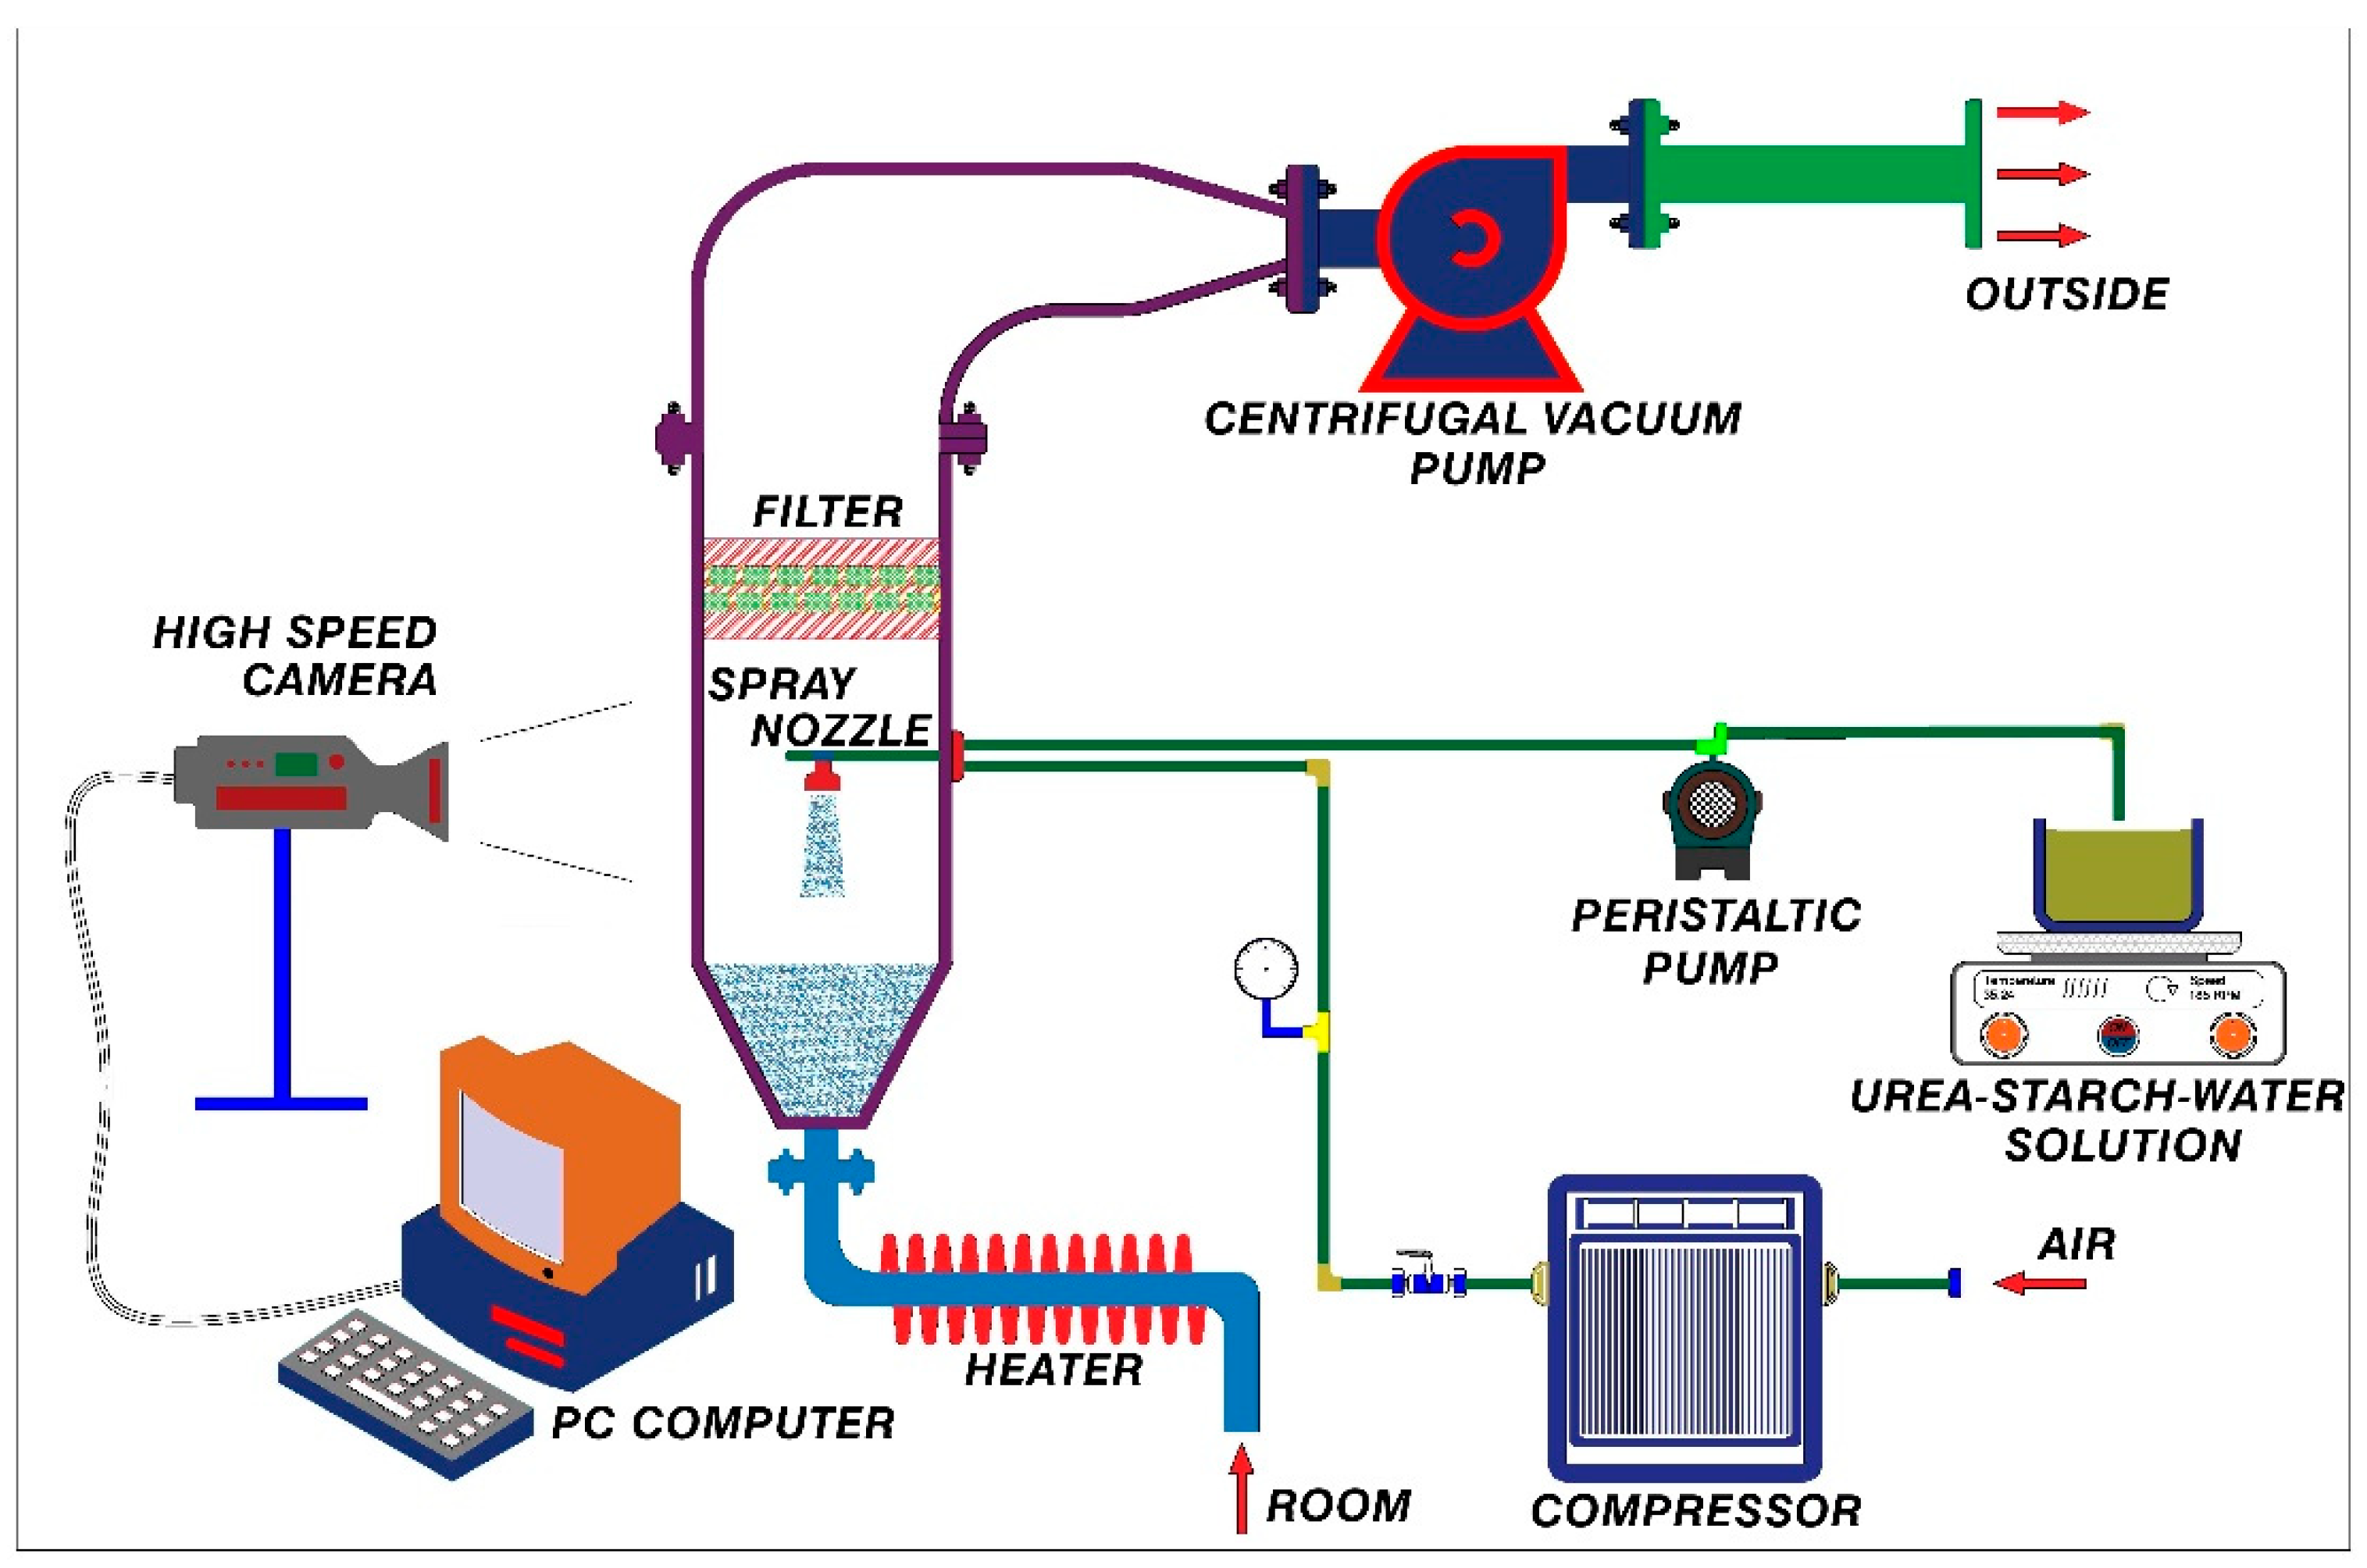
Top-Spray Fluidized Bed Granulation
Test Procedure
Sampling and Granule Size Measurement
Design of Experiments
3. Results and Discussion
3.1. Binder Properties
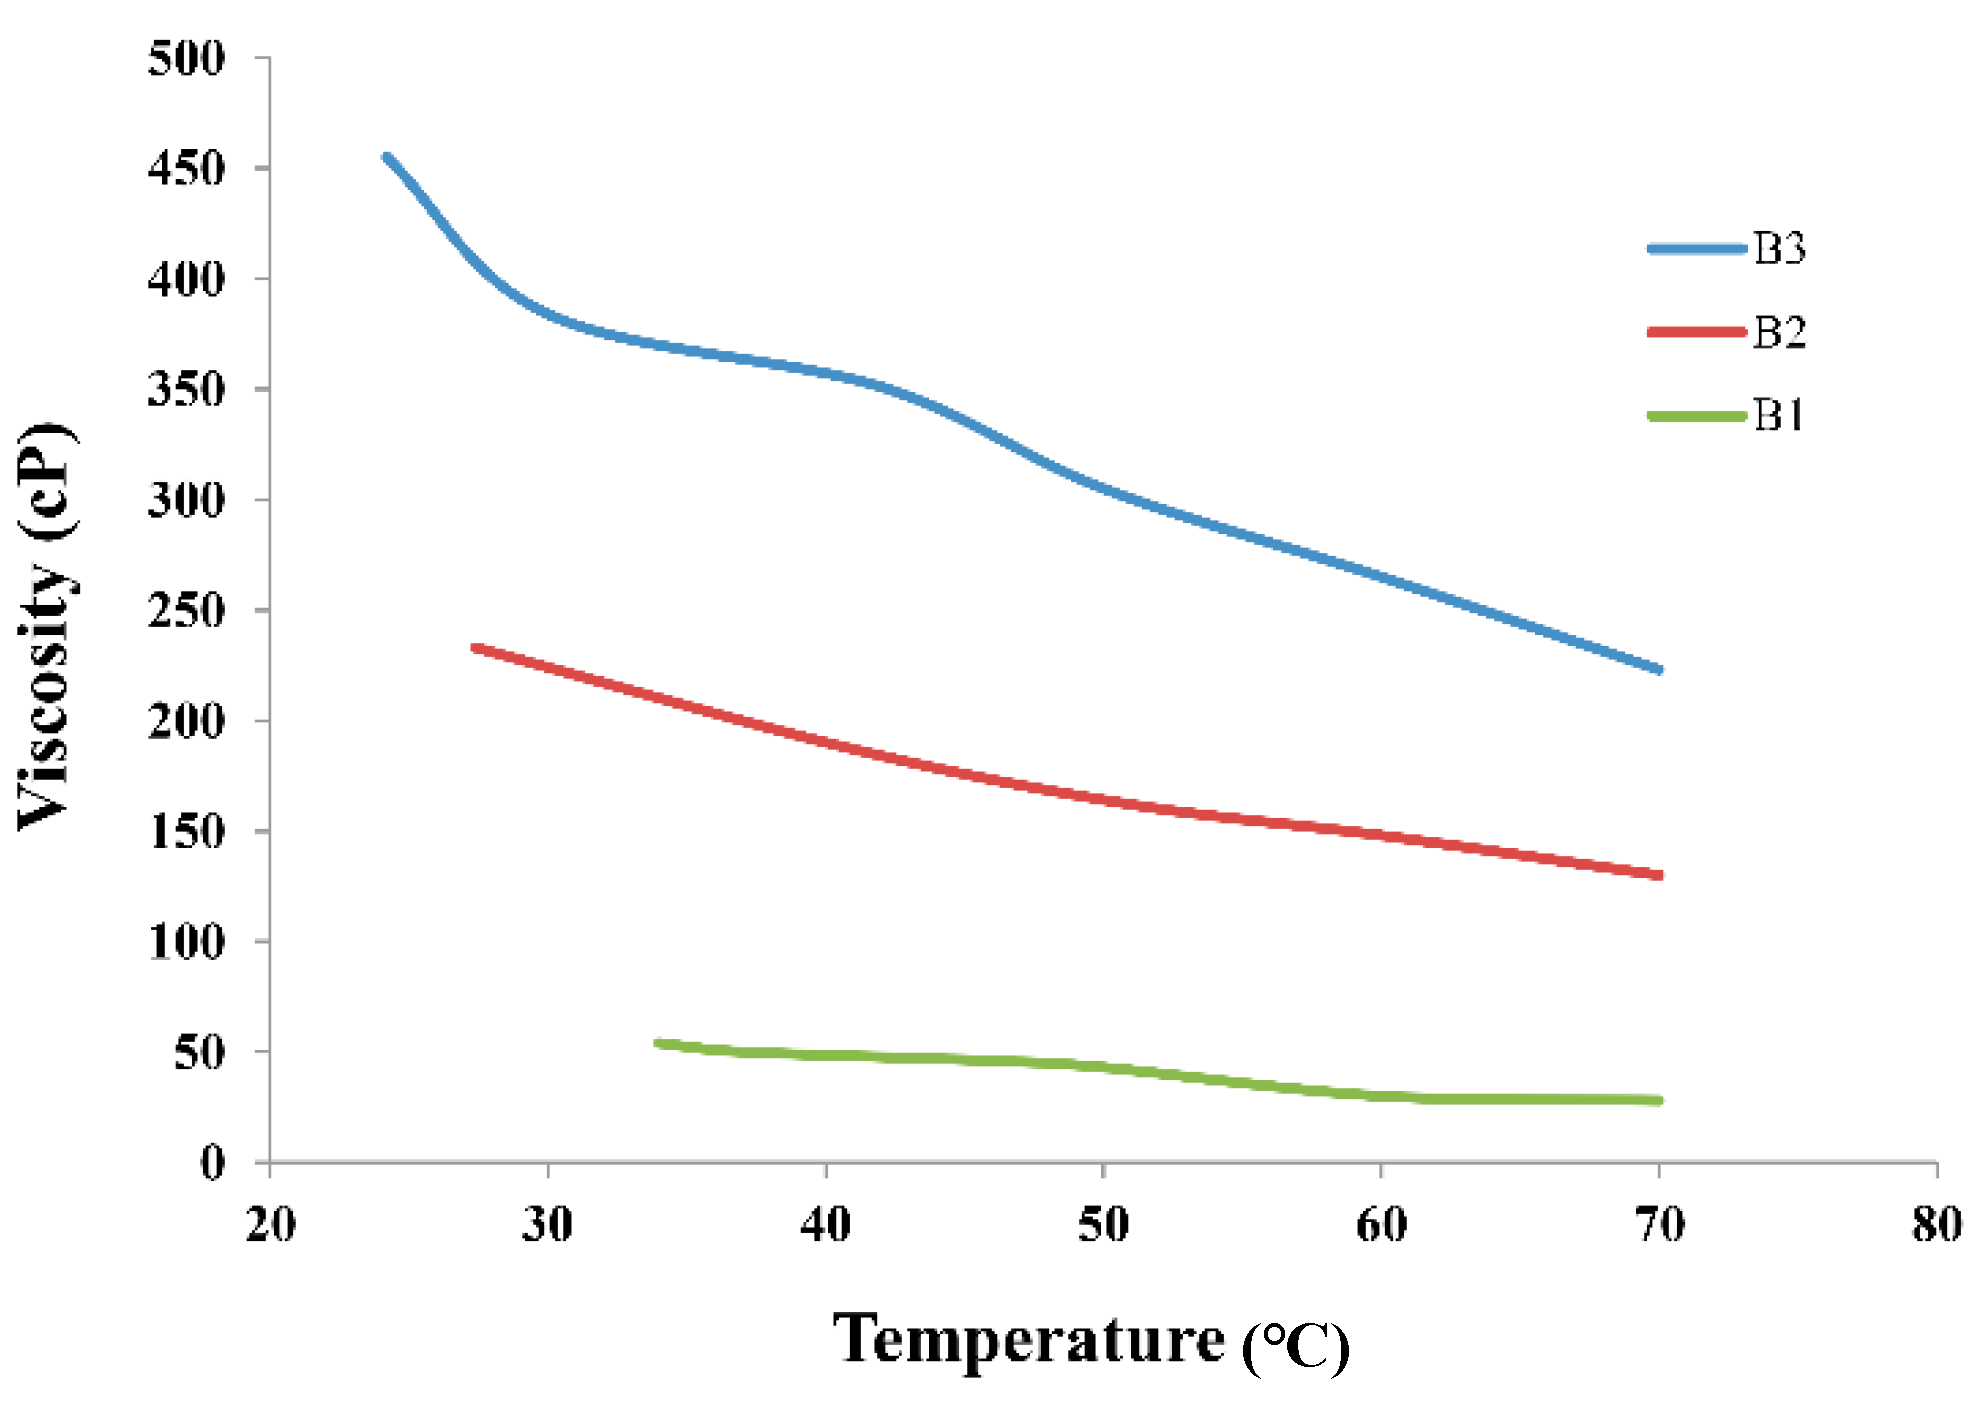
3.1.1. Binder Density and Viscosity
3.1.2. Binder Surface Tension
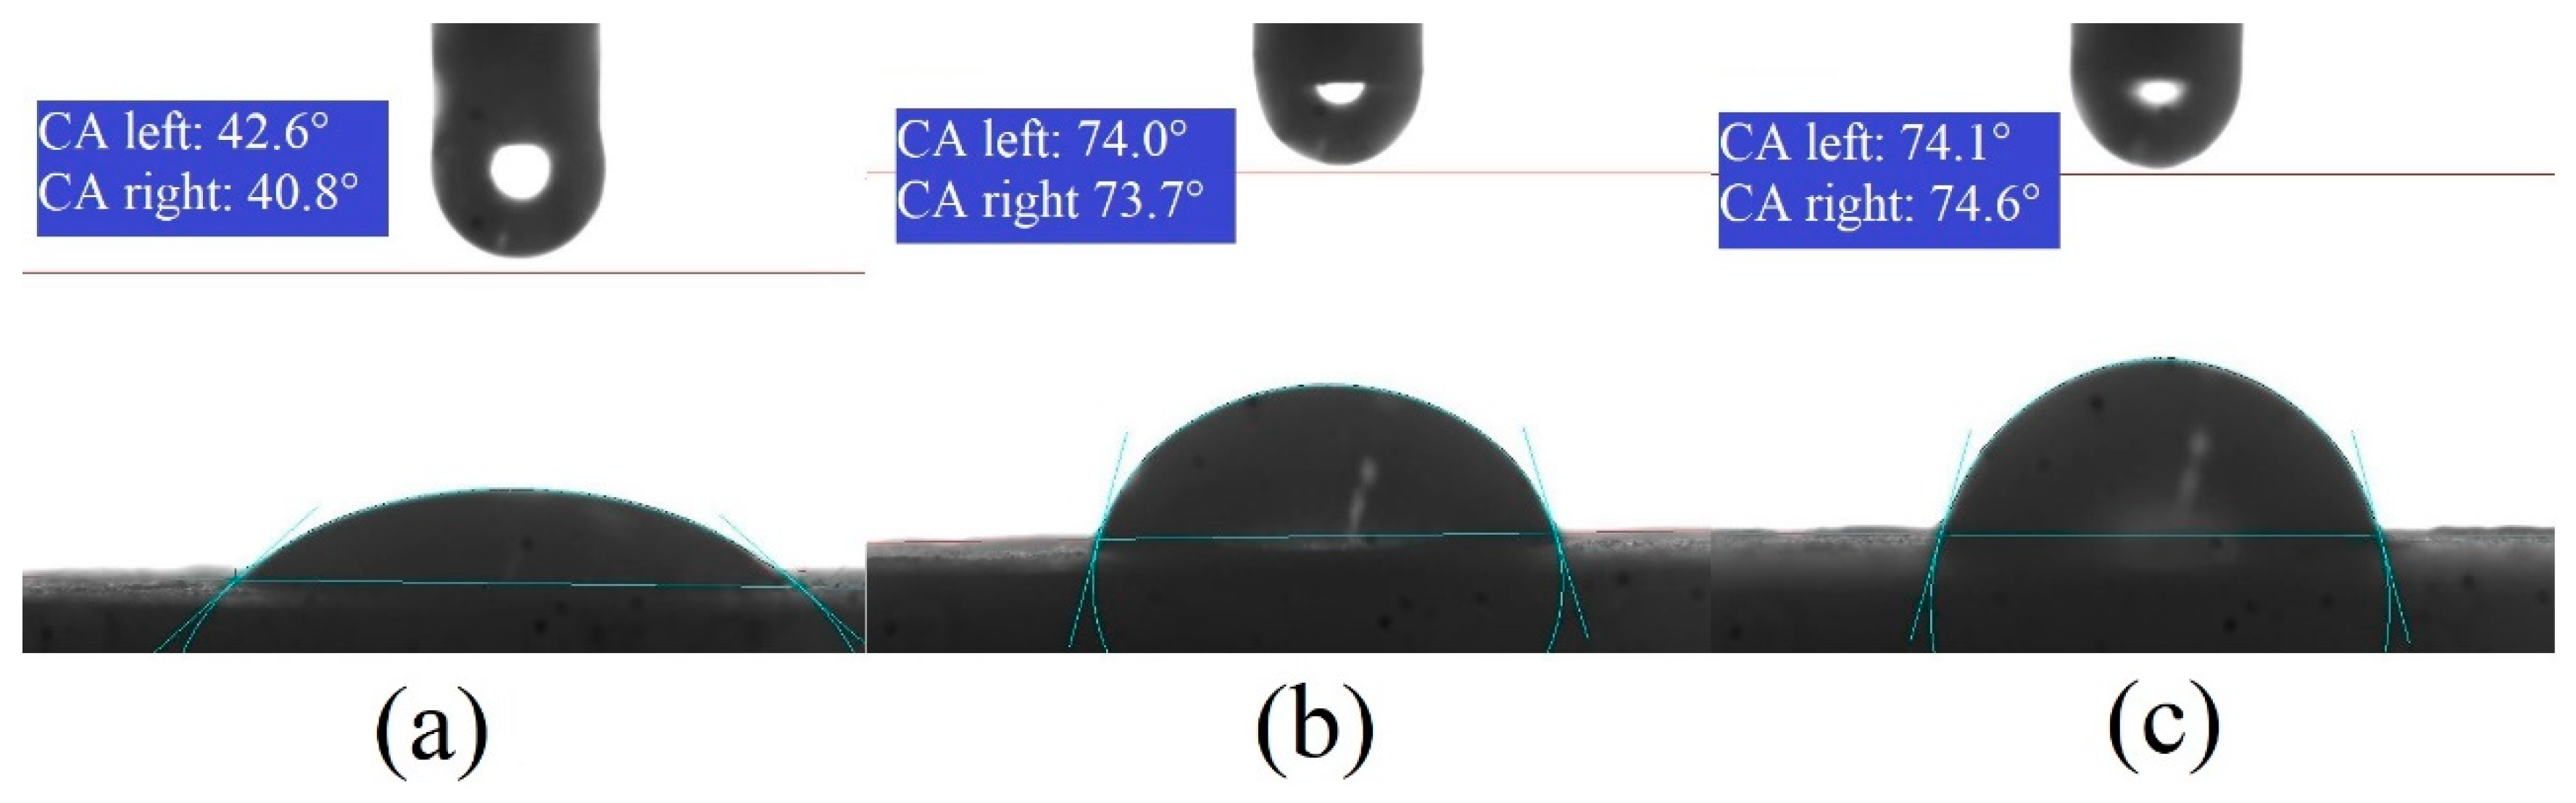
3.1.3. Binder Contact Angle
3.1.4. Droplet Penetration Time
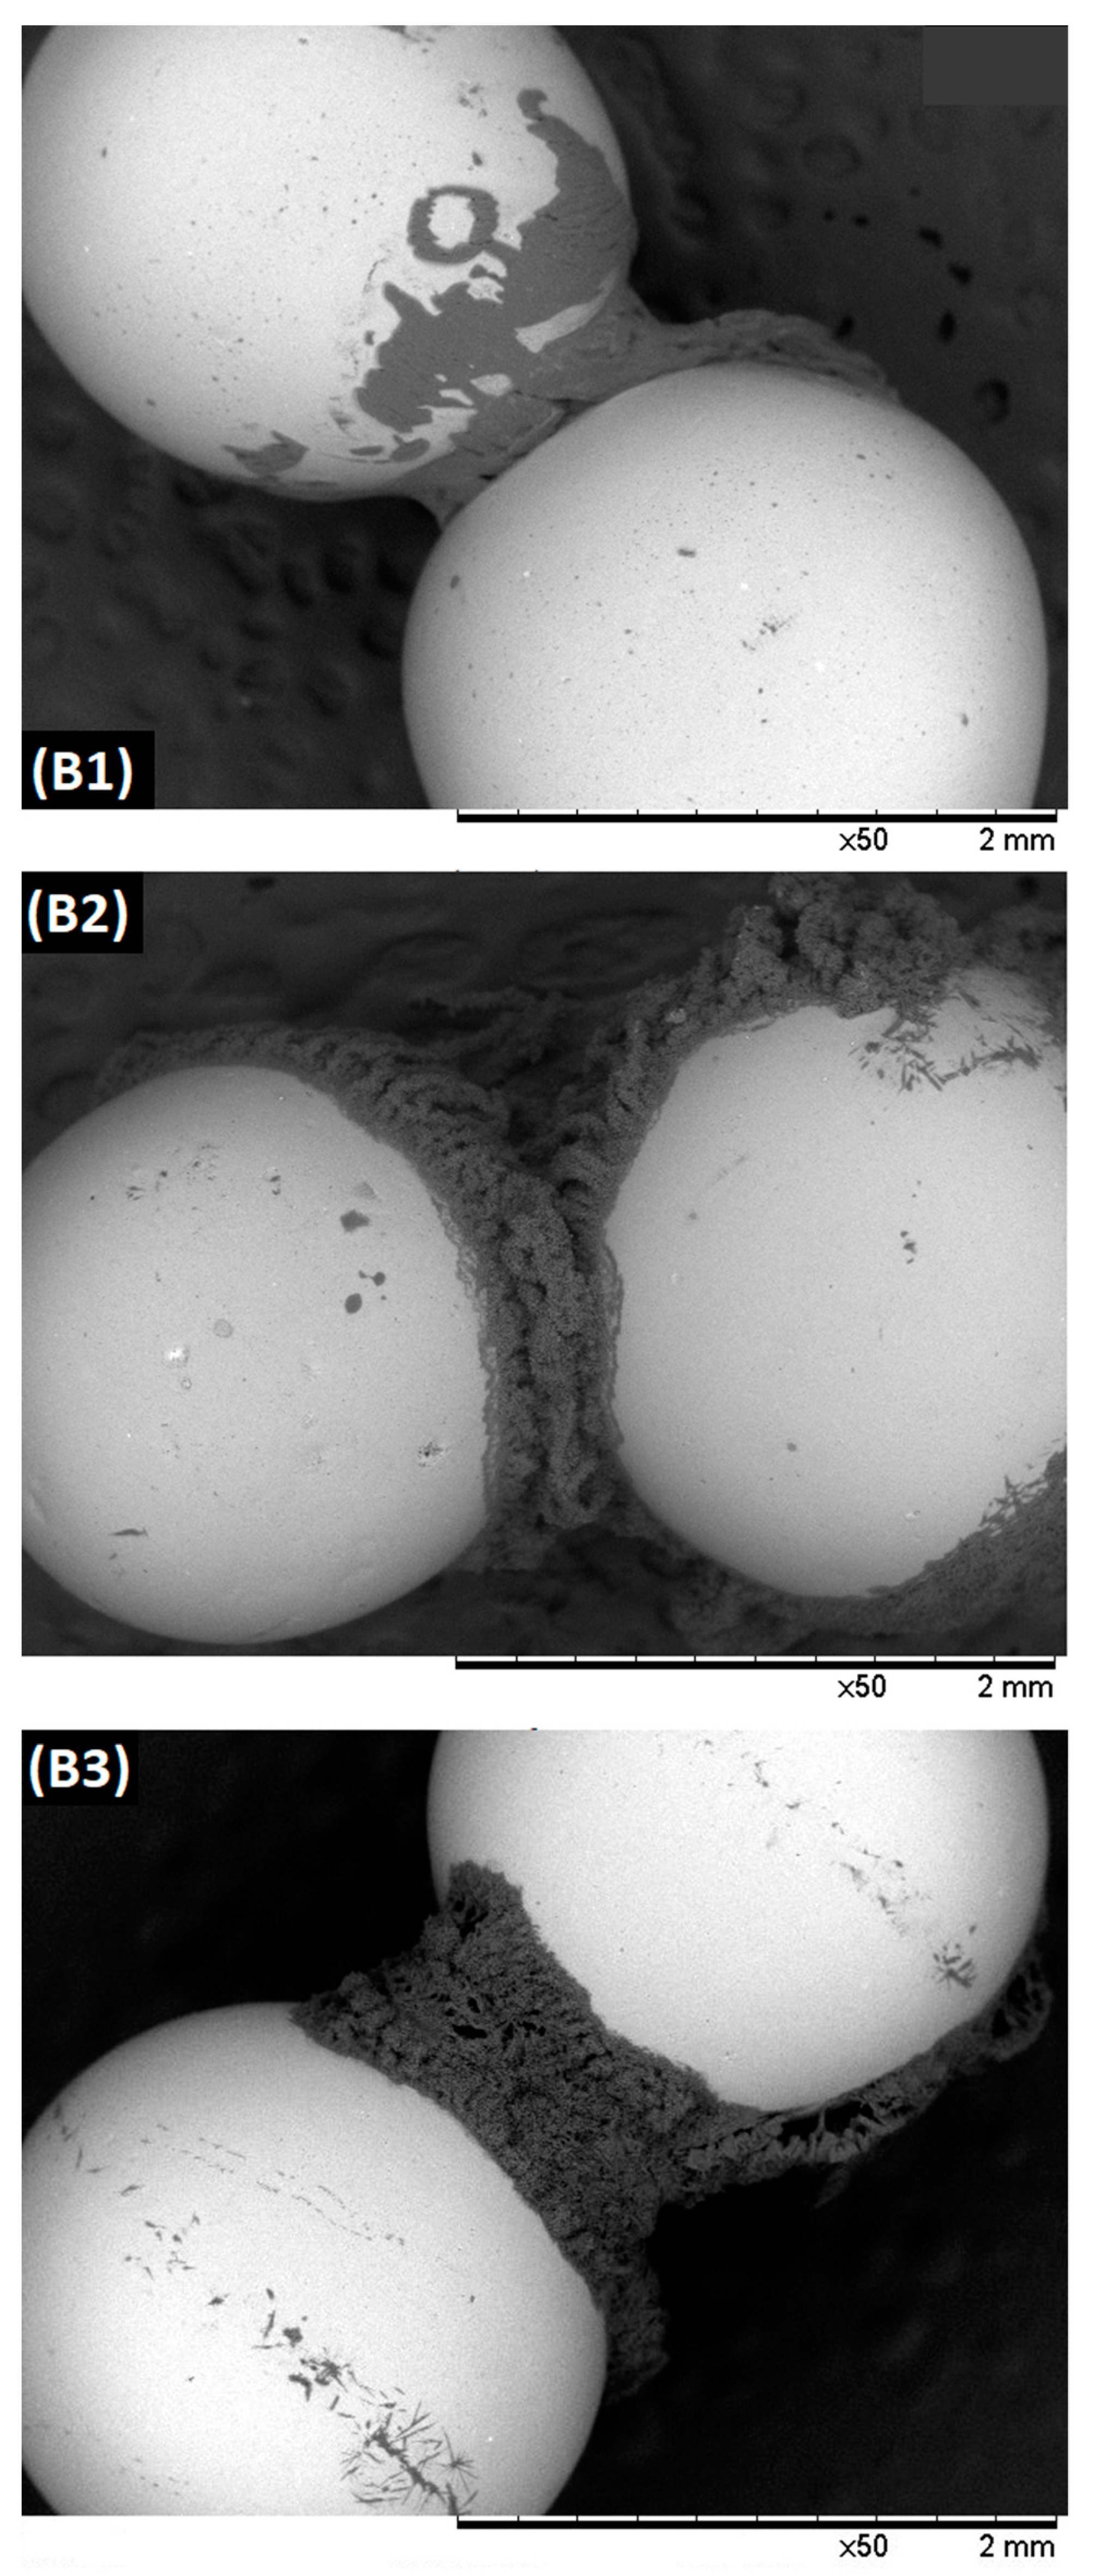
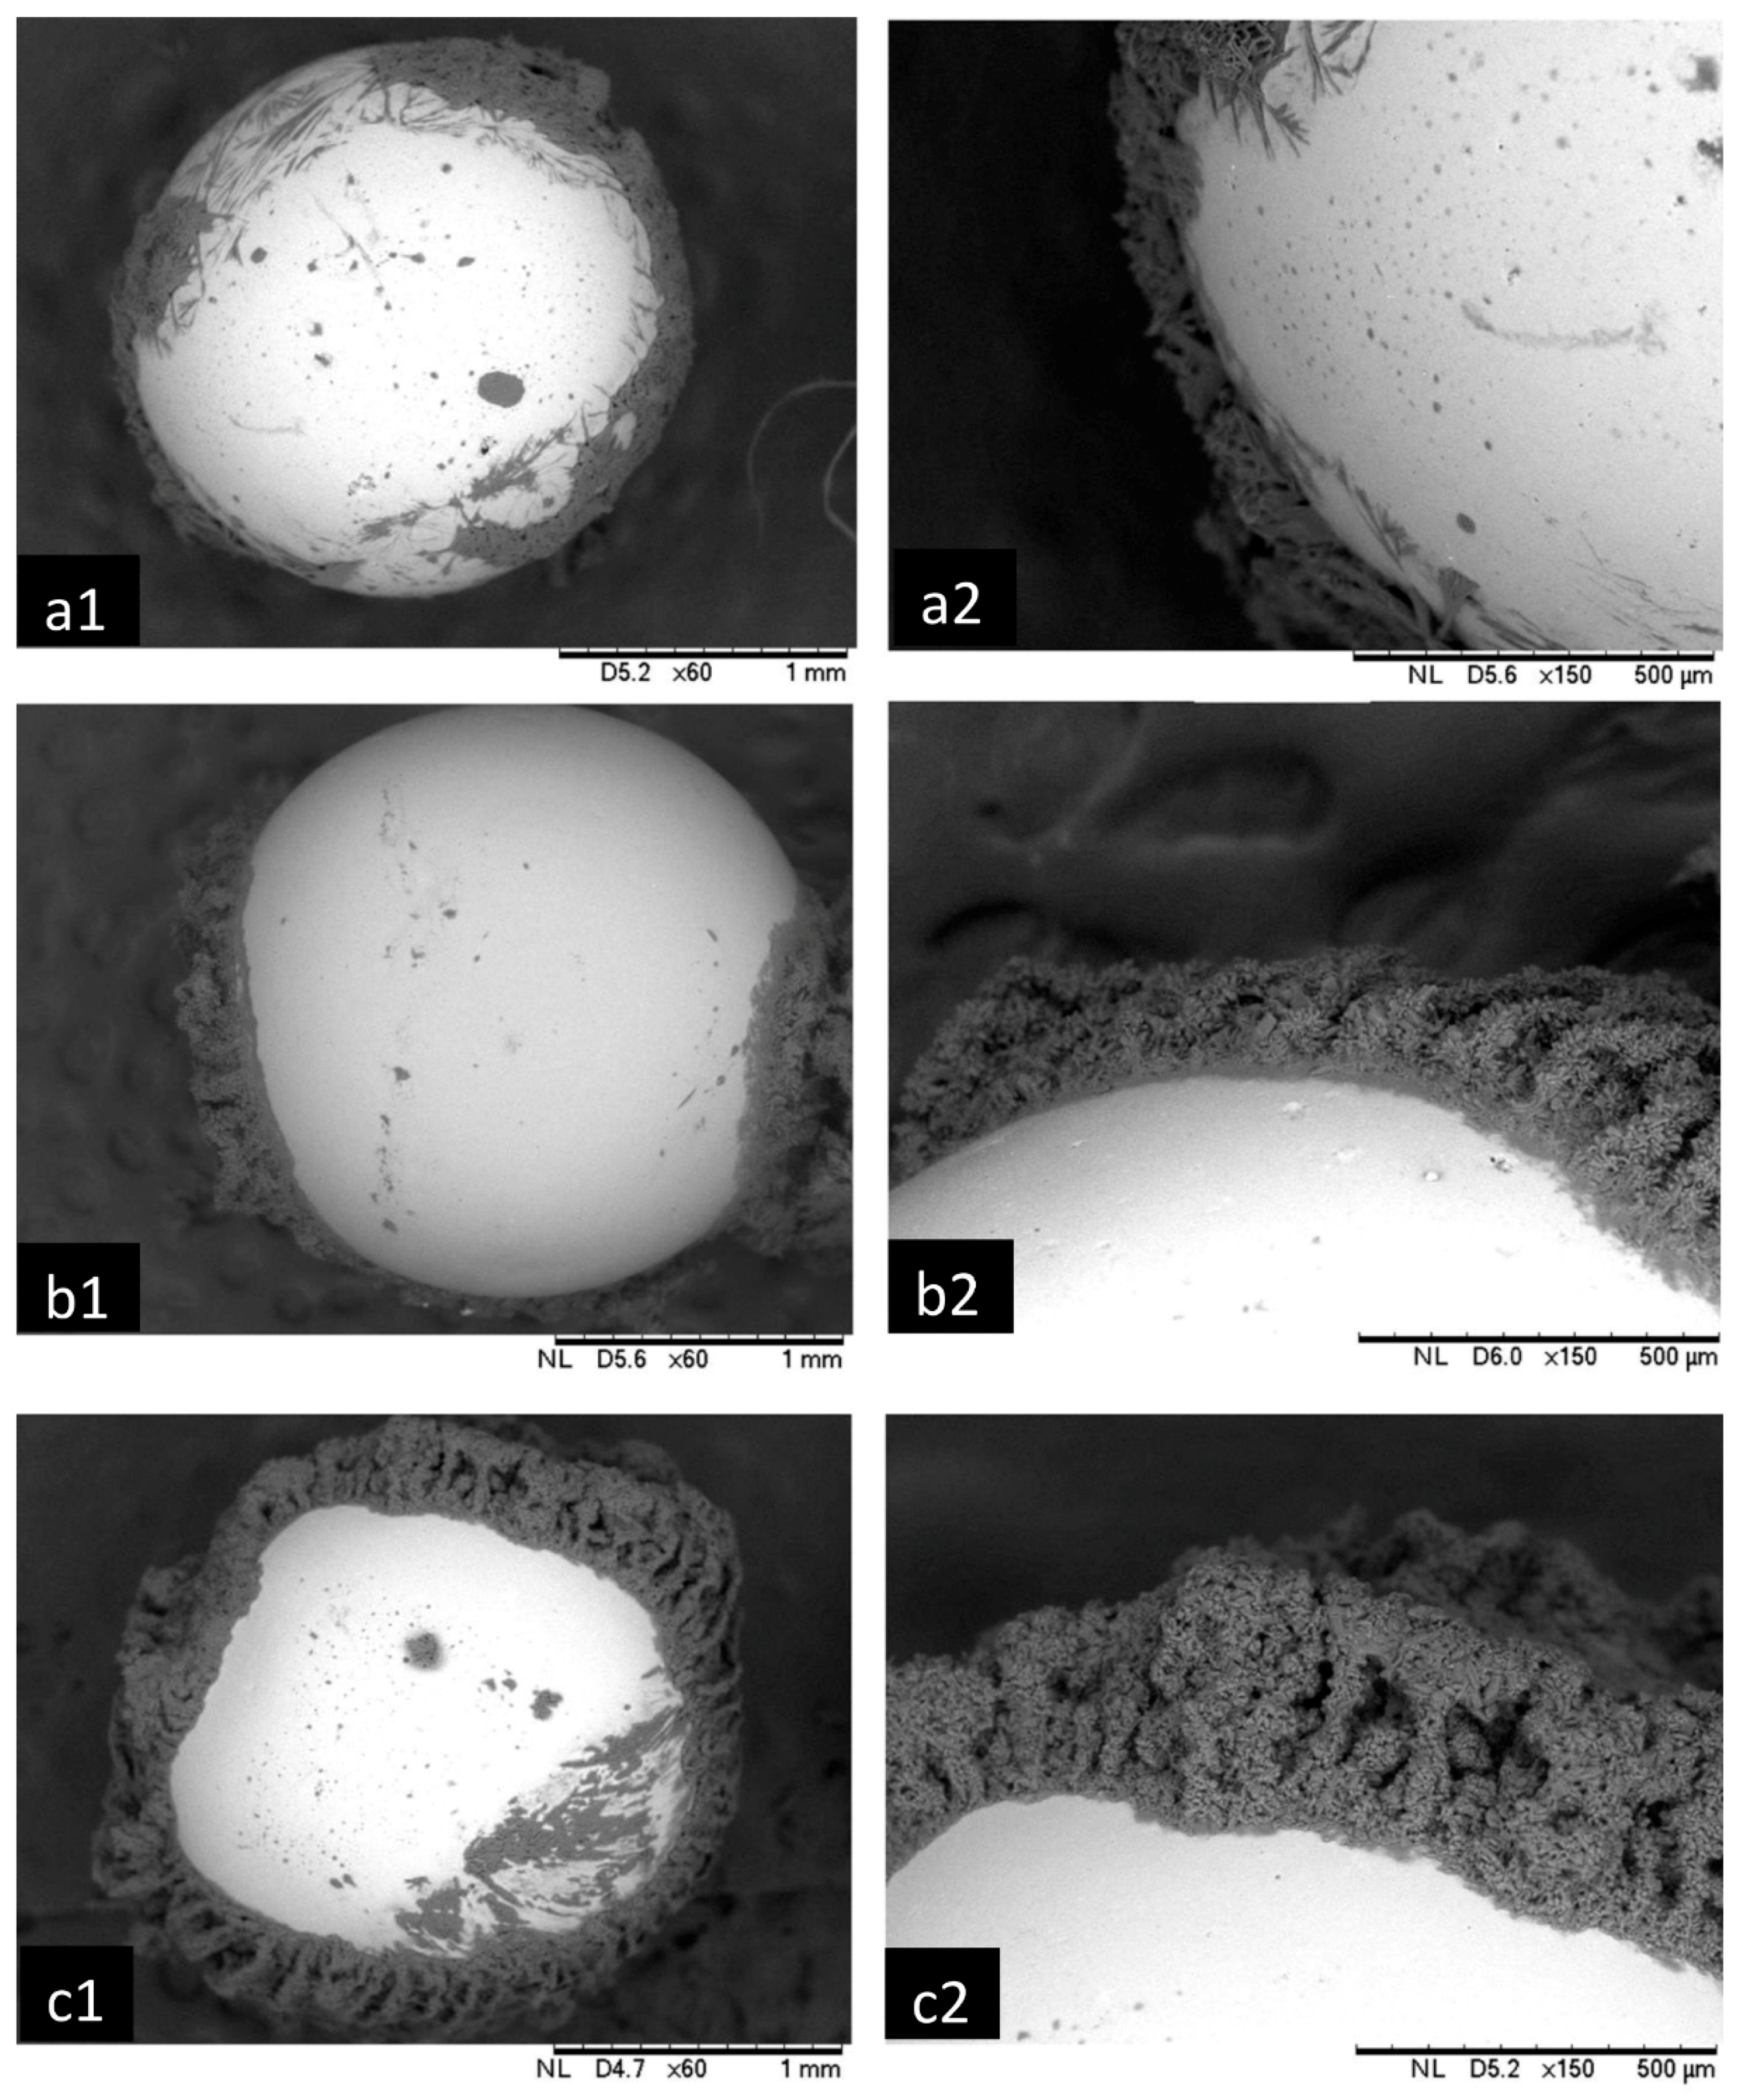
3.1.5. Liquid Bridge Bonding Forces
3.2. Effect of Operating Parameters on Particle Growth
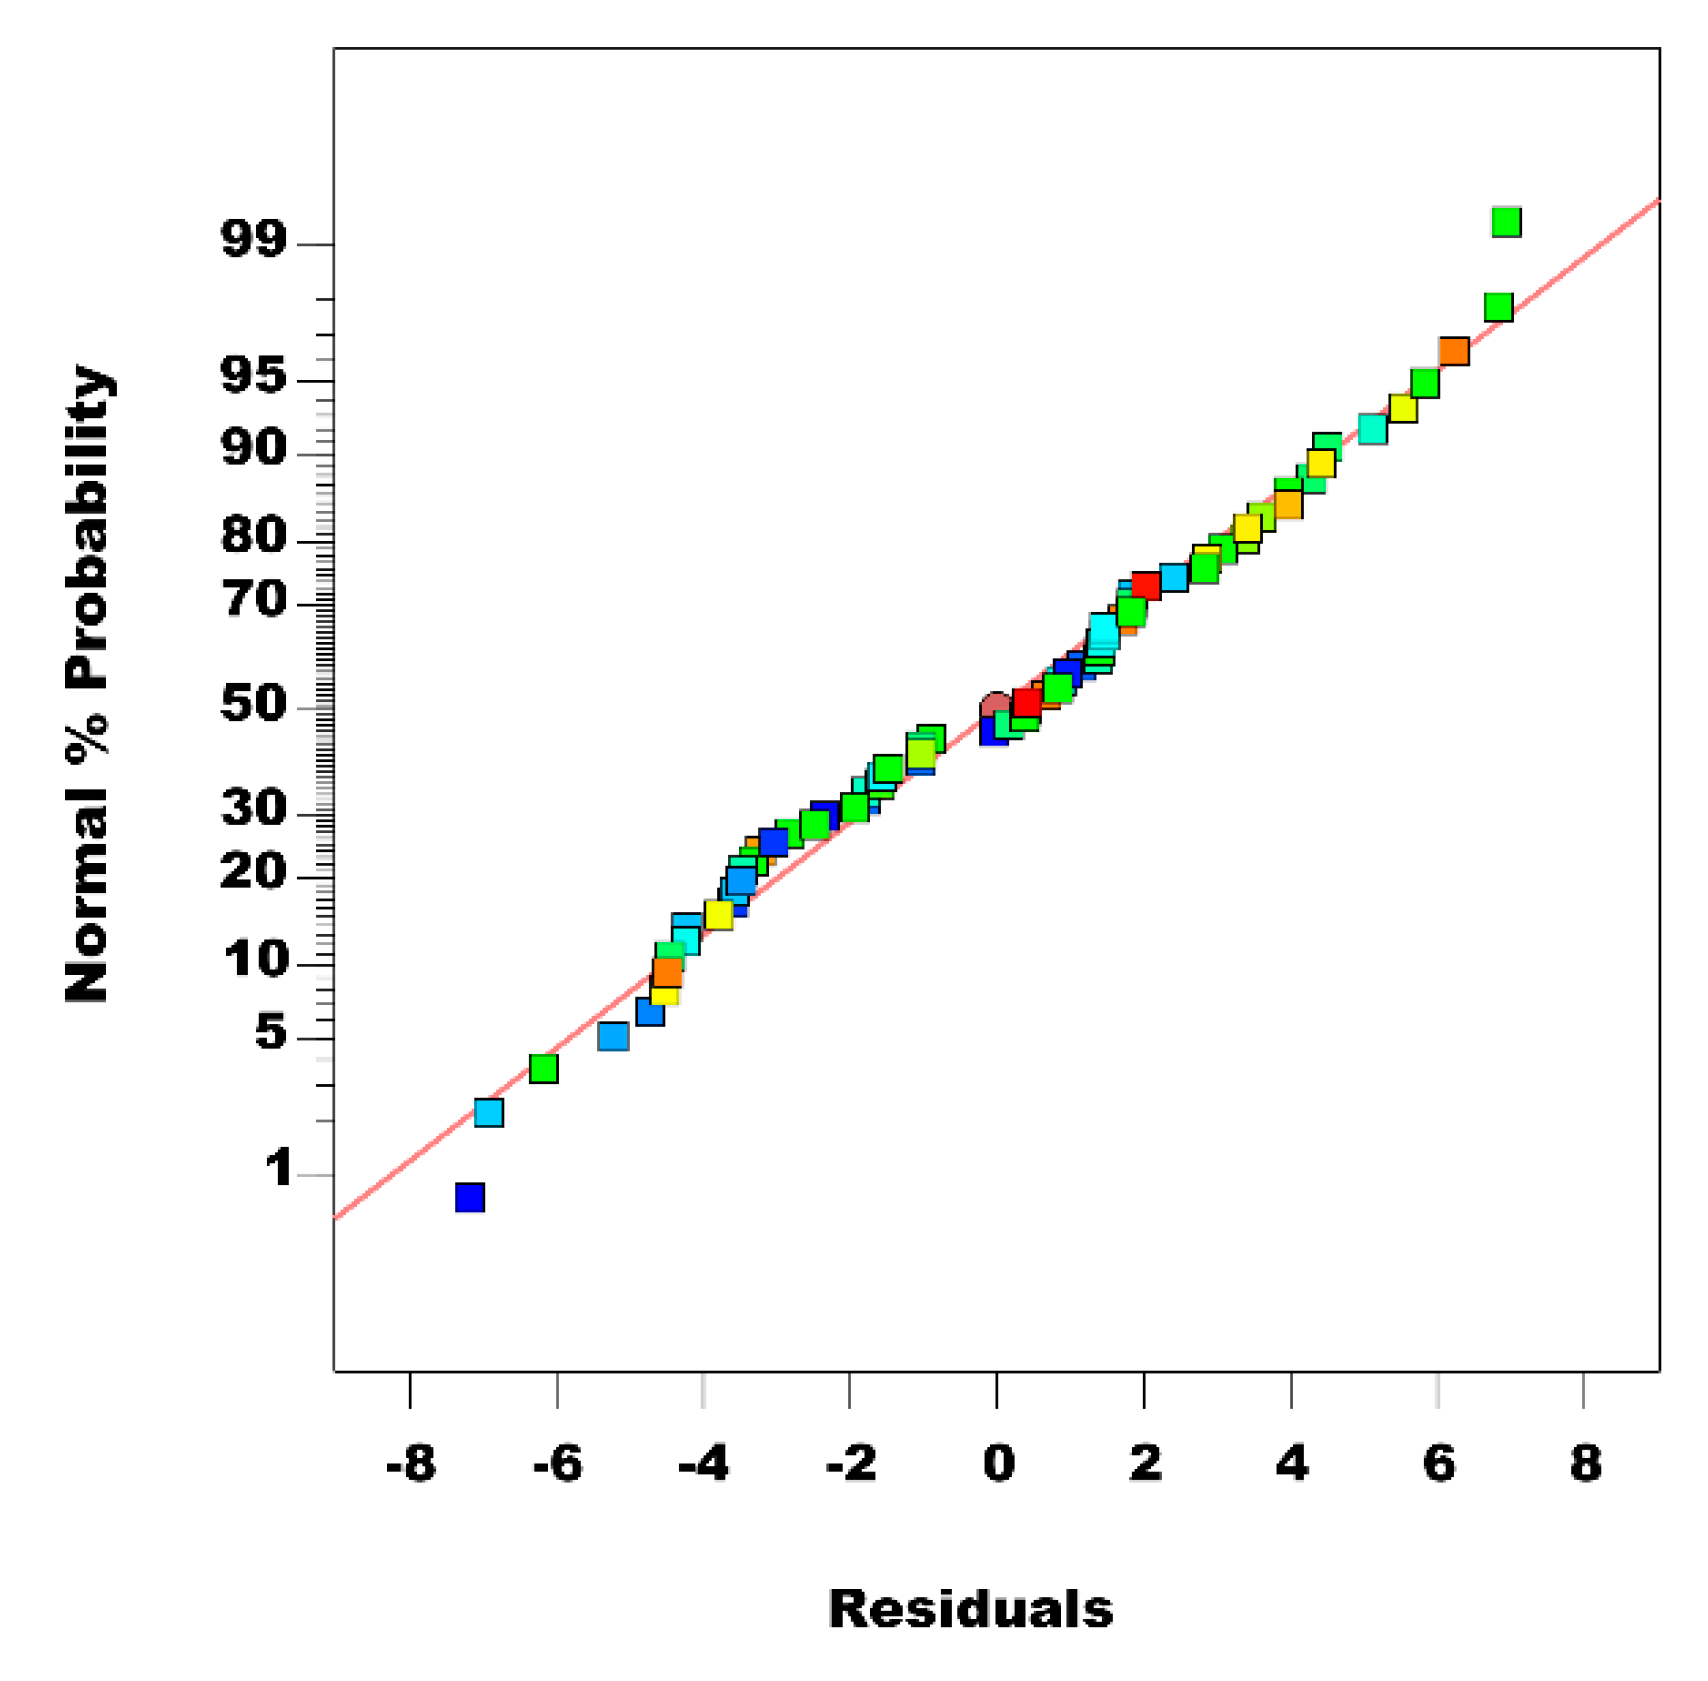
3.2.1. Statistical Analysis (ANOVA)
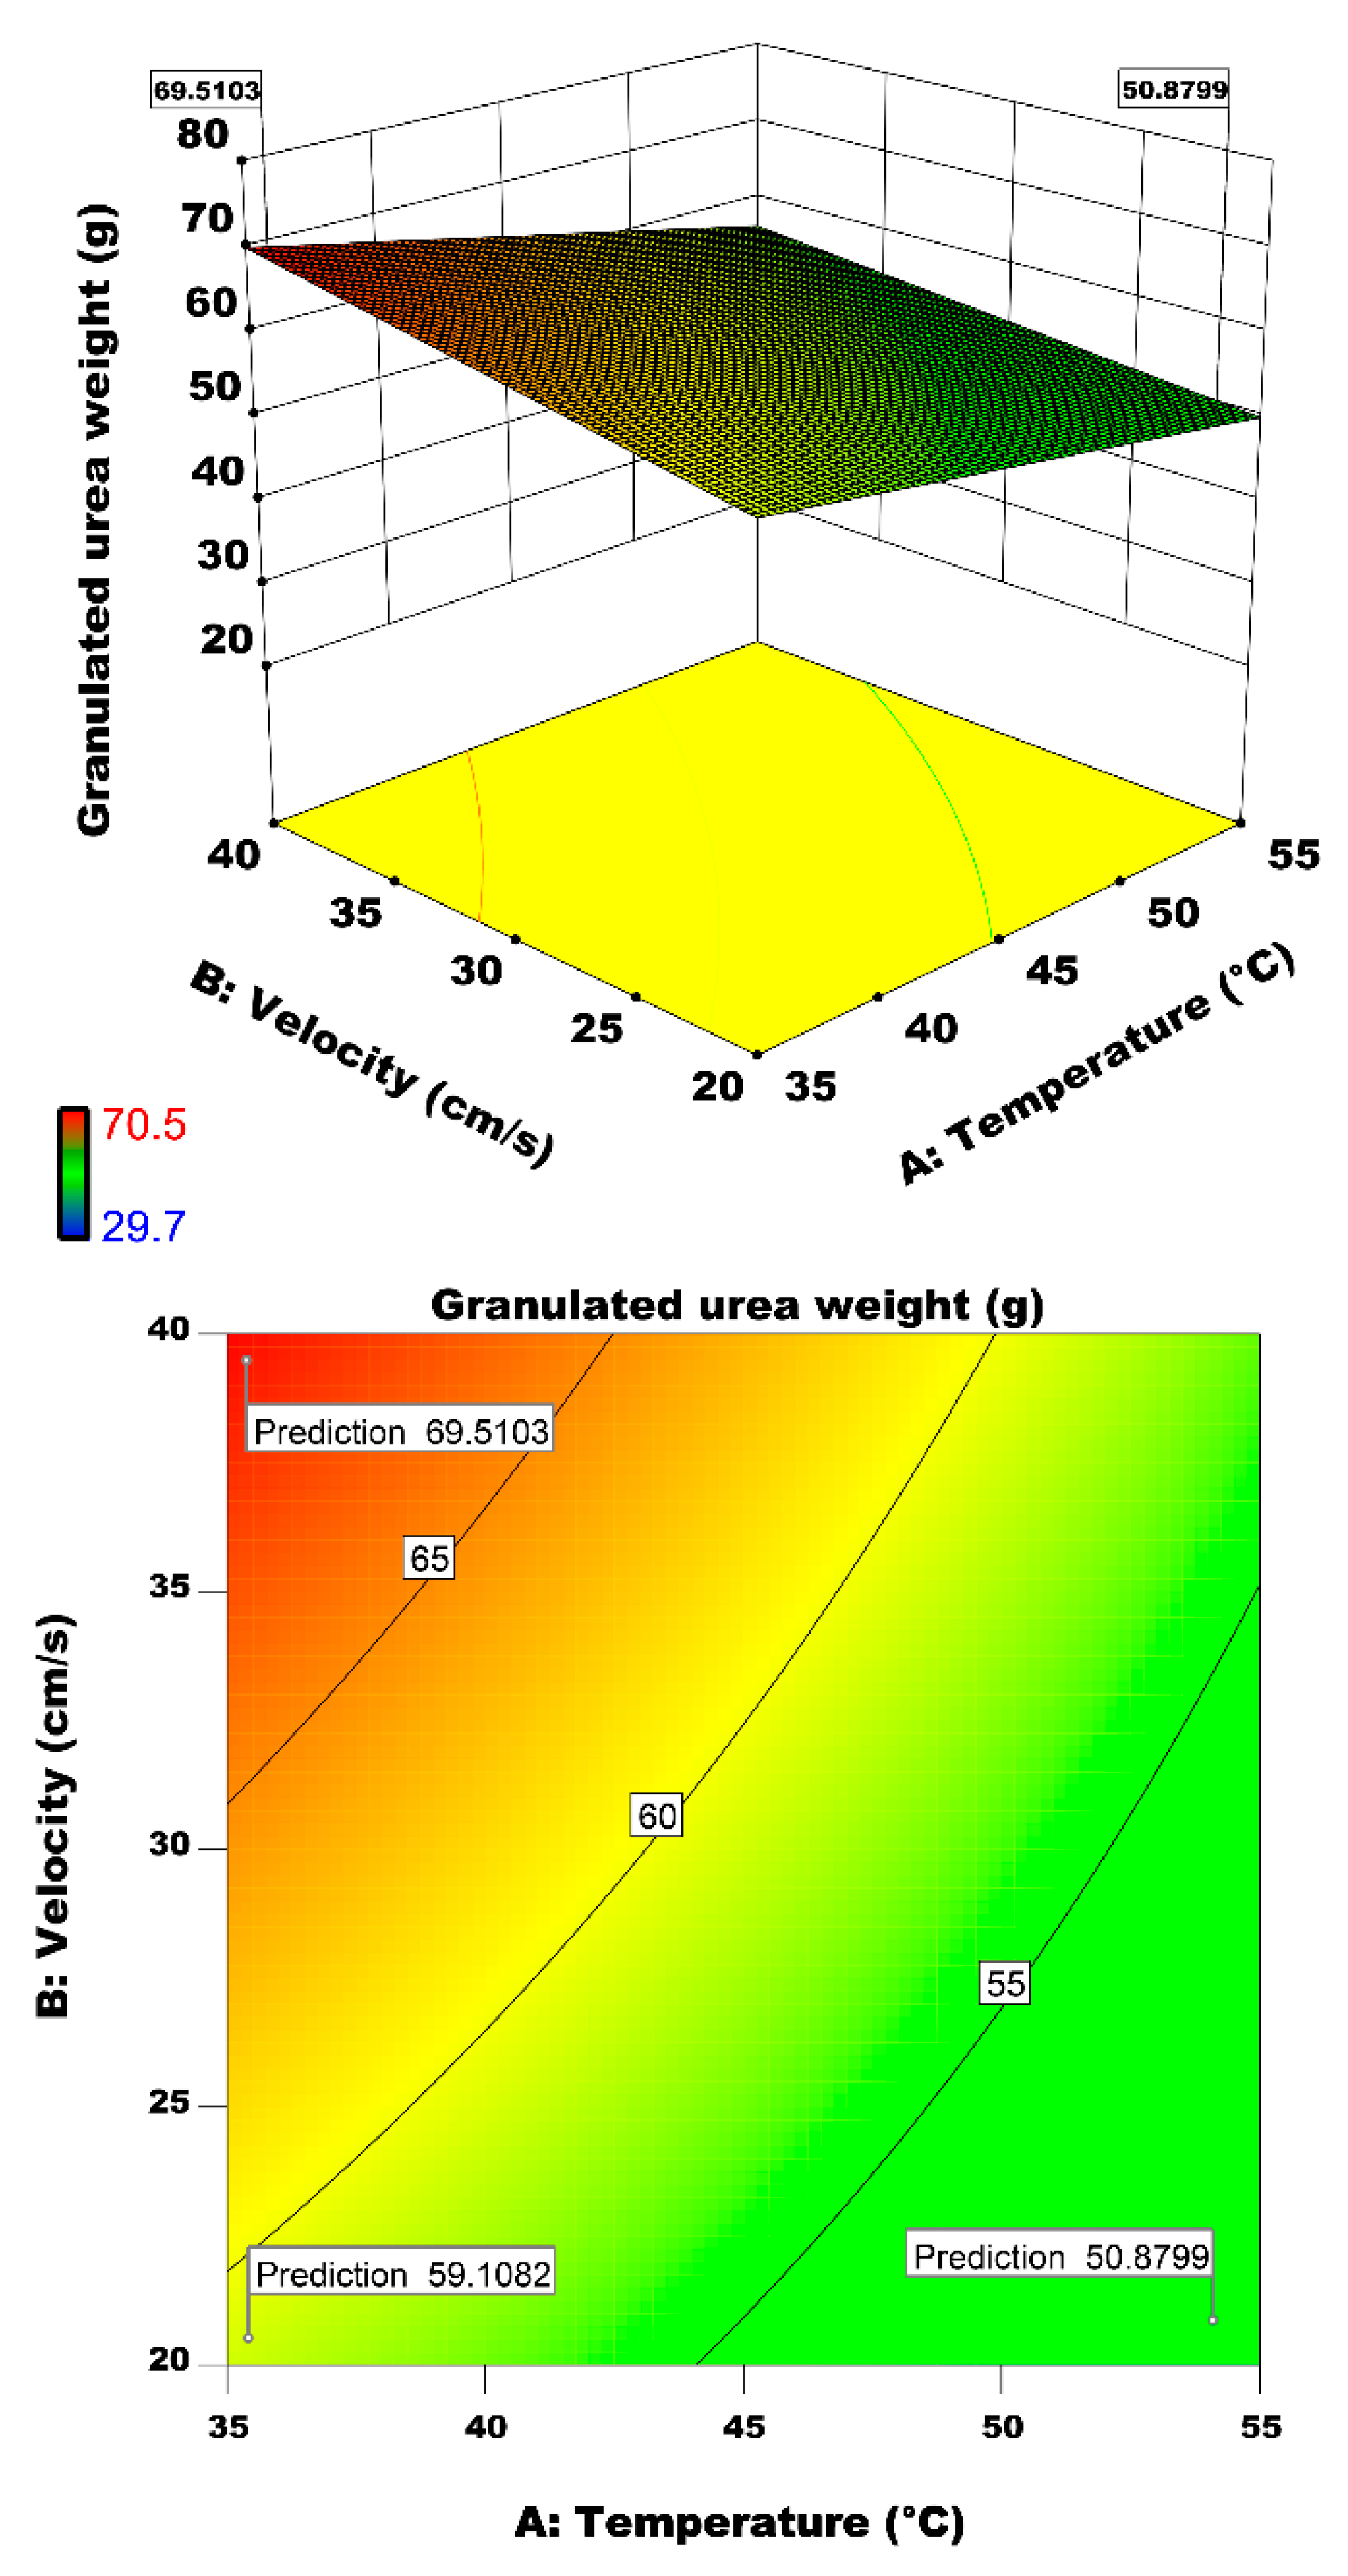
3.2.2. Interactive Effect of Air Temperature and Velocity on Particle Growth
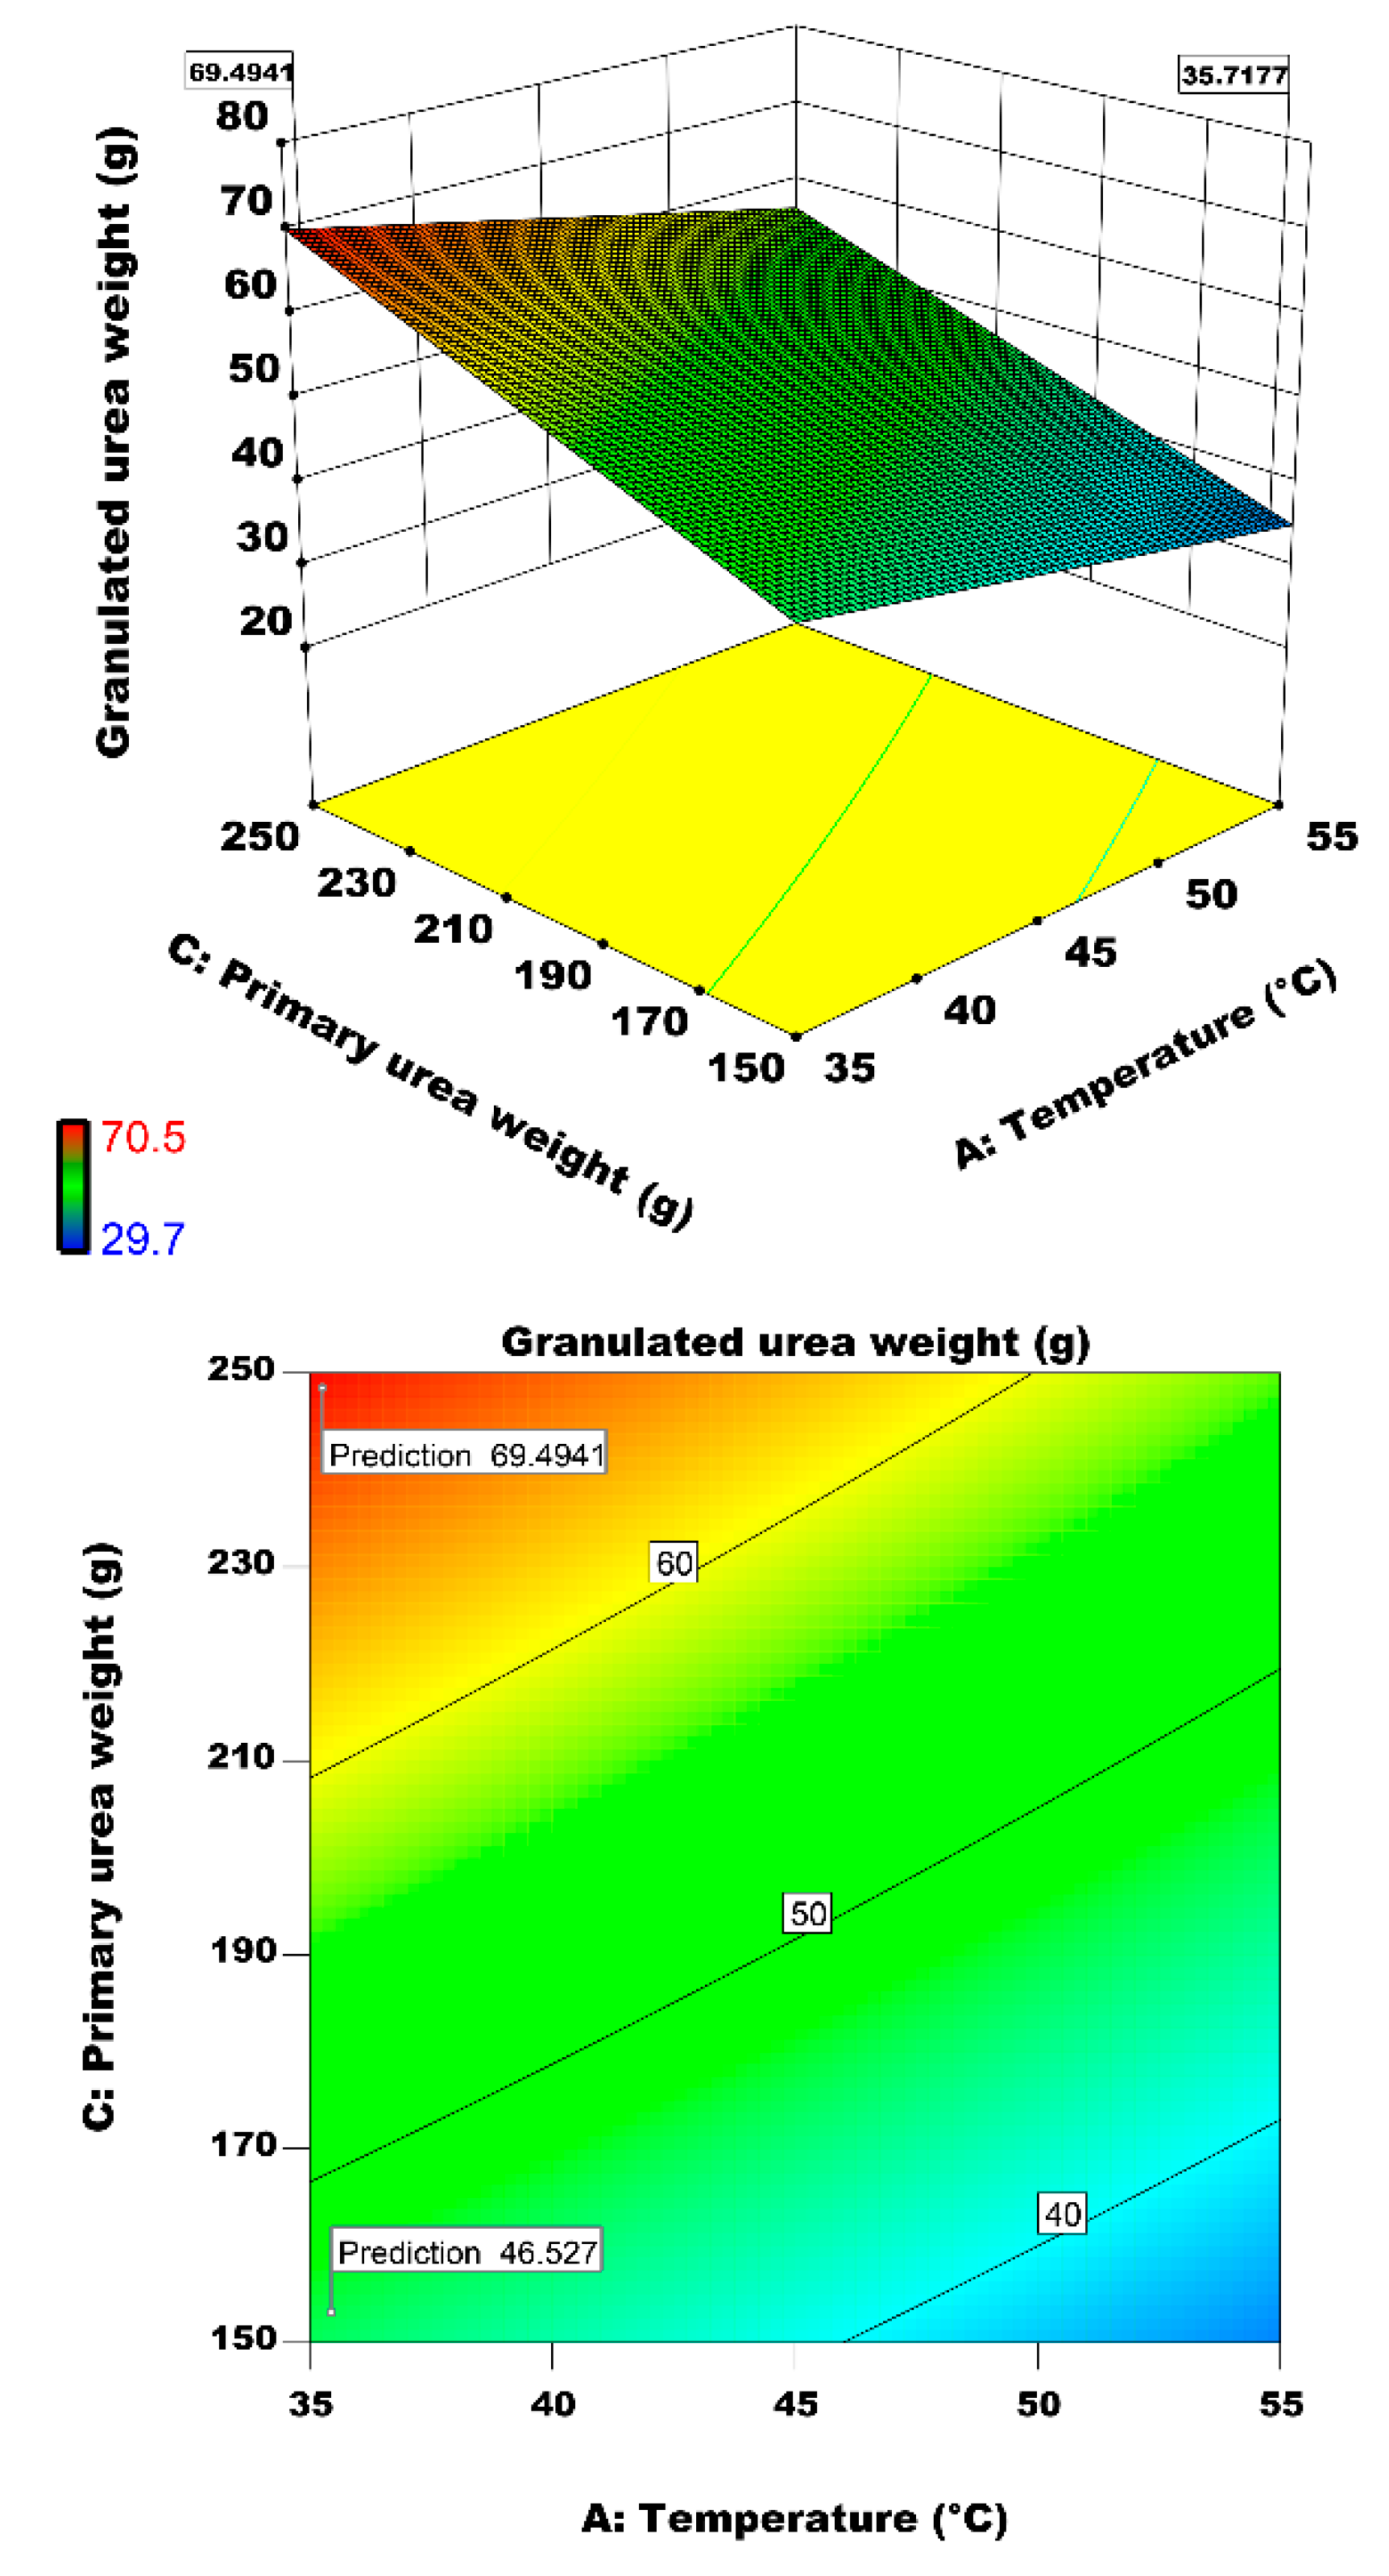
3.2.3. Interactive Effect of Air Temperature and Primary Urea Weight on Particle Growth
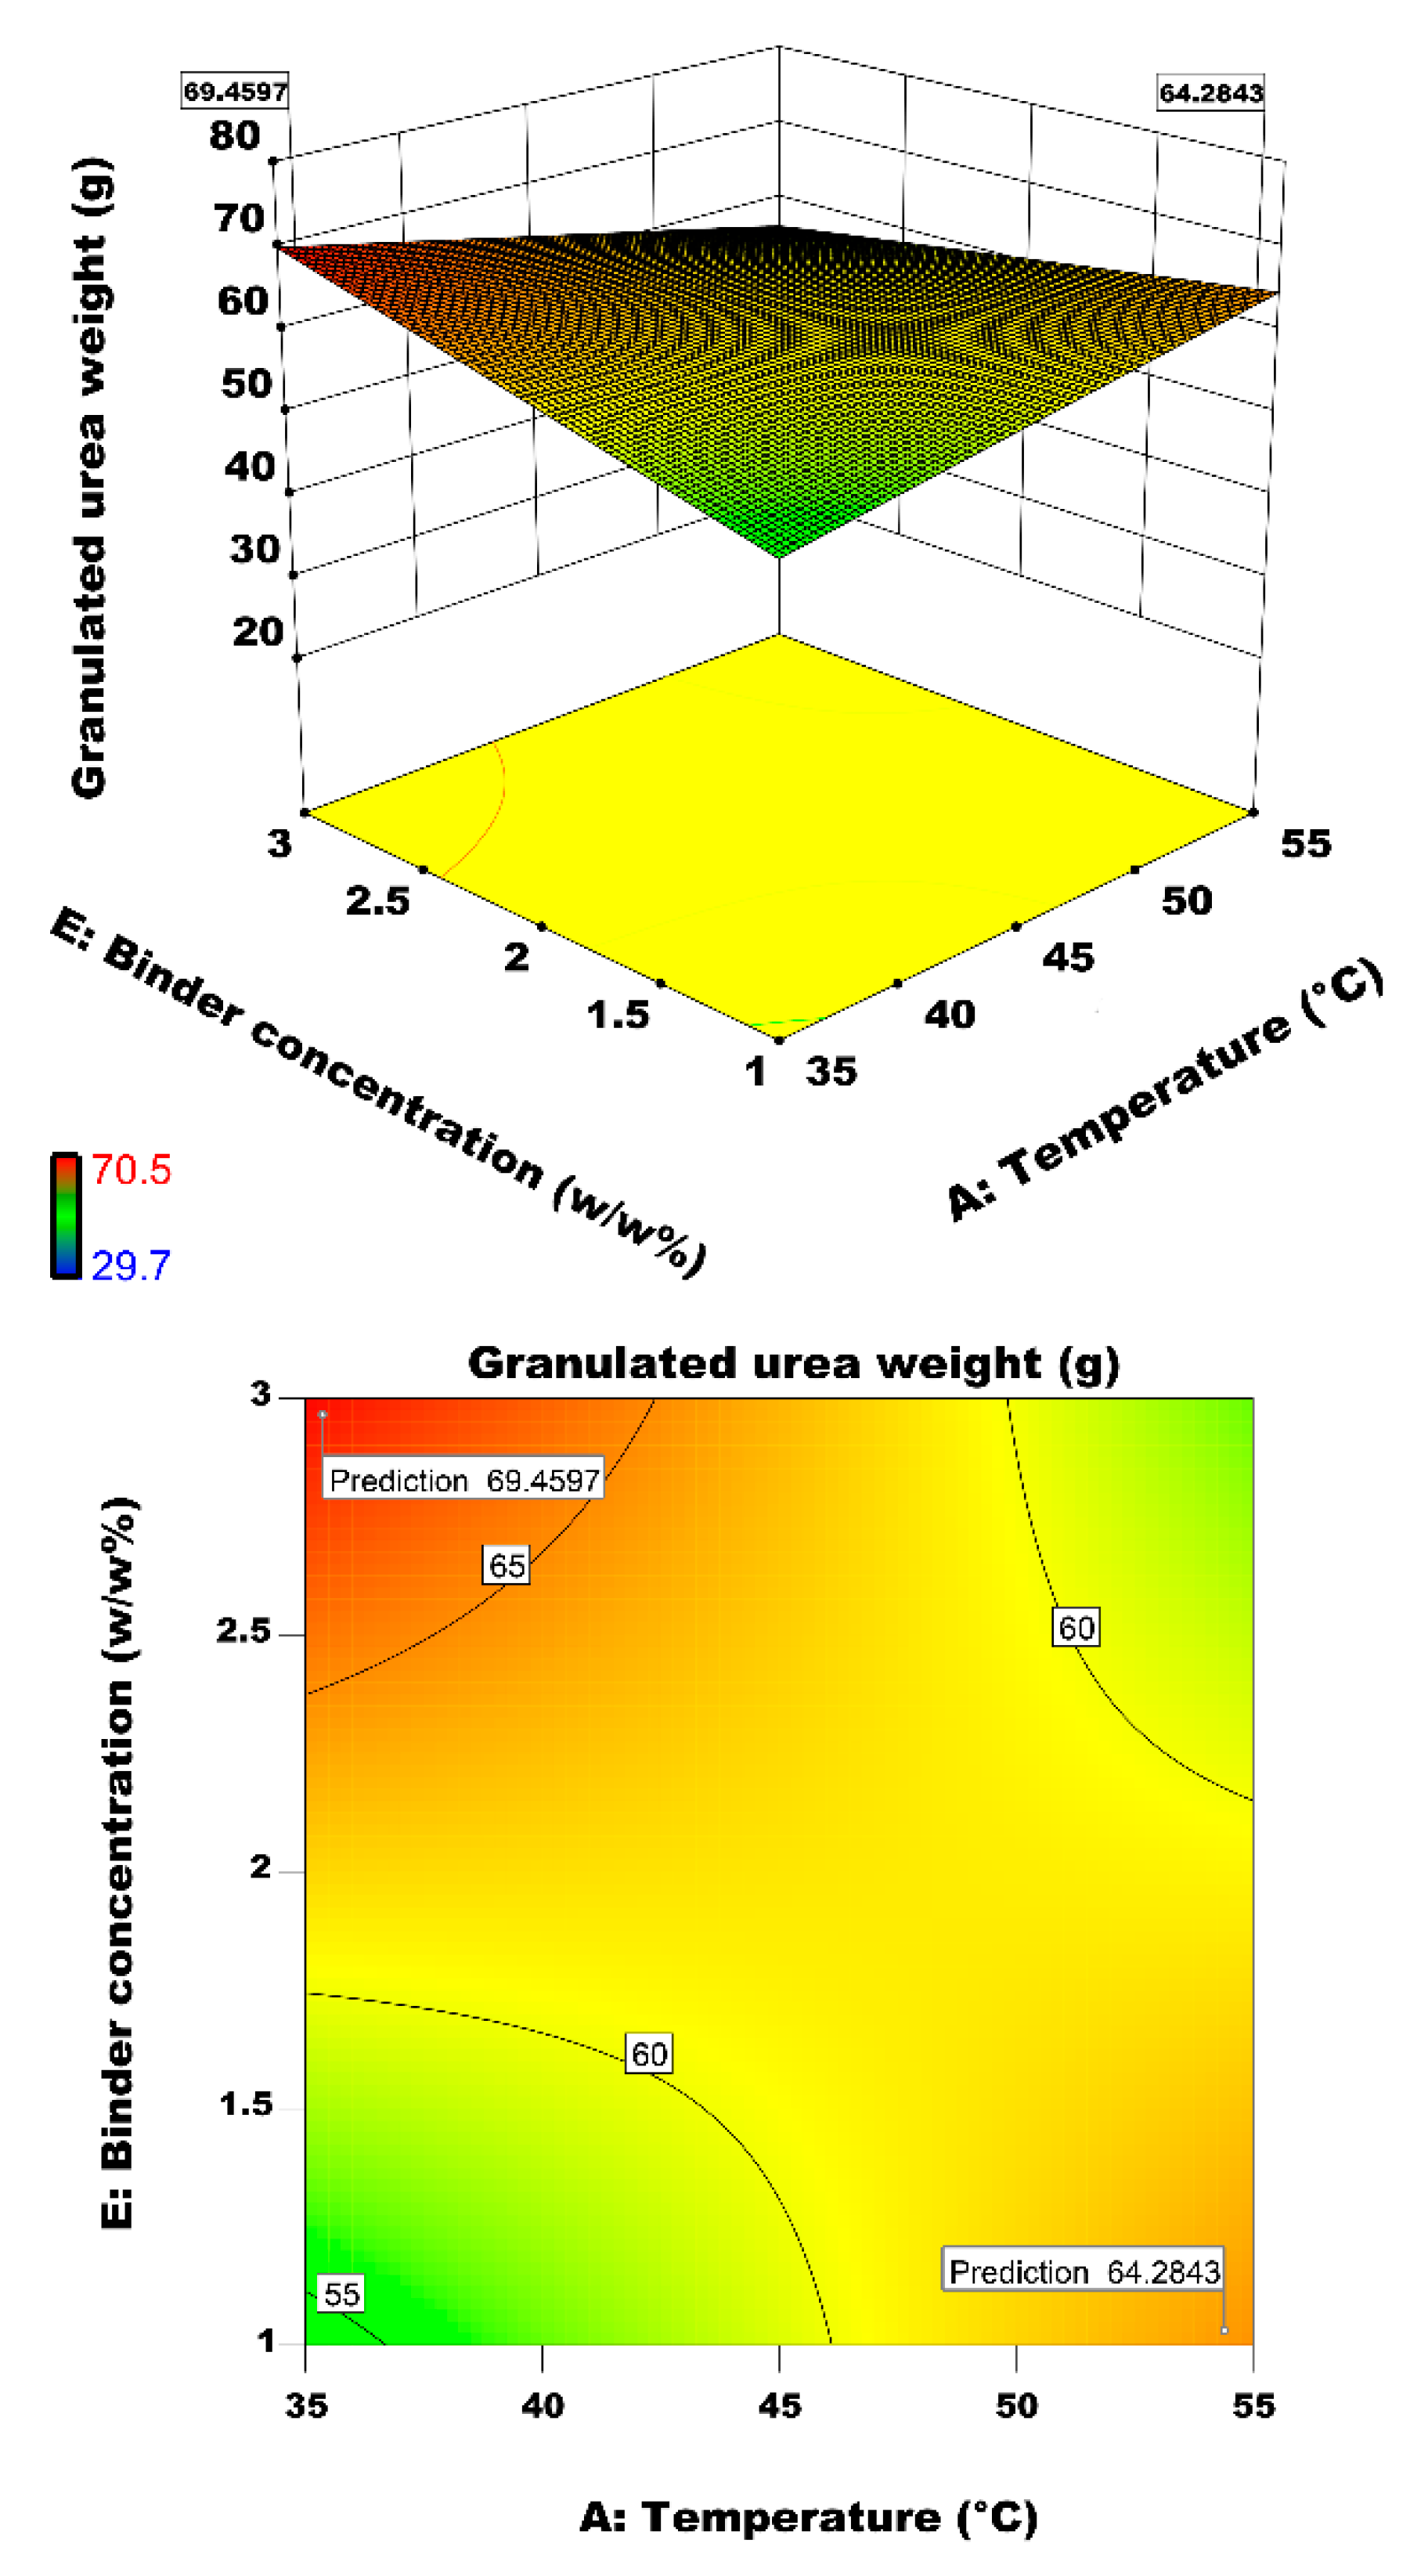
3.2.4. Interactive Effect of Air Temperature and Binder Concentration on Particle Growth
3.2.5. Interactive Effect of Air Velocity and Primary Urea Weight on Particle Growth
3.2.6. Interactive Effect of Air Velocity and Binder Volumetric Flow rate on Particle Growth
4. Conclusions
Author Contributions
Funding
Acknowledgments
Conflicts of Interest
References
- Lee, R.; Kpytowski, J. Fertilizer Manual. United Nations Industrial Development Organization (UNIDO) and International Fertilizer Development Center (IFDC); Kluwer Academic Publishers: Dordrecht, The Netherlands, 1998. [Google Scholar]
- Roy, P.; Vashishtha, M.; Khanna, R.; Subbarao, D. International Journal of Pharmaceutical Sciences Review and ResearchHeat and mass transfer study in fluidized bed granulation—Prediction of entry length. Particuology 2009, 7, 215–219. [Google Scholar] [CrossRef]
- Iveson, S.M. Granule coalescence modelling: Including the effects of bond strengthening and distributed impact separation forces. Chem. Eng. Sci. 2001, 56, 2215–2220. [Google Scholar] [CrossRef]
- Dürig, T.; Karan, K. Chapter 9: Binders in Wet Granulation. In Handbook of Pharmaceutical Wet Granulation, 1st ed.; Narang, A.S., Badawy, S.I.F., Eds.; Academic Press: Cambridge, MA, USA, 2019; pp. 317–349. [Google Scholar]
- Biggs, C.; Sanders, C.; Scott, A.; Willemse, A.; Hoffman, A.; Instone, T.; Salman, A.; Hounslow, M. Coupling granule properties and granulation rates in high-shear granulation. Powder Technol. 2003, 130, 162–168. [Google Scholar] [CrossRef]
- Andrade, T.C.; Martins, R.M.; Freitas, L.A.P. Granulation of indomethacin and a hydrophilic carrier by fluidized hot melt method: The drug solubility enhancement. Powder Technol. 2015, 270, 453–460. [Google Scholar] [CrossRef]
- Chua, K.W.; Makkawi, Y.T.; Hounslow, M.J. A priori prediction of aggregation efficiency and rate constant for fluidized bed melt granulation. Chem. Eng. Sci. 2013, 98, 291–297. [Google Scholar] [CrossRef]
- Chua, K.W.; Makkawi, Y.T.; Hewakandamby, B.N.; Hounslow, M.J. Time scale analysis for fluidized bed melt granulation-II: Binder spreading rate. Chem. Eng. Sci. 2011, 66, 327–335. [Google Scholar] [CrossRef]
- Nilpawar, A.M.; Reynolds, G.K.; Salman, A.D.; Hounslow, M.J. Estimating aggregation efficiency from observation of flow behaviour in a high shear mixer. In Proceedings of the World Congress on Particle Technology, Edinburgh, UK, 24–27 September 2006. [Google Scholar]
- Hounslow, M.; Pearson, J.; Instone, T. Tracer studies of high-shear granulation: II. Population balance modeling. AIChE J. 2001, 47, 1984–1999. [Google Scholar] [CrossRef]
- Pearson, J.; Hounslow, M.; Instone, T. Tracer studies of high-shear granulation: I. Experimental results. AIChE J. 2001, 47, 1978–1983. [Google Scholar] [CrossRef]
- Iveson, S.M. Limitations of one-dimensional population balance models of wet granulation processes. Powder Technol. 2002, 124, 219–229. [Google Scholar] [CrossRef]
- Ennis, B.J.; Tardos, G.; Pfeffer, R. A microlevel-based characterization of granulation phenomena. Powder Technol. 1991, 65, 257–272. [Google Scholar] [CrossRef]
- Heinrich, S.; Peglow, M.; Ihlow, M.; Henneberg, M.; Mörl, L. Analysis of the start-up process in continuous fluidized bed spray granulation by population balance modelling. Chem. Eng. Sci. 2002, 57, 4369–4390. [Google Scholar] [CrossRef]
- Hemati, M.; Cherif, R.; Saleh, K.; Pont, V. Fluidized bed coating and granulation: Influence of process-related variables and physicochemical properties on the growth kinetics. Powder Technol. 2003, 130, 18–34. [Google Scholar] [CrossRef]
- Tardos, G.I.; Khan, M.I.; Mort, P.R. Critical parameters and limiting conditions in binder granulation of fine powders. Powder Technol. 1997, 94, 245–258. [Google Scholar] [CrossRef]
- Kivikero, N. Granulation in Miniaturised Fluid Bed Using Electrostatic Atomisation. Ph.D. Thesis, University of Helsinki, Helsinki, Finland, 2010. [Google Scholar]
- Patel, T.B.; Patel, L.; Patel, T.B.; Makwana, S.H.; Patel, T.R. Influence of process variables on physicochemical properties of the granulation mechanism of diclofenac sodium in fluid bed granulation. Int. J. Pharm. Sci. Rev. Res. 2010, 3, 61–65. [Google Scholar]
- Reynolds, G.K.; Le, P.K.; Nilpawar, A.M. High shear granulation. In Handbook of Powder Technology, 1st ed.; Elsevier: Amsterdam, The Netherlands, 2007; Volume 11, pp. 3–19. [Google Scholar]
- Mörl, L.; Heinrich, S.; Peglow, M. Fluidized bed spray granulation. In Handbook of Powder Technology, 1st ed.; Elsevier: Amsterdam, The Netherlands, 2007; Volume 11, pp. 21–188. [Google Scholar]
- Nishii, K.; Horio, M. Dry granulation. In Handbook of Powder Technology, 1st ed.; Elsevier: Amsterdam, The Netherlands, 2007; Volume 11, pp. 289–322. [Google Scholar]
- Saleh, K.; Guigon, P. Coating and encapsulation processes in powder technology. In Handbook of Powder Technology, 1st ed.; Elsevier: Amsterdam, The Netherlands, 2007; Volume 11, pp. 323–375. [Google Scholar]
- Ennis, B. On the Mechanisms of Granulation. Ph.D. Thesis, City University, New York, NY, USA, 1990. [Google Scholar]
- Ennis, B.J.; Li, J.; Robert, P. The influence of viscosity on the strength of an axially strained pendular liquid bridge. Chem. Eng. Sci. 1990, 45, 3071–3088. [Google Scholar] [CrossRef]
- Ennis, B.; Tardos, G.; Pfeffer, R. A micro-level-based classification of granulation regimes and mechanisms. In Proceedings of the Second World Congress on Powder Technology, Kyoto, Japan, 19–22 September 1990. [Google Scholar]
- Dimin, M.; Loh, M.; Jamli, M.; Sued, M.; Munawar, R. Fluidized Bed Granulation Parameters Effect on Urea Granule Physical Properties. J. Appl. Fluid Mech. 2019, 12, 495–503. [Google Scholar] [CrossRef]
- Montgomery, D.C. Design and Analysis of Experiments; John Wiley & Sons: Hoboken, NJ, USA, 2017. [Google Scholar]
- Cocco, R.; Karri, S.R.; Knowlton, T. Introduction to fluidization. Chem. Eng. Prog. 2014, 110, 21–29. [Google Scholar]
- Smith, P.; Nienow, A. Particle growth mechanisms in fluidised bed granulation—I: The effect of process variables. Chem. Eng. Sci. 1983, 38, 1223–1231. [Google Scholar] [CrossRef]
- Adams, M.; Perchard, V. The cohesive forces between particles with interstitial liquid. In Proceedings of the Institute of Chemical Engineering Symposium, New York, USA, 2–5 August 1985. [Google Scholar]
- Mazzone, D.; Tardos, G.; Pfeffer, R. The behavior of liquid bridges between two relatively moving particles. Powder Technol. 1987, 51, 71–83. [Google Scholar] [CrossRef]
- Capes, C.E.; Danckwerts, P.V. Granule formation by the agglomeration of damp powders. Part II: The distribution of granule sizes. Trans. Inst. Chem. Eng. 1965, 43, 125–130. [Google Scholar]
- Iveson, S.M.; Litster, J.D. Fundamental studies of granule consolidation part 2: Quantifying the effects of particle and binder properties. Powder Technol. 1998, 99, 243–250. [Google Scholar] [CrossRef]
- Hapgood, K.P.; Litster, J.D.; Biggs, S.R.; Howes, T. Drop Penetration into Porous Powder Beds. J. Colloid Interface Sci. 2002, 253, 353–366. [Google Scholar] [CrossRef]
- Maurstad, O. Population Balance Modeling of Agglomeration in Granulation Processes. Ph.D. Thesis, Norwegian University of Science and Technology (NTNU), Trondheim, Norway, 2002. [Google Scholar]
- Seville, J.; Willett, C.; Knight, P. Interparticle forces in fluidisation: A review. Powder Technol. 2000, 113, 261–268. [Google Scholar] [CrossRef]
- Sherrington, P.; Oliver, R. Granulation; John Wiley & Sons: Otawa, ON, Canada, 1980. [Google Scholar]
- Newitt, D. A contribution to the theory and practice of granulation. Trans. Inst. Chem. Eng. 1958, 36, 422–442. [Google Scholar]
- Rumpf, H. Basic principles and methods of granulation. I. II. Chem. Ing. Tech. 1958, 30, 144–158. [Google Scholar] [CrossRef]
- Schæfer, T.; Taagegaard, B.; Thomsen, L.J.; Kristensen, H.G. Melt pelletization in a high shear mixer. V. Effects of apparatus variables. Eur. J. Pharm. Sci. 1993, 1, 133–141. [Google Scholar]
- Keningley, S.T.; Knight, P.C.; Marson, A.D. An investigation into the effects of binder viscosity on agglomeration behaviour. Powder Technol. 1997, 91, 95–103. [Google Scholar] [CrossRef]
- Zahraee, S.M.; Rohani, J.M.; Wong, K.Y. Application of computer simulation experiment and response surface methodology for productivity improvement in a continuous production line: Case study. J. King Saud Univ.-Eng. Sci. 2018, 30, 207–217. [Google Scholar] [CrossRef]
- Liu, H.; Yoon, S.; Li, M. Three-dimensional computational fluid dynamics (CFD) study of the gas-particle circulation pattern within a fluidized bed granulator: By full factorial design of fluidization velocity and particle size. Dry. Technol. 2017, 35, 1043–1058. [Google Scholar] [CrossRef]
- Jane, J. Starch properties, modifications, and applications. J. Macromol. Sci. A 1995, 32, 751–757. [Google Scholar] [CrossRef]
- Hoornaert, F.; Wauters, P.A.L.; Meesters, G.M.H.; Pratsinis, S.E.; Scarlett, B. Agglomeration behaviour of powders in a Lödige mixer granulator. Powder Technol. 1998, 96, 116–128. [Google Scholar] [CrossRef]
- Johansen, A.; Schæfer, T. Effects of interactions between powder particle size and binder viscosity on agglomerate growth mechanisms in a high shear mixer. Eur. J. Pharm. Sci. 2001, 12, 297–309. [Google Scholar] [CrossRef]
- Rumpf, H. Agglomeration, 1st ed.; Interscience Pub.: New York, NY, USA, 1962. [Google Scholar]
- Simons, S.J.R.; Fairbrother, R.J. Direct observations of liquid binder–particle interactions: The role of wetting behaviour in agglomerate growth. Powder Technol. 2000, 110, 44–58. [Google Scholar] [CrossRef]
- Zahraee, S.M.; Shariatmadari, S.; Ahmadi, H.B.; Hakimi, S.; Shahpanah, A. Application of design of experiment and computer simulation to improve the color industry productivity: Case study. J. Teknol. 2014, 68, 7–11. [Google Scholar] [CrossRef][Green Version]
- Farouk, H.; Zahraee, S.M.; Atabani, A.; Mohd Jaafar, M.N.; Alhassan, F.H. Optimization of the esterification process of crude jatropha oil (CJO) containing high levels of free fatty acids: A Malaysian case study. Biofuels 2017. [Google Scholar] [CrossRef]
- Liu, H.; Wang, K.; Schlindwein, W.; Li, M. Using the Box–Behnken experimental design to optimise operating parameters in pulsed spray fluidised bed granulation. Int. J. Pharm. 2013, 448, 329–338. [Google Scholar] [CrossRef]
- Tardos, G.; Farber, L.; Bika, D.; Michaels, J. Morphology and strength development in solid and solidifying interparticle bridges in granules of pharmaceutical powders. In Handbook of Powder Technology; Elsevier: Amsterdam, The Netherlands, 2007; Volume 11, pp. 1213–1256. [Google Scholar]
- Subramonian, S.; Bin Said, M.R.; Rostam, O.; Hafiz, M.Z.; Hassan, L.H.; Shaaban, A.; Dimin, M.F. Top spray fluidized bed granulated paddy urea fertilizer. Appl. Mech. Mater. 2014, 606, 137–140. [Google Scholar] [CrossRef]


| Solution No. | Starch Concentration (w/w%) | Urea Concentration (w/w%) |
|---|---|---|
| B1 | 1 | 49 |
| B2 | 2 | 48 |
| B3 | 3 | 47 |
| Factors | Symbols | Levels | ||
|---|---|---|---|---|
| Low Level (−1) | Center Point (0) | High Level (+1) | ||
| Air inlet temperature (°C) | A | 35 | 45 | 55 |
| Air inlet velocity (cm/s) | B | 20 | 30 | 40 |
| Primary urea weight (g) | C | 150 | 200 | 250 |
| Binder volumetric flow rate (mL/min) | D | 11.6 | 13.4 | 15.2 |
| Binder concentration (Urea w/w%) | E | 49 | 48 | 47 |
| Solution No. | Binder Density (g/cm3) | Binder Viscosity (cP) | Standard Deviation (cP) | Standard Error (cP) |
|---|---|---|---|---|
| B1 | 1.14012 | 43 | 1.64 | 0.95 |
| B2 | 1.13413 | 164 | 1.63 | 0.94 |
| B3 | 1.12864 | 305 | 1.64 | 0.95 |
| Solution No. | Binder Surface Tension (N/m) | Standard Deviation (N/m) | Standard Error (N/m) |
|---|---|---|---|
| B1 | 58.41 | 0.422 | 0.24 |
| B2 | 53.45 | 0.435 | 0.25 |
| B3 | 47.13 | 0.431 | 0.24 |
| Solution No. | Contact Angle (°) | Standard Deviation (°) | Standard Error (°) |
|---|---|---|---|
| B1 | 41.7 | 1.14 | 0.658 |
| B2 | 73.85 | 0.629 | 0.363 |
| B3 | 74.35 | 0.12 | 0.069 |
| Solution No. | Penetration Time (s) | Standard Deviation (s) | Standard Error (s) |
|---|---|---|---|
| B1 | 1.95 | 0.15 | 0.086 |
| B2 | 3.55 | 0.33 | 0.19 |
| B3 | 8.5 | 0.70 | 0.40 |
| Solution No. | Fstat | Fdyn | Cavis |
|---|---|---|---|
| B1 | 0.2729 | 0.00391 | 0.013 |
| B2 | 0.378 | 0.006 | 0.016 |
| B3 | 0.207 | 0.00762 | 0.036 |
| Particle Diameter (µm) | Viscous St Number, Stv | ||
|---|---|---|---|
| B1 | B2 | B3 | |
| 250 | 2.062016 | 0.54065 | 0.29071 |
| 500 | 4.124031 | 1.081301 | 0.581421 |
| 1000 | 8.248062 | 2.162602 | 1.162842 |
| 2000 | 16.49612 | 4.325203 | 2.325683 |
| 3000 | 24.74419 | 6.487805 | 3.488525 |
| 4000 | 32.99225 | 8.650407 | 4.651366 |
| Source | Sum of Square | Degree of Freedom | Mean Square | F-Value | p-Value |
|---|---|---|---|---|---|
| Model | 7457.94 | 27 | 276.22 | 14.51 | <0.0001 |
| A | 167.77 | 1 | 167.77 | 8.81 | 0.0050 |
| B | 613.43 | 1 | 613.43 | 32.22 | <0.0001 |
| C | 3852.06 | 1 | 3852.06 | 202.31 | <0.0001 |
| D | 34.93 | 1 | 34.93 | 1.83 | 0.1832 |
| E | 1.60 | 1 | 1.60 | 0.084 | 0.7734 |
| AB | 80.33 | 1 | 80.33 | 4.22 | 0.0466 |
| AC | 84.73 | 1 | 84.73 | 4.45 | 0.0412 |
| AD | 13.76 | 1 | 13.76 | 0.72 | 0.4003 |
| AE | 395.81 | 1 | 395.81 | 20.79 | <0.0001 |
| BC | 40.26 | 1 | 40.26 | 2.11 | 0.1537 |
| BD | 68.48 | 1 | 68.48 | 3.60 | 0.0651 |
| BE | 30.36 | 1 | 30.36 | 1.59 | 0.2140 |
| CD | 0.15 | 1 | 0.15 | 7.886 × 10⁻³ | 0.9297 |
| CE | 29.35 | 1 | 29.35 | 1.54 | 0.2216 |
| DE | 61.11 | 1 | 61.11 | 3.21 | 0.0808 |
| Curvature | 71.00 | 1 | 71.00 | 3.73 | 0.0606 |
| Residual | 761.61 | 40 | 19.04 | - | - |
| Lack of Fit | 102.74 | 4 | 25.69 | 1.40 | 0.2525 |
| Pure Error | 658.86 | 36 | 18.30 | - | - |
| R2 =0.9073, Adjusted R2 = 0.8448, Predicted R2 = 0.7148, AdEquation Precision = 14.158 | |||||
© 2019 by the authors. Licensee MDPI, Basel, Switzerland. This article is an open access article distributed under the terms and conditions of the Creative Commons Attribution (CC BY) license (http://creativecommons.org/licenses/by/4.0/).
Share and Cite
Zhalehrajabi, E.; Lau, K.K.; Ku Shaari, K.Z.; Zahraee, S.M.; Seyedin, S.H.; Azeem, B.; Shaaban, A. Effect of Biodegradable Binder Properties and Operating Conditions on Growth of Urea Particles in a Fluidized Bed Granulator. Materials 2019, 12, 2320. https://doi.org/10.3390/ma12142320
Zhalehrajabi E, Lau KK, Ku Shaari KZ, Zahraee SM, Seyedin SH, Azeem B, Shaaban A. Effect of Biodegradable Binder Properties and Operating Conditions on Growth of Urea Particles in a Fluidized Bed Granulator. Materials. 2019; 12(14):2320. https://doi.org/10.3390/ma12142320
Chicago/Turabian StyleZhalehrajabi, Ehsan, Kok Keong Lau, Ku Zilati Ku Shaari, Seyed Mojib Zahraee, Seyed Hadi Seyedin, Babar Azeem, and Azizah Shaaban. 2019. "Effect of Biodegradable Binder Properties and Operating Conditions on Growth of Urea Particles in a Fluidized Bed Granulator" Materials 12, no. 14: 2320. https://doi.org/10.3390/ma12142320
APA StyleZhalehrajabi, E., Lau, K. K., Ku Shaari, K. Z., Zahraee, S. M., Seyedin, S. H., Azeem, B., & Shaaban, A. (2019). Effect of Biodegradable Binder Properties and Operating Conditions on Growth of Urea Particles in a Fluidized Bed Granulator. Materials, 12(14), 2320. https://doi.org/10.3390/ma12142320