Sorption of Molybdates and Tungstates on Functionalized Montmorillonites: Structural and Textural Features


Abstract
1. Introduction
- Molybdenum is used as an alloying agent; as electrodes for electrically heated glass furnaces and fire hearths; in nuclear energy applications; as a catalyst in the refining of petroleum; in radio and light bulbs as a coupling element; and as flame- and corrosion-resistant coatings for other metals.
- Tungsten is used as cemented carbide; as alloys; in electronics and electrical industries; in chemical applications; and as glass-to-metal seals. Tungsten oxides have two unique properties: intercalation and polycondensation. Thus, there is much opportunity for tungsten to find application in a fuel cell or energy-saving technologies in the future.
2. Materials and Methods
2.1. Materials
2.2. Montmorillonite Modification
- DDTMAad—the amount of DDTMA (mmol) adsorbed on 100 g of Na-M [mmol/100 g Na-M];
- CHNdifference—the difference in the sum of carbon + hydrogen + nitrogen before and after modification [mg/100 g Na-M]. The molar fraction of each element in the surfactant was considered during the calculation.
- mDDTMA—the mMolar mass of DDTMA.
- ▪
- Na-montmorillonite: Na-M
- ▪
- montmorillonite modified with dodecyl trimethyl ammonium bromide: DDTMA-M
- ▪
- montmorillonite modified with didodecyl dimethyl ammonium bromide: DDDDMA-M
2.3. Sorption
- ▪
- Na-M sample with absorbed Mo(VI) ions: Na-M-Mo
- ▪
- Na-M sample with absorbed W(VI) ions: Na-M-W
- ▪
- Na-M sample with absorbed Mo(VI) and W(VI) ions: Na-M-MoW
2.4. Methods
- VmicDR—the volume of micropores
- VmesBJH—the volume of mesopores
- C0—initial Mo(VI) or W(VI) concentration [mM]
- Ceq—the concentration of Mo(VI) or W(VI) in equilibrium solution [mM] after adsorption.
3. Results
3.1. Sorption of Mo(VI) and W(VI)
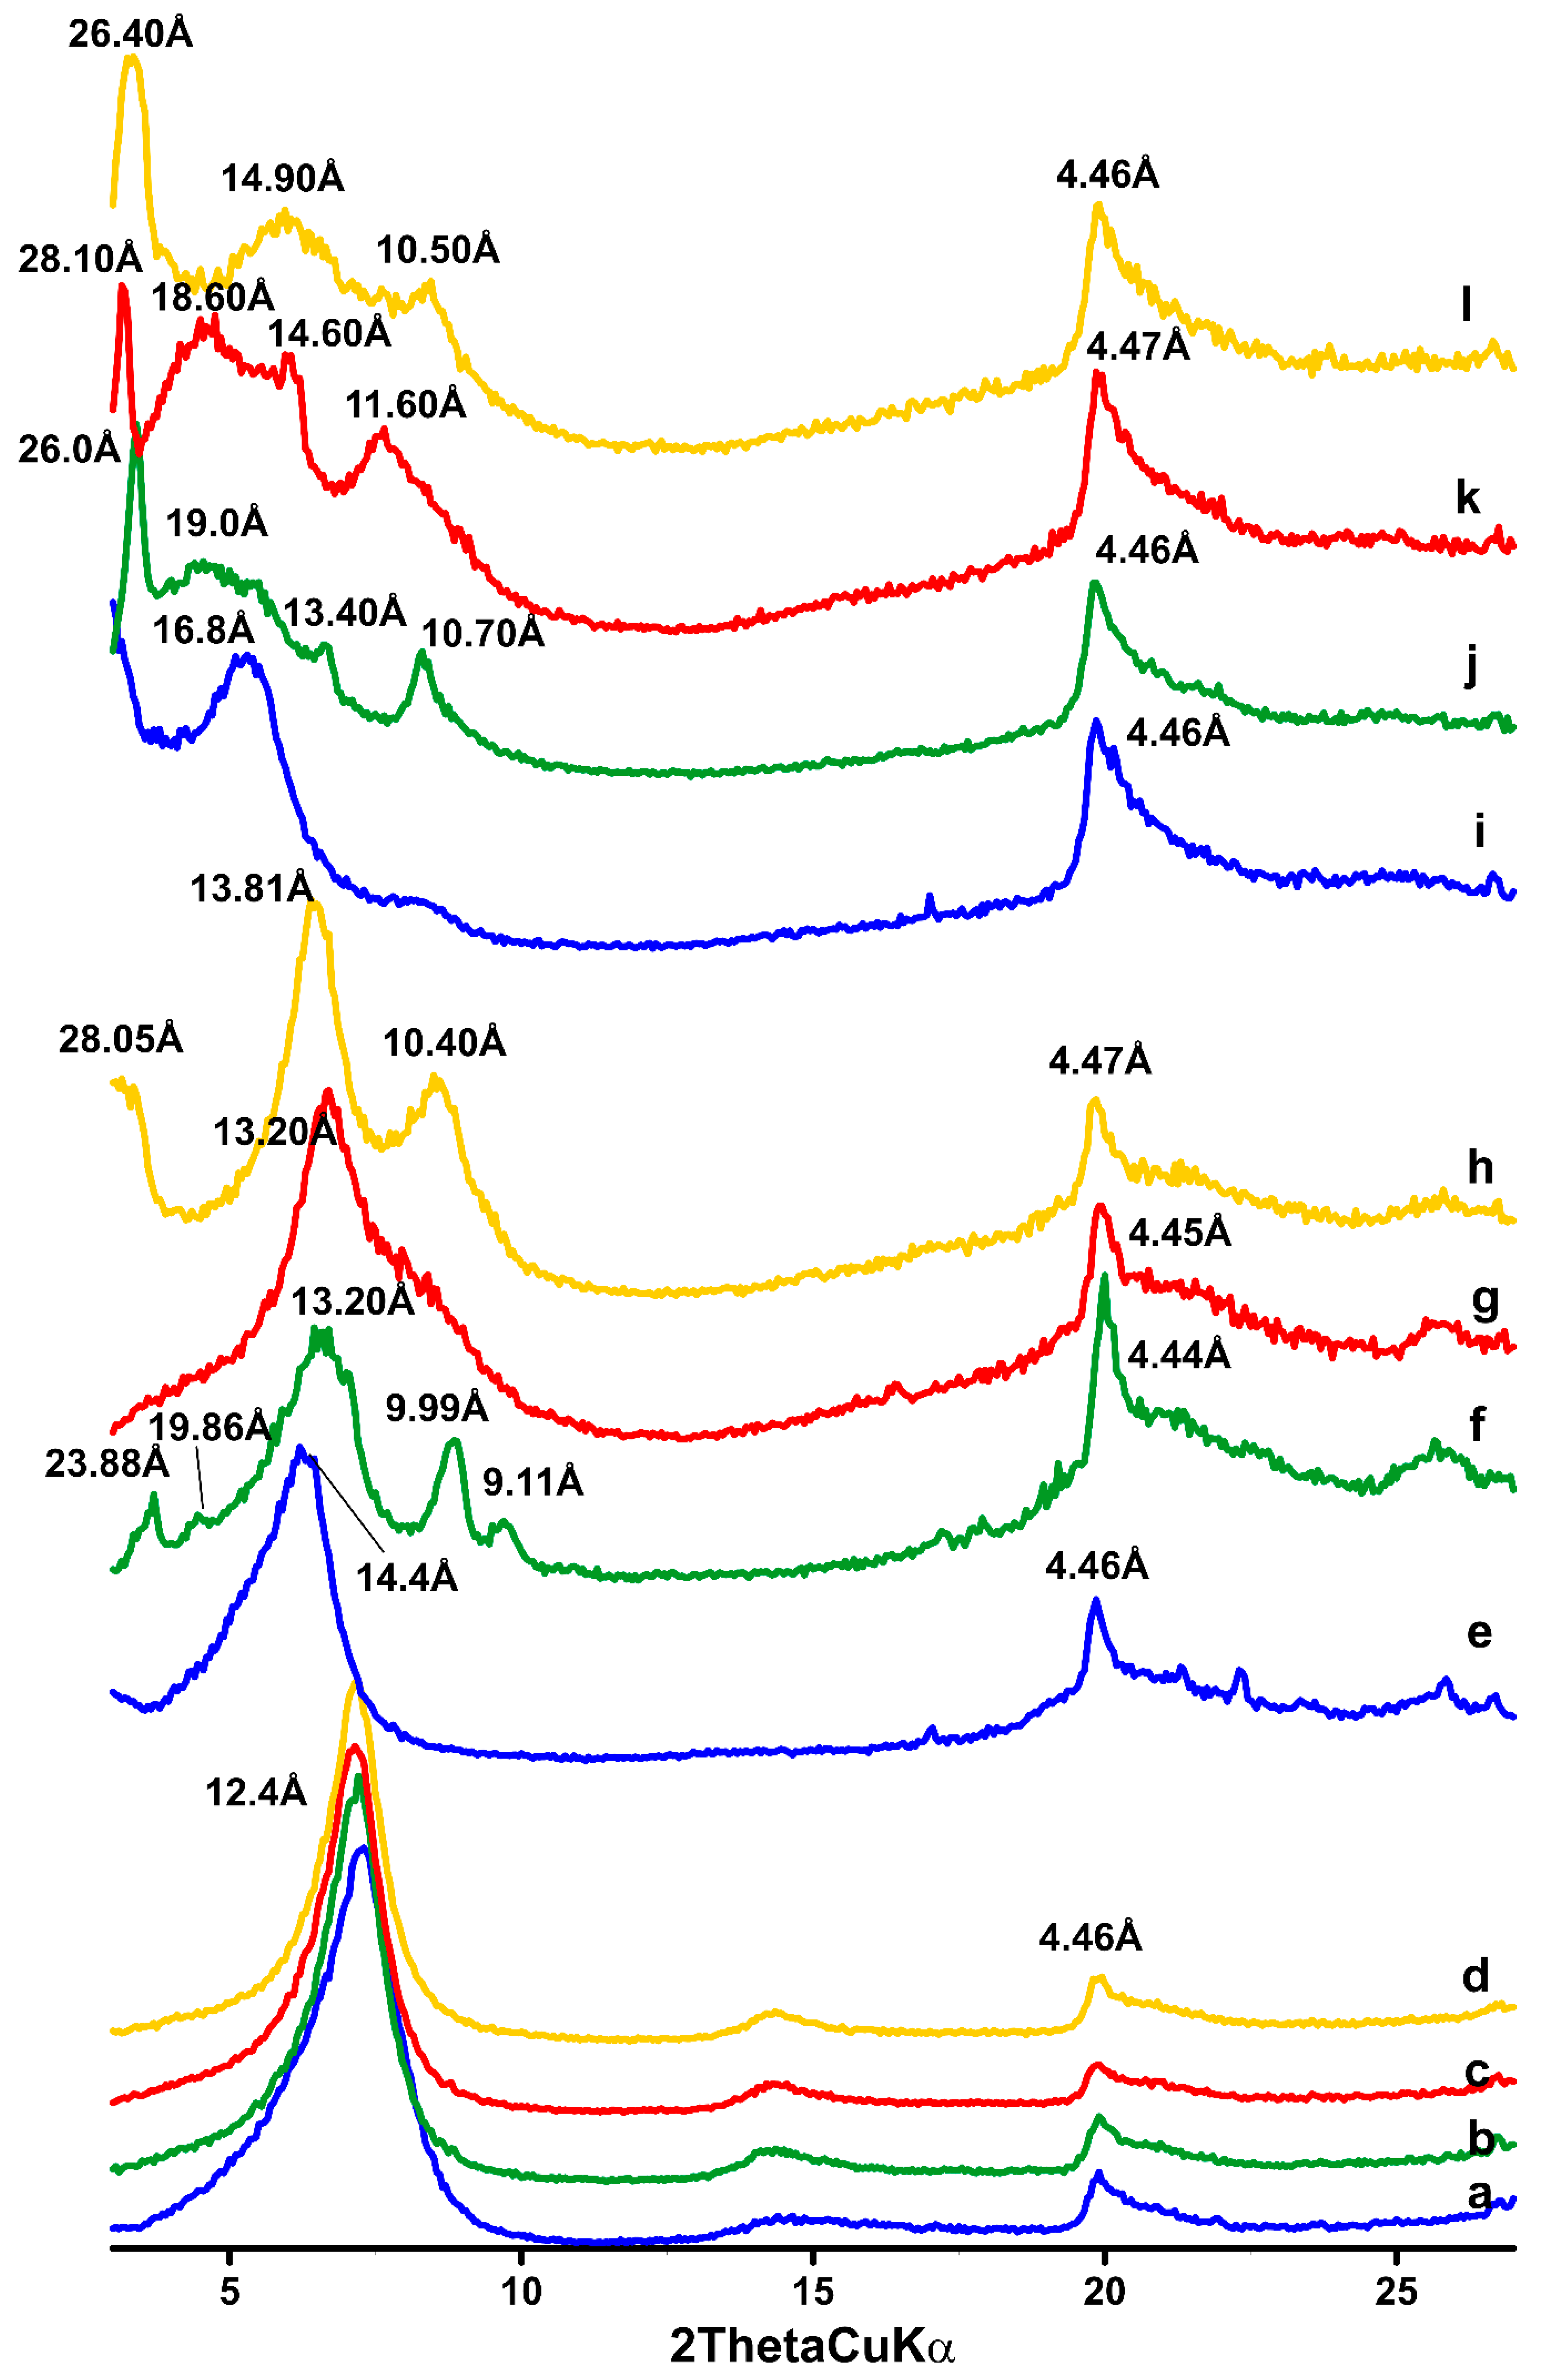
3.2. XRD
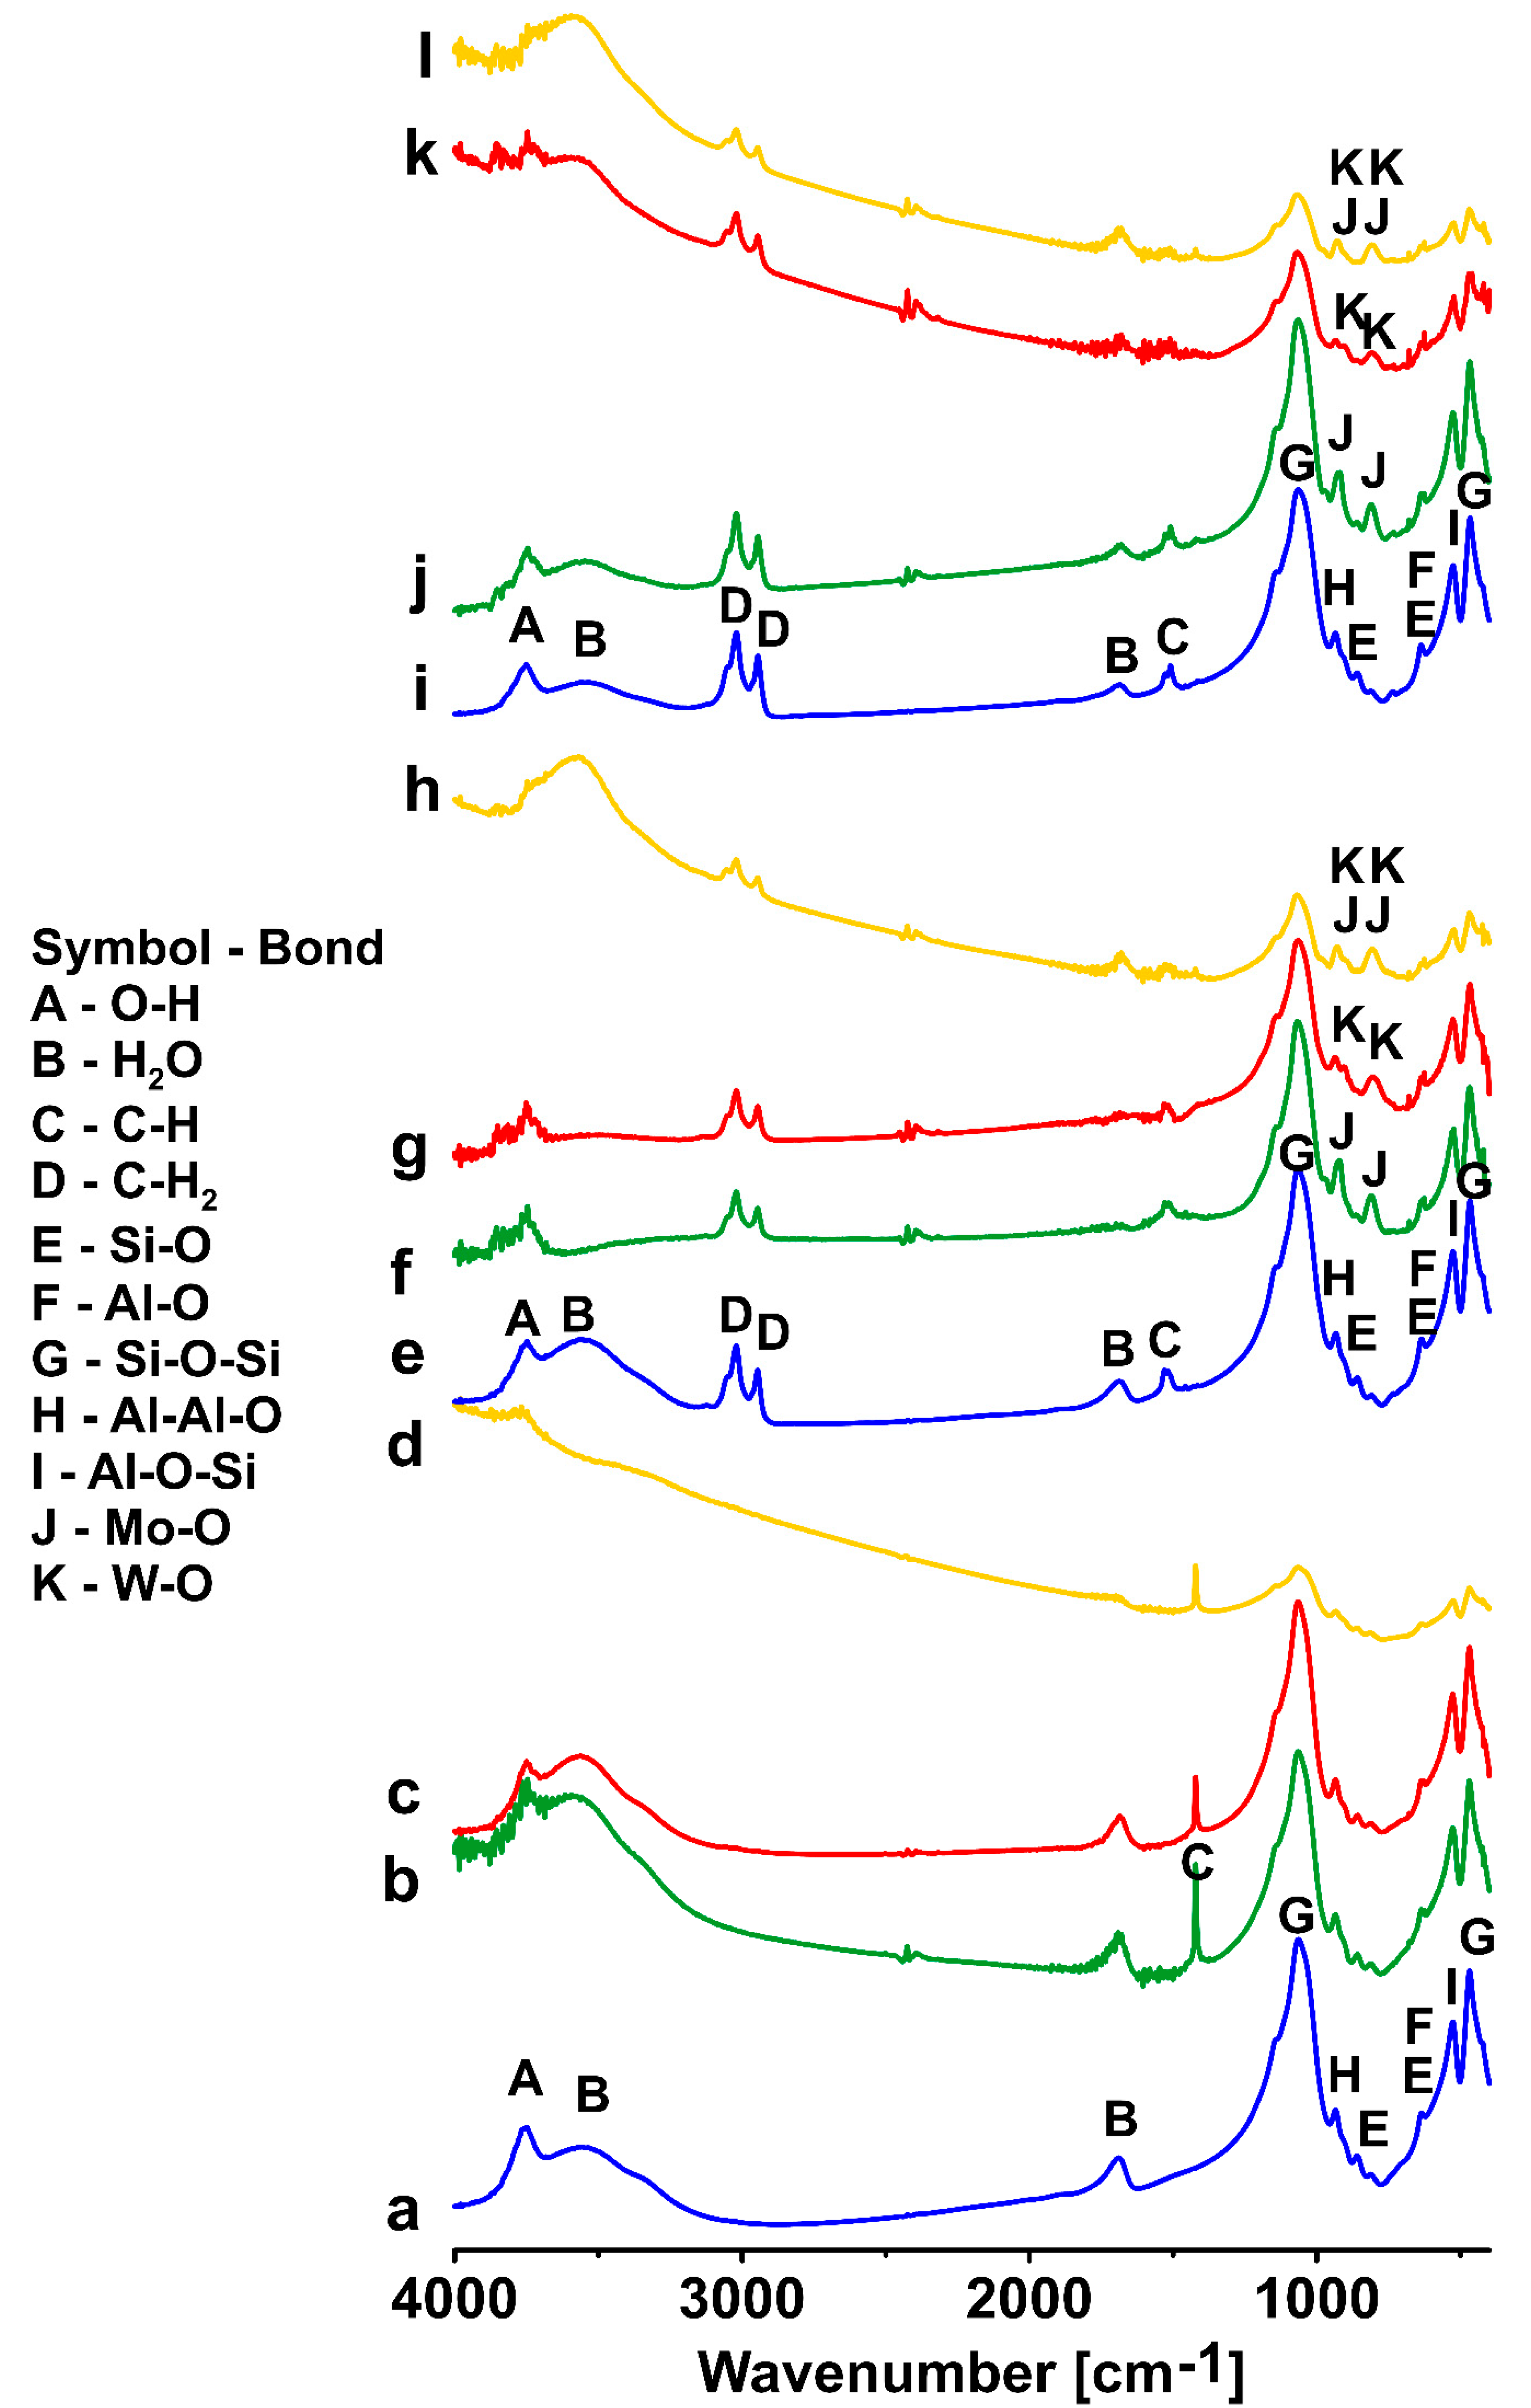
3.3. FTIR
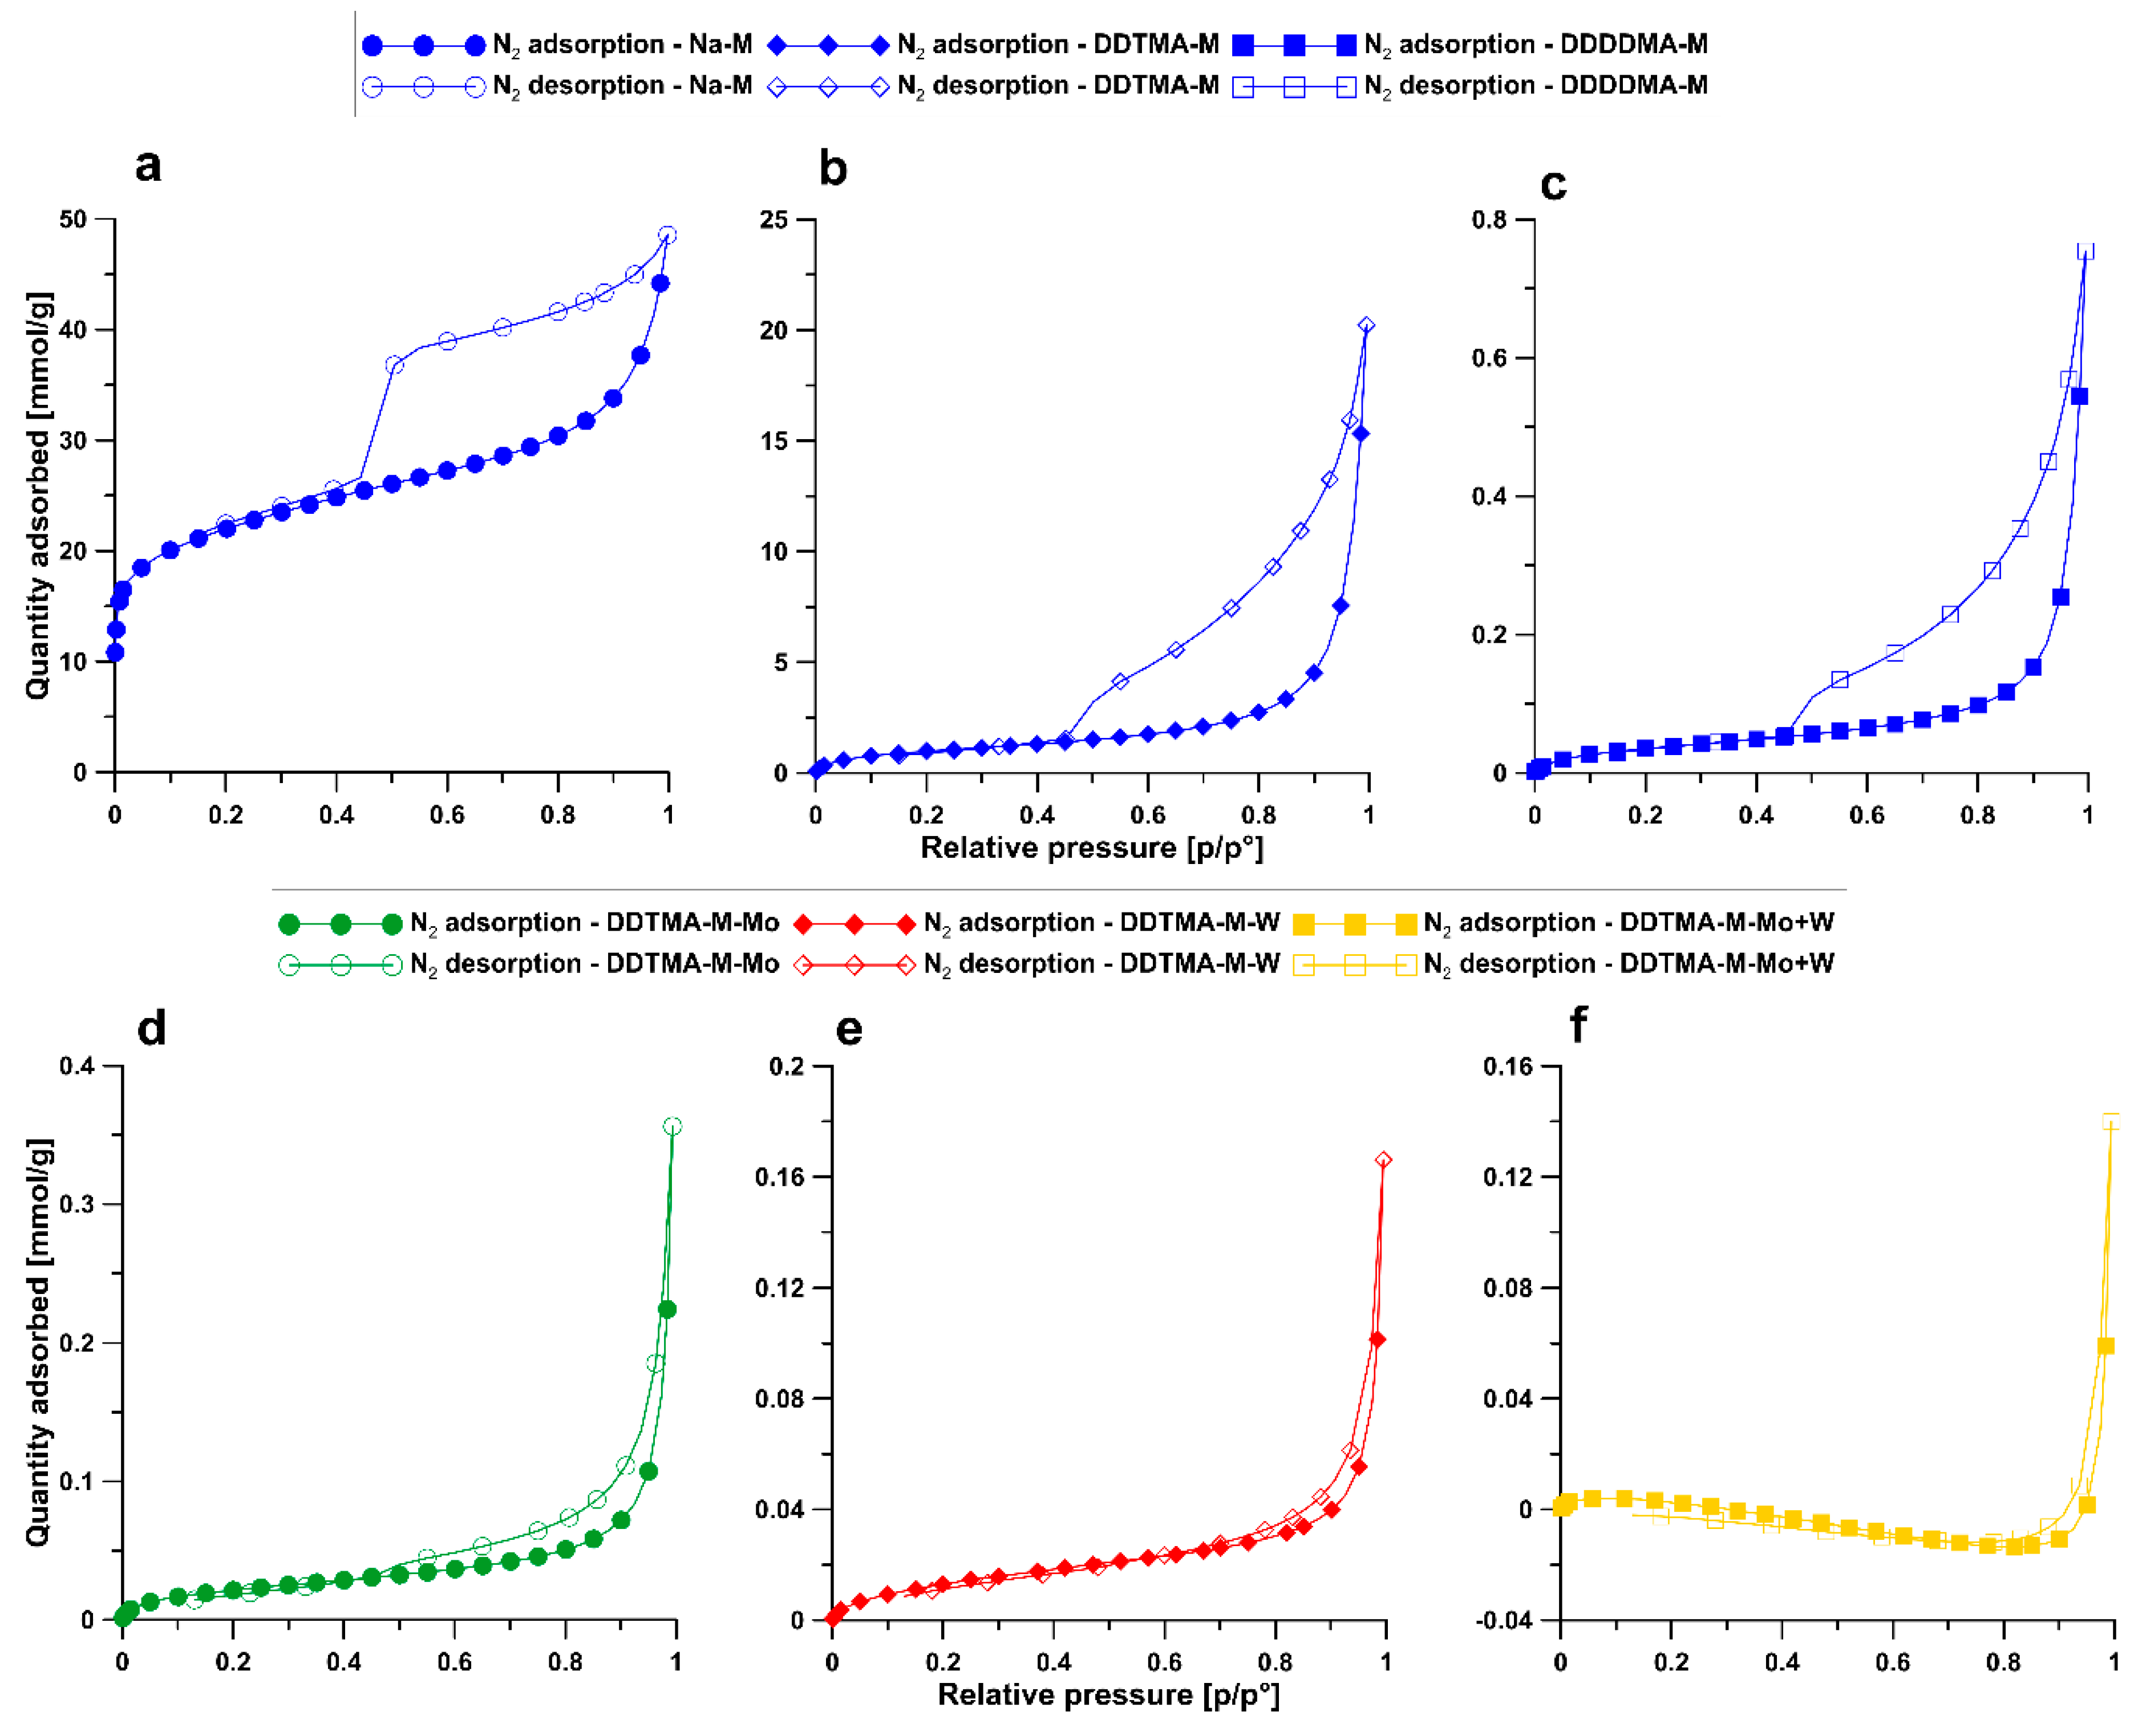
3.4. BET
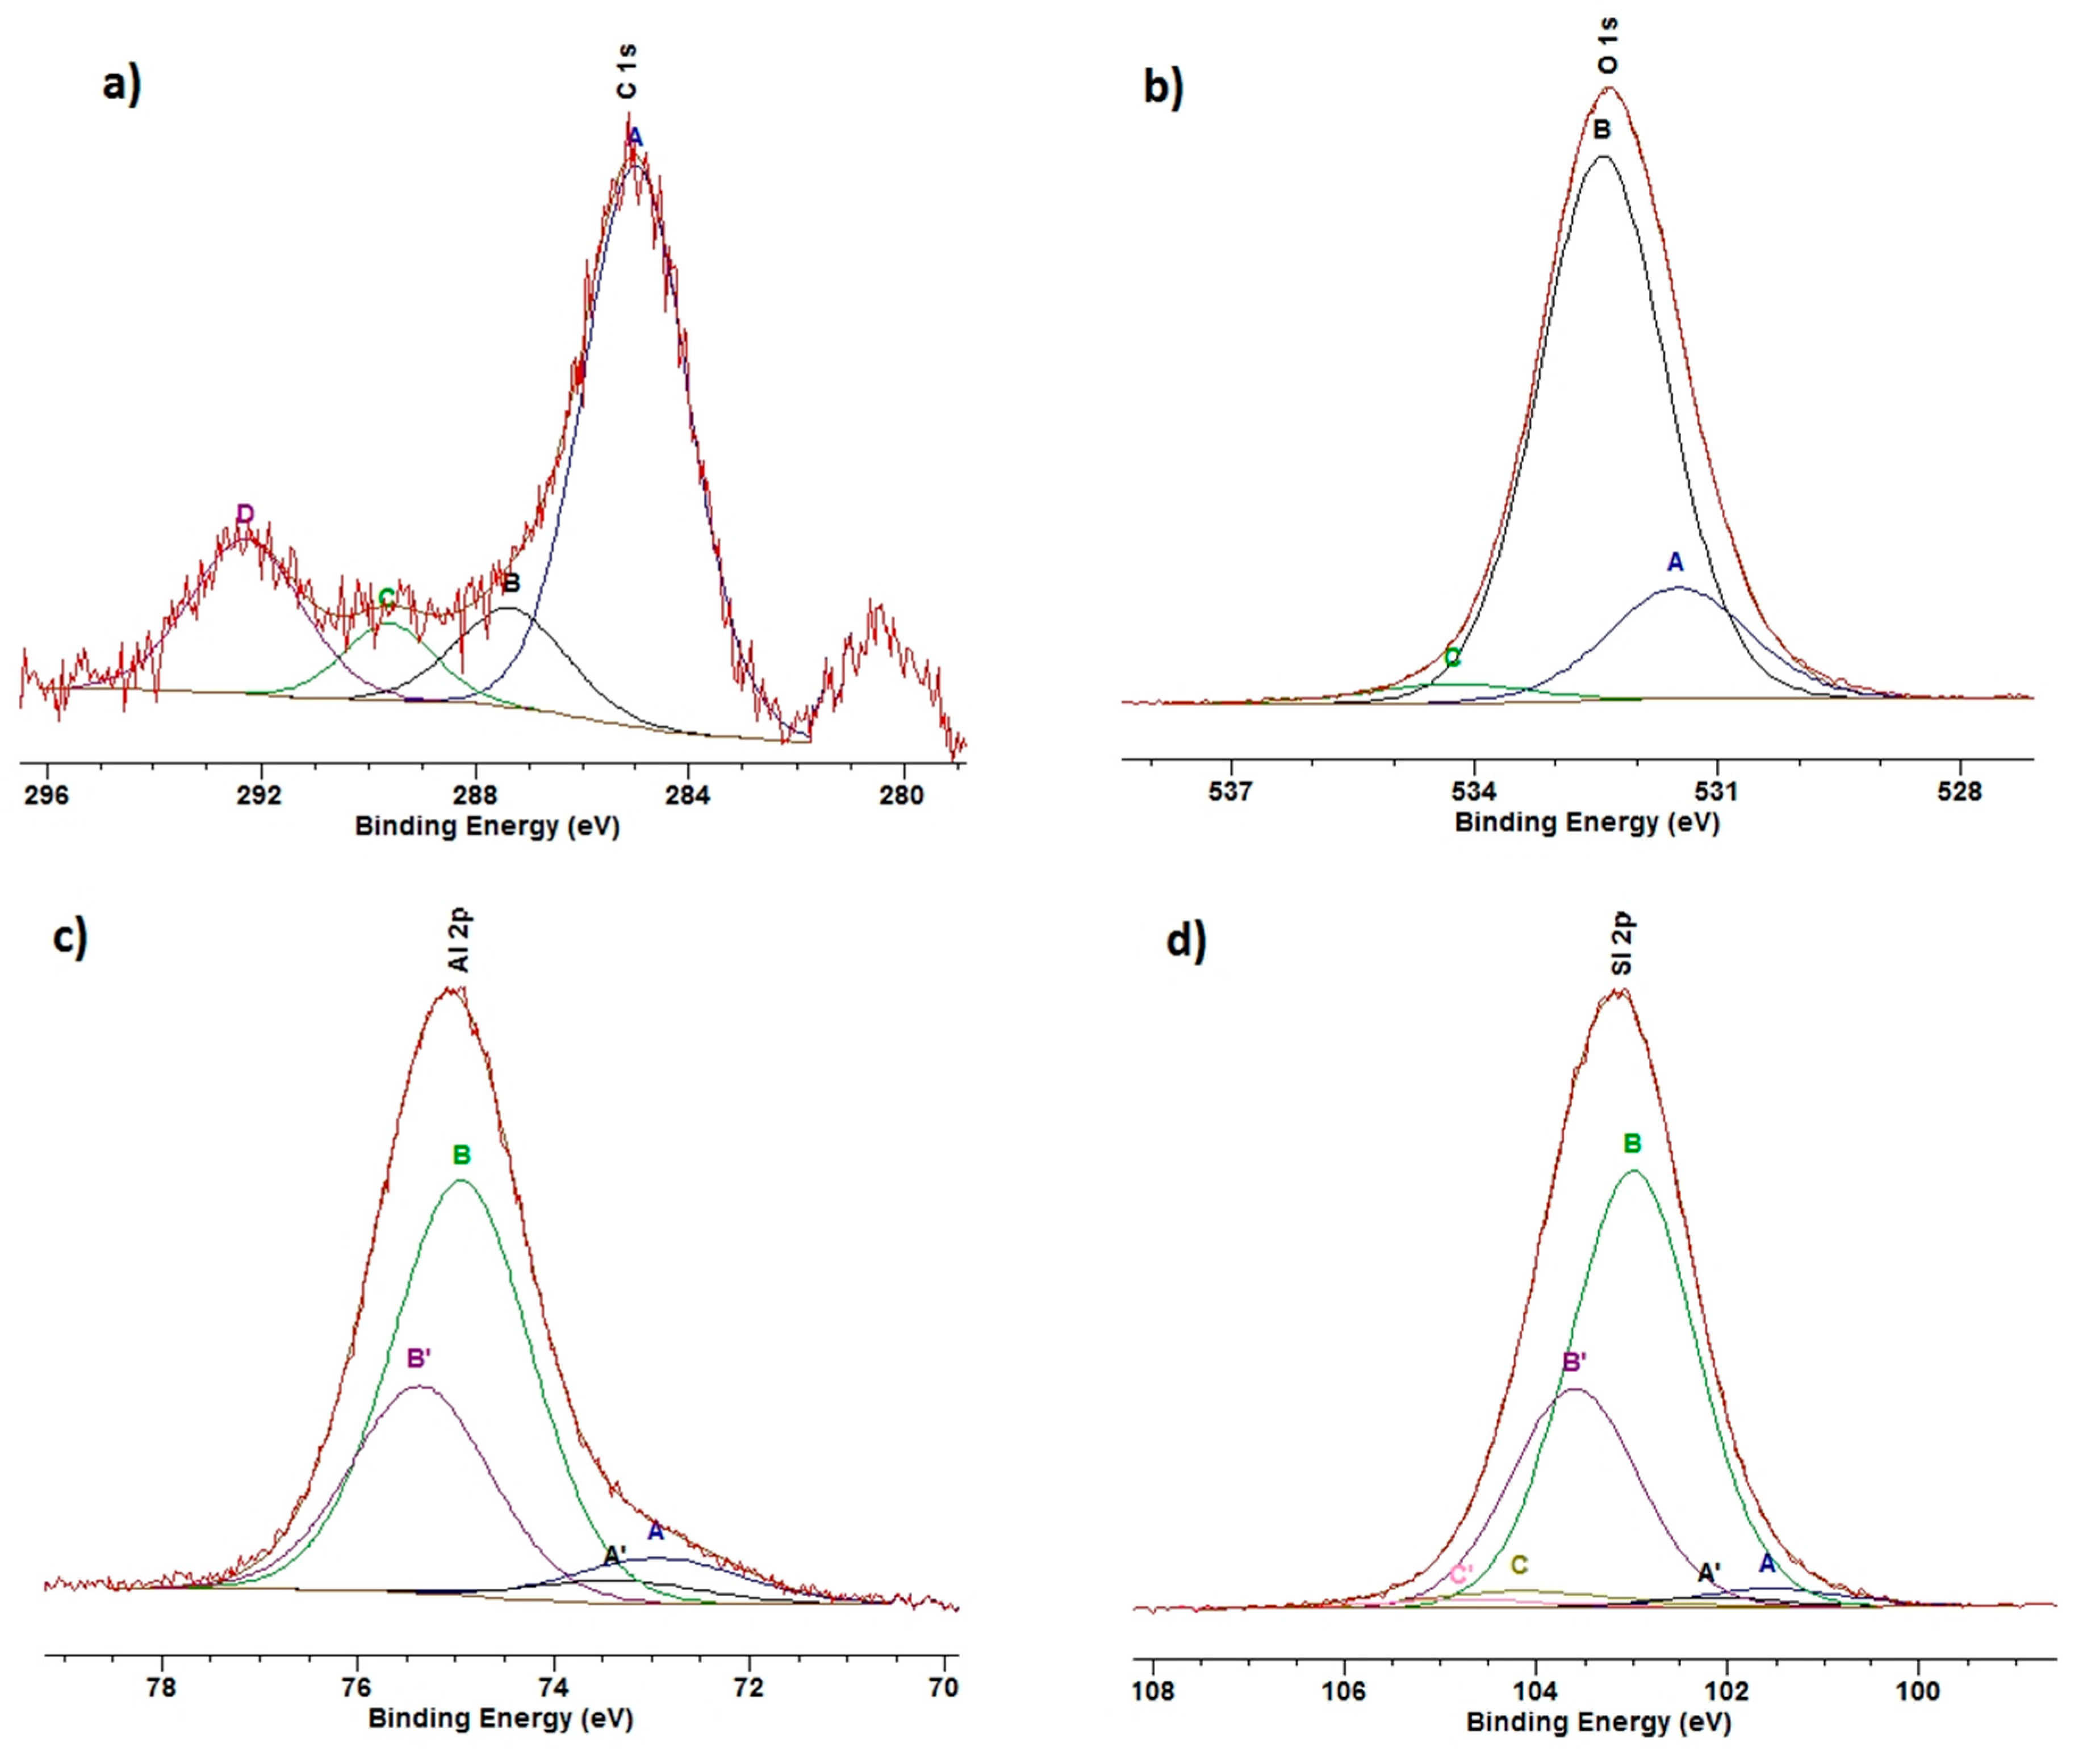
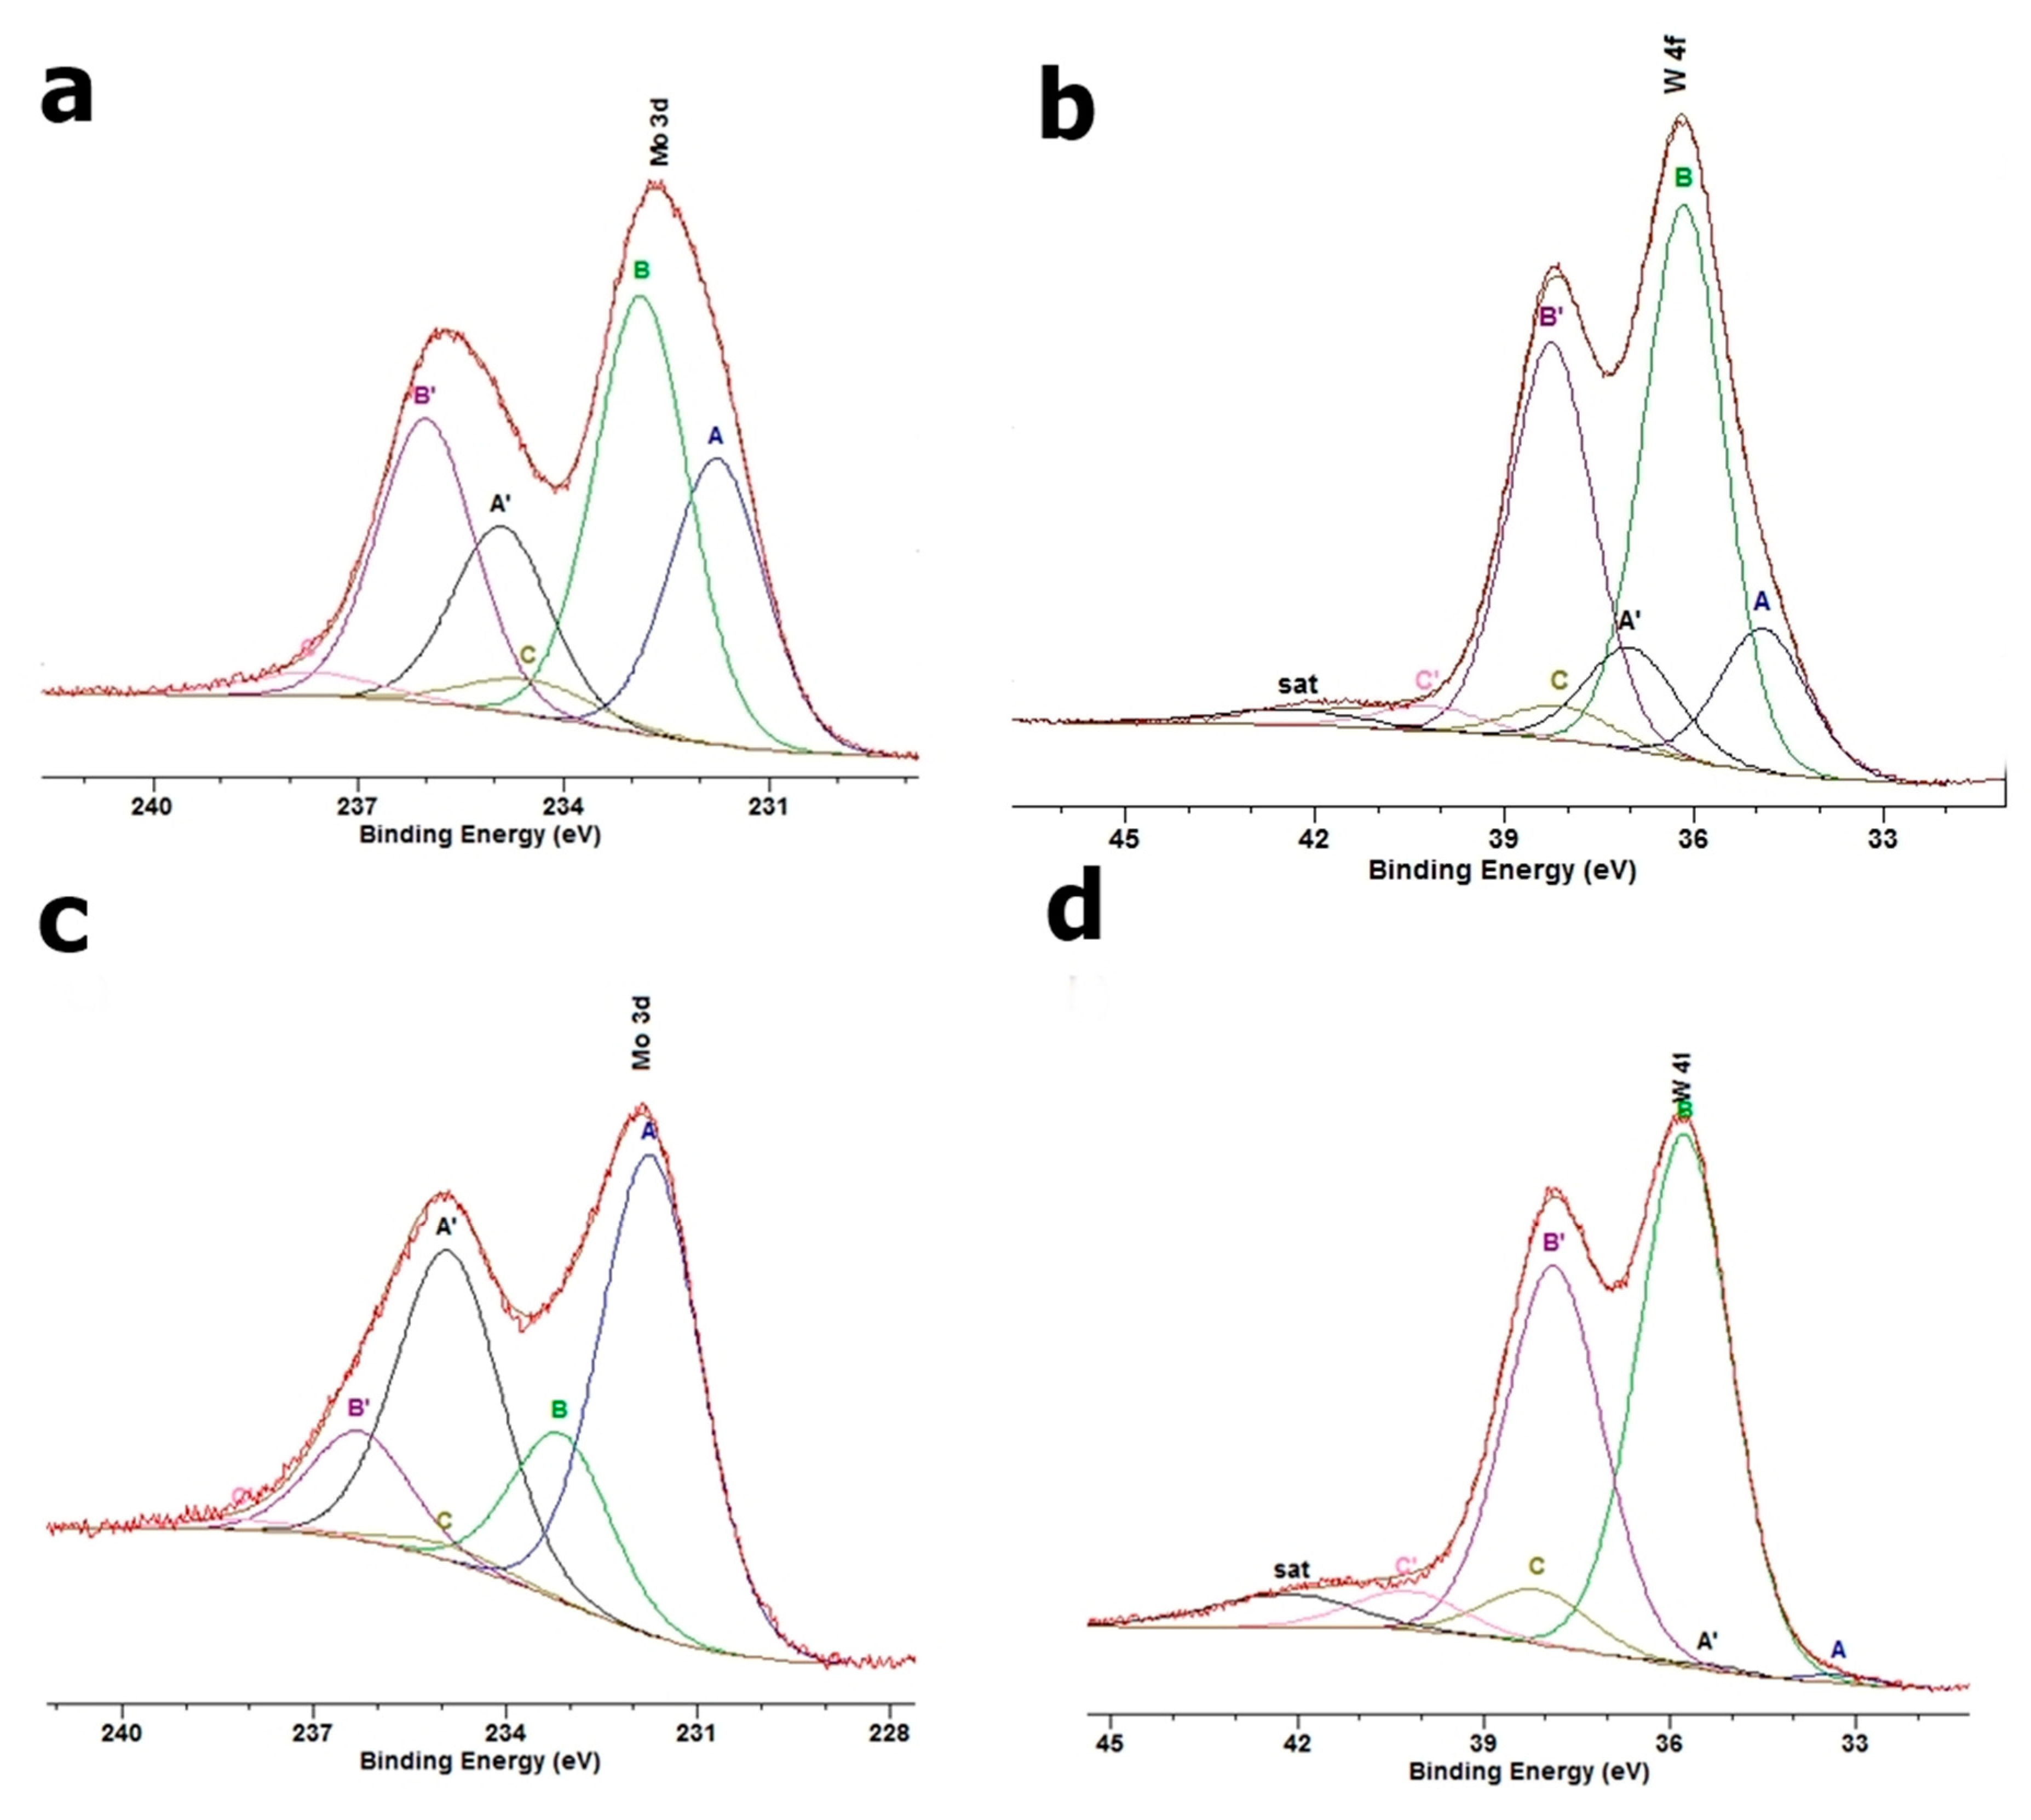
3.5. XPS
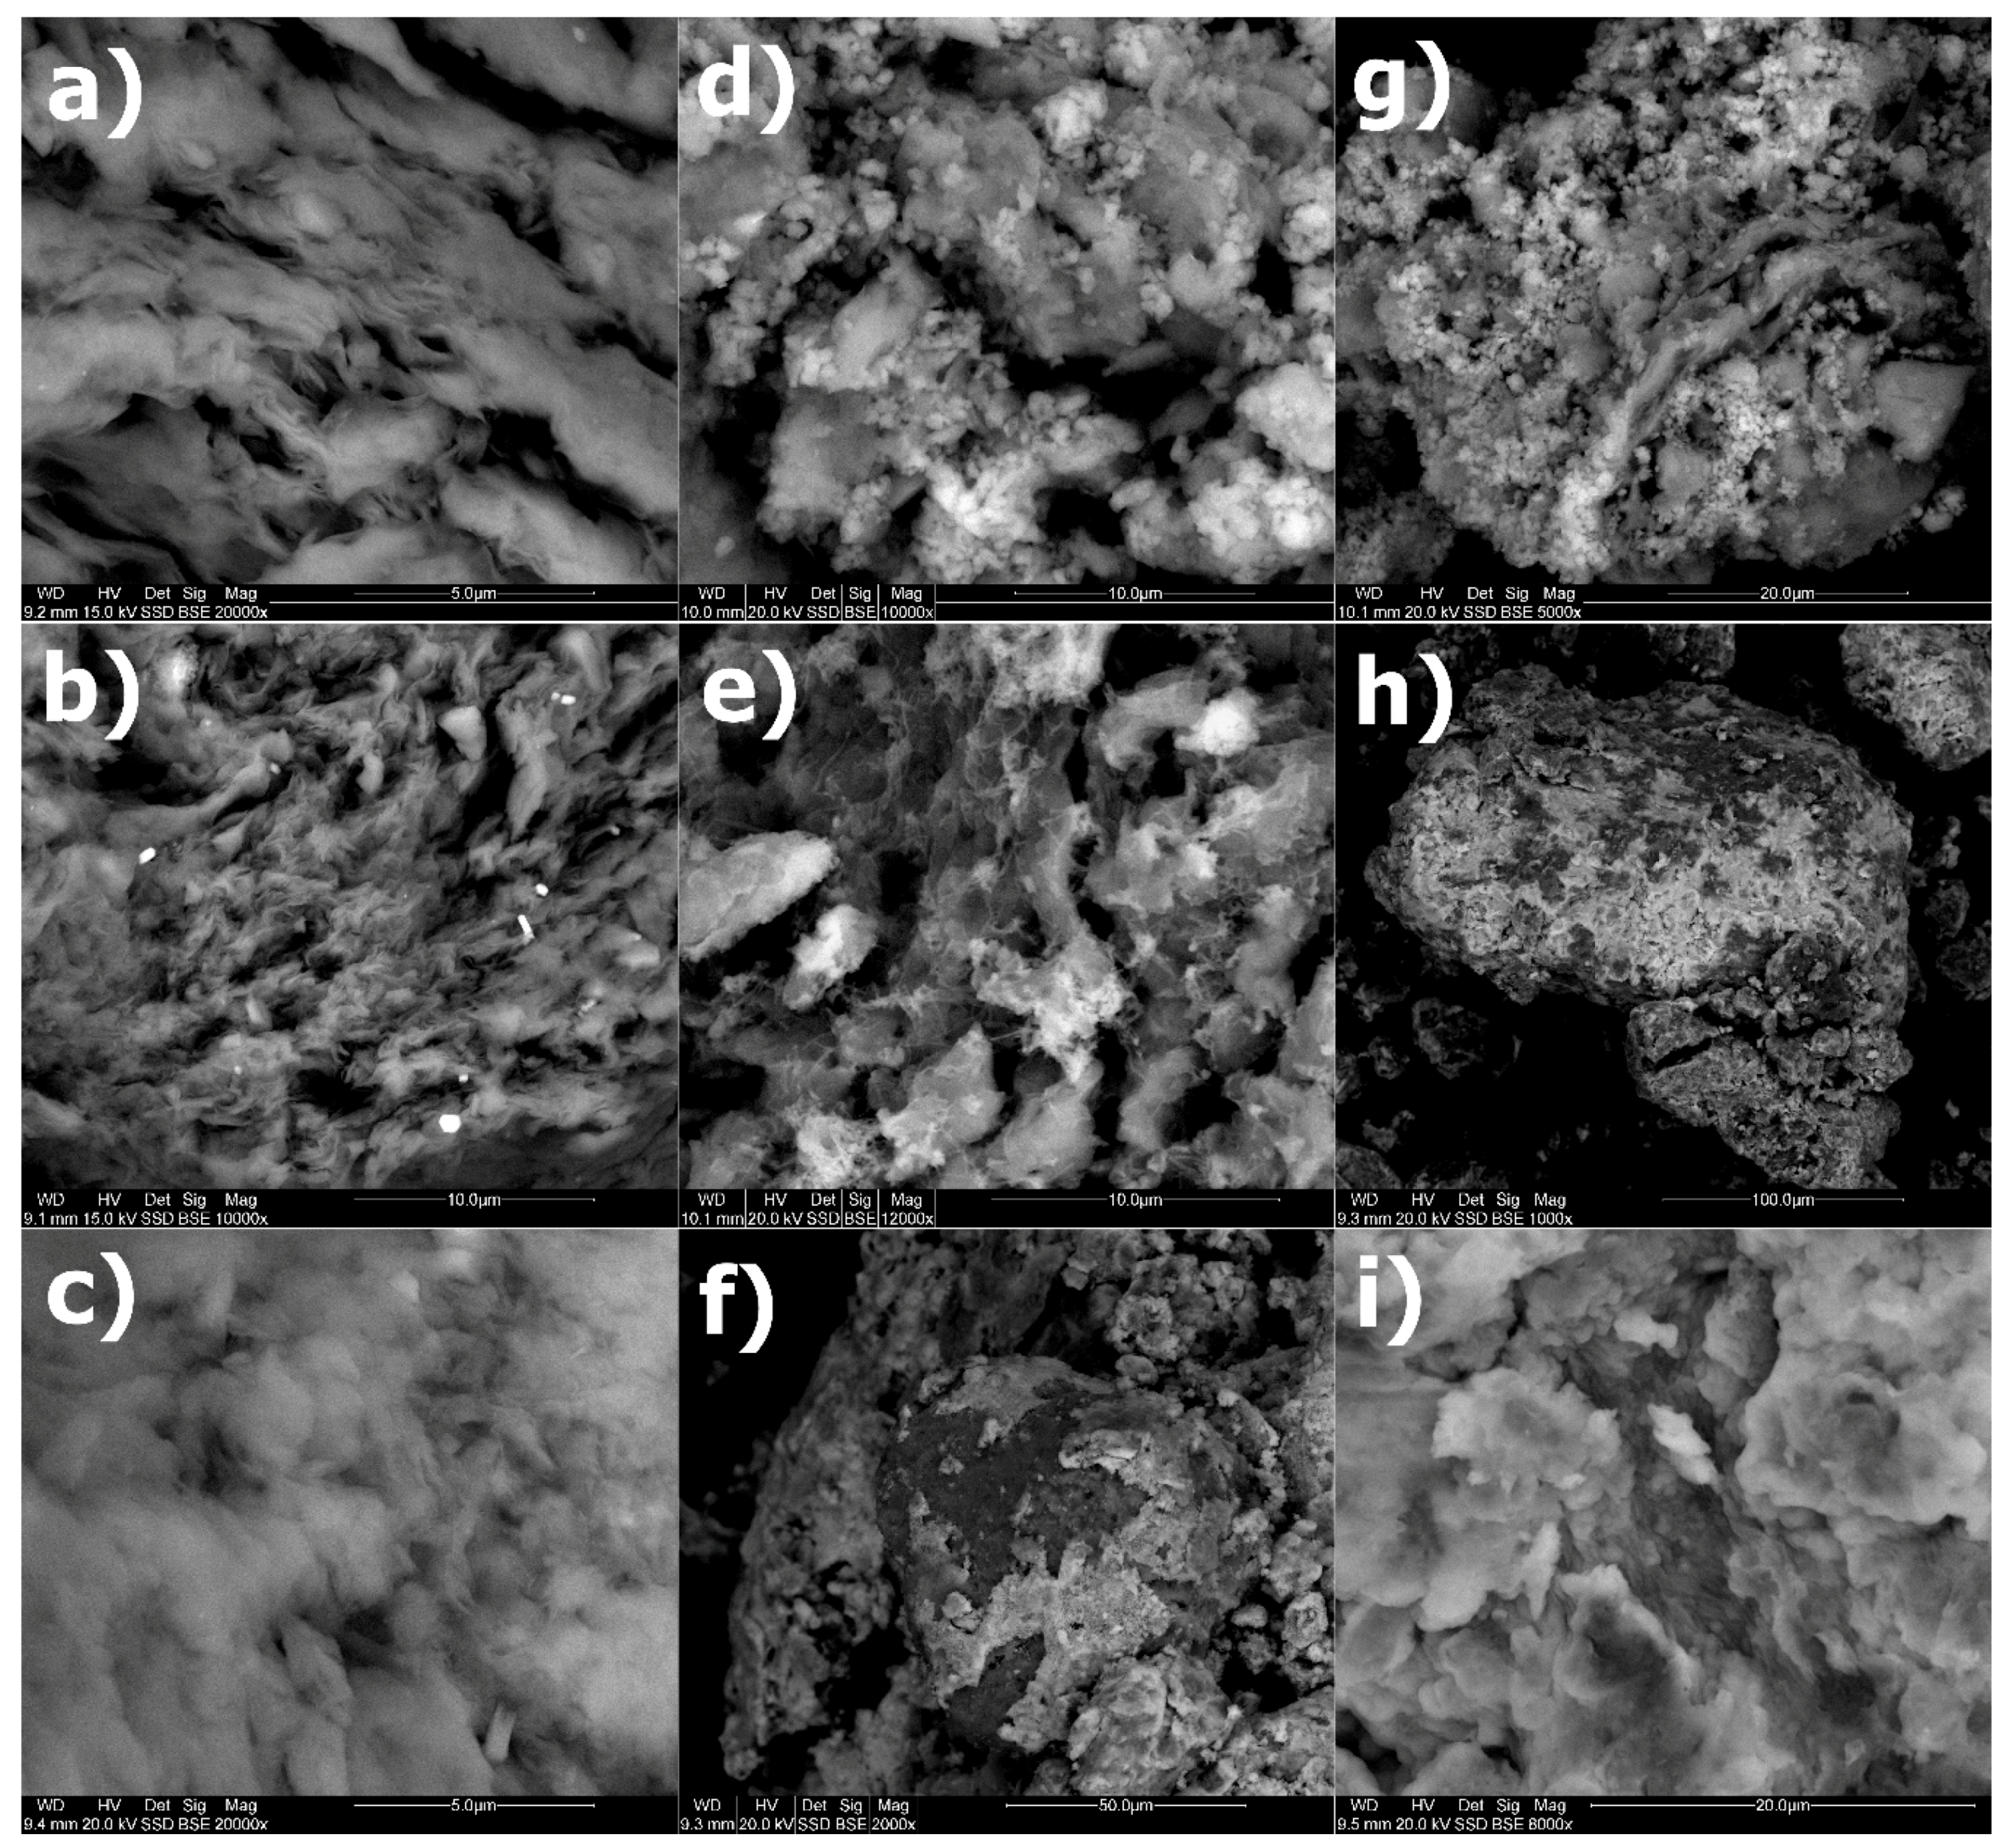
3.6. SEM
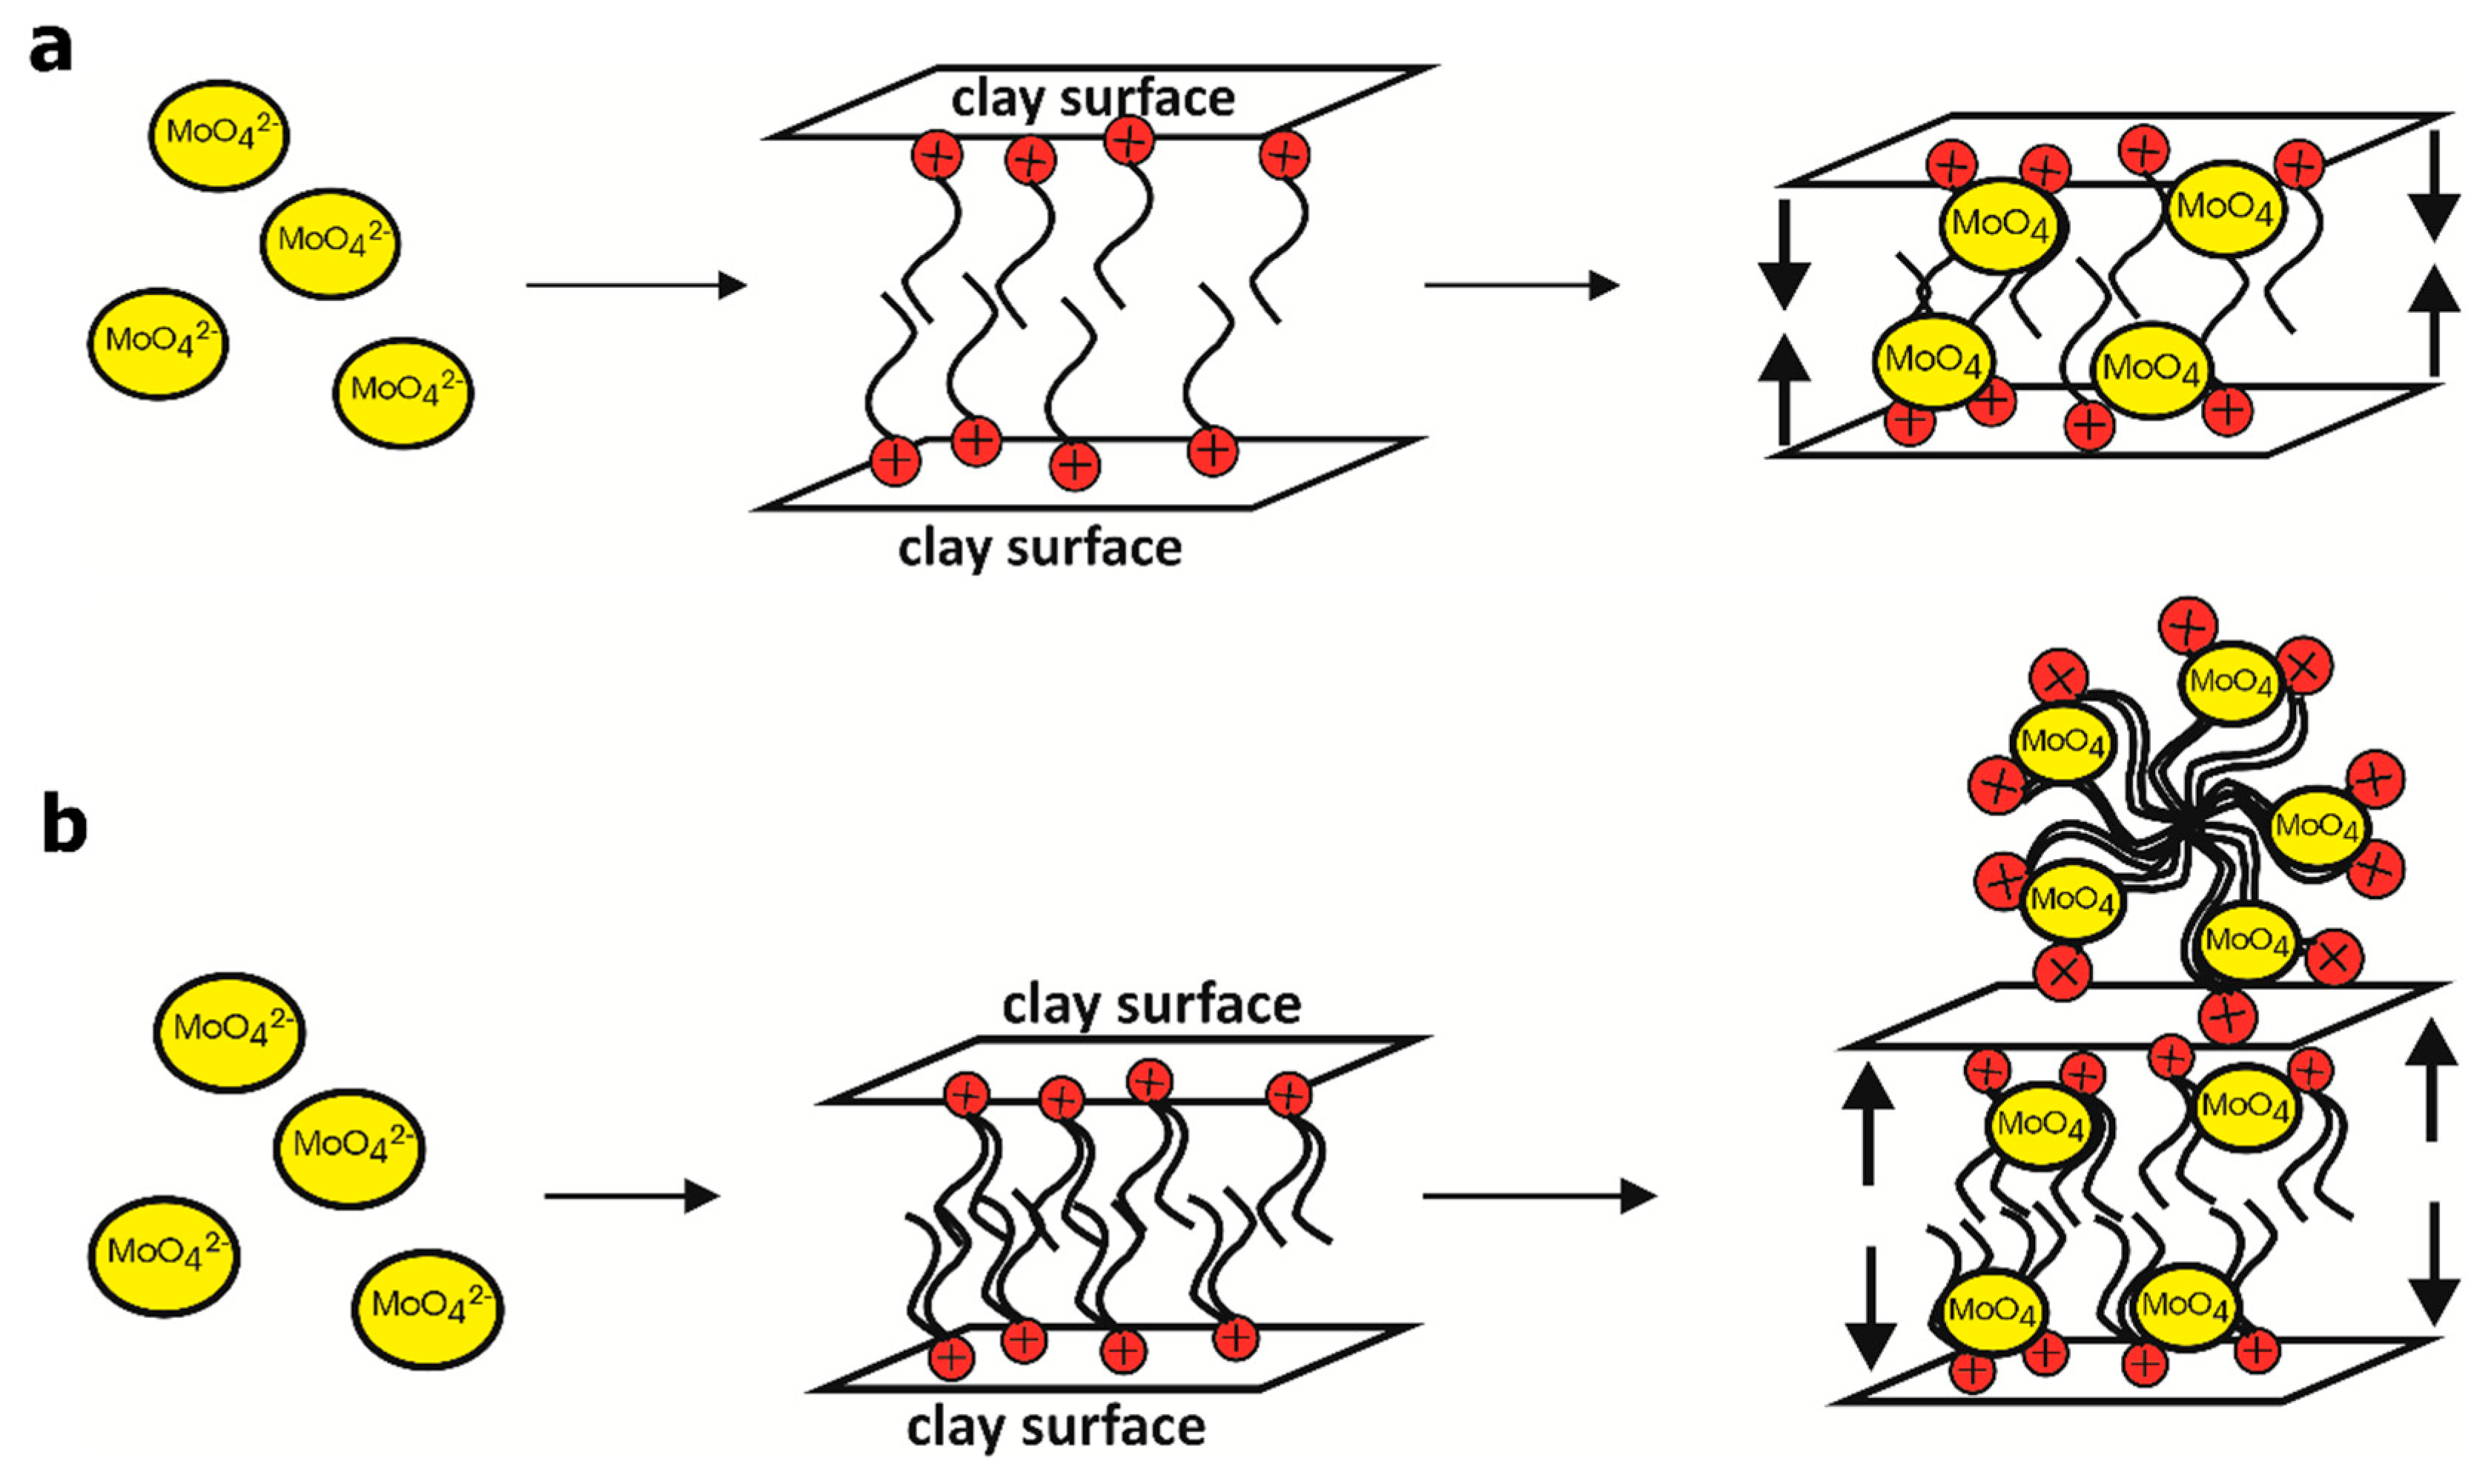
4. Discussion
Author Contributions
Funding
Conflicts of Interest
References
- Smedley, P.L.; Kinniburgh, D.G. Molybdenum in natural waters: A review of occurence, distributions and controls. Appl. Geochem. 2017, 84, 387–432. [Google Scholar] [CrossRef]
- Xu, M.H.; Yan, R.; Zheng, C.G.; Qiao, Y.; Han, J.; Sheng, C.D. Status of trace element emission in a coal combustion process: A review. Fuel Process. Technol. 2004, 85, 215–237. [Google Scholar] [CrossRef]
- Lassner, E.; Schubert, W.-D. Tungsten Properties, Chemistry, Technology of the Element, Alloys and Chemical Compounds; Springer: New York, NY, USA, 1999; p. 422. [Google Scholar]
- Sen Tuna, G.; Braida, W. Evaluation of the adsorption of mono- and polytungstates onto different types of clay minerals and pahokee peat. Soil Sediment Contam. 2014, 23, 838–849. [Google Scholar] [CrossRef]
- Lin, S.H.; Juang, R.S. Heavy metal removal from water by sorption using surfactant-modified montmorillonite. J. Hazard. Mater. 2002, 92, 315–326. [Google Scholar] [CrossRef]
- Bajda, T.; Klapyta, Z. Adsorption of chromate from aqueous solutions by HDTMA-modified clinoptilolite, glauconite and montmorillonite. Appl. Clay Sci. 2013, 86, 169–173. [Google Scholar] [CrossRef]
- Iwai, T.; Hashimoto, Y. Adsorption of tungstate (WO4) on birnessite, ferrihydrite, gibbsite, goethite and montmorillonite as affected by pH and competitive phosphate (PO4) and molybdate (MoO4) oxyanions. Appl. Clay Sci. 2017, 143, 372–377. [Google Scholar] [CrossRef]
- Li, Z.H.; Bowman, R.S. Sorption of chromate and PCE by surfactant-modified clay minerals. Environ. Eng. Sci. 1998, 15, 237–245. [Google Scholar] [CrossRef]
- Sullivan, E.J.; Bowman, R.S.; Legiec, I.A. Sorption of arsenic from soil-washing leachate by surfactant-modified zeolite. J. Environ. Qual. 2003, 32, 2387–2391. [Google Scholar] [CrossRef]
- Klapyta, Z.; Fujita, T.; Iyi, N. Adsorption of dodecyl- and octadecyltrimethylammonium ions on a smectite and synthetic micas. Appl. Clay Sci. 2001, 19, 5–10. [Google Scholar] [CrossRef]
- He, H.P.; Frost, R.L.; Bostrom, T.; Yuan, P.; Duong, L.; Yang, D.; Yunfel, X.F.; Kloprogge, J.T. Changes in the morphology of organoclays with HDTMA(+) surfactant loading. Appl. Clay Sci. 2006, 31, 262–271. [Google Scholar] [CrossRef]
- Muir, B.; Andrunik, D.; Hyla, J.; Bajda, T. The removal of molybdates and tungstates from aqueous solution by organo-smectites. Appl. Clay Sci. 2017, 136, 8–17. [Google Scholar] [CrossRef]
- Goldberg, S.; Forster, H.S.; Godfrey, C.L. Molybdenum adsorption on oxides, clay minerals, and soils. Soil Sci. Soc. Am. J. 1996, 60, 425–432. [Google Scholar] [CrossRef]
- Markovic, B.M.; Vukovic, Z.M.; Spasojevic, V.V.; Kusigerski, V.B.; Pavlovic, V.B.; Onjia, A.E.; Nastasovic, A.B. Selective magnetic GMA based potential sorbents for molybdenum and rhenium sorption. J. Alloys Compd. 2017, 705, 38–50. [Google Scholar] [CrossRef]
- Freund, C.; Wishard, A.; Brenner, R.; Sobel, M.; Mizelle, J.; Kim, A.; Meyer, D.A.; Morford, J.L. The effect of a thiol-containing organic molecule on molybdenum adsorption onto pyrite. Geochim. Cosmochim. Acta 2016, 174, 222–235. [Google Scholar] [CrossRef]
- Xu, N.; Christodoulatos, C.; Braida, W. Modeling the competitive effect of phosphate, sulfate, silicate, and tungstate anions on the adsorption of molybdate onto goethite. Chemosphere 2006, 64, 1325–1333. [Google Scholar] [CrossRef]
- Gustafsson, J.P. Modelling molybdate and tungstate adsorption on ferrihydrite. Chem. Geol. 2003, 200, 105–115. [Google Scholar] [CrossRef]
- Cui, M.M.; Johannesson, K.H. Comparison of tungstate and tetrathiotungstate adsorption onto pyrite. Chem. Geol. 2017, 464, 57–68. [Google Scholar] [CrossRef]
- Rakshit, S.; Sallman, B.; Dayantes, A.; Lefevre, G. Tungstate (VI) sorption on hematite: An in situ ATR-FTIR probe on the mechanism. Chemosphere 2017, 168, 685–691. [Google Scholar] [CrossRef]
- Namasivayam, C.; Sangeetha, D. Removal of molybdates from water by adsorption onto ZnCl2 activated coir pith carbon. Bioresour. Technol. 2006, 97, 1194–1200. [Google Scholar] [CrossRef]
- Swarnkar, V.; Agrawal, N.; Priya, P.; Tomar, R. Batch-wise tungstate removal from water on a surfactant-modified zeolite. Int. J. Appl. Chem. 2014, 2, 10–12. [Google Scholar]
- Ogata, F.; Nakamura, T.; Ueta, E.; Nagahashi, E.; Kobayashi, Y.; Kawasaki, N. Adsorption of tungsten ion with a novel Fe-Mg type hydrotalcite prepared at different Mg2+/Fe3+ ratios. J. Environ. Chem. Eng. 2017, 5, 3083–3090. [Google Scholar] [CrossRef]
- Hur, H.; Reeder, R.J. Tungstate sorption mechanisms on boehmite: Systematic uptake studies and X-ray absorption spectroscopy analysis. J. Colloid Interface Sci. 2016, 461, 249–260. [Google Scholar] [CrossRef] [PubMed]
- Hur, H.; Reeder, R.J. Formation of CoAl layered double hydroxide on the boehmite surface and its role in tungstate sorption. J. Environ. Sci. 2018, 65, 103–115. [Google Scholar] [CrossRef] [PubMed]
- Bajda, T.; Szala, B.; Solecka, U. Removal of lead and phosphate ions from aqueous solutions by organo-smectite. Environ. Technol. 2015, 36, 2872–2883. [Google Scholar] [CrossRef] [PubMed]
- Moore, D.M.; Reynolds, R.C., Jr. X-ray Diffraction and the Identification and Analysis of Clay Minerals, 2nd ed.; Oxford University Press: New York, NY, USA, 1997; p. 400. [Google Scholar]
- Brunauer, S.; Emmett, P.H.; Teller, E. Adsorption of gases in multimolecular layers. J. Am. Chem. Soc. 1938, 60, 309–319. [Google Scholar] [CrossRef]
- Dubinin, M.M. The potential theory of adsorption of gases and vapors for adsorbents with energetically nonuniform surfaces. Chem. Rev. 1960, 60, 235–241. [Google Scholar] [CrossRef]
- Barrett, E.P.; Joyner, L.G.; Halenda, P.P. The determination of pore volume and area distributions in porous substances II. J. Am. Chem. Soc. 1951, 73, 373–380. [Google Scholar] [CrossRef]
- Jović-Jovičić, N.; Milutinović-Nikolić, A.; Banković, P.; Dojčinović, B.; Nedić, B.; Gržetić, I.; Kabata-Pendias, A. Trace Elements of Group 6 (Previously Group VIb). In Trace Elements from Soil to Human; Kabata-Pendias, A., Mukherjee, A.B., Eds.; Springer: Berlin, Germany, 2010; pp. 181–201. [Google Scholar]
- Navratilova, Z.; Wojtowicz, P.; Vaculikova, L.; Sugarkova, V. Sorption of alkylammonium cations on montmorillonite. Acta Geodyn. Geomater. 2007, 4, 59–65. [Google Scholar]
- Stuart, B.H. Infrared Spectroscopy: Fundamentals and Applications, Analytical Techniques in the Sciences; John Wiley & Sons Ltd.: London, UK, 2005. [Google Scholar]
- He, H.; Frost, L.R.; Zhu, J. Infrared study of HDTMA + intercalated montmorillonite. Spectrochim. Acta Part A Mol. Biomol. Spectrosc. 2004, 60, 2853–2859. [Google Scholar]
- Madejova, J. FTIR techniques in clay mineral studies. Vib. Spectrosc. 2003, 31, 1–10. [Google Scholar] [CrossRef]
- Davantes, A.; Costa, D.; Sallman, B.; Rakshitt, S.; Lefevre, G. Surface polymerization of Mo(VI) and W(VI) anions on hematite revealed by in situ infrared spectroscopy and DFT plus U theoretical study. J. Phys. Chem. C 2017, 121, 324–332. [Google Scholar] [CrossRef]
- Sing, K.S.W.; Everett, D.H.; Haul, R.A.W.; Moscou, L.; Pierotti, R.A.; Rouquerol, J.; Siemieniewska, T. Reporting physisorption data for gas solid systems with special reference to the determination of surface-area and porosity (Recommendations 1984). Pure Appl. Chem. 1985, 57, 603–619. [Google Scholar] [CrossRef]
- Schulze, D.G. Clay minerals. In Encyclopedia of Soil in the Environment; Hillel, D.D., Ed.; Elsevier/Academic Press: New York, NY, USA, 2005; pp. 246–254. [Google Scholar]
- Moulder, J.F.; Stickle, W.F.; Sobol, P.E.; Bomben, K.; Chastain, J. Handbook of X-ray Photoelectron Spectroscopy: A Reference Book of Standard Spectra for Identification and Interpretation of XPS Data; Physical Electronics Division: Eden Prairie, MN, USA, 1992; p. 275. [Google Scholar]
- Barr, T.L.; Seal, S.; He, H.; Klinowski, J. X-ray photoelectron spectroscopic studies of kaolinite and montmorillonite. Vacuum 1995, 46, 1391–1395. [Google Scholar] [CrossRef]
- Murray, H.H. Applied clay mineralogy today and tomorrow. Clay Miner. 1999, 34, 39–49. [Google Scholar] [CrossRef]
- Lee, S.M.; Tiwari, D. Organo and inorgano-organo-modified clays in the remediation of aqueous solutions: An overview. Appl. Clay Sci. 2012, 59, 84–102. [Google Scholar] [CrossRef]
- Muir, B.; Matusik, J.; Bajda, T. New insights into alkylammonium-functionalized clinoptilolite and Na-P1 zeolite: Structural and textural features. Appl. Surf. Sci. 2016, 361, 242–250. [Google Scholar] [CrossRef]
- Mikesova, M.; Bartusek, M. Reaction of molybdate and tungstate with oxalate, mannitol and sorbitol. Collect. Czechoslov. Chem. Commun. 1978, 43, 1867–1877. [Google Scholar] [CrossRef]
- Mistova, E.; Parschova, H.; Matejka, Z. Selective sorption of metal oxoanions from dilute solution by bead cellulose sorbent. Sep. Sci. Technol. 2007, 42, 1231–1243. [Google Scholar] [CrossRef]
- Cruywagen, J.J. Protonation, oligomerization, and condensation reactions of vanadate(V), molybdate(VI), and tungstate(VI). Adv. Inorg. Chem. 2000, 49, 127–182. [Google Scholar]
- Andersson, I.; Hastings, J.J.; Howarth, O.W.; Pettersson, L. Aqueous molybdotungstates. J. Chem. Soc. Dalton Trans. 1994, 7, 1061–1066. [Google Scholar] [CrossRef]
- Huang, X.R.; Zhang, W.J.; Xu, G.Y.; Han, S.H.; Li, Y.; Li, C.P. Mixed micellar medium for the spectrophotometric determination of molybdenum in molybdenum/tungsten mixtures. Talanta 1998, 47, 869–875. [Google Scholar] [CrossRef]
- Sun, J.; Bostick, B.C. Effects of tungstate polymerization on tungsten(VI) adsorption on ferrihydrite. Chem. Geol. 2015, 417, 21–31. [Google Scholar] [CrossRef]
- Lian, J.J.; Yang, M.; Chen, B.; Wang, S.S.; Ye, T.R.; Zheng, D.D.; Jiang, C.R. Characteristics and mechanisms of molybdenum(VI) adsorption by drinking water treatment residue. Desalin. Water Treat. 2019, 142, 235–243. [Google Scholar] [CrossRef]
- Sun, W.G.; Selim, H.M. Kinetic modeling of pH-dependent molybdenum(VI) adsorption and desorption on iron oxide-coated sand. Soil Sci. Soc. Am. J. 2019, 83, 357–365. [Google Scholar] [CrossRef]
- Haggerty, G.M.; Bowman, R.S. Sorption of chromate and other inorganic anions by organo-zeolite. Environ. Sci. Technol. 1994, 28, 452–458. [Google Scholar] [CrossRef]
- Thanos, A.G.; Sotiropoulos, A.; Malamis, S.; Katsou, E.; Pavlatou, E.A.; Haralambous, K.J. Regeneration of HDTMA-modified minerals after sorption with chromate anions. Desalin. Water Treat. 2016, 57, 27869–27878. [Google Scholar] [CrossRef]
- Li, Z.H.; Bowman, R.S. Retention of inorganic oxyanions by organo-kaolinite. Water Res. 2001, 35, 3771–3776. [Google Scholar] [CrossRef]
- Sun, Z.M.; Park, Y.; Zheng, S.L.; Ayoko, G.A.; Frost, R.L. Thermal stability and hot-stage Raman spectroscopic study of Ca-montmorillonite modified with different surfactants: A comparative study. Thermochim. Acta 2013, 569, 151–160. [Google Scholar] [CrossRef]
- Zheng, S.L.; Sun, Z.M.; Park, Y.; Ayoko, G.A.; Frost, R.L. Removal of bisphenol A from wastewater by Ca-montmorillonite modified with selected surfactants. Chem. Eng. J. 2013, 234, 416–422. [Google Scholar] [CrossRef]
- Caglar, B.; Topcu, C.; Coldur, F.; Sarp, G.; Caglar, S.; Tabak, A.; Sahin, E. Structural, thermal, morphological and surface charge properties of dodecyltrimethylammonium-smectite composites. J. Mol. Struct. 2016, 1105, 70–79. [Google Scholar] [CrossRef]
- Krishna, B.S.; Murty, D.S.R.; Prakash, B.S.J. Surfactant-modified clay as adsorbent for chromate. Appl. Clay Sci. 2001, 20, 65–71. [Google Scholar] [CrossRef]
- Bajda, T.; Szala, B. Removal of vanadium(VI) from aqueous solution by HDTMA-modified clinoptilolite. In Proceedings of the AMAM: International Conference on Applied Mineralogy & Advanced Materials, Taranto, Italy, 7–12 June 2015. [Google Scholar]
- Bajda, T. Oxyanions sorption by organo-smectite. In Proceedings of the 55th Annual Meeting the Clay Minerals Society, Urbana-Champaign, IL, USA, 26–28 April 2012. [Google Scholar]
- Thommes, M.; Kaneko, K.; Neimark, A.V.; Olivier, J.P.; Rodriguez-Reinoso, F.; Rouquerol, J.; Sing, K.S.W. Physisorption of gases, with special reference to the evaluation of surface area and pore size distribution (IUPAC Technical Report). Pure Appl. Chem. 2015, 87, 1051–1069. [Google Scholar] [CrossRef]
- Le Forestier, L.; Muller, F.; Villieras, F.; Pelletier, M. Textural and hydration properties of a synthetic montmorillonite compared with a natural Na-exchanged clay analogue. Appl. Clay Sci. 2010, 48, 18–25. [Google Scholar] [CrossRef]
- Alothman, Z.A. A review: Fundamental aspects of silicate mesoporous materials. Materials 2012, 5, 2874–2902. [Google Scholar] [CrossRef]
- Majdan, M.; Maryuk, O.; Pikus, S.; Olszewska, E.; Kwiatkowski, R.; Skrzypek, H. Equilibrium, FTIR, scanning electron microscopy and small wide angle X-ray scattering studies of chromates adsorption on modified bentonite. J. Mol. Struct. 2005, 740, 203–211. [Google Scholar] [CrossRef]


| Sample | Sorption Capacity [mmol/kg] | |||
|---|---|---|---|---|
| Mo(VI) | W(VI) | Mo(VI) + W(VI) | ||
| Mo(VI) | W(VI) | |||
| Na-M | <0.01 | <0.01 | <0.01 | <0.01 |
| DDTMA-M | 387.72 ± 28.99 | 537.41 ± 189.36 | 8.01 ± 1.13 | 48.26 ± 4.00 |
| DDDDMA-M | 84.33 ± 31.47 | 260.67 ± 38.19 | 9.36 ± 0.90 | 54.14 ± 3.05 |
| Absorbed Ions | Sample | Sorbent | ||
|---|---|---|---|---|
| Na-M | DDTMA-M | DDDDMA-M | ||
| pH Values | ||||
| Mo(VI) | 1st | 4.71 | 4.71 | 4.78 |
| 5th | 4.65 | 4.78 | 4.82 | |
| 10th | 4.68 | 4.63 | 4.70 | |
| 15th | 4.73 | 4.72 | 4.75 | |
| W(VI) | 1st | 5.00 | 5.40 | 5.36 |
| 5th | 4.44 | 5.30 | 5.20 | |
| 10th | 5.02 | 5.28 | 5.40 | |
| 15th | 5.00 | 5.36 | 5.37 | |
| Mo(VI) + W(VI) | 1st | 4.49 | 4.61 | 4.54 |
| 5th | 4.47 | 4.78 | 4.57 | |
| 10th | 4.53 | 4.62 | 4.57 | |
| 15th | 4.48 | 4.61 | 4.62 | |
| Sample | BET Surface Area [m2/g] | Total Pore Volume [cm3/g] | Volume of Micropores [cm3/g] | Volume of Mesopores [cm3/g] | Volume of Macropores [cm3/g] |
|---|---|---|---|---|---|
| DDTMA-M-Mo | 1.8 | 0.011 | 0.001 | 0.005 | 0.005 |
| DDTMA-M-W | 1.2 | 0.005 | <0.001 | 0.002 | 0.003 |
| DDTMA-M-MoW | 0.4 | 0.004 | <0.001 | 0.001 | 0.003 |
| Sample | C 1s | O 1 s | Si 2 p | Al 2p | Na 1s | N 1s | Ca 2p | Mg 2s | Mo 3d | W 4f |
|---|---|---|---|---|---|---|---|---|---|---|
| Na-M | 6.3 | 57.0 | 23.8 | 10.2 | 1.1 | 0.2 | 0.2 | 1.3 | - | - |
| DDTMA-M-Mo | 52.8 | 28.5 | 6.4 | 1.6 | 0.5 | 1.6 | - | 0.7 | 7.8 | - |
| DDTMA-M-W | 32.6 | 40.2 | 15.7 | 5.7 | 0.2 | 1.9 | - | 0.4 | - | 3.3 |
| DDTMA-M-MoW | 45.4 | 32.9 | 8.4 | 4.1 | 0.2 | 1.6 | - | 1.1 | 3.0 | 3.3 |
© 2019 by the authors. Licensee MDPI, Basel, Switzerland. This article is an open access article distributed under the terms and conditions of the Creative Commons Attribution (CC BY) license (http://creativecommons.org/licenses/by/4.0/).
Share and Cite
Tuchowska, M.; Muir, B.; Kowalik, M.; Socha, R.P.; Bajda, T. Sorption of Molybdates and Tungstates on Functionalized Montmorillonites: Structural and Textural Features. Materials 2019, 12, 2253. https://doi.org/10.3390/ma12142253
Tuchowska M, Muir B, Kowalik M, Socha RP, Bajda T. Sorption of Molybdates and Tungstates on Functionalized Montmorillonites: Structural and Textural Features. Materials. 2019; 12(14):2253. https://doi.org/10.3390/ma12142253
Chicago/Turabian StyleTuchowska, Magdalena, Barbara Muir, Mariola Kowalik, Robert P. Socha, and Tomasz Bajda. 2019. "Sorption of Molybdates and Tungstates on Functionalized Montmorillonites: Structural and Textural Features" Materials 12, no. 14: 2253. https://doi.org/10.3390/ma12142253
APA StyleTuchowska, M., Muir, B., Kowalik, M., Socha, R. P., & Bajda, T. (2019). Sorption of Molybdates and Tungstates on Functionalized Montmorillonites: Structural and Textural Features. Materials, 12(14), 2253. https://doi.org/10.3390/ma12142253