Zirconium Phase Transformation under Static High Pressure and ω-Zr Phase Stability at High Temperatures

 ,
, 
Abstract
1. Introduction
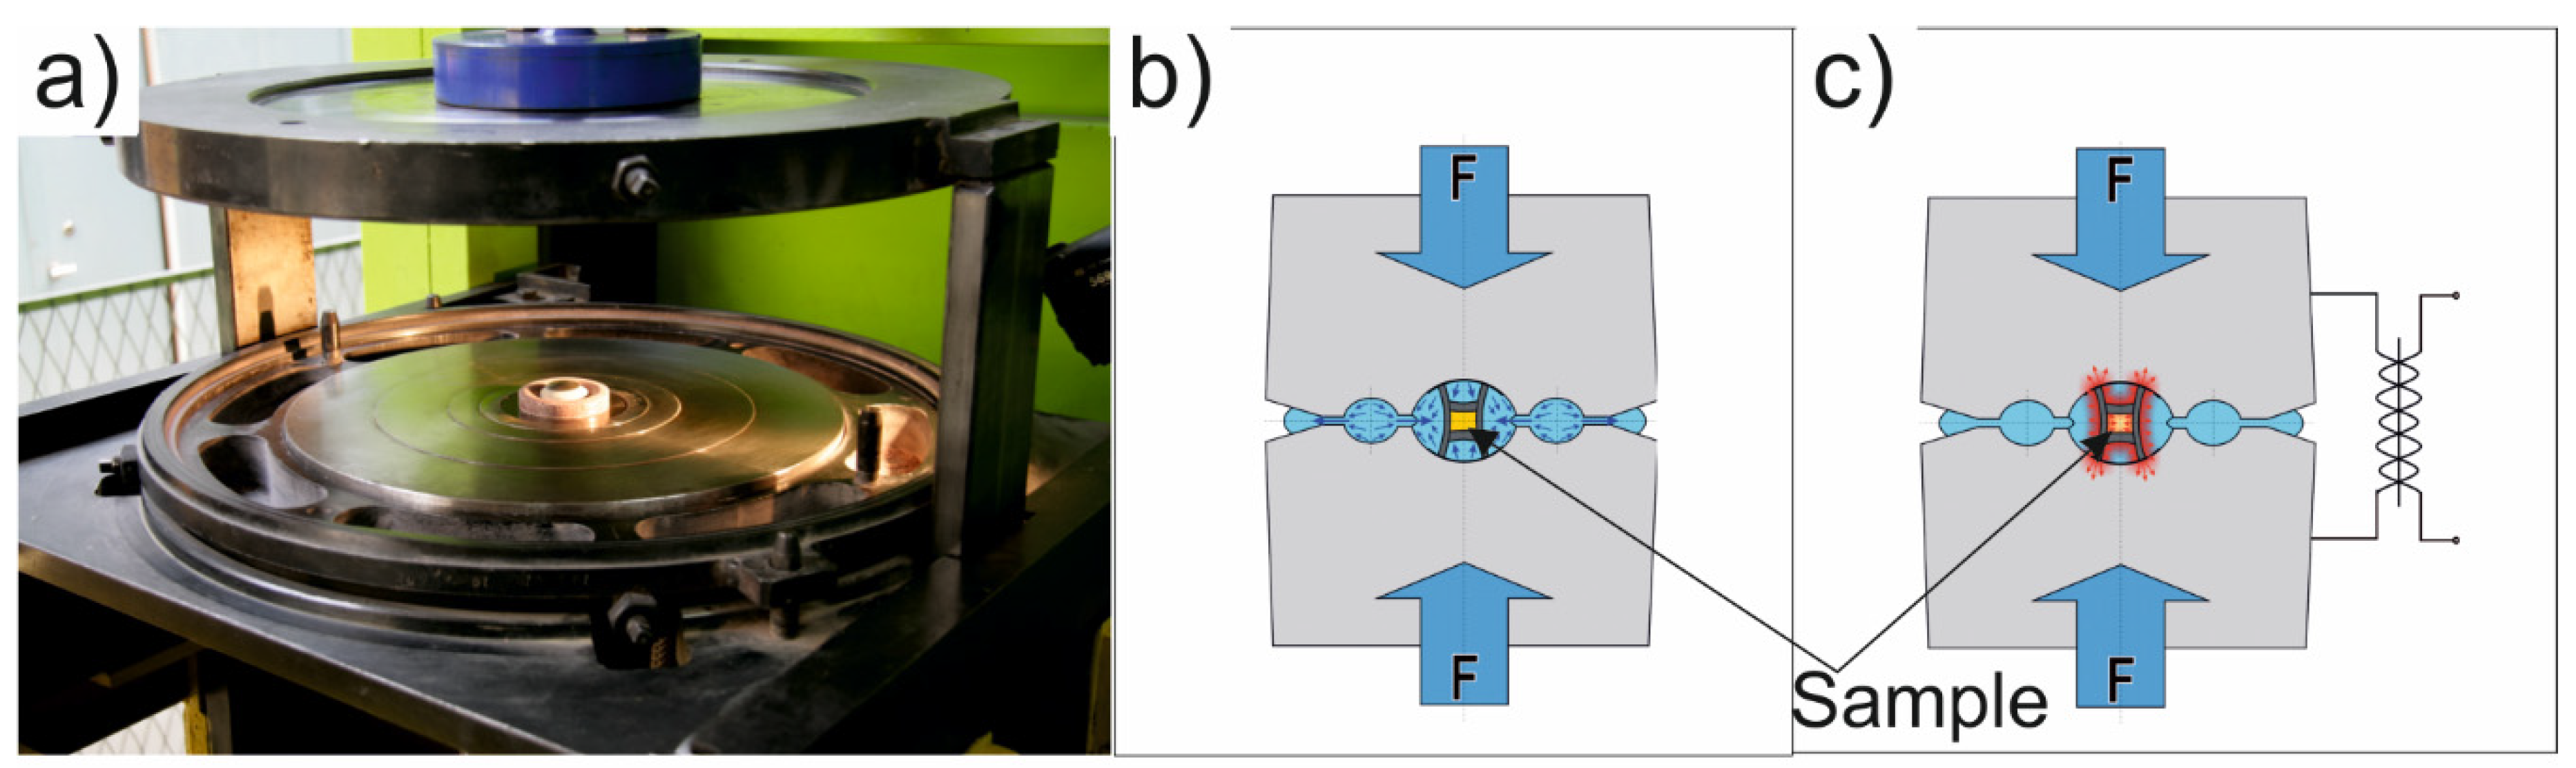
2. Materials and Methods
3. Results and Discussion
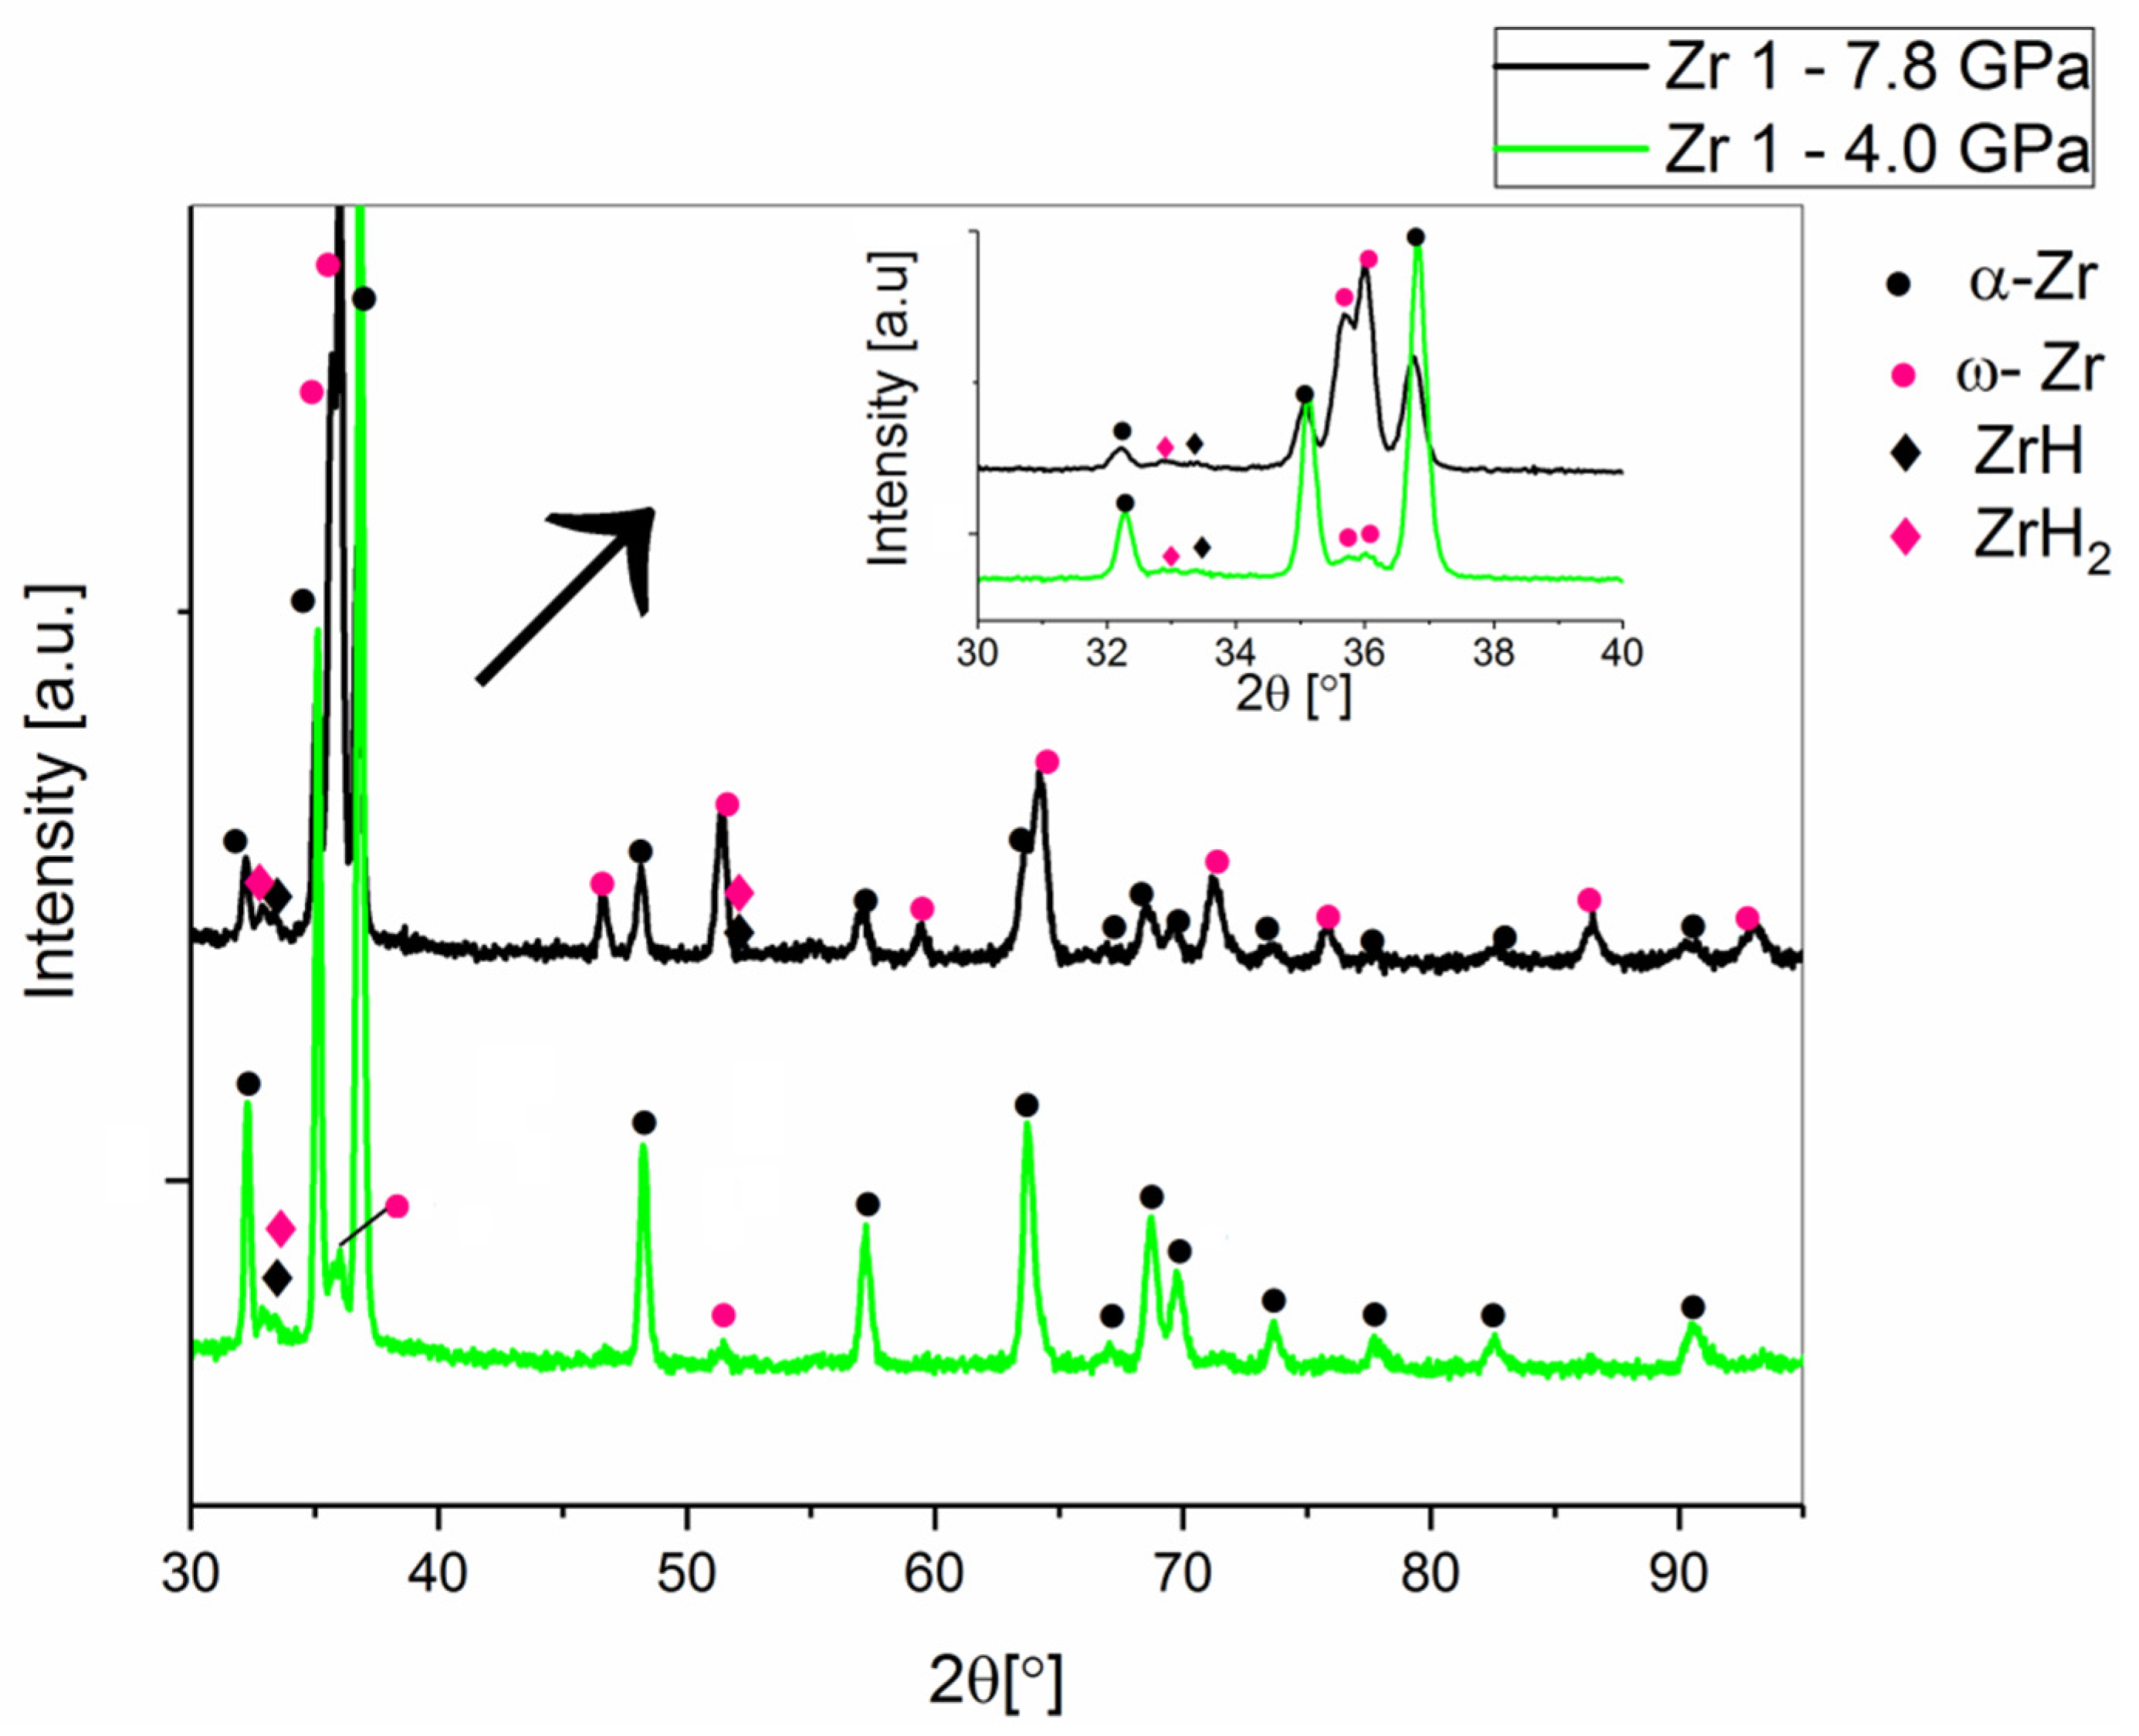
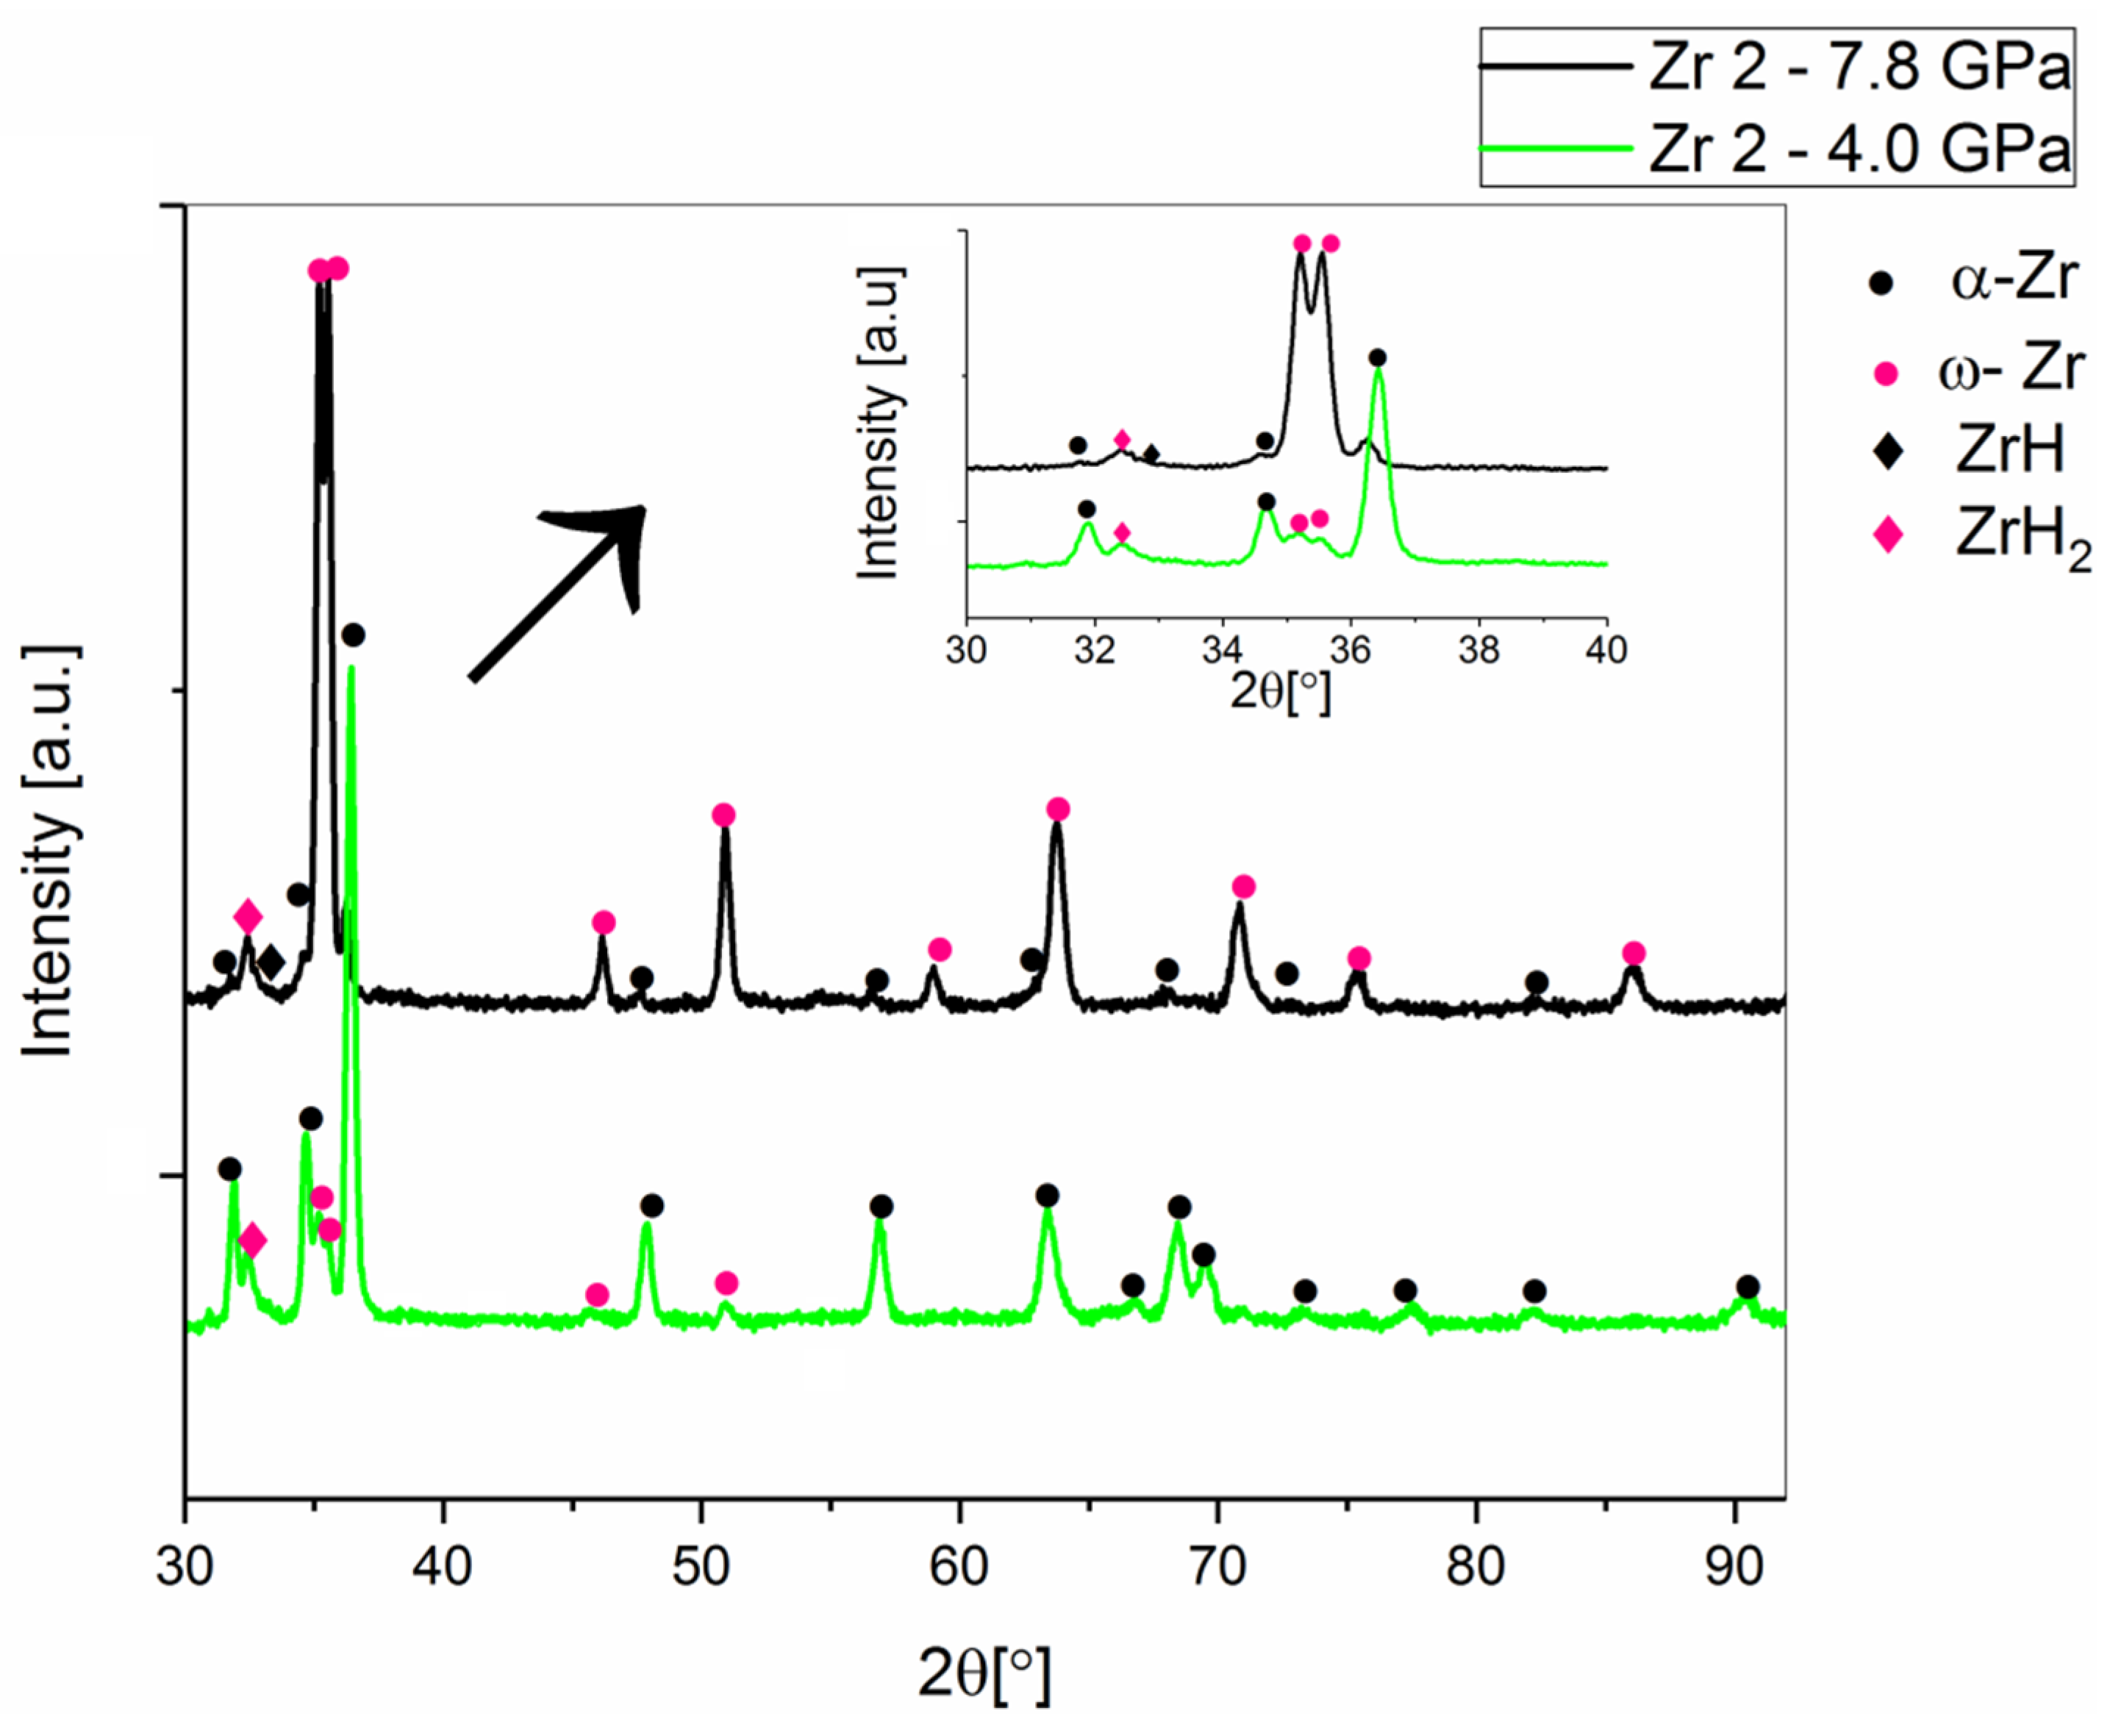
3.1. Phase Transition during High-Pressure Compacting and Sintering
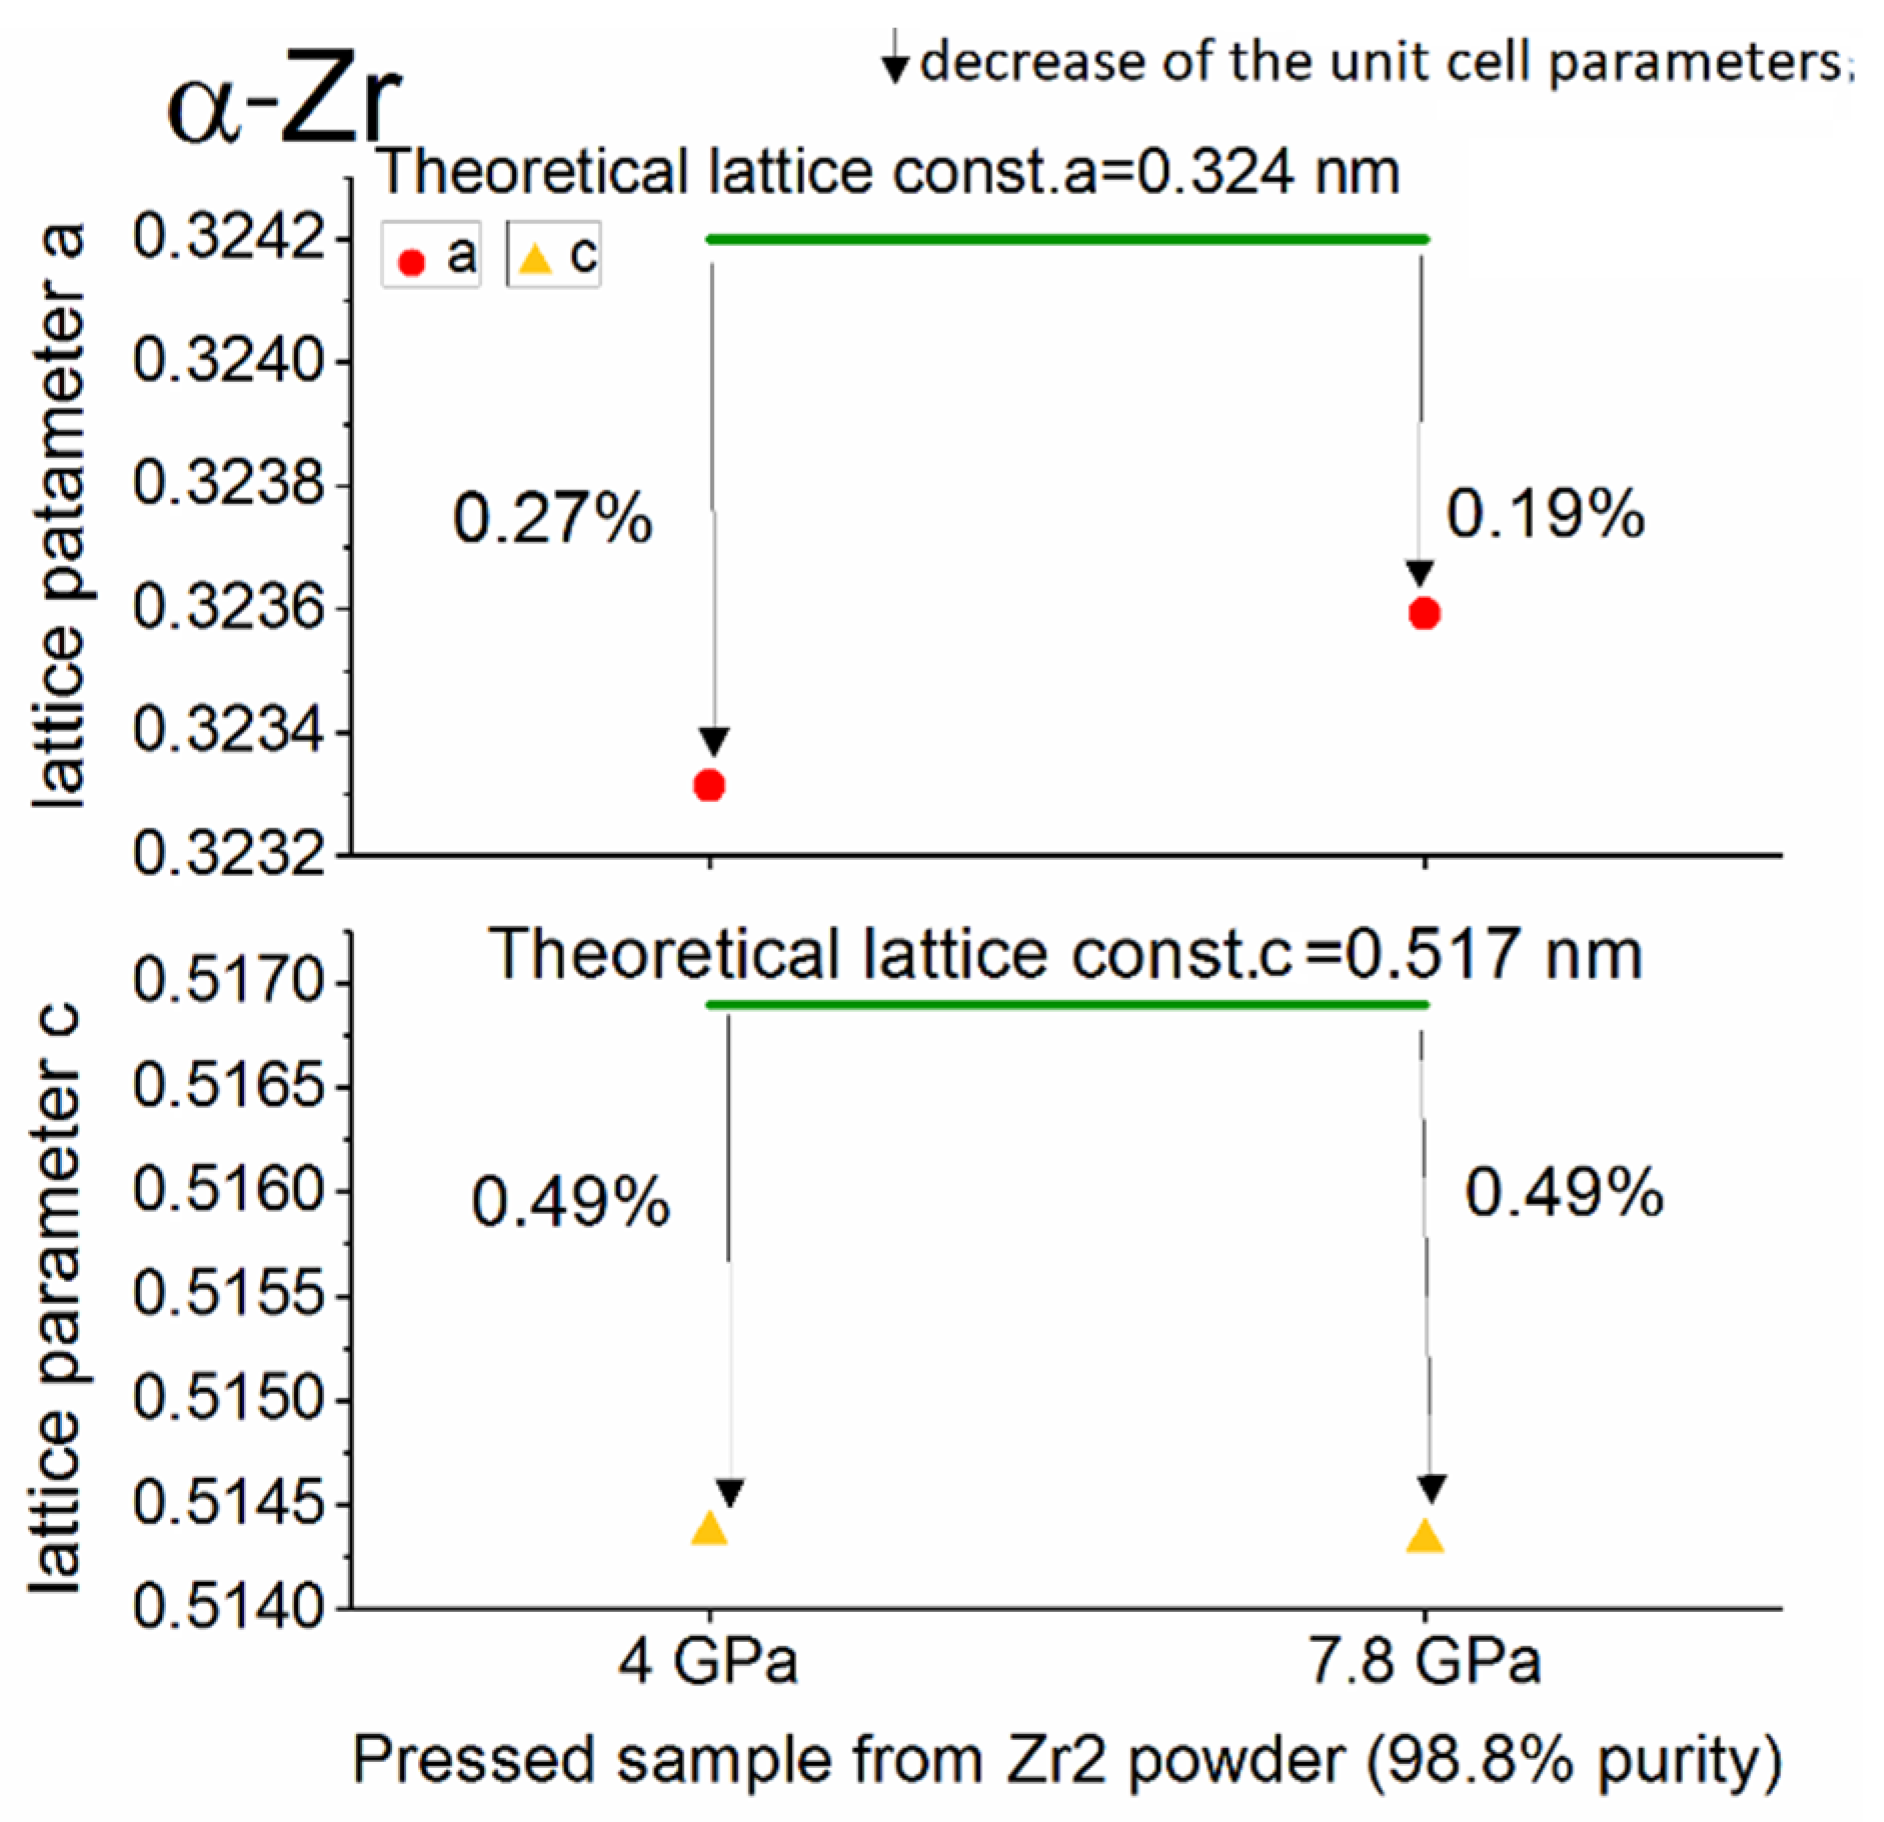
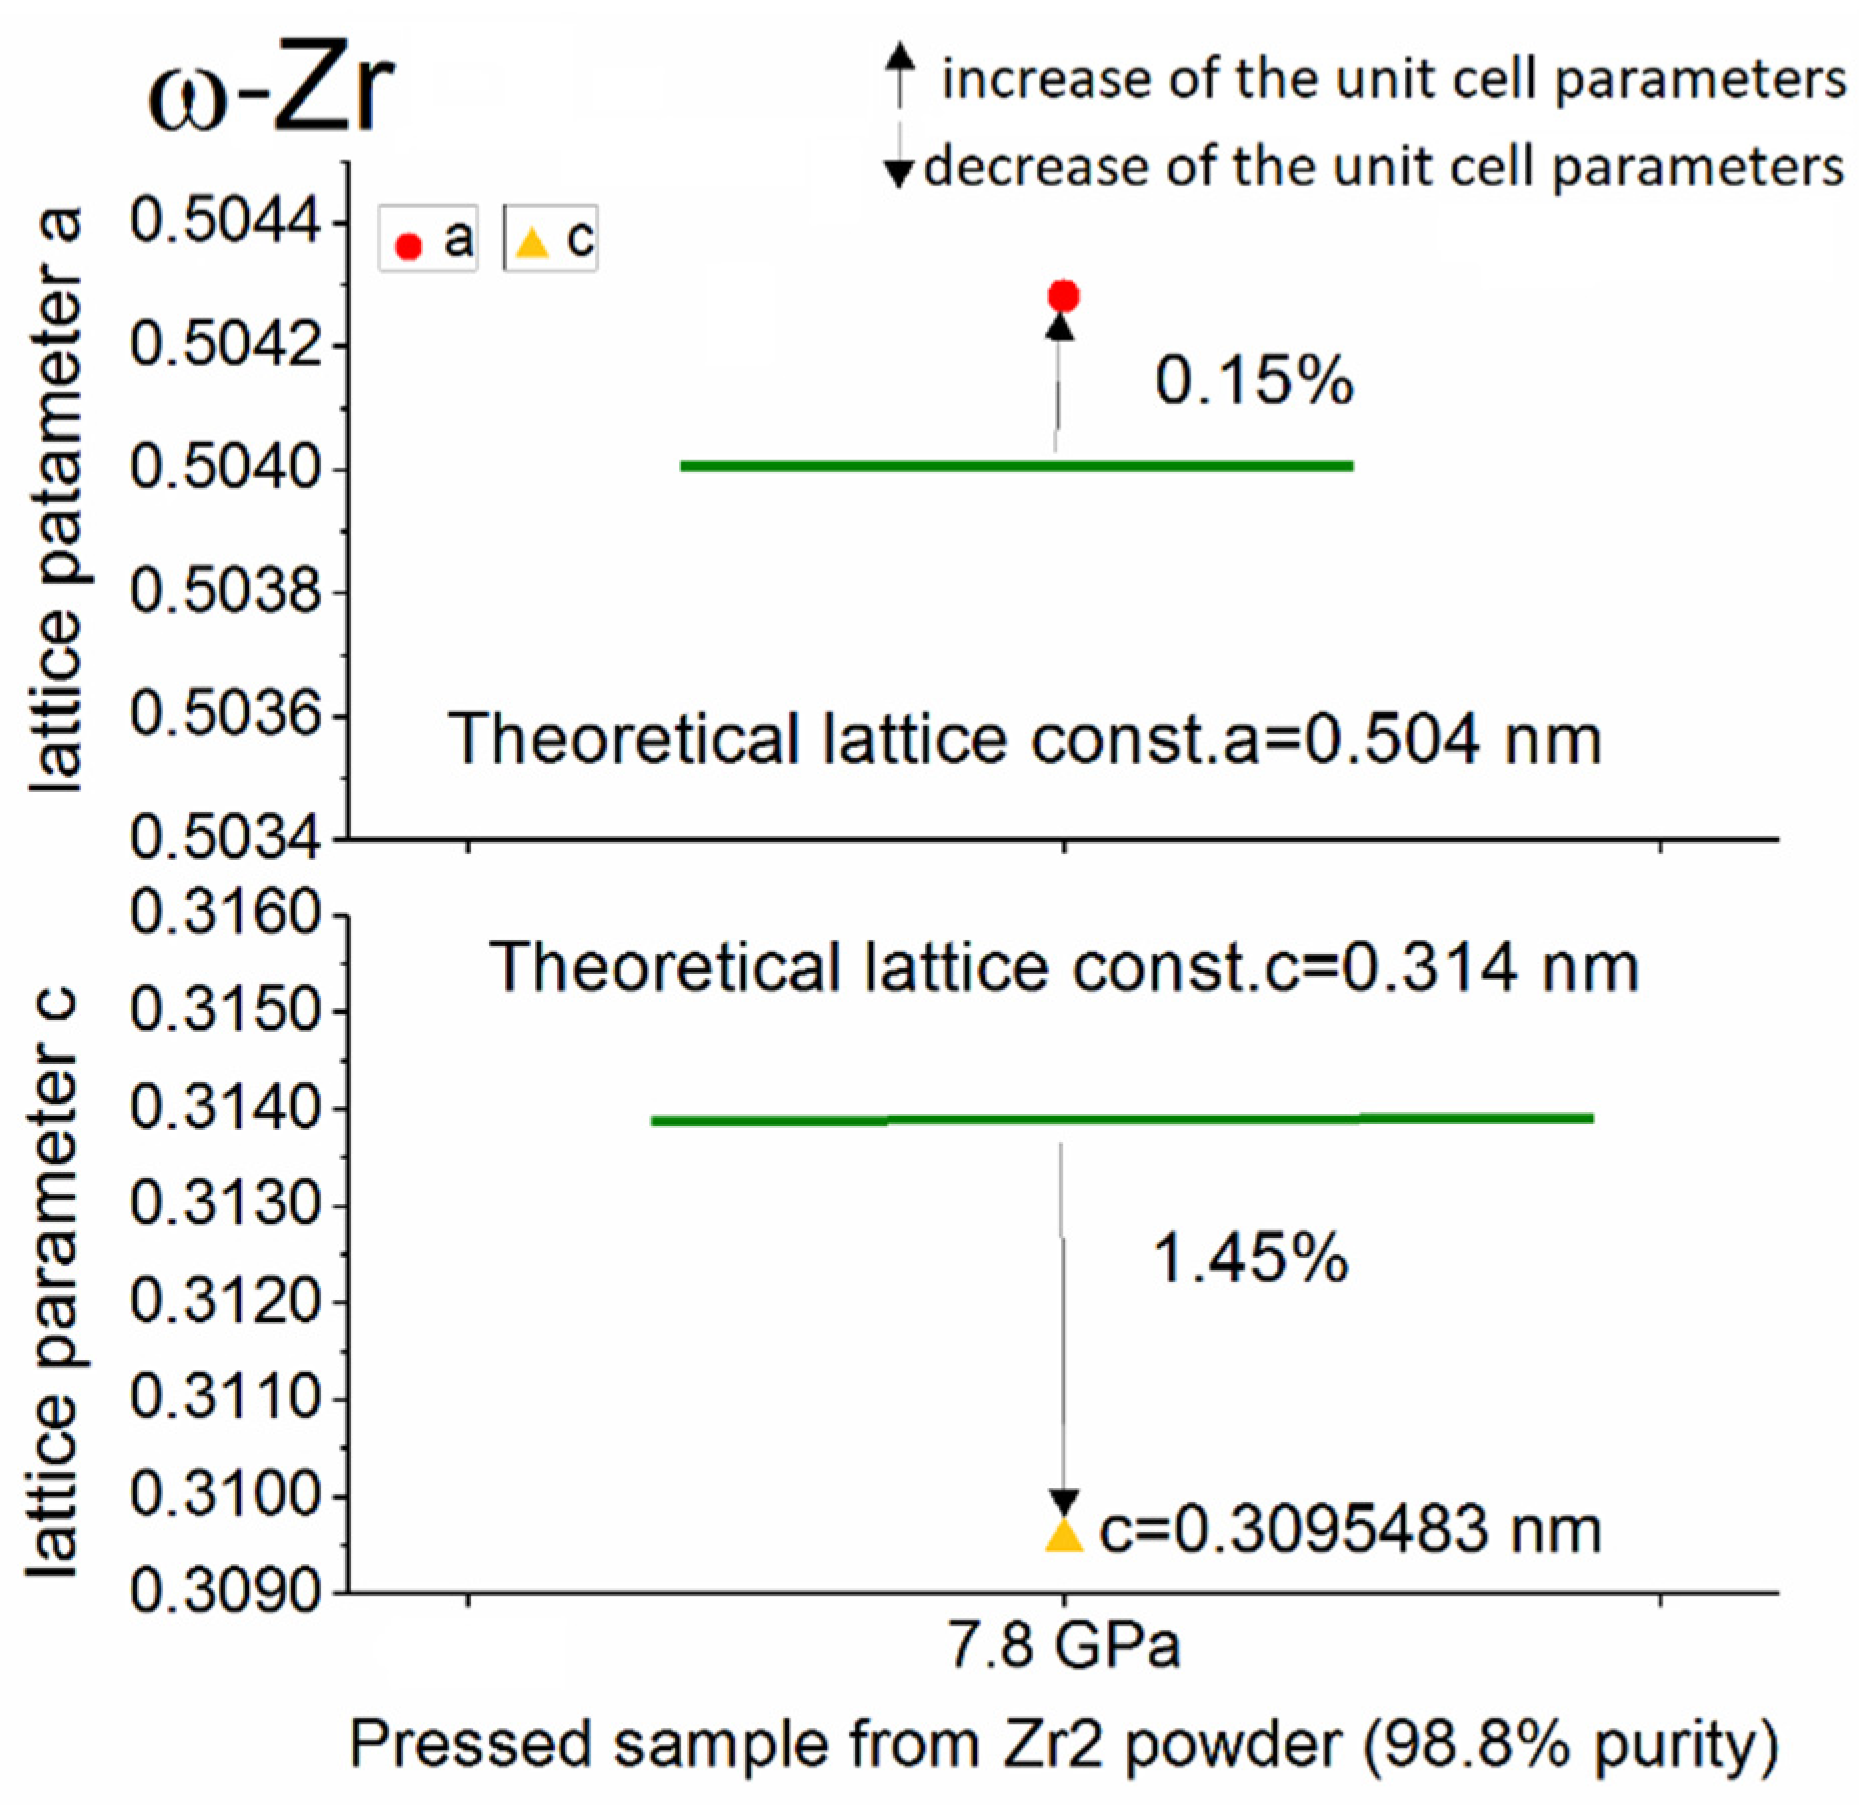
3.2. Stress Measurements for High-Pressure Compacting and Sintering Zirconium Powders
3.3. The ω-Zr Phase Stability at High Temperatures
4. Conclusions
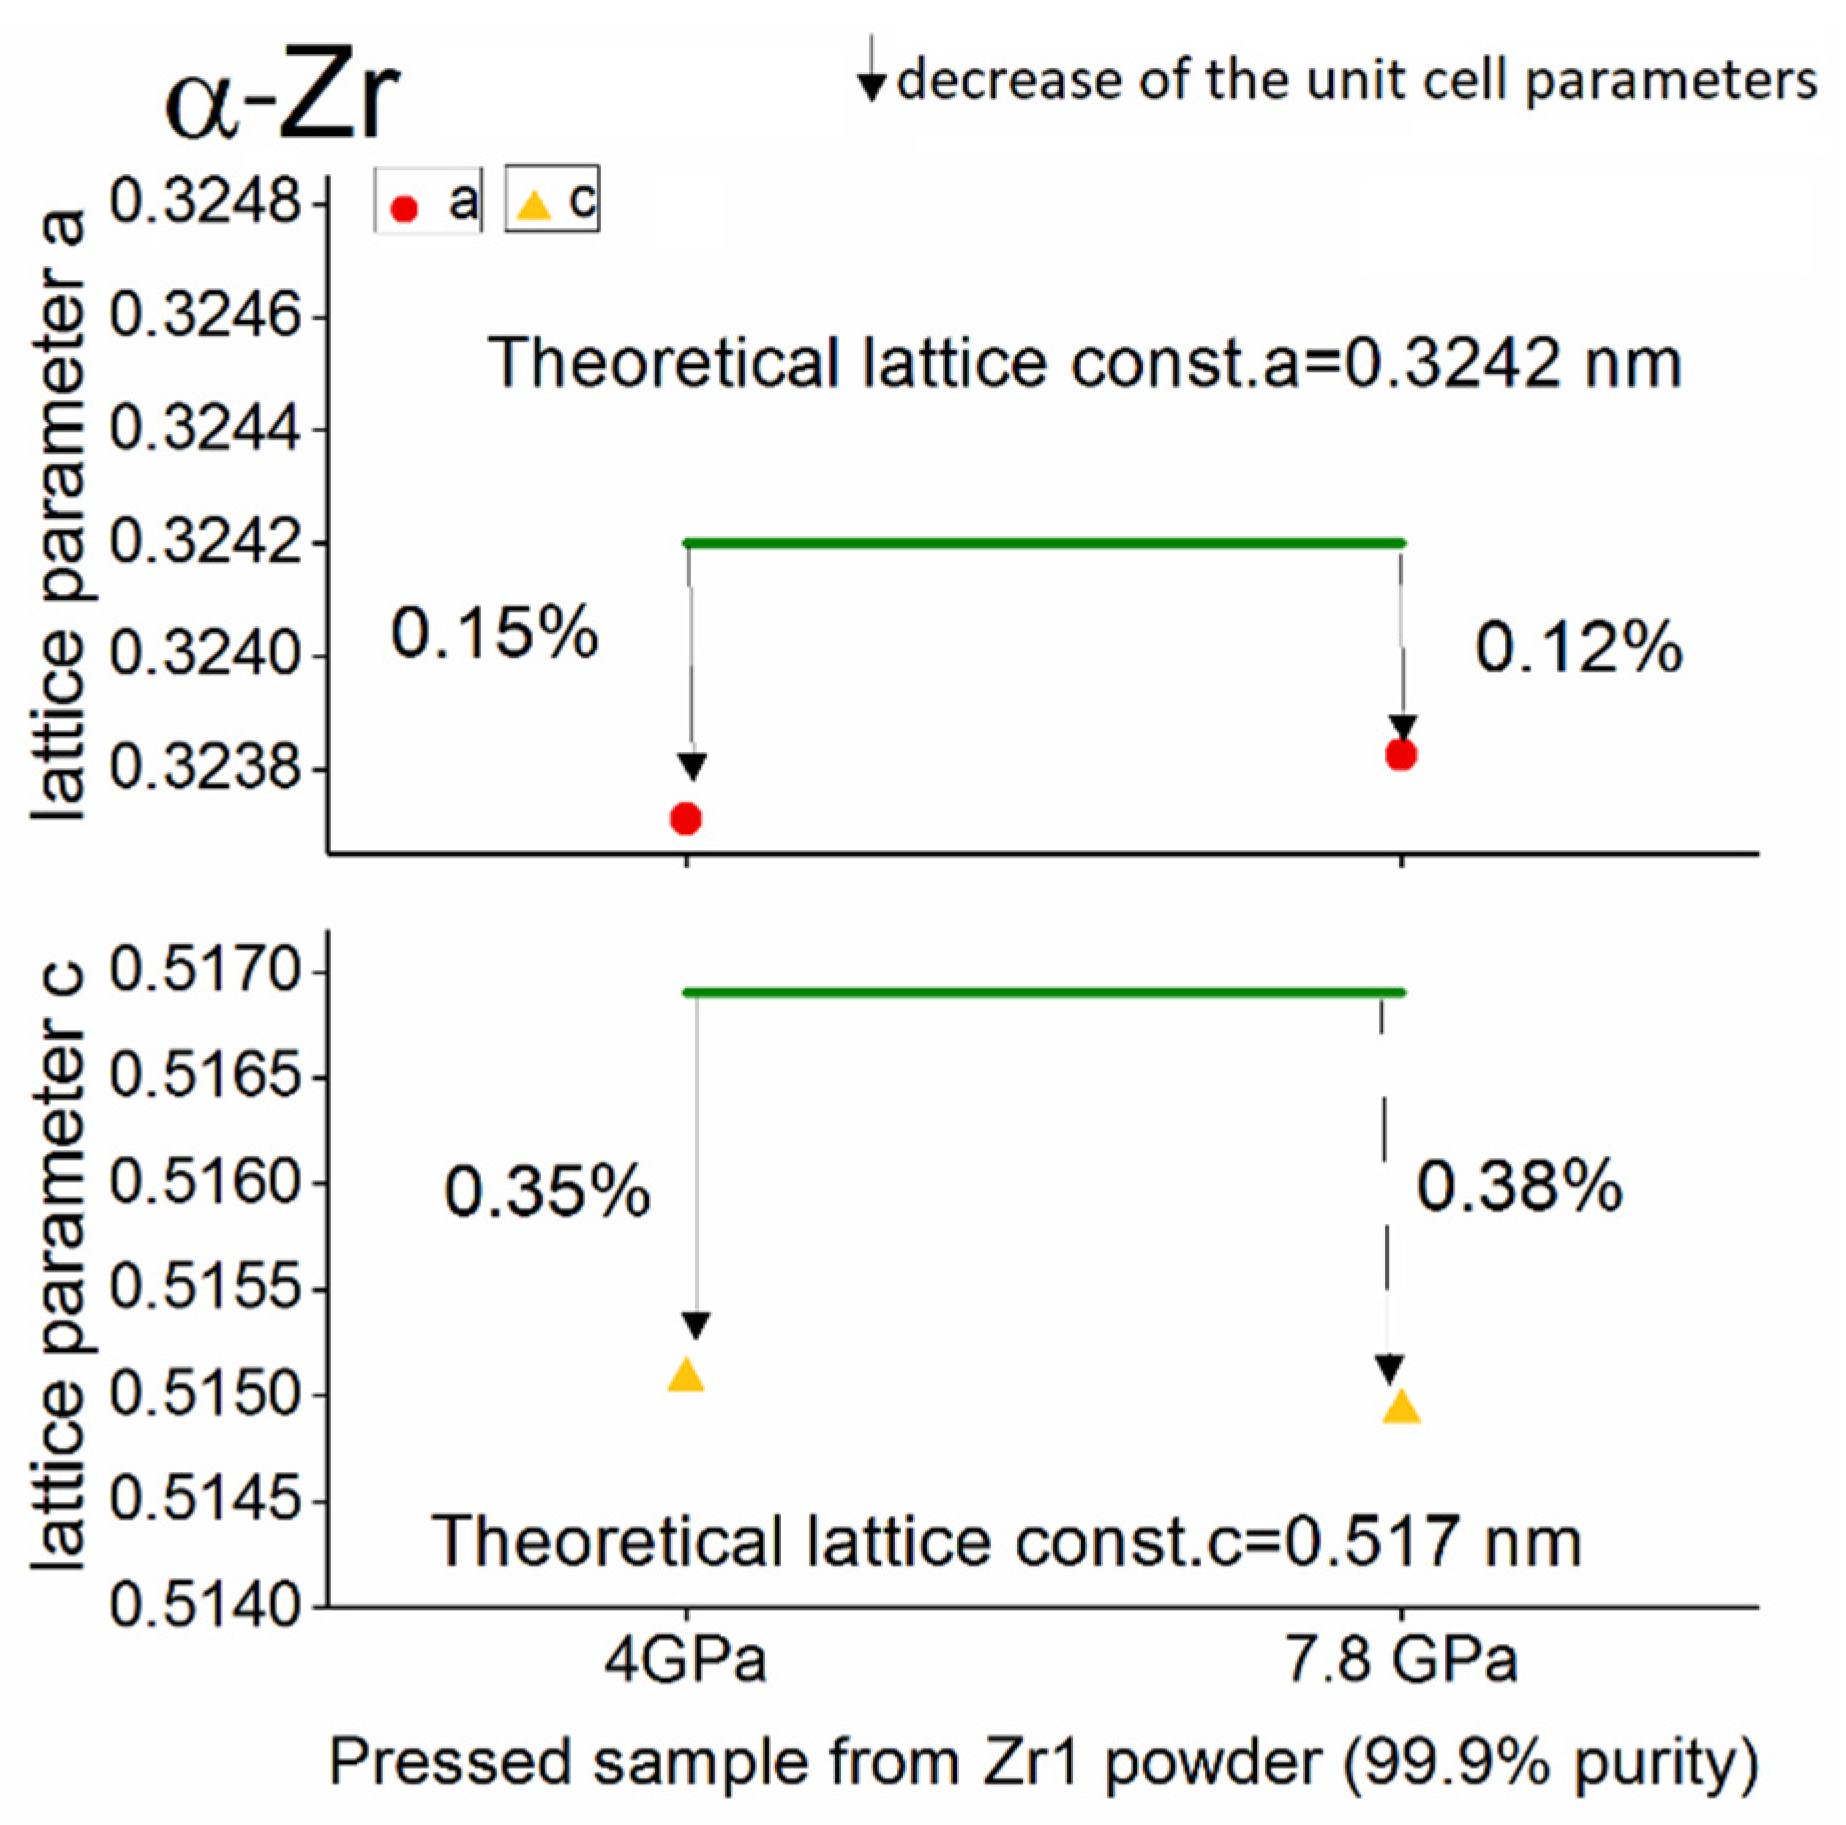
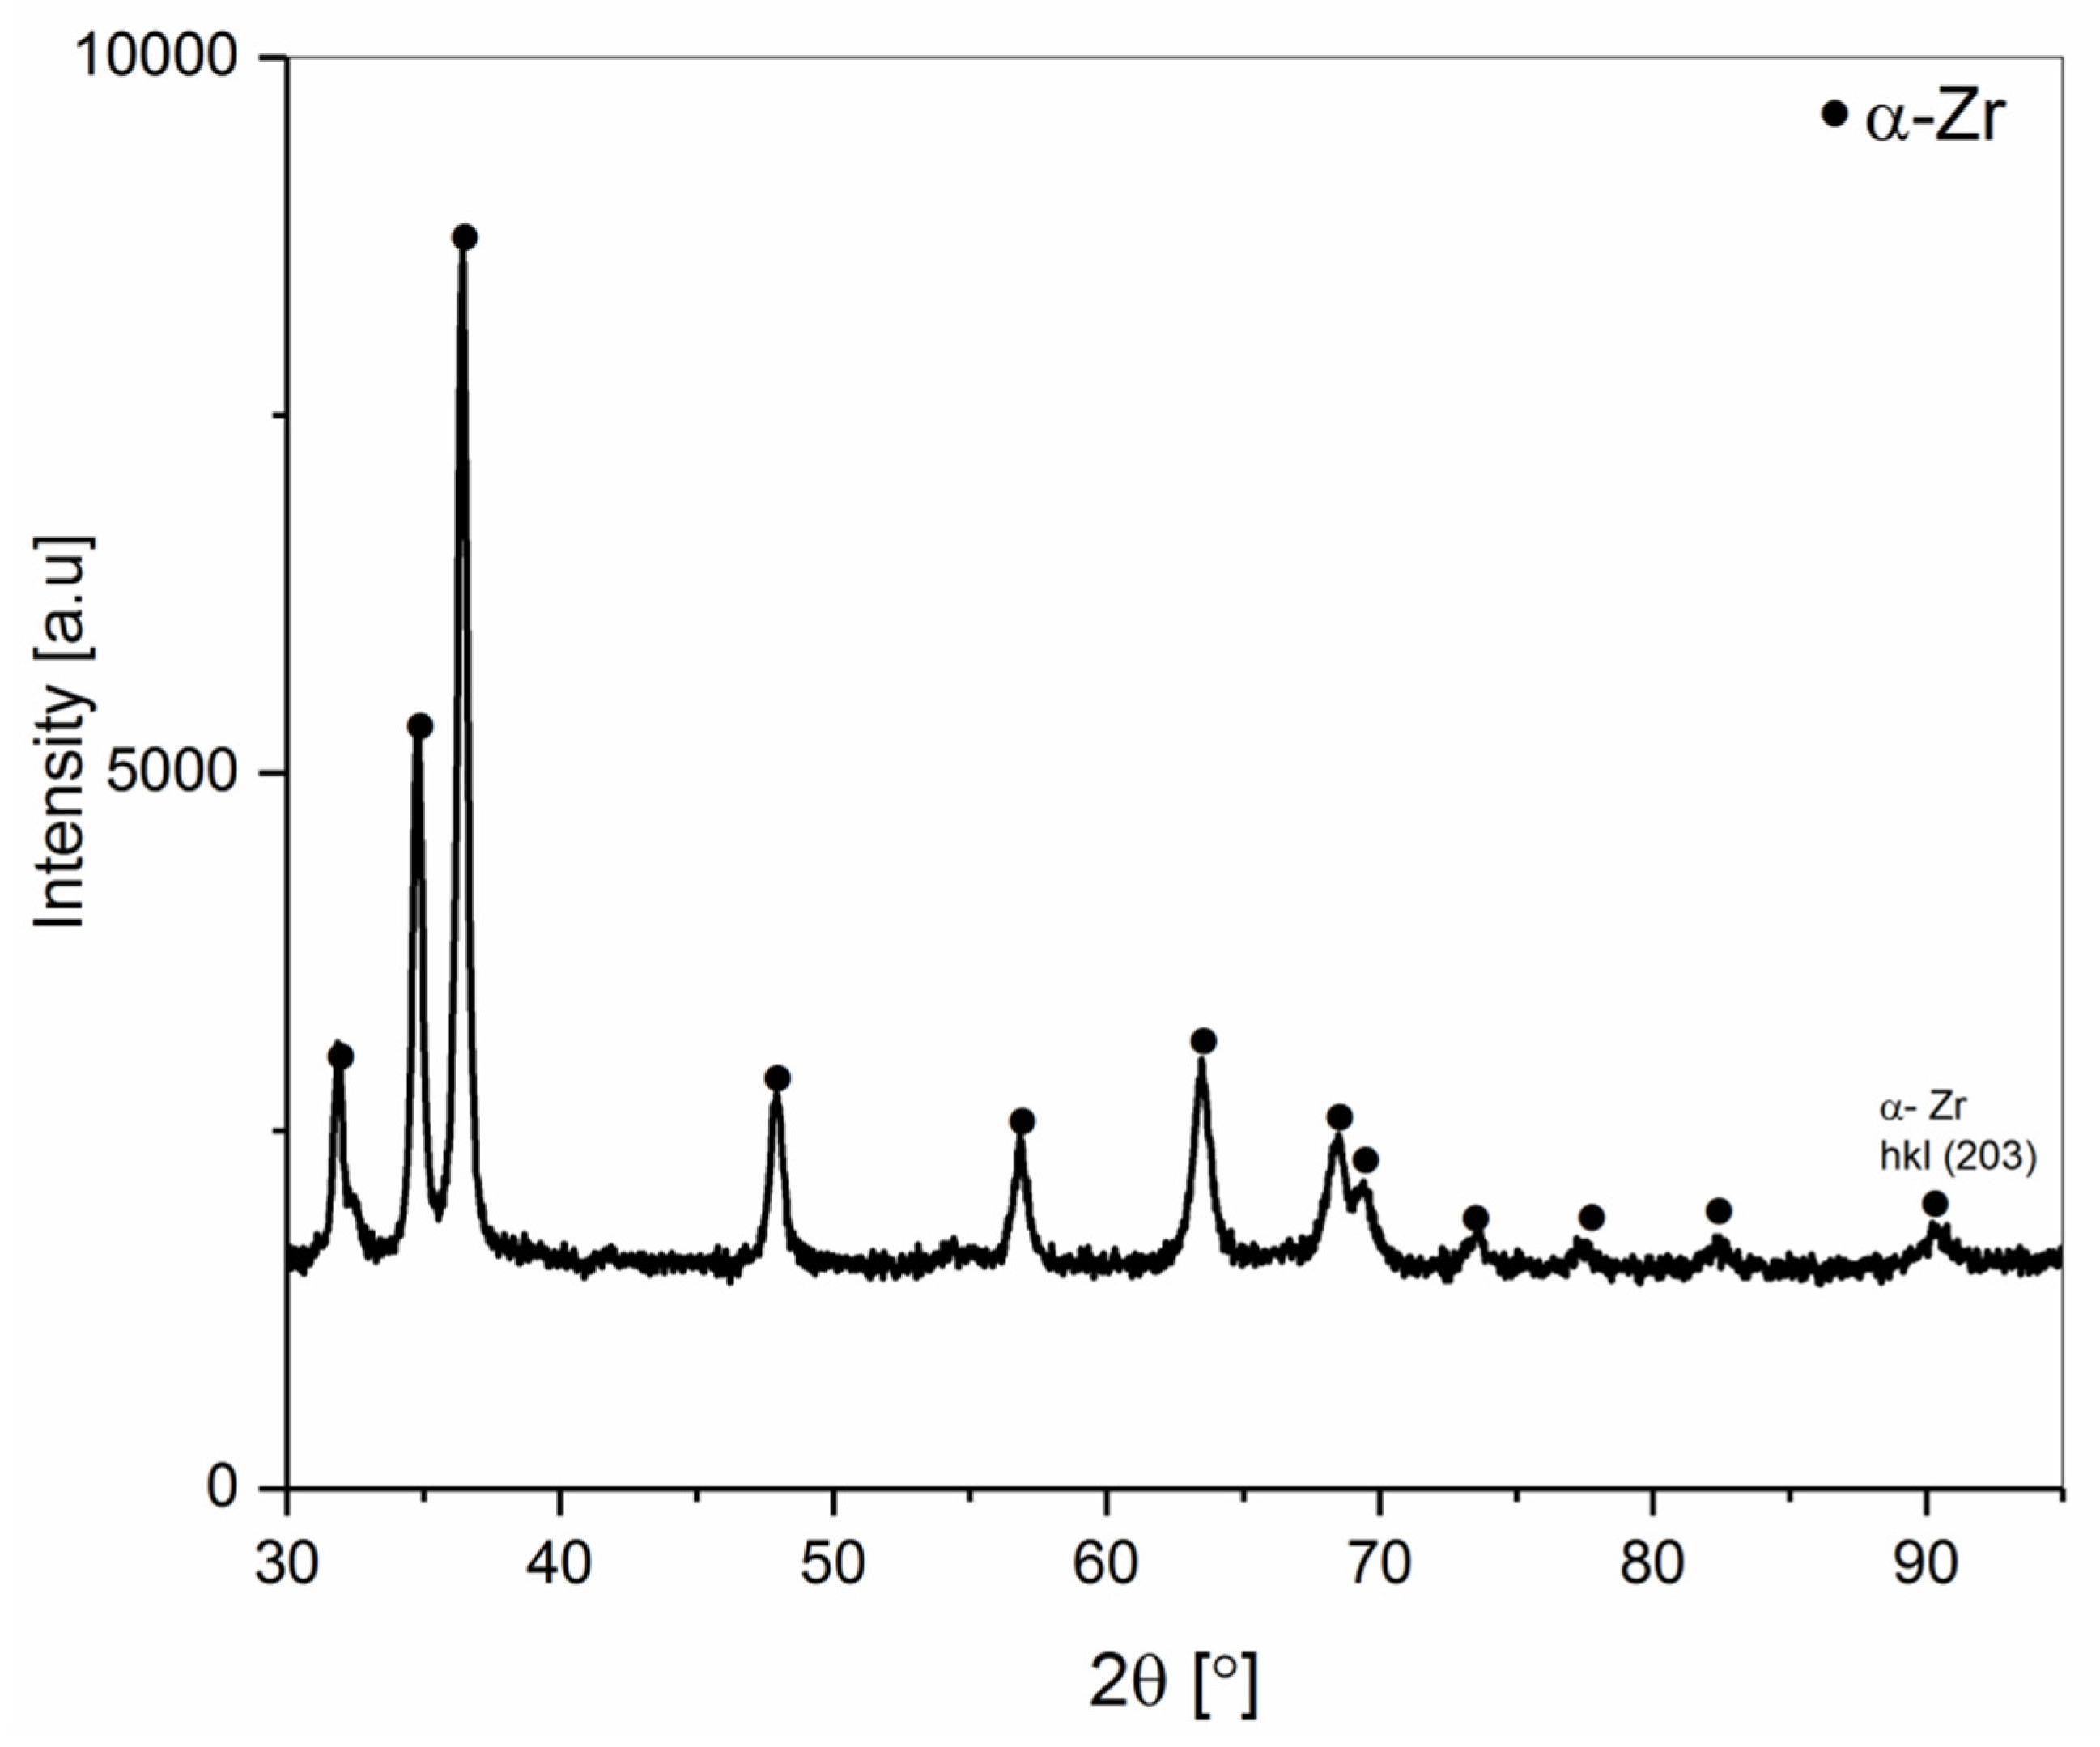
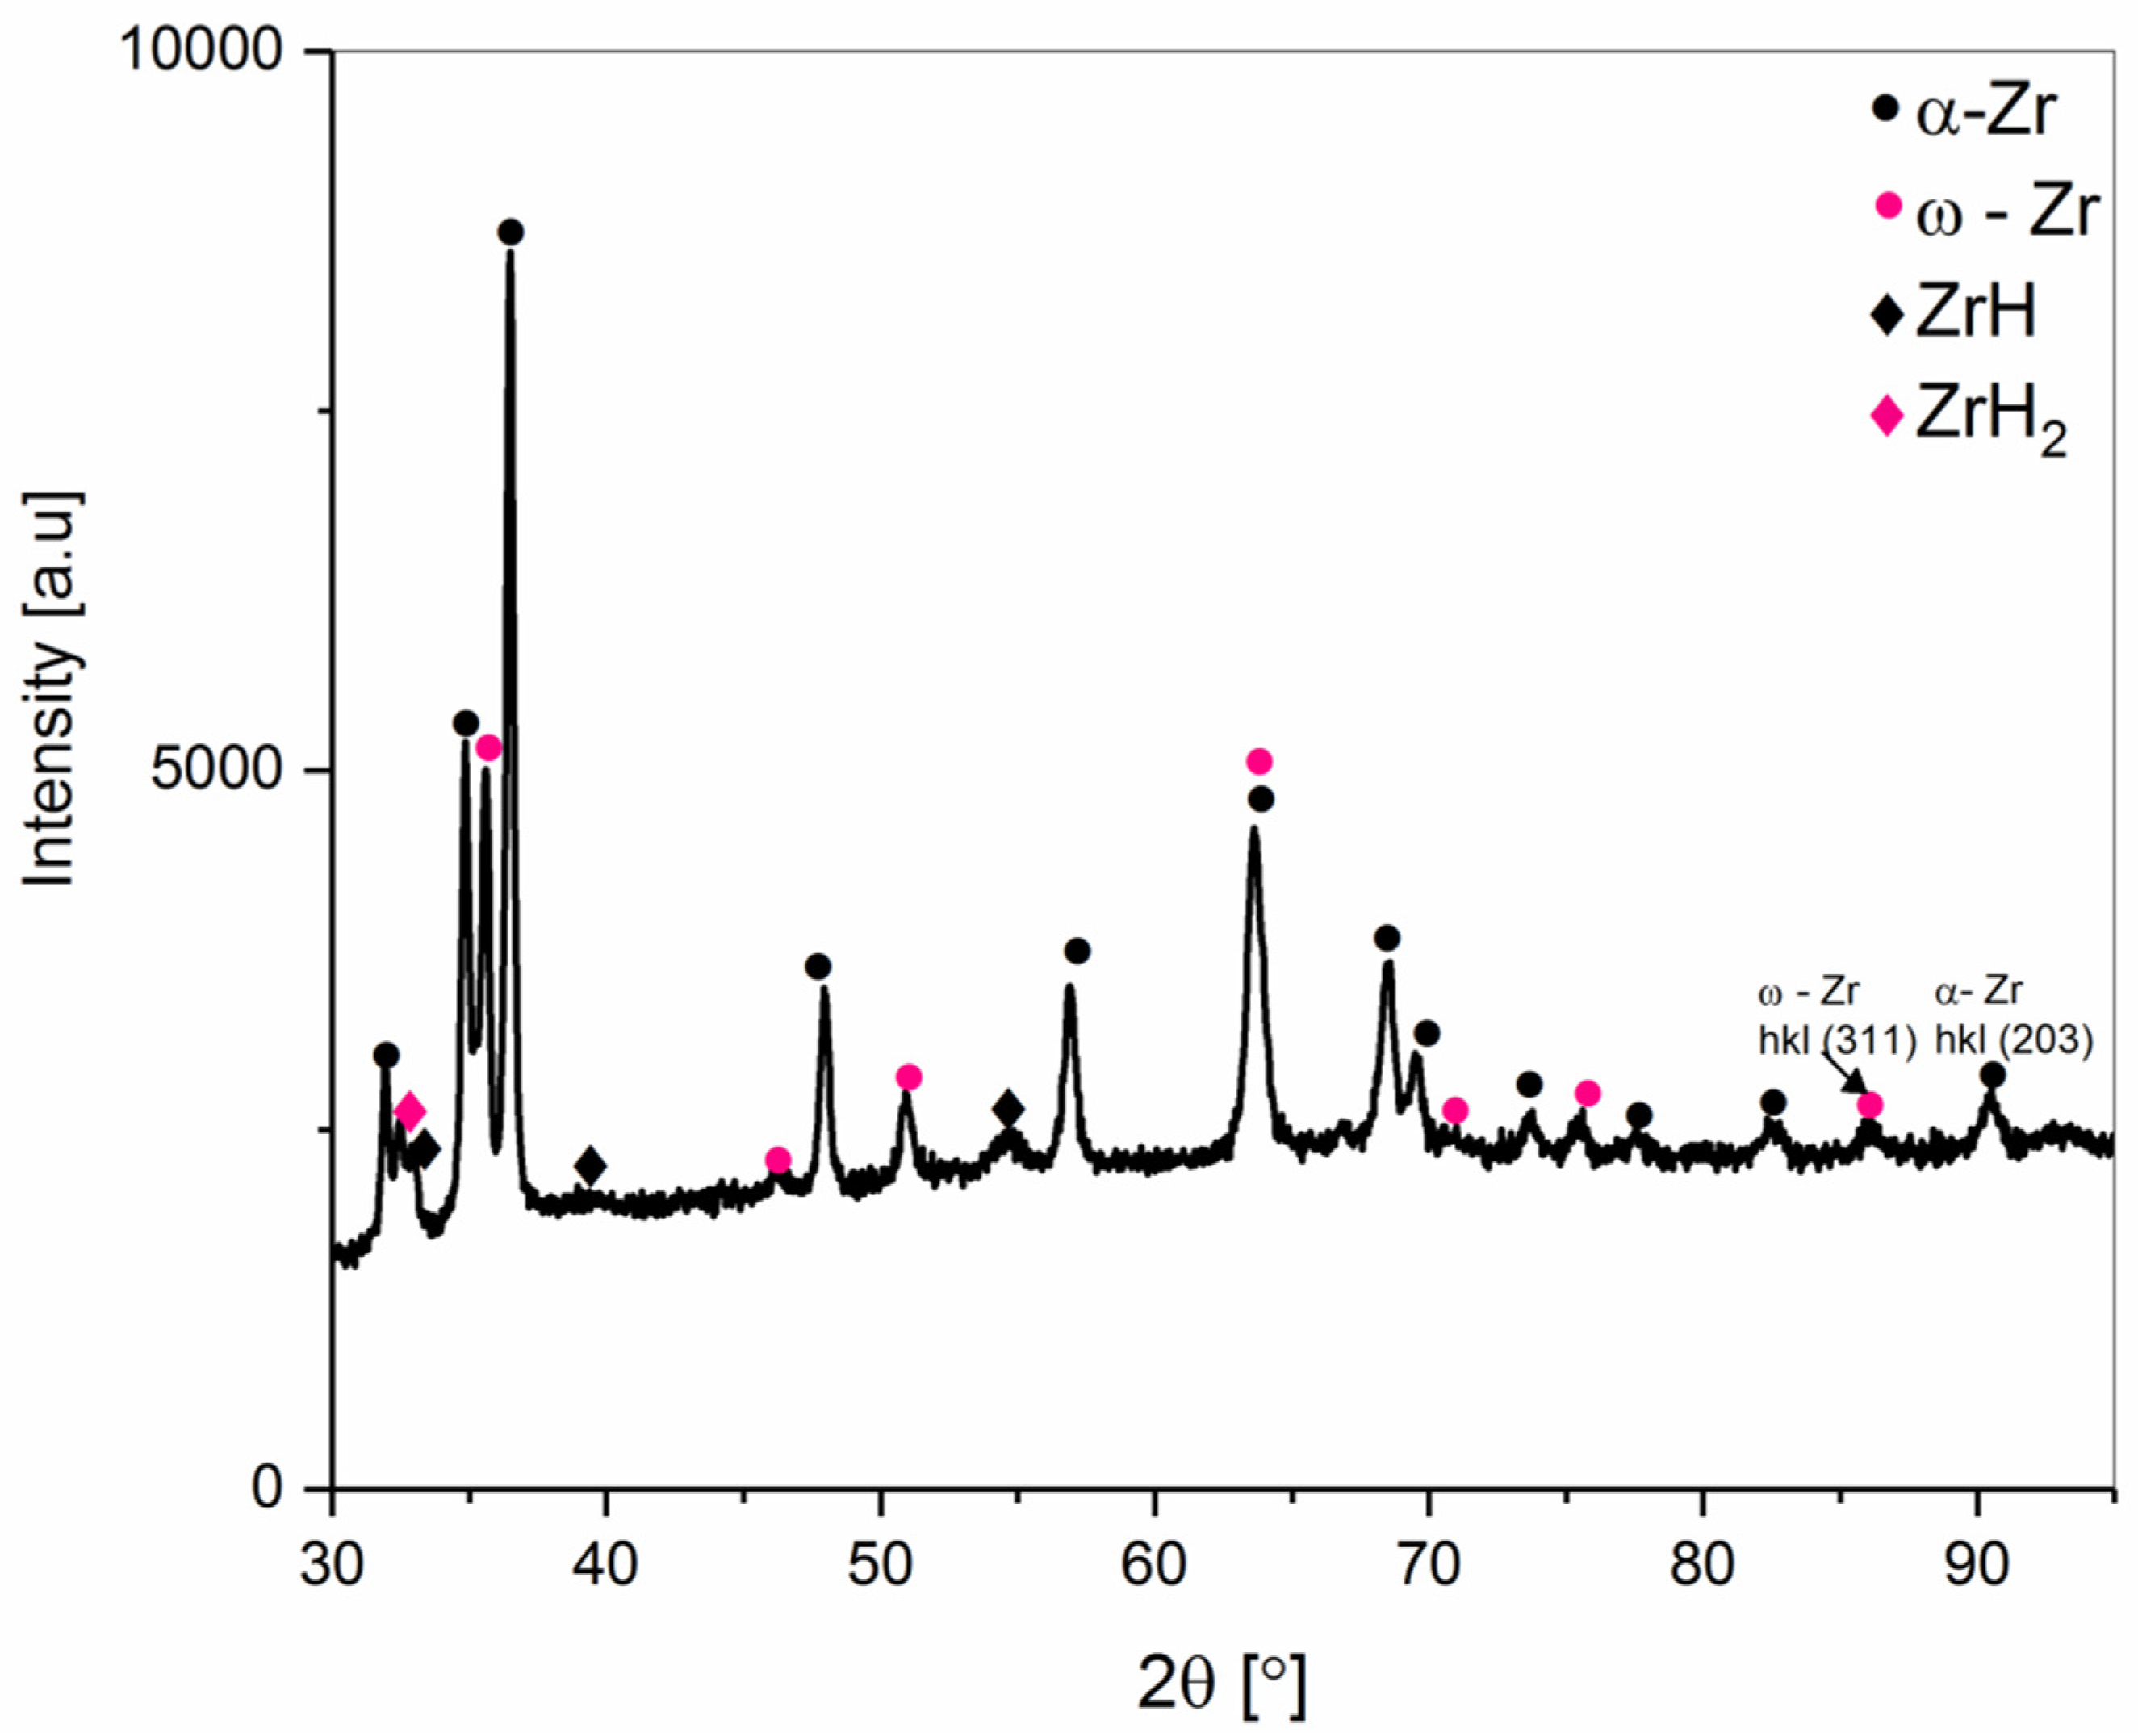
- The pressing of powders under static high-pressure conditions of 7.8 GPa using a Bridgman apparatus led to the transformation of the α-Zr phase into the ω-Zr phase at room temperature. The transformation occurred for zirconium powder of 98.8% purity (with hydrides participation), but did not occur for high purity (99.9%) zirconium powders. After transformation, the ω-Zr content was ~22%.
- The transformation of α-Zr into ω-Zr occurred during the sintering process at 4.0 GPa for both type of zirconium powders (99.9% and 98.8% purity). The amount of ω-Zr phase contents depended on the pressure and the temperature of the HPHT process. The conditions of the transformation process were more dependent on the pressure than on the temperature.
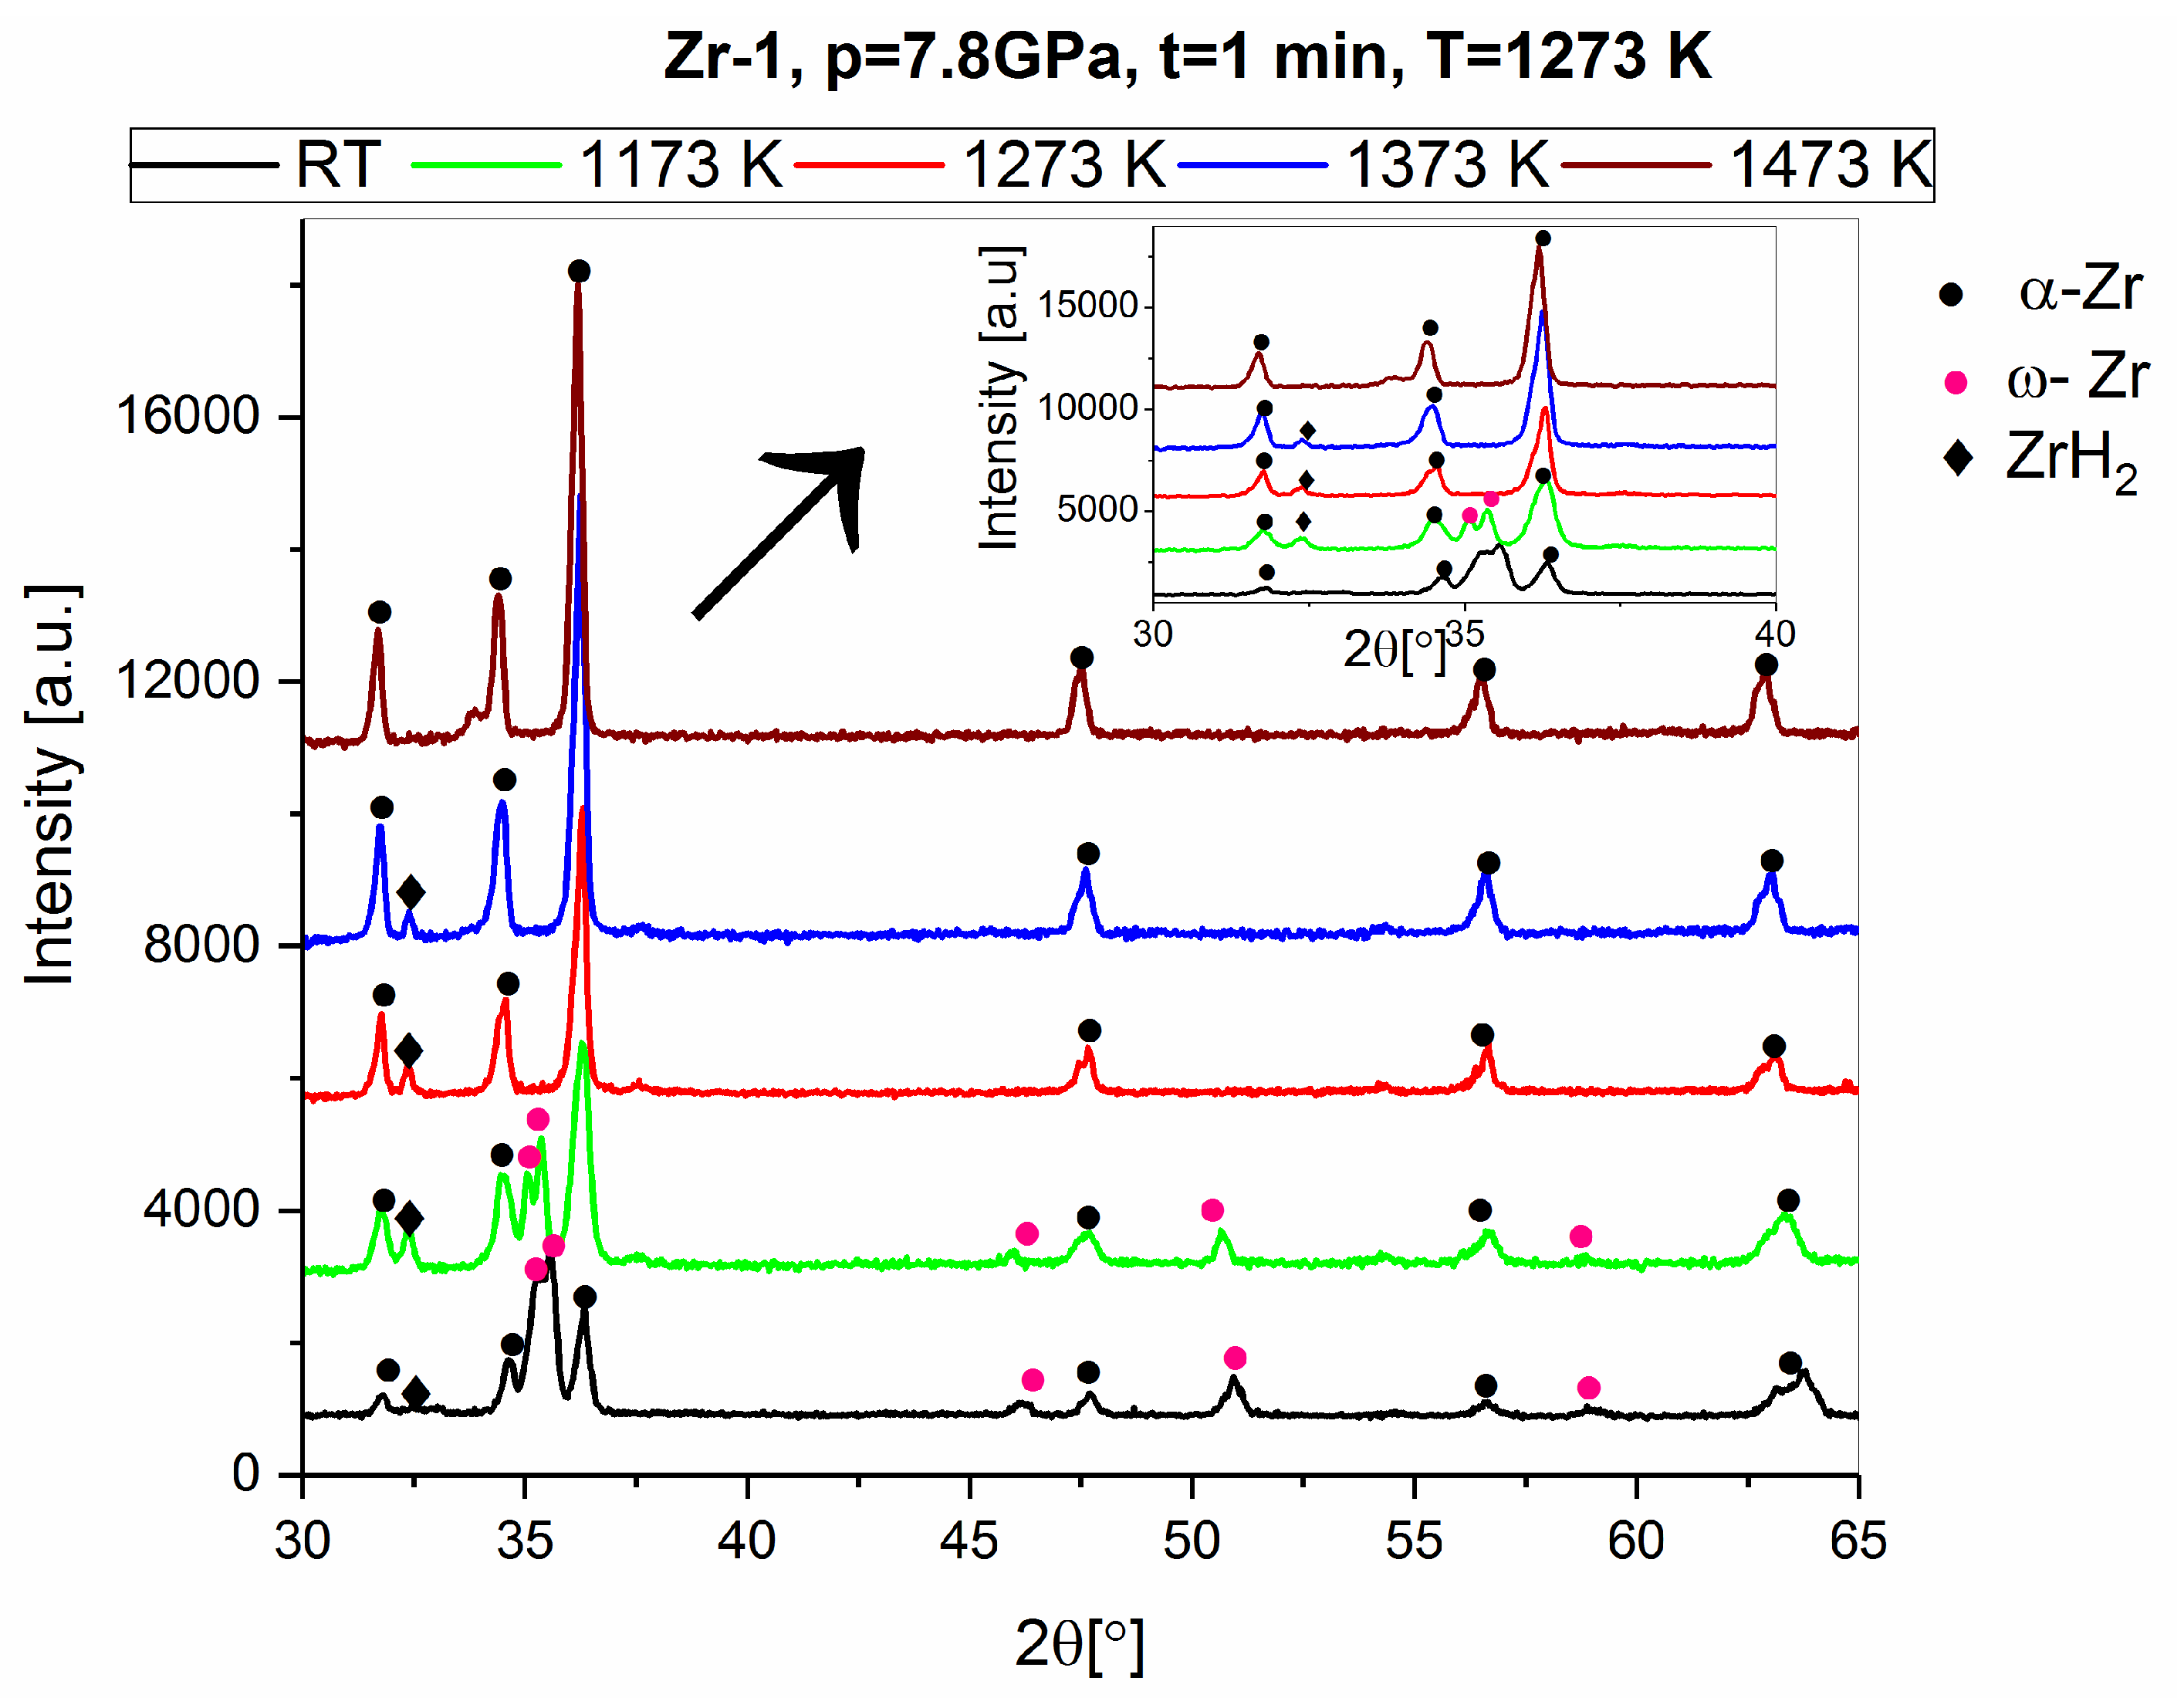
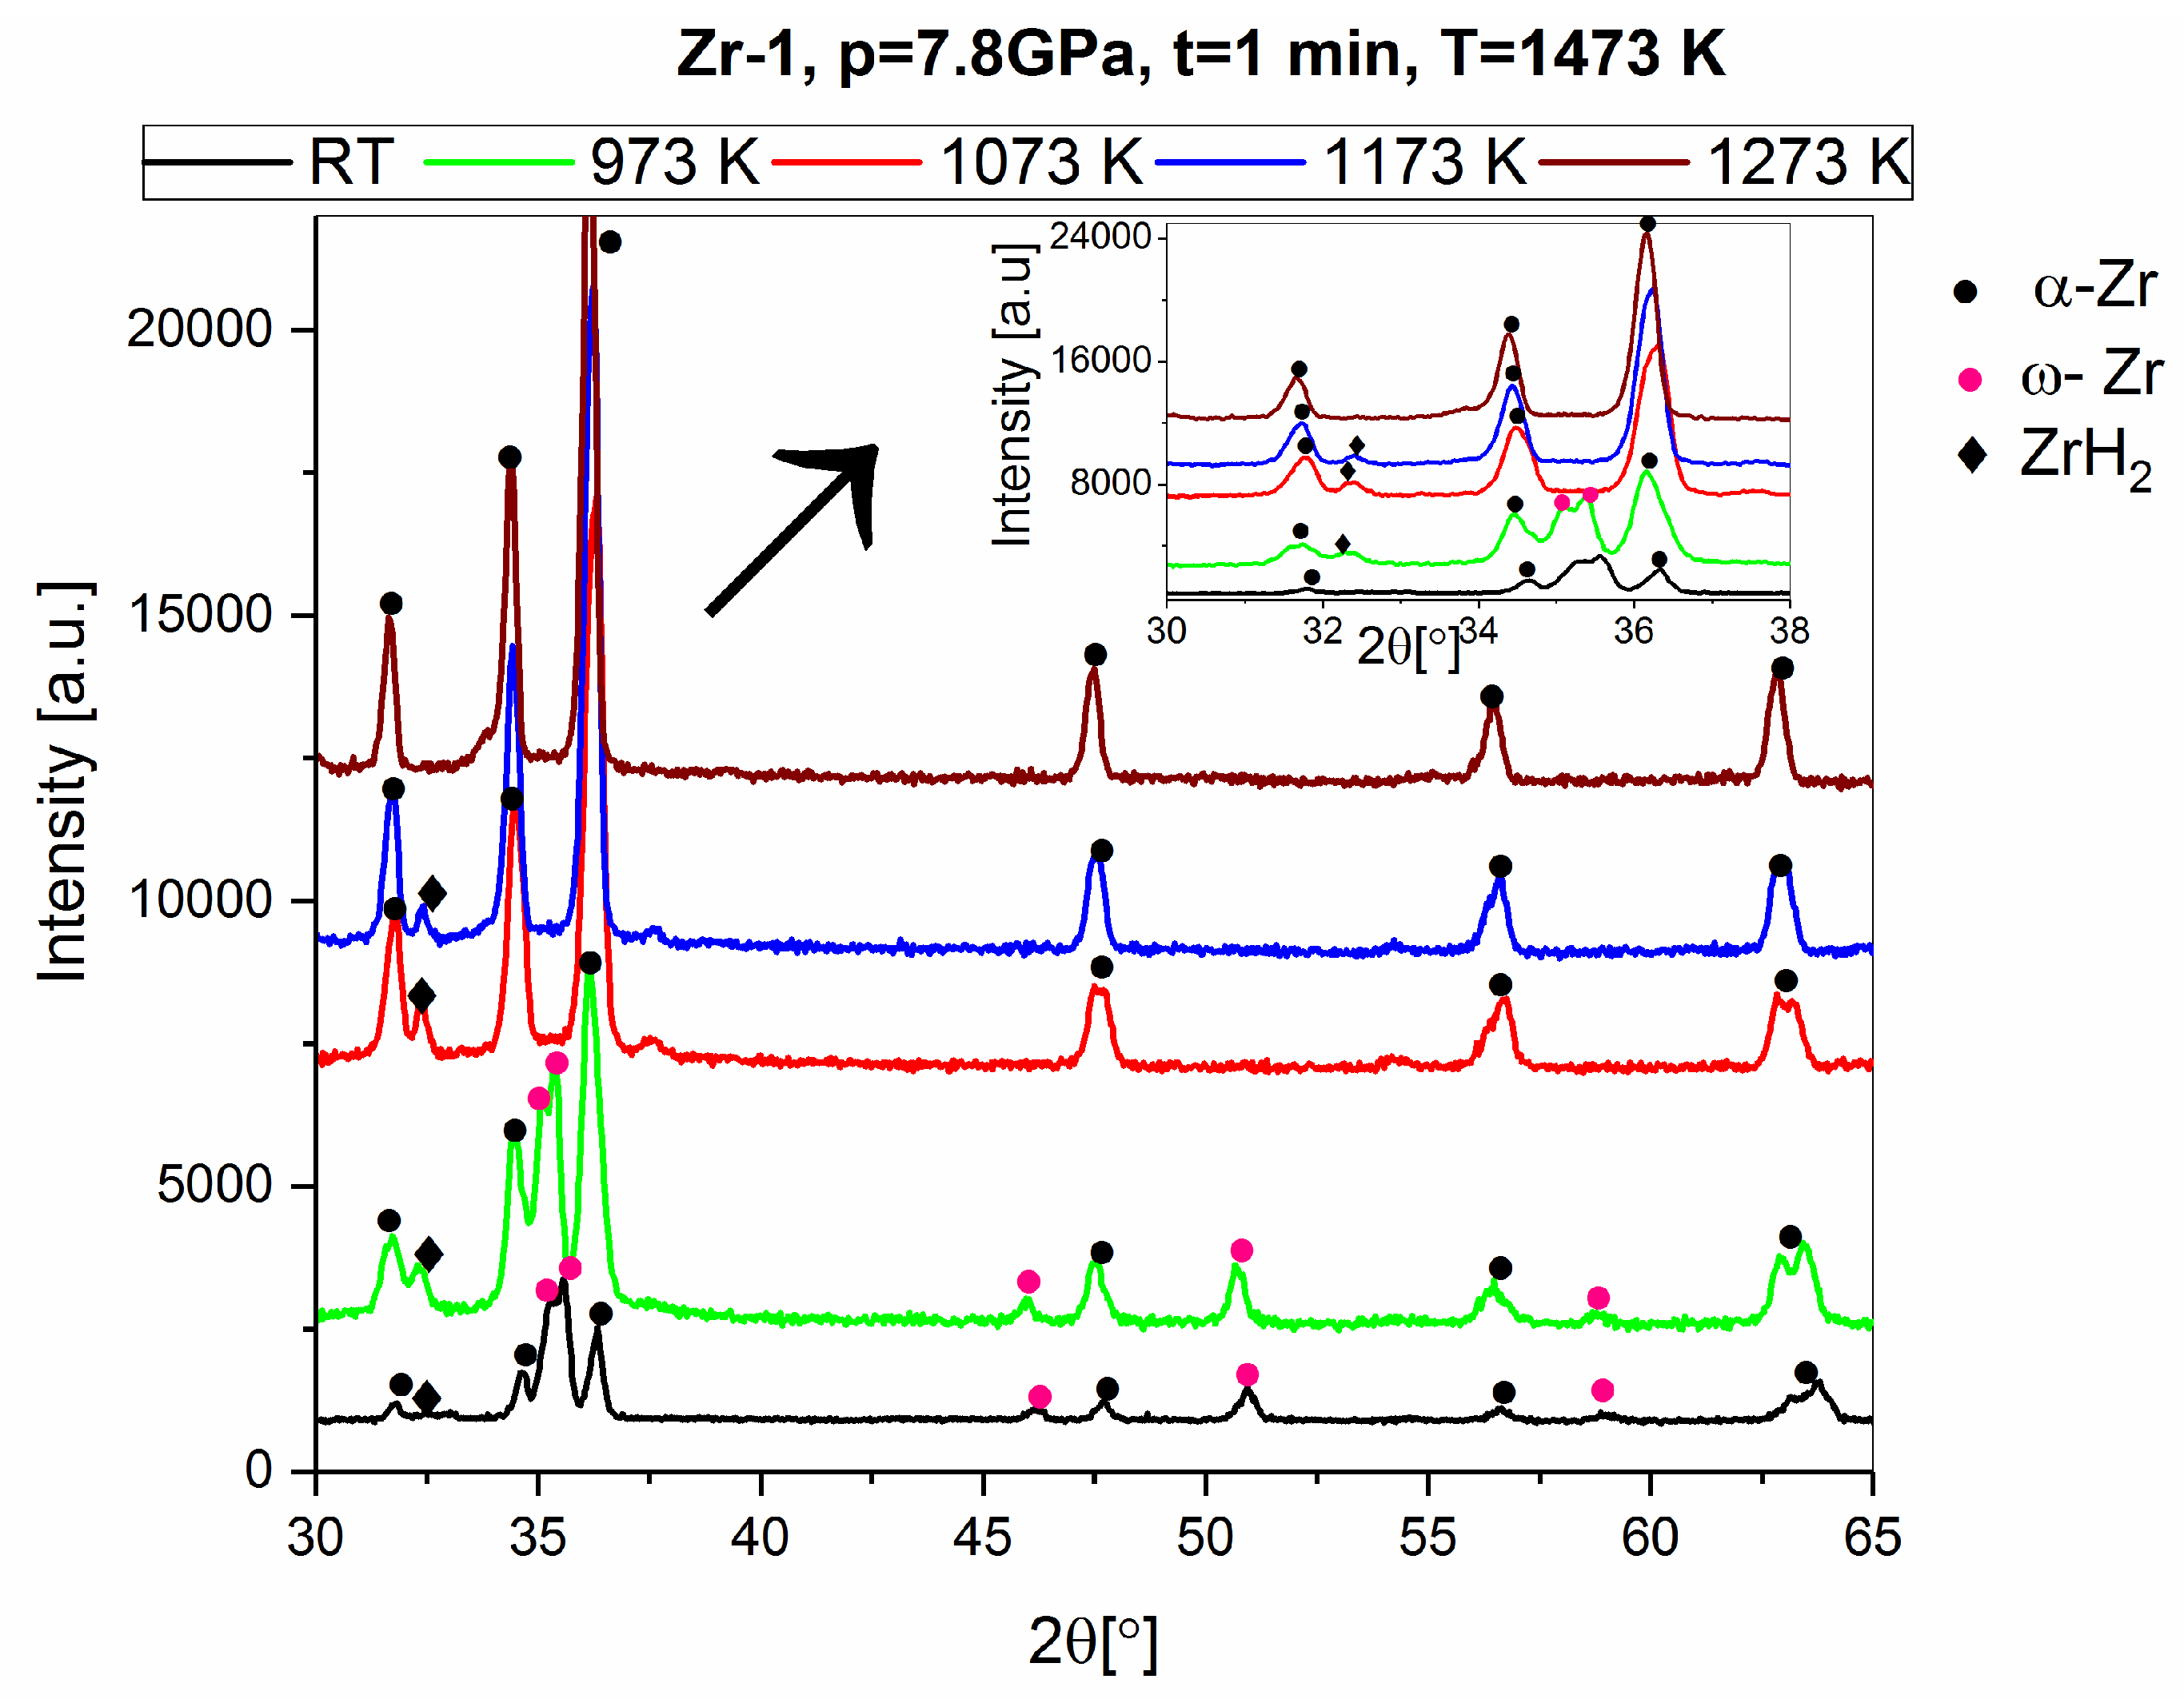
- The highest content of the ω-Zr phase was obtained in the Zr 2 material (98.8% purity with hydrides content) sintered for 1 min at a temperature of 1473 K and a pressure of 7.8 GPa.
- The higher sintering temperature resulted in a decrease of the residual stresses in the ω-Zr phase in the sintered zirconium. The higher levels of stress limited the transformation of the α-Zr phase into the ω-Zr phase.
Author Contributions
Funding
Conflicts of Interest
References
- Sikka, S.K.; Vohra, Y.K.; Chidambaram, R. Omega phase in materials. Prog. Mater. Sci. 1982, 27, 245–310. [Google Scholar] [CrossRef]
- Brown, D.W.; Almer, J.D.; Balogh, L.; Cerreta, E.K.; Clausen, B.; Escobedo-Diaz, J.P.; Sisneros, T.A.; Mosbrucker, P.L.; Tulk, E.F.; Vogel, S.C. Stability of the two-phase (α/ω) microstructure of shocked zirconium. Acta Mater. 2014, 67, 383–394. [Google Scholar] [CrossRef]
- Hu, C.E.; Zeng, Z.Y.; Zhang, L.; Chen, X.R.; Cai, L.C. Density functional study of the phase diagram and thermodynamic properties of Zr. Comput. Mater. Sci. 2011, 50, 835–840. [Google Scholar] [CrossRef]
- Sanati, M.; Saxena, A.; Lookman, T.; Albers, R.C. Landau free energy for a bcc-hcp reconstructive phase transformation. Phys. Rev. B 2001, 63, 224114. [Google Scholar] [CrossRef]
- Song, S.G.; Gray, G.T. Microscopic and crystallographic aspects of retained omega phase in shock-loaded zirconium and its formation mechanism. Philos. Mag. A Phys. Condens. Matter Struct. Defects Mech. Prop. 1995, 71, 275–290. [Google Scholar] [CrossRef]
- Jamieson, J.C. Crystal structures of titanium, zirconium, and hafnium at high pressures. Science (80-) 1963, 140, 72–73. [Google Scholar] [CrossRef] [PubMed]
- Jyoti, G.; Joshi, K.D.; Gupta, S.C.; Sikka, S.K.; Dey, G.K.; Banerjee, S. Crystallography of the α → o transition in shock-loaded zirconium. Philos. Mag. Lett. 1997, 75, 291–300. [Google Scholar] [CrossRef]
- Vohra, Y.K. Kinetics of phase transformations in Ti, Zr and Hf under static and dynamic pressures. J. Nucl. Mater. 1978, 75, 288–293. [Google Scholar] [CrossRef]
- Cerreta, E.; Gray, G.T.; Hixson, R.S.; Rigg, P.A.; Brown, D.W. The influence of interstitial oxygen and peak pressure on the shock loading behavior of zirconium. Acta Mater. 2005, 53, 1751–1758. [Google Scholar] [CrossRef]
- Bridgman, P.W. The Resistance of 72 Elements, Alloys and Compounds to 100,000 Kg/Cm2. Proc. Am. Acad. Arts Sci. 2010, 81, 165. [Google Scholar] [CrossRef]
- Rabinkin, A.; Talianker, M.; Botstein, O. Crystallography and a model of the α → ω phase transformation in zirconium. Acta Metall. 1981, 29, 691–698. [Google Scholar] [CrossRef]
- Yu, X.; Zhang, R.; Weldon, D.; Vogel, S.C.; Zhang, J.; Brown, D.W.; Wang, Y.; Reiche, H.M.; Wang, S.; Du, S.; et al. High Pressure Phase-Transformation Induced Texture Evolution and Strengthening in Zirconium Metal: Experiment and Modeling. Sci. Rep. 2015, 5. [Google Scholar] [CrossRef] [PubMed]
- Xia, H.; Ruoff, A.L.; Vohra, Y.K. Temperature dependence of the -bcc phase transition in zirconium metal. Phys. Rev. B 1991, 44, 10374–10376. [Google Scholar] [CrossRef] [PubMed]
- Ming, L.C.; Manghnani, M.H.; Katahara, K.W. Investigation of a→w transformation in the Zr-Hf system to 42 GPa. J. Appl. Phys. 1981, 52, 1332–1335. [Google Scholar] [CrossRef]
- Dobromyslov, A.V.; Kazantseva, N.V. Formation of metastable ω-phase in Zr-Fe, Zr-Co, Zr-Ni, and Zr-Cu alloys. Scr. Mater. 1997, 37, 615–620. [Google Scholar] [CrossRef]
- Pichon, L.; Girardeau, T.; Lignou, F.; Straboni, A. Evidence of ω-phase in ion beam sputtered zirconium thin films. Thin Solid Films 1999, 342, 93–99. [Google Scholar] [CrossRef]
- Guan, S.H.; Liu, Z.P. Anisotropic kinetics of solid phase transition from first principles: Alpha-omega phase transformation of Zr. Phys. Chem. Chem. Phys. 2016, 18, 4527–4534. [Google Scholar] [CrossRef]
- Cerreta, E.K.; Escobedo, J.P.; Rigg, P.A.; Trujillo, C.P.; Brown, D.W.; Sisneros, T.A.; Clausen, B.; Lopez, M.F.; Lookman, T.; Bronkhorst, C.A.; et al. The influence of phase and substructural evolution during dynamic loading on subsequent mechanical properties of zirconium. Acta Mater. 2013, 61, 7712–7719. [Google Scholar] [CrossRef]
- Low, T.S.E.; Brown, D.W.; Welk, B.A.; Cerreta, E.K.; Okasinski, J.S.; Niezgoda, S.R. Isothermal annealing of shocked zirconium: Stability of the two-phase α / ω microstructure. Acta Mater. 2015, 91, 101–111. [Google Scholar] [CrossRef]
- McCusker, L.B.; Von Dreele, R.B.; Cox, D.E.; Louër, D.; Scardi, P. Rietveld refinement guidelines. J. Appl. Crystallogr. 1999, 32, 36–50. [Google Scholar] [CrossRef]
- Yamanaka, S.; Miyake, M.; Katsura, M. Study on the hydrogen solubility in zirconium alloys. J. Nucl. Mater. 1997, 247, 315–321. [Google Scholar] [CrossRef]
- Bair, J.; Asle Zaeem, M.; Tonks, M. A review on hydride precipitation in zirconium alloys. J. Nucl. Mater. 2015, 466, 12–20. [Google Scholar] [CrossRef]
- Van Sinh, N.; Hai, T.D.; Hien, T.T.; Van Tien, D.; Anh, C.P.; Mai, T.P.; Giang, D.T.; Duc, N.M. Study on Preparing Zirconium Powder by Metal-Thermic Method Using Calcium; VAEC-AR--08; International Atomic Energy Agency (IAEA): Vienna, Austria, 2010. [Google Scholar]
- Noyan, I.C.; Cohen, J.B. Residual Stress—Measurement by Diffraction and Interpretation; Springer: Berlin/Heidelberg, Germany, 1987; ISBN 0387963782. [Google Scholar]
- Noyan, I.C.; Cohen, J.B.; Noyan, I.C.; Cohen, J.B. Analysis of Residual Stress Fields Using Linear Elasticity Theory. In Residual Stress; Springer: Berlin/Heidelberg, Germany, 2011; pp. 47–74. [Google Scholar]
- Kutsar, A.R.; Lyasotski, I.V.; Podurets, A.M.; Sanches-Bolinches, A.F. Omega phase of zirconium: Formation under shock wave compressin and stability at atmospheric pressure. High Press. Sci. Technol. 1990, 4, 475–477. [Google Scholar] [CrossRef]


| Powder Determination | Zr 1 | Zr 2 |
|---|---|---|
| Supplier/supply procedure | BIMOTECH, Poland/in an aqueous suspension | KAMB, Poland/in an aqueous suspension |
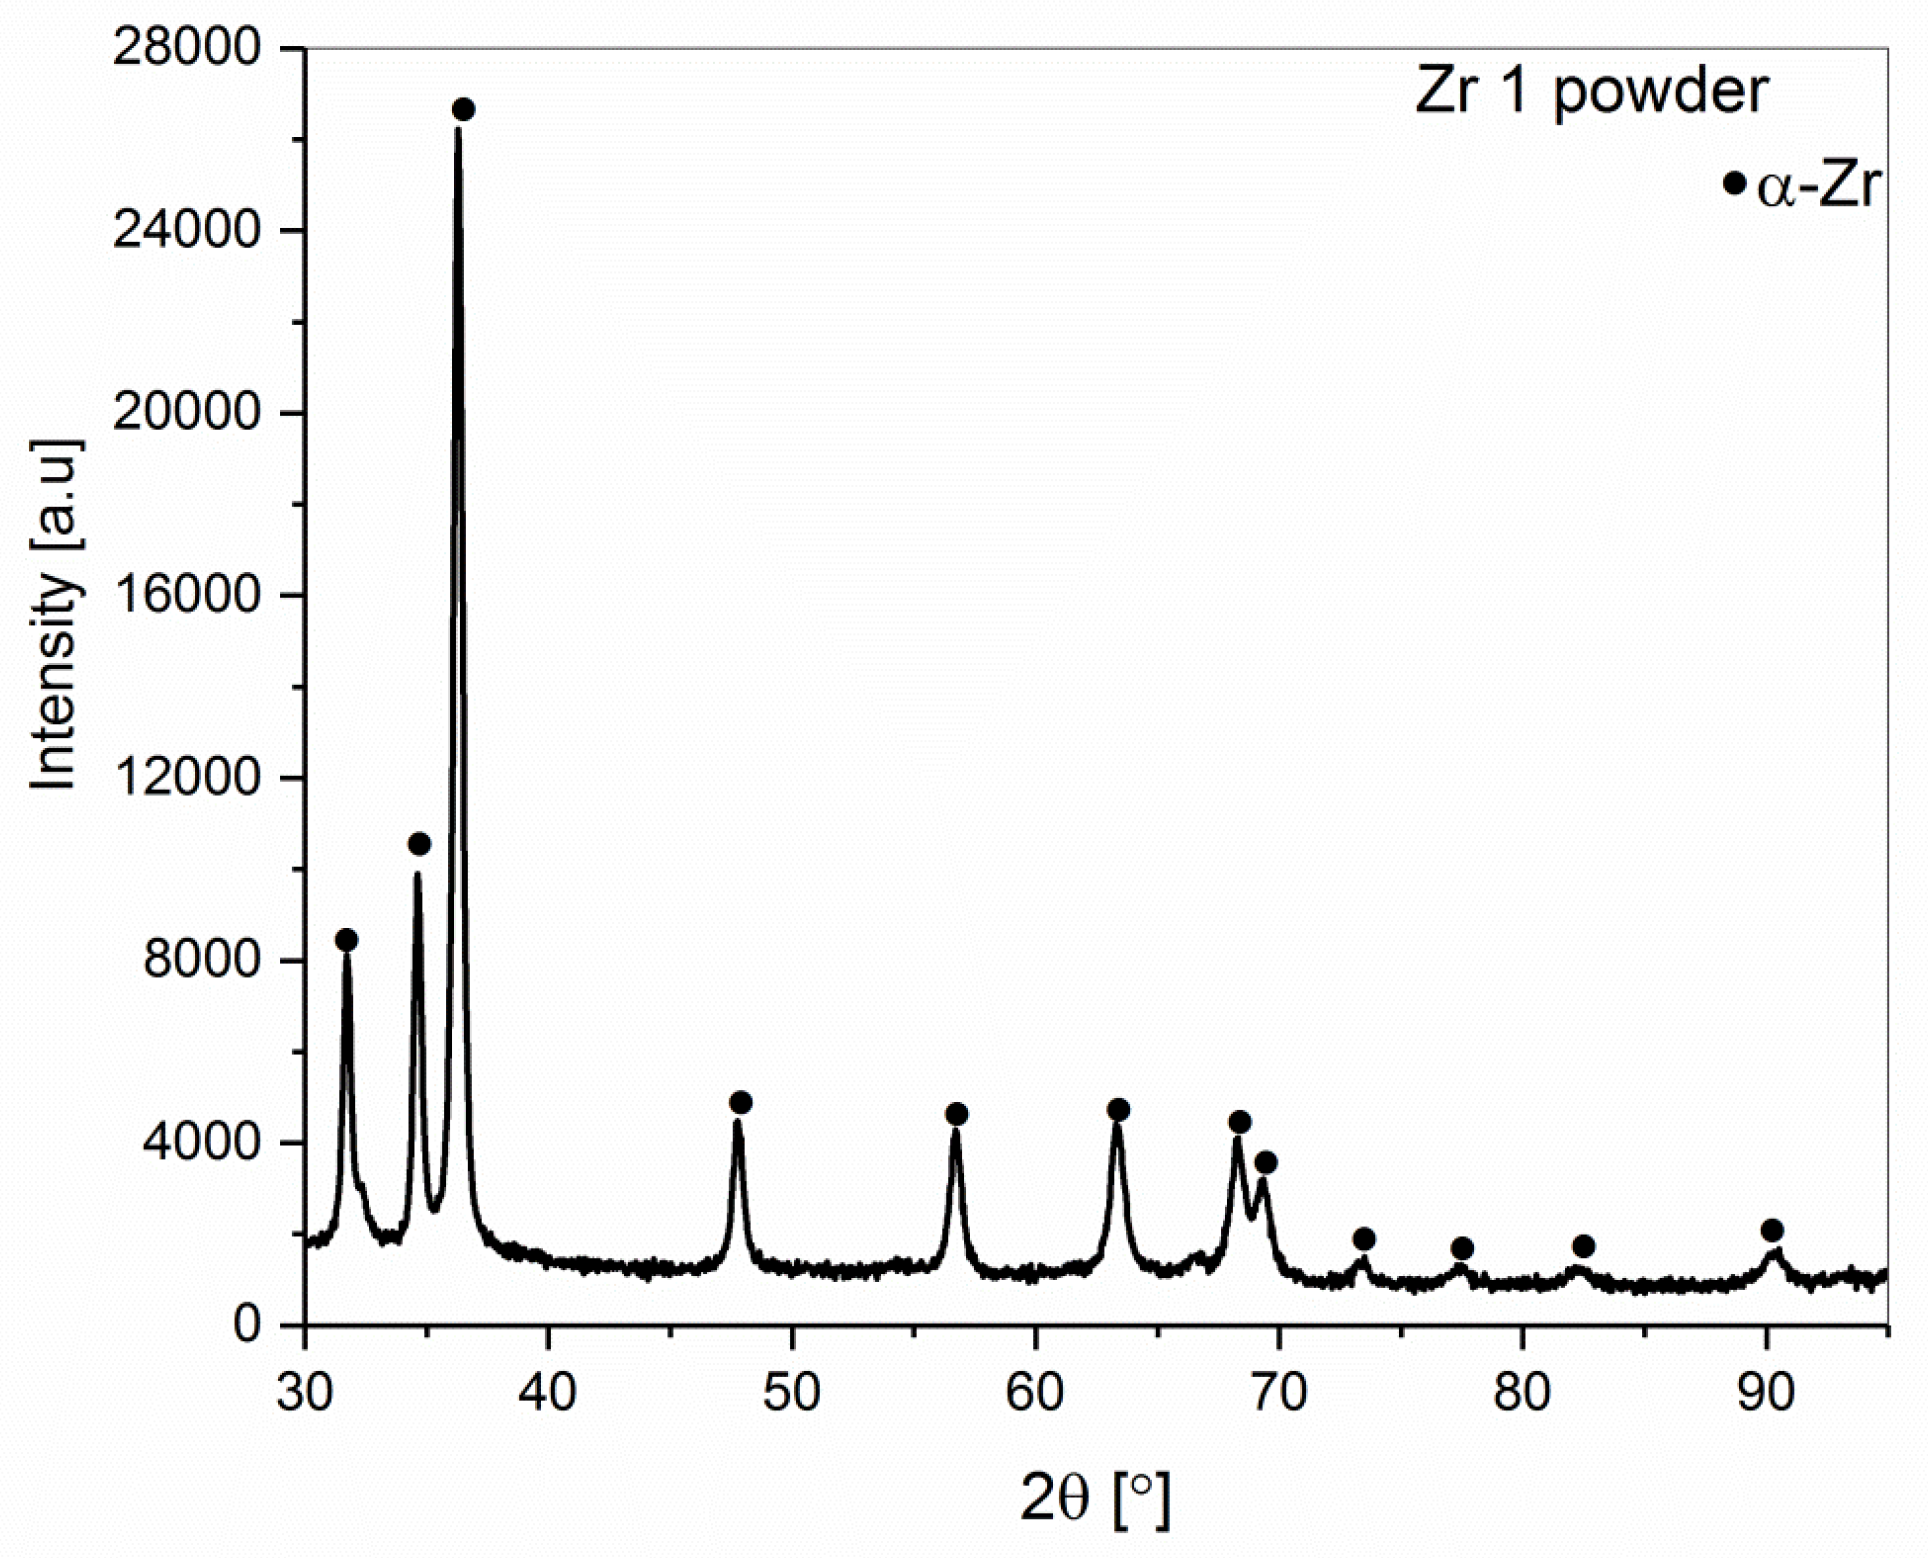
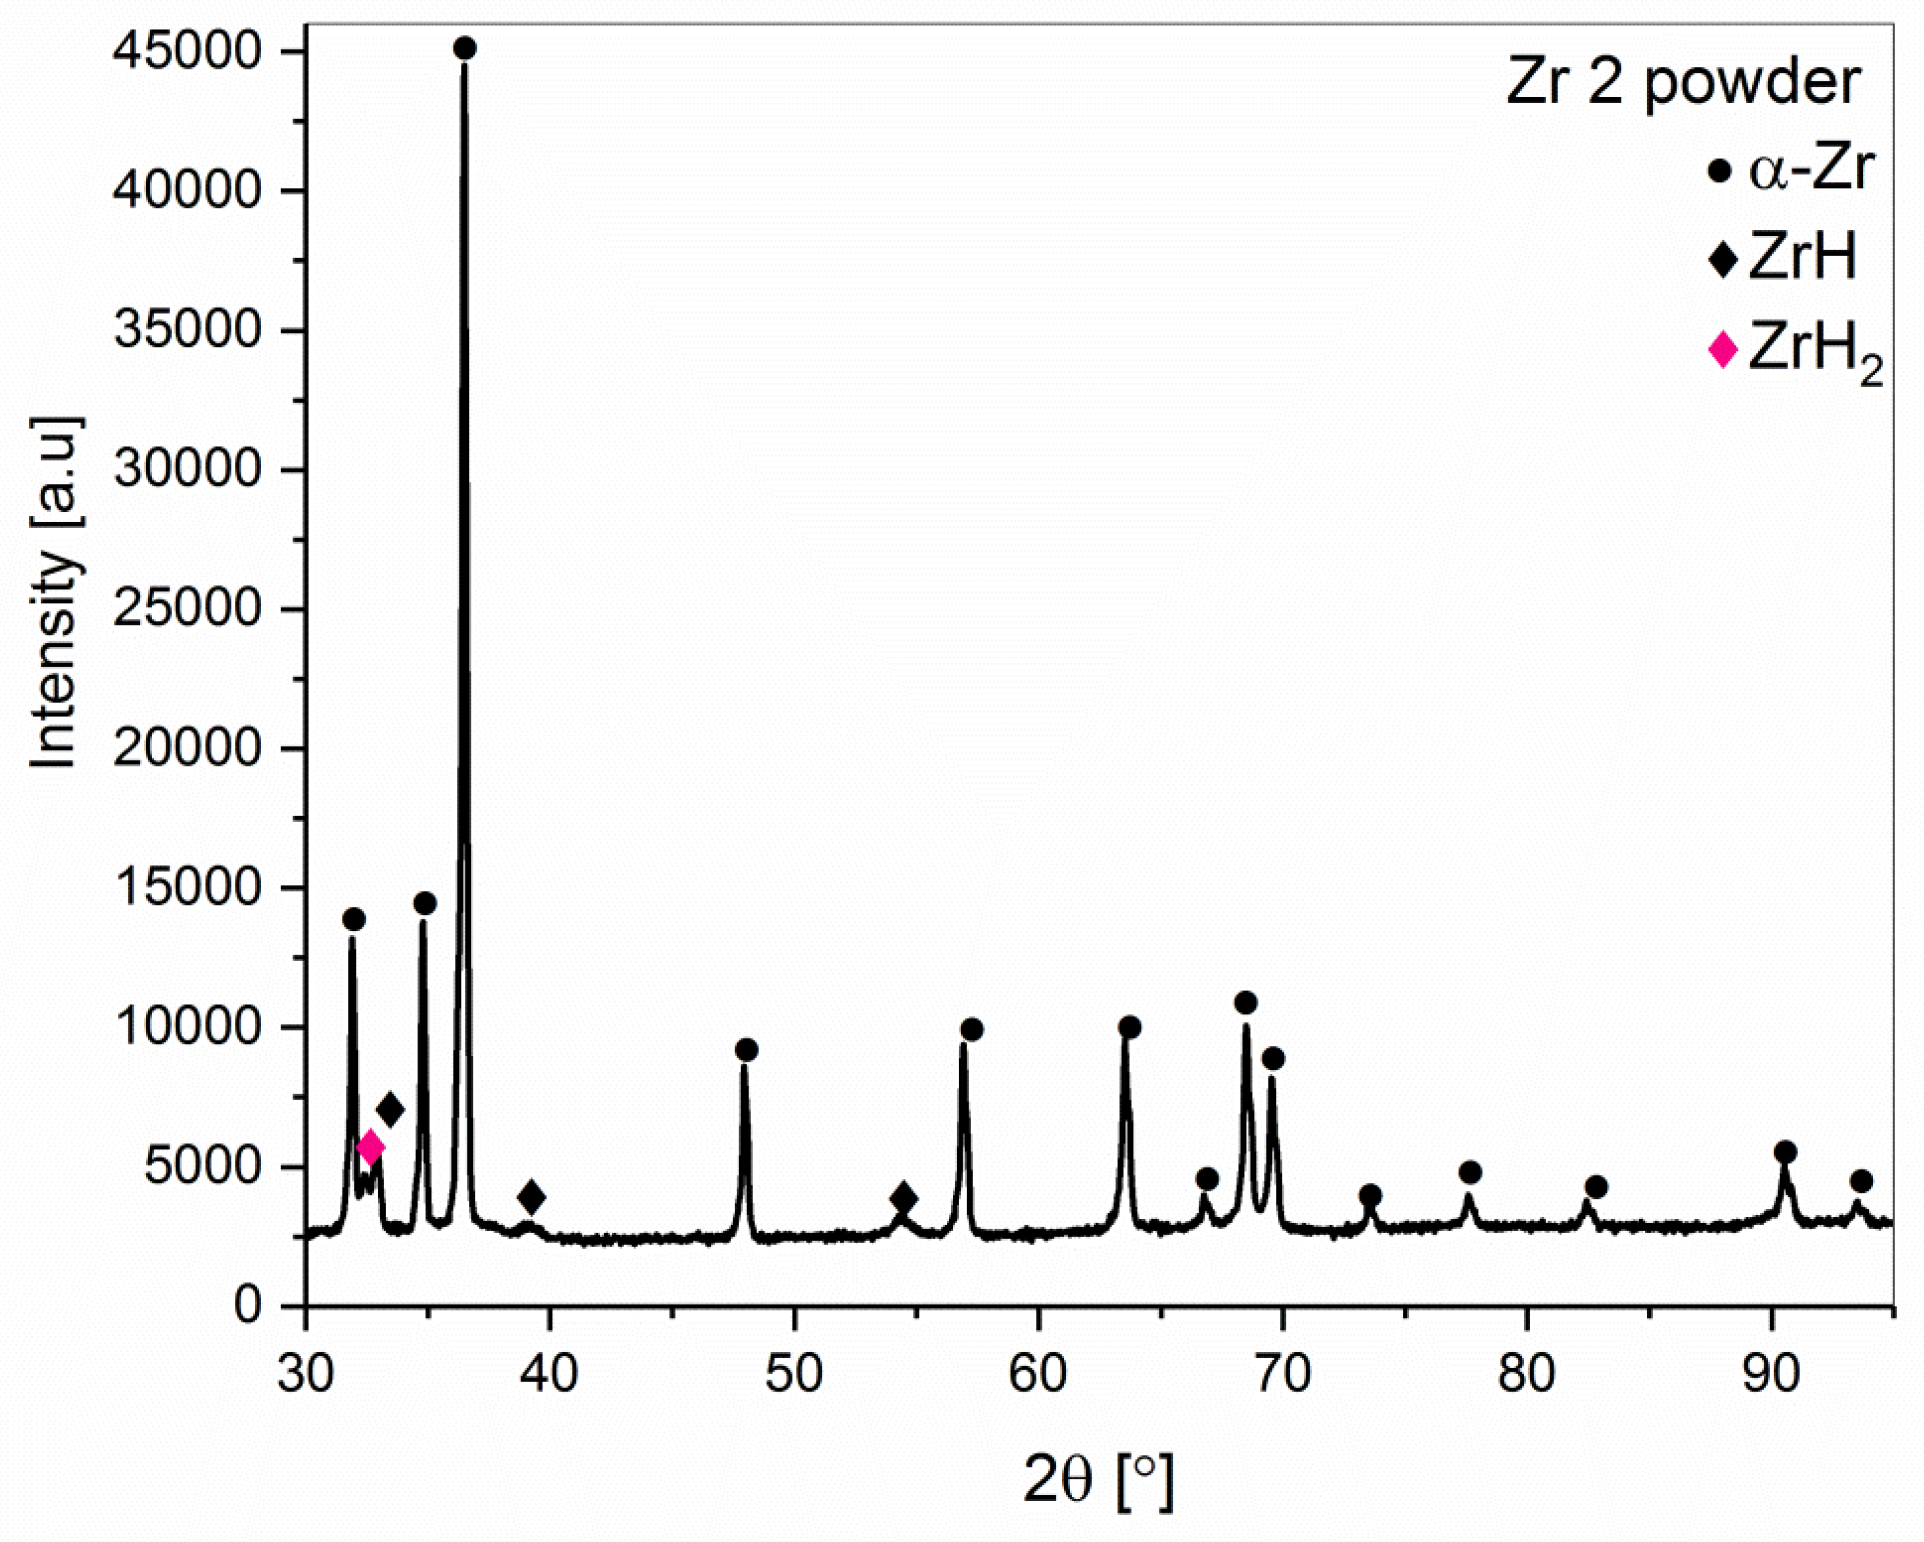
| Purity [%] | 99.9 | 98.8 |
| Particle size by the producer [µm] | 60 | <45 |
| Measured particle size-median [µm] | 12 | 6 |
| Oxygen content [%] | 1.6 ± 0.08 | 0.75 ± 0.01 |
| Nitrogen content [ppm] | 121.0 ± 8.8 | 446.5 ± 18.3 |
| Hydrogen content [%] | 0.155 ± 0.02 | 0.381 ± 0.002 |
| Powder Symbol | Phase Composition | Unit Cell Parameters | Phase Content [wt.%] | Agreement Indices * | |
|---|---|---|---|---|---|
| From ICCD Data Base [nm] | Fitting by Rietveld Method [nm] | ||||
| Zr 1 | α-Zr | a = 0.3242 c = 0.5169 | a = 0.3234052 c = 0.5147363 | 100 | Rexp = 2.13%Rp = 2.07% Rwp = 2.92% |
| Zr 2 | α-Zr | a = 0.3242 c = 0.5169 | a = 0.3229767 c = 0.5143974 | 85 | Rexp = 2.10% Rp = 2.04% Rwp = 2.82% |
| ZrH | a = 0.4586 c = 4.948 | a = 0.4594012 c = 0.4946331 | 10 | ||
| ZrH2 | a = 0.5000 c = 0.4440 | a = 0.500129 c = 0.4462180 | 5 | ||
| Pressure of the Sintering 4.0 GPa | Pressure of the Sintering 7.8 GPa | ||||
|---|---|---|---|---|---|
| Phase Constitution | wt.% | Agreement Indices * | Phase Constituion | wt.% | Agreement Indices |
| α-Zr | 91 | Rexp = 3.13% Rp = 3.01% Rwp = 4.69% | α-Zr | 33 | Rexp = 3.13% Rp = 2.52% Rwp = 3.73% |
| ω-Zr | 6 | ω-Zr | 64 | ||
| ZrH | 2.5 | ZrH | 2 | ||
| ZrH2 | 0.5 | ZrH2 | 1 | ||
| Pressure 4.0 GPa | Pressure 7.8 GPa | ||
|---|---|---|---|
| Phase Type | wt.% | Phase Type | wt.% |
| α-Zr | 79 | α-Zr | 7 |
| ω-Zr | 12 | ω-Zr | 87 |
| ZrH | - | ZrH | 1 |
| ZrH2 | 9 | ZrH2 | 5 |
| Phase Type | Zr 1 | Zr 2 | ||
|---|---|---|---|---|
| T = 1273 K, t = 1 min, wt.% | T = 1473 K, t = 1 min, wt.% | T = 1273 K, t = 1 min, wt.% | T = 1473 K, t = 1 min, wt.% | |
| α-Zr | 33 | 38 | 12 | 7 |
| ω-Zr | 64 | 60 | 79 | 87 |
| ZrH | 1 | - | - | 1 |
| ZrH2 | 2 | 2 | 9 | 5 |
| Powder/Pressure of Compacting | Zr 1 | Zr 2 | ||
|---|---|---|---|---|
| 4.0 GPa | 7.8 GPa | 4.0 GPa | 7.8 GPa | |
| α-Zr(203) | −133 ± 24 MPa | −159 ± 15 MPa | 101 ± 9 MPa | −567 ± 52 MPa |
| ω-Zr(311) | lack of ω-Zr phase | lack of ω-Zr phase | lack of ω-Zr phase | 223 ± 72 MPa |
| Phase/Sample Sintering Parameters | Zr 1 | Zr 2 | ||
|---|---|---|---|---|
| T = 1273 K, t = 1 min [MPa] | T = 1473 K, t = 1 min [MPa] | T = 1273 K, t = 1 min [MPa] | T = 1473 K, t =1 min [MPa] | |
| α-Zr(203) | −37 ± 21 | −269 ± 53 | Too low amount of α-Zr phase for calculations | Too low amount of α-Zr phase for calculations |
| ω-Zr(311) | −431 ± 43 | −333 ± 30 | −307 ± 25 | −214 ± 21 |
| Sample Sintering Parameters | Zr 1, 7.8 GPa, T = 1273 K, t = 1 min | ||||
|---|---|---|---|---|---|
| Phase Type/Temperature in the HTK2000 Device | RT | 1173 K | 1273 K | 1373 K | 1473 K |
| α-Zr | 33 | 70 | 95 | 98 | 100 |
| ω-Zr | 64 | 25 | - | - | - |
| ZrH | 2 | - | - | - | - |
| ZrH2 | 1 | 5 | 5 | 2 | - |
| Sample Sintering Parameters | Zr 1, 7.8 GPa, T = 1473 K, t = 1 min | ||||
|---|---|---|---|---|---|
| Phase Type/Temperature in the HTK2000 Device | RT | 973 K | 1073 K | 1173 K | 1273 K |
| α-Zr | 38 | 64 | 96 | 98 | 100 |
| ω-Zr | 60 | 34 | - | - | - |
| ZrH | - | - | - | - | - |
| ZrH2 | 2 | 2 | 4 | 2 | - |
© 2019 by the authors. Licensee MDPI, Basel, Switzerland. This article is an open access article distributed under the terms and conditions of the Creative Commons Attribution (CC BY) license (http://creativecommons.org/licenses/by/4.0/).
Share and Cite
Jaworska, L.; Cyboron, J.; Cygan, S.; Zwolinski, A.; Onderka, B.; Skrzekut, T. Zirconium Phase Transformation under Static High Pressure and ω-Zr Phase Stability at High Temperatures. Materials 2019, 12, 2244. https://doi.org/10.3390/ma12142244
Jaworska L, Cyboron J, Cygan S, Zwolinski A, Onderka B, Skrzekut T. Zirconium Phase Transformation under Static High Pressure and ω-Zr Phase Stability at High Temperatures. Materials. 2019; 12(14):2244. https://doi.org/10.3390/ma12142244
Chicago/Turabian StyleJaworska, Lucyna, Jolanta Cyboron, Slawomir Cygan, Adam Zwolinski, Boguslaw Onderka, and Tomasz Skrzekut. 2019. "Zirconium Phase Transformation under Static High Pressure and ω-Zr Phase Stability at High Temperatures" Materials 12, no. 14: 2244. https://doi.org/10.3390/ma12142244
APA StyleJaworska, L., Cyboron, J., Cygan, S., Zwolinski, A., Onderka, B., & Skrzekut, T. (2019). Zirconium Phase Transformation under Static High Pressure and ω-Zr Phase Stability at High Temperatures. Materials, 12(14), 2244. https://doi.org/10.3390/ma12142244