Abstract
This paper presents the characteristic of 316L steel turning obtained by 3D printing. The analysis of the influence of turning data on the components of the total cutting force, surface roughness and the maximum temperature values in the cutting zone are presented. The form of chips obtained in the machining process was also analyzed. Statistical analysis of the test results was developed using the Taguchi method.
1. Introduction
In recent years, an intensive Additive Manufacturing (AM) industry has developed, due to possibilities of manufacturing of very complex structures inside parts and work pieces. This innovative technology is often determined as “3D printing”. The technology, in contrast to the conventional (subtractive) method of “top-down” machining processes (SM) which removes material, creates parts via a “bottom-up” process. In AM, the elements are created layer-by-layer by using a computer-controlled laser beam source. This allows fabrication of complex shapes inside of the parts, which are difficult to obtain by using molding or conventional manufacturing techniques [1,2,3]. AM technologies are used in several applications such as turbine blade manufacturing in aerospace engineering, prosthesis and medical implants (in the medical industry), and die casting molds, valves, heat exchangers, manifolds and collectors. One of the main challenges of this technology is the characterization and prediction of manufactured structures and their connection with selected fabrication settings [4,5,6,7].
Both subtractive and additive manufacturing have several advantages and disadvantages. In practice, parts made in additive technology are a replacement for casting technology. The big advantages of the additive manufacturing rely basically on no restrictions to building complex shapes and ability to produce several units at the same time. On the other hand, the disadvantage is undoubtedly the lower surface quality and the dimensional–shape accuracy compared to parts made with the use of machining. The material obtained with 3D printing technology shows porosity and areas with different consistency of material. The characteristics of the parts obtained in the AM technology is the layered structure of the material and necessity to decrease the size of stresses within the material caused by a poor heat distribution [8,9].
Geometrically simple objects are easier to machine by SM. A more complex tool path is generated if the geometry becomes more complex and this can be difficult to produce with a milling machine even with five or more axes.
An interesting idea to improve the quality of the manufactured parts is the use of hybrid processing, previously analyzing whether it is better to use more thin layers during AM production or fewer thick layers (then worse quality of the item) but with the need of additional mechanical machining AM + SM [10].
Selective Laser Melting (SLM) is the most widespread method of metal additive manufacturing that allows laser fusion of metal powders (with low granulation 15–45 μm), such as AISI 316L and PH 17-4 stainless steels, Maraging steels, Inconel 625 and 718, Al-Si alloys, CoCr and Ti6Al4V [1,4,11]. SLM involves a powder bed fusion process where parts are produced by melting a thin coat of powder layer-by-layer by applying a rastered laser beam controlled directly from a computer aided design model (CAD). For the SLM-process, the build chamber is flooded with an inert gas, such as argon (Ar), or a process gas, such as nitrogen (N2), to prevent oxidation on the powder surface [1,6]. Additionally, the SLM process allows the fabrication of almost fully dense metal parts with mechanical properties comparable to components made by conventional routes. SLM enables a high relative density (even for arbitrary complex structures), low porosity of the manufactured elements and high material utilization rates. SLM enables the fabrication of parts without the need of tools and prototypes. In addition, for the production of small element sizes, there is no increase in costs (in contrary to the mold-based technologies). However, the quality of SLM produced parts strongly depends on the laser processing parameters, building chamber atmosphere, powder bed preheating, and especially on the powder feedstock characteristics [11,12,13,14,15,16,17]. Unfortunately, the parts fabricated by using the SLM process, characterize decreased dimensional accuracy and surface quality (with the dimensional tolerance of 40–80 μm). Therefore, post-processing by machining (finishing or grinding) is often necessary in order to achieve the suitable surface conditions for its applications [18,19].
Several alloys are currently used for SLM. However, the AISI 316L austenitic stainless steel is frequently employed due to its combination of good mechanical properties, excellent corrosion resistance and good SLM process compatibility [4,12]. Researchers have focused mainly on applying process parameters for SLM to improve the geometrical and microstructural properties of manufactured components (such as surface roughness and surface integrity, high density and residual stress of AISI 316L) [13,20,21]. The effect of LSM parameters such as laser power, scanning velocity and scanning direction are correlated with the mechanical properties of the fabricated parts [22,23,24]. For example, the lower laser power P = 100 W causes the fabricated sample to be characterized by more pores and lower hardness [23]. However, the laser power P = 200 W and the high scan speed vscan = 400 mm/s yield a low temperature during process SLM, which gives poor wettability and micropores appearing in the structure [24]. Additively, the laser power increase and or scanning velocity decrease contribute to the increase of energy density, which impact on: lower porosity, bigger melt pool, and stronger bonding between pools [22]. The quality of fabricated part depends on these properties, which can affect the post-process machining.
Additively, the parameters of SLM such as energy input effects spatter behavior, which is generated during the process. The formed spatter influences the part structure, which can be significant during added post-process machining [25]. The distribution state and particle size of nanoscale TiC reinforcements in the structure of molten part affect the micro-hardness and wear rates [26]. The increase of the volume content of TiC causes an increase of hardness and decrease of coefficient of friction and wear rate [27].
Previous studies to a lesser extent have presented the machining of external surfaces of AISI 316L fabricated via SLM. The impact of machining data on the surface quality (surface roughness or surface integrity) plays an important role [28,29,30,31]. Therefore, there is a need to analyze the cutting process of metals obtained by additive technology, SLM in our case.
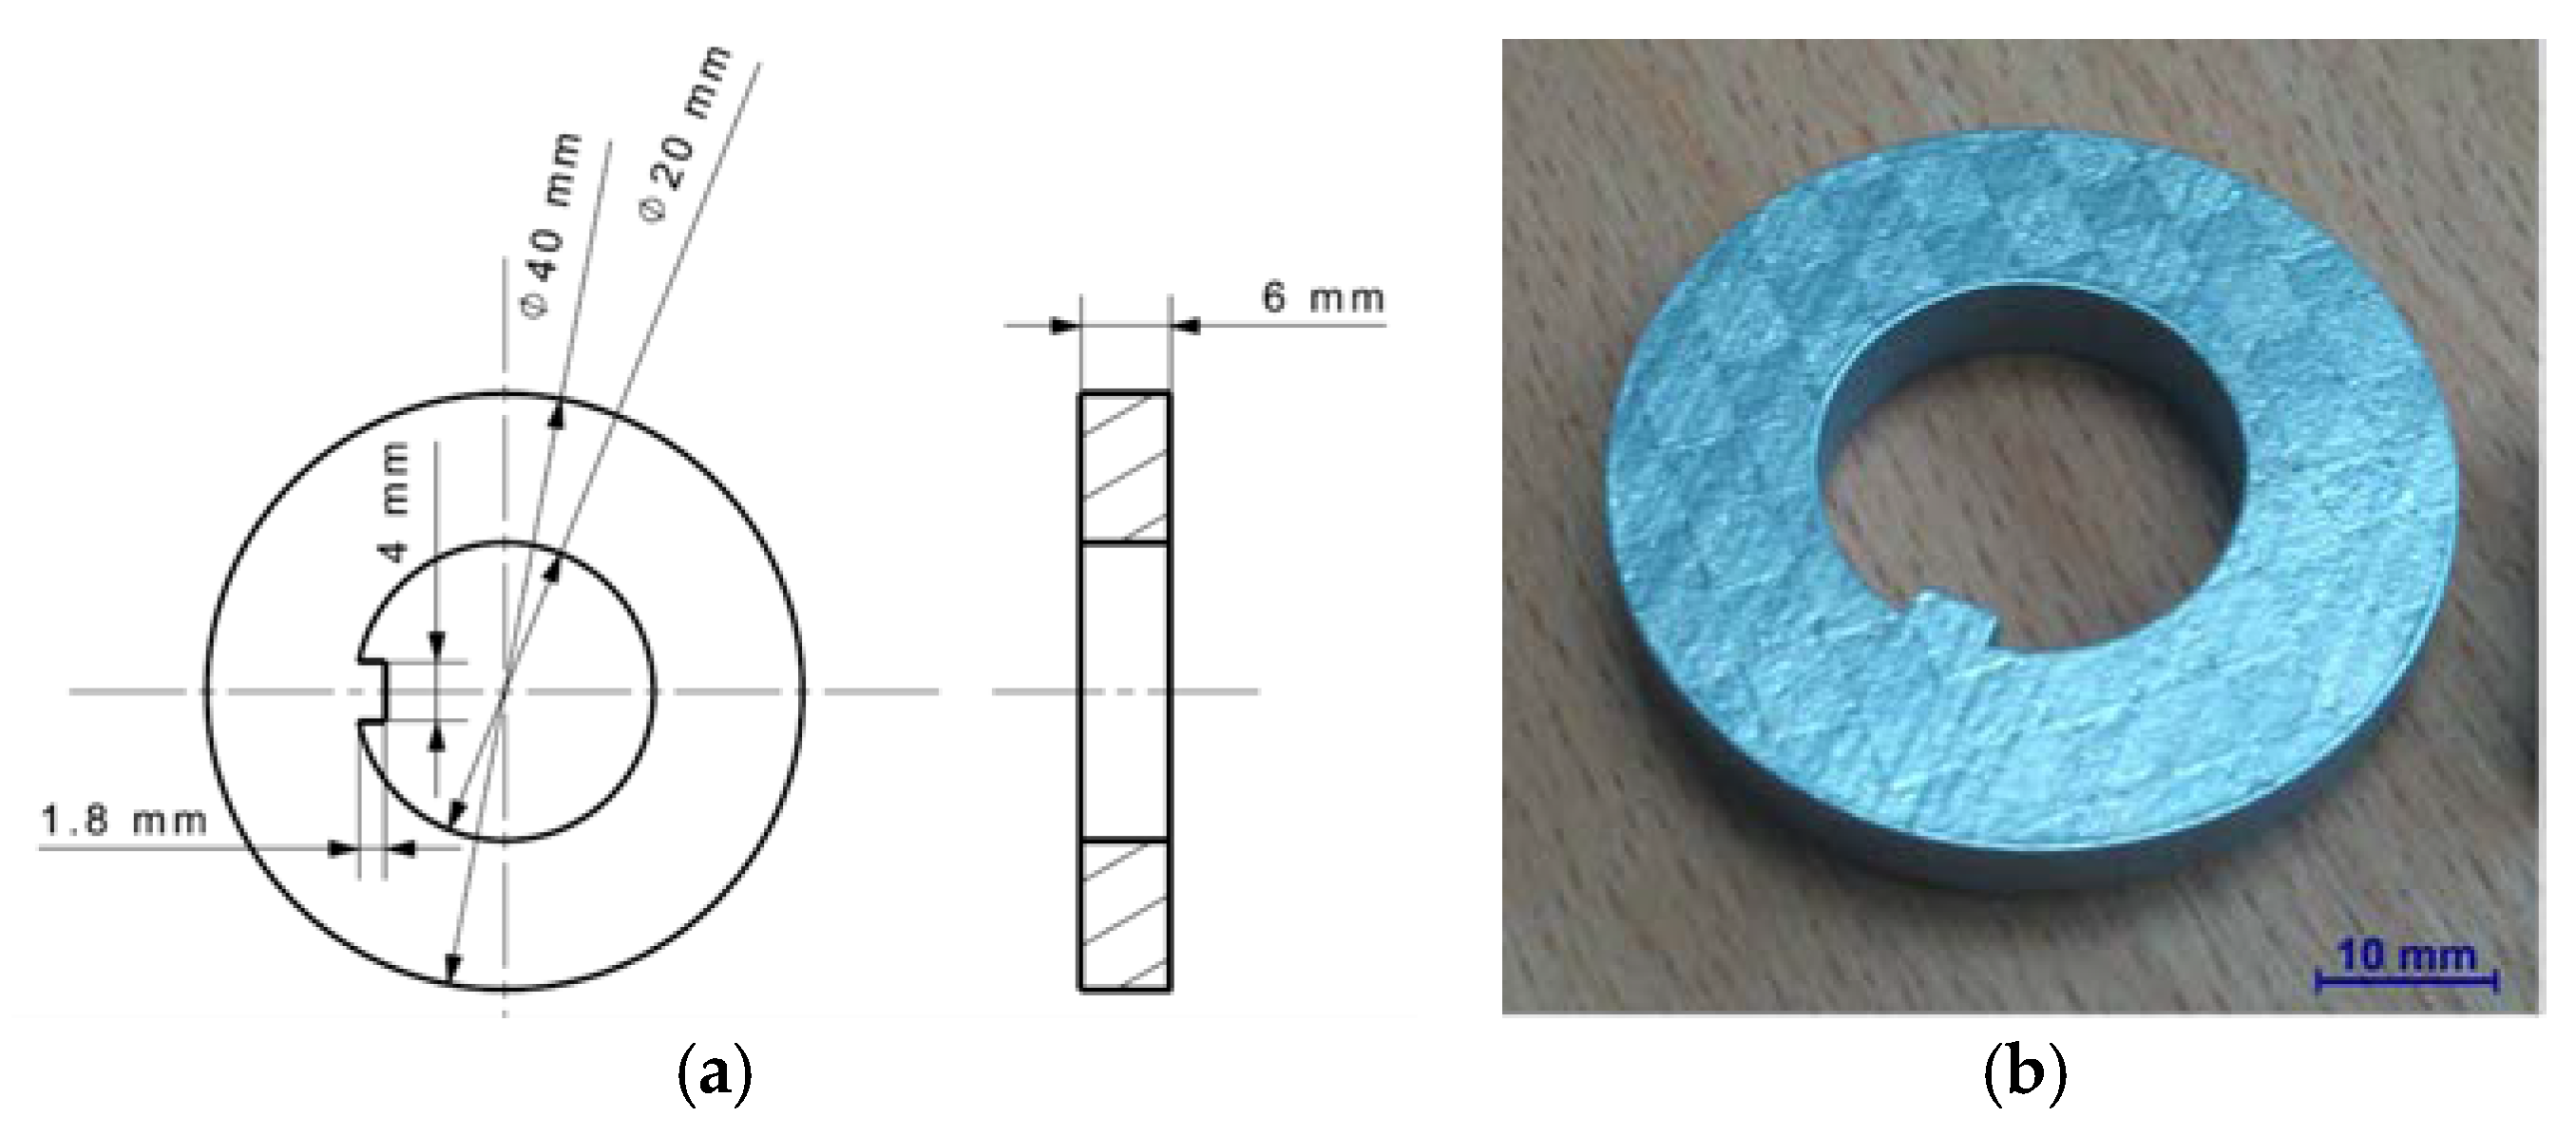
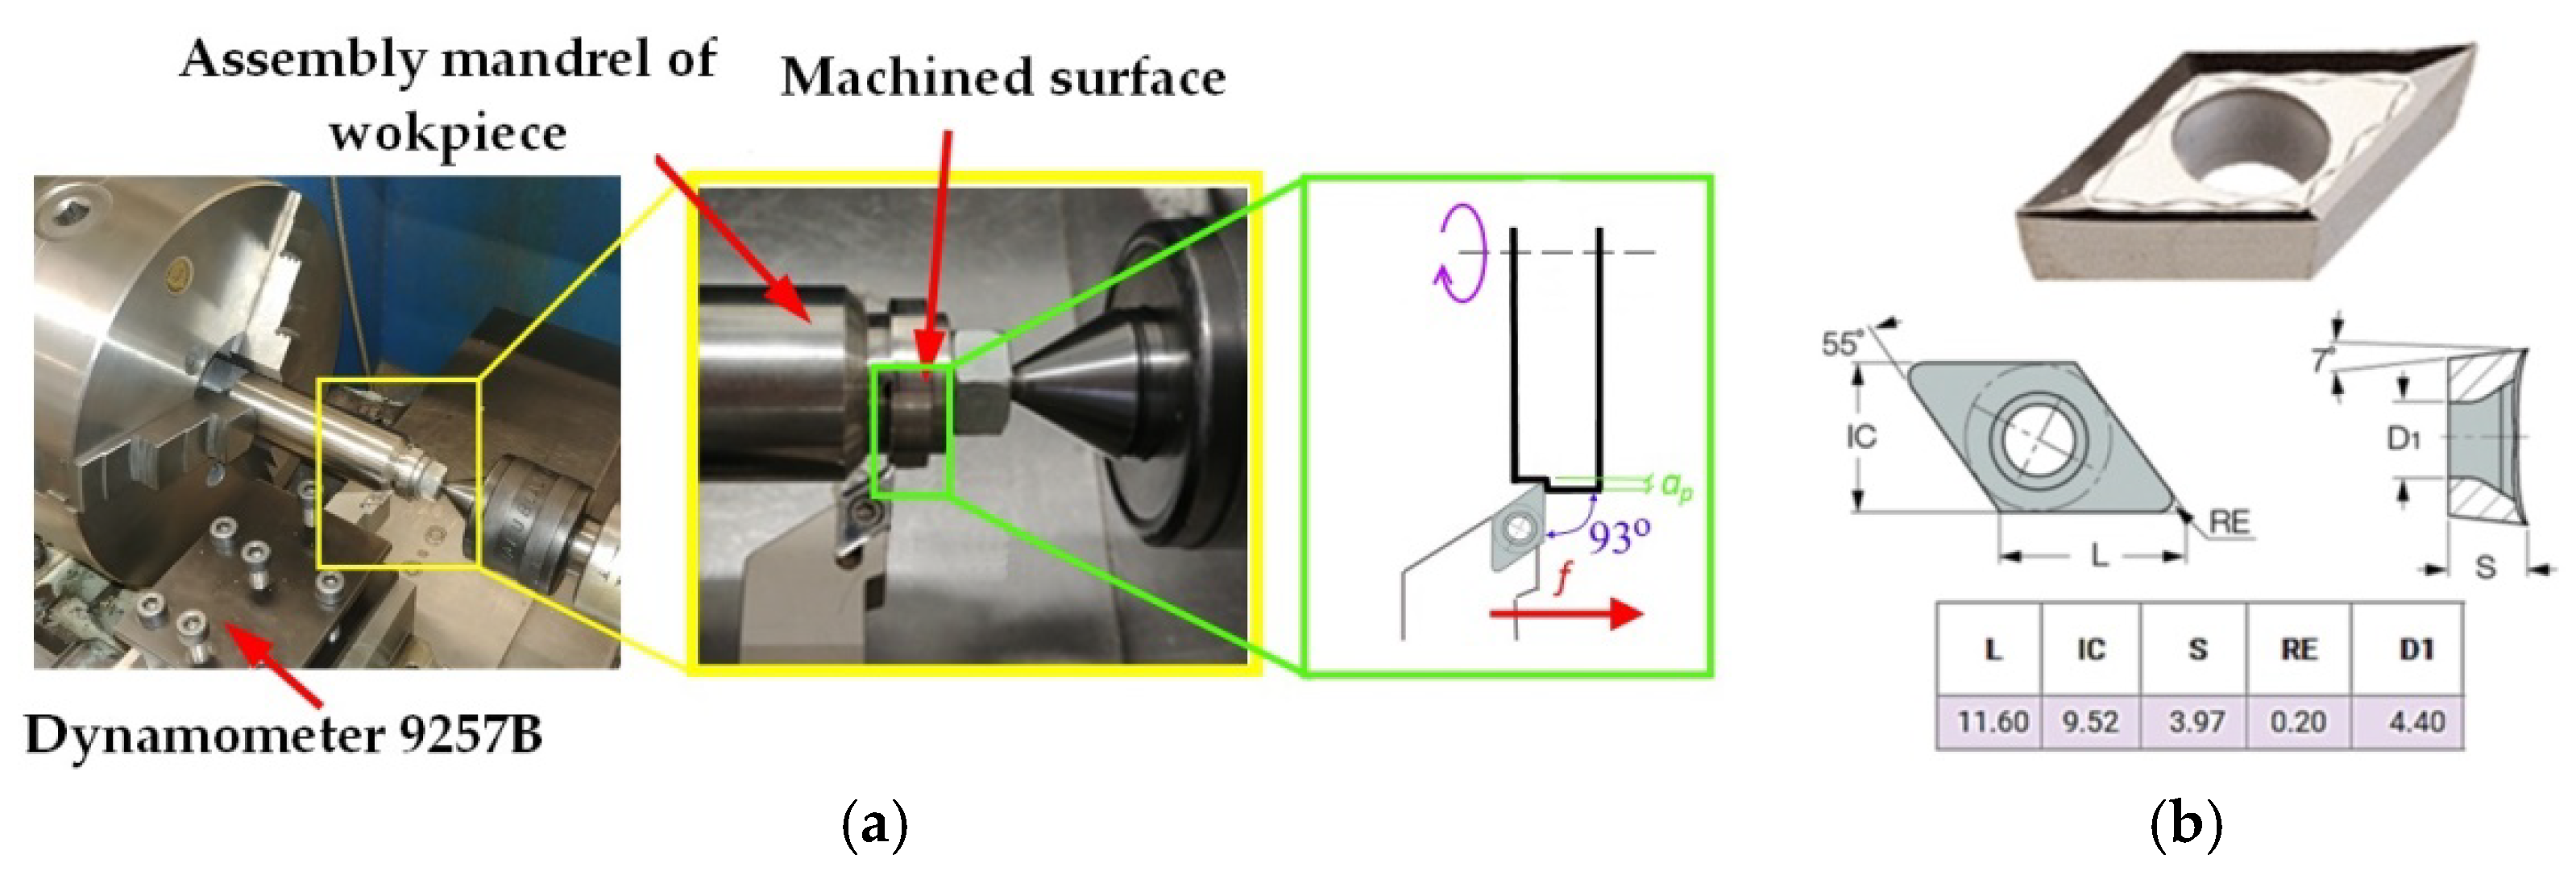
We determined the influence of parameters cutting data on the molten laser stainless steel 316L on the surface finish, cutting forces and temperatures values in the cutting zone. A machining analysis of a specially designed sintered turning ring was carried out.
2. Materials and Methods
2.1. Design of Experiment
The external surface of the test sample was subjected to the longitudinal turning. The 3D samples made of 316L stainless steel (with grain size in range 23–48 µm) were fabricated with SLM/LMF technique using a TRUMPF TruPrint 1000 3D Laser Metal Fusion machine (Ditzingen, Germany). Figure 1 presents a ring-shaped sample and its dimensions. The SLM process parameters are characterized in Table 1.
Figure 1.
Test sample fabricated by using SLM: (a) dimensions of the sample; and (b) photograph of the sample.
Table 1.
The major SLM process parameters used in printing 3D test samples.
The prepared shape of the test stand enables the installation on a specially prepared attachment bolt. The test position and applied cutting tool, produced by ISCAR company (Tefen, Israel), the cutting insert, DCGT 11T302-AS IC20; and the tool holder, SDJCR2020K11) [32] are shown in Figure 2.
Figure 2.
Test stand for experiments: (a) the attachment bolt of sample with dynamometer; and (b) dimensions of the DCGT 11T302-AS IC20 cutting insert.
During the investigations, measurements of surface roughness, surface topography, cutting forces, micro-hardness and temperature in the cutting zone were performed. Furthermore, the created chips were classified (advantages, disadvantages, acceptable or unacceptable). The turning tests of the sample were carried out on a Masterturn 400 lathe, equipped with a special prepared measurement system that enables the measurement of cutting forces and temperature values in the machining area. The cutting forces were measured and recorded by applying the dynamometer 9257B and the amplifier 5070B produced by Kistler company (Winterthur, Switzerland). The cutting forces waveforms were converted by analog to digital converter and analyzed using DynoWare software (Version 2825A, Kistler Group, Winterthur, Switzerland). Sampling frequency was 1 kHz and measuring time was 10 s. The measurements of surface roughness and topography were performed using Talysurf Intra 50 profilometer produced by Taylor Hobson company (Leicester, UK). The microhardness was measured using Micro-Vickers HM-112 tester produced by Mitutoyo company (Kawasaki, Japan). After the investigations, the average hardness value of the external surface was determined. The measurements were performed along the radius of the workpiece over a distance of 0.5 mm. The analysis of the results did not show any changes in the hardness value, which was HRCmean = 43 (HRC—Rockwell Hardness scale C).
2.2. Material
AISI 316L stainless steel is specified as X2CrNiMo17-12-2/1.4404 according to European standard and includes the austenitic structure of stainless steel. The chemical composition and main mechanical properties of this material are presented in Table 2 and Table 3, respectively. This stainless steel is used for fabricating parts working in salt water condition; for chemical, paper, and food industries among others; and for architectural elements. Additionally, due to anticorrosive properties, austenitic stainless steels are commonly used. The addition of Molybdenum (Mo) in chemical composition of the stainless steel contributes to increase acetic and sulfuric acid resistance.
Table 2.
Chemical composition of 316L stainless steel (wt. %).
Table 3.
Mechanical properties of 316L stainless steel.
2.3. Experimental Details
The experimental research was performed according to the Taguchi method [33]. The purpose of the tests was to examine the impact of some machining data, such as feed rate f and cutting speed vc, on:
- component values of the total cutting force F, main force Fc, feed force Ff and thrust force Fp;
- surface roughness parameter values Ra and Rz; and
- maximum temperature value Tmax in machining zone.
Cutting depth ap = 0.5 mm and cutting edge radius rε = 0.2 mm were assumed. The cutting data values of the turning experiment are presented in Table 4. To statistically fit the experimental data, the polynomial was selected.
Table 4.
Experimental design by using the Taguchi method.
The strategy of factor analysis S/N (signal to noise) was determined as “smaller-is-better” according to following formula:
where: yi is the respective characteristic and n is the number of observations.
3. Results Analysis of Cutting Forces Measurements
In Table 5, the experimental results of the components of the total cutting force with standard deviations (Std. Dev.) are shown. The cutting forces, such as Fc, Ff, and 
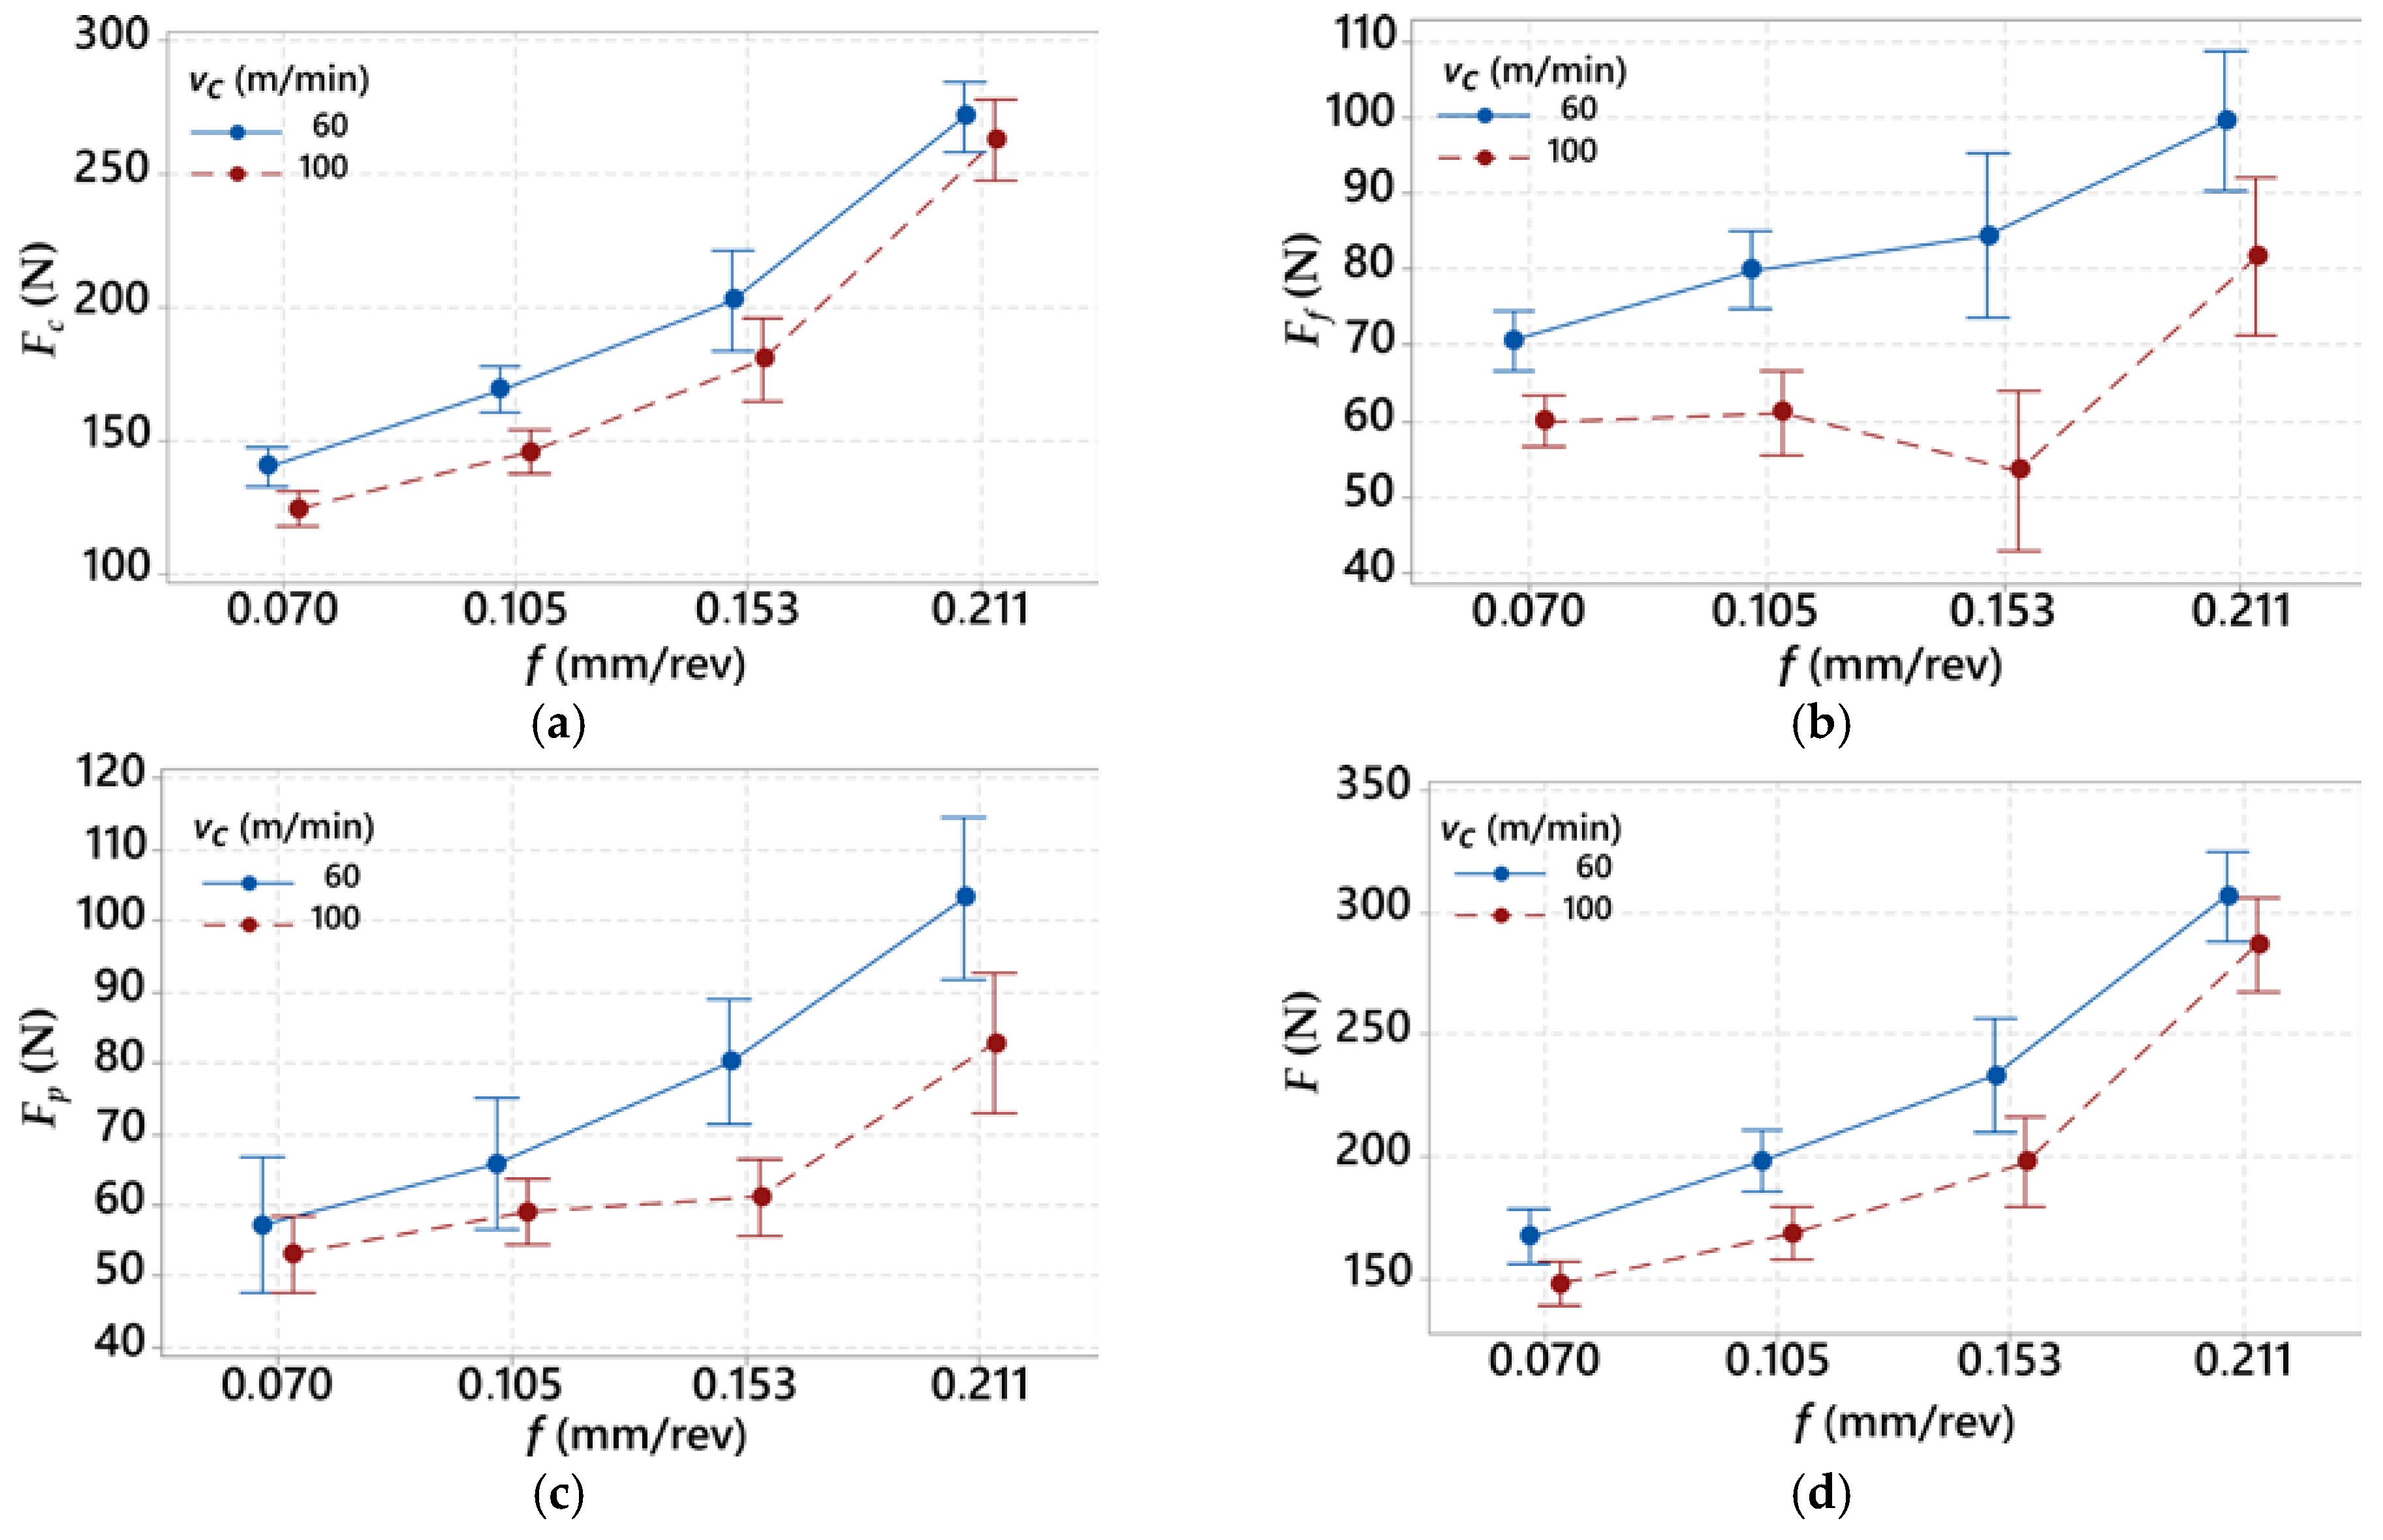
Fp, are presented as their average values. The impact of feed rate f on the cutting forces values and the total cutting force F, are presented in Figure 3.
Table 5.
Experimental design and results of the components of the total cutting force.
Figure 3.
Diagram representing relation between the feed rate f and: (a) main force Fc; (b) feed force Ff; (c) thrust force Fp; and (d) total cutting force F.
The results show that the feed rate f significantly affects the total cutting force F. In the case of the longitudinal force Fc, the increase of the feed rate values causes a stable increase of the force with constant increments. A threefold increase of feed rate, from f = 0.07 mm/rev to f = 0.211 mm/rev, contributes to the cutting force increase Fc of about 120–150 N in relation to the cutting speed. It was observed that, when applying the cutting speed vc = 100 mm/min for feed rate f > 0.15 mm/rev, the increment of thrust force Fp decreases and the increment of feed force Ff increases. This result indicates changes in the direction of the forces (Ff and Fp) in the case of using higher cutting speed values. The analysis of the results shows a decrease of about 10% of the cutting force Fc when using the higher cutting speed (100 m/min vs. 60 m/min). The obtained results of S/N parameters and its values for the cutting forces (Fc, Ff, and Fp) are presented in
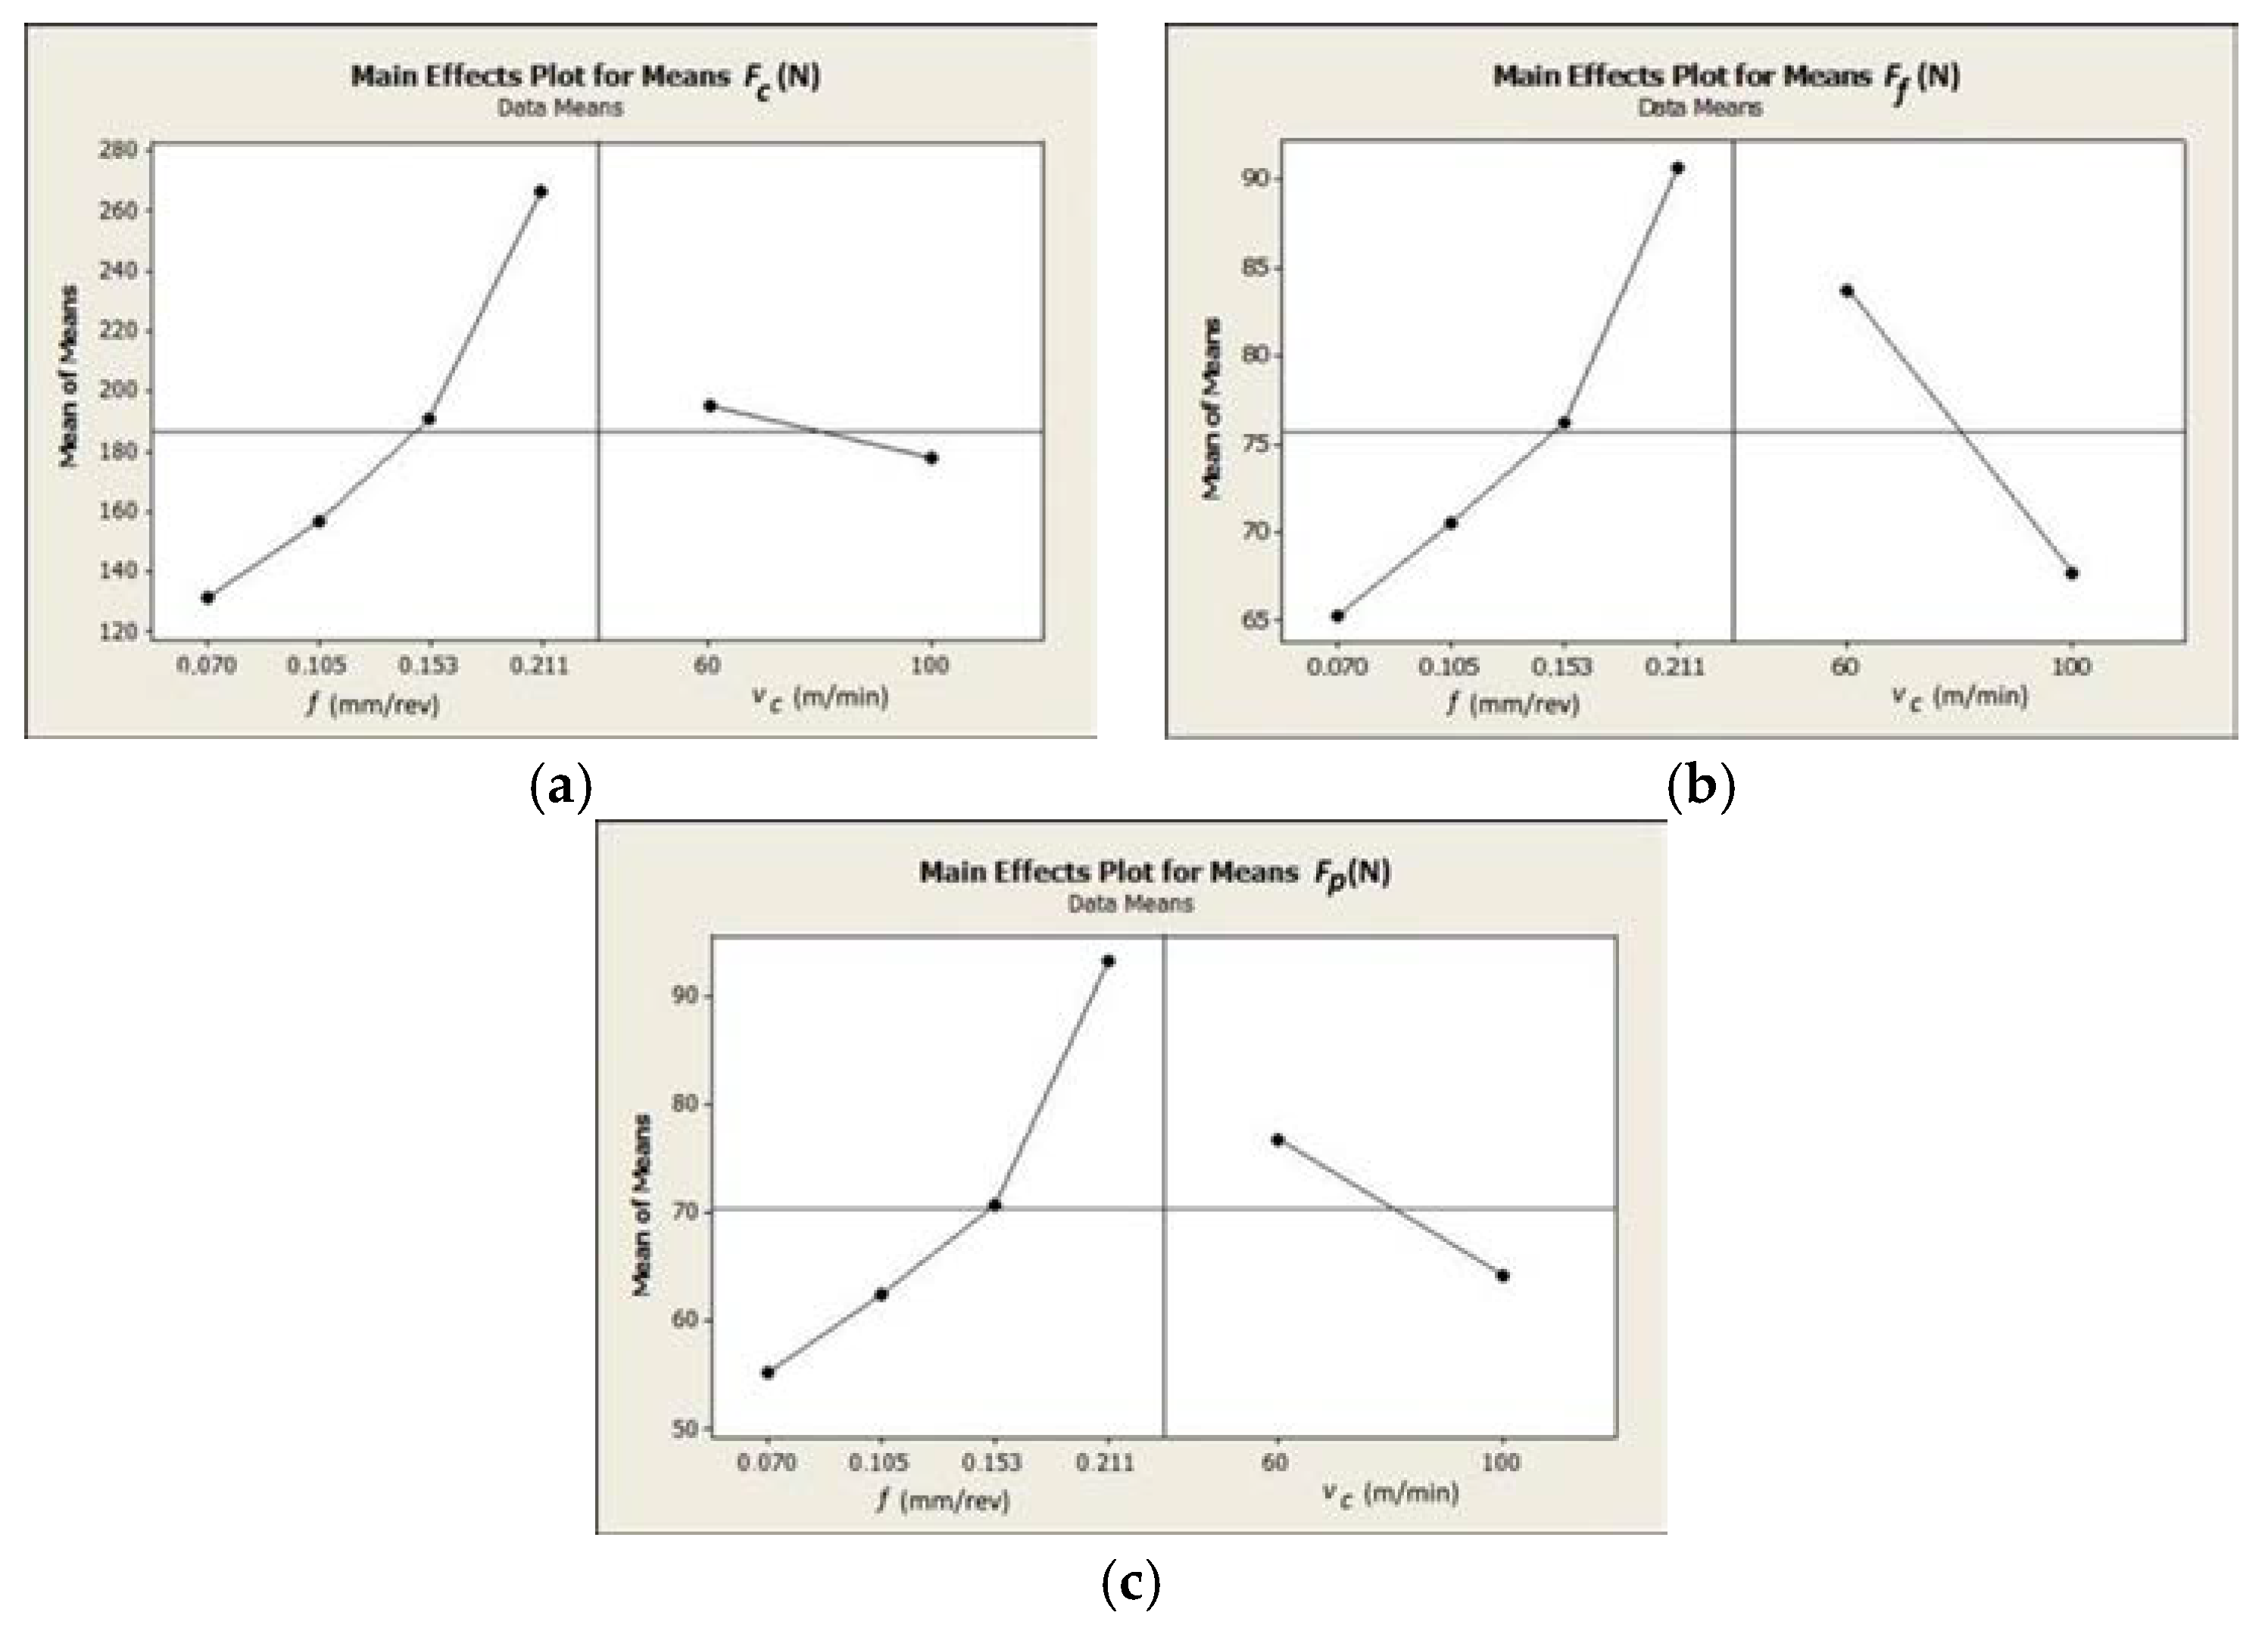
 Table 6. In Figure 4, the impact of cutting data on the cutting forces is shown.
Table 6.
The results analysis according to the Taguchi method for the cutting forces Fc, Ff, and Fp.
Figure 4.
Diagram representing relation between the cutting data (f, vc) and: (a) main force Fc; (b) feed force Ff; and (c) thrust force Fp.
The analysis of results confirms that the feed rate mainly affects the values of the cutting forces Fc, Ff and Fp. The cutting speed increase causes a decrease of values for all components of the total cutting force. Table 7, Table 8 and Table 9 show the ANOVA regression analysis results of the components for the total cutting force (where: DF—degrees of freedom, Seq SS—sums of squares, Adj SS—adjusted sums of squares, Adj MS—adjusted means squares).
Table 7.
Analysis of variance for mean values—main force Fc.
Table 8.
Analysis of variance for mean values—feed force Ff.
Table 9.
Analysis of variance for mean values—thrust force Fp.
Fc(f, vc), Ff(f, vc) and Fp(f, vc) are described by Equations (2)–(4):
4. Results Analysis of Surface Roughness
Table 10 presents the results of measured surface roughness Ra and Rz. The examples of topographies and profiles of the parts surface are shown in Table 11 (Trial 1 for fmin and Trial 7 for fmax, vc = 60 m/min).
Table 10.
The results of surface roughness Ra and Rz.
Table 11.
The examples of topography and profiles of the parts surface for fmin = 0.07 mm/rev and fmax = 0.211 mm/rev, vc = 60 m/min.
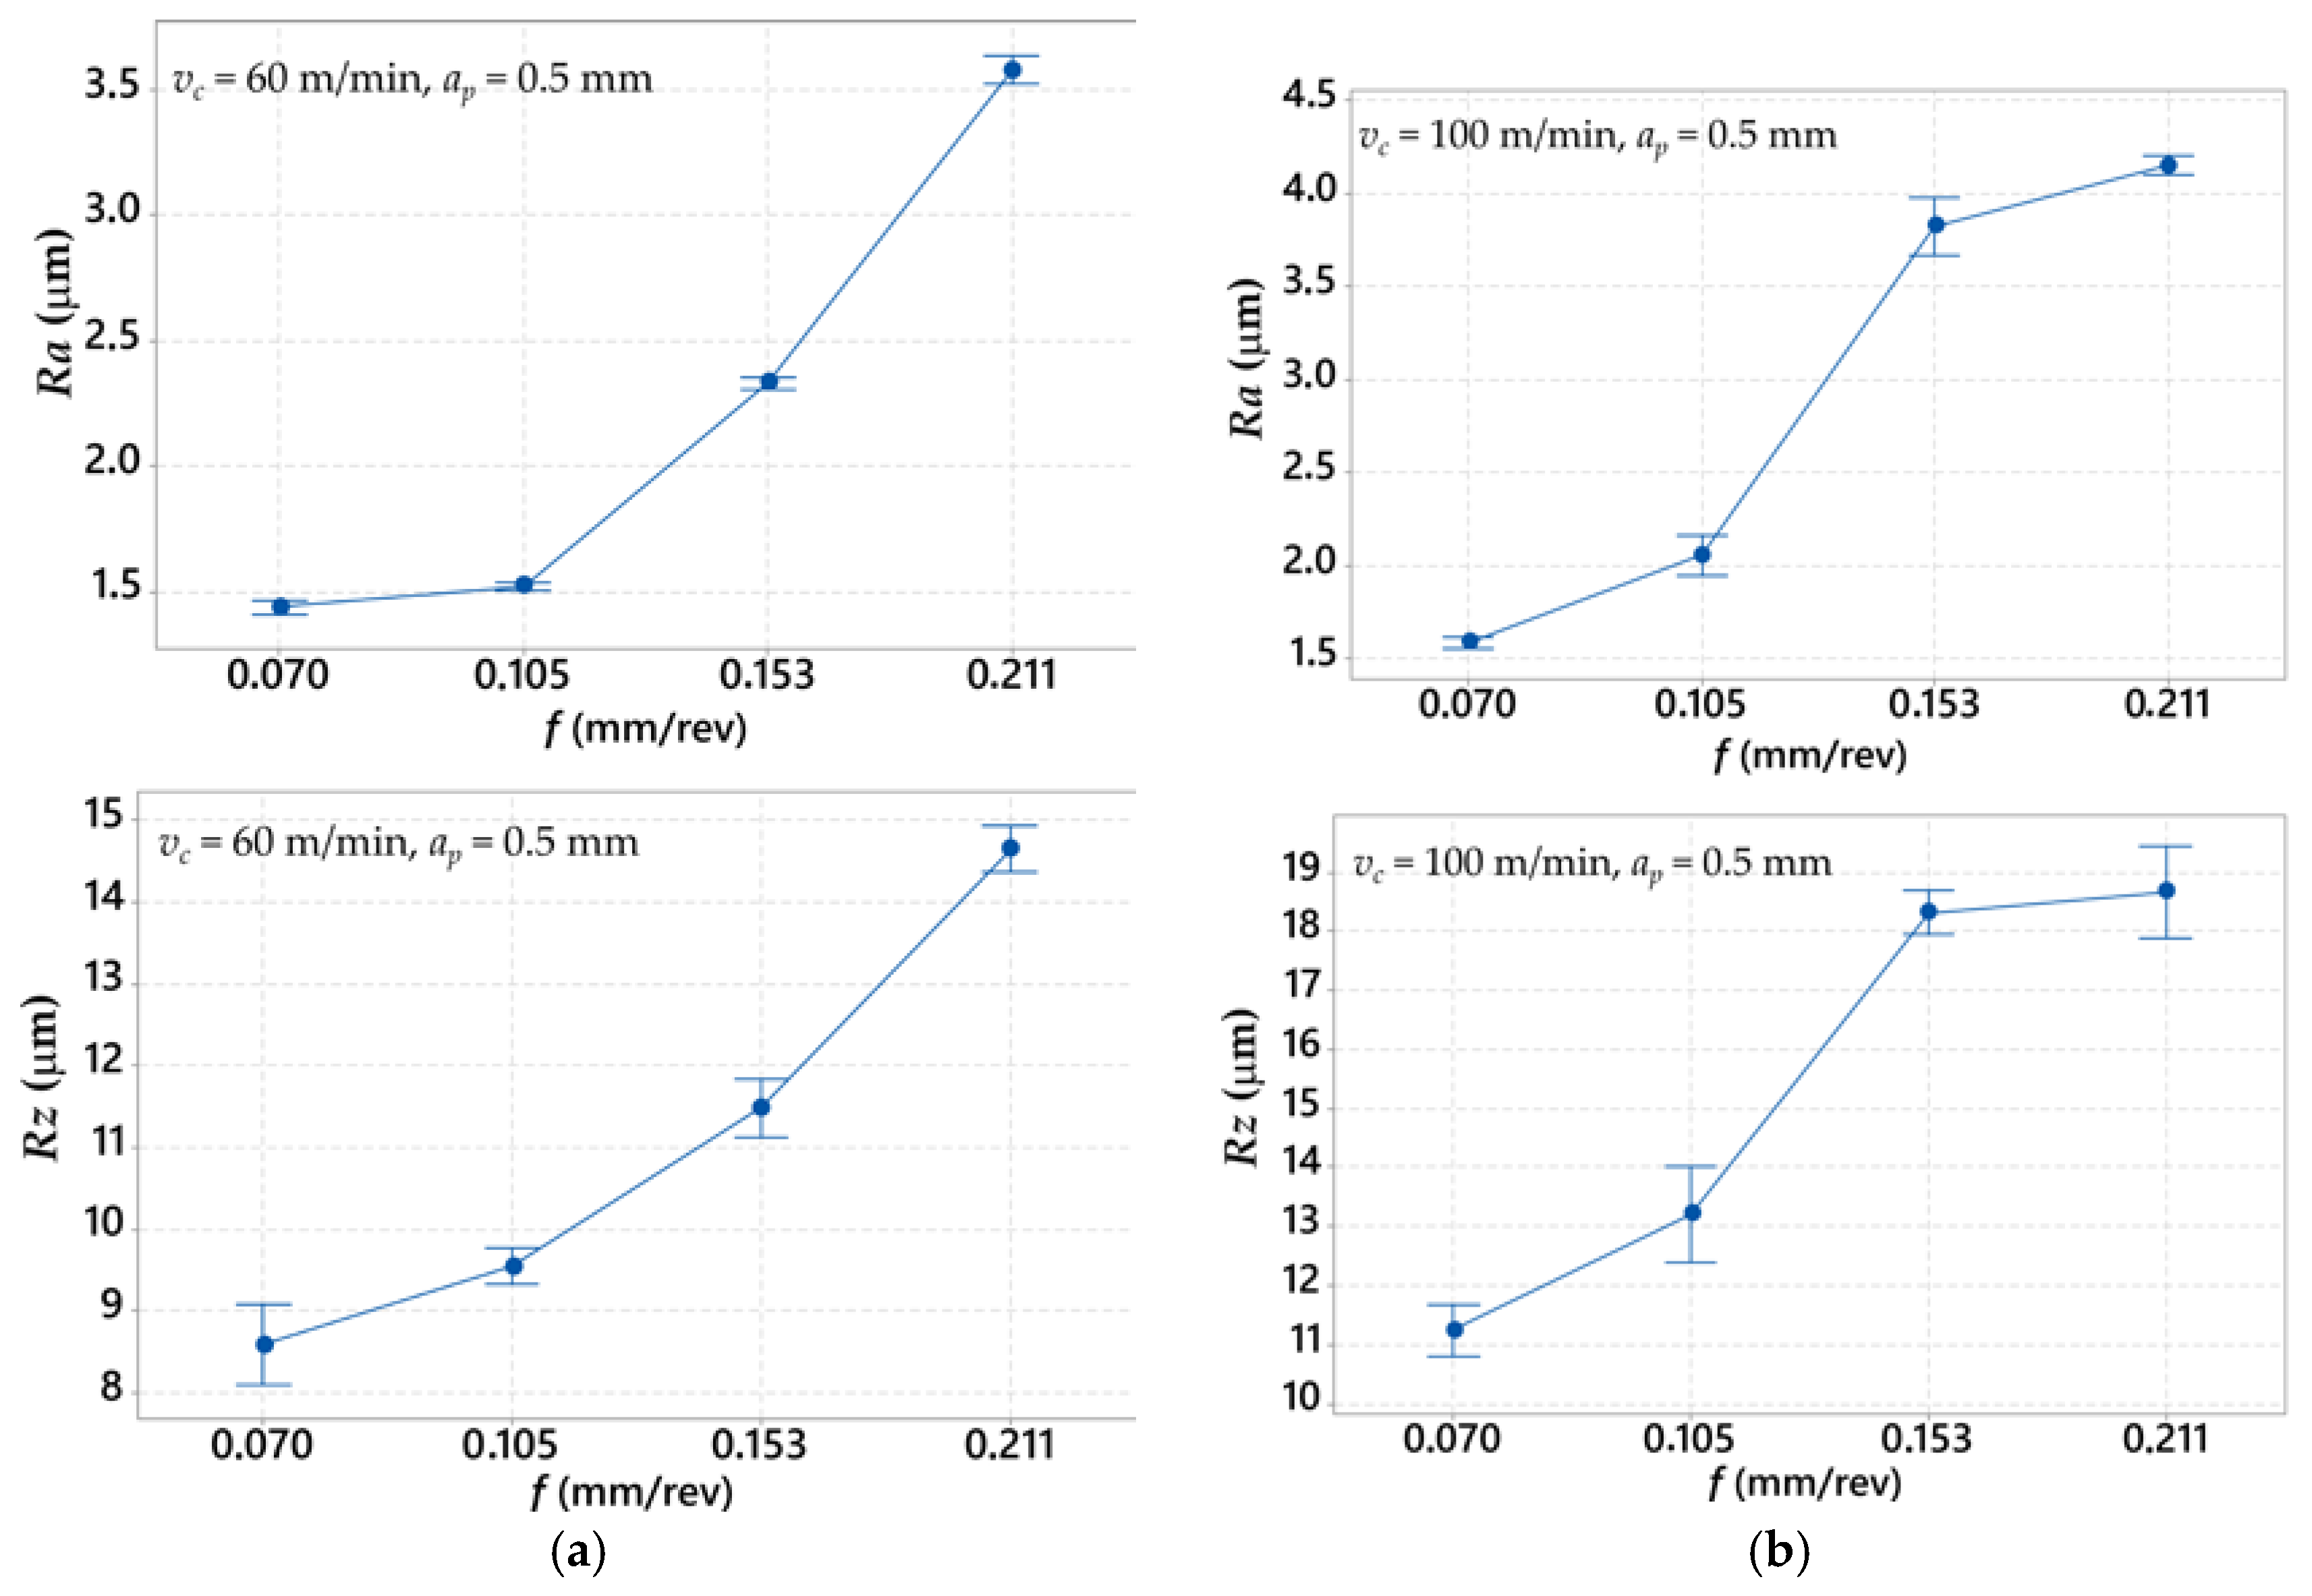
Figure 5 presents the impact of the feed rate on Ra and Rz roughness parameters, for values of the cutting speed vc = 60 m/min and vc = 100 m/min. Table 12 shows the S/N factor results and the average values of surface roughness parameters (Ra and Rz, respectively).
Figure 5.
Graph representing relation between the average values of surface roughness parameters (Ra and Rz) and: (a) cutting speed vc = 60 m/min; and (b) cutting speed vc = 100 m/min.
Table 12.
The results analysis of S/N factor and surface roughness parameters (Ra, Rz) according to Taguchi method.
Presented analysis of the relations in Figure 5 shows that values of surface roughness parameters are proportional to feed rate values. In all cases, higher values of surface roughness Ra and Rz are obtained with higher values of cutting speed, during changes from vc = 60 m/min to vc = 100 m/min. Moreover, it was observed that a higher dispersion of the measured values for vc = 100 m/min is accrued.
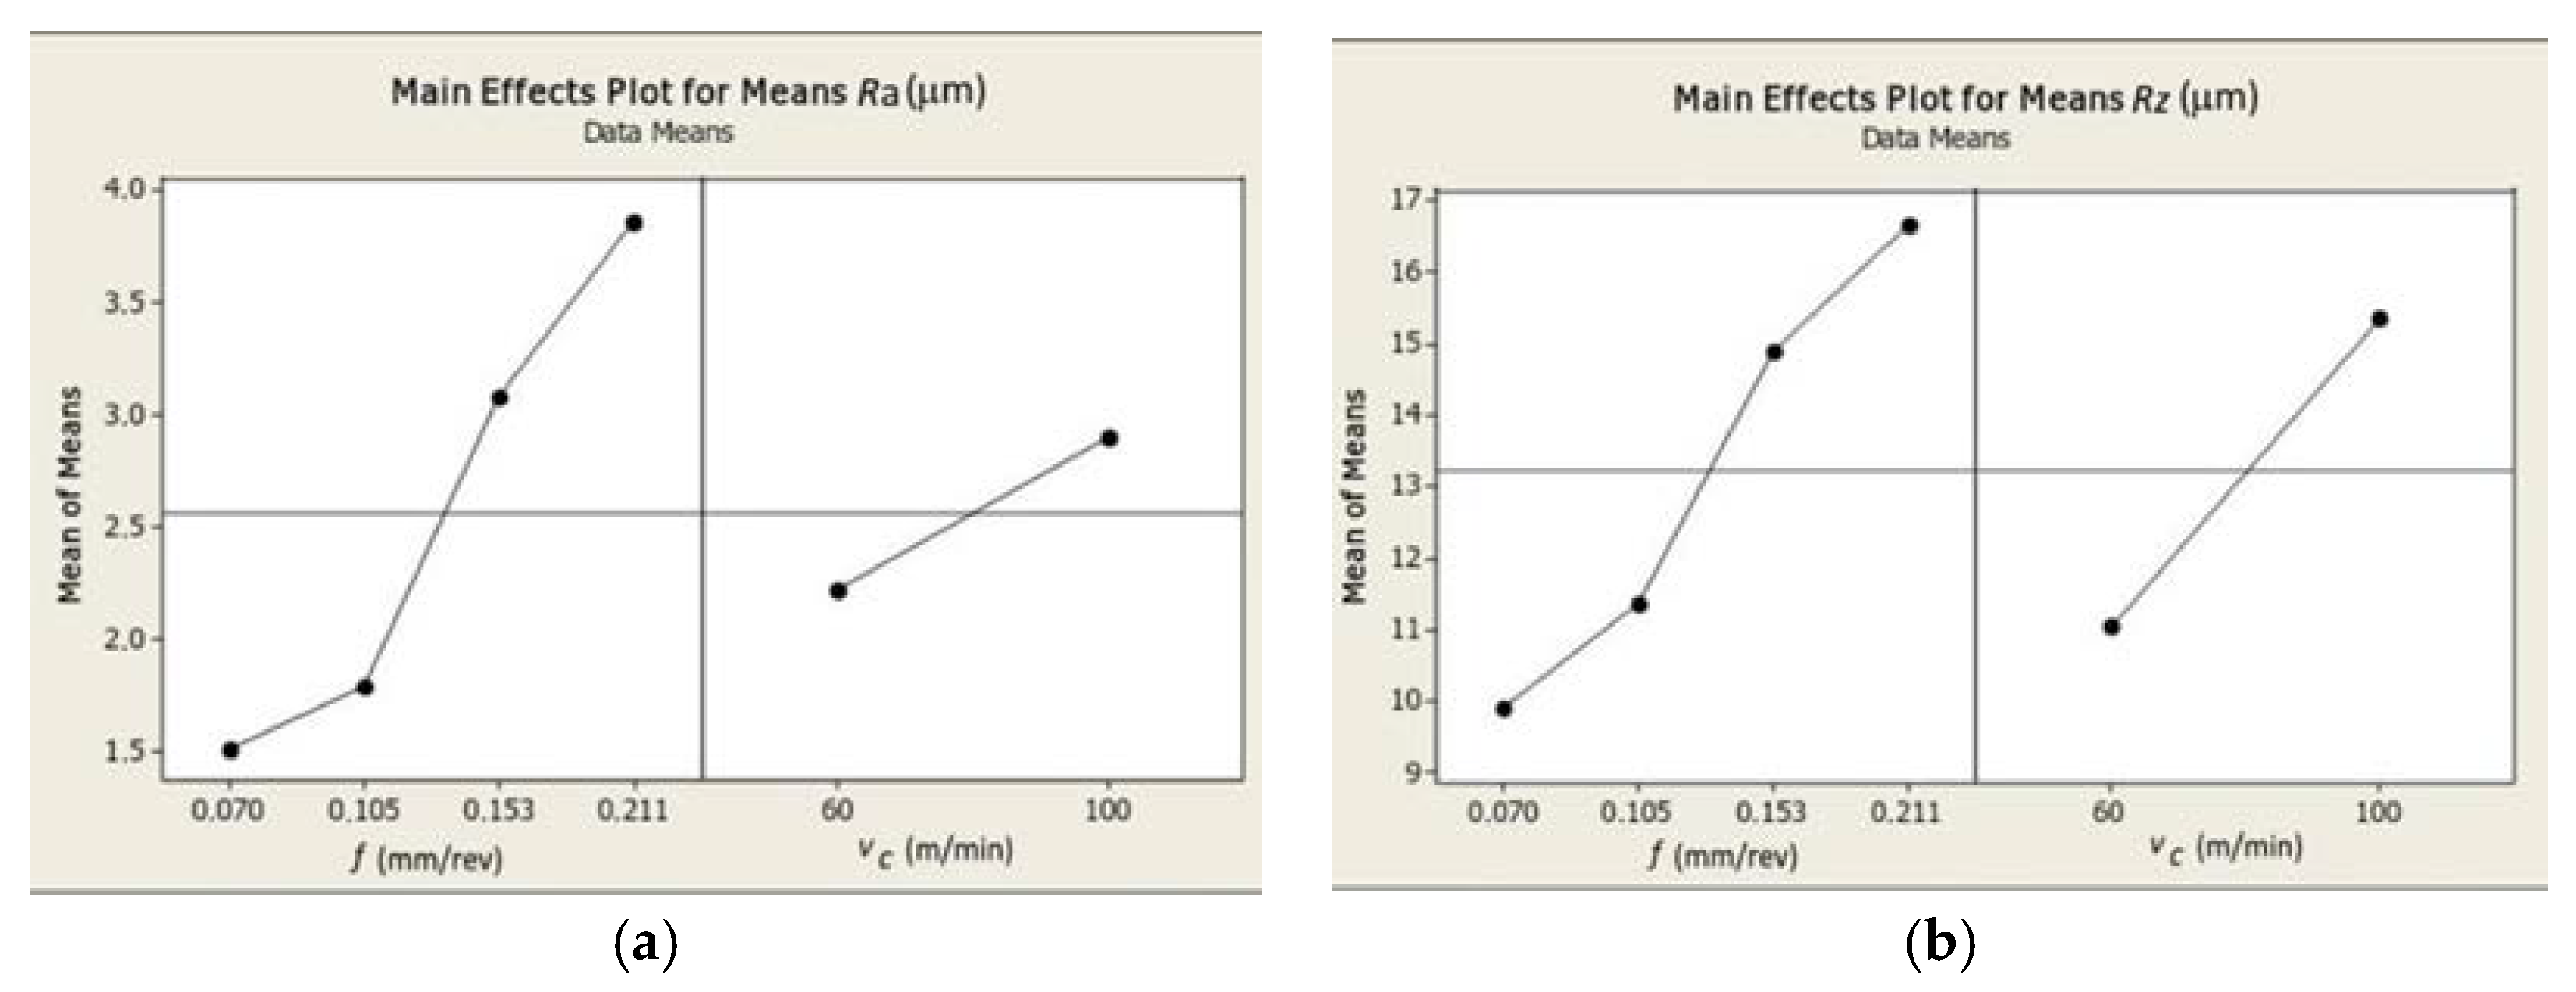
The graphical representations of the impact of the surface roughness parameters Ra and Rz on the cutting data and S/N factor are presented in Figure 6.
Figure 6.
Graphs representing relation between the cutting data (f, vc) and: (a) surface roughness parameter Ra; and (b) surface roughness parameter Rz.
The cutting feed increase causes the increase of surface roughness Ra and Rz. Results analysis presented in Figure 6 additively confirms the most significant impact of feed rate on the cutting forces Fc, Ff and Fp. Table 13 and Table 14 present the ANOVA regression analysis results for each roughness parameter. Ra(f, vc) and Rz(f, vc) are described by Equations (5) and (6).
Table 13.
Analysis of variance for average values of the surface roughness parameter Ra.
Table 14.
Analysis of variance for average values of surface roughness parameter Rz.
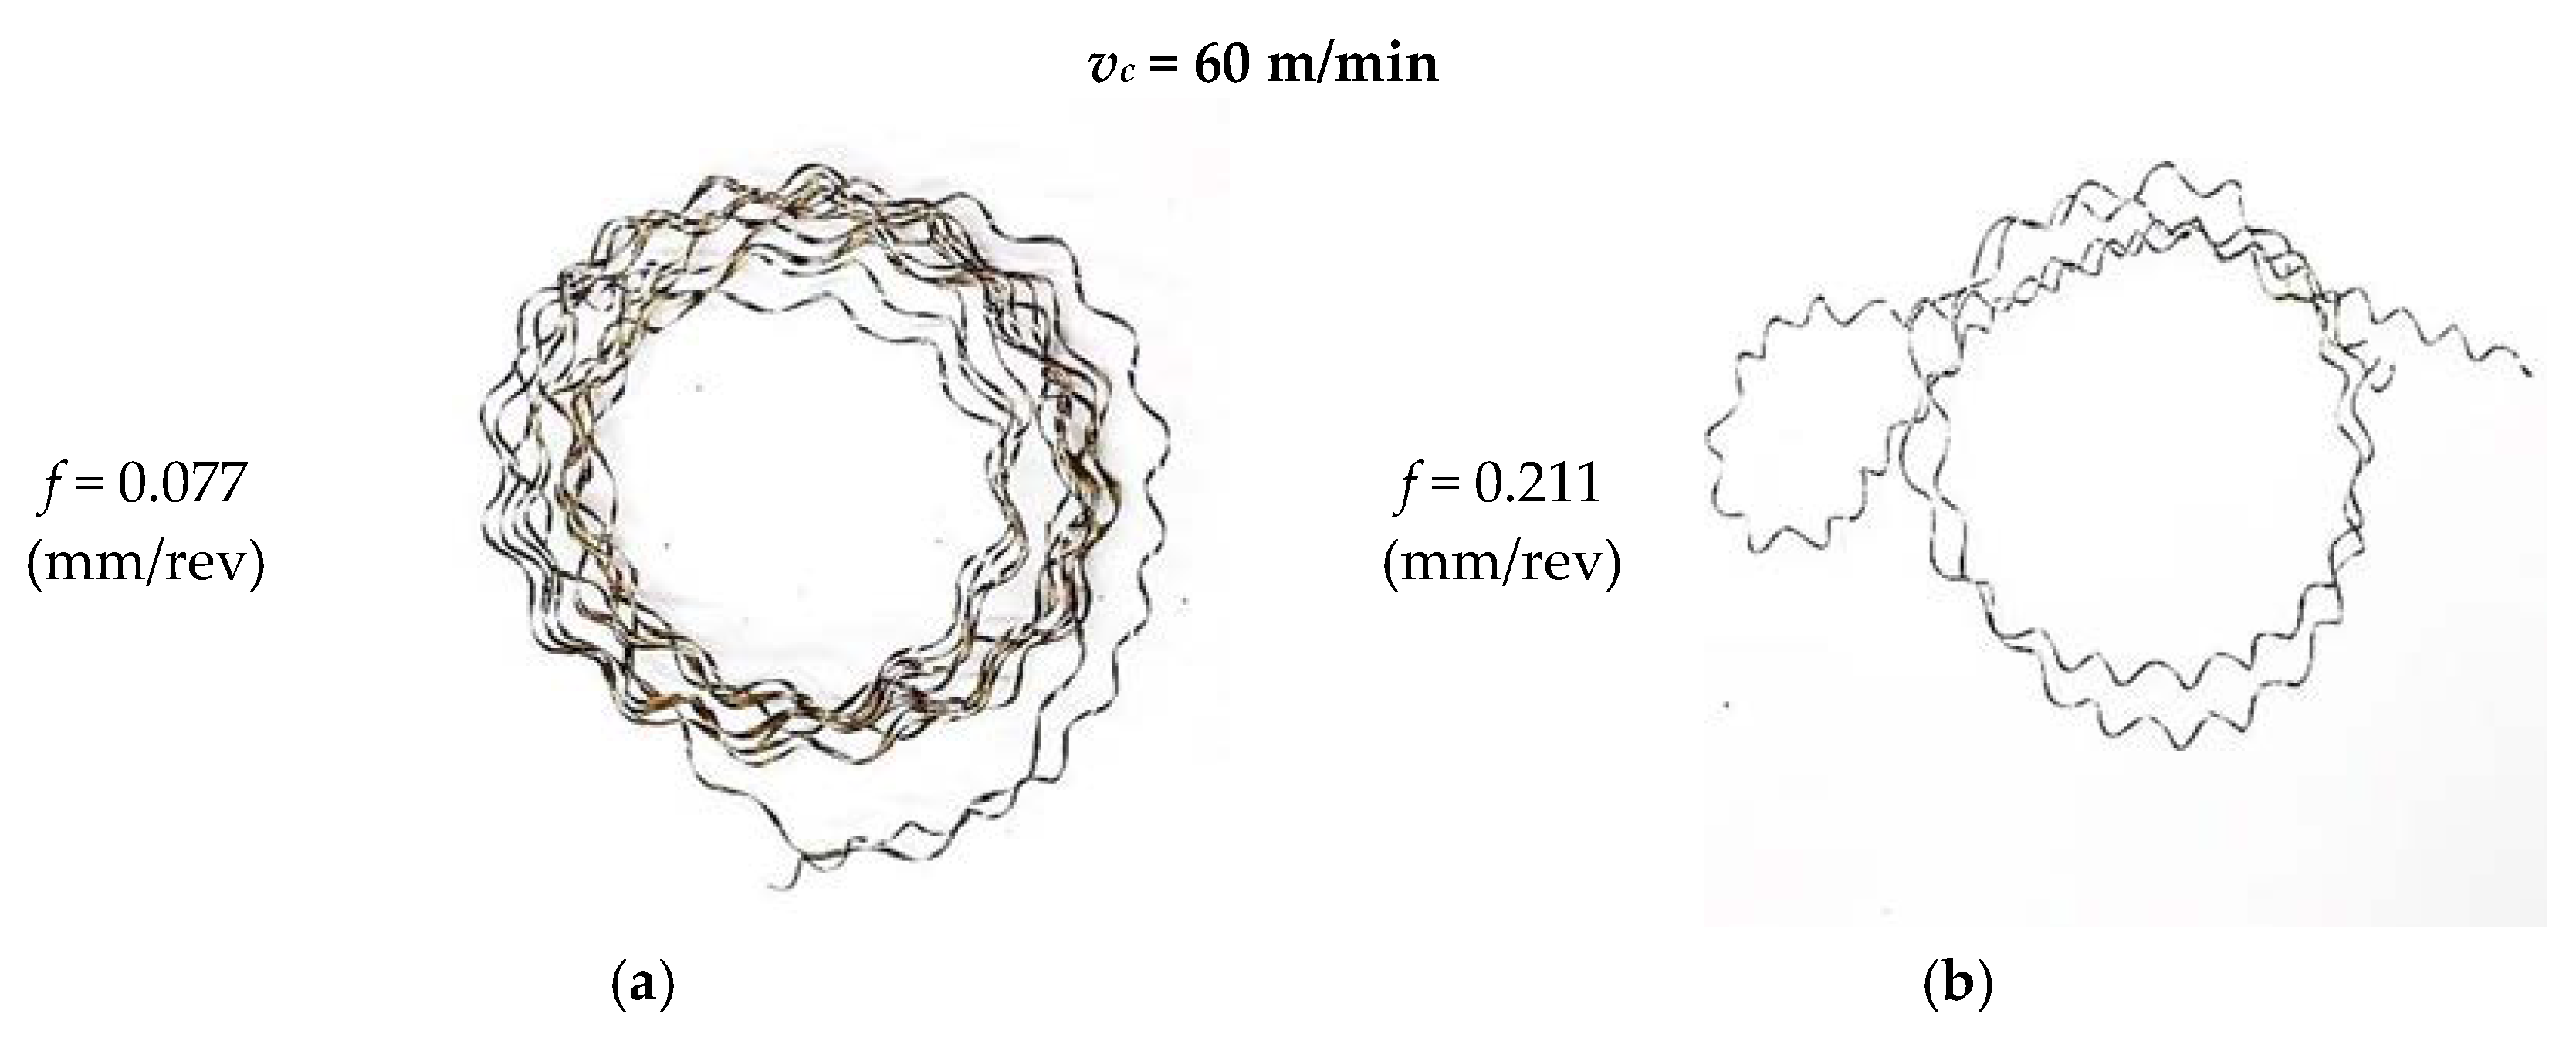
Figure 7 shows photographs of the obtained chips for selected compositions of the experimental design (Trial 1 for fmin and Trial 7 for fmax). During the experimental research, the classification of created chips was performed. A three-step scale was adopted: “+”, advantageous chips; “−“, disadvantageous chips; and “0”, unacceptable chips. In all experimental tests, unacceptable chips were obtained (long, tangled, and spiral).
Figure 7.
Photographs of example chips for fmin = 0.07 mm/rev (a) and fmax = 0.211 mm/rev (b).
5. Results Analysis of Temperature in Cutting Zone
The temperature measurements were performed using a FLIR SC 620 thermal camera (FLIR Systems, Wilsonville, OR, USA)which was installed above the cutting zone and connected to a computer. ThermaCam Researcher Pro 2.9 (FLIR Systems, Wilsonville, OR, USA) was used for acquisition and analysis of the recorded thermograms. Two-second sequences of a stable phase of machining process (30 frames per second) were recorded and the maximum temperature Tmax that existed in the cutting area was obtained. The main errors during temperature measurements are the emissivity factor and reflections. In our case, the emissivity factor was 0.98. The configuration parameters of the thermal camera are presented in Table 15.
Table 15.
The configuration parameters of the thermal camera.
Figure 8 presents the thermal vision of the cutting zone and selected thermograms of tests for vc = 60 m/min fmin = 0.07 mm/rev and fmax = 0.211 mm/rev.
Figure 8.
Thermograms recorded by ThermaCamResearcher software for: (a) Trial 1, fmin = 0.07 mm/rev; and (b) Trial 7, fmax = 0.211 mm/rev.
Based on the obtained experimental research using the Taguchi methods, the ANOVA regression analysis was performed. Table 16 and Table 17 present obtained results of statistical analysis and values of variance for average analysis.
Table 16.
The statistical analysis results of the maximum temperature Tmax in the cutting zone.
Table 17.
Analysis of variance for average values of the maximum temperature—Tmax.
The polynomial Tmax (f, vc) is described by Equation (7).
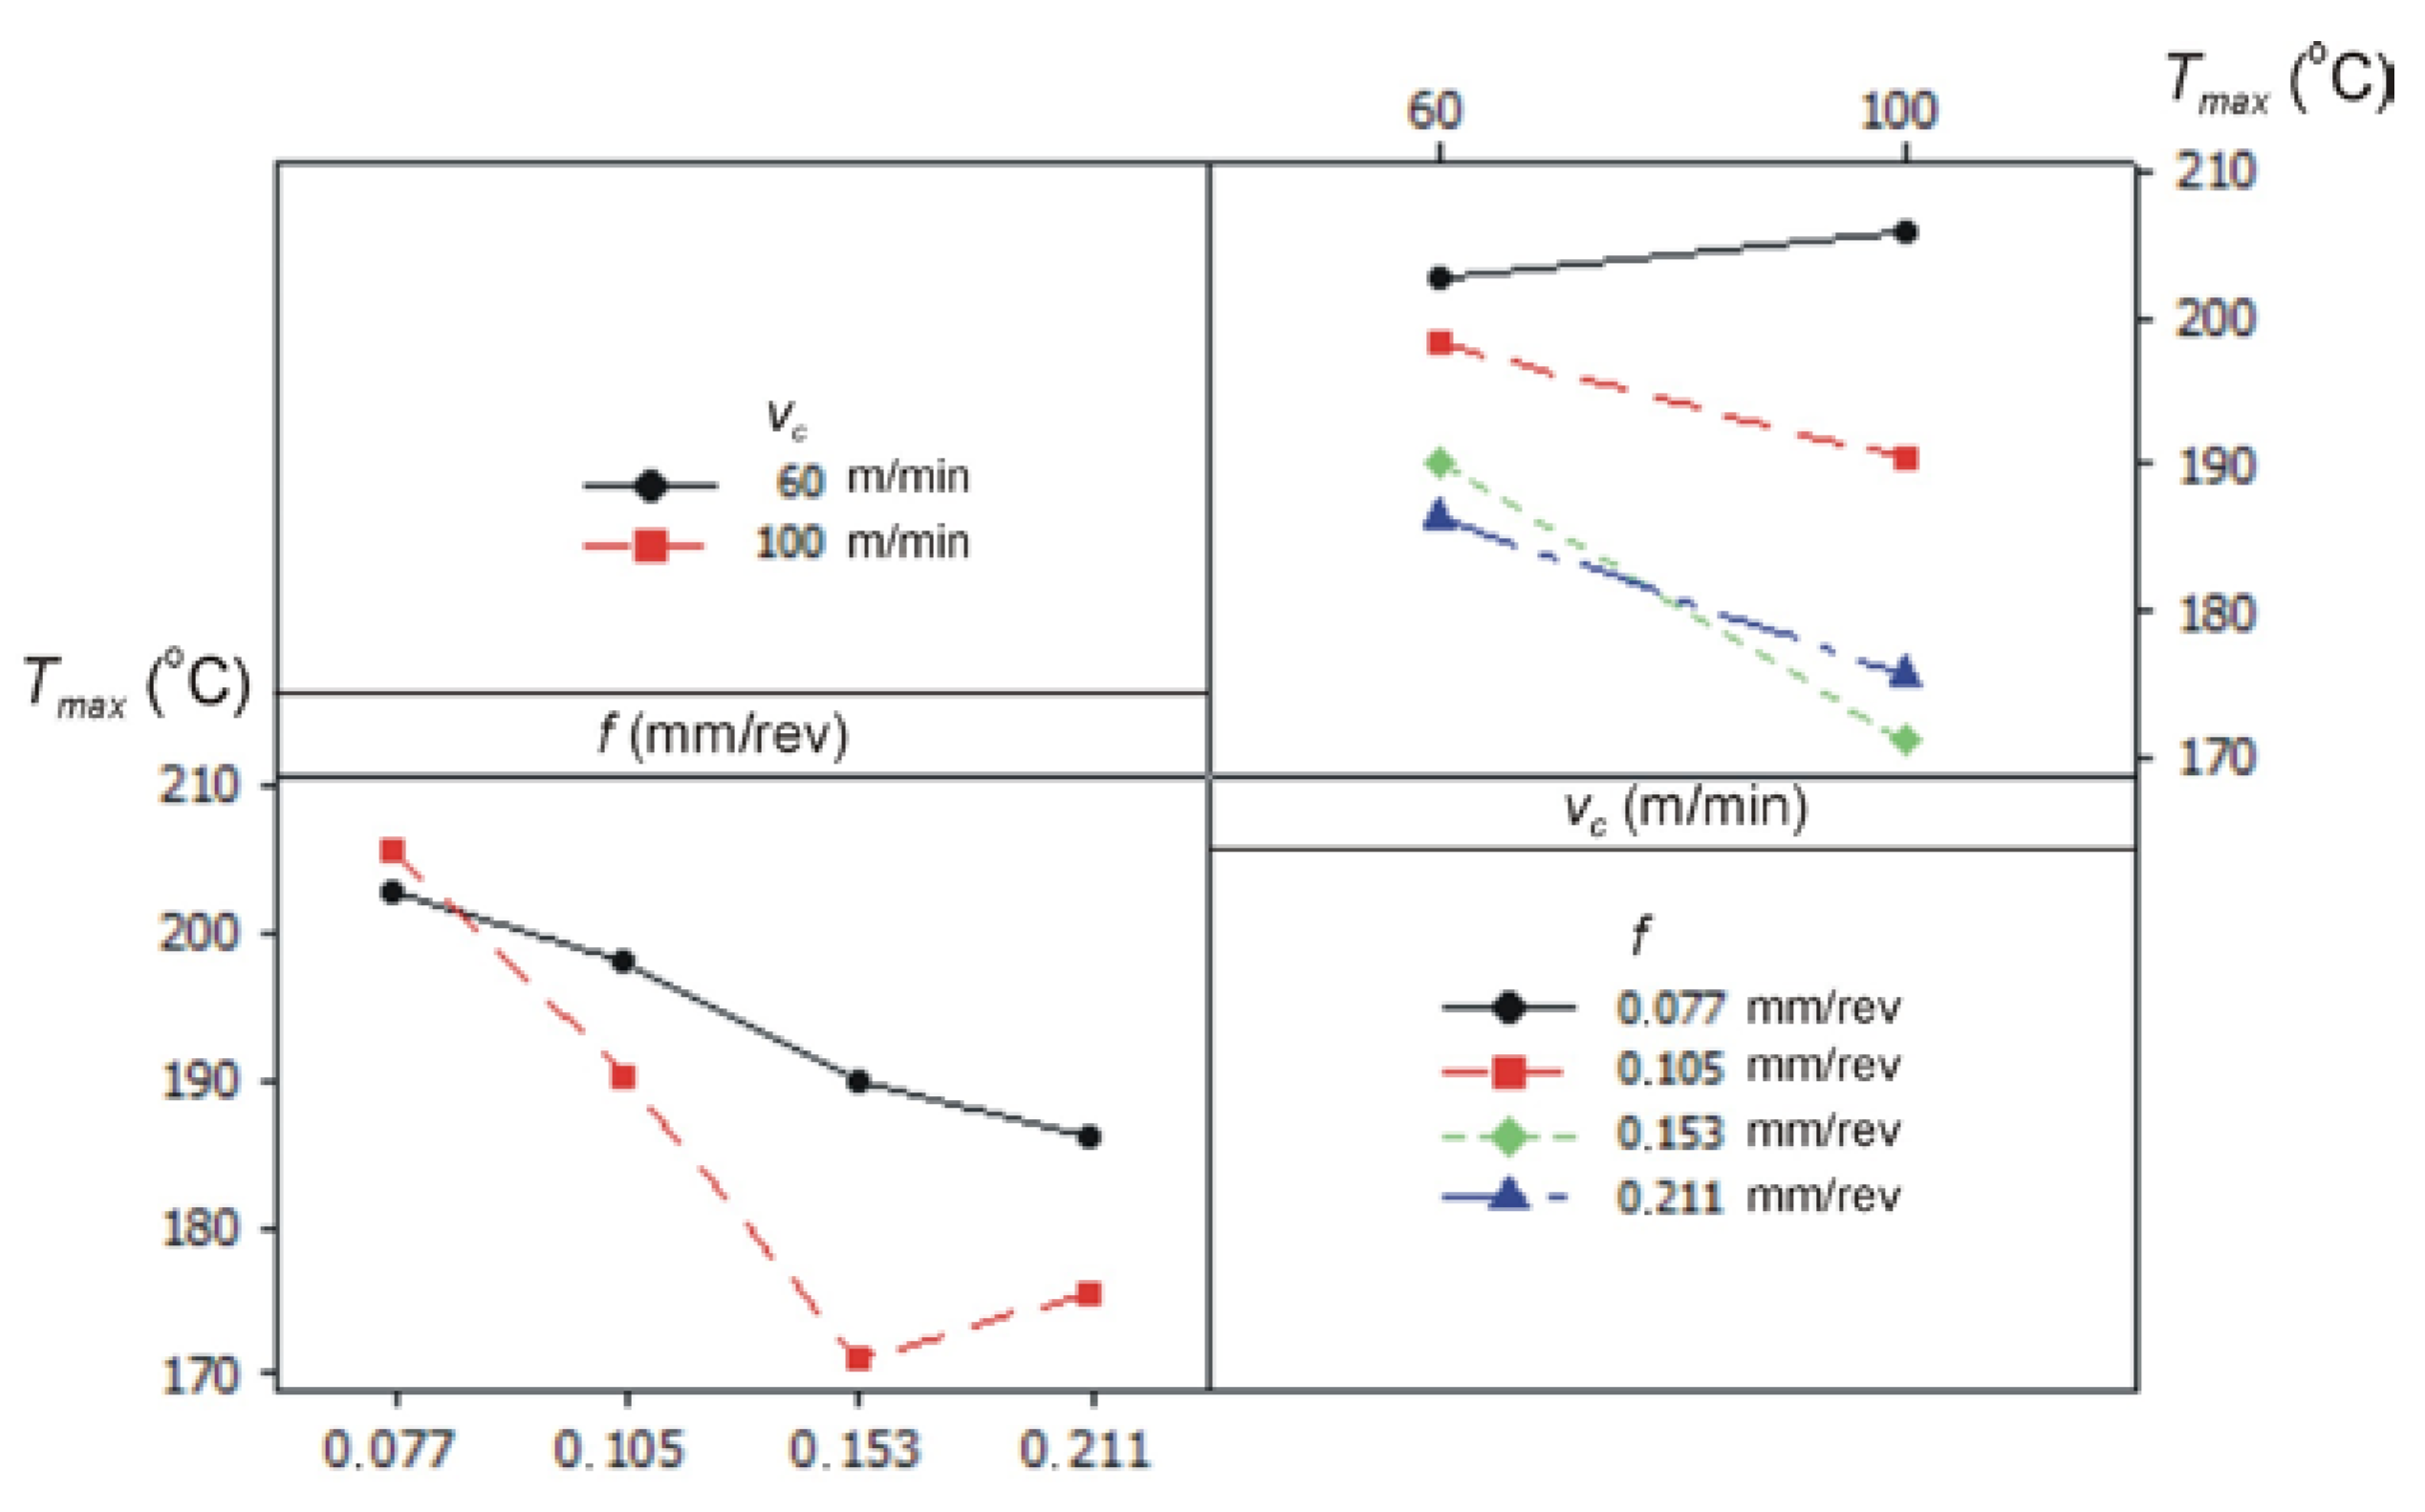
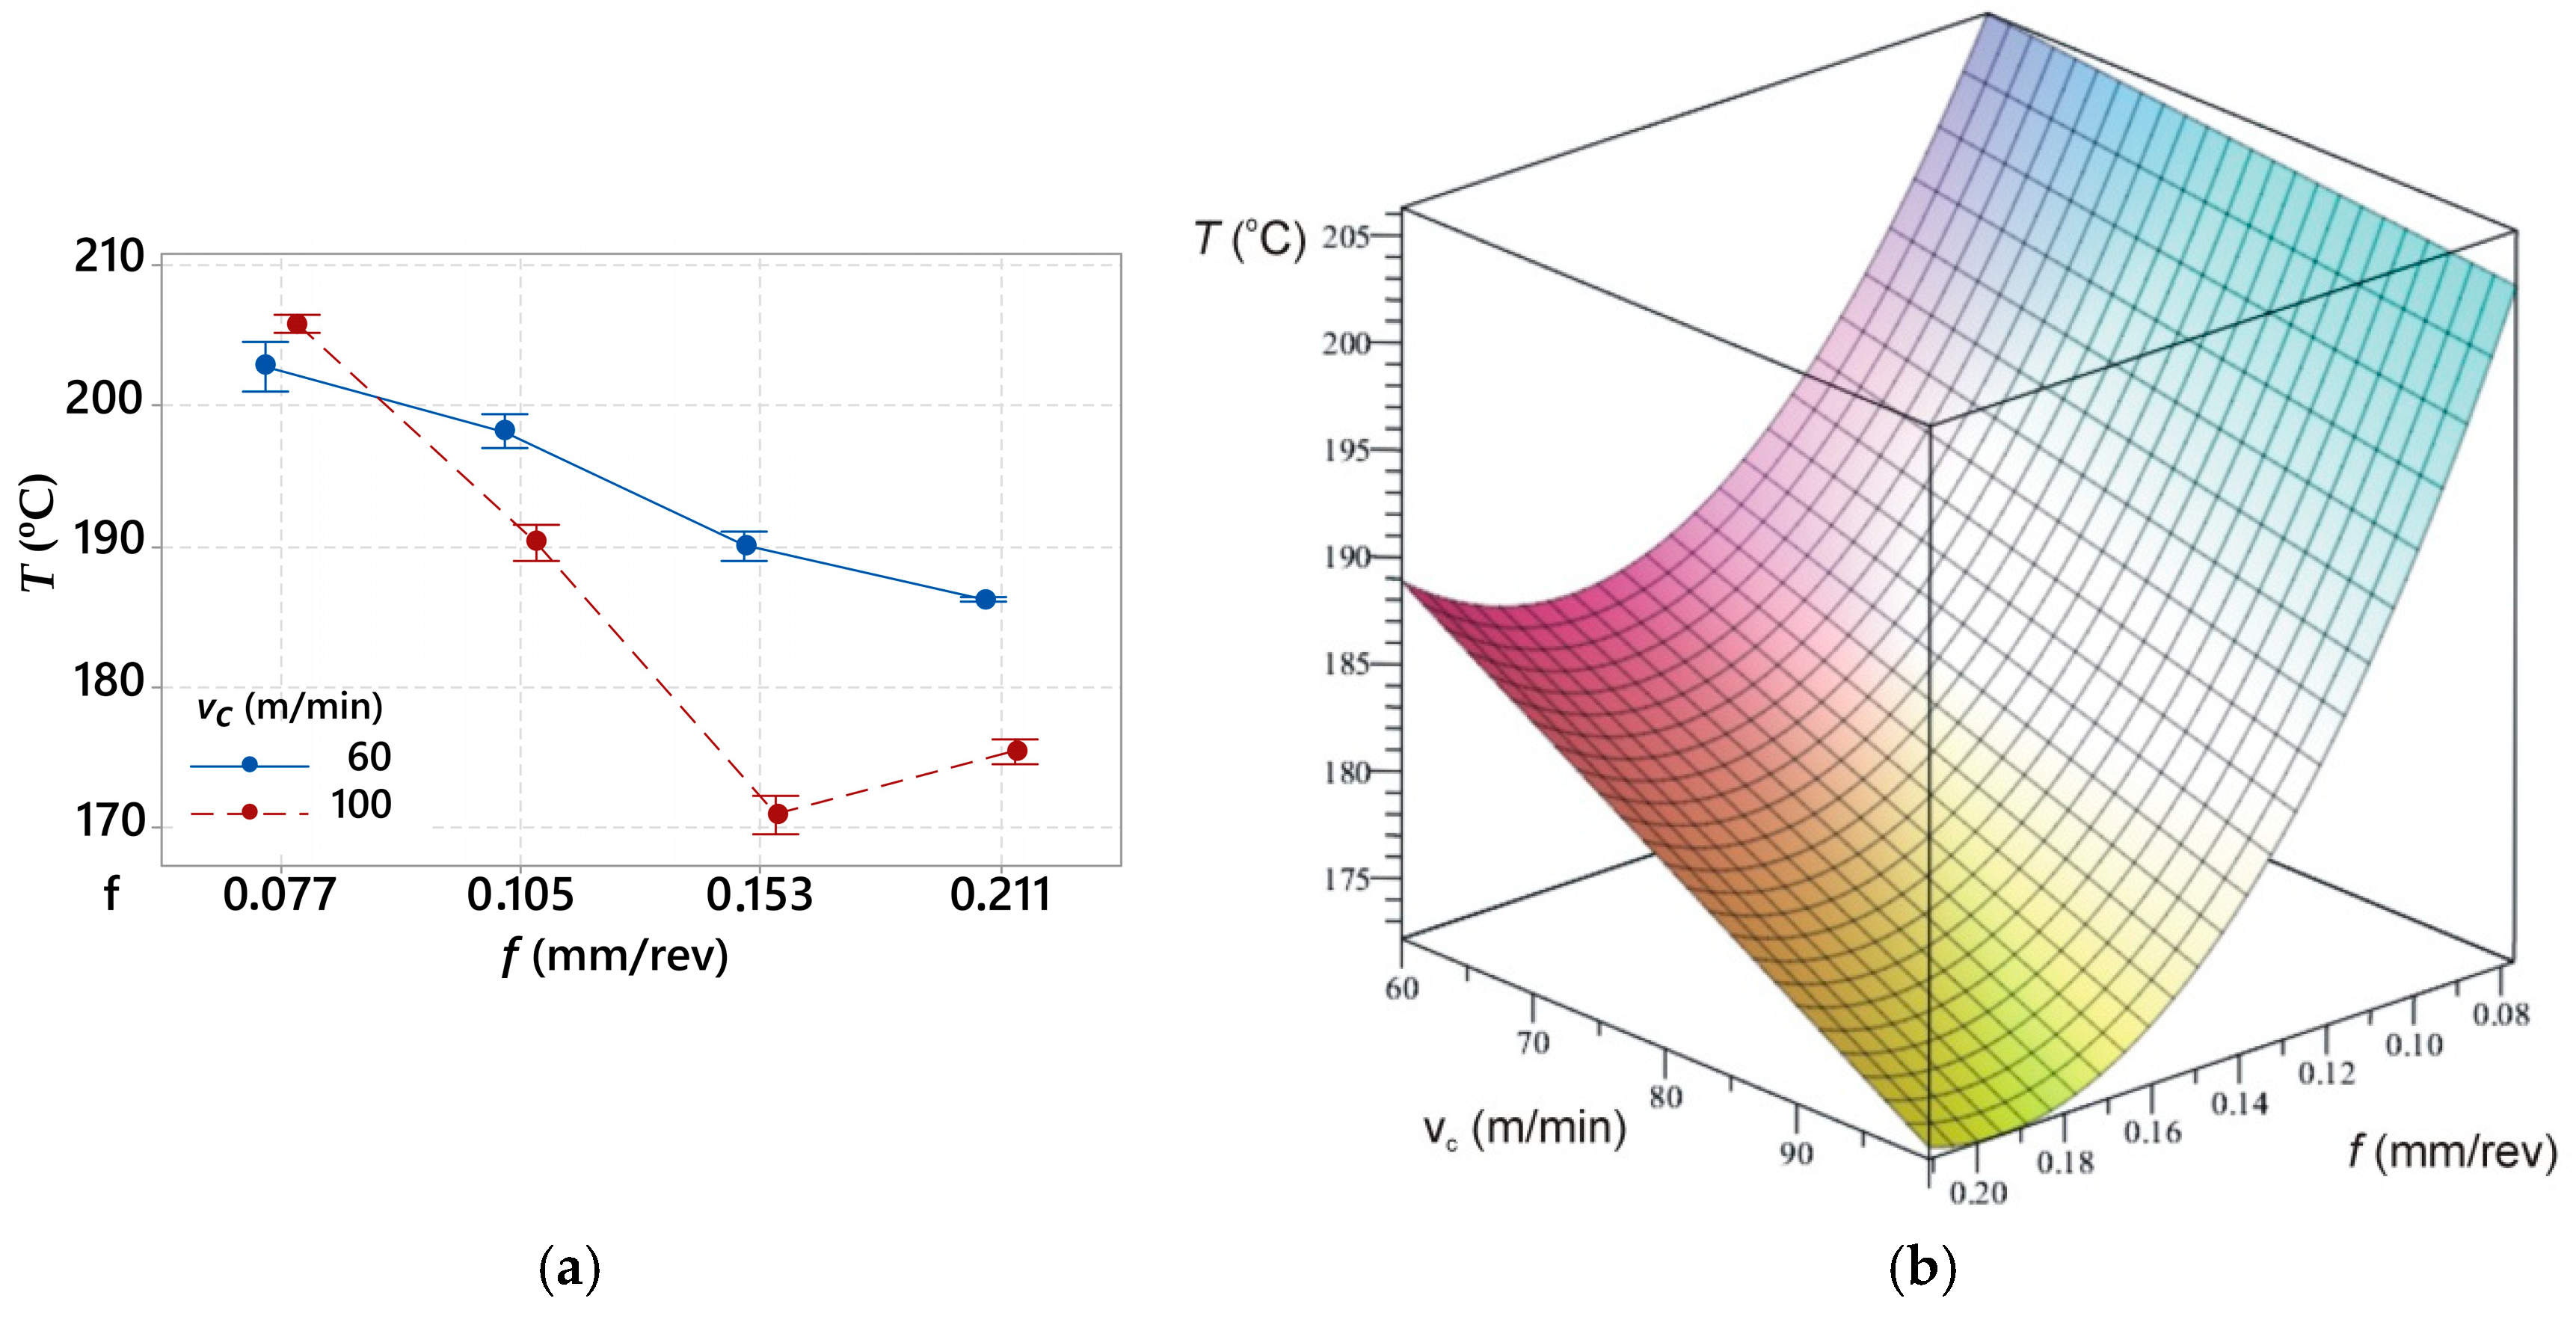
The impact of the cutting data on the values of the maximum temperature in the cutting zone is shown in Figure 9.
Figure 9.
Graphs representing the relation between the average maximum temperature Tmax and the cutting data (f, vc).
During the experimental research, the camera was installed perpendicular to the cutting zone and recorded the flown chip on the rake face of the cutting insert. It had the most impact on the recorded value of the temperature. The feed rate increase contributes to a decrease of the maximum temperature recorded by the thermal camera. The section of the cutting layer and chip thickness increase with a feed increase. Further, the part of generated heat flux on the junction chip and cutting edge spreads in more material volume. The cutting speed increase causes a decrease of the temperature value in the cutting zone. It can result from the shorter contact time between the chip and the cutting edge, which effects on the decrease of the heat source friction.
Figure 10a,b shows the relation between the average maximum temperature and feed rate during the applied cutting speed of vc = 60 m/min and vc = 100 m/min.
Figure 10.
(a) Diagram representing relation between the average maximum temperature Tmax and the feed rate f with an applied cutting speed of vc = 60 m/min and vc = 100 m/min; and (b) 3D graph.
The analysis of Figure 10 shows that an applied lower cutting speed causes higher temperature values in the cutting zone. A similar correlation was observed for the components of the cutting forces.
6. Conclusions
The following can be concluded from the performed experimental research:
- Speed rate f has a significant effect on the values of the cutting forces. The speed rate increase causes the linear increase of all components of the cutting forces. The values of the cutting forces can be decreased by the increase of the cutting speed values. During the applied cutting speed of vc = 100 m/min, the total cutting force is about threefold lower than for the applied vc = 60 m/min.
- Surface roughness values (Ra and Rz) are connected to the feed rate f and cutting speed vc. For threefold increase of the speed rate f, values of surface roughness parameters Ra increase 2.5-fold, and values of surface roughness parameters Rz increase about 1.5-fold. In addition, higher values of surface roughness parameters (Ra and Rz) were obtained for vc = 100 m/min than vc = 60 m/min.
- Values of the average maximum temperature Tmax in the cutting zone decrease with the increase of the speed rate f and the cutting speed vc; the correlations are connected to chip thickness and contact time chip between the chip and the cutting edge, respectively.
- The applied cutting data have no effect on the chips form—all of them were unacceptable.
Author Contributions
Conceptualization, W.Z.; Methodology, W.Z. and G.S.; Validation, Ł.Ś., A.M. and F.L.; Formal Analysis, F.L. and S.H.; Writing-Original Draft Preparation, G.S. S.H. and M.M.; Writing-Review & Editing, G.S., M.M., Ł.Ś. and A.M.; Editing, G.S. and M.M., Visualization, M.M. A.M. and Ł.Ś.; Supervision, W.Z. and G.S.
Funding
This research received no external funding.
Conflicts of Interest
The authors declare no conflict of interest.
References
- AlMangour, B.; Grzesiak, D.; Borkar, T.; Yang, J.-M. Densification behavior, microstructural evolution, and mechanical properties of TiC/316L stainless steel nanocomposites fabricated by selective laser melting. Mater. Des. 2018, 138, 119–128. [Google Scholar] [CrossRef]
- Bandyopadhyay, A.; Heer, B. Additive manufacturing of multi-material structures. Mater. Sci. Eng. R Rep. 2018, 129, 1–16. [Google Scholar] [CrossRef]
- Herzog, D.; Seyda, V.; Wycisk, E.; Emmelmann, C. Additive manufacturing of metals. Acta Mater. 2016, 117, 371–392. [Google Scholar] [CrossRef]
- Rosa, F.; Manzoni, S.; Casati, R. Damping behavior of 316 L lattice structures produced by Selective Laser Melting. Mater. Des. 2018, 160, 1010–1018. [Google Scholar] [CrossRef]
- Schmidt, M.; Merklein, M.; Bourell, D.; Dimitrov, D.; Hausotte, T.; Wegener, K.; Overmeyer, L.; Vollertsen, F.; Levy, G.N. Laser based additive manufacturing in industry and academia. CIRP Ann. 2017, 66, 561–583. [Google Scholar] [CrossRef]
- Hitzler, L.; Hirsch, J.; Heine, B.; Merkel, M.; Hall, W.; Öchsner, A. On the Anisotropic Mechanical Properties of Selective Laser-Melted Stainless Steel. Materials 2017, 10, 1136. [Google Scholar] [CrossRef]
- Wei, L.C.; Ehrlich, L.E.; Powell-Palm, M.J.; Montgomery, C.; Beuth, J.; Malen, J.A. Thermal conductivity of metal powders for powder bed additive manufacturing. Addit. Manuf. 2018, 21, 201–208. [Google Scholar] [CrossRef]
- Kruth, J.-P.; Levy, G.; Klocke, F.; Childs, T.H.C. Consolidation phenomena in laser and powder-bed based layered manufacturing. CIRP Ann. 2007, 56, 730–759. [Google Scholar] [CrossRef]
- Jabbari, Y.S.A.; Koutsoukis, T.; Barmpagadaki, X.; Zinelis, S. Metallurgical and interfacial characterization of PFM Co–Cr dental alloys fabricated via casting, milling or selective laser melting. Dent. Mater. 2014, 30, e79–e88. [Google Scholar] [CrossRef]
- Fernández, M.; Delgado, L.; Molmeneu, M.; García, D.; Rodríguez, D. Analysis of the misfit of dental implant-supported prostheses made with three manufacturing processes. J. Prosthet. Dent. 2014, 111, 116–123. [Google Scholar] [CrossRef]
- Kluczyński, J.; Śnieżek, L.; Grzelak, K.; Mierzyński, J. The Influence of Exposure Energy Density on Porosity and Microhardness of the SLM Additive Manufactured Elements. Materials 2018, 11, 2304. [Google Scholar] [CrossRef] [PubMed]
- Bartolomeu, F.; Buciumeanu, M.; Pinto, E.; Alves, N.; Carvalho, O.; Silva, F.S.; Miranda, G. 316L stainless steel mechanical and tribological behavior—A comparison between selective laser melting, hot pressing and conventional casting. Addit. Manuf. 2017, 16, 81–89. [Google Scholar] [CrossRef]
- Simson, T.; Emmel, A.; Dwars, A.; Böhm, J. Residual stress measurements on AISI 316L samples manufactured byselective laser melting. Addit. Manuf. 2017, 17, 183–189. [Google Scholar] [CrossRef]
- Ma, M.; Wang, Z.; Zeng, X. A comparison on metallurgical behaviors of 316L stainless steel by selective laser melting and laser cladding deposition. Mater. Sci. Eng. A 2017, C, 265–273. [Google Scholar] [CrossRef]
- Campanelli, S.L.; Contuzzi, N.; Ludovico, A.D.; Caiazzo, F.; Cardaropoli, F.; Sergi, V. Manufacturing and Characterization of Ti6Al4V Lattice Components Manufactured by Selective Laser Melting. Materials 2014, 7, 4803–4822. [Google Scholar] [CrossRef] [PubMed]
- Wang, S.; Liu, Y.; Shi, W.; Qi, B.; Yang, J.; Zhang, F.; Han, D.; Ma, Y. Research on High Layer Thickness Fabricated of 316L by Selective Laser Melting. Materials 2017, 10, 1055. [Google Scholar] [CrossRef] [PubMed]
- Baitimerov, R.; Lykov, P.; Zherebtsov, D.; Radionova, L.; Shultc, A.; Prashanth, K.G. Influence of Powder Characteristics on Processability of AlSi12 Alloy Fabricated by Selective Laser Melting. Materials 2018, 11, 742. [Google Scholar] [CrossRef]
- Khorasani, A.M.; Gibson, I.; Goldberg, M.; Littlefair, G. A comprehensive study on surface quality in 5-axis milling of SLM Ti-6Al-4V spherical components. Int. J. Adv. Manuf. Technol. 2018, 94, 3765–3784. [Google Scholar] [CrossRef]
- Coz, G.L.; Fischer, M.; Piquard, R.; D’Acunto, A.; Laheurte, P.; Dudzinski, D. Micro Cutting of Ti-6Al-4V Parts Produced by SLM Process. Procedia CIRP 2017, 58, 228–232. [Google Scholar] [CrossRef]
- Deev, A.A.; Kuznetcov, P.A.; Petrov, S.N. Anisotropy of mechanical properties and its correlation with the structure of the stainless steel 31L1 produced by the SLM method. Phys. Procedia 2016, 83, 789–796. [Google Scholar] [CrossRef]
- Li, X.; Willy, H.J.; Chang, S.; Lu, W.; Herng, T.S.; Ding, J. Selective laser melting of stainless steel and alumina composite: Experimental and simulation studies on processing parameters, microstructure and mechanical properties. Mater. Des. 2018, 145, 1–10. [Google Scholar] [CrossRef]
- Ahmadi, A.; Mirzaeifar, R.; Moghaddam, N.S.; Turabi, A.S.; Karaca, H.E.; Elahinia, M. Effect of manufacturing parameters on mechanical properties of 316L stainless steel parts fabricated by selective laser melting: A computational framework. Mater. Des. 2016, 112, 328–338. [Google Scholar] [CrossRef]
- Li, H.; Ramezani, M.; Li, M.; Ma, C.; Wang, J. Effect of process parameters on tribological performance of 316L stainless steel parts fabricated by selective laser melting. Manuf. Lett. 2018, 16, 36–39. [Google Scholar] [CrossRef]
- Li, Y.; Gu, D. Parametric analysis of thermal behavior during selective laser melting additive manufacturing of aluminum alloy powder. Mater. Des. 2014, 63, 856–867. [Google Scholar] [CrossRef]
- Liu, Y.; Yang, Y.; Mai, S.; Wang, D.; Song, C. Investigation into spatter behavior during selective laser melting of AISI 316L stainless steel powder. Mater. Des. 2015, 87, 797–806. [Google Scholar] [CrossRef]
- AlMangour, B.; Grzesiak, D.; Cheng, J.; Ertas, Y. Thermal behavior of the molten pool, microstructural evolution, and tribological performance during selective laser melting of TiC/316L stainless steel nanocomposites: Experimental and simulation methods. J. Mater. Process. Technol. 2018, 257, 288–301. [Google Scholar] [CrossRef]
- AlMangour, B.; Grzesiak, D. Jenn-MingYang Selective laser melting of TiC reinforced 316L stainless steel matrix nanocomposites: Influence of starting TiC particle size and volume content. Mater. Des. 2016, 104, 141–151. [Google Scholar] [CrossRef]
- Struzikiewicz, G.; Zębala, W.; Rumian, K. Application of Taguchi method to optimization of cutting force and temperature during turning of difficult to cut materials. Key Eng. Mater. 2016, 686, 114–118. [Google Scholar] [CrossRef]
- Struzikiewicz, G.; Otko, T. Dependence of Shape Deviations and Surface Roughness in the Hardened Steel Turning. Key Eng. Mater. 2014, 581, 443–448. [Google Scholar] [CrossRef]
- Ślusarczyk, L.; Franczyk, E. Development and verification of a measuring stand for recording the physical phenomena during turning. Proc. SPIE Int. Soc. Opt. Eng. 2017, 10445. [Google Scholar] [CrossRef]
- Ślusarczyk, Ł. Temperature Distribution in the Machining Zone during the Turning of a Shaft Made of the AMS5643 Steel. Solid State Phenom. 2017, 261, 58–65. [Google Scholar] [CrossRef]
- Iscar Poland Cutting Tools. Available online: https://www.iscar.pl/index.aspx/countryid/11 (accessed on 6 December 2018).
- Nalbant, T.M.; Gökkaya, H.; Sur, G. Application of Taguchi method in the optimization of cutting parameters for surface roughness in turning. Mater. Des. 2007, 28, 1379–1385. [Google Scholar] [CrossRef]
© 2019 by the authors. Licensee MDPI, Basel, Switzerland. This article is an open access article distributed under the terms and conditions of the Creative Commons Attribution (CC BY) license (http://creativecommons.org/licenses/by/4.0/).


