Effect of Defects on Spontaneous Polarization in Pure and Doped LiNbO3: First-Principles Calculations

 ,
,  , ,
, ,
Abstract
1. Introduction
2. Methods
3. Results and Discussion
3.1. Intrinsic Defects in LN
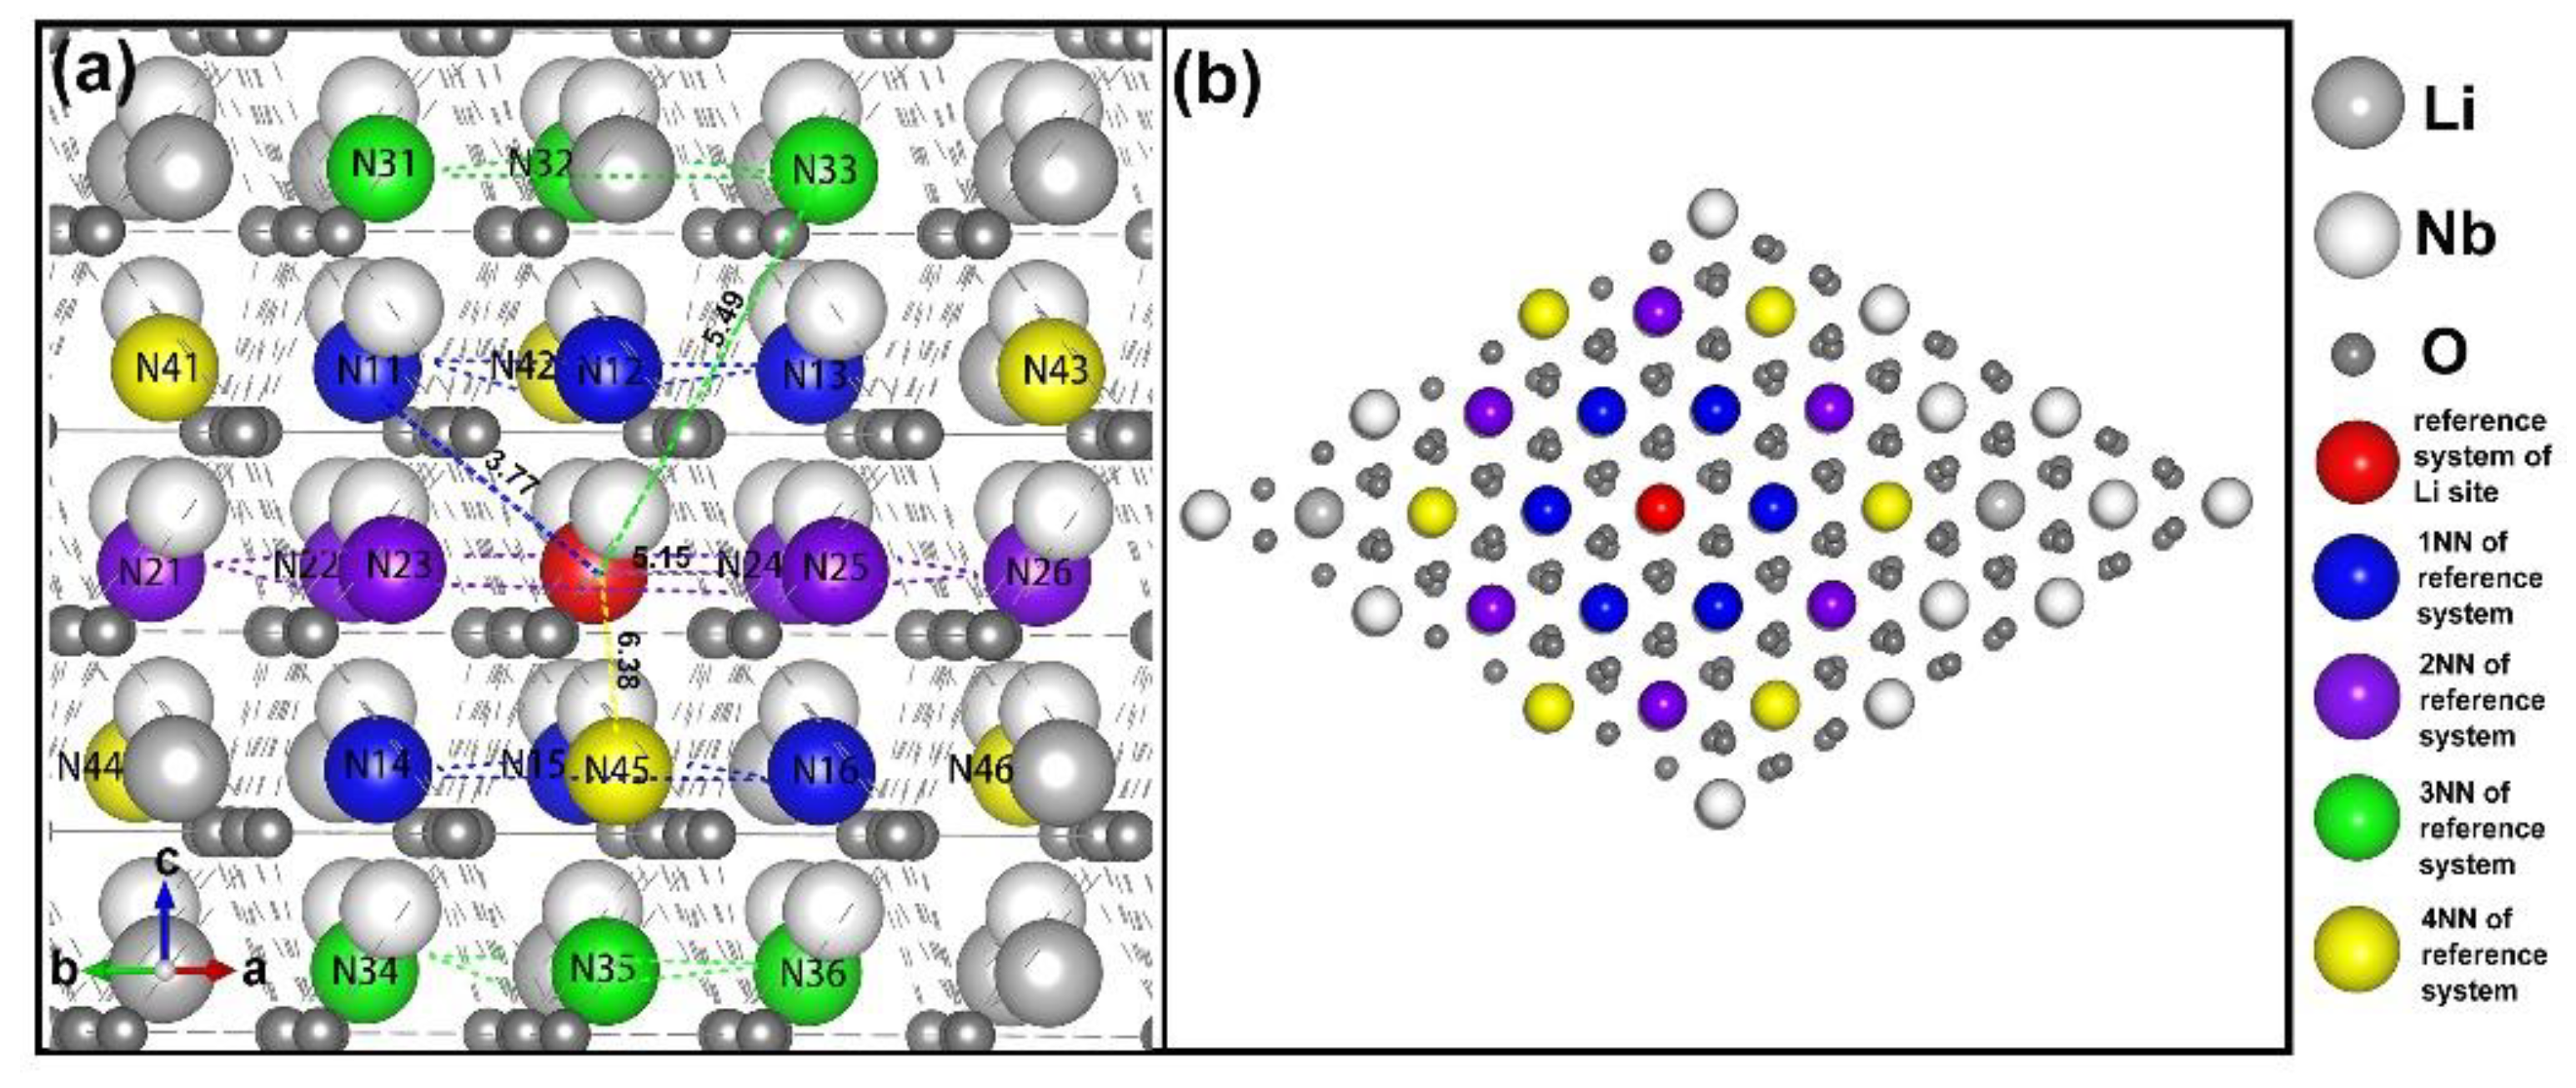
- four lithium vacancies as 1NNs;
- four lithium vacancies as 2NNs;
- four lithium vacancies as 3NNs;
- three lithium vacancies as 1NNs and one other NN;
- three lithium vacancies as 2NNs and one other NN;
- two lithium vacancies as 1NNs and two other NNs;
3.2. Divalent, Trivalent, and Tetravalent Ions Doped LN
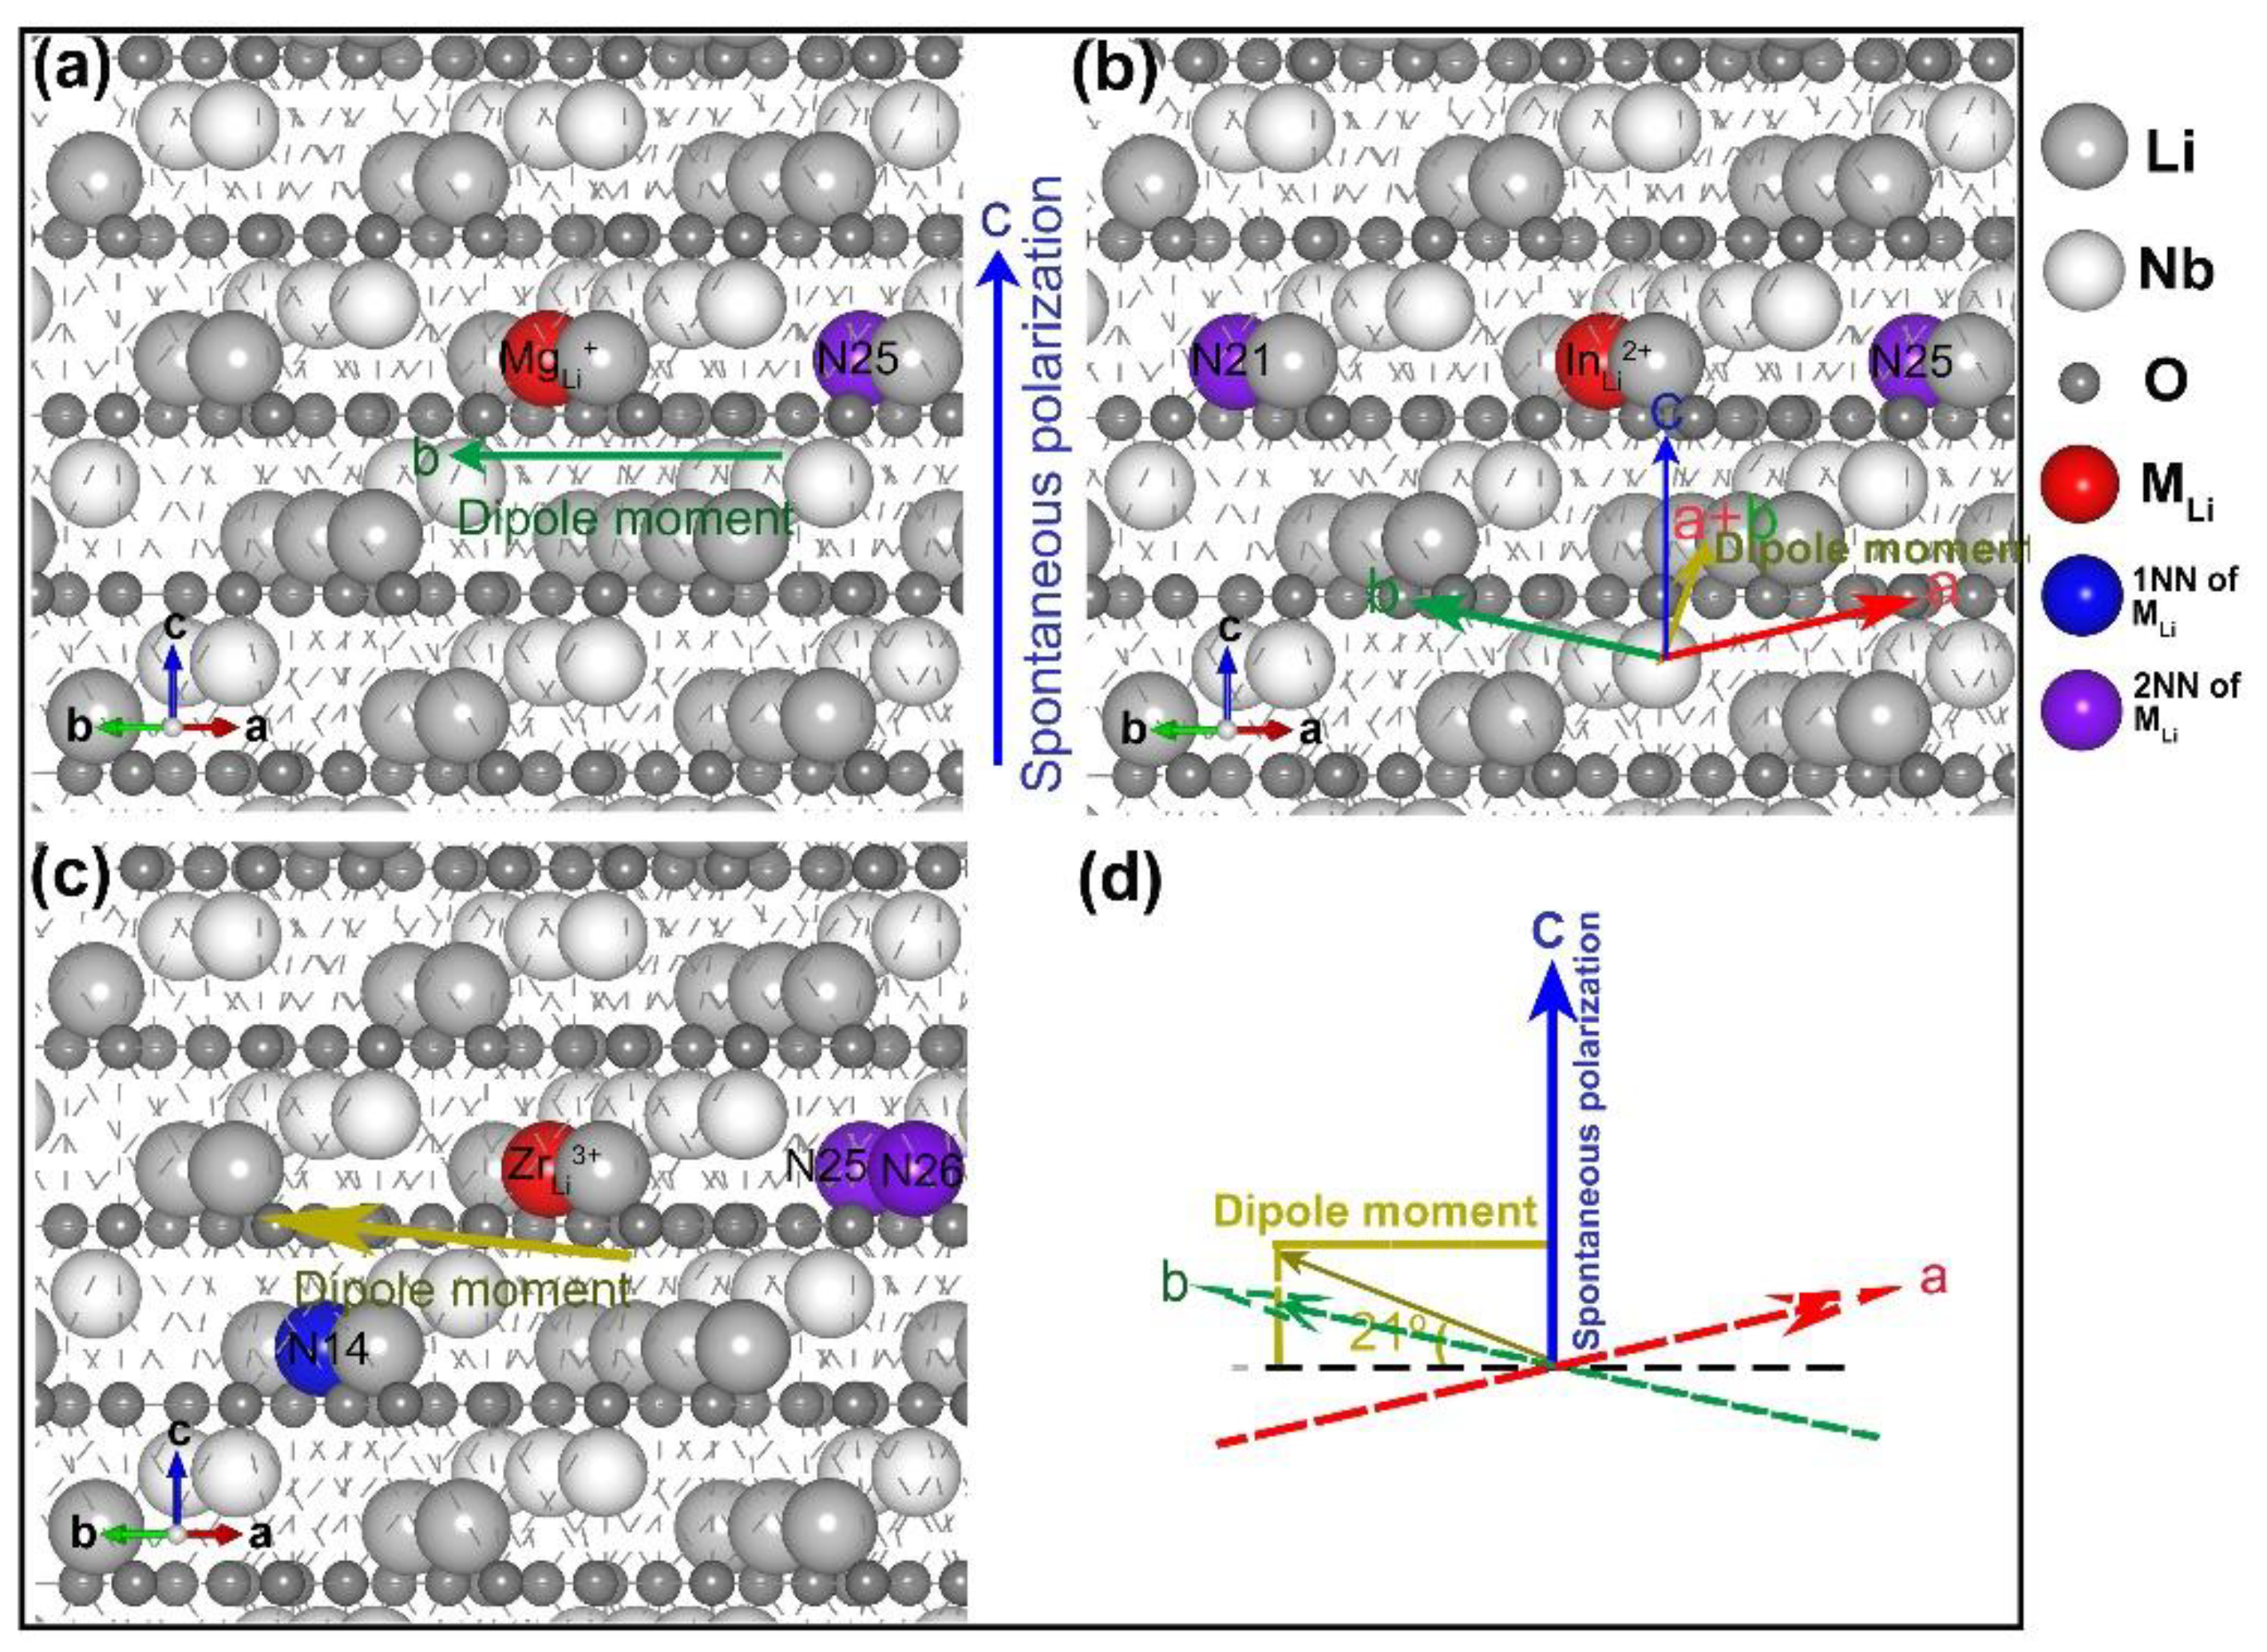
- three lithium vacancies as 1NNs;
- two lithium vacancies as 1NNs and one other;
- two lithium vacancies as 2NN and one other;
- three lithium vacancies as 2NNs;
4. Conclusions
Author Contributions
Funding
Conflicts of Interest
References
- Weis, R.S.; Gaylord, T.K. Lithium niobate Summary of physical properties and crystal structure. Appl. Phys. A 1985, 37, 191–203. [Google Scholar] [CrossRef]
- Boyd, G.D.; Miller, R.C.; Nassau, K.; Bond, W.L.; Savage, A. LiNbO3: An Efficient Phase Matchable Nonlinear Optical Material. Appl. Phys. Lett. 1964, 5, 234–236. [Google Scholar] [CrossRef]
- Iyi, N.; Kitamura, K.; Izumi, F.; Yamamoto, J.K.; Hayashi, T.; Asano, H.; Kimura, S. Comparative study of defect structures in lithium niobate with different compositions. J. Solid State Chem. 1992, 101, 340–352. [Google Scholar] [CrossRef]
- Donnerberg, H.; Tomlinson, S.M.; Catlow, C.R.A.; Schirmer, O.F. Computer-simulation studies of intrinsic defects in LiNbO3 crystals. Phys. Rev. B 1989, 40, 11909–11916. [Google Scholar] [CrossRef]
- Xu, H.; Lee, D.; He, J.; Sinnott, S.B.; Gopalan, V.; Dierolf, V.; Phillpot, S.R. Stability of intrinsic defects and defect clusters in LiNbO3 from density functional theory calculations. Phys. Rev. B 2008, 78. [Google Scholar] [CrossRef]
- Kim, S.; Gopalan, V.; Kitamura, K.; Furukawa, Y. Domain reversal and nonstoichiometry in lithium tantalate. J. Appl. Phys. 2001, 90, 2949–2963. [Google Scholar] [CrossRef]
- Xu, H.; Lee, D.; Sinnott, S.B.; Dierolf, V.; Gopalan, V.; Phillpot, S.R. Structure and diffusion of intrinsic defect complexes in LiNbO3 from density functional theory calculations. J. Phys. Condens. Matter 2010, 22, 135002. [Google Scholar] [CrossRef]
- Bridges, F.; Castillo-Torres, J.; Car, B.; Medling, S.; Kozina, M. EXAFS evidence for a primary ZnLi dopant in LiNbO3. Phys. Rev. B 2012, 85. [Google Scholar] [CrossRef]
- Suche, H.; Wessel, R.; Westenhofer, S.; Sohler, W.; Bosso, S.; Carmannini, C.; Corsin, R. Harmonically mode-locked Ti:Er:LiNbO3 waveguide laser. Opt. Lett. 1995, 20, 596–598. [Google Scholar] [CrossRef]
- Spaeth, H.; Spaeth, J.-M. The site and local environment of Fe3+ in LiNbO3 investigated with ENDOR. J. Phys. Condens. Matter 1992, 4, 9901–9908. [Google Scholar] [CrossRef]
- Kityk, I.V.; Makowska-Janusik, M.; Fontana, M.D.; Aillerie, M.; Abdi, F. Nonstoichiometric Defects and Optical Properties in LiNbO3. J. Phys. Chem. B 2001, 105, 12242–12248. [Google Scholar] [CrossRef]
- Li, Y.; Li, L.; Cheng, X.; Zhao, X. Microscopic properties of Mg in Li and Nb sites of LiNbO3 by first-principle hybrid functional: Formation and related optical properties. J. Phys. Chem. C 2017, 121, 8968–8975. [Google Scholar] [CrossRef]
- Nassau, K.; Levinstein, H.J.; Loiacomo, G.M. The domain structure and etching of ferroelecteic lithium biobate. Appl. Phys. Lett. 1965, 6, 228. [Google Scholar] [CrossRef]
- Zheng, S.J.; Kong, Y.F.; Liu, H.D.; Chen, S.L.; Zhang, L.; Liu, S.G.; Xu, J.J. Pyroelectric effect in green light-assisted domain reversal of Mg-doped LiNbO3 crystals. Opt. Express 2012, 20, 29131–29136. [Google Scholar] [CrossRef] [PubMed]
- Thaniyavaran, S.; Findakly, T.; Boother, D.; Moen, J. Domain inversion effects in Ti-LiNbO3 integrated optical devices. Appl. Phys. Lett. 1985, 46, 933. [Google Scholar] [CrossRef]
- Kresse, G.; Furthmüller, J. Efficient iterative schemes for ab initio total-energy calculations using a plane wave basis set. Phys. Rev. B 1996, 54, 11169–11186. [Google Scholar] [CrossRef]
- Kresse, G.; Furthmüller, J. Efficiency of ab-initio total energy calculations for metals and semiconductors using a plane-wave basis set. Comp. Mater. Sci. 1996, 6, 15–50. [Google Scholar] [CrossRef]
- Blöchl, P.E. Projector augmented-wave method. Phys. Rev. B 1994, 50, 17953–17979. [Google Scholar] [CrossRef]
- Kresse, G.; Joubert, D. From ultrasoft pseudopotentials to the projector augmented-wave method. Phys. Rev. B 1998, 59, 1758–1775. [Google Scholar] [CrossRef]
- Smith, R.G.; Fraser, D.B.; Denton, R.T.; Rich, T.C. Correlation of Reduction in Optically Induced Refractive-Index Inhomogeneity with OH− Content in LiTaO3 and LiNbO3. J. Appl. Phys. 1968, 39, 4600–4602. [Google Scholar] [CrossRef]
- Monkhorst, H.J.; Pack, J.D. Special points for Brillouin-zone integrations. Phys. Rev. B 1976, 13, 5188–5192. [Google Scholar] [CrossRef]
- Redfield, D.; Burke, W.J. Optical absorption edge of LiNbO3. J. Appl. Phys. 1974, 45, 4566–4571. [Google Scholar] [CrossRef]
- Li, Y.; Schmidt, W.G.; Sanna, S. Defect complexes in congruent LiNbO3 and their optical signatures. Phys. Rev. B 2015, 91, 174106. [Google Scholar] [CrossRef]
- Kohan, A.F.; Ceder, G.; Morgan, D.; Van de Walle, C.G. First-principles study of native point defects in ZnO. Phys. Rev. B 2000, 61, 15019–15027. [Google Scholar] [CrossRef]
- He, J.; Behera, R.K.; Finnis, M.W.; Li, X.; Dickey, E.C.; Phillpot, S.R.; Sinnott, S.B. Prediction of high-temperature point defect formation in TiO2 from combined ab initio and thermodynamic calculations. Acta Mater. 2007, 55, 4325–4337. [Google Scholar] [CrossRef]
- Komsa, H.P.; Rantala, T.T.; Pasquarello, A. Finite-size supercell correction schemes for charged defect calculations. Phys. Rev. B 2012, 86, 045112. [Google Scholar] [CrossRef]
- Leslie, M.; Gillan, N.J. The energy and elastic dipole tensor of defects in ionic crystals calculated by the supercell method. J. Phys. C Solid State Phys. 1985, 18, 973–982. [Google Scholar] [CrossRef]
- Van de Walle, C.G.; Neugebauer, J. First-principles calculations for defects and impurities: Applications to III-nitrides. J. Appl. Phys. 2004, 95, 3851–3879. [Google Scholar] [CrossRef]
- Lany, S.; Zunger, A. Assessment of correction methods for the band-gap problem and for finite-size effects in supercell defect calculations: Case studies for ZnO and GaAs. Phys. Rev. B 2008, 78. [Google Scholar] [CrossRef]
- Xu, H.; Lee, D.; Sinnott, S.B.; Gopalan, V.; Dierolf, V.; Phillpot, S.R. Structure and energetics of Er defects in LiNbO3 from first-principles and thermodynamic calculations. Phys. Rev. B 2009, 80, 144104. [Google Scholar] [CrossRef]
- Li, L.; Li, Y.; Zhao, X. Hybrid density functional theory insight into the stability and microscopic properties of Bi-doped LiNbO3: Lone electron pair effect. Phys. Rev. B 2017, 96. [Google Scholar] [CrossRef]
- Xu, H.; Chernatynskiy, A.; Lee, D.; Sinnott, S.B.; Gopalan, V.; Dierolf, V.; Phillpot, S.R. Stability and charge transfer levels of extrinsic defects in LiNbO3. Phys. Rev. B 2010, 82. [Google Scholar] [CrossRef]
- Li, L.; Li, Y.; Zhao, X. Doping stability of nonphotorefractive ions in stoichiometric and congruent LiNbO3. Phys. Chem. Chem. Phys. 2018, 20, 17477–17486. [Google Scholar] [CrossRef] [PubMed]
- Byer, R.L. Quasi-Phasematched Nonlinear Interactions and Devices. J. Nonlinear Opt. Phys. Mater. 1997, 6, 549–592. [Google Scholar] [CrossRef]


| Situations | DFE (eV) | Configuration of 4 Lithium Vacancies | Polarization Change (μC·cm−2) |
|---|---|---|---|
| I four lithium vacancies as 1NNs; | 13.280 | 1NN + 1NN + 1NN + 1NN | |
| II four lithium vacancies as 2NNs; | 13.204 | 2NN + 2NN + 2NN + 2NN | |
| III four lithium vacancies as 3NNs; | 13.357 | 3NN + 3NN + 3NN + 3NN | |
| IV three lithium vacancies as 1NNs and one other NN; | 13.246 | 1NN + 1NN + 1NN + 2NN | |
| V three lithium vacancies as 2NNs and one other NN; | 13.222 | 2NN + 2NN + 2NN + 1NN | |
| VI two lithium vacancies as 1NNs and two other NNs; | 13.166 | 1NN + 1NN + 2NN + 2NN | 2.8 |
| Kim’s Model | 13.389 | 1NN + 1NN + 1NN + one in the direction of polarization | 3.2 [7] |
| Xu’s Model | 13.307 | 1NN + 1NN + 1NN + 1NN | 0.8 [7] |
| MgLi+ + VLi− | ScLi2+ + 2VLi− | ZrLi3+ + 3VLi− | |||
|---|---|---|---|---|---|
| Specific Configuration | DFE (eV) | Specific Configuration | DFE (eV) | Specific Configuration | DFE (eV) |
| 1NN | 0.924 | 1NN + 1NN | 6.575 | 1NN + 1NN + 1NN | 9.343 |
| 2NN | 0.862 | 1NN + 2NN | 6.508 | 1NN + 1NN + 2NN | 9.338 |
| 3NN | 0.967 | 2NN + 2NN | 6.466 | 1NN + 2NN + 2NN | 9.111 |
| 2NN + 2NN + 2NN | 9.133 | ||||
© 2018 by the authors. Licensee MDPI, Basel, Switzerland. This article is an open access article distributed under the terms and conditions of the Creative Commons Attribution (CC BY) license (http://creativecommons.org/licenses/by/4.0/).
Share and Cite
Wang, W.; Zheng, D.; Hu, M.; Saeed, S.; Liu, H.; Kong, Y.; Zhang, L.; Xu, J. Effect of Defects on Spontaneous Polarization in Pure and Doped LiNbO3: First-Principles Calculations. Materials 2019, 12, 100. https://doi.org/10.3390/ma12010100
Wang W, Zheng D, Hu M, Saeed S, Liu H, Kong Y, Zhang L, Xu J. Effect of Defects on Spontaneous Polarization in Pure and Doped LiNbO3: First-Principles Calculations. Materials. 2019; 12(1):100. https://doi.org/10.3390/ma12010100
Chicago/Turabian StyleWang, Weiwei, Dahuai Zheng, Mengyuan Hu, Shahzad Saeed, Hongde Liu, Yongfa Kong, Lixin Zhang, and Jingjun Xu. 2019. "Effect of Defects on Spontaneous Polarization in Pure and Doped LiNbO3: First-Principles Calculations" Materials 12, no. 1: 100. https://doi.org/10.3390/ma12010100
APA StyleWang, W., Zheng, D., Hu, M., Saeed, S., Liu, H., Kong, Y., Zhang, L., & Xu, J. (2019). Effect of Defects on Spontaneous Polarization in Pure and Doped LiNbO3: First-Principles Calculations. Materials, 12(1), 100. https://doi.org/10.3390/ma12010100