Article

Understanding of BeCu Interaction Characteristics with a Variation of ns Laser-Pulse Duration

Department of Mechanical and Automotive Engineering, Kongju National University, Cheonan 31080, Korea
Materials 2018, 11(8), 1423; https://doi.org/10.3390/ma11081423
Submission received: 10 July 2018 / Revised: 8 August 2018 / Accepted: 12 August 2018 / Published: 13 August 2018
(This article belongs to the Section Manufacturing Processes and Systems)

Abstract

:
An inspection process using a Spring Contact Probe (SCP) is an essential step in the semiconductor-manufacturing process. Many plungers, which are the main body of the SCP, are manufactured by a stamping process. After the stamping process, mechanical cutting is applied and the plunger body may be damaged. Thus, to improve cut quality and productivity while minimizing body damage, laser spot cutting can be used. To fully utilize this technology, it is necessary to investigate interaction characteristics of beryllium copper (BeCu) during laser spot cutting. Effects of a total irradiated laser-pulse energy (1 mJ ~1000 mJ ) and pulse duration (100 ns ~8 ns ) on the material-removal zone, thermal depth, and crater size are examined. The crater size can be affected by the localization of heating dominantly. An incubation model is applied to investigate the correlation between crater size and laser-pulse energy. Surface morphology characteristics such as edge separation, small particles, spatter motion, and soaring-up motion are observed.

1. Introduction

After semiconductor chips are fabricated on wafers, they are divided into individual semiconductor chips. After packaging these semiconductor chips, to be protected from mechanical stress, the packaged semiconductor devices have to be electrically tested. The semiconductor devices with manufacturing defects are classified during the electronic test. Many spring-loaded contact probes are used to test electrical connectivity between a Printed Circuit Board (PCB) and the semiconductor devices [1]. These probes are called Spring Contact Probes (SCP) [2]. A typical composition of an SCP is a plunger, a barrel, and an internal spring [3], as shown in Reference [4].
A major material of plungers is beryllium copper (BeCu). The plungers are typically coated with gold and this coating improves electrical performance and corrosion resistance. BeCu is a copper alloy with 0.5~3% beryllium and it has high strength, high conductivity, is nonmagnetic, nonsparking, etc. Thus, BeCu can be widely used in metalworking and has many specialized applications, such as musical instruments, precision-measurement devices, electrical connectors, automotive systems, and aerospace systems. The plunger tip is to make contact with the PCB and semiconductor package. A stamping process is applied to manufacture plungers [5] so that a number of plungers are molded together to improve productivity, as shown in Reference [4]. After the stamping process, plunger connection arms need to be cut into pieces. A current cutting method is mechanical cutting. Mechanical cutting may damage the body of plunger owing to the mechanical force applied at the cutting interface [6]. Furthermore, connection arms may be deflected so that fractures can eventually occur because of mechanical-stress accumulation. Moreover, cutting tools wear over time and this tool wear results in process instability and poor cut quality. Poor cut quality may affect electric connectivity between SCP and semiconductor so that electrical performance could be measured incorrectly. In that case, inspection performance and a production yield would be decreased. Therefore, these problems can be solved by applying laser spot cutting. In addition, laser spot cutting may also improve both cut quality and productivity.
Laser cutting is a popular application among laser-aided manufacturing [4,7,8] since it has various advantages, such as being contact-free process, having high-energy concentration, fast processing time, a small Heat-Affected Zone (HAZ), and applicability to almost every material [9]. Thus, laser cutting has been applied to many different types of materials, such as sandwiched composites [10,11,12,13,14,15,16,17,18,19,20,21,22,23], reinforced composites [9,24,25,26,27,28,29], and metals [4,6,8,13,30,31,32,33,34,35,36]. Laser spot cutting is using a laser to separate a workpiece into two or more pieces [4]. Since there is no relative motion, this may make the cutting process more efficient. To examine optimal laser parameters, interaction characteristics between BeCu and laser need to be fully understood. However, there is little information about the interaction characteristics. Therefore, this study examines crater size, thermal depth, and ablation threshold to evaluate ablation characteristics. The ablation threshold and incubation coefficient are compared with the literature. In addition, ablation depth, full penetration, and material-removal zone are evaluated. This paper is composed as follows: First, a sample and experimental setup are described. Second, interaction characteristics are evaluated and discussed. Finally, conclusions are summarized.

2. Experiments

47-µm-thick BeCu, which is a copper alloy with 1.8~2% beryllium, was prepared using the stamping process. On the top and bottom of the BeCu, 4-µm-thick Au was coated by electroplating so that the total thickness was 55 µm. Rectangular samples shown in Reference [4] were used. Due to the low investment cost, a nanosecond laser or Ytterbium pulsed-fiber laser (IPG-YLPM, IPG photonics, Oxford, MA, USA) was chosen. The experimental setup is shown in Figure 1. The laser-pulse durations were controllable in the range of 4 ns to 200 ns. Pulse durations chosen for the experiments were 8, 20, 50, and 100 ns. Chosen laser-pulse durations provided enough time for thermal-energy propagation [37]. This created a relatively large melt pool and evaporation could also occur. Wavelength was 1064 nm. The maximum average output laser power was 20 W and the maximum average power was fixed for experiments to obtain high productivity. The Gaussian laser beam was focused on the top surface and spot size was 30 µm at a focal position. A 3D galvoscanner (RAYLASE AS-12Y, Raylase, Wessling, Germany) was used to deflect the laser beam from the laser source to the workpiece. Assistant or shielding gas was not used.
Two variables, which are pulse duration and total irradiated laser energy, were chosen for independent variables. The repetition rate was modified to maintain the maximum average-output laser power for all laser-pulse durations (100 ns~8 ns). For example, when the repetition rate was set to 40 kHz for 100 ns pulse duration, the multiplication of the repetition rate (40 kHz) and pulse energy (500 µJ) led to the average power of 20W. In addition, when the repetition rate was set to 200 kHz for 8 ns pulse duration, the multiplication of the repetition rate (200 kHz) and pulse energy (100 µJ) also led to the average power of 20 W. Laser parameters used were tabulated in Table 1. Average output laser power was set to 20 W. A pulse energy ( E ) and total irradiated laser energy ( E t o t a l ) can be calculated as
  E t o t a l = E · N = ( P p e a k Δ t ) · N = ( P a v g f ) · N    
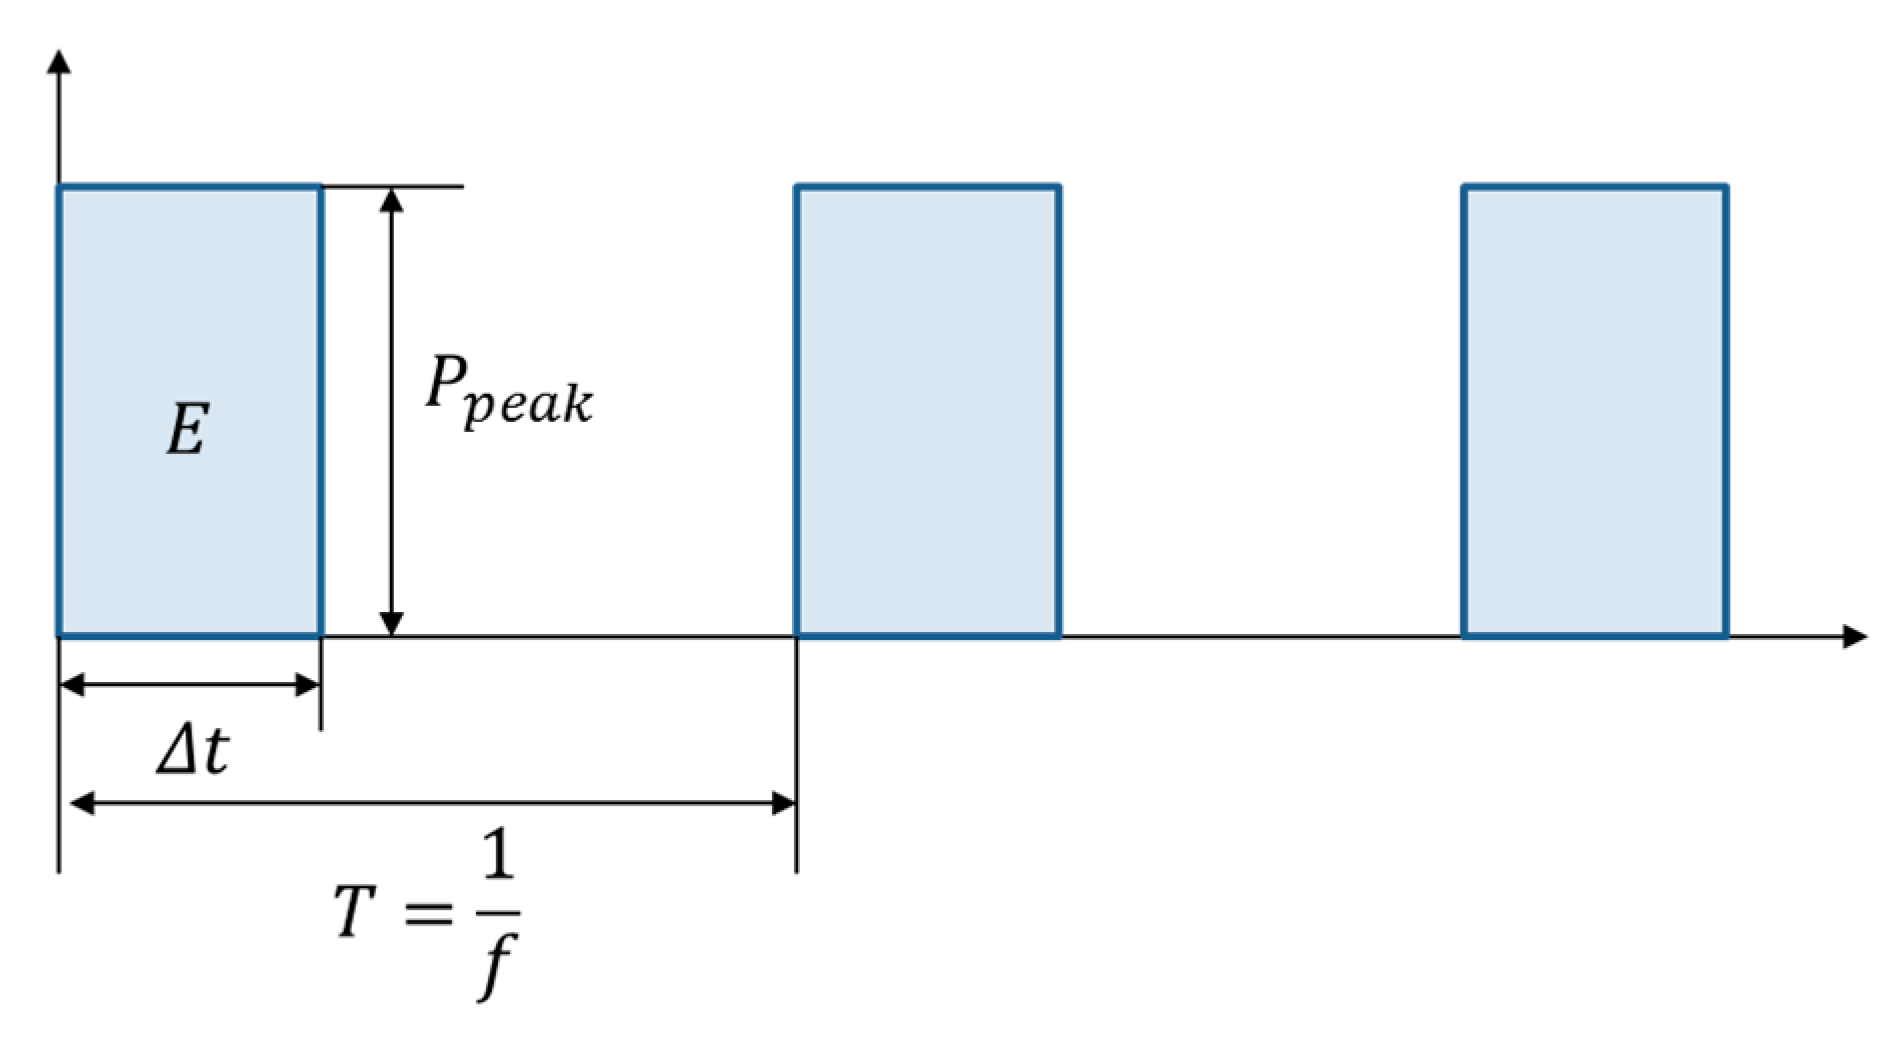
where E is the pulse energy, P a v g is the average output laser power, Δ t is the pulse duration, P p e a k is the peak pulse power, N is the number of pulses, and f is the repetition rate. This relationship is shown in Figure 2. Since P a v g was set to the maximum power, or P a v g = 20   W , the pulse energy was inversely proportional to f . The pulse energy for each pulse duration is shown in Table 1. To set the same E t o t a l , N was adjusted for each pulse duration. N used for experiments is shown in Table 1. The laser pulses were applied to the same spot at the constant fluence. A confocal microscope (OLS4000, Olympus, Tokyo, Japan) was utilized to measure the ablation profile. In addition, a Scanning Electron Microscope (SEM) (Tescan-Vega3, Zeiss, Oberkochen, Germany) was used to observe the interaction characteristics.

3. Results and Discussions

Ablation characteristics, depending on total irradiated laser energy ( E t o t a l ) and pulse duration, were observed. Crater size, ablation threshold, thermal depth, and incubation coefficient were observed. The crater size was measured based on the maximum distance of the melting zone. Thermal depth could determine the localization of the heating,
  l t h = α Δ t  
where l t h is the thermal depth, and α and Δ t are the thermal diffusivity and pulse duration, respectively. Material-removal zone and ablation depth were investigated. The interaction characteristics and surface morphology were discussed in detail. In this paper, crater size and material-removal zones were measured from the top surface in length scale due to radial symmetricity.

3.1. Crater Size, Thermal Depth, Ablation Threshold, and Incubation Coefficient

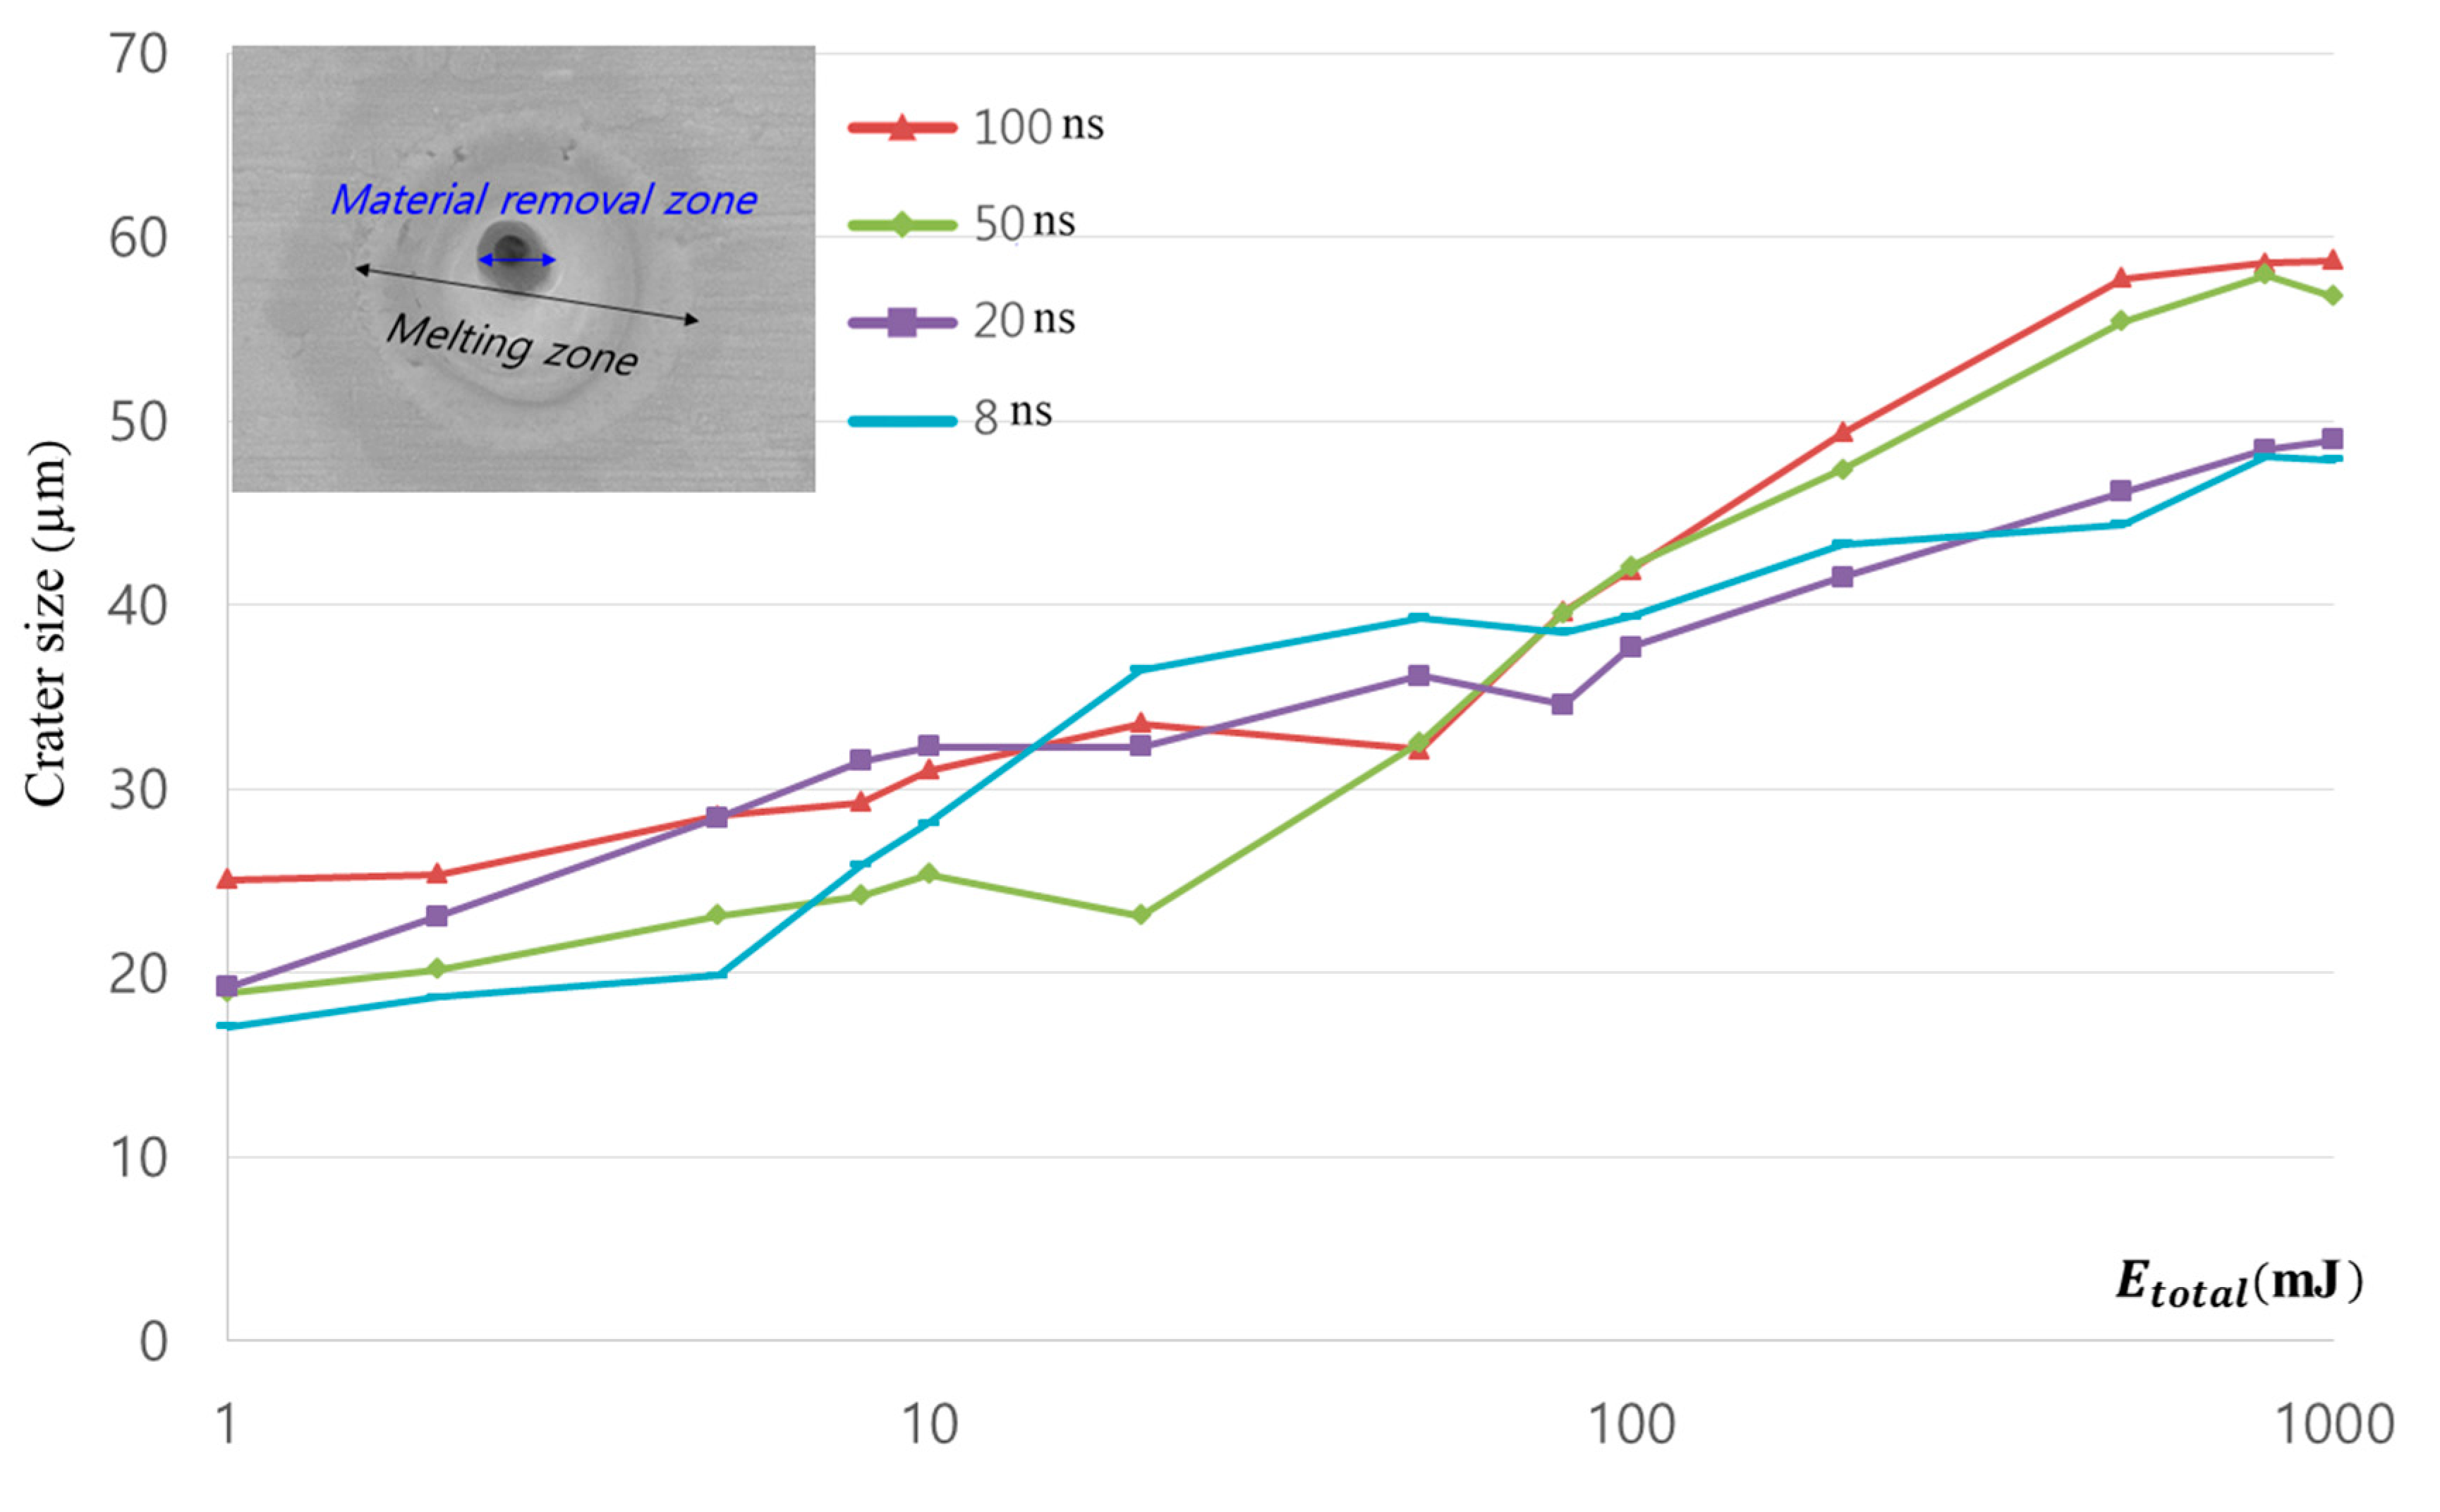
Measured craters are shown in Figure 3. The x-axis of Figure 3 is total irradiated laser energy ( E t o t a l ) and plotted in a log scale. As E t o t a l increased, the crater size increased logarithmically in all pulse durations. At E t o t a l =   1 mJ, the total number of pulses was less than 10. Hence, less number of pulses led to localized heat. In addition, heat conduction rather than evaporation was predominant since electron temperature was equilibrated with the atoms at the nanosecond laser-pulse duration. This caused strong heating of the irradiated volume [38]. Because majority part of the sample was Cu, the material properties of Cu were used. The α of Cu was 1.15 cm 2 / s . The thermal depth for all pulse durations was tabulated in Table 2.
Even though thermal depth monotonically increased from 0.959 to 3.391 μ m as pulse duration increased, the variation of crater size was insignificant. This may have been related to the direction of heat transfer. Since thermal depth was the indirect indicator of heat effect in longitudinal direction and the crater size was highly affected by the heat transfer in transverse direction, correlation between thermal depth and crater size was insignificant.
Since the 8 ns pulse duration had the minimum thermal depth among the other pulse durations, a much-localized heat effect could have been expected. Therefore, the minimum crater size was observed in the low E t o t a l , which was more sensitive to localized heat. The crater size increased sharply for the pulse duration of 50 and 100 ns when E t o t a l was over 100 mJ. For 20 ns pulse durations, crater size decreased slightly, at which E t o t a l was 80 mJ. The decreasing crater size proved physically meaningful due to surface-morphology variation. This morphology change will be discussed in detail in the next section. When E t o t a l was high, the differences in crater size between the pulse durations of 50 and 100 ns, as well as between the pulse durations of 8 and 20 ns, were hardly observed. While a small amount of E t o t a l led to the localization of heating, three kinds of thermal processes, i.e., vaporization, normal boiling, and explosive boiling, were influencing the laser–material interaction as increasing energy [39,40,41,42,43]. Crater sizes less than a laser-spot size, or 30 μ m , were observed at the point where low E t o t a l was applied. To explain this, an ablation threshold and a Gaussian laser-beam distribution needed to be introduced first. The ablation threshold can be expressed in terms of peak fluence. The peak fluence of a Gaussian beam can be calculated by
  F o = 2 E π w 0 2  
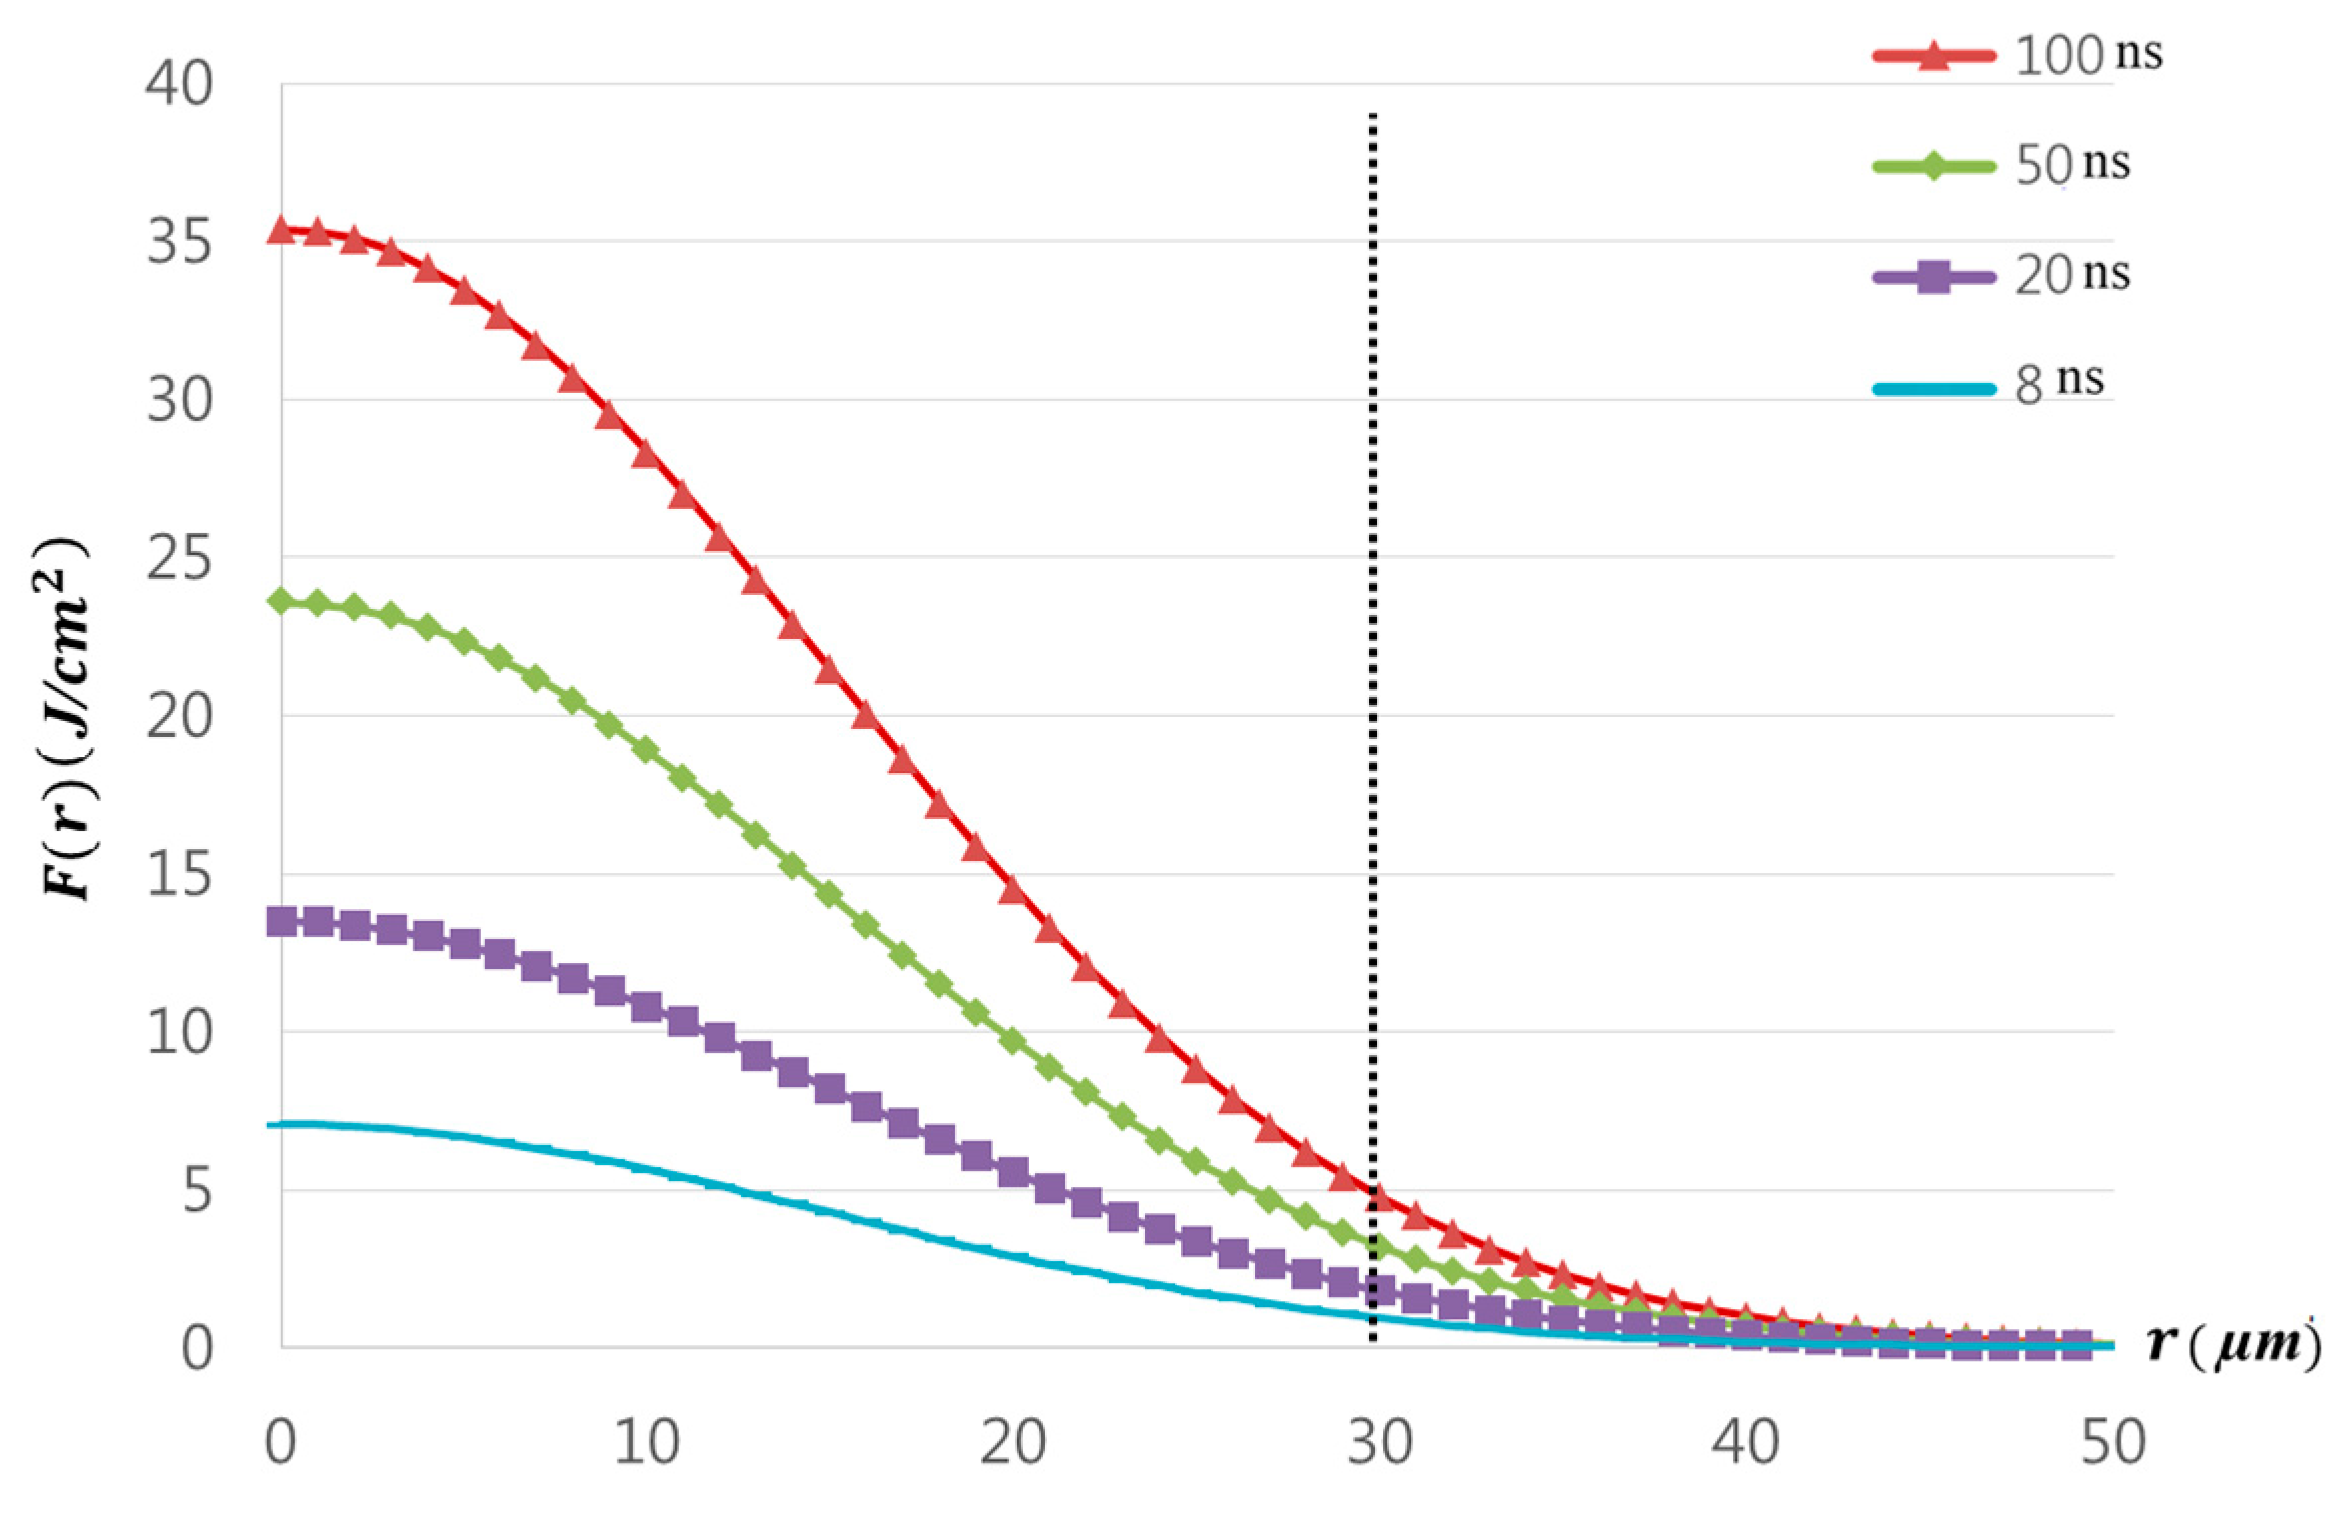
where E is a pulse energy and w 0 is a Gaussian beam radius. According to Equation (4), the calculated laser fluences are 7.07 J / cm 2 , 13.5 J / cm 2 , 23.6 J / cm 2 , and 35.4 J / cm 2 for the pulse duration of 8 ns, 20 ns, 50 ns, and 100 ns, respectively. Since the ablation threshold of Cu with a nanosecond laser pulse was given in the range of 5.1 J / cm 2 to 11 J / cm 2 [38,44,45], the fluence used for all cases except the 8 ns pulse duration was greater than the ablation threshold of Cu. Thus, having a crater size less than 30 μ m was understandable for the 8 ns pulse duration. However, other cases also showed crater size less than 30 μ m . This may be explained by examining laser-beam distribution. When a laser beam has the Gaussian distribution, the fluence also has the Gaussian distribution. The spatial fluence distribution for the Gaussian laser beam is given by Reference [39]:
  F ( r ) = F 0 e 2 r 2 w o 2  
where F 0 is peak fluence in the beam and r is radius. According to the fluence distribution, the fluence near the edge of the laser-beam spot was less than 10 J / cm 2 , which is the ablation threshold of Cu. This is shown in Figure 4. Therefore, crater size less than 30 μ m could be observed when E t o t a l was less than 10 mJ in all cases.
The peak fluence ( F 0 ) can be calculated with the relationship between an ablation threshold fluence ( F t h ) and the diameter (D) [46]:
  D 2 = 2 w 0 2 ln ( F 0 F t h )  
Furthermore, the incubation model explains accumulation behavior [47]. This model explains the relationship between the singe-shot ablation threshold fluence and the ablation threshold fluence for the number of laser pulses (N). This relationship can be expressed as follows:
  F t h ( N ) = F t h ( 1 ) N s 1  
where F t h ( 1 ) is the ablation threshold fluence using one laser pulse and s is the incubation coefficient. The crater size and the number of laser pulses are related by combining Equations (6) and (7):
  D = w 0 2 ln ( F 0 F t h ( 1 ) N s 1 )  
where F 0 is the ablation fluence [39]. Equation (8) can be rearranged as:
  1 2 ( D w 0 ) 2 + ln F 0 = ln (   F t h ( 1 ) ) + ( s 1 ) ln ( N )  
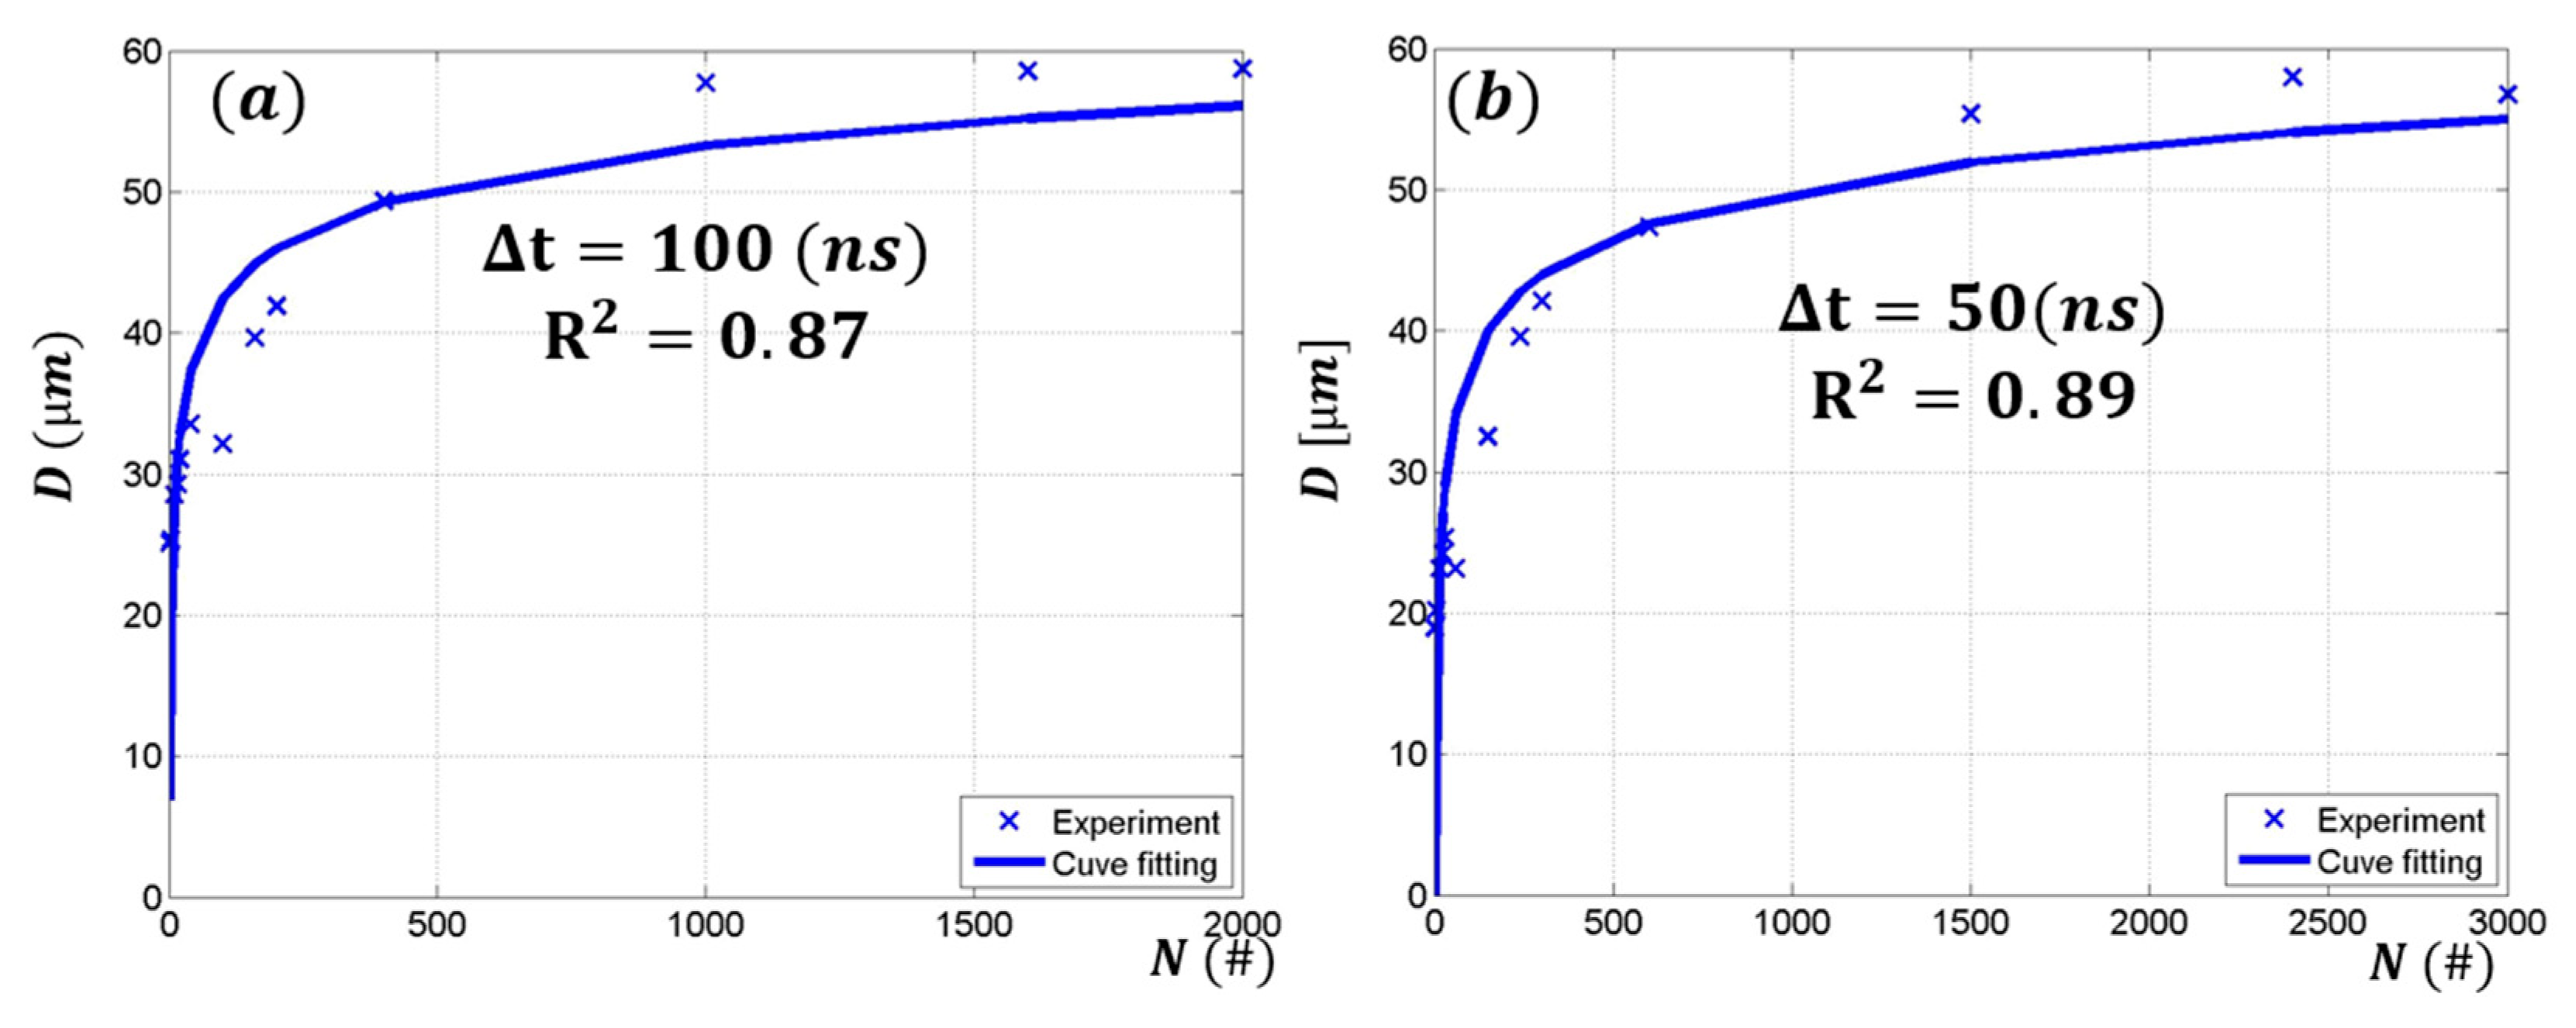
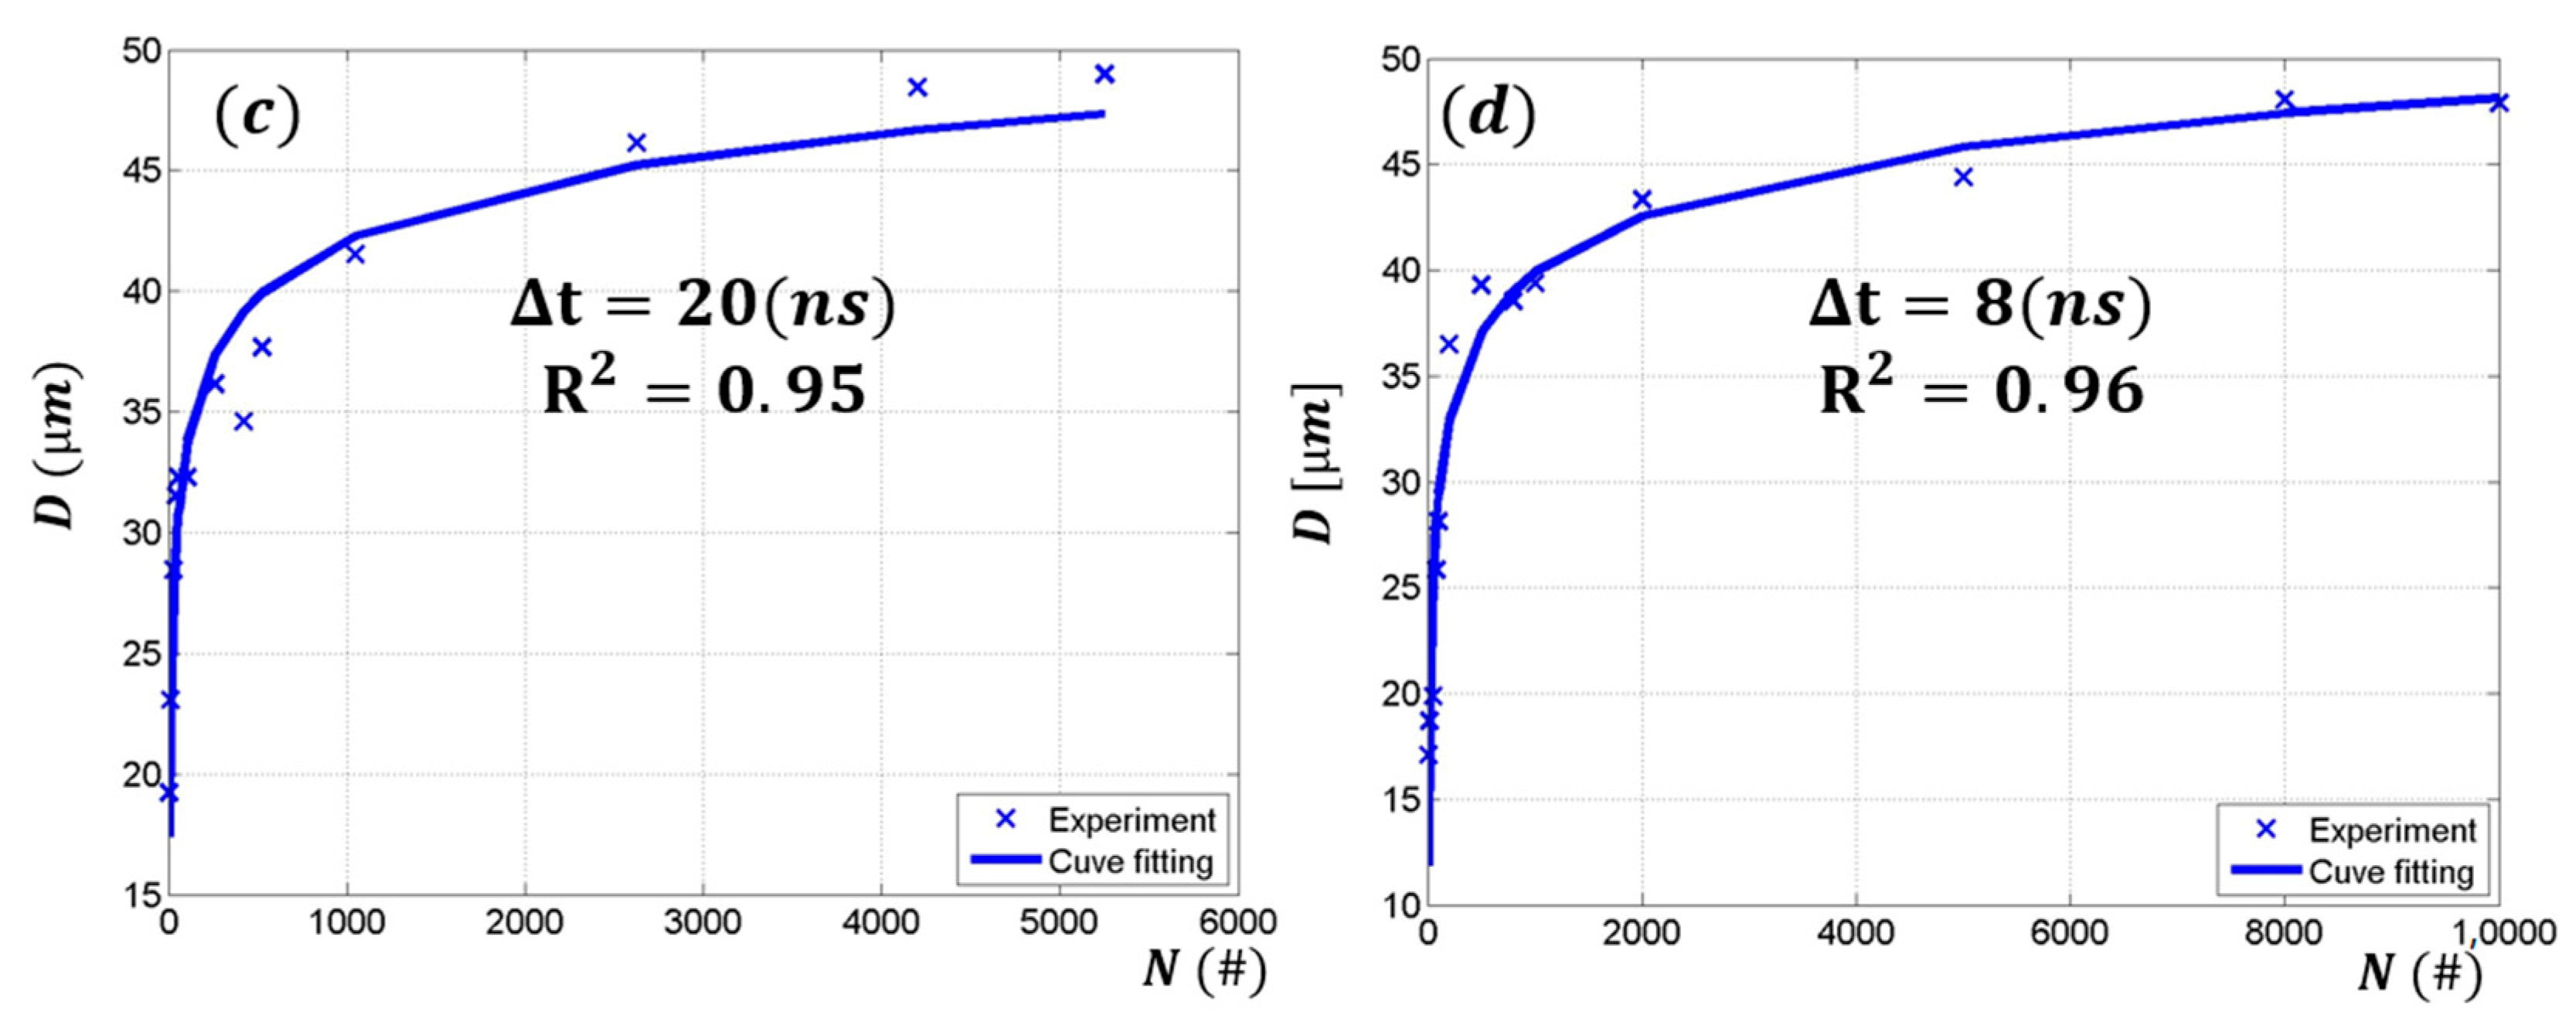
From Equation (6), F t h ( 1 ) and s can be obtained by linear interpolation and substitution. The single-shot ablation threshold fluence and incubation coefficient are tabulated in Table 2. Figure 5 shows the crater diameters versus the number of laser pulses applied to the same spot at a constant fluence. The solid line shows a curve fitting according to Equation (8). The single-shot ablation threshold fluences are 40.9 J / cm 2 , 36.3 J / cm 2 , 14.8 J / cm 2 , and 9.79 J / cm 2 for the 100 ns , 50 ns , 20 ns , and 8 ns pulse duration, respectively. The incubation coefficients were 0.75, 0.74, 0.84, and 0.82 for the 100 ns , 50 ns , 20 ns , and 8 ns pulse duration, respectively. Attained ablation threshold for the 8 ns pulse duration is very similar to the literature, where the ablation threshold is observed in the range of 5.1 J / cm 2 and 11 J / cm 2 [38,44,45]. However, ablation thresholds for the other pulse durations are hardly found from the literature. The coefficient of determination ( R 2 ) is shown for each pulse duration in Figure 5. The short pulse duration (8 and 20 ns ) resulted in a relatively good fitting and high R 2 values. However, the long pulse duration (50 and 100 ns ) showed low R 2 values. Furthermore, R 2 value decreased as the pulse duration increased. This may have been due to heat accumulation effect. Since longer pulse duration leads to deeper thermal depth and longer exposure time to laser energy, heat accumulation may have been more pronounced. Thus, wider and deeper melting-zone formation may result in the deviation.

3.2. Material-Removal Zone, Ablation Depth, and Full Penetration

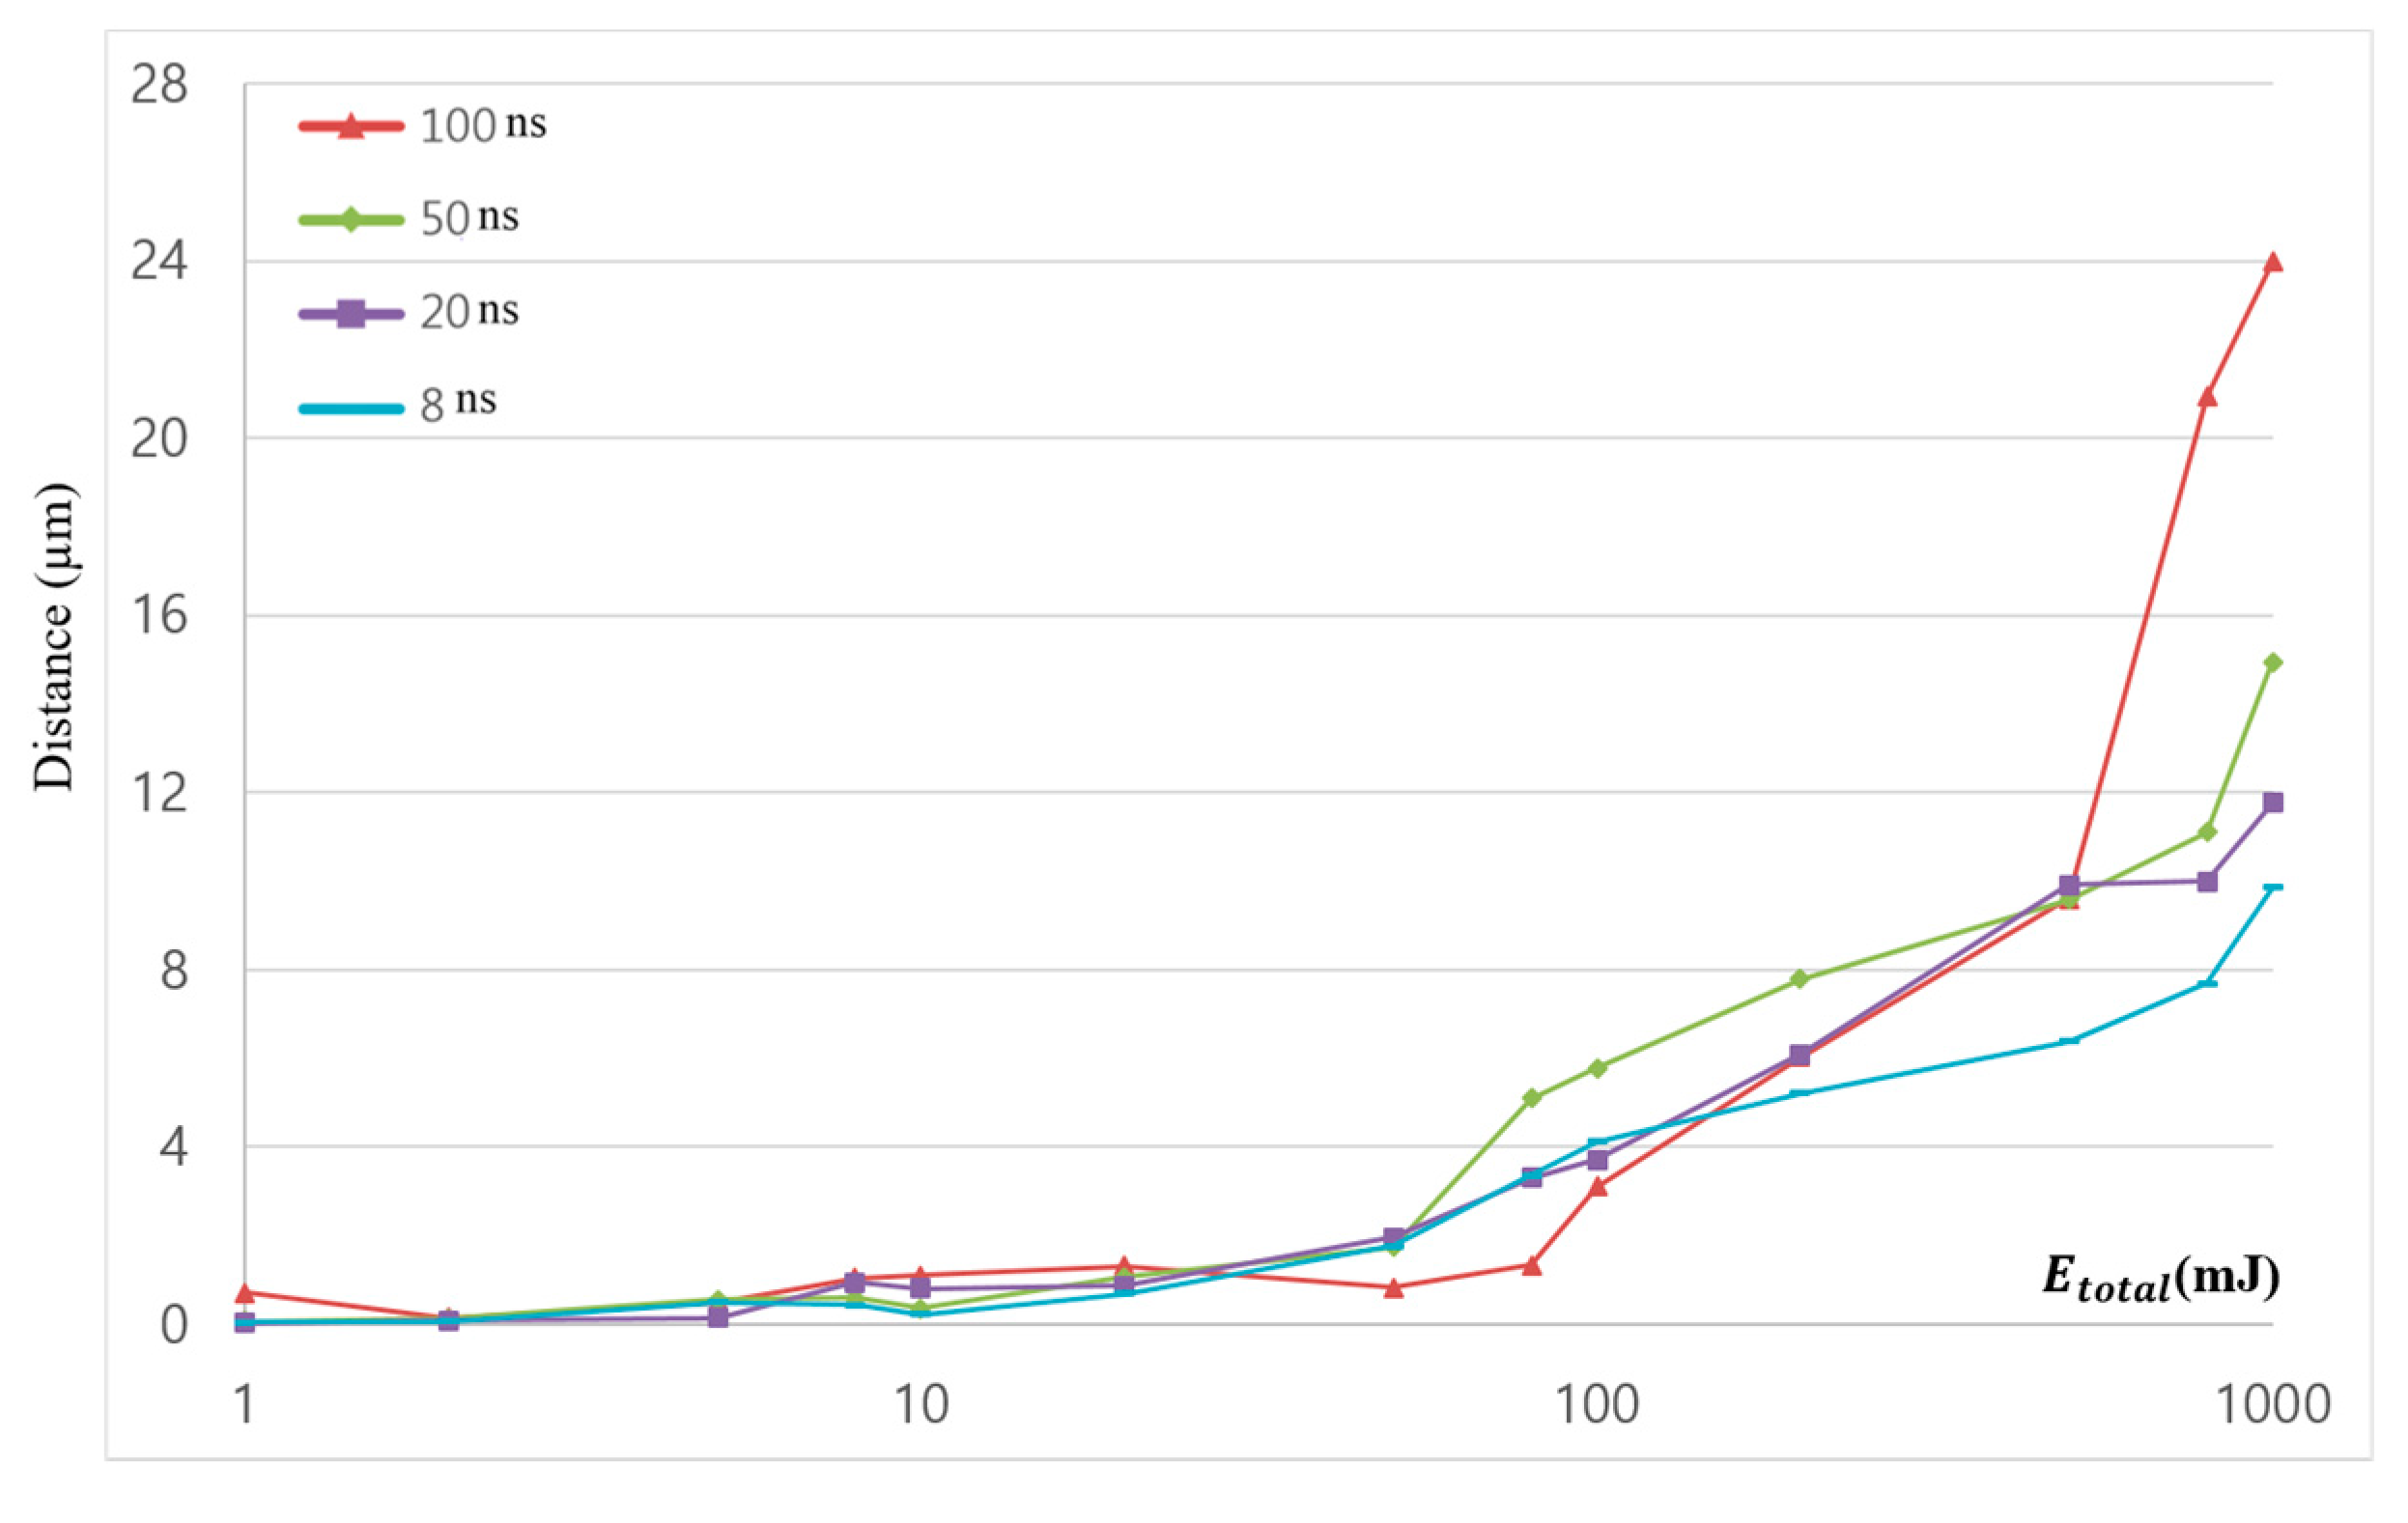
The material-removal zone is plotted in Figure 6. The x-axis of Figure 6 is plotted on a log scale. At the 100 ns and 50 ns pulse duration, material-removal zones were detected when E t o t a l was greater than 500 mJ and 800 mJ, respectively. All the material-removal zones were less than 10 μ m . No material = removal zone was found when the pulse duration was less than or equal to 20 ns . From the figure, the given E t o t a l is the proper range to investigate the ablation regime since the given E t o t a l was not enough to remove the material.
Ablation depth was measured by a confocal microscope. Comparison of ablation depth is shown in Figure 7. The x-axis of Figure 7 is total irradiated laser energy ( E t o t a l ) and plotted in a log scale. Higher peak power caused more ablation if we consider only one laser-pulse duration. However, this understanding was not applicable in this study. This is because the independent variable was not the number of laser pulses using one type of laser-pulse duration, but the total irradiated laser energy. Furthermore, one laser pulse was not enough to clearly ablate the material for the given material. In addition, the minimum E t o t a l , or 1 mJ , required a different number of laser pulses, depending on the pulse duration. Therefore, the common understanding that higher peak power leads to more ablation is hardly applicable to explain the phenomena.
Ablation depth barely increased when E t o t a l was less than 80 mJ. When E t o t a l was 80 mJ, the ablation depth suddenly increased. No full penetration was observed in the 100 ns, 50 ns, 20 ns, and 8 ns pulse durations. However, full penetration may be expected as E t o t a l increases. Although the same E t o t a l was applied for all pulse durations, the ablation depth was different. Apparent differences can be observed at E t o t a l = 1000 mJ. According to the laser parameters used in this study, when a longer pulse duration was used, weaker peak power formed, as shown in Table 1. However, a longer pulse duration had higher pulse energy. Thus, ablation depth was highly dependent on E t o t a l when E t o t a l was greater than 500 mJ.

3.3. Effect of Laser Parameters on Ablation Characteristics and Surface Morphology

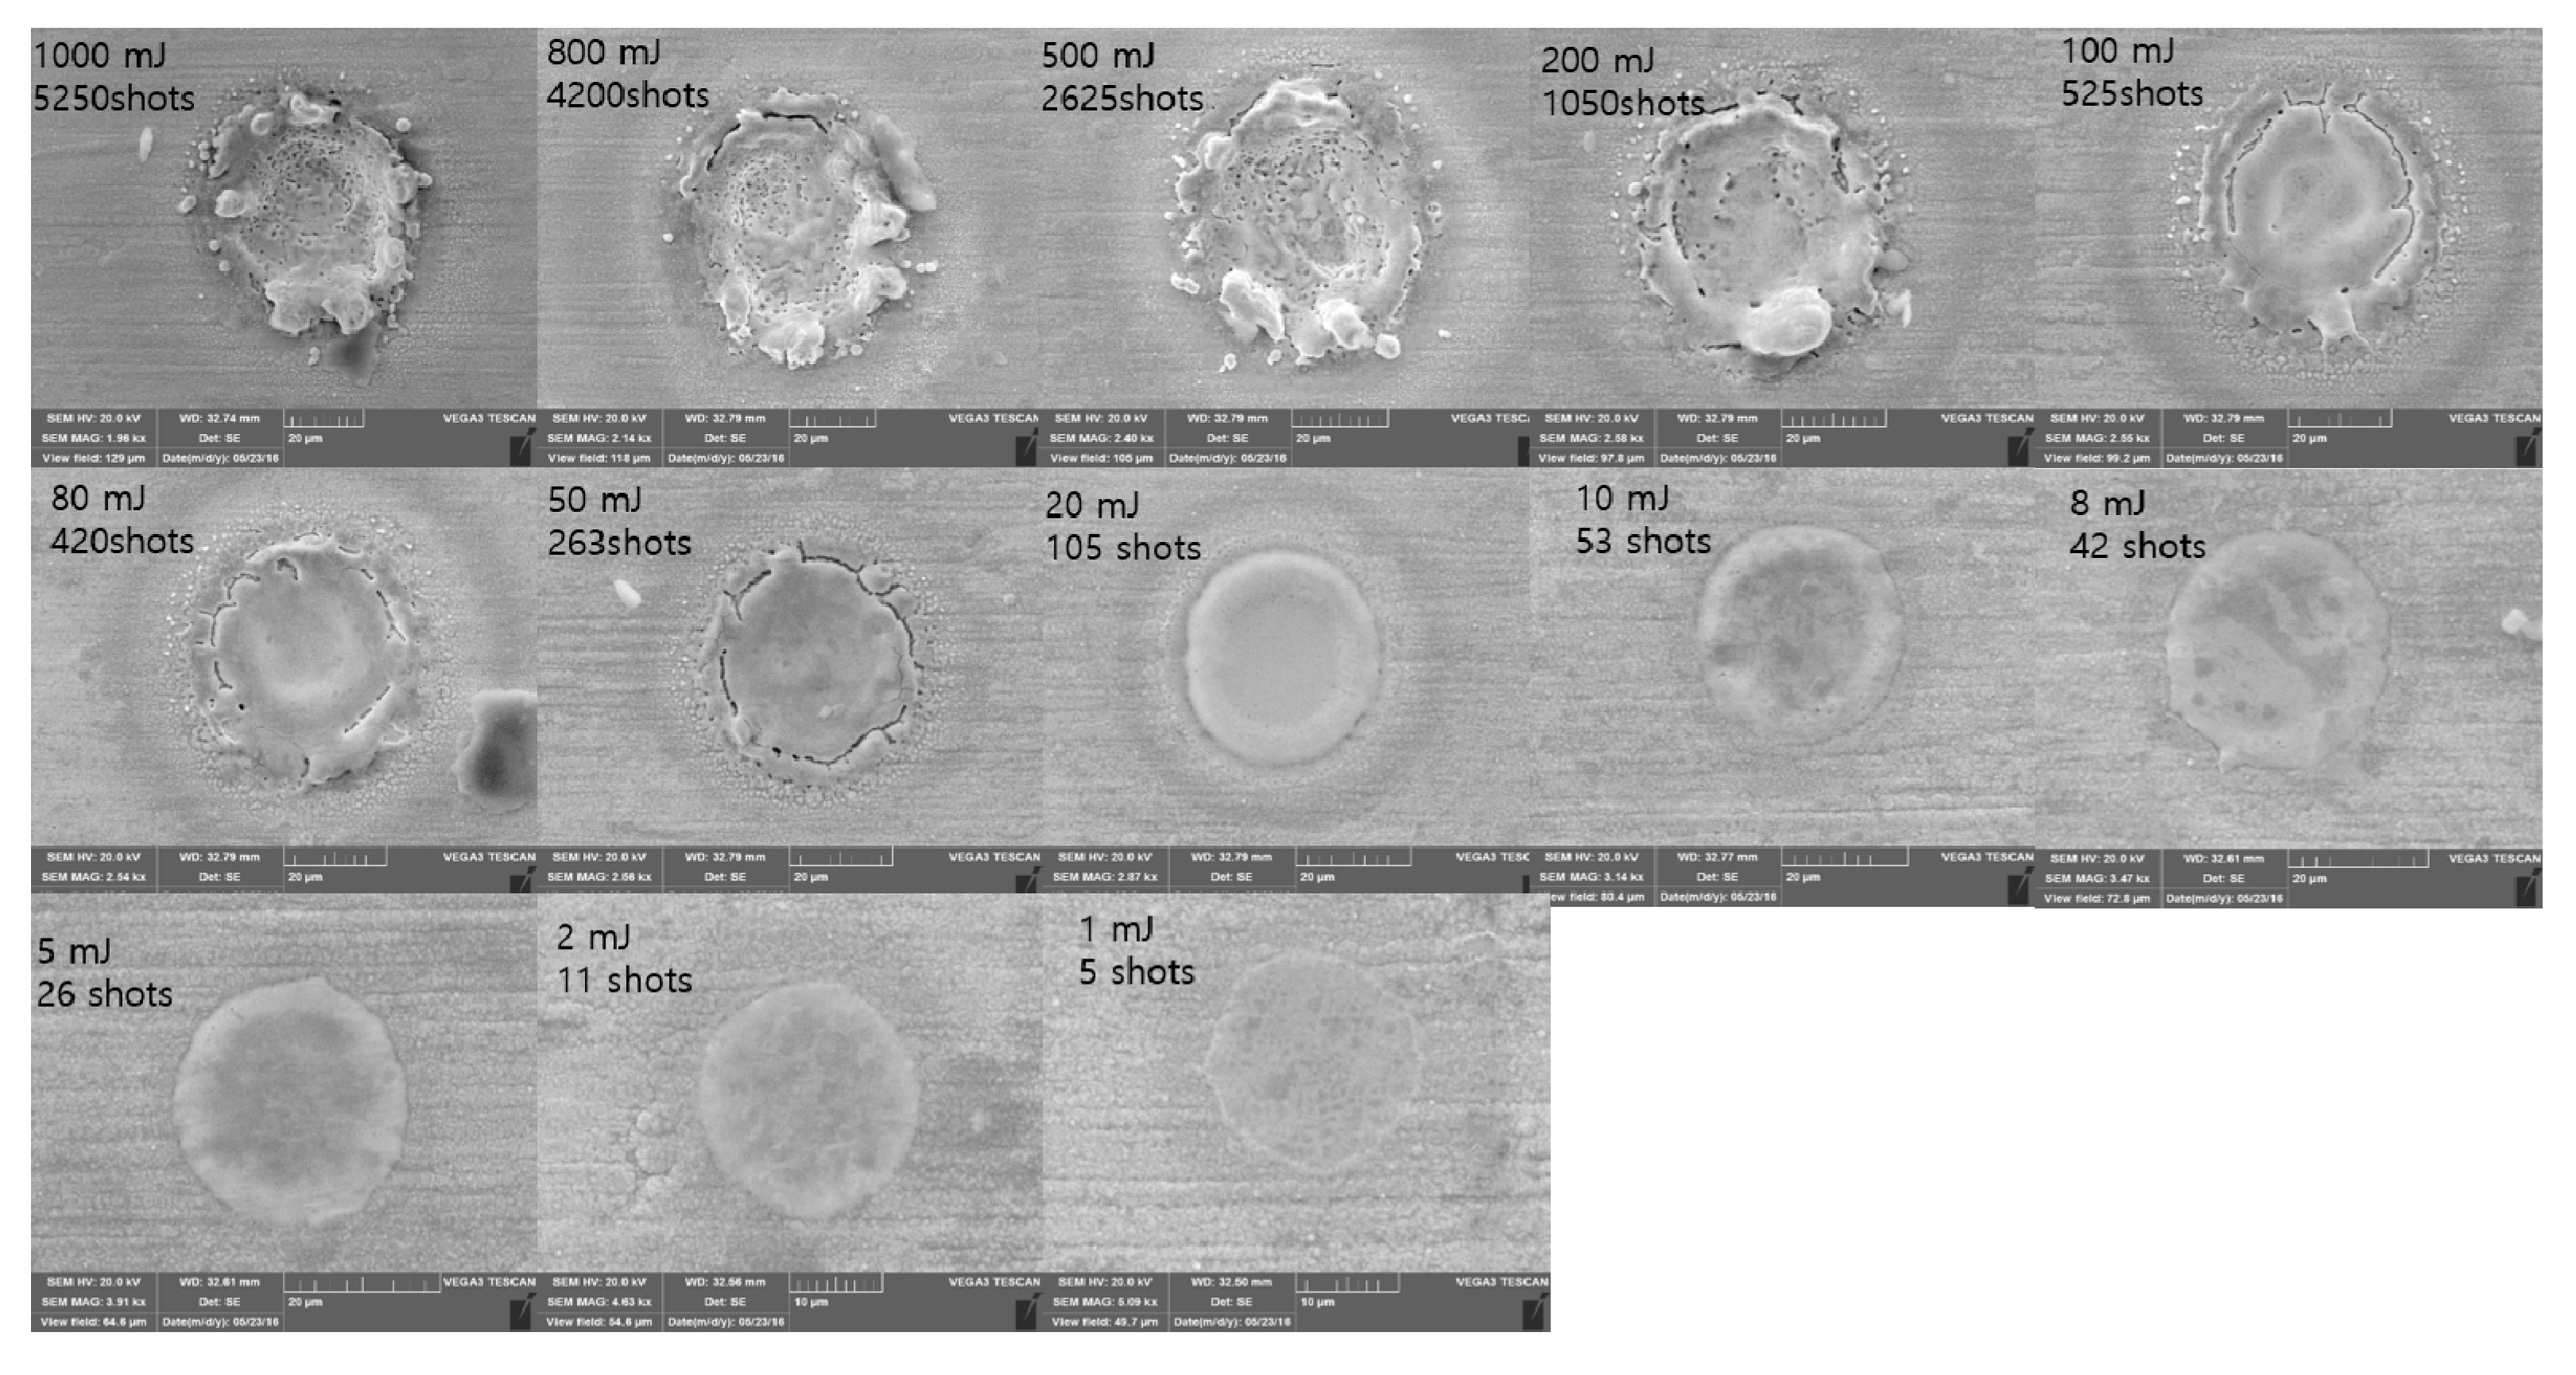
Figure 8 shows SEM images for the 100 ns pulse duration. Crater size was clearly observed if E t o t a l was less than 80 mJ. These craters were formed by a molten workpiece when there was enough time for the thermal wave to propagate into the target. Thus, this thermal wave created a molten layer and the resolidified molten layer formed the crater [37]. When E t o t a l was 100 mJ, the groove was discovered at the edge of the crater. This groove became separated when E t o t a l increased into 200 mJ. This edge separation was readily observable if E t o t a l was greater than 200 mJ. After the edge separation was detected, the crater size converged into the value of 60 μ m . After the edge-separation and crater-size convergence, a material-removal zone was observed. Thus, evaporation was introduced as a material-removal mechanism in addition to the melting and resolidification.
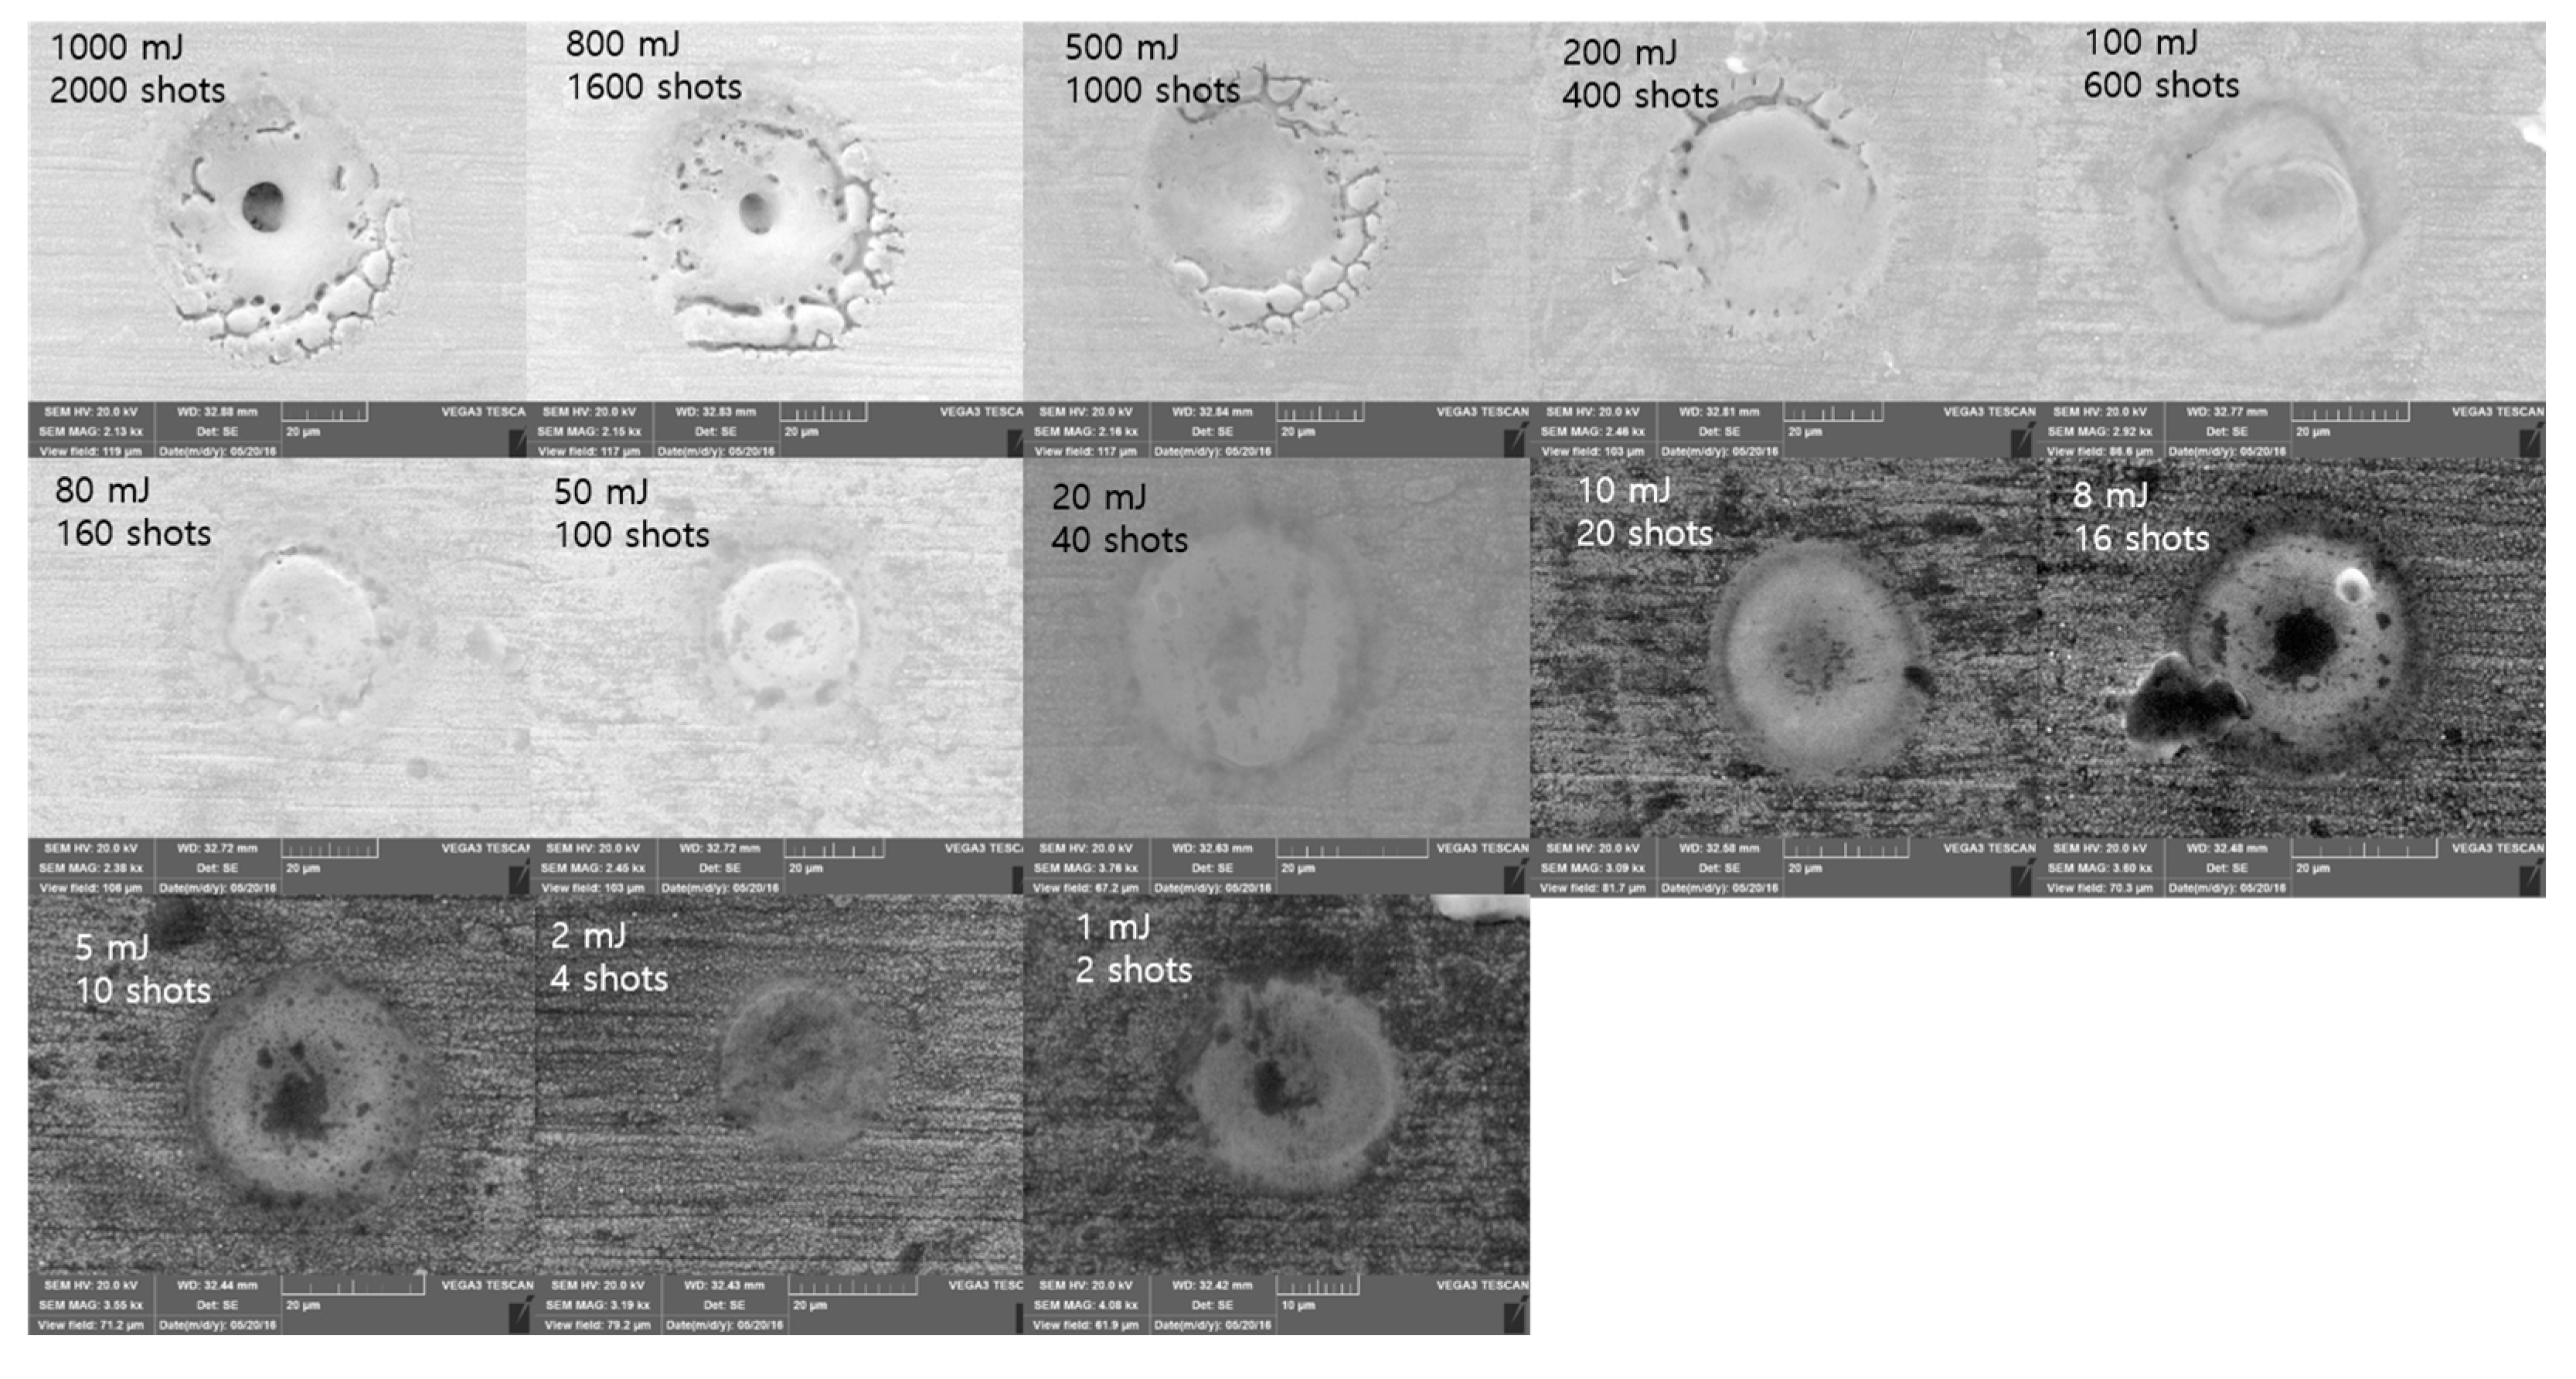
SEM images for the 50 ns pulse duration are shown in Figure 9. In this pulse duration, crater size changed considerably in the range of 18.9 μ m to 58.2 μ m . The crater existed where E t o t a l was less than 10 mJ. When E t o t a l was 20 mJ, an initial stage of edge separation was observed around the edge of the crater. Not only edge separation, but also small particles could be observed around the crater edge as increasing E t o t a l . The particle size was in the range of 300 nm to 1.5 μ m . Due to the repeated laser pulses, a molten workpiece was spattered from the laser–material interaction zone to the edge. After the laser–material interaction, this spattered molten workpiece was solidified and it formed particles. Furthermore, these particles may have been formed by condensation of plasma [48]. However, further investigation is required to clearly justify and quantify the causation of these particles. Further increase of E t o t a l led to create the material-removal zone when E t o t a l was 1000 mJ.
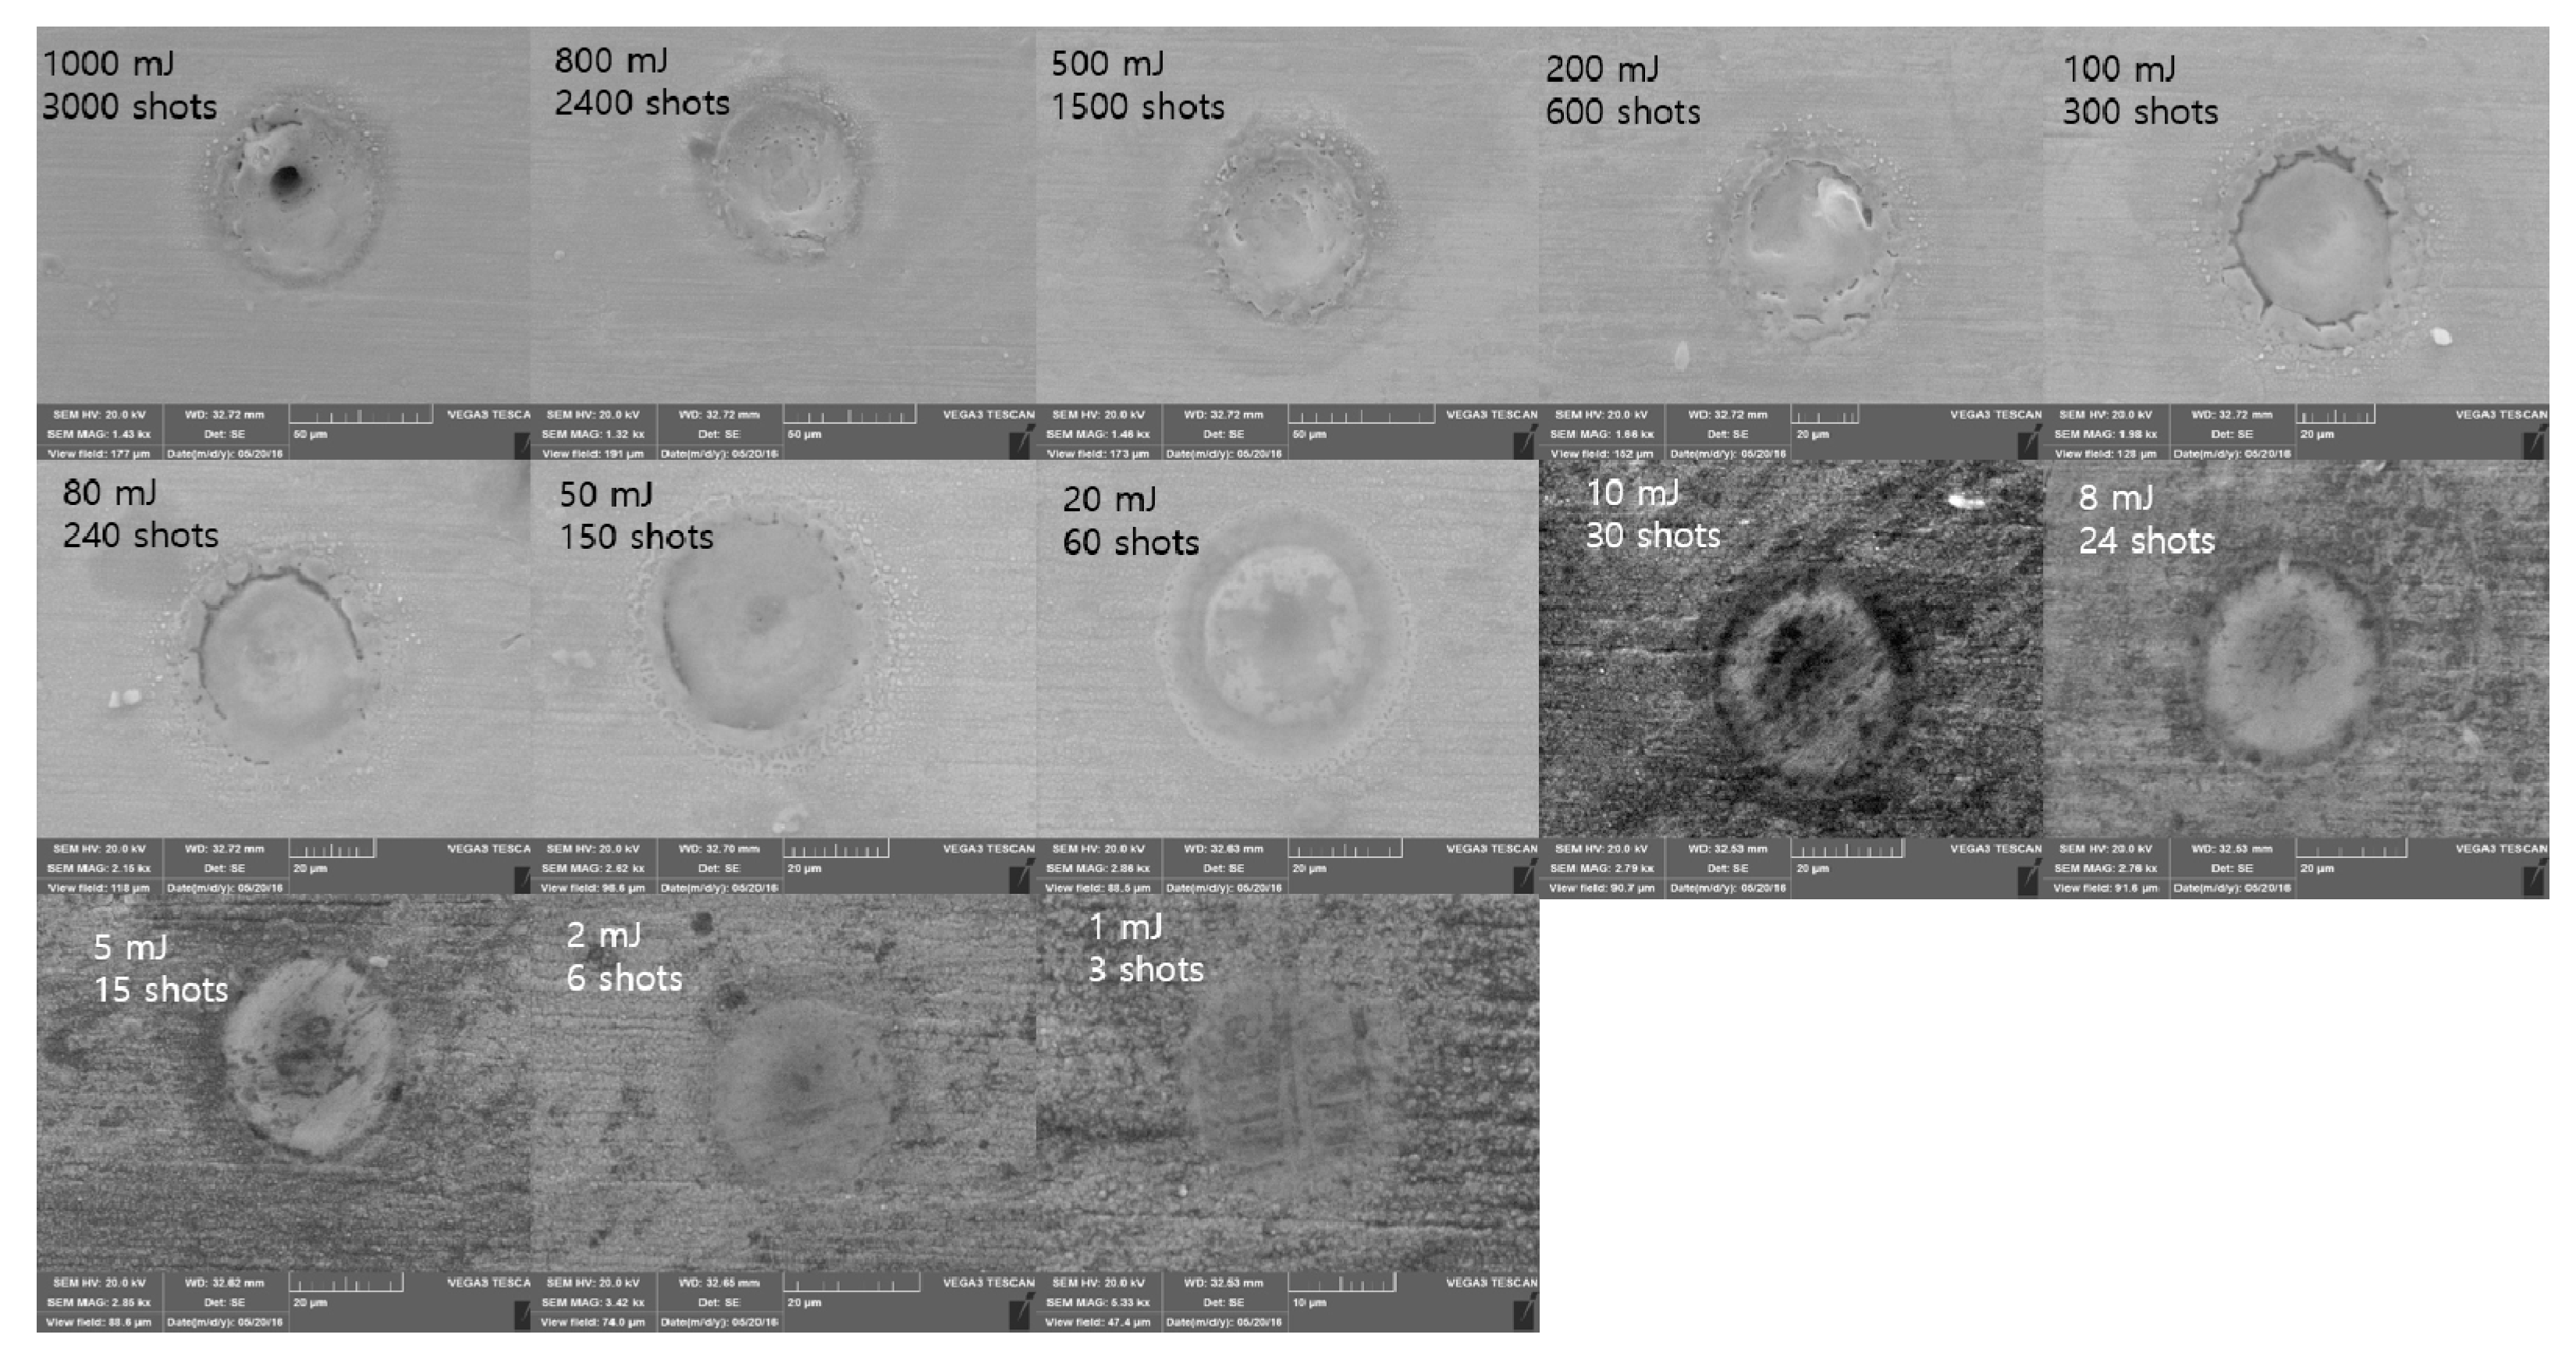
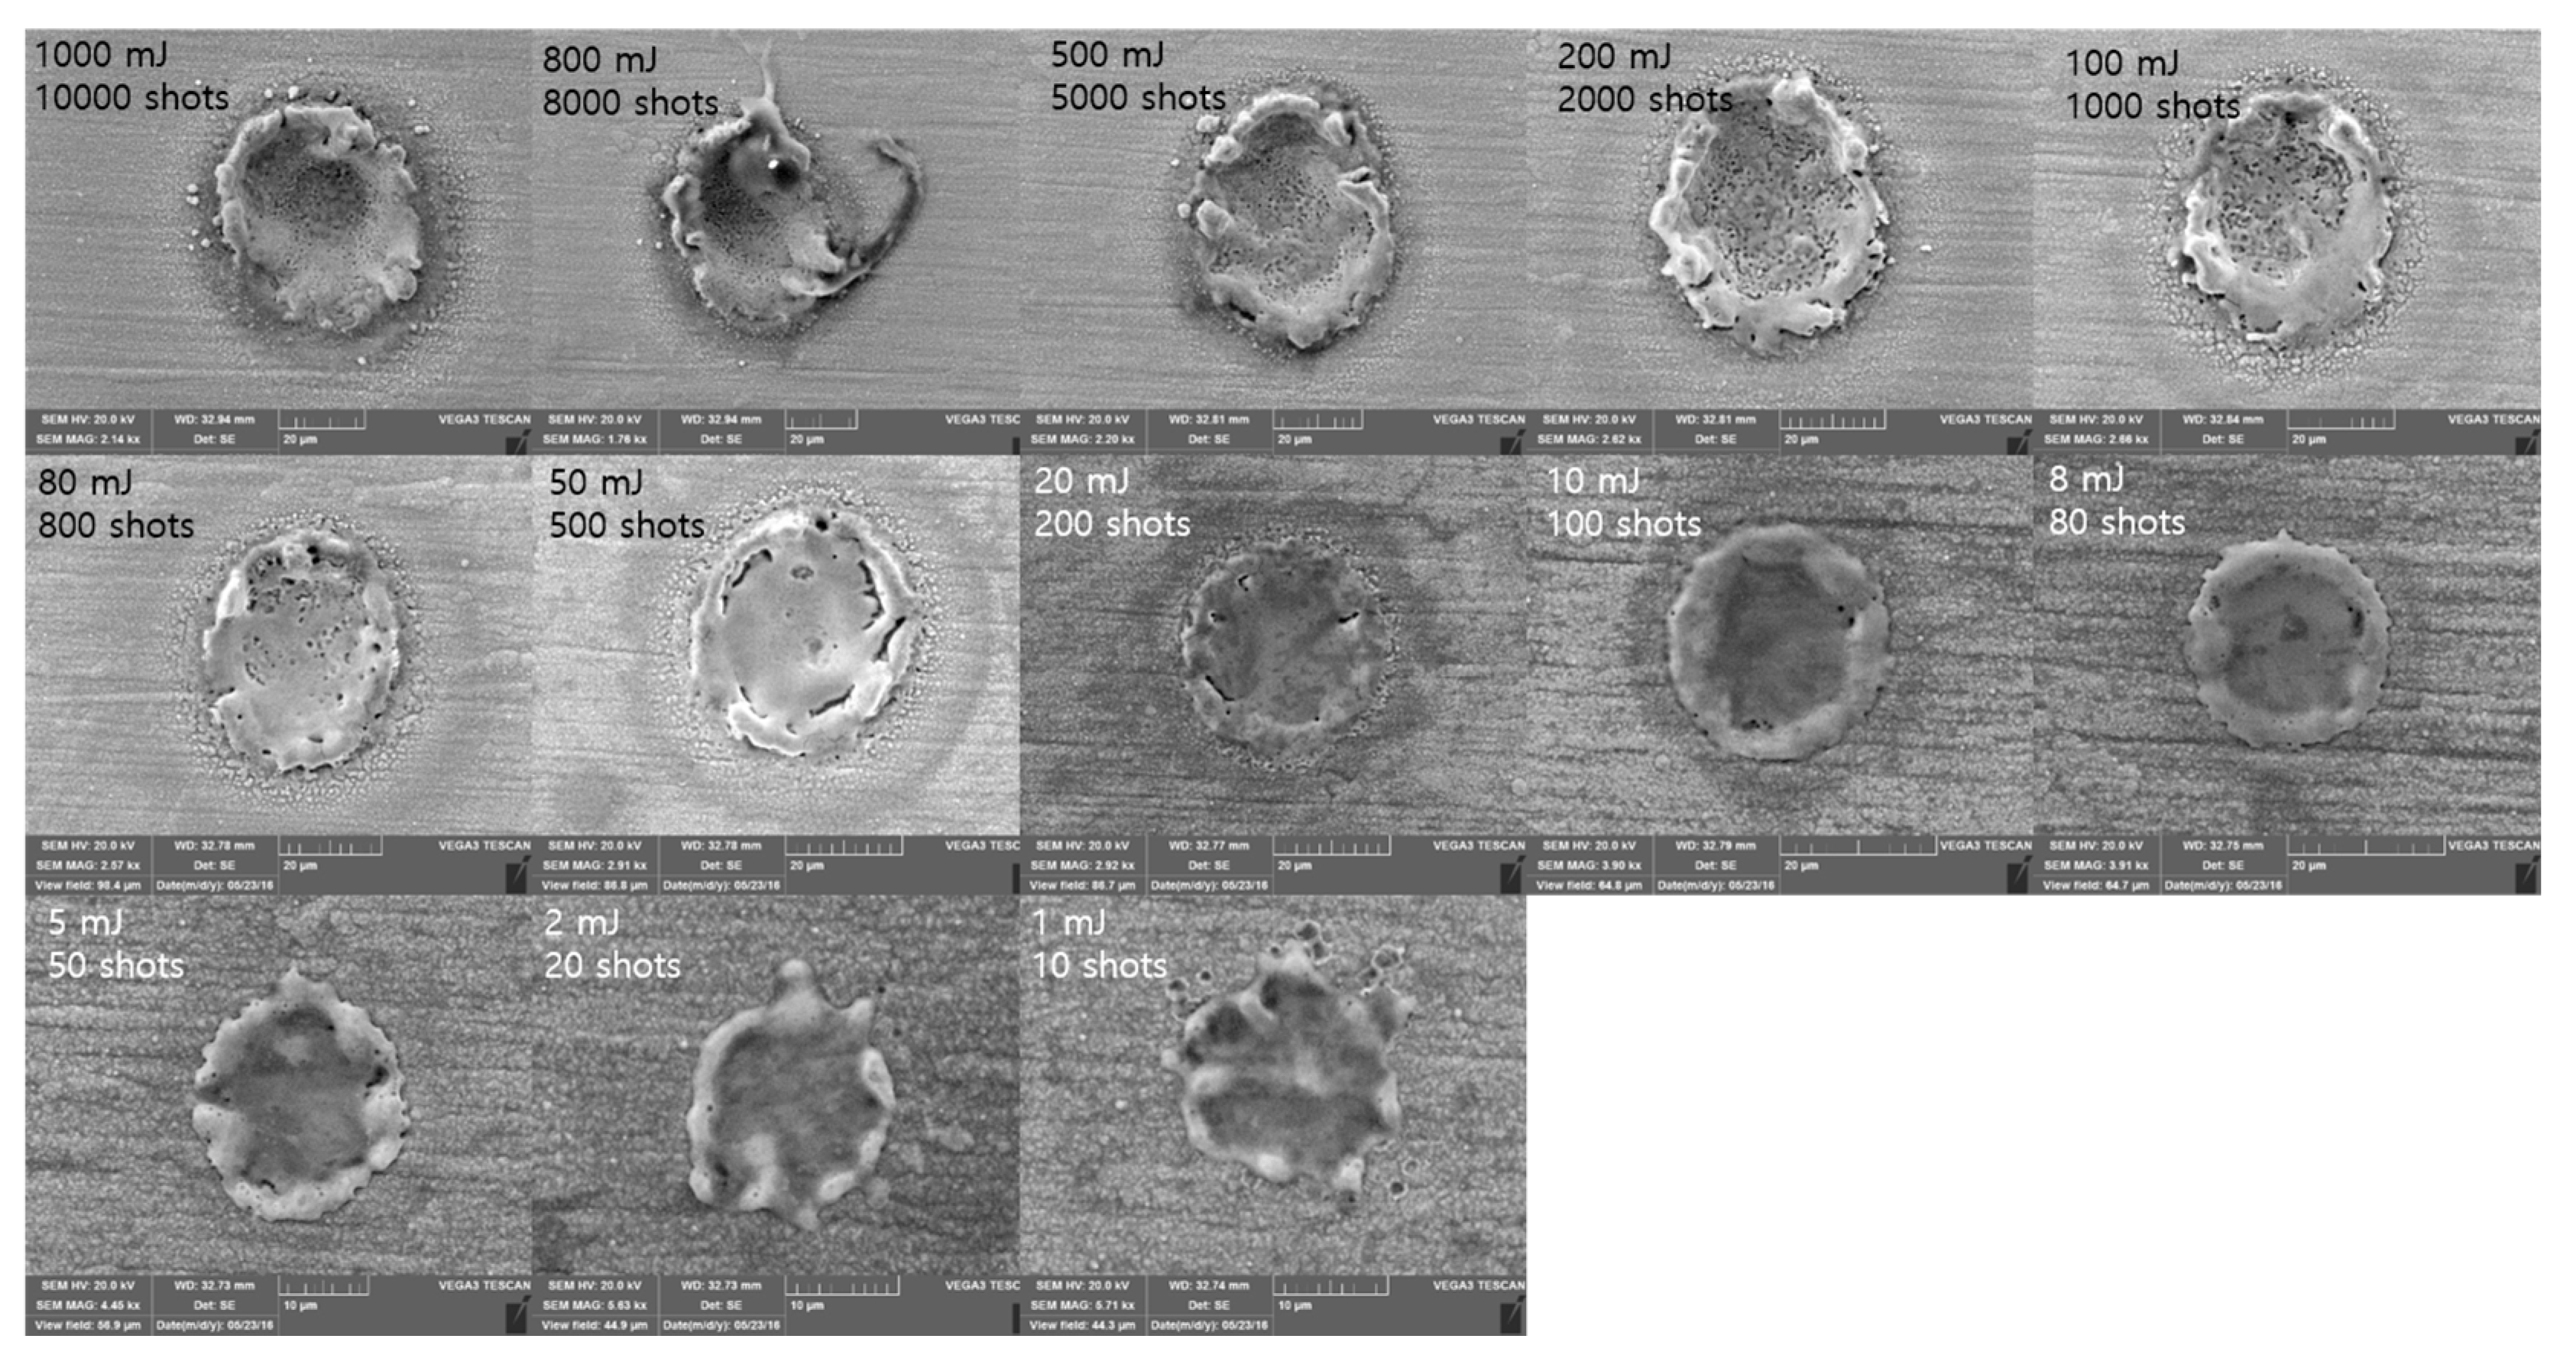
SEM images of the 20 ns pulse duration are shown in Figure 10. Similar phenomena observed from the case of 50 ns pulse duration were observed. Smooth crater surface could be found in the E t o t a l range of 1 mJ to 10 mJ. At the E t o t a l of 20 mJ, a heat-affected zone was observed around the crater. Both the edge separation and small particles were observed in the E t o t a l range of 50 mJ to 100 mJ. When E t o t a l increases, the crater showed a soaring-up motion. This soaring-up motion may have been due to the intense evaporation, which gives rise to recoil pressure during the laser–material interaction. Thus, there existed three interaction characteristics, i.e., edge separation, small particles, and soaring-up motion, when E t o t a l was greater than 200 mJ.
SEM images for the 8 ns pulse duration are shown in Figure 11. Interaction characteristics observed are almost similar to the case for the 20 ns pulse duration. However, the edge separation was rarely observable. The interesting thing was that the soaring-up motion was detected even though E t o t a l was less than 10 mJ due to high peak power.

4. Conclusions

To fully utilize laser cutting on BeCu, interaction characteristics during laser spot cutting were observed with variation of an ns pulse duration (100 ns ~8 ns ) and E t o t a l (1 mJ ~1000 mJ ). Crater size, material-removal zone, and thermal depth were examined. Furthermore, ablation depth, ablation threshold, incubation coefficient, and surface morphology were observed. Crater size can be affected dominantly by the localization of heating when a small amount of E t o t a l is applied. The relationship between crater size and the number of laser pulses was examined with the incubation model. A single-shot ablation threshold and incubation coefficient obtained from the model were compared. The values are in a good agreement with the literature for the 8 ns laser pulse. Edge separation, small particles, spatter motion, and soaring-up motion were detected on the surface and discussed. The results can be used for BeCu laser cutting in many applications as a fundamental reference.

Funding

The research described herein was sponsored by the National Research Foundation of Korea (NRF) Grant funded by the Korean government (MSIP; Ministry of Science, ICT and Future Planning) (No. 2017R1C1B5017916). The opinions expressed in this paper are those of the authors and do not necessarily reflect the views of the sponsors.

Conflicts of Interest

The authors declare no conflict of interest.

References

  1. Golden, J.R.; Bernard, B.T. Coaxial Spring Contact Probe. U.S. Patent 5196789A, 23 May 1993. [Google Scholar]
  2. LEENO. Spring Contact Probe (ICT). Available online: http://leeno.com/products/spring-contact-probe/ (accessed on 10 July 2018).
  3. Tsui, C.M.S.; Sze, C.T.A.; Chan, S.K.D.; Wong, S.K.J. Spring Contact Probe Device for Electrical Testing. U.S. Patent 6967492B2, 22 November 2005. [Google Scholar]
  4. Lee, D.; Cho, J.; Kim, C.H.; Lee, S.H. Application of laser spot cutting on spring contact probe for semiconductor package inspection. Opt. Laser Technol. 2017, 97, 90–96. [Google Scholar] [CrossRef]
  5. Wang, X.; Zhang, D.; Gu, C.; Shen, Z.; Liu, H. Research on the micro sheet stamping process using plasticine as soft punch. Materials 2014, 7, 4118–4131. [Google Scholar] [CrossRef] [PubMed]
  6. Lee, D. Experimental investigation of laser ablation characteristics on nickel-coated beryllium copper. Metals 2018, 8, 211. [Google Scholar] [CrossRef]
  7. Steen, W.M.; Mazumder, J. Laser Material Processing, 4th ed.; Springer: London, UK, 2010. [Google Scholar]
  8. Lee, D. Experimental investigation of laser spot welding of Ni and Au-Sn-Ni alloy. J. Weld. Join. 2017, 35, 1–5. [Google Scholar] [CrossRef]
  9. Lee, D.; Pyo, S. Experimental investigation of multi-mode fiber laser cutting of cement mortar. Materials 2018, 11, 278. [Google Scholar] [CrossRef] [PubMed]
  10. Lee, D.; Mazumder, J. Numerical studies of laser cutting of an anode for Lithium-Ion batteries. In Proceedings of the 31th International Congress on Applications of Lasers & Electro–Optics, Anaheim, CA, USA, 23–27 September 2012. [Google Scholar]
  11. Lee, D.; Patwa, R.; Herfurth, H.; Mazumder, J. High speed remote laser cutting of electrodes for Lithium-Ion batteries: Anode. J. Power Sources 2013, 240, 368–380. [Google Scholar] [CrossRef]
  12. Herfurth, H.J.; Patwa, R.; Pantsar, H. Laser cutting of electrodes for advanced batteries. In Proceedings of the LPM, Stuttjart, Germany, 7–10 June 2010. [Google Scholar]
  13. Lee, D.; Mazumder, J. Effects of laser beam spatial distribution on laser-material interaction. J. Laser Appl. 2016, 28, 032003. [Google Scholar] [CrossRef]
  14. Mazumder, J.; Lee, D.; Tübke, J.; Pinkwart, K.; Herfurth, H.; Patwa, R. High speed laser cutting of electrodes for lithium ion batteries. In Collaboration of the University of Michigan and Fraunhofer—Progress Report; University of Michigan: Ann Arbor, MI, USA, 2011. [Google Scholar]
  15. Patwa, R.; Herfurth, H.; Heinemann, S.; Mazumder, J.; Lee, D. Investigation of different laser cutting strategies for sizing of Li-Ion battery electrodes. In Proceedings of the 31th International Congress on Applications of Lasers & Electro–Optics, Anaheim, CA, USA, 23–27 September 2012. [Google Scholar]
  16. Patwa, R.; Herfurth, H.J.; Pantsar, H.; Heinemann, S.; Mazumder, J.; Lee, D. High speed laser cutting of electrodes for advanced batteries. In Proceedings of the 29th International Congress on Applications of Lasers & Electro–Optics, Anaheim, CA, USA, 26–30 September 2010. [Google Scholar]
  17. Lee, D.; Patwa, R.; Herfurth, H.; Mazumder, J. Three dimensional simulation of high speed remote laser cutting of cathode for lithium-ion batteries. J. Laser Appl. 2016, 28, 032010. [Google Scholar] [CrossRef]
  18. Lee, D.; Patwa, R.; Herfurth, H.; Mazumder, J. Parameter optimization for high speed remote laser cutting of electrodes for lithium-ion batteries. J. Laser Appl. 2016, 28, 022006. [Google Scholar] [CrossRef]
  19. Lee, D.; Mazumder, J. Dataset demonstrating effects of momentum transfer on sizing of current collector for Lithium-Ion batteries during laser cutting. Data Brief 2018, 17, 6–14. [Google Scholar] [CrossRef] [PubMed]
  20. Lee, D. Investigation of physical phenomena and cutting efficiency for laser cutting on anode for Li-Ion batteries. Appl. Sci. 2018, 8, 266. [Google Scholar] [CrossRef]
  21. Lee, D.; Ahn, S. Investigation of laser cutting width of LiCoO2 coated aluminum for Lithium-Ion batteries. Appl. Sci. 2017, 7, 914. [Google Scholar] [CrossRef]
  22. Lee, D.; Mazumder, J. Effects of momentum transfer on sizing of current collectors for Lithium-Ion batteries during laser cutting. Opt. Laser Technol. 2018, 99, 315–325. [Google Scholar] [CrossRef]
  23. Lee, D.; Patwa, R.; Herfurth, H.; Mazumder, J. Computational and experimental studies of laser cutting of the current collectors for Lithium-Ion batteries. J. Power Sources 2012, 210, 327–338. [Google Scholar] [CrossRef]
  24. Herzog, D.; Jaeschke, P.; Meier, O.; Haferkamp, H. Investigations on the thermal effect caused by laser cutting with respect to static strength of cfrp. Int. J. Mach. Tools Manuf. 2008, 48, 1464–1473. [Google Scholar] [CrossRef]
  25. Herzog, D.; Schmidt-Lehr, M.; Oberlander, M.; Canisius, M.; Radek, M.; Emmelmann, C. Laser cutting of carbon fibre reinforced plastics of high thickness. Mater. Des. 2016, 92, 742–749. [Google Scholar] [CrossRef]
  26. Mathew, J.; Goswami, G.L.; Ramakrishnan, N.; Naik, N.K. Parametric studies on pulsed Nd:YAG laser cutting of carbon fibre reinforced plastic composites. J. Mater. Process. Technol. 1999, 89–90, 198–203. [Google Scholar] [CrossRef]
  27. Wu, C.-W.; Wu, X.-Q.; Huang, C.-G. Ablation behaviors of carbon reinforced polymer composites by laser of different operation modes. Opt. Laser Technol. 2015, 73, 23–28. [Google Scholar] [CrossRef] [Green Version]
  28. Lee, D.; Seo, Y.; Pyo, S. Effect of laser speed on cutting characteristics of cement-based materials. Materials 2018, 11, 1055. [Google Scholar] [CrossRef] [PubMed]
  29. Lee, D. Picosecond IR pulsed laser drilling of copper-coated glass/epoxy composite. In IEEE Transactions on Components, Packaging and Manufacturing Technology; IEEE: Piscataway, NJ, USA, 2017; Volume 7, pp. 2066–2072. [Google Scholar]
  30. Ghany, K.A.; Newishy, M. Cutting of 1.2 mm thick austenitic stainless steel sheet using pulsed and CW Nd:YAG laser. J. Mater. Process. Technol. 2005, 168, 438–447. [Google Scholar] [CrossRef]
  31. Gladush, G.G.; Rodionov, N.B. Calculation of mass transfer in the remote cutting of metals by radiation of a high-power repetitively pulsed CO2 laser. Quantum Electron. 2002, 32, 14–18. [Google Scholar] [CrossRef]
  32. Hoult, A.; Migliore, L. High speed keyhole welding of steels using <500 watt CO2 lasers. In Proceedings of the Fifth International Symposium on Laser Precision Microfabrication, Nara, Japan, 11–14 May 2004; pp. 343–348. [Google Scholar]
  33. Orishich, A.M.; Shulyatyev, V.B.; Filon, A.E. Craterlike structures on the cut surface after oxygen-assisted laser cutting of steel. J. Laser Appl. 2016, 28, 012007. [Google Scholar] [CrossRef]
  34. Hilton, P.A.; Lloyd, D.; Tyrer, J.R. Use of a diffractive optic for high power laser cutting. J. Laser Appl. 2016, 28, 012014. [Google Scholar] [CrossRef] [Green Version]
  35. Phi Long, N.; Matsunaga, Y.; Hanari, T.; Yamada, T.; Muramatsu, T. Experimental investigation of transient temperature characteristic in high power fiber laser cutting of a thick steel plate. Opt. Laser Technol. 2016, 84, 134–143. [Google Scholar] [CrossRef]
  36. Choubey, A.; Jain, R.K.; Ali, S.; Singh, R.; Vishwakarma, S.C.; Agrawal, D.K.; Arya, R.; Kaul, R.; Upadhyaya, B.N.; Oak, S.M. Studies on pulsed Nd:YAG laser cutting of thick stainless steel in dry air and underwater environment for dismantling applications. Opt. Laser Technol. 2015, 71, 6–15. [Google Scholar] [CrossRef]
  37. Chichkov, B.N.; Momma, C.; Nolte, S.; von Alvensleben, F.; Tünnermann, A. Femtosecond, picosecond and nanosecond laser ablation of solids. Appl. Phys. A 1996, 63, 109–115. [Google Scholar] [CrossRef]
  38. Vladoiu, I.; Stafe, M.; Negutu, C.; Popescu, I.M. The dependence of the ablation rate of metals on nanosecond laser fluence and wavelength. J. Optoelectron. Adv. Mater. 2008, 10, 3177–3181. [Google Scholar]
  39. Mannion, P.T.; Magee, J.; Coyne, E.; O’Connor, G.M.; Glynn, T.J. The effect of damage accumulation behaviour on ablation thresholds and damage morphology in ultrafast laser micro-machining of common metals in air. Appl. Surf. Sci. 2004, 233, 275–287. [Google Scholar] [CrossRef]
  40. Ki, H.; Mohanty, P.S.; Mazumder, J. A numerical method for multiphase incompressible thermal flows with solid-liquid and liquid-vapor phase transformations. Numer. Heat Transf. Part B Fundam. 2005, 48, 125–145. [Google Scholar] [CrossRef]
  41. Ki, H.; Mohanty, P.S.; Mazumder, J. Modeling of laser keyhole welding: Part I. Mathematical modeling, numerical methodology, role of recoil pressure, multiple reflections, and free surface evolution. Metall. Mater. Trans. A Phys. Metall. Mater. Sci. 2002, 33, 1817–1830. [Google Scholar] [CrossRef]
  42. Ki, H.; Mohanty, P.S.; Mazumder, J. Modeling of laser keyhole welding: Part II. Simulation of keyhole evolution, velocity, temperature profile, and experimental verification. Metall. Mater. Trans. A Phys. Metall. Mater. Sci. 2002, 33, 1831–1842. [Google Scholar] [CrossRef]
  43. Ki, H.; Mohanty, P.S.; Mazumder, J. Modelling of high-density laser-material interaction using fast level set method. J. Phys. D Appl. Phys. 2001, 34, 364–372. [Google Scholar] [CrossRef]
  44. Maisterrena-Epstein, R.; Camacho-López, S.; Escobar-Alarcón, L.; Camacho-López, M.A. Nanosecond laser ablation of bulk Al, Bronze, and Cu: Ablation rate saturation and laser-induced oxidation. Superf. Vacío 2007, 20, 1–5. [Google Scholar]
  45. Torrisi, L.; Gammino, S.; Andò, L.; Nassisi, V.; Doria, D.; Pedone, A. Comparison of nanosecond laser ablation at 1064 and 308 nm wavelength. Appl. Surf. Sci. 2003, 210, 262–273. [Google Scholar] [CrossRef]
  46. Liu, J.M. Simple technique for measurements of pulsed gaussian-beam spot sizes. Opt. Lett. 1982, 7, 196–198. [Google Scholar] [CrossRef] [PubMed]
  47. Jee, Y.; Becker, M.F.; Walser, R.M. Laser-induced damage on single-crystal metal surfaces. J. Opt. Soc. Am. B 1988, 5, 648–659. [Google Scholar] [CrossRef]
  48. Mohanta, A.; Thareja, R.K. Rayleigh scattering from gaseous phase nanoparticles synthesized by pulsed laser ablation of zno. J. Appl. Phys. 2009, 106, 124909. [Google Scholar] [CrossRef]
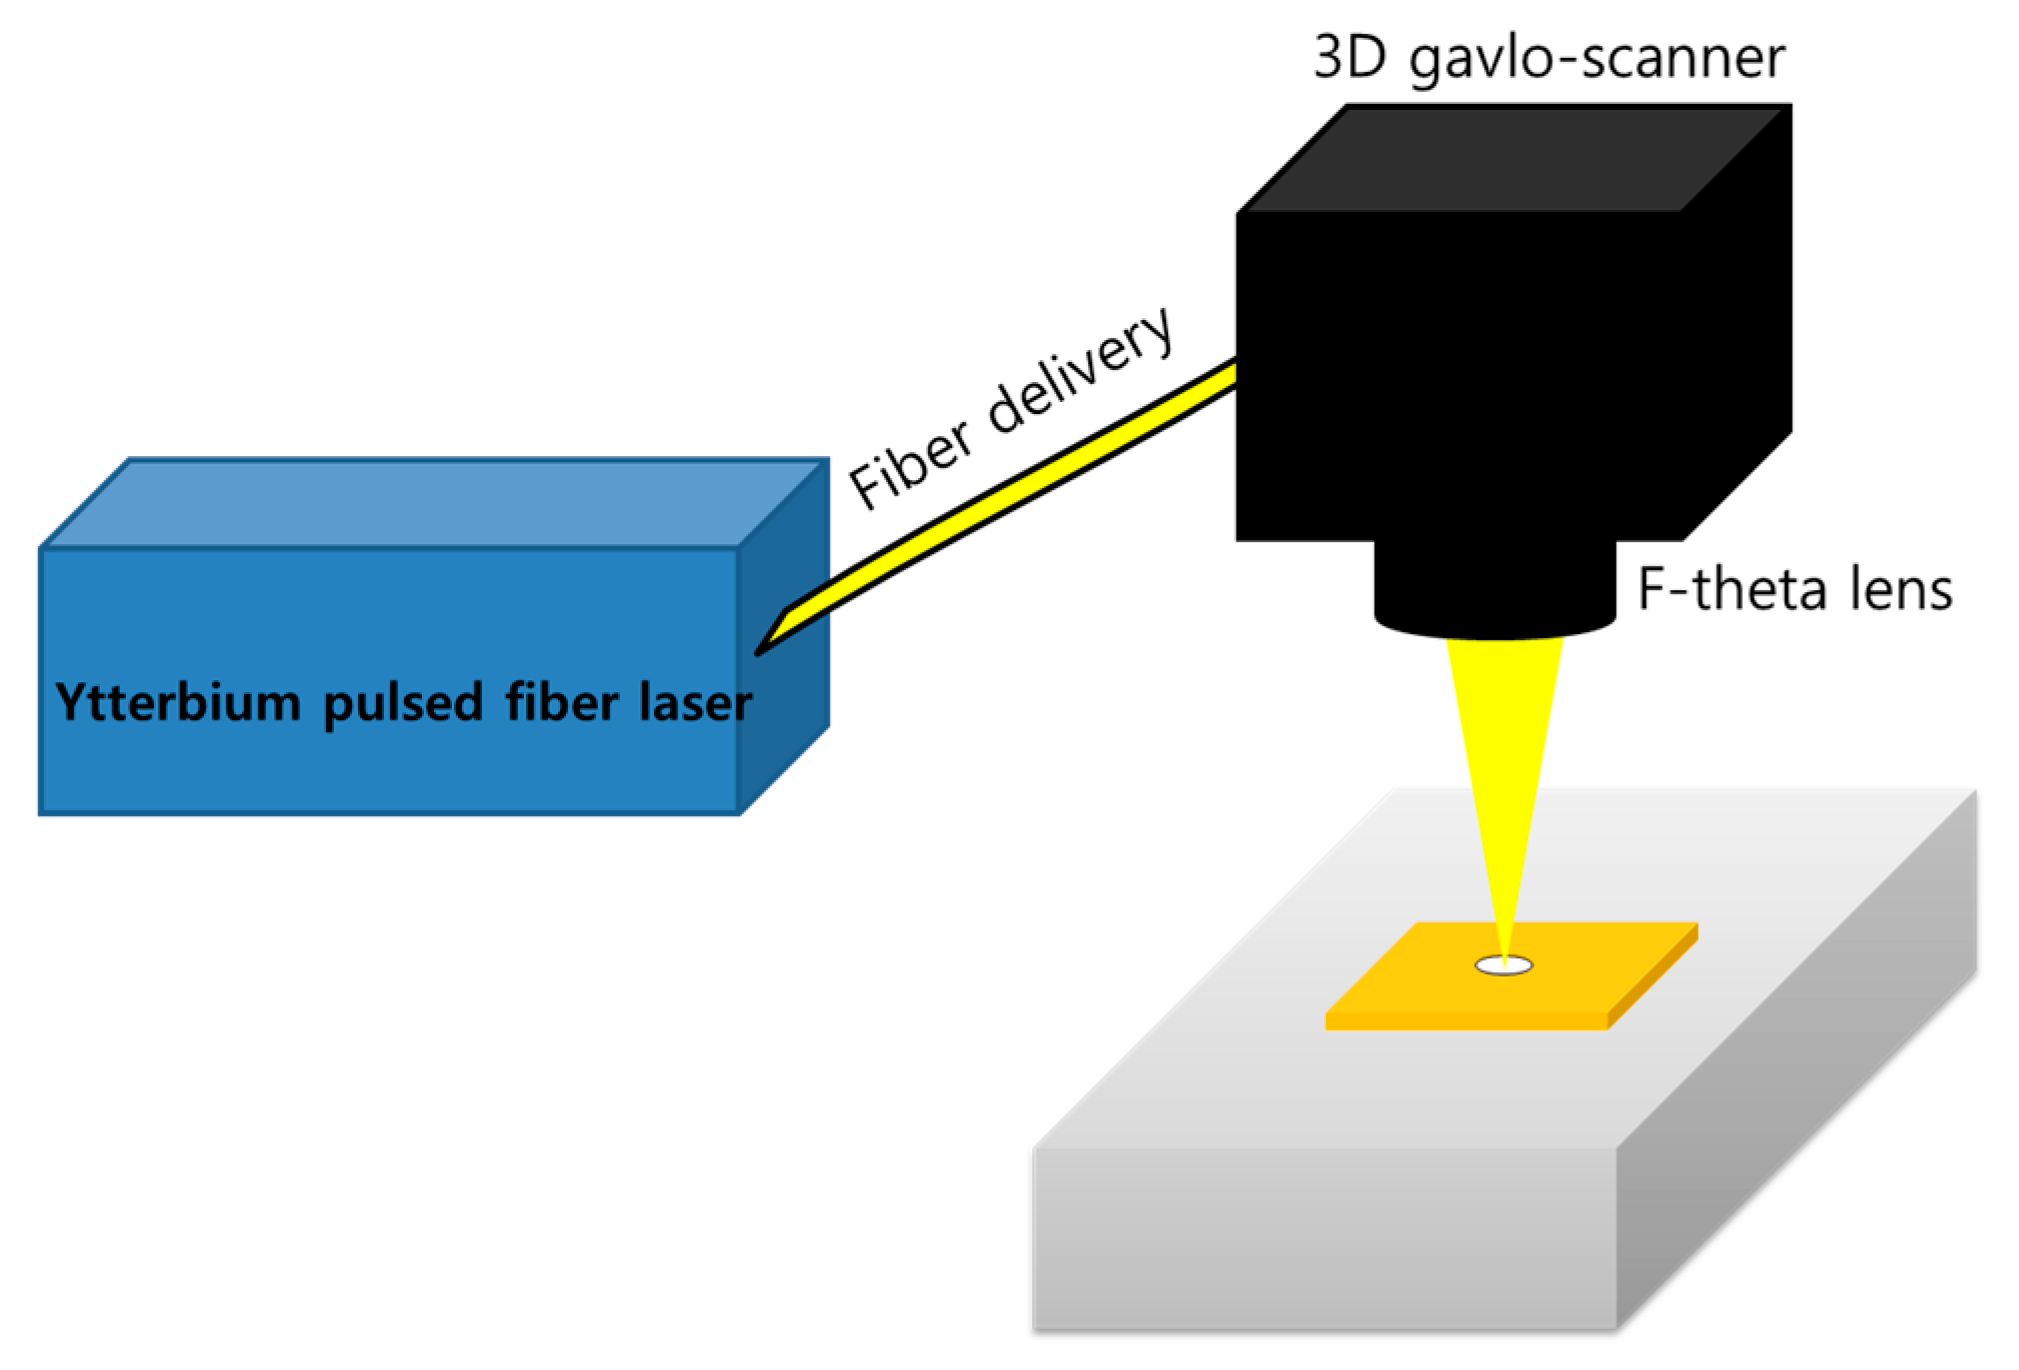
Figure 1. Schematic of experimental setup.
Materials 11 01423 g001
Figure 2. The relationship between pulse energy and laser power.
Materials 11 01423 g002
Figure 3. Comparison of crater size.
Materials 11 01423 g003
Figure 4. A Gaussian spatial distribution of the laser beam.
Materials 11 01423 g004
Figure 5. Crater diameter VS the number of laser pulses applied to the same spot at the constant fluence for the (a) 100 ns; (b) 50 ns; (c) 20 ns; and (d) 8 ns laser-pulse duration.
Materials 11 01423 g005aMaterials 11 01423 g005b
Figure 6. Comparison of material-removal zones.
Materials 11 01423 g006
Figure 7. Comparison of ablation depth.
Materials 11 01423 g007
Figure 8. Scanning electron microscope (SEM) images Δt = 100 ns.
Materials 11 01423 g008
Figure 9. SEM images Δt = 50 ns.
Materials 11 01423 g009
Figure 10. SEM images Δt = 20 ns.
Materials 11 01423 g010
Figure 11. SEM images Δt = 8 ns.
Materials 11 01423 g011
Table 1. Laser parameters used for experiments.
#Δt (ns)f (kHz)Pulse E (µJ)Ppeak (W)Total Energy (mJ)
1000800500200100805020108521
Number of Pulses (#)
11004050050002000160010004002001601004020161042
25060333.36666.73000240015006003002401506030241563
320105190.59523.85250420026251050525420263105534226115
48200100125,00010,000800050002000100080050020010080502010
Table 2. Thermal depth ( l t h ), ablation threshold fluence ( F t h ) and incubation coefficient ( s ).
  Δ t   ( n s )   l t h   ( μ m )   F t h   ( J / c m 2 ) s
1003.39140.9640.750
502.29836.3170.736
201.51714.7510.844
80.9599.7900.825