Recent Developments in Spectroscopic Techniques for the Detection of Explosives


Abstract
1. Introduction
2. Terahertz Spectroscopy
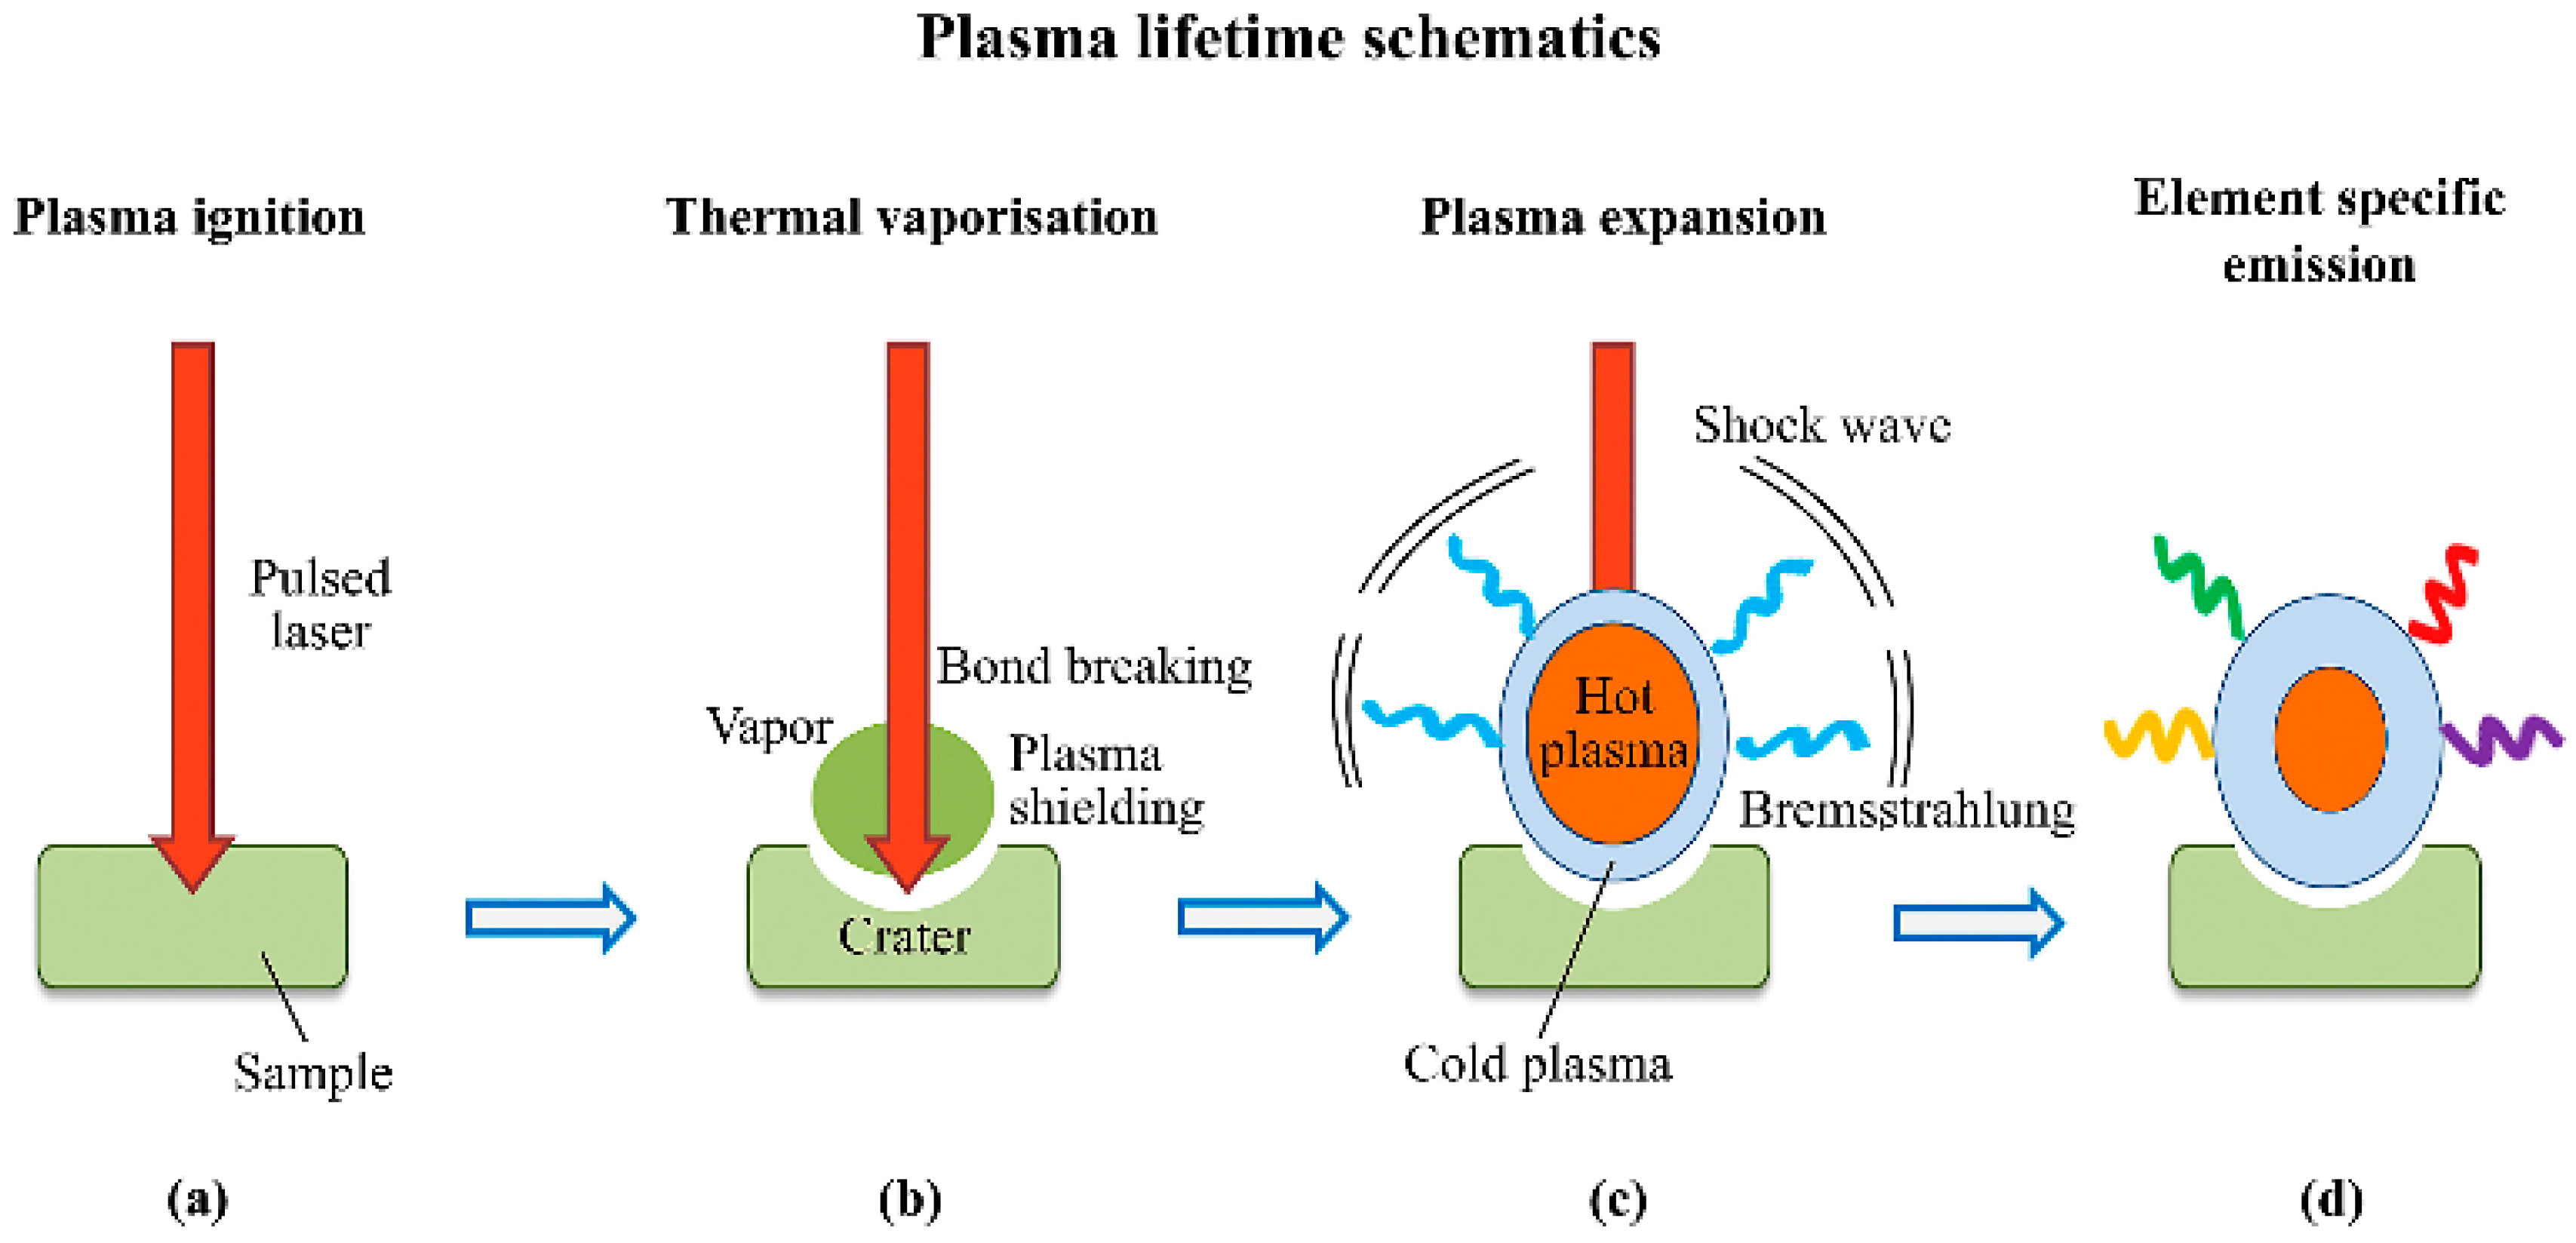
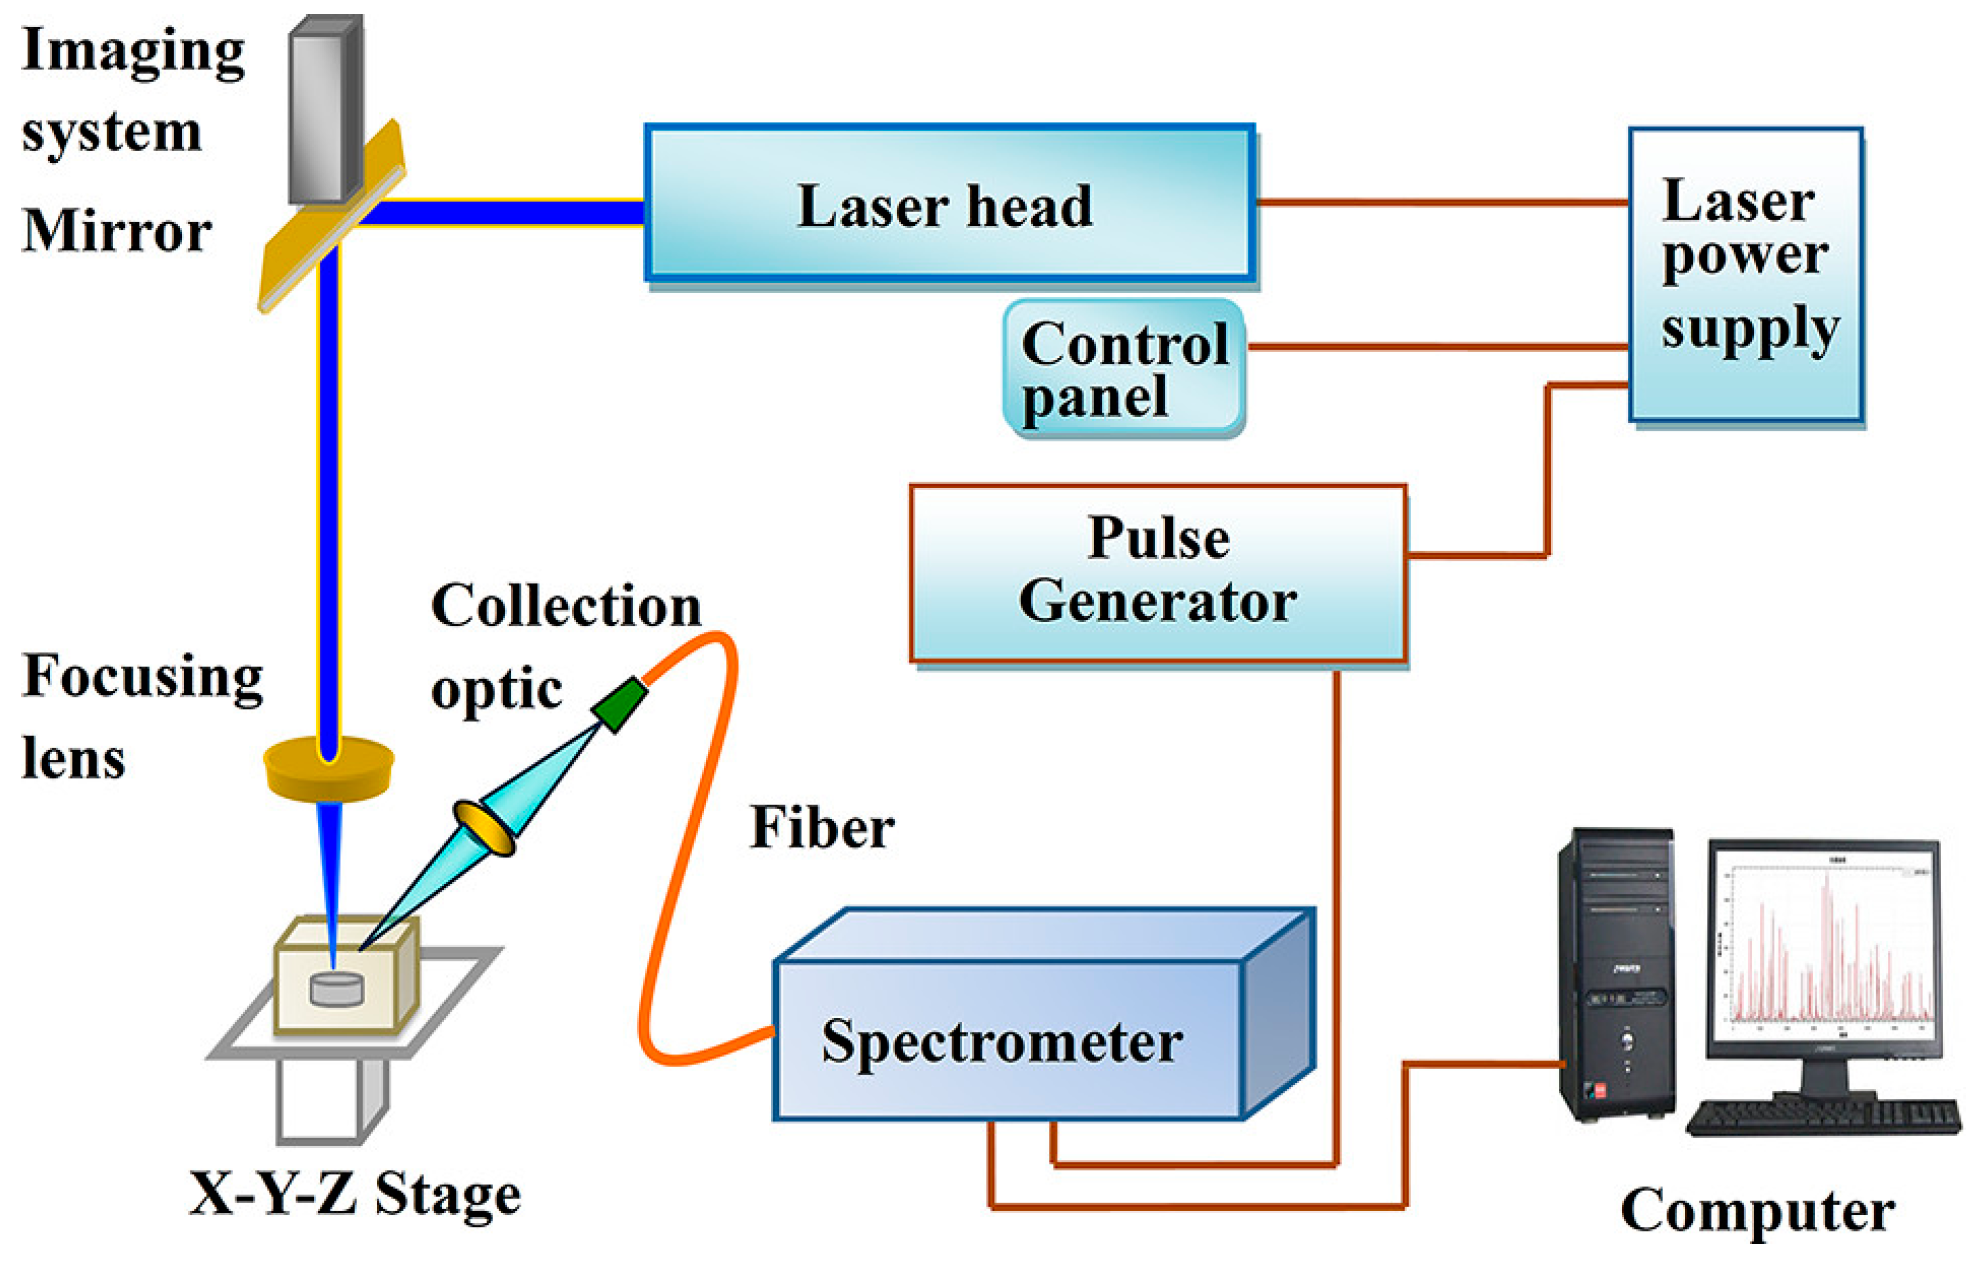
3. Laser-Induced Breakdown Spectroscopy
4. Raman Spectroscopy
5. Ion Mobility Spectroscopy (IMS)
6. Conclusions and Future Prospects
Author Contributions
Funding
Acknowledgments
Conflicts of Interest
References
- Lefferts, M.J.; Castell, M.R. Vapour sensing of explosive materials. Anal. Methods 2015, 7, 9005–9017. [Google Scholar] [CrossRef]
- Zandieh, O.; Kim, S. Sensitive and selective detection of adsorbed explosive molecules using opto-calorimetric infrared spectroscopy and micro-differential thermal analysis. Sens. Actuators B Chem. 2016, 231, 393–398. [Google Scholar] [CrossRef]
- Gares, K.L.; Hufziger, K.T.; Bykov, S.V.; Asher, S.A. Review of explosive detection methodologies and the emergence of standoff deep UV resonance Raman. J. Raman Spectrosc. 2016, 47, 124–141. [Google Scholar] [CrossRef]
- Lu, W.; Dong, X.; Qiu, L.; Yan, Z.; Meng, Z.; Xue, M.; He, X.; Liu, X. Colorimetric sensor arrays based on pattern recognition for the detection of nitroaromatic molecules. J. Hazard. Mater. 2017, 326, 130–137. [Google Scholar] [CrossRef] [PubMed]
- López-López, M.; García-Ruiz, C. Infrared and Raman spectroscopy techniques applied to identification of explosives. Trends Anal. Chem. 2013, 54, 36–44. [Google Scholar]
- Mäkinen, M.; Nousiainen, M.; Sillanpää, M. Ion spectrometric detection technologies for ultra-traces of explosives: A review. Mass Spectrom. Rev. 2011, 30, 940–973. [Google Scholar] [CrossRef] [PubMed]
- Zarei, A.R.; Ghazanchayi, B. Design and fabrication of optical chemical sensor for detection of nitroaromatic explosives based on fluorescence quenching of phenol red immobilized poly(vinyl alcohol) membrane. Talanta 2016, 150, 162–168. [Google Scholar] [CrossRef] [PubMed]
- Pramanik, S.; Zheng, C.; Zhang, X.; Emge, T.J.; Li, J. New microporous metal-organic framework demonstrating unique selectivity for detection of high explosives and aromatic compounds. J. Am. Chem. Soc. 2011, 133, 4153–4155. [Google Scholar] [CrossRef] [PubMed]
- Demirağ, Y.; Bütün, B.; Özbay, E. Plasmonic enhanced terahertz time-domain spectroscopy system for identification of common explosives. In Proceedings of the Next-Generation Spectroscopic Technologies X, Anaheim, CA, USA, 5 May 2017. [Google Scholar]
- Greenall, N.; Valavanis, A.; Desai, H.; Acheampong, D.; Li, L.; Cunningham, J.; Davies, A.; Linfield, E.; Burnett, A. The Development of a Semtex-H Simulant for Terahertz Spectroscopy. J. Infrared Millim. Terahertz Waves 2017, 38, 325–338. [Google Scholar] [CrossRef]
- Lucena, P.; Doña, A.; Tobaria, L.; Laserna, J. New challenges and insights in the detection and spectral identification of organic explosives by laser induced breakdown spectroscopy. Spectrochim. Acta Part B 2011, 66, 12–20. [Google Scholar] [CrossRef]
- Gavenda, T.; Křesálek, V. Terahertz time-domain spectroscopy for distinguishing different kinds of gunpowder. In Proceedings of the Millimetre Wave and Terahertz Sensors and Technology VI, Dresden, Germany, 18 October 2013. [Google Scholar]
- Wang, Z.; Yuan, T.-B.; Hou, Z.-Y.; Zhou, W.-D.; Lu, J.-D.; Ding, H.-B.; Zeng, X.-Y. Laser-induced breakdown spectroscopy in China. Front. Phys. 2014, 9, 419–438. [Google Scholar] [CrossRef]
- Zhang, W.; Ma, X.; Shen, R.; Wu, L.; Ye, Y.; Hu, Y.; Zhu, P. Progress on laser-induced decomposition of explosives investigated by spectroscopic methods. Appl. Spectrosc. Rev. 2014, 49, 550–563. [Google Scholar] [CrossRef]
- Zhang, W.; Shen, R.; Wu, L.; Ye, Y.; Hu, Y. Experimental studies on plasma emission spectroscopy of laser ablation of hexahydro-l, 3, 5-trinitro-l,3,5-triazine. In Proceedings of the 2nd International Symposium on Laser Interaction with Matter (LIMIS 2012), Xi’an, China, 16 May 2013. [Google Scholar]
- Yang, C.S.-C.; Jin, F.; Trivedi, S.B.; Brown, E.E.; Hommerich, U.; Tripathi, A.; Samuels, A.C. Long-wave infrared (LWIR) molecular laser-induced breakdown spectroscopy (LIBS) emissions of thin solid explosive powder films deposited on aluminum substrates. Appl. Spectrosc. 2017, 71, 728–734. [Google Scholar] [CrossRef] [PubMed]
- Botti, S.; Almaviva, S.; Cantarini, L.; Palucci, A.; Puiu, A.; Rufoloni, A. Trace level detection and identification of nitro-based explosives by surface-enhanced Raman spectroscopy. J. Raman Spectrosc. 2013, 44, 463–468. [Google Scholar] [CrossRef]
- Malka, I.; Rosenwaks, S.; Bar, I. Photo-guided sampling for rapid detection and imaging of traces of explosives by a compact Raman spectrometer. Appl. Phys. Lett. 2014, 104, 221103. [Google Scholar] [CrossRef]
- Piorek, B.D.; Lee, S.J.; Moskovits, M.; Meinhart, C.D. Free-surface microfluidics/surface-enhanced Raman spectroscopy for real-time trace vapor detection of explosives. Anal. Chem. 2012, 84, 9700–9705. [Google Scholar] [CrossRef] [PubMed]
- Butler, H.J.; Ashton, L.; Bird, B.; Cinque, G.; Curtis, K.; Dorney, J.; Esmonde-White, K.; Fullwood, N.J.; Gardner, B.; Martin-Hirsch, P.L.; et al. Using Raman spectroscopy to characterize biological materials. Nat. Protoc. 2016, 11, 664–687. [Google Scholar] [CrossRef] [PubMed]
- Farhadian, A.; Tehrani, M.K.; Keshavarz, M.; Darbani, S. Raman spectroscopy combined with principle component analysis to investigate the aging of high energy materials. Laser Phys. 2017, 27, 075701. [Google Scholar] [CrossRef]
- Guven, B.; Eryilmaz, M.; Üzer, A.; Boyaci, I.H.; Tamer, U.; Apak, R. Surface-enhanced Raman spectroscopy combined with gold nanorods for the simultaneous quantification of nitramine energetic materials. RSC Adv. 2017, 7, 37039–37047. [Google Scholar] [CrossRef]
- Buryakov, I.A. Detection of explosives by ion mobility spectrometry. J. Anal. Chem. 2011, 66, 674. [Google Scholar] [CrossRef]
- Filipenko, A.A.; Malkin, E.K. Study of the effect of ionization conditions on the mass selective distributions of the ion mobilities of trotyl and hexogen by ion mobility spectrometry-tandem mass spectrometry. J. Anal. Chem. 2011, 66, 1324–1332. [Google Scholar] [CrossRef]
- Gaik, U.; Sillanpää, M.; Witkiewicz, Z.; Puton, J. Nitrogen oxides as dopants for the detection of aromatic compounds with ion mobility spectrometry. Anal. Bioanal. Chem. 2017, 409, 3223–3231. [Google Scholar] [CrossRef] [PubMed]
- Hagan, N.; Goldberg, I.; Graichen, A.; Jean, A.S.; Wu, C.; Lawrence, D.; Demirev, P. Ion mobility spectrometry-high resolution LTQ-Orbitrap mass spectrometry for analysis of homemade explosives. J. Am. Soc. Mass Spectrom. 2017, 28, 1531–1539. [Google Scholar] [CrossRef] [PubMed]
- Krylatykh, N.A.; Fattakhov, Y.V.; Fakhrutdinov, A.R.; Anashkin, V.N.; Shagalov, V.A.; Khabipov, R.S. Detection of explosive precursors using low-field magnetic resonance imaging. Appl. Magn. Reson. 2016, 47, 915–924. [Google Scholar] [CrossRef]
- Balcı, E.; Rameev, B.; Acar, H.; Mozzhukhin, G.V.; Aktaş, B.; Çolak, B.; Kupriyanov, P.A.; Ievlev, A.V.; Chernyshev, Y.S.; Chizhik, V.I. Development of Earth’s field nuclear magnetic resonance (EFNMR) technique for applications in security scanning devices. Appl. Magn. Reson. 2016, 47, 87–99. [Google Scholar] [CrossRef]
- Rameev, B.Z.; Aktaş, B. NMR & MW techniques for detection of explosive and illicit materials. In Proceedings of the 2016 9th International Kharkiv Symposium on Physics and Engineering of Microwaves, Millimeter and Submillimeter Waves (MSMW), Kharkiv, Ukraine, 20–24 June 2016; pp. 1–3. [Google Scholar]
- Apih, T.; Rameev, B.; Mozzhukhin, G.; Barras, J. Magnetic Resonance Detection of Explosives and Illicit Materials; Springer: Berlin, Germany, 2013. [Google Scholar]
- Hemnani, P.; Joshi, G.; Rajarajan, A.; Ravindranath, S. 14N NQR spectrometer for explosive detection: A review. In Proceedings of the 2016 International Conference on Automatic Control and Dynamic Optimization Techniques (ICACDOT), Pune, India, 9–10 September 2016; pp. 1120–1125. [Google Scholar]
- Cardona, L.; Miyato, Y.; Itozaki, H.; Jiménez, J.; Vanegas, N.; Sato-Akaba, H. Remote detection of ammonium nitrate by nuclear quadrupole resonance using a portable system. Appl. Magn. Reson. 2015, 46, 95–307. [Google Scholar] [CrossRef]
- Cooper, R.J.; Mark, B.L.; Prescott, D.W.; Sauer, K.L. Improving the design of atomic magnetometer arrays for RF interference mitigation in NQR detection of explosives. In Proceedings of the Detection and Sensing of Mines, Explosive Objects, and Obscured Targets XXII, Anaheim, CA, USA, 4 May 2017. [Google Scholar]
- Galan-Freyle, N.J.; Pacheco-Londono, L.C.; Figueroa-Navedo, A.M.; Hernandez-Rivera, S.P. Standoff detection of highly energetic materials using laser-induced thermal excitation of infrared emission. Appl. Spectrosc. 2015, 69, 535–544. [Google Scholar] [CrossRef] [PubMed]
- Figueroanavedo, A.; Pachecolondoño, L.C.; Hernándezrivera, S.P. Improved detection of highly energetic materials traces on surfaces by standoff laser-induced thermal emission incorporating neural networks. In Proceedings of the Thermosense: Thermal Infrared Applications XXXV, Baltimore, MD, USA, 3 June 2013. [Google Scholar]
- Castro-Suarez, J.R.; Pacheco-Londoño, L.C.; Aparicio-Bolaño, J.; Hernández-Rivera, S.P. Active mode remote infrared spectroscopy detection of TNT and PETN on aluminum substrates. J. Spectrosc. 2017, 2017, 2730371. [Google Scholar] [CrossRef]
- Breshike, C.J.; Kendziora, C.A.; Furstenberg, R.; Nguyen, V.; McGill, R.A. Methodology for using active infrared spectroscopy in standoff detection of trace explosives. In Proceedings of the Chemical, Biological, Radiological, Nuclear, and Explosives (CBRNE) Sensing XVIII, Anaheim, CA, USA, 3 May 2017. [Google Scholar]
- Ewing, A.V.; Kazarian, S.G. Infrared spectroscopy and spectroscopic imaging in forensic science. Analyst 2017, 142, 257–272. [Google Scholar] [CrossRef] [PubMed]
- Ong, T.-H.; Mendum, T.; Geurtsen, G.; Kelley, J.; Ostrinskaya, A.; Kunz, R. Use of mass spectrometric vapor analysis to improve canine explosive detection efficiency. Anal. Chem. 2017, 89, 6482–6490. [Google Scholar] [CrossRef] [PubMed]
- Civiš, S.; Civiš, M.; Sovová, K.; Dryahina, K.; Kubišta, J.; Skřehot, P.; Španěl, P.; Kyncl, M. Selected ion flow tube mass spectrometry analyses of laser decomposition products of a range of explosives and ballistic propellants. Anal. Methods 2016, 8, 1145–1150. [Google Scholar] [CrossRef]
- Sisco, E.; Najarro, M.; Samarov, D.; Lawrence, J. Quantifying the stability of trace explosives under different environmental conditions using electrospray ionization mass spectrometry. Talanta 2017, 165, 10–17. [Google Scholar] [CrossRef] [PubMed]
- Gamble, S.C.; Campos, L.C.; Morgan, R.M. Detection of trace peroxide explosives in environmental samples using solid phase extraction and liquid chromatography mass spectrometry. Environ. Forensics 2017, 18, 50–61. [Google Scholar] [CrossRef]
- Sun, W.; Liang, M.; Li, Z.; Shu, J.; Yang, B.; Xu, C.; Zou, Y. Ultrasensitive detection of explosives and chemical warfare agents by low-pressure photoionization mass spectrometry. Talanta 2016, 156, 191–195. [Google Scholar] [CrossRef] [PubMed]
- Zhang, W.; Shen, R.; Ye, Y.; Wu, L.; Zhu, P.; Hu, Y. Distribution and formation of particles produced by laser ablation of cyclotetramethylene tetranitramine. Laser Part. Beams 2017, 35, 391–396. [Google Scholar] [CrossRef]
- Zhang, W.; Shen, R.; Ye, Y.; Wu, L.; Hu, Y.; Zhu, P. Dissociation of Cyclotrimethylenetrinitramine Under 1064-nm Laser Irradiation Investigated by Time-of-Flight Mass Spectrometer. Spectrosc. Lett. 2014, 47, 611–615. [Google Scholar] [CrossRef]
- Zhang, W.; Wang, F.; Shen, R.; Ye, Y. Time of flight mass spectroscopy of 2,2′,4,4′,6,6′-hexanitrostilbene under 1064nm excitation. In Proceedings of the Fourth International Symposium on Laser Interaction with Matter, Chengdu, China, 12 May 2017. [Google Scholar]
- Fujiyama-Novak, J.H.; Gaddam, C.K.; Das, D.; Vander Wal, R.L.; Ward, B. Detection of explosives by plasma optical emission spectroscopy. Sensor Actuators B-Chem. 2013, 176, 985–993. [Google Scholar] [CrossRef]
- Vander Wal, R.L.; Gaddam, C.K.; Kulis, M.J. An investigation of micro-hollow cathode glow discharge generated optical emission spectroscopy for hydrocarbon detection and differentiation. Appl. Spectrosc. 2014, 68, 649–656. [Google Scholar] [CrossRef] [PubMed]
- Furstenberg, R.; Kendziora, C.A.; Papantonakis, M.R.; Mcgill, R.A. Trace explosives detection using photo-thermal infrared imaging spectroscopy (PT-IRIS): theory, modeling, and detection algorithms. In Proceedings of the Chemical, Biological, Radiological, Nuclear, and Explosives (CBRNE) Sensing XVI, Baltimore, MD, USA, 19 May 2015. [Google Scholar]
- Kendziora, C.A.; Furstenberg, R.; Papantonakis, M.; Nguyen, V.; McGill, R.A. Broadband infrared imaging spectroscopy for standoff detection of trace explosives. In Proceedings of the Micro- and Nanotechnology Sensors, Systems, and Applications VIII, Baltimore, MD, USA, 25 May 2016. [Google Scholar]
- Kendziora, C.A.; Furstenberg, R.; Papantonakis, M.; Nguyen, V.; Byers, J.; McGill, R.A. Infrared photothermal imaging spectroscopy for detection of trace explosives on surfaces. Appl. Opt. 2015, 54, 129–138. [Google Scholar] [CrossRef] [PubMed]
- Marcus, L.S.; Holthoff, E.L.; Pellegrino, P.M. Standoff photoacoustic spectroscopy of explosives. Appl. Spectrosc. 2017, 71, 833–838. [Google Scholar] [CrossRef] [PubMed]
- Holthoff, E.L.; Marcus, L.S.; Pellegrino, P.M. Photoacoustic spectroscopy for trace vapor detection and standoff detection of explosives. In Proceedings of the Chemical, Biological, Radiological, Nuclear, and Explosives (CBRNE) Sensing XVII, Baltimore, MD, USA, 12 May 2016. [Google Scholar]
- Puiu, A.; Giubileo, G.; Cesaro, S.N.; Palucci, A. Application of Laser photoacoustic spectroscopy and chemometrics in homeland security. In Photoptics 2015; Springer: Berlin, Germany, 2016; pp. 53–62. [Google Scholar]
- Cuisset, A.; Gruet, S.; Pirali, O.; Chamaille, T.; Mouret, G. Synchrotron FT-FIR spectroscopy of nitro-derivatives vapors: New spectroscopic signatures of explosive taggants and degradation products. Spectroc. Acta Part A Mol. Biomol. Spectrosc. 2014, 132, 838–845. [Google Scholar] [CrossRef] [PubMed]
- Qin, T.; Wang, X.; Meng, H.; Qin, Y.X.; Webb, B.; Wan, G.B.; Witte, R.S.; Xin, H. Microwave-induced thermoacoustic imaging for embedded explosives detection. In Proceedings of the IEEE Antennas and Propagation Society International Symposium, Memphis, TN, USA, 6–11 July 2014; pp. 1917–1918. [Google Scholar]
- Roucou, A.; Kleiner, I.; Goubet, M.; Bteich, S.; Mouret, G.; Bocquet, R.; Hindle, F.; Meerts, W.L.; Cuisset, A. Towards the detection of explosive taggants: Microwave and millimetre-wave gas-phase spectroscopies of 3-Nitrotoluene. Chemphyschem 2018, 19, 1056–1067. [Google Scholar] [CrossRef] [PubMed]
- Wells, K.; Bradley, D. A review of X-ray explosives detection techniques for checked baggage. Appl. Radiat. Isot. 2012, 70, 1729–1746. [Google Scholar] [CrossRef] [PubMed]
- Gierlik, M.; Borsuk, S.; Guzik, Z.; Iwanowska, J.; Korolczuk, S.; Kozłowski, T.; Krakowski, T.; Marcinkowski, R.; Swiderski, L.; Szeptycka, M. SWAN-Detection of explosives by means of fast neutron activation analysis. Methods Phys. Res. Sect. A 2016, 834, 16–23. [Google Scholar] [CrossRef]
- Yin, M.; Tang, S.; Tong, M. The application of Terahertz spectroscopy to liquid petrochemicals detection: A review. Appl. Spectrosc. Rev. 2016, 51, 379–396. [Google Scholar] [CrossRef]
- Baxter, J.B.; Guglietta, G.W. Terahertz spectroscopy. Anal. Chem. 2011, 83, 4342–4368. [Google Scholar] [CrossRef] [PubMed]
- Han, S.; Bertling, K.; Dean, P.; Keeley, J.; Burnett, A.D.; Lim, Y.L.; Khanna, S.P.; Valavanis, A.; Linfield, E.H.; Davies, A.G. Laser feedback interferometry as a tool for analysis of granular materials at terahertz frequencies: towards imaging and identification of plastic explosives. Sensors 2016, 16, 352. [Google Scholar] [CrossRef] [PubMed]
- Skvortsov, L.A. Standoff Detection of Hidden Explosives and Cold and Fire Arms by Terahertz Time-Domain Spectroscopy and Active Spectral Imaging (Review). J. Appl. Spectrosc. 2014, 81, 725–749. [Google Scholar] [CrossRef]
- Palka, N.; Szala, M.; Czerwinska, E. Characterization of prospective explosive materials using terahertz time-domain spectroscopy. Appl. Opt. 2016, 55, 4575–4583. [Google Scholar] [CrossRef] [PubMed]
- Lepodise, L.M.; Horvat, J.; Lewis, R.A. Terahertz Spectroscopy of 2,4-Dinitrotoluene over a Wide Temperature Range (7–245 K). J. Phys. Chem. A 2015, 119, 263–270. [Google Scholar] [CrossRef] [PubMed]
- Pierno, L.; Fiorello, A.M.; Scafè, S.; Cunningham, J.; Burnett, A.D.; Linfield, E.H.; Davies, A.G. THz-TDS analysis of hidden explosives for homeland security scenarios. In Proceedings of the 2013 6th UK, European, China Millimeter Waves and THz Technology Workshop, Rome, Italy, 9–11 September 2013; pp. 1–2. [Google Scholar]
- Trofimov, V.A.; Varentsova, S.A.; Zakharova, I.G.; Zagursky, D.Y. Principal limitation of standard THz time-domain spectroscopy method of the detection and identification of substance and way of its overcoming. In Proceedings of the Optics and Photonics for Counterterrorism, Crime Fighting, and Defence XI; and Optical Materials and Biomaterials in Security and Defence Systems Technology XII, Toulouse, France, 21 October 2015. [Google Scholar]
- Smith, R.M.; Arnold, M.A. Terahertz time-domain spectroscopy of solid samples: principles, applications, and challenges. Appl.Spectrosc. Rev. 2011, 46, 636–679. [Google Scholar] [CrossRef]
- Sleiman, J.B.; Bousquet, B.; Palka, N.; Mounaix, P. Quantitative analysis of hexahydro-1,3,5-trinitro-1,3,5, triazine/pentaerythritol tetranitrate (RDX -PETN) mixtures by terahertz time domain spectroscopy. Appl. Spectrosc. 2015, 69, 1464–1471. [Google Scholar] [CrossRef] [PubMed]
- Sleiman, J.B.; Perraud, J.-B.; Bousquet, B.; Guillet, J.-P.; Palka, N.; Mounaix, P. Identifying explosives by chemometrics with terahertz spectral imaging. SPIE Newsroom 2015. [Google Scholar] [CrossRef]
- Bousleiman, J.; Perraud, J.B.; Palka, N.; Mounaix, P. Discrimination and identification of RDX/PETN explosives by chemometrics applied to terahertz time-domain spectral imaging. In Proceedings of the Millimetre Wave and Terahertz Sensors and Technology VIII, Toulouse, France, 21 October 2015. [Google Scholar]
- Trzcinski, T.; Palka, N.; Szustakowski, M. THz spectroscopy of explosive-related simulants and oxidizers. Polska Akad. Nauk. Bull. Pol. Acad. Sci. 2011, 59, 445. [Google Scholar] [CrossRef]
- Rahman, A. Dendrimer based terahertz time-domain spectroscopy and applications in molecular characterization. J. Mol. Struct. 2011, 1006, 59–65. [Google Scholar] [CrossRef]
- Palka, N. THz reflection spectroscopy of explosives measured by time domain spectroscopy. Acta Phys. Pol. A 2011, 120, 713–715. [Google Scholar] [CrossRef]
- Choi, K.; Hong, T.; Ik Sim, K.; Ha, T.; Cheol Park, B.; Hyuk Chung, J.; Gyeong Cho, S.; Hoon Kim, J. Reflection terahertz time-domain spectroscopy of RDX and HMX explosives. J. Appl. Phys. 2014, 115, 023105. [Google Scholar] [CrossRef]
- Huang, P.; Qiu, R.; Tang, Y.X. Study on terahertz spectroscopic of energetic ion salt and oxidizer. J. Microw. Power Electromagn. Energy 2015, 49, 21–28. [Google Scholar]
- Huang, P.; Shi, W. Study on Terahertz time-domain spectroscopy of HNS by sample measure and quantum chemistry calculation. Propellants Explos. Pyrotech. 2011, 36, 513–518. [Google Scholar] [CrossRef]
- Meng, Z.-R.; Shang, L.-P.; Du, Y.; Deng, H. Absorption characteristics and simulation of LLM-105 in the Terahertz range. Guangpuxue Yu Guangpu Fenxi 2015, 35, 1779–1782. [Google Scholar]
- Meng, Z.R.; Shang, L.P.; Du, Y.; Deng, H. Absorption characteristics and simulation of FOX-7 in the terahertz range. Guangpuxue Yu Guangpu Fenxi 2015, 44, 1121–1125. [Google Scholar]
- Du, Y.; Li, J.-M.; Zong, H.-H.; Yang, Z.-F.; Zhang, W.-B. Absorption spectrum studies on the RDX crystals with different granularity in terahertz frequency range. J. Electron. Sci. Technol. 2014, 12, 150–155. [Google Scholar]
- Guo, L.; Zhang, L.; Wang, X.; Hu, Y.; Zhang, C. Time-resolved terahertz spectroscopy of explosive materials. Chin. Opt. Lett. 2005, 3, 117–119. [Google Scholar]
- Choi, J.; Ryu, S.Y.; Kwon, W.S.; Kim, K.-S.; Kim, S. Compound explosives detection and component analysis via terahertz time-domain spectroscopy. J. Opt. Soc. Korea 2013, 17, 454–460. [Google Scholar] [CrossRef]
- Chrzanowski, L.S.V.; Beckmann, J.; Marchetti, B.; Ewert, U.; Schade, U. Terahertz time domain spectroscopy for non-destructive testing of hazardous liquids. Mater. Test. 2012, 54, 444–450. [Google Scholar] [CrossRef]
- Puc, U.; Abina, A.; Rutar, M.; Zidansek, A.; Jeglic, A.; Valusis, G. Terahertz spectroscopic identification of explosive and drug simulants concealed by various hiding techniques. Appl. Opt. 2015, 54, 4495–4502. [Google Scholar] [CrossRef] [PubMed]
- Wang, Z.-Z.; Deguchi, Y.; Zhang, Z.-Z.; Wang, Z.; Zeng, X.-Y.; Yan, J.-J. Laser-induced breakdown spectroscopy in Asia. Front. Phys. 2016, 11, 114213. [Google Scholar] [CrossRef]
- Fountain, A.W.; Christesen, S.D.; Moon, R.P.; Guicheteau, J.A.; Emmons, E.D. Recent advances and remaining challenges for the spectroscopic detection of explosive threats. Appl. Spectrosc. 2014, 68, 795–811. [Google Scholar] [CrossRef] [PubMed]
- Pellegrino, P.M.; Holthoff, E.L.; Farrell, M.E. Laser-based optical detection of explosives; CRC Press: Boca Raton, FL, USA, 2015; Volume 40. [Google Scholar]
- Johnson, J.B.; Allen, S.D.; Merten, J.; Johnson, L.; Pinkham, D.; Reeve, S.W. Standoff methods for the detection of threat agents: A review of several promising laser-based techniques. J. Spectrosc. 2014, 2014, 613435. [Google Scholar] [CrossRef]
- Leahy-Hoppa, M.R.; Miragliotta, J.; Osiander, R.; Burnett, J.; Dikmelik, Y.; McEnnis, C.; Spicer, J.B. Ultrafast laser-based spectroscopy and sensing: applications in LIBS, CARS, and THz spectroscopy. Sensors 2010, 10, 4342–4372. [Google Scholar] [CrossRef] [PubMed]
- Rao, E.N.; Mathi, P.; Kalam, S.A.; Sreedhar, S.; Singh, A.K.; Jagatap, B.; Rao, S.V. Femtosecond and nanosecond LIBS studies of nitroimidazoles: Correlation between molecular structure and LIBS data. J. Anal. At. Spectrom. 2016, 31, 737–750. [Google Scholar] [CrossRef]
- Ahmido, T.; Ting, A.; Misra, P. Femtosecond laser-induced breakdown spectroscopy of surface nitrate chemicals. Appl. Opt. 2013, 52, 3048–3057. [Google Scholar] [CrossRef] [PubMed]
- Markiewicz-Keszycka, M.; Cama-Moncunill, X.; Casado-Gavalda, M.P.; Dixit, Y.; Cama-Moncunill, R.; Cullen, P.J.; Sullivan, C. Laser-induced breakdown spectroscopy (LIBS) for food analysis: a review. Trends Food Sci. Technol. 2017, 65, 80–93. [Google Scholar] [CrossRef]
- Serrano, J.; Moros, J.; Javier Laserna, J. Molecular signatures in femtosecond laser-induced organic plasmas: Comparison with nanosecond laser ablation. Phys. Chem. Chem. Phys. 2016, 18, 2398–2408. [Google Scholar] [CrossRef] [PubMed]
- Moros, J.; Laserna, J.J. A spectral sieve-based strategy for sensing inorganic and organic traces on solid surfaces using laser-induced breakdown spectroscopy. Anal. Methods 2015, 7, 7280–7289. [Google Scholar] [CrossRef]
- Moros, J.; Serrano, J.; Gallego, F.J.; Macias, J.; Laserna, J.J. Recognition of explosives fingerprints on objects for courier services using machine learning methods and laser-induced breakdown spectroscopy. Talanta 2013, 110, 108–117. [Google Scholar] [CrossRef] [PubMed]
- Yang, C.S.C.; Brown, E.E.; Hommerich, U.; Jin, F.; Trivedi, S.B.; Samuels, A.C.; Snyder, A.P. Long-wave, infrared laser-induced breakdown (LIBS) spectroscopy emissions from energetic materials. Appl. Spectrosc. 2012, 66, 1397–1402. [Google Scholar] [CrossRef] [PubMed]
- Li, W.; Lu, J.; Dong, M.; Lu, S.; Yu, J.; Li, S.; Huang, J.; Liu, J. Quantitative analysis of calorific value of coal based on spectral preprocessing by laser-induced breakdown spectroscopy (LIBS). Energy Fuels 2017, 32, 24–32. [Google Scholar] [CrossRef]
- Myakalwar, A.K.; Spegazzini, N.; Zhang, C.; Anubham, S.K.; Dasari, R.R.; Barman, I.; Gundawar, M.K. Less is more: Avoiding the LIBS dimensionality curse through judicious feature selection for explosive detection. Sci. Rep. 2015, 5, 10. [Google Scholar] [CrossRef] [PubMed]
- Yang, C.S.; Brown, E.; Hommerich, U.; Trivedi, S.B.; Samuels, A.C.; Snyder, A.P. Infrared laser-induced breakdown spectroscopy emissions from energetic materials. In Proceedings of the Chemical, Biological, Radiological, Nuclear, and Explosives (CBRNE) Sensing XII, Orlando, FL, USA, May 2011. [Google Scholar]
- Sunku, S.; Gundawar, M.K.; Myakalwar, A.K.; Kiran, P.P.; Tewari, S.P.; Rao, S.V. Femtosecond and nanosecond laser induced breakdown spectroscopic studies of NTO, HMX, and RDX. Spectrochim. Acta 2013, 79–80, 31–38. [Google Scholar] [CrossRef]
- Sreedhar, S.; Nageswara Rao, E.; Manoj Kumar, G.; Tewari, S.P.; Venugopal Rao, S. Molecular formation dynamics of 5-nitro-2,4-dihydro-3H-1,2,4-triazol-3-one, 1,3,5-trinitroperhydro-1,3,5-triazine, and 2,4,6-trinitrotoluene in air, nitrogen, and argon atmospheres studied using femtosecond laser induced breakdown spectroscopy. Spectrochim. Acta 2013, 87, 121–129. [Google Scholar] [CrossRef]
- Rao, E.N.; Sunku, S.; Rao, S.V. Femtosecond laser-induced breakdown spectroscopy studies of nitropyrazoles: the effect of varying nitro groups. Appl. Spectrosc. 2015, 69, 1342–1354. [Google Scholar] [CrossRef] [PubMed]
- Nageswara Rao, E.; Sunku, S.; Tewari, S.P.; Manoj Kumar, G.; Venugopal Rao, S. Femtosecond LIBS studies of nitropyrazoles. In Proceedings of the Chemical, Biological, Radiological, Nuclear, and Explosives (CBRNE) Sensing XIV, Baltimore, MD, USA, 29 May 2013. [Google Scholar]
- Delgado, T.; Vadillo, J.M.; Laserna, J.J. Primary and recombined emitting species in laser-induced plasmas of organic explosives in controlled atmospheres. J. Anal. At. Spectrom. 2014, 29, 1675–1685. [Google Scholar] [CrossRef]
- De Lucia, F.C.; Gottfried, J.L. Influence of molecular structure on the laser-induced plasma emission of the explosive RDX and organic polymers. J. Phys. Chem. A 2013, 117, 9555–9563. [Google Scholar] [CrossRef] [PubMed]
- Rezaei, A.H.; Keshavarz, M.H.; Tehrani, M.K.; Darbani, S.M.R.; Farhadian, A.H.; Jabbarmousavi, S.; Mousaviazar, A. Approach for determination of detonation performance and aluminum percentage of aluminized-based explosives by laser-induced breakdown spectroscopy. Appl. Opt. 2016, 55, 3233–3240. [Google Scholar] [CrossRef] [PubMed]
- De Lucia, F.C.; Gottfried, J.L. Characterization of a series of nitrogen-rich molecules using laser induced breakdown spectroscopy. Propellants Explos. Pyrotech. 2010, 35, 268–277. [Google Scholar] [CrossRef]
- Shaik, A.K.; Epuru, N.R.; Syed, H.; Byram, C.; Soma, V.R. Femtosecond laser induced breakdown spectroscopy based standoff detection of explosives and discrimination using principal component analysis. Opt. Express 2018, 26, 8069–8083. [Google Scholar] [CrossRef] [PubMed]
- Khandasammy, S.R.; Fikiet, M.A.; Mistek, E.; Ahmed, Y.; Halámková, L.; Bueno, J.; Lednev, I.K. Bloodstains, paintings, and drugs: Raman spectroscopy applications in forensic science. Forensic Chem. 2018, 8, 111–133. [Google Scholar] [CrossRef]
- Tuschel, D.D.; Mikhonin, A.V. Deep ultraviolet resonance Raman excitation enables explosives detection. Appl. Spectrosc. 2010, 64, 425–432. [Google Scholar] [CrossRef] [PubMed]
- John, N.; George, S. Raman Spectroscopy. In Spectroscopic Methods for Nanomaterials Characterization; Elsevier: New York, NY, USA, 2017; pp. 95–127. [Google Scholar]
- Almaviva, S.; Botti, S.; Cantarini, L.; Palucci, A.; Puiu, A.; Rufoloni, A.; Landstrom, L.; Romolo, F.S. Trace detection of explosives and their precursors by surface enhanced Raman spectroscopy. In Proceedings of the Optics and Photonics for Counterterrorism, Crime Fighting, and Defence VIII, Edinburgh, UK, 30 October 2012. [Google Scholar]
- Jin, H.C.; Cho, S.G. Nanosecond Gated Raman Spectroscopy for Standoff Detection of Hazardous Materials. Bull. Korean Chem. Soc. 2014, 35, 3547–3552. [Google Scholar]
- Ghosh, M.; Wang, L.; Asher, S.A. Deep-ultraviolet resonance raman excitation profiles of NH4NO3, PETN, TNT, HMX, and RDX. Appl. Spectrosc. 2012, 66, 1013–1021. [Google Scholar] [CrossRef]
- Hwang, J.; Choi, N.; Park, A.; Park, J.-Q.; Chung, J.H.; Baek, S.; Cho, S.G.; Baek, S.-J.; Choo, J. Fast and sensitive recognition of various explosive compounds using Raman spectroscopy and principal component analysis. J. Mol. Struct. 2013, 1039, 130–136. [Google Scholar] [CrossRef]
- Nuntawong, N.; Eiamchai, P.; Limwichean, S.; Wong-Ek, B.; Horprathum, M.; Patthanasettakul, V.; Leelapojanaporn, A.; Nakngoenthong, S.; Chindaudom, P. Trace detection of perchlorate in industrial-grade emulsion explosive with portable surface-enhanced Raman spectroscopy. Forensic Sci. Int. 2013, 233, 174–178. [Google Scholar] [CrossRef] [PubMed]
- Zapata, F.; Garcia-Ruiz, C. Determination of nanogram microparticles from explosives after real open-air explosions by confocal Raman microscopy. Anal. Chem. 2016, 88, 6726–6733. [Google Scholar] [CrossRef] [PubMed]
- Zhang, L.; Zheng, H.Y.; Wang, Y.P.; Ding, L.; Fang, L. Characteristics of Raman spectrum from stand-off detection. Acta Phys. Sin. 2016, 65, 054206. [Google Scholar]
- Hufziger, K.T.; Bykov, S.V.; Asher, S.A. Ultraviolet Raman wide-field hyperspectral imaging spectrometer for standoff trace explosive detection. Appl. Spectrosc. 2016, 71, 173–185. [Google Scholar] [CrossRef] [PubMed]
- Chen, N.; Ding, P.; Shi, Y.; Jin, T.; Su, Y.; Wang, H.; He, Y. Portable and reliable surface-enhanced Raman scattering silicon chip for signal-on detection of trace trinitrotoluene explosive in real systems. Anal. Chem. 2017, 89, 5072–5078. [Google Scholar] [CrossRef] [PubMed]
- Zapata, F.; Lopez-Lopez, M.; Garcia-Ruiz, C. Detection and identification of explosives by surface enhanced Raman scattering. Appl. Spectrosc. Rev. 2016, 51, 207–242. [Google Scholar] [CrossRef]
- Hakonen, A.; Andersson, P.O.; Schmidt, M.S.; Rindzevicius, T.; Kall, M. Explosive and chemical threat detection by surface-enhanced Raman scattering: A review. Anal. Chim. Acta 2015, 893, 1–13. [Google Scholar] [CrossRef] [PubMed]
- Jamil, A.K.M.; Izake, E.L.; Sivanesan, A.; Fredericks, P.M. Rapid detection of TNT in aqueous media by selective label free surface enhanced Raman spectroscopy. Talanta 2015, 134, 732–738. [Google Scholar] [CrossRef] [PubMed]
- Gillibert, R.; Huang, J.Q.; Zhang, Y.; Fu, W.L.; de la Chapelle, M.L. Explosive detection by surface enhanced raman scattering. TrAC Trends Anal. Chem. 2018, 105, 166–172. [Google Scholar] [CrossRef]
- Emmons, E.D.; Guicheteau, J.A.; Christesen, S.D.; Fountain, A.W., III. Ultraviolet resonance Raman spectroscopy of nitroaromatic compounds for standoff detection applications. In Proceedings of the Chemical, Biological, Radiological, Nuclear, and Explosives (CBRNE) Sensing XII, Orlando, FL, USA, 6 June 2011. [Google Scholar]
- Yellampelle, B.; Sluch, M.; Asher, S.; Lemoff, B. Multiple-excitation-wavelength resonance-Raman explosives detection. In Proceedings of the Chemical, Biological, Radiological, Nuclear, and Explosives (CBRNE) Sensing XII, Orlando, FL, USA, 3 June 2011. [Google Scholar]
- Johnson, P.V.; Beegle, L.W.; Kim, H.I.; Eiceman, G.A.; Kanik, I. Ion mobility spectrometry in space exploration. Int. J. Mass Spectrom. 2007, 262, 1–15. [Google Scholar] [CrossRef]
- Sivakumar, N.; Joseph, M.; Manoravi, P.; Vasudeva Rao, P.R.; Raj, B. Development of an ion mobility spectrometer for detection of explosives. Instrum. Sci. Technol. 2013, 41, 96–108. [Google Scholar] [CrossRef]
- Lee, J.; Park, S.; Cho, S.G.; Goh, E.M.; Lee, S.; Koh, S.-S.; Kim, J. Analysis of explosives using corona discharge ionization combined with ion mobility spectrometry–mass spectrometry. Talanta 2014, 120, 64–70. [Google Scholar] [CrossRef] [PubMed]
- Langmeier, A.; Heep, W.; Oberhuettinger, C.; Oberpriller, H.; Kessler, M.; Goebel, J.; Mueller, G. Detection and classification of explosive compounds utilizing laser ion mobility spectrometry. In Proceedings of the Chemical, Biological, Radiological, Nuclear, and Explosives (CBRNE) Sensing X, Orlando, FL, USA, 8 May 2009. [Google Scholar]
- Tabrizchi, M.; Ilbeigi, V. Detection of explosives by positive corona discharge ion mobility spectrometry. J. Hazard. Mater. 2010, 176, 692–696. [Google Scholar] [CrossRef] [PubMed]
- Hilton, C.K.; Krueger, C.A.; Midey, A.J.; Osgood, M.; Wu, J.; Wu, C. Improved analysis of explosives samples with electrospray ionization-high resolution ion mobility spectrometry (ESI-HRIMS). Int. J. Mass. Spectrom. 2010, 298, 64–71. [Google Scholar] [CrossRef]
- Perr, J.M.; Furton, K.G.; Almirall, J.R. Application of a SPME-IMS detection system for explosives detection. In Proceedings of the SPIE-The International Society for Optical Engineering, Miami, FL, USA, May 2005. [Google Scholar]
- Waterbury, R.; Blank, T.; Ford, A.; Dottery, E. Fabrication and testing of a standoff trace explosives detection system. In Proceedings of the Chemical, Biological, Radiological, Nuclear, and Explosives (CBRNE) Sensing XII, Orlando, FL, USA, 3 June 2011. [Google Scholar]
- Moros, J.; Lorenzo, J.A.; Lucena, P.; Tobaria, L.M.; Laserna, J.J. Simultaneous Raman spectroscopy-laser-induced breakdown spectroscopy for instant standoff analysis of explosives using a mobile integrated sensor platform. Anal. Chem. 2010, 82, 1389. [Google Scholar] [CrossRef] [PubMed]


| Compound | Measured Resonance/THz | Theoretical Resonance/THz |
|---|---|---|
| 5-ATN | 0.73, 1.23, 1.79 | 1.12, 1.66 |
| BMDATHBT | 1.50, 1.68 | 1.48, 1.70 |
| SrNO3 | 1.80 | 1.72 |
| 5-ATN/SrNO3 | 0.72, 1.23, 1.80 | - |
| BMDATHBT/SrNO3 | 1.55, 1.67, 1.80 | - |
| KClO3 | 2.38 | 2.40 |
| KClO3/Al/S | 2.35 | - |
| KClO4 | 2.00, 2.17 | 2.00, 2.20 |
| KClO4/Al/S | 1.96, 2.20 | - |
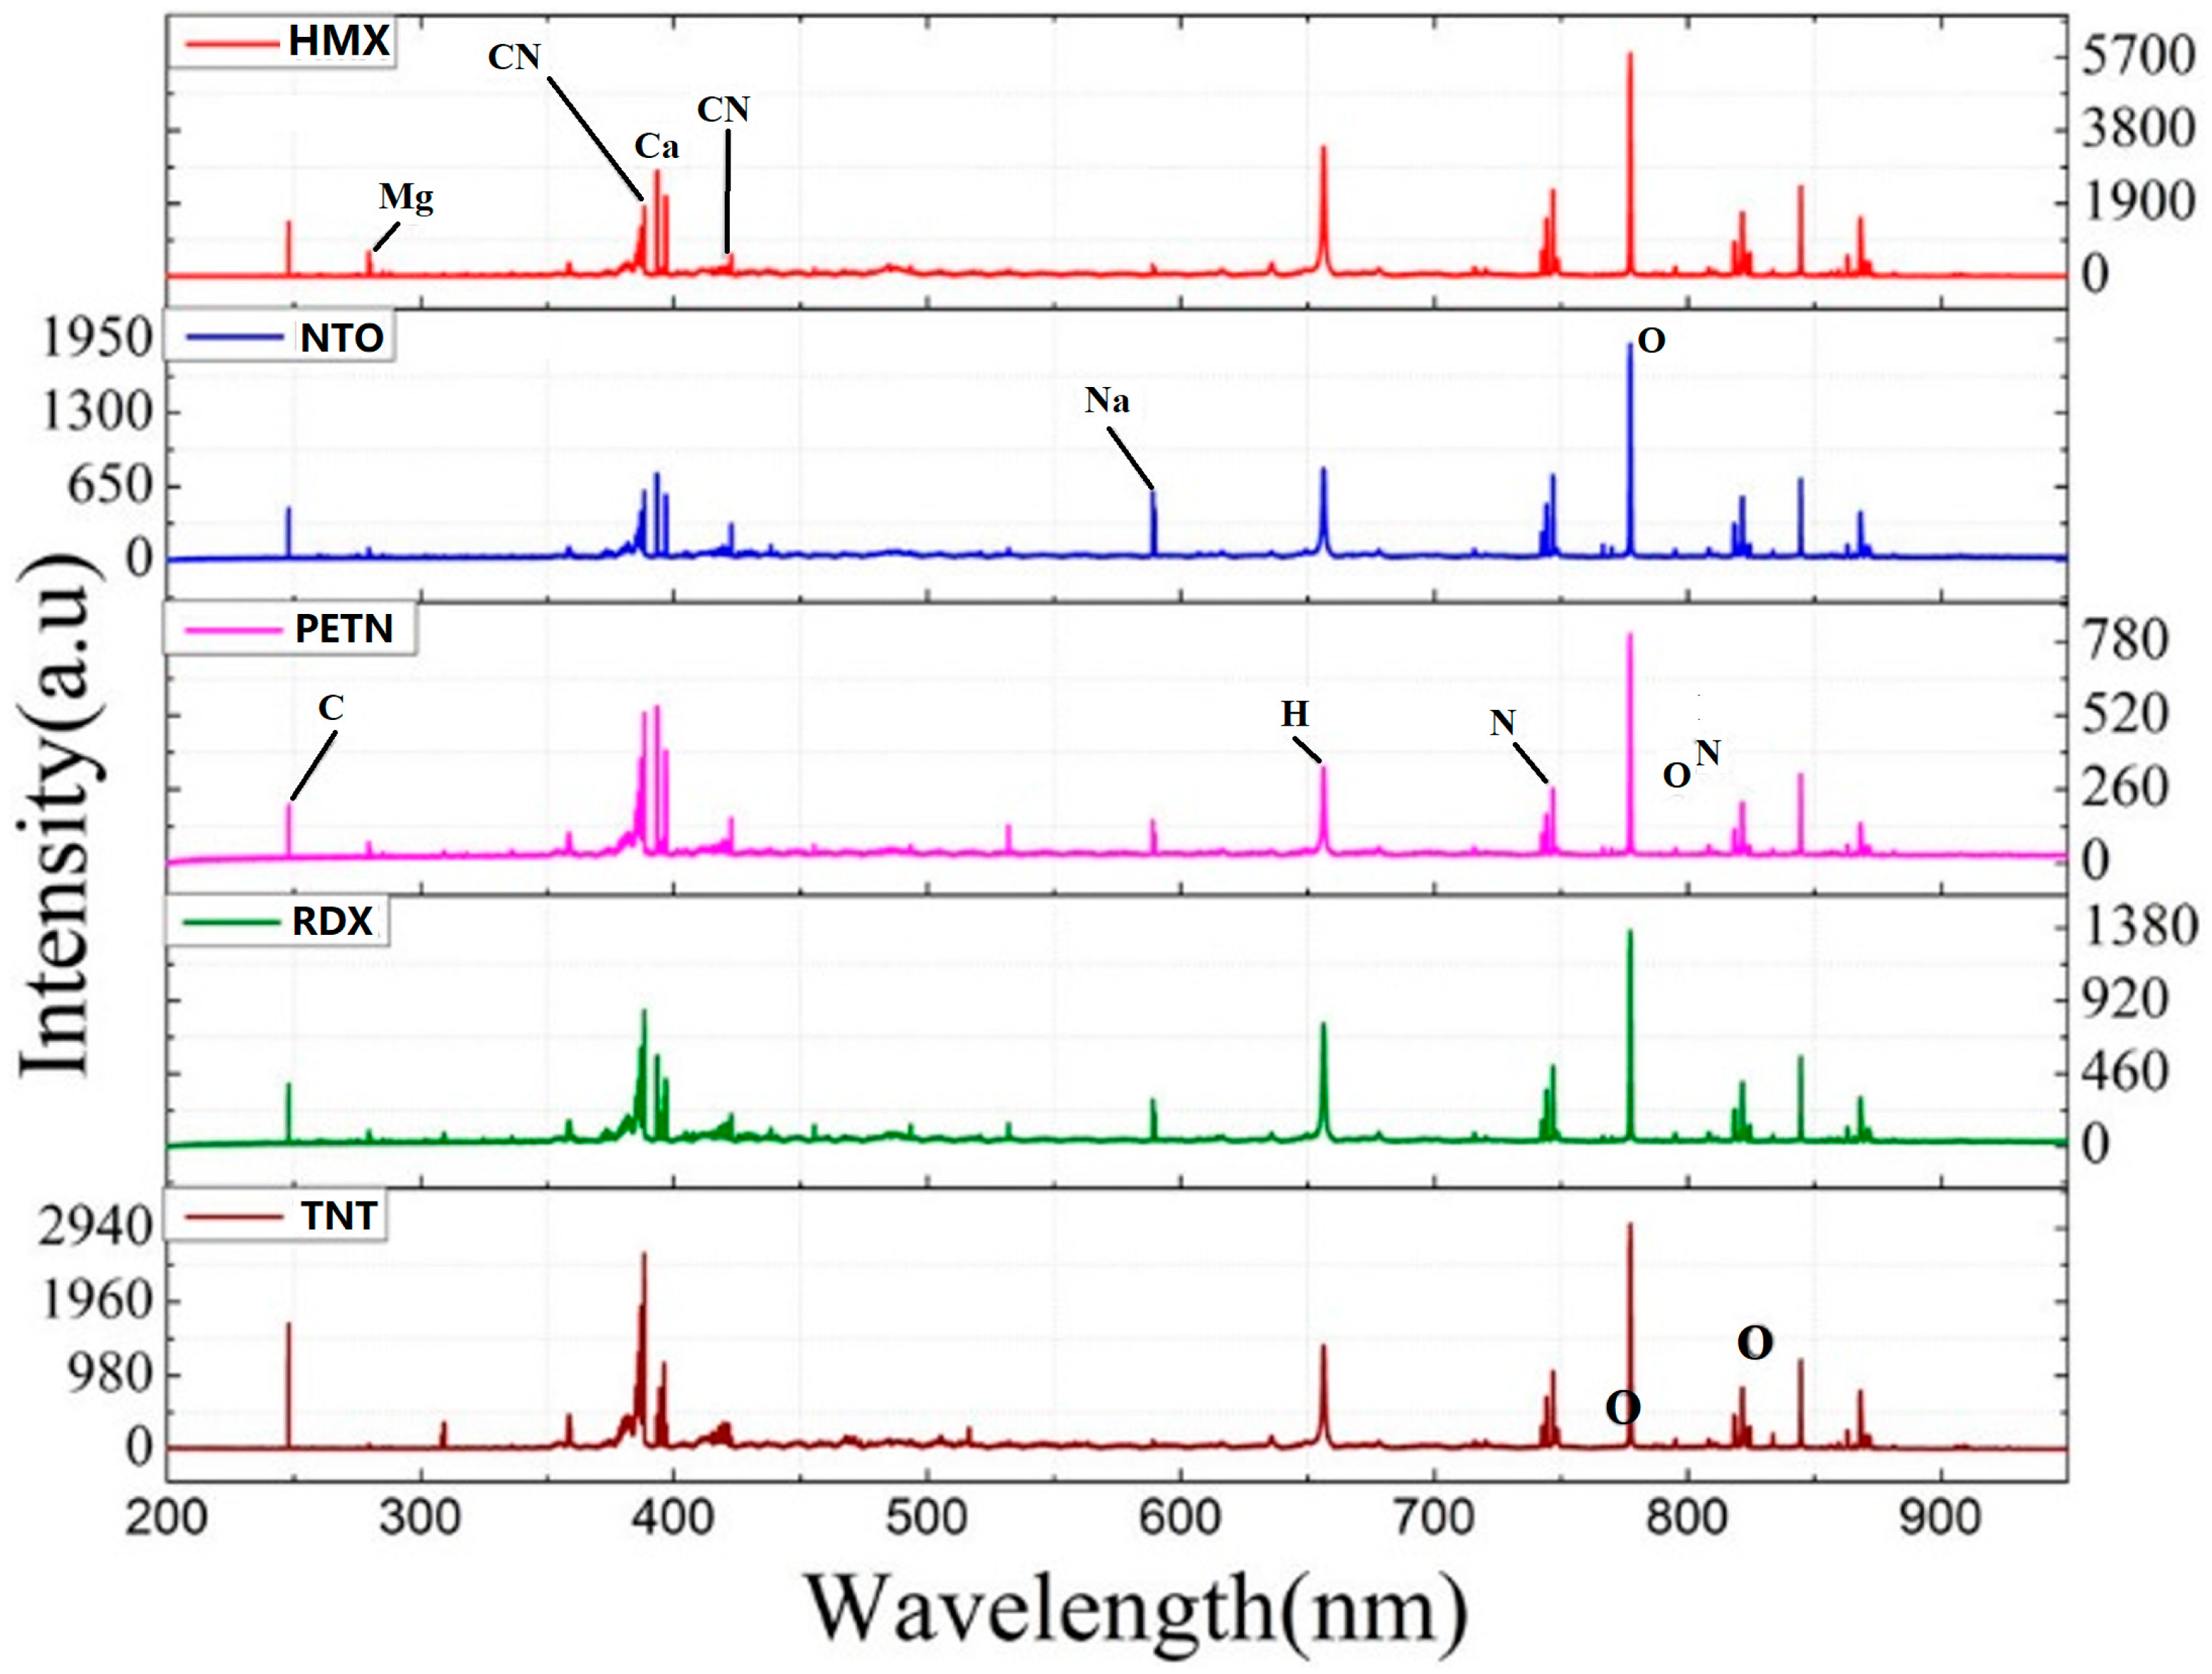
| Peak/nm | Species | RDX | HMX | NTO | |||
|---|---|---|---|---|---|---|---|
| ns | fs | ns | fs | ns | fs | ||
| 247.82 | C | * | * | * | * | * | * |
| 279.49, 280.21, 285.10 | Mg | * | * | * | * | * | * |
| 385.01 | CN | # | * | # | * | # | * |
| 385.40 | CN | * | * | * | * | * | * |
| 386.16 | CN | * | * | * | * | * | * |
| 387.07 | CN | * | * | * | * | * | * |
| 388.28 | CN | * | * | * | * | * | * |
| 393.25, 396.77 | Ca | * | * | * | * | * | * |
| 394.4, 396.15 | Al | * | * | * | * | * | * |
| 588.89, 589.50 | Na | * | * | * | * | * | * |
| 656.2 | H | * | * | * | * | * | * |
| 742.2, 744.1, 746.8 | N | ** | * | ** | * | ** | * |
| 777.20 | O (triplet) | * | * | * | * | * | * |
| 818.34, 818.64, 821.50, 822.35, | N | * | * | * | * | * | * |
| 824.22, 859.5, 856.74, 862.9, 865.66, 868.03, 870.25, 871.10, 870.74 | N | ** | * | ** | * | ** | * |
| 844.55 | O | * | * | * | * | * | * |
| 867.80, 868.80 | N | * | * | * | * | * | * |
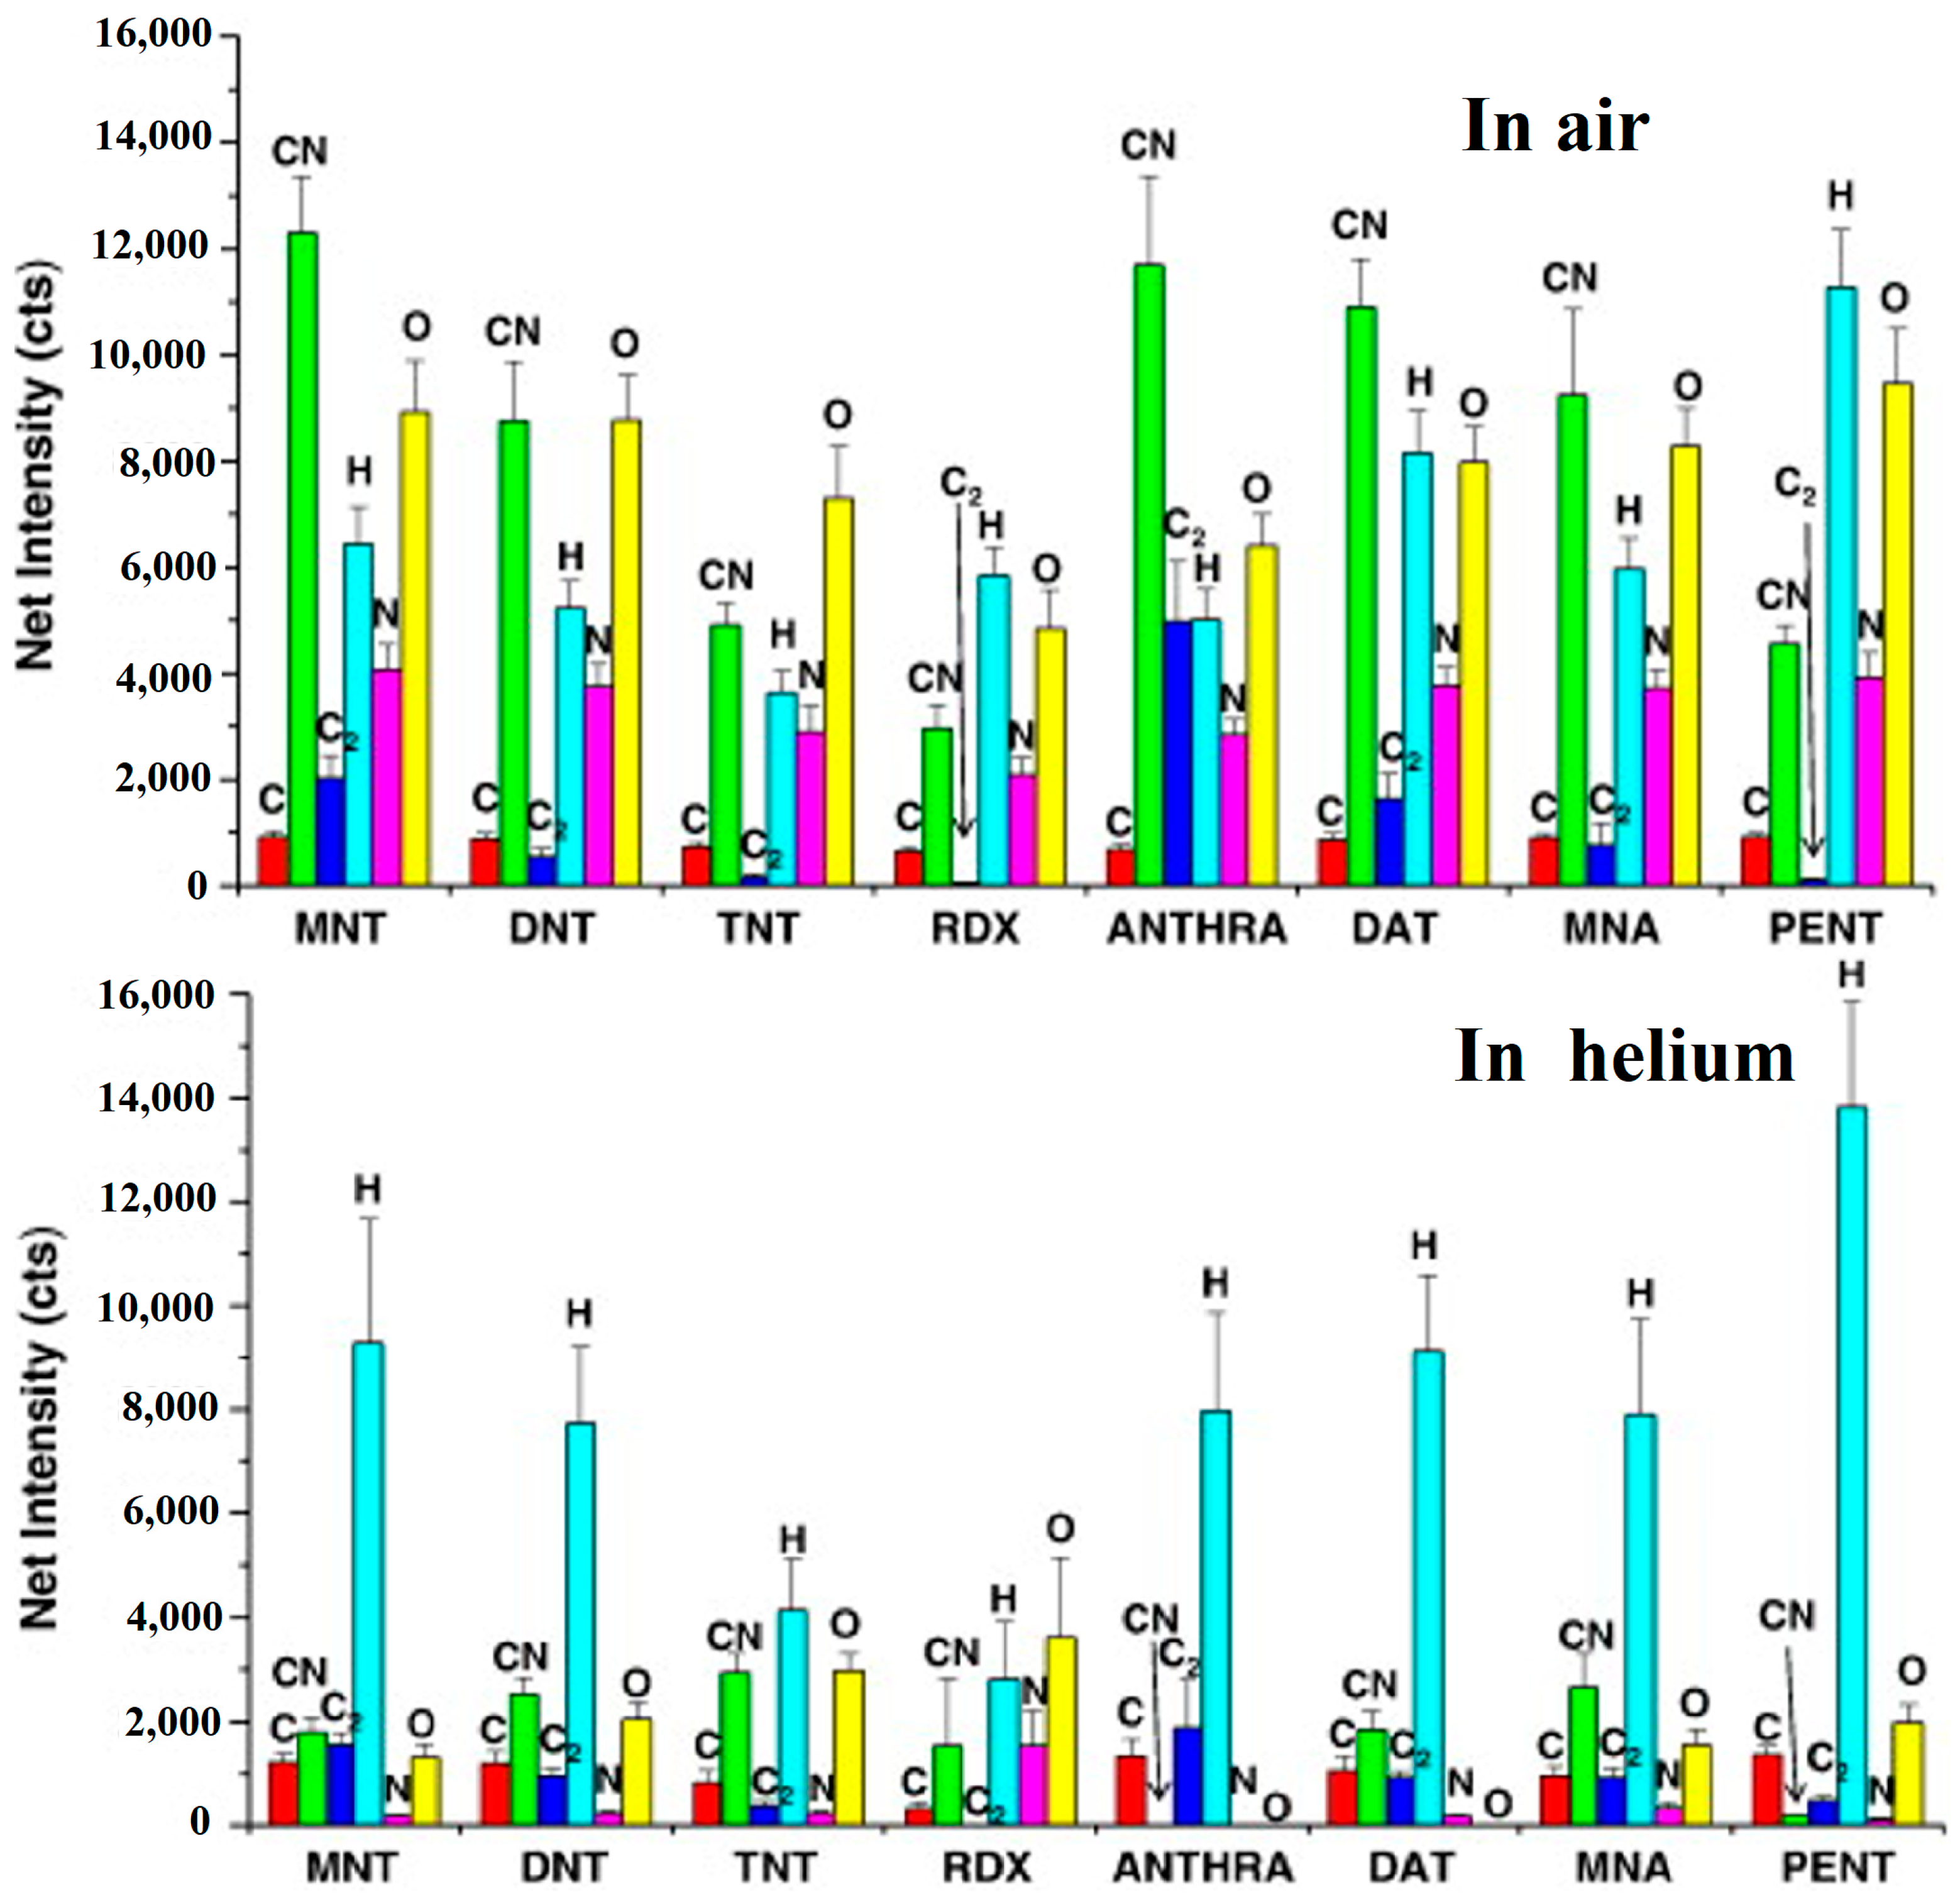
| Species | Peaks/nm | NTO | RDX | TNT | ||||||
|---|---|---|---|---|---|---|---|---|---|---|
| Air | N2 | Ar | Air | N2 | Ar | Air | N2 | Ar | ||
| C | 247.82 | * | * | *B | * | * | *B | * | * | *B |
| Ca | 393.35, 396.83, 422.67 | * | * | * | * | * | * | – | – | – |
| CN-(∆ν = +1) | 359.02 | * | * | * | * | * | *L | * | * | *L |
| CN-(∆ν = 0) | 388.28, 387.07, 386.16, 385.40, 385.01 | * | *B | * | * | *B | * | * | *B | * |
| CN-(∆ν = −1) | 421.50, 419.63, 418.03, 416.78 | * | * | * | * | * | *L | * | * | * |
| C2-(∆ν = +1) | 473.63, 471.50 | – | – | – | – | – | – | * | *L | * |
| C2-(∆ν = 0) | 516.47 | – | – | *L | – | – | *L | * | * | *B |
| Na | 588.89, 589.50 | * | * | * | * | * | * | – | – | – |
| Hα | 656.2 | * | * | *B | * | * | * | * | * | *B |
| O | 777.2, 844.55 | *B | * | * | *B | * | * | *B | * | * |
| N | 821.50, 822.35 | * | * | * | * | * | * | * | * | * |
| N | 867.80, 868.80 | * | * | * | * | * | * | * | * | * |
| Methods | Sample Type | Sensitivity | Molecular Selectivity | Acquisition Time | In Situ Monitoring |
|---|---|---|---|---|---|
| THz spectroscopy | condensed | medium | good | fast | Yes |
| LIBS | condensed | low | medium | fast | Yes |
| Raman spectroscopy | condensed | medium | good | slow | Yes |
| IMS | gas | high | medium | medium | Yes |
© 2018 by the authors. Licensee MDPI, Basel, Switzerland. This article is an open access article distributed under the terms and conditions of the Creative Commons Attribution (CC BY) license (http://creativecommons.org/licenses/by/4.0/).
Share and Cite
Zhang, W.; Tang, Y.; Shi, A.; Bao, L.; Shen, Y.; Shen, R.; Ye, Y. Recent Developments in Spectroscopic Techniques for the Detection of Explosives. Materials 2018, 11, 1364. https://doi.org/10.3390/ma11081364
Zhang W, Tang Y, Shi A, Bao L, Shen Y, Shen R, Ye Y. Recent Developments in Spectroscopic Techniques for the Detection of Explosives. Materials. 2018; 11(8):1364. https://doi.org/10.3390/ma11081364
Chicago/Turabian StyleZhang, Wei, Yue Tang, Anran Shi, Lirong Bao, Yun Shen, Ruiqi Shen, and Yinghua Ye. 2018. "Recent Developments in Spectroscopic Techniques for the Detection of Explosives" Materials 11, no. 8: 1364. https://doi.org/10.3390/ma11081364
APA StyleZhang, W., Tang, Y., Shi, A., Bao, L., Shen, Y., Shen, R., & Ye, Y. (2018). Recent Developments in Spectroscopic Techniques for the Detection of Explosives. Materials, 11(8), 1364. https://doi.org/10.3390/ma11081364