Hot Deformation Behavior of a Ti-40Al-10V Alloy with Quenching-Tempering Microstructure

 ,
, 
Abstract
:1. Introduction
2. Materials and Methods
2.1. Materials Preparation and Compression Tests
2.2. Microstructure Characterization
3. Results
3.1. Inital Microstructure
3.2. Deformation Kinetics
3.3. Microstructure Evolution
3.3.1. Strain Rate Effects
3.3.2. Temperature Effects
4. Discussion
4.1. Deformation Mechanisms
4.2. On the Hyperbolic-Sine Law
5. Conclusions
- The Q&T microstructure of the Ti-40Al-10V alloy mainly consisted of ultra-large β grains with a mean size of ~2 mm and numerous γ laths in the β matrix. Only a small number of α2 laths existed. A definite Kurdjumov-Sachs orientation relationship was identified between β and γ phase.
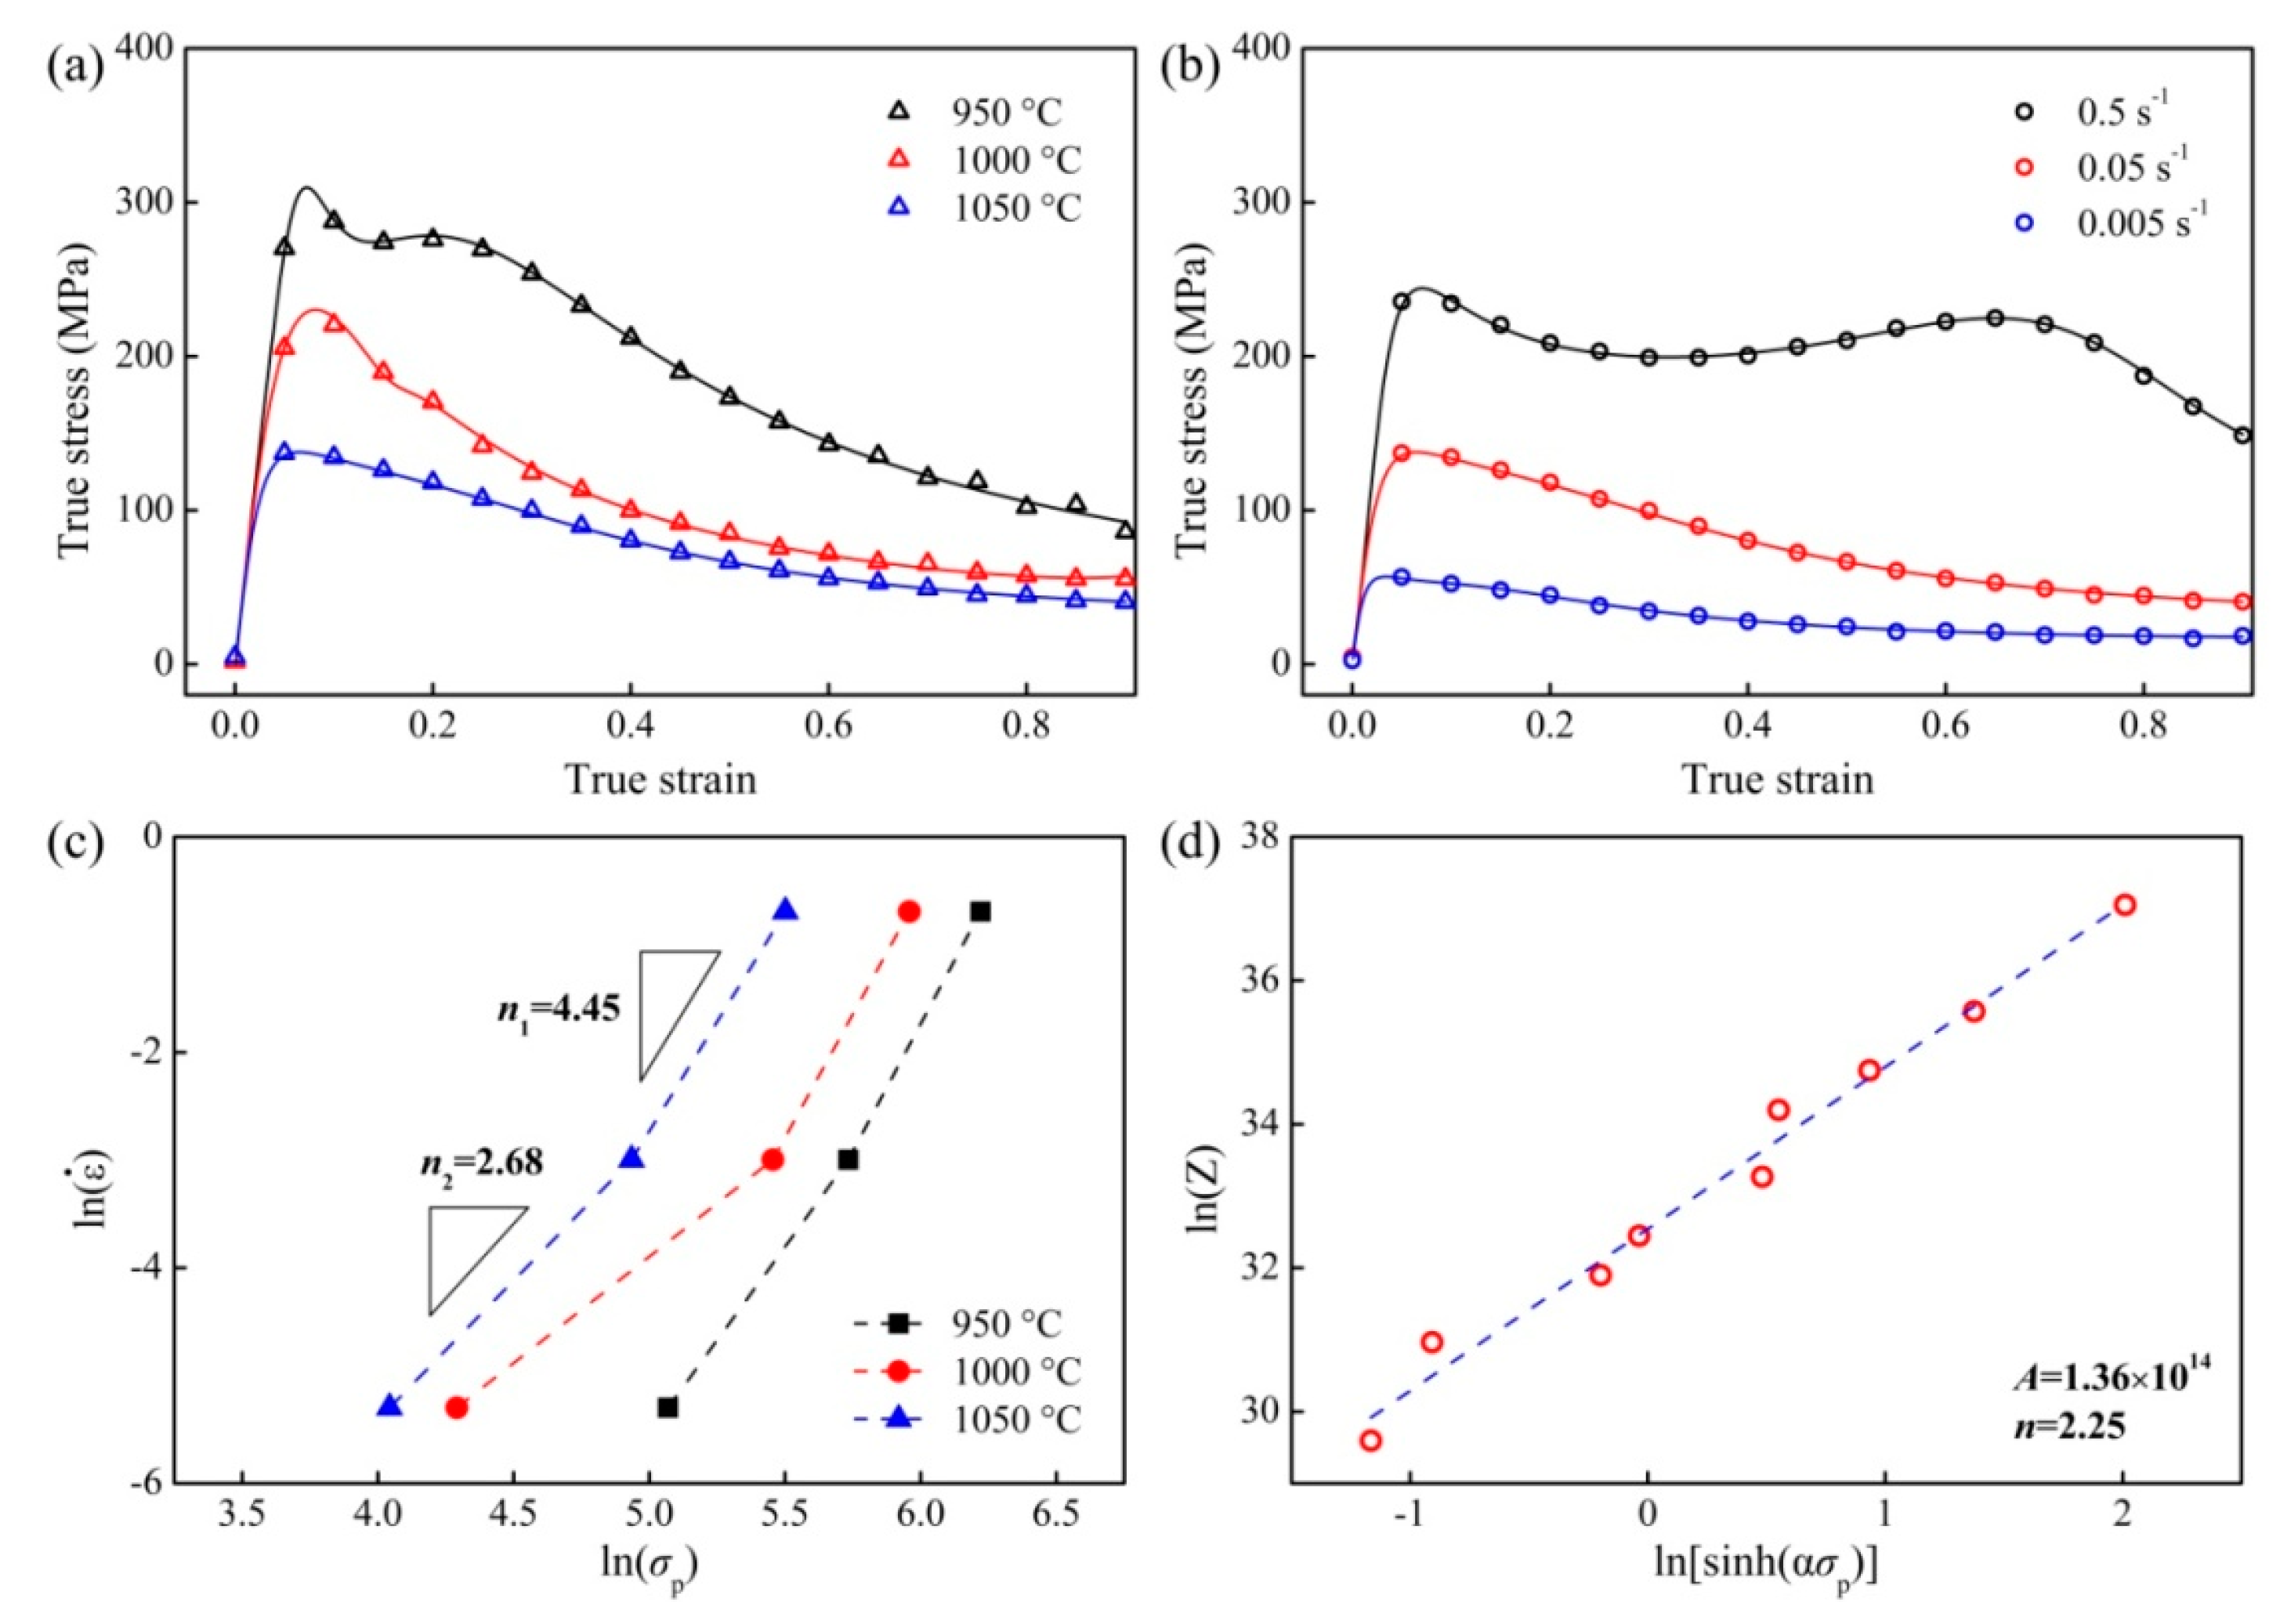
- The flow curves were characterized by a single peak at the initial stage and then continuously soften to reach a steady-state flow. However, the flow curve at 0.5 s−1 exhibited a secondary hardening stage after a transient softening stage. Based on the hyperbolic-sine law, the estimated apparent activation energy (Qapp) was 384 kJ/mol, and the stress exponent value was determined to be ~2.25. Detailed analysis revealed that the Qapp values were 325 kJ/mol and 245 kJ/mol at high and low strain rate range, respectively, with corresponding stress exponent values of 2.7 and 4.5. The hyperbolic-sine law was believed to be invalid when it was not the case of dislocation creep, especially there was a transition in rate-controlling process.
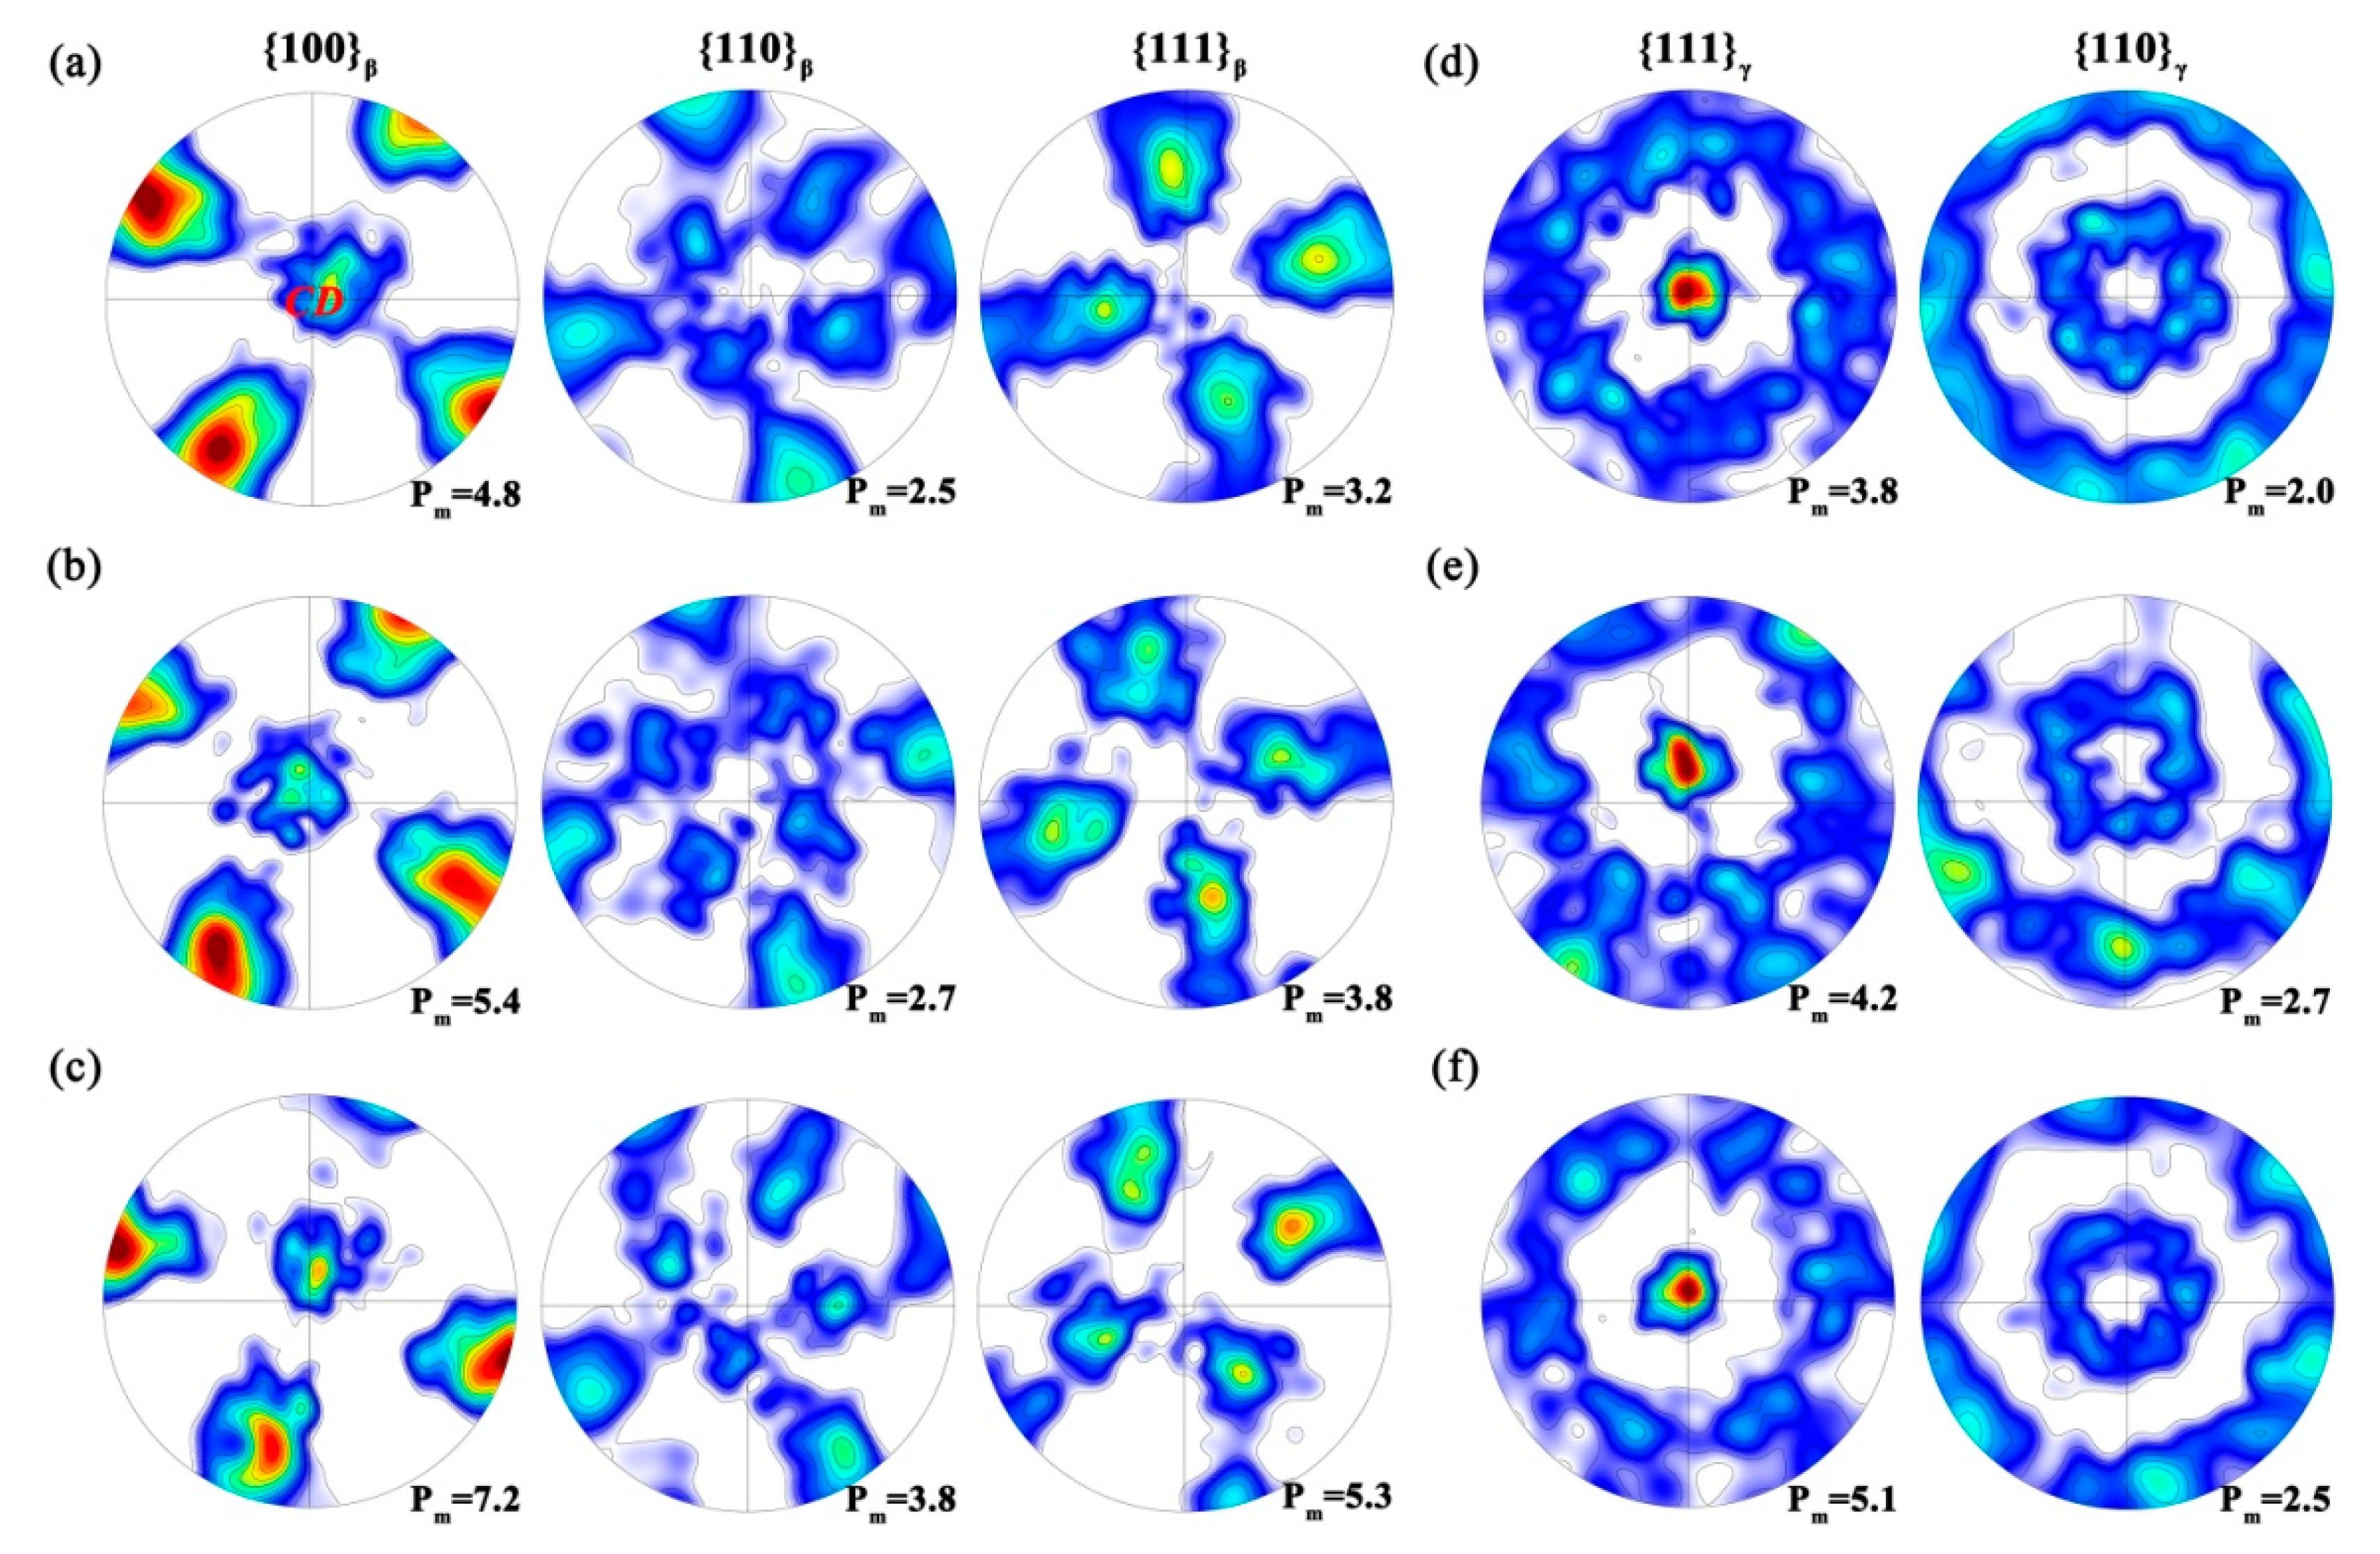
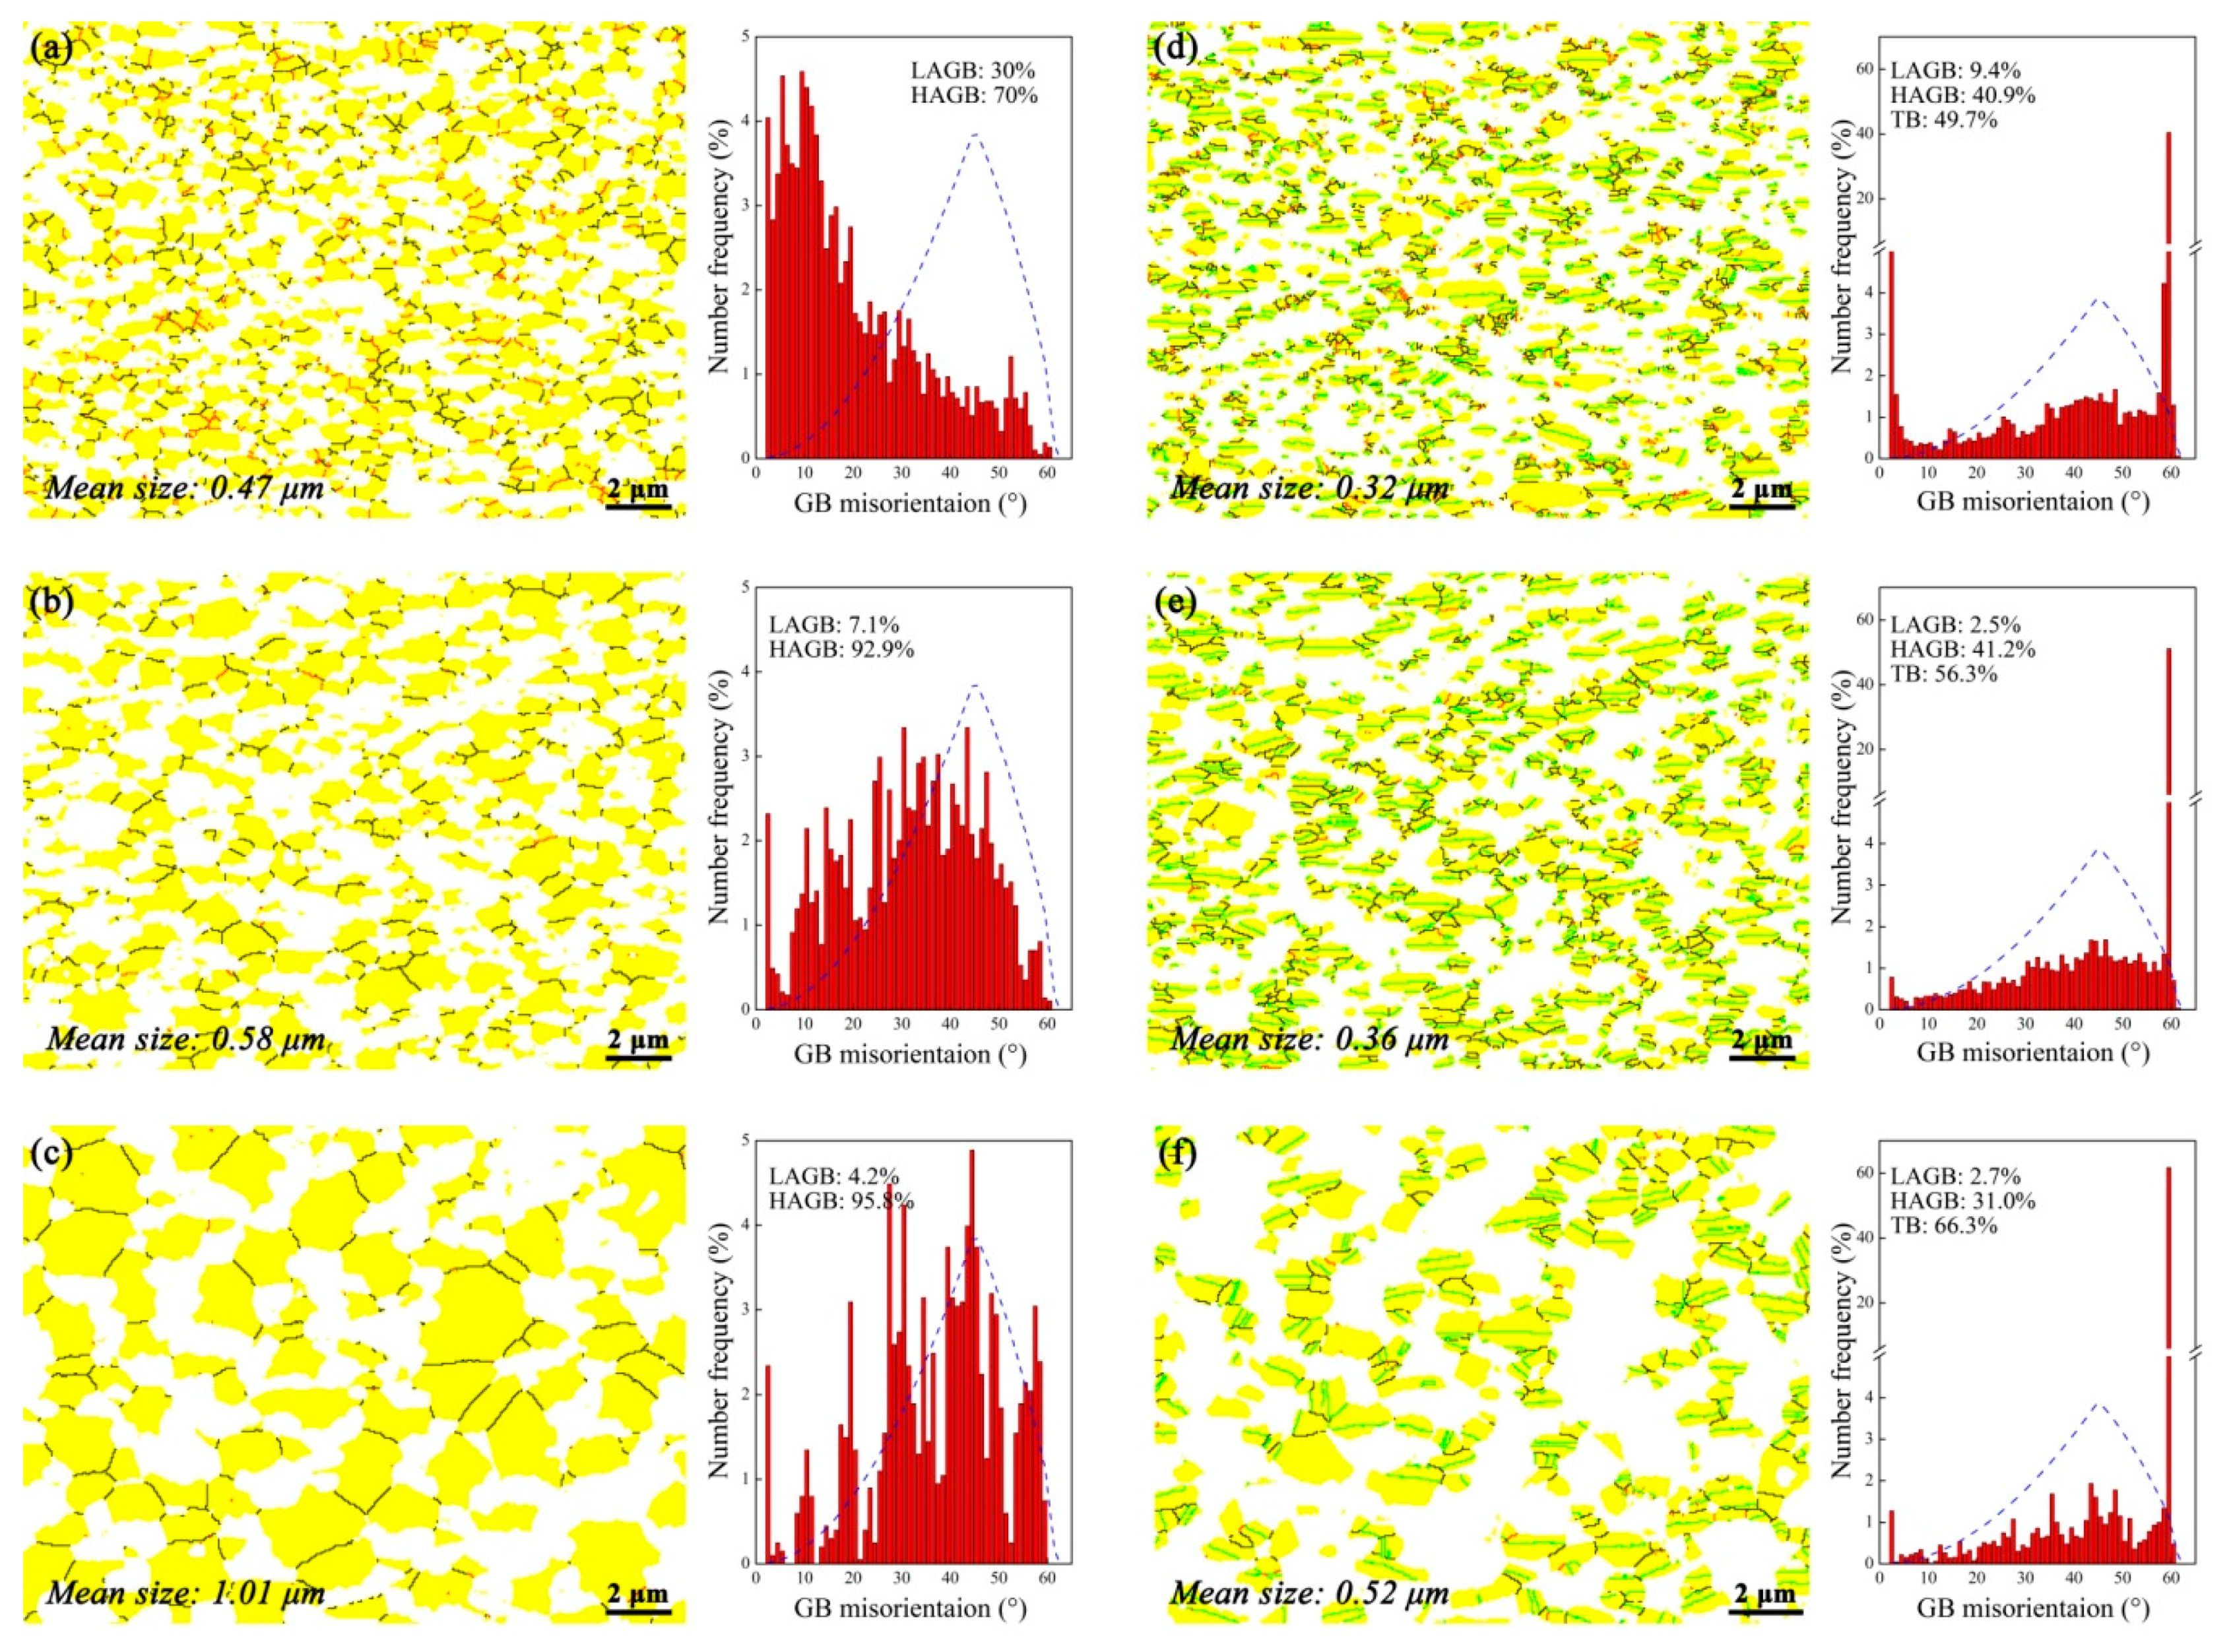
- For all the deformed samples, continuous dynamic recrystallization intensively occurred in the β matrix, accompanied by the simultaneous rotation of the γ laths. Meanwhile, a preferential orientation of <100>β and <111>γ parallel to the compression axis was observed for β and γ phase, respectively. With the decreasing strain rates, the grain boundary/interface sliding gradually became prominent which resulted in some superplastic deformation features such as intensive strain-induced grain growth and interface migration, as well as continuous weakening/vanishing of the local texture, etc. Meanwhile, the temperature had slight effects on deformation behavior. After a detailed discussion, it was believed that the deformation mechanism was the intragranular deformation (or dislocation creep) in the β matrix under high strain rates, but gradually evolved to the grain boundary/interface sliding mechanism at low strain rate regime.
Author Contributions
Funding
Conflicts of Interest
References
- Appel, F.; Paul, J.D.H.; Oehring, M. Gamma Titanium Aluminide Alloys: Science and Technology; Wiley-VCH: Weinheim, Germany, 2011. [Google Scholar]
- Kothari, K.; Radhakrishnan, R.; Wereley, N.M. Advances in gamma titanium aluminides and their manufacturing techniques. Prog. Aerosp. Sci. 2012, 55, 1–16. [Google Scholar] [CrossRef]
- Clemens, H.; Kestler, H. Processing and applications of intermetallic γ-TiAl-based alloys. Adv. Eng. Mater. 2000, 2, 551–570. [Google Scholar] [CrossRef]
- Cheng, L.; Chang, H.; Tang, B.; Kou, H.C.; Li, J.S. Deformation and dynamic recrystallization behavior of a high Nb containing TiAl alloy. J. Alloys Compd. 2013, 552, 363–369. [Google Scholar] [CrossRef]
- Tang, B.; Cheng, L.; Kou, H.C.; Li, J.S. Hot forging design and microstructure evolution of a high Nb containing TiAl alloy. Intermetallics 2015, 58, 7–14. [Google Scholar] [CrossRef]
- Cheng, L.; Li, J.S.; Xue, X.Y.; Tang, B.; Kou, H.C.; Bouzy, E. General features of high temperature deformation kinetics for γ-TiAl-based alloys with DP/NG microstructures: Part I. A survey of mechanical data and development of unified rate-equations. Mater. Sci. Eng. A 2016, 678, 389–401. [Google Scholar] [CrossRef]
- Mishin, Y.; Herzig, C. Diffusion in the Ti-Al system. Acta Mater. 2000, 48, 589–623. [Google Scholar] [CrossRef]
- Sun, F.S.; Cao, C.X.; Kim, S.; Lee, Y.T.; Yan, M.G. Alloying mechanism of beta stabilizers in a TiAl alloy. Metall. Mater. Trans. A 2001, 32, 1573–1589. [Google Scholar] [CrossRef]
- Clemens, H.; Wallgram, W.; Kremmer, S.; Güther, V.; Otto, A.; Bartels, A. Design of novel β-Solidifying TiAl alloys with adjustable β/B2-phase fraction and excellent hot-workability. Adv. Eng. Mater. 2008, 10, 707–713. [Google Scholar] [CrossRef]
- Kong, F.T.; Chen, Y.Y.; Li, B.H. Influence of yttrium on the high temperature deformability of TiAl alloys. Mater. Sci. Eng. A 2009, 499, 53–57. [Google Scholar] [CrossRef]
- Nobuki, M.; Vanderschueren, D.; Nakamura, M. High temperature mechanical properties of vanadium alloyed γ based titanium-aluminides. Acta Metall. Mater. 1994, 42, 2623–2632. [Google Scholar] [CrossRef]
- Chen, Y.; Cheng, L.; Sun, L.Y.; Lu, Y.L.; Yang, G.; Kou, H.C.; Bouzy, E. Characterization of a new microstructure in a β-Solidifying TiAl alloy after air-cooling from β phase field and subsequent tempering. Metals 2018, 8, 156. [Google Scholar] [CrossRef]
- Cheng, L.; Chen, Y.; Sun, L.Y.; Lu, Y.L.; Bouzy, E. Microstructure and mechanical properties of a V-rich TiAl alloy after quenching-tempering. Mater. Lett. 2018. Submitted. [Google Scholar]
- Zambaldi, C.; Zaefferer, S.; Wright, S.I. Characterization of order domains in γ-TiAl by orientation microscopy based on electron backscatter diffraction. J. Appl. Crystallogr. 2009, 42, 1092–1101. [Google Scholar] [CrossRef]
- Mingard, K.P.; Day, A.P.; Quested, P.N. Recent developments in two fundamental aspects of electron backscatter diffraction. IOP Conf. Ser. Mater. Sci. Eng. 2014, 55, 012011. [Google Scholar] [CrossRef]
- Fundenberger, J.J.; Beausir, B. JTEX—Software for Texture Analysis; Universite de Lorraine: Metz, France, 2015; Available online: http://jtex-software.eu/ (accessed on 23 May 2018).
- Doherty, R.D.; Hughes, D.A.; Humphreys, F.J.; Jonas, J.J.; Jensen, D.J.; Kassner, M.E.; King, W.E.; McNelley, T.R.; McQueen, H.J.; Rollett, A.D. Current issues in recrystallization: A review. Mater. Sci. Eng. A 1997, 238, 219–274. [Google Scholar] [CrossRef]
- Straumal, B.B.; Gornakova, A.S.; Prokofjev, S.I.; Afonikova, N.S.; Baretzky, B.; Nekrasov, A.N.; Kolesnikova, K.I. Continuous and discontinuous αTi layers between grains of β(Ti,Co.) phase. J. Mater. Eng. Perform. 2014, 23, 1580–1584. [Google Scholar] [CrossRef]
- Zherebtsov, S.; Salishchev, G.; Semiatin, S.L. Loss of coherency of the alpha/beta interface boundary in titanium alloys during deformation. Philos. Mag. Lett. 2010, 90, 903–914. [Google Scholar] [CrossRef]
- Zherebtsov, S.V.; Kudryavtsev, E.A.; Salishchev, G.A.; Straumal, B.B.; Semiatin, S.L. Microstructure evolution and mechanical behavior of ultrafine Ti-6Al-4V during low-temperature superplastic deformation. Acta Mater. 2016, 121, 152–163. [Google Scholar] [CrossRef]
- Straumal, B.B.; Sauvage, X.; Baretzky, B.; Mazilkin, A.A.; Valiev, R.Z. Grain boundary films in Al-Zn alloys after high pressure torsion. Scr. Mater. 2014, 70, 59–62. [Google Scholar] [CrossRef]
- Li, K.; Yang, P. The formation of strong {100} Texture by dynamic strain-induced boundary migration in hot compressed Ti-5Al-5Mo-5V-1Cr-1Fe alloy. Metals 2017, 7, 412. [Google Scholar] [CrossRef]
- Onuki, Y.; Okayasu, K.; Fukutomi, H. Formation of {001} fiber texture in Fe-3mass%Si alloy during uniaxial compression deformation at elevated temperatures. ISIJ Int. 2011, 51, 1564–1565. [Google Scholar] [CrossRef]
- Cheng, L.; Li, J.S.; Xue, X.Y.; Tang, B.; Kou, H.C.; Bouzy, E. Superplastic deformation mechanisms of high Nb containing TiAl alloy with (α2+γ) microstructure. Intermetallics 2016, 75, 62–71. [Google Scholar] [CrossRef]
- Hasegawa, M.; Yamamoto, M.; Fukutomi, H. Formation mechanism of texture during dynamic recrystallization in γ-TiAl, nickel and copper examined by microstructure observation and grain boundary analysis based on local orientation measurements. Acta Mater. 2003, 51, 3939–3950. [Google Scholar] [CrossRef]
- Bartels, A.; Schillinger, W. Micromechanical mechanism of texture formation in γ-TiAl. Intermetallics 2001, 9, 883–889. [Google Scholar] [CrossRef]
- Stark, A.; Bartels, A.; Clemens, H.; Kremmer, S.; Schimansky, F.P.; Gerling, R. Microstructure and texture formation during near conventional forging of an intermetallic Ti-45Al-5Nb alloy. Adv. Eng. Mater. 2009, 11, 976–981. [Google Scholar]
- Zhang, W.J.; Lorenz, U.; Appel, F. Recovery, Recrystallizaiton and phase transformation during thermomechanical processing and treatment of TiAl-based alloys. Acta Mater. 2000, 48, 2803–2813. [Google Scholar] [CrossRef]
- Zghal, S.; Naka, S.; Couret, A. A quantitative TEM analysis of the lamellar microstructure in TiAl based alloys. Acta Mater. 1997, 45, 3005–3015. [Google Scholar] [CrossRef]
- Sherby, O.D.; Wadsworth, J. Superplasticity—Recent advances and future directions. Prog. Mater. Sci. 1989, 33, 169–221. [Google Scholar] [CrossRef]
- Imayev, R.M.; Salishchev, G.A.; Senkov, O.N.; Imayev, V.M.; Shagiev, M.R.; Gabdullin, N.K.; Kuznetsov, A.V.; Froes, F.H. Low-temperature superplasticity of titanium aluminides. Mater. Sci. Eng. A 2001, 300, 263–277. [Google Scholar] [CrossRef]
- Nieh, T.G.; Hsiung, L.M.; Wadsworth, J. Superplastic behavior of a powder metallurgy TiAl alloy with a metastable microstructure. Intermetallics 1999, 7, 163–170. [Google Scholar] [CrossRef]
- Nabarro, F.R.N.; Villiers, H.L. The Physics of Creep; Taylor and Francis: Oxford, UK, 1995. [Google Scholar]
- Kassner, M.E.; Perez-Prado, M.T. Five-power-law creep in single phase metals and alloys. Prog. Mater. Sci. 2000, 45, 1–102. [Google Scholar] [CrossRef]
- Tobolová, Z.; Čadek, J. An interpretation of steady state creep. Philos. Mag. 1972, 26, 1419–1428. [Google Scholar] [CrossRef]


© 2018 by the authors. Licensee MDPI, Basel, Switzerland. This article is an open access article distributed under the terms and conditions of the Creative Commons Attribution (CC BY) license (http://creativecommons.org/licenses/by/4.0/).
Share and Cite
Cheng, L.; Chen, Y.; Yang, G.; Xie, L.; Wang, J.; Lu, Y.; Kou, H. Hot Deformation Behavior of a Ti-40Al-10V Alloy with Quenching-Tempering Microstructure. Materials 2018, 11, 872. https://doi.org/10.3390/ma11060872
Cheng L, Chen Y, Yang G, Xie L, Wang J, Lu Y, Kou H. Hot Deformation Behavior of a Ti-40Al-10V Alloy with Quenching-Tempering Microstructure. Materials. 2018; 11(6):872. https://doi.org/10.3390/ma11060872
Chicago/Turabian StyleCheng, Liang, Yi Chen, Guang Yang, Li Xie, Jiangtao Wang, Yalin Lu, and Hongchao Kou. 2018. "Hot Deformation Behavior of a Ti-40Al-10V Alloy with Quenching-Tempering Microstructure" Materials 11, no. 6: 872. https://doi.org/10.3390/ma11060872
APA StyleCheng, L., Chen, Y., Yang, G., Xie, L., Wang, J., Lu, Y., & Kou, H. (2018). Hot Deformation Behavior of a Ti-40Al-10V Alloy with Quenching-Tempering Microstructure. Materials, 11(6), 872. https://doi.org/10.3390/ma11060872