1. Introduction
Global and national policies, including the Paris agreement [
1] and the UK’s Climate Change Act [
2], demand that all industries and sectors must decarbonise their emissions of greenhouse gases in order to mitigate the worst effects of climate change. The production of H
2 is included in these decarbonisation targets, however, most commercially available H
2 is produced via the steam methane reforming (SMR) process which emits more than seven times as much CO
2 as H
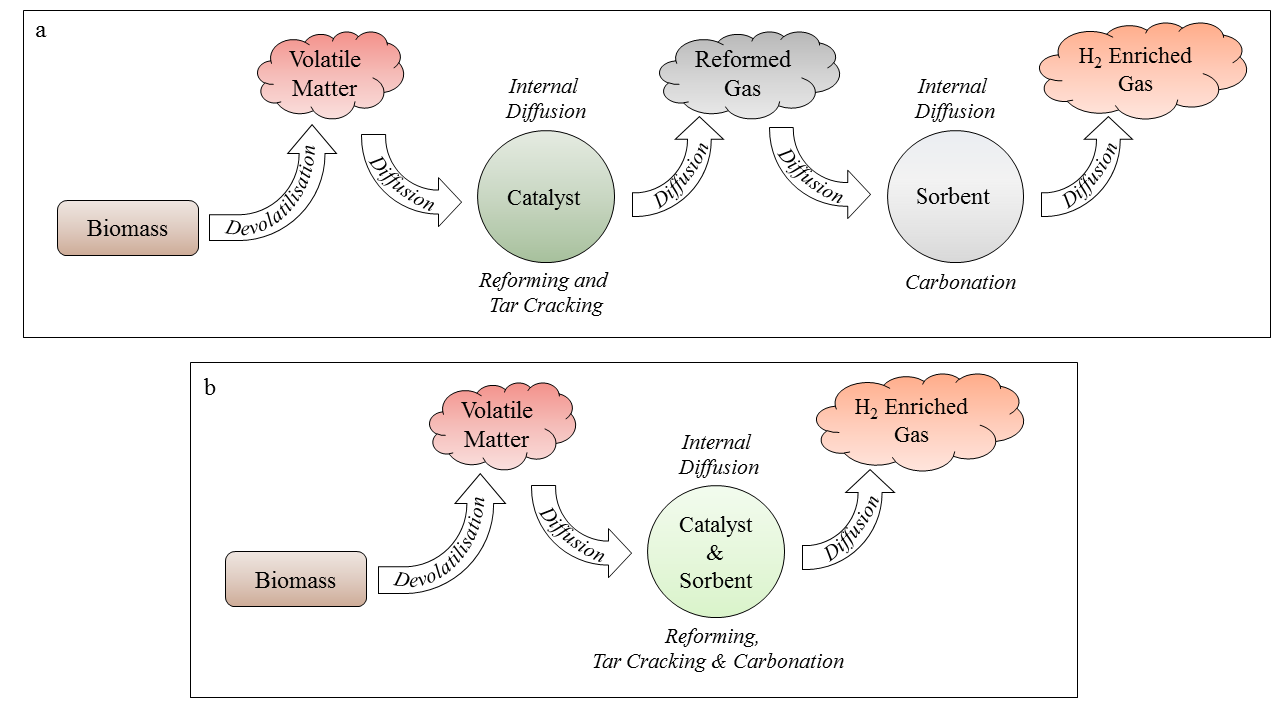
2 produced [
3]. The integration of carbon capture, utilisation and storage (CCUS) technology is therefore needed to decarbonise hydrogen production [
4].
H
2 is an important chemical feedstock most notably used in the production of ammonia and in the oil refining industry. It is also a versatile, zero-carbon energy vector that has applications as a fuel for both centralised and distributed electricity generation, domestic and industrial heating and transportation [
5]; H
2 could also provide a zero-carbon substitute in existing natural gas networks for domestic and industrial demands [
6,
7].
Sorption Enhanced Steam Reforming (SESR) is a pre-combustion CO
2 capture process in which hydrocarbon fuel is reacted with steam in the presence of a CO
2 sorbent and reforming catalyst to produce decarbonised, high purity H
2 (Equation (1)) and concentrated CO
2 suitable for transport and geological storage (or reuse). Assuming a stoichiometric ratio of each reactant, the SESR process overall is mildly exothermic due to the exothermic water-gas shift and carbonation reactions balancing the endothermic steam methane reforming. SESR utilises two reactors: a joint carbonator/gasifier/reformer where CO
2 is absorbed and H
2 generated; and a calciner where the sorbent is regenerated, releasing CO
2; the nickel catalyst may also become partially oxidised [
8]. The presence of a CO
2-sorbent in the reforming stage shifts the equilibrium position of the reactions, in favour of H
2 production, as described by Le Chatelier’s principle [
9].
Equation (1). Simplified, overall SESR reaction:
CaO is the most commonly studied CO
2 sorbent for SESR applications due to: (i) sufficiently fast sorption kinetics at a temperature range (500–700 °C) compatible with gasification, reforming and water-gas-shift reactions; (ii) its high CO
2 carrying capacity; (iii) wide availability and (iv) low cost. Other sorbents investigated for SESR applications include hydrotalcites, dolomites and MgO-based sorbents [
10,
11,
12,
13,
14,
15].
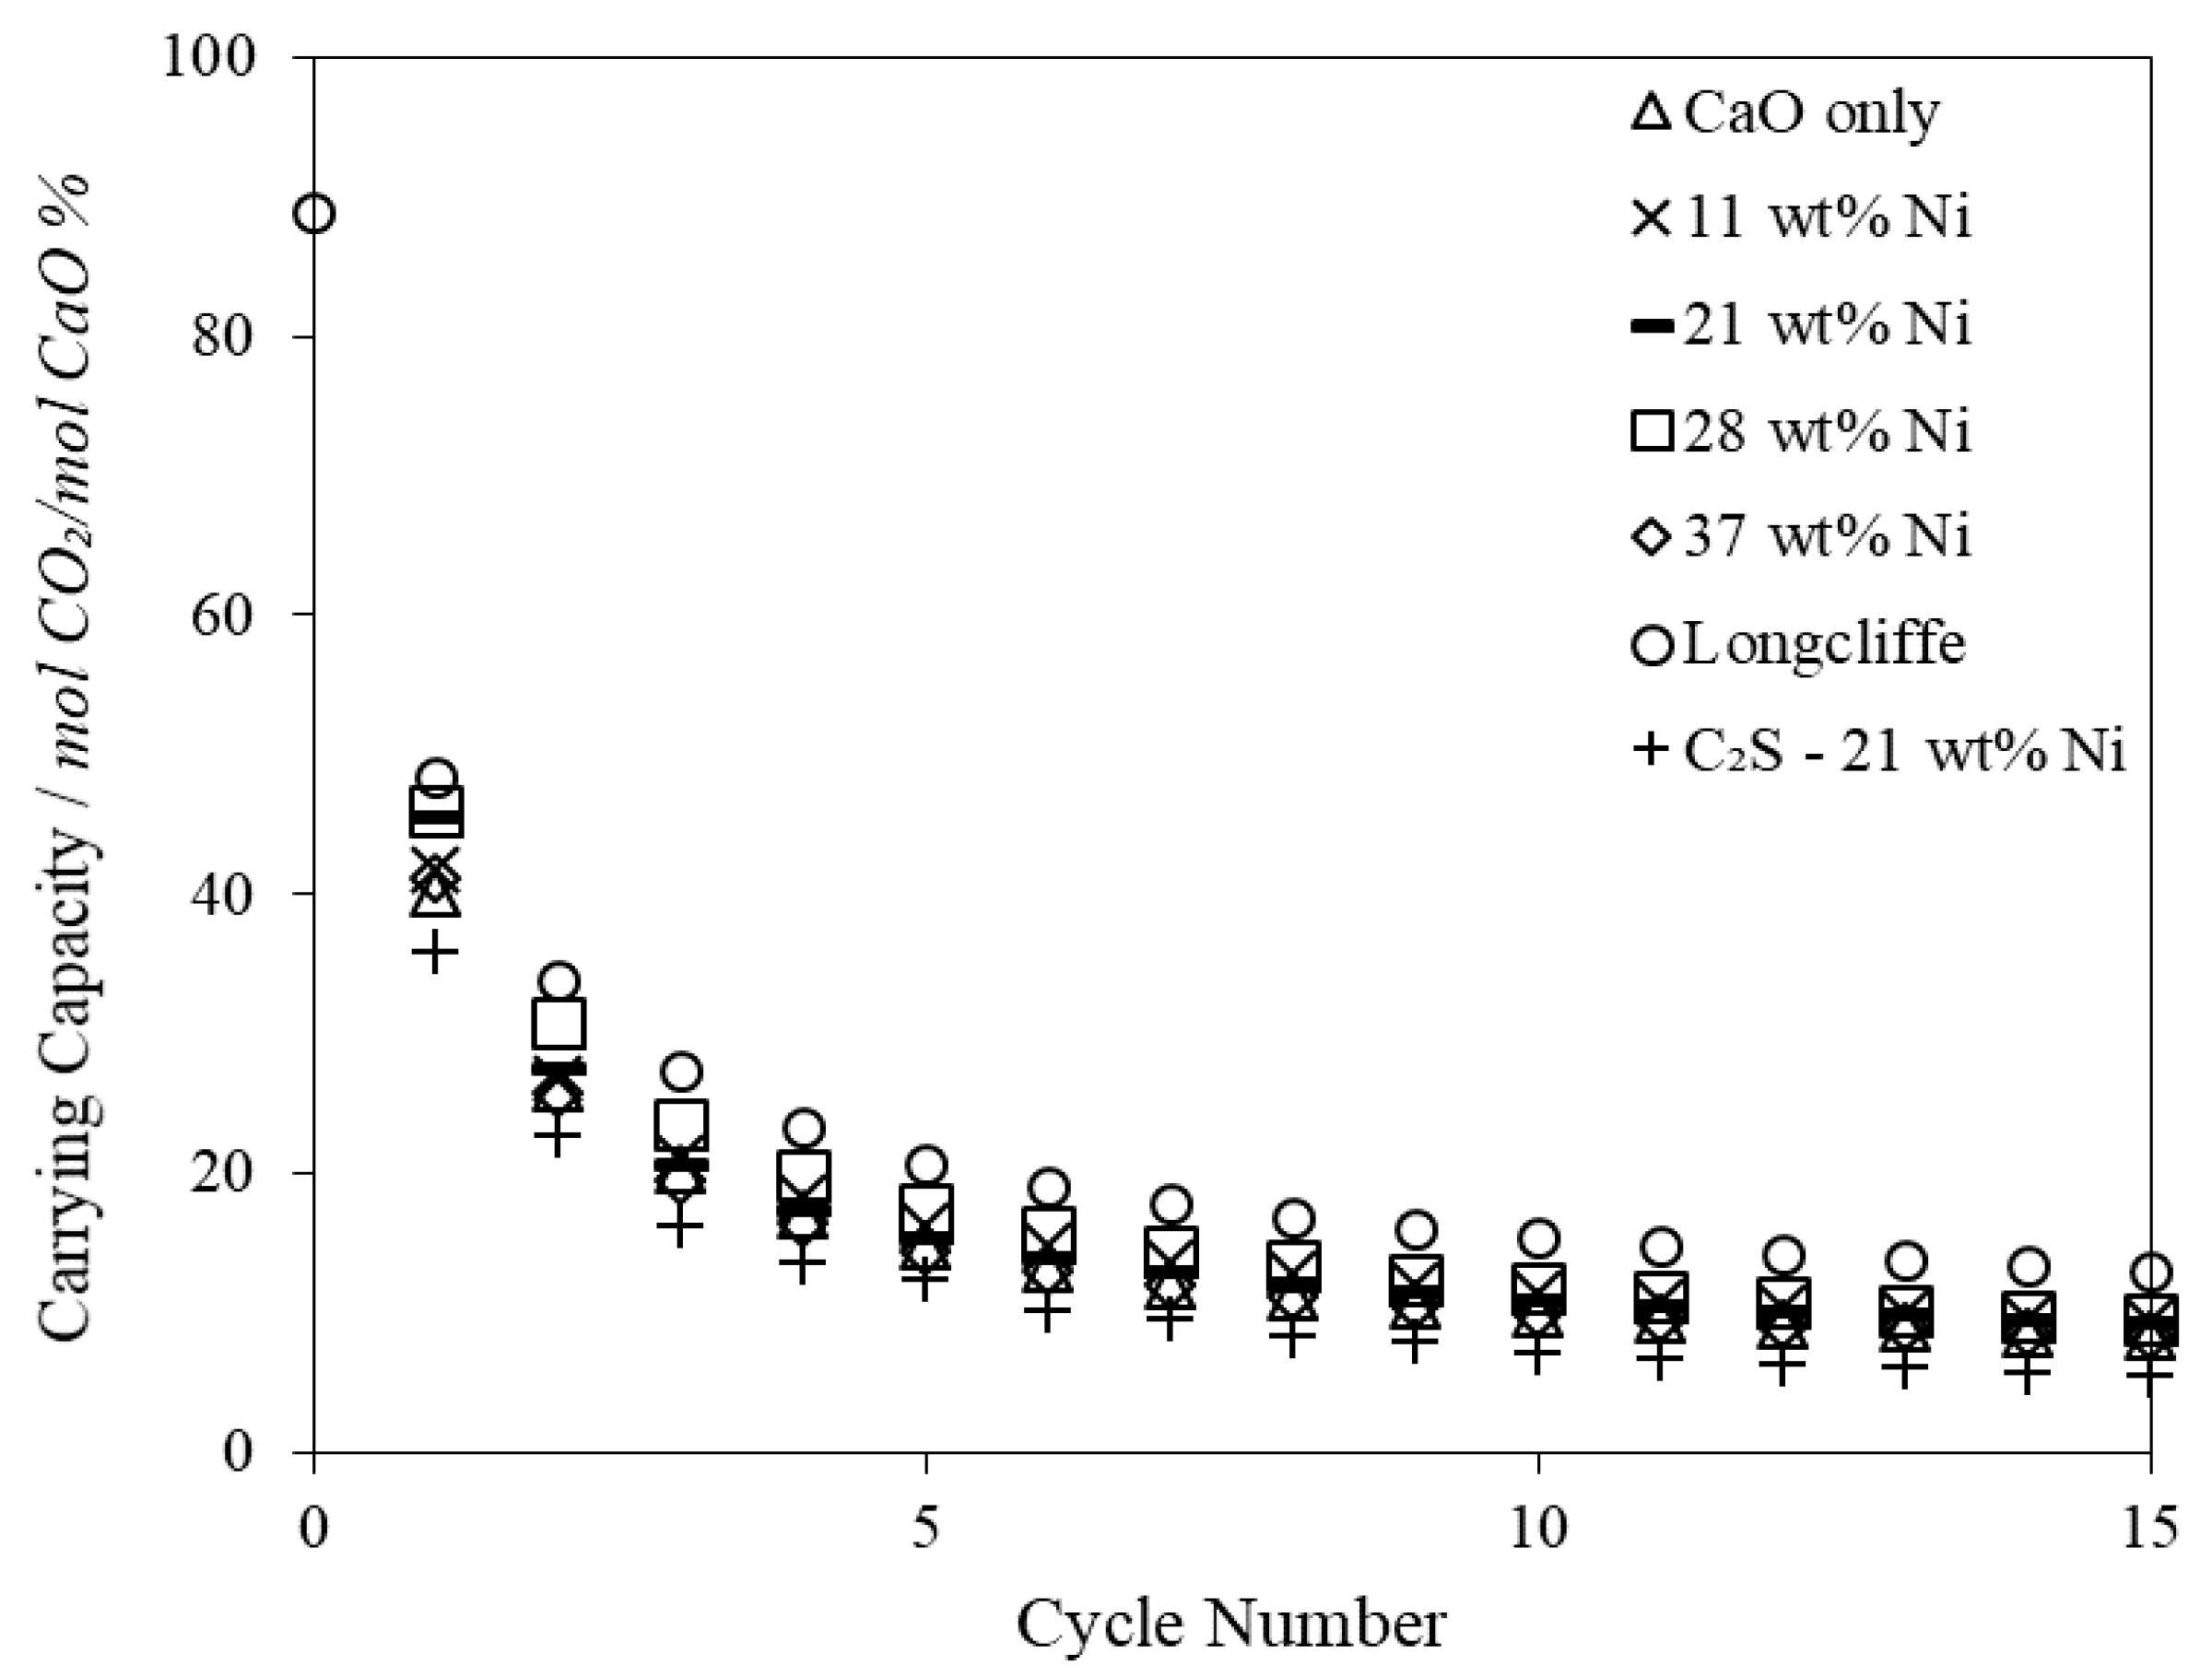
The main drawback with Ca-based sorbents is their widely documented decay in CO
2 carrying capacity over multiple carbonation/calcination cycles caused by thermal and reactive sintering, attrition and sulphation [
16,
17]. A substantial research effort has been directed at developing and testing strategies for overcoming the degradation in the cyclic CO
2 carrying capacity of CaO with varying degrees of success [
18,
19].
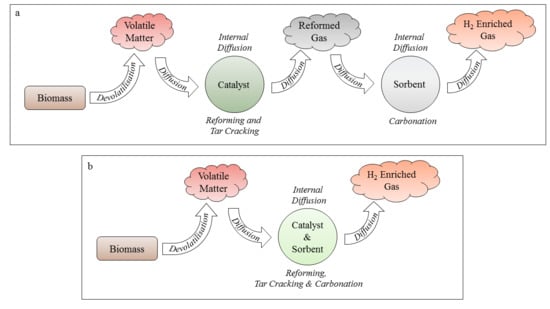
The reforming/carbonation stage of the SESR process is limited by mass transfer, in particular diffusion of the intermediary and final products between the catalytic and sorption sites [
20]. The amalgamation of catalyst and sorbent materials into a single, multifunctional particle is therefore of great interest within the research community [
21,
22,
23,
24,
25]. The single, combined particle system greatly minimises the effective diffusion distance and prevents dilution of intermediates by the bulk gas, thereby promoting improved mass transfer rates and conversion efficiencies. A schematic showing the effective diffusion pathways for separated- and single-particle systems when biomass is utilised as the feedstock is shown in
Figure 1. The best performing combined particle systems reported in the literature are formed of homogeneously mixed catalytic and sorption material [
26,
27,
28].
A wide range of methods for producing combined, multifunctional particles have been reported, from highly-engineered sol-gel [
29] and co-precipitation techniques [
30,
31], to low-engineered techniques such as wet-impregnation [
32,
33] and wet/physical mixing [
30,
33,
34,
35,
36]. The highly-engineered methods often require costly chemical precursor reagents and have multiple time-consuming manufacturing steps. On the other hand, low-engineered methods are generally simpler, cheaper and quicker to produce. There is the argument that highly-engineered methods can result in better performing materials. However, the feasibility and cost of scaling up production of these materials and the implications this has on the OPEX of large-scale plants is rarely considered. A further argument is that direct contact between the sorbent/catalyst particles and the fuel (as proposed here) will cause enhanced material degradation due to interactions between ash, sulphur containing gases, coking, and tar deposition. A higher sorbent/catalyst replenishment rate will therefore be needed, thus incentivising the use of a lower cost sorbent/catalyst material.
The use of biomass as the fuel input for SESR is an area of research that is gaining substantial traction since it is a form of negative emissions technology [
32,
37,
38,
39]. The use of H
2 produced by biomass-SESR would therefore result in a net-removal of CO
2 from the atmosphere. However, difficulties with biomass handling (feeding, conveying, handling and tar production) has meant that the majority of research has been limited to the study of separate gasification and reforming reactors, fixed beds, or thermogravimetric analysers (TGA) with model biomass compounds—all of which are far from representative of an industrial scale operation [
13,
40,
41,
42,
43,
44,
45,
46,
47,
48,
49,
50].
Limited experimental experience is available involving the use of multifunctional sorbent and catalyst combined particles with a biomass SESR process. As such, a spout-fluidised bed reactor was designed and constructed to allow the study of an SESR process with continuous solid fuel feeding. This research aimed to explore the use of combined sorbent and catalyst particles prepared via a simple low-engineered wet mixing process within a biomass SESR process and highlight any operational limitations.
3. Reactor Description
3.1. Reactor and Equipment Design
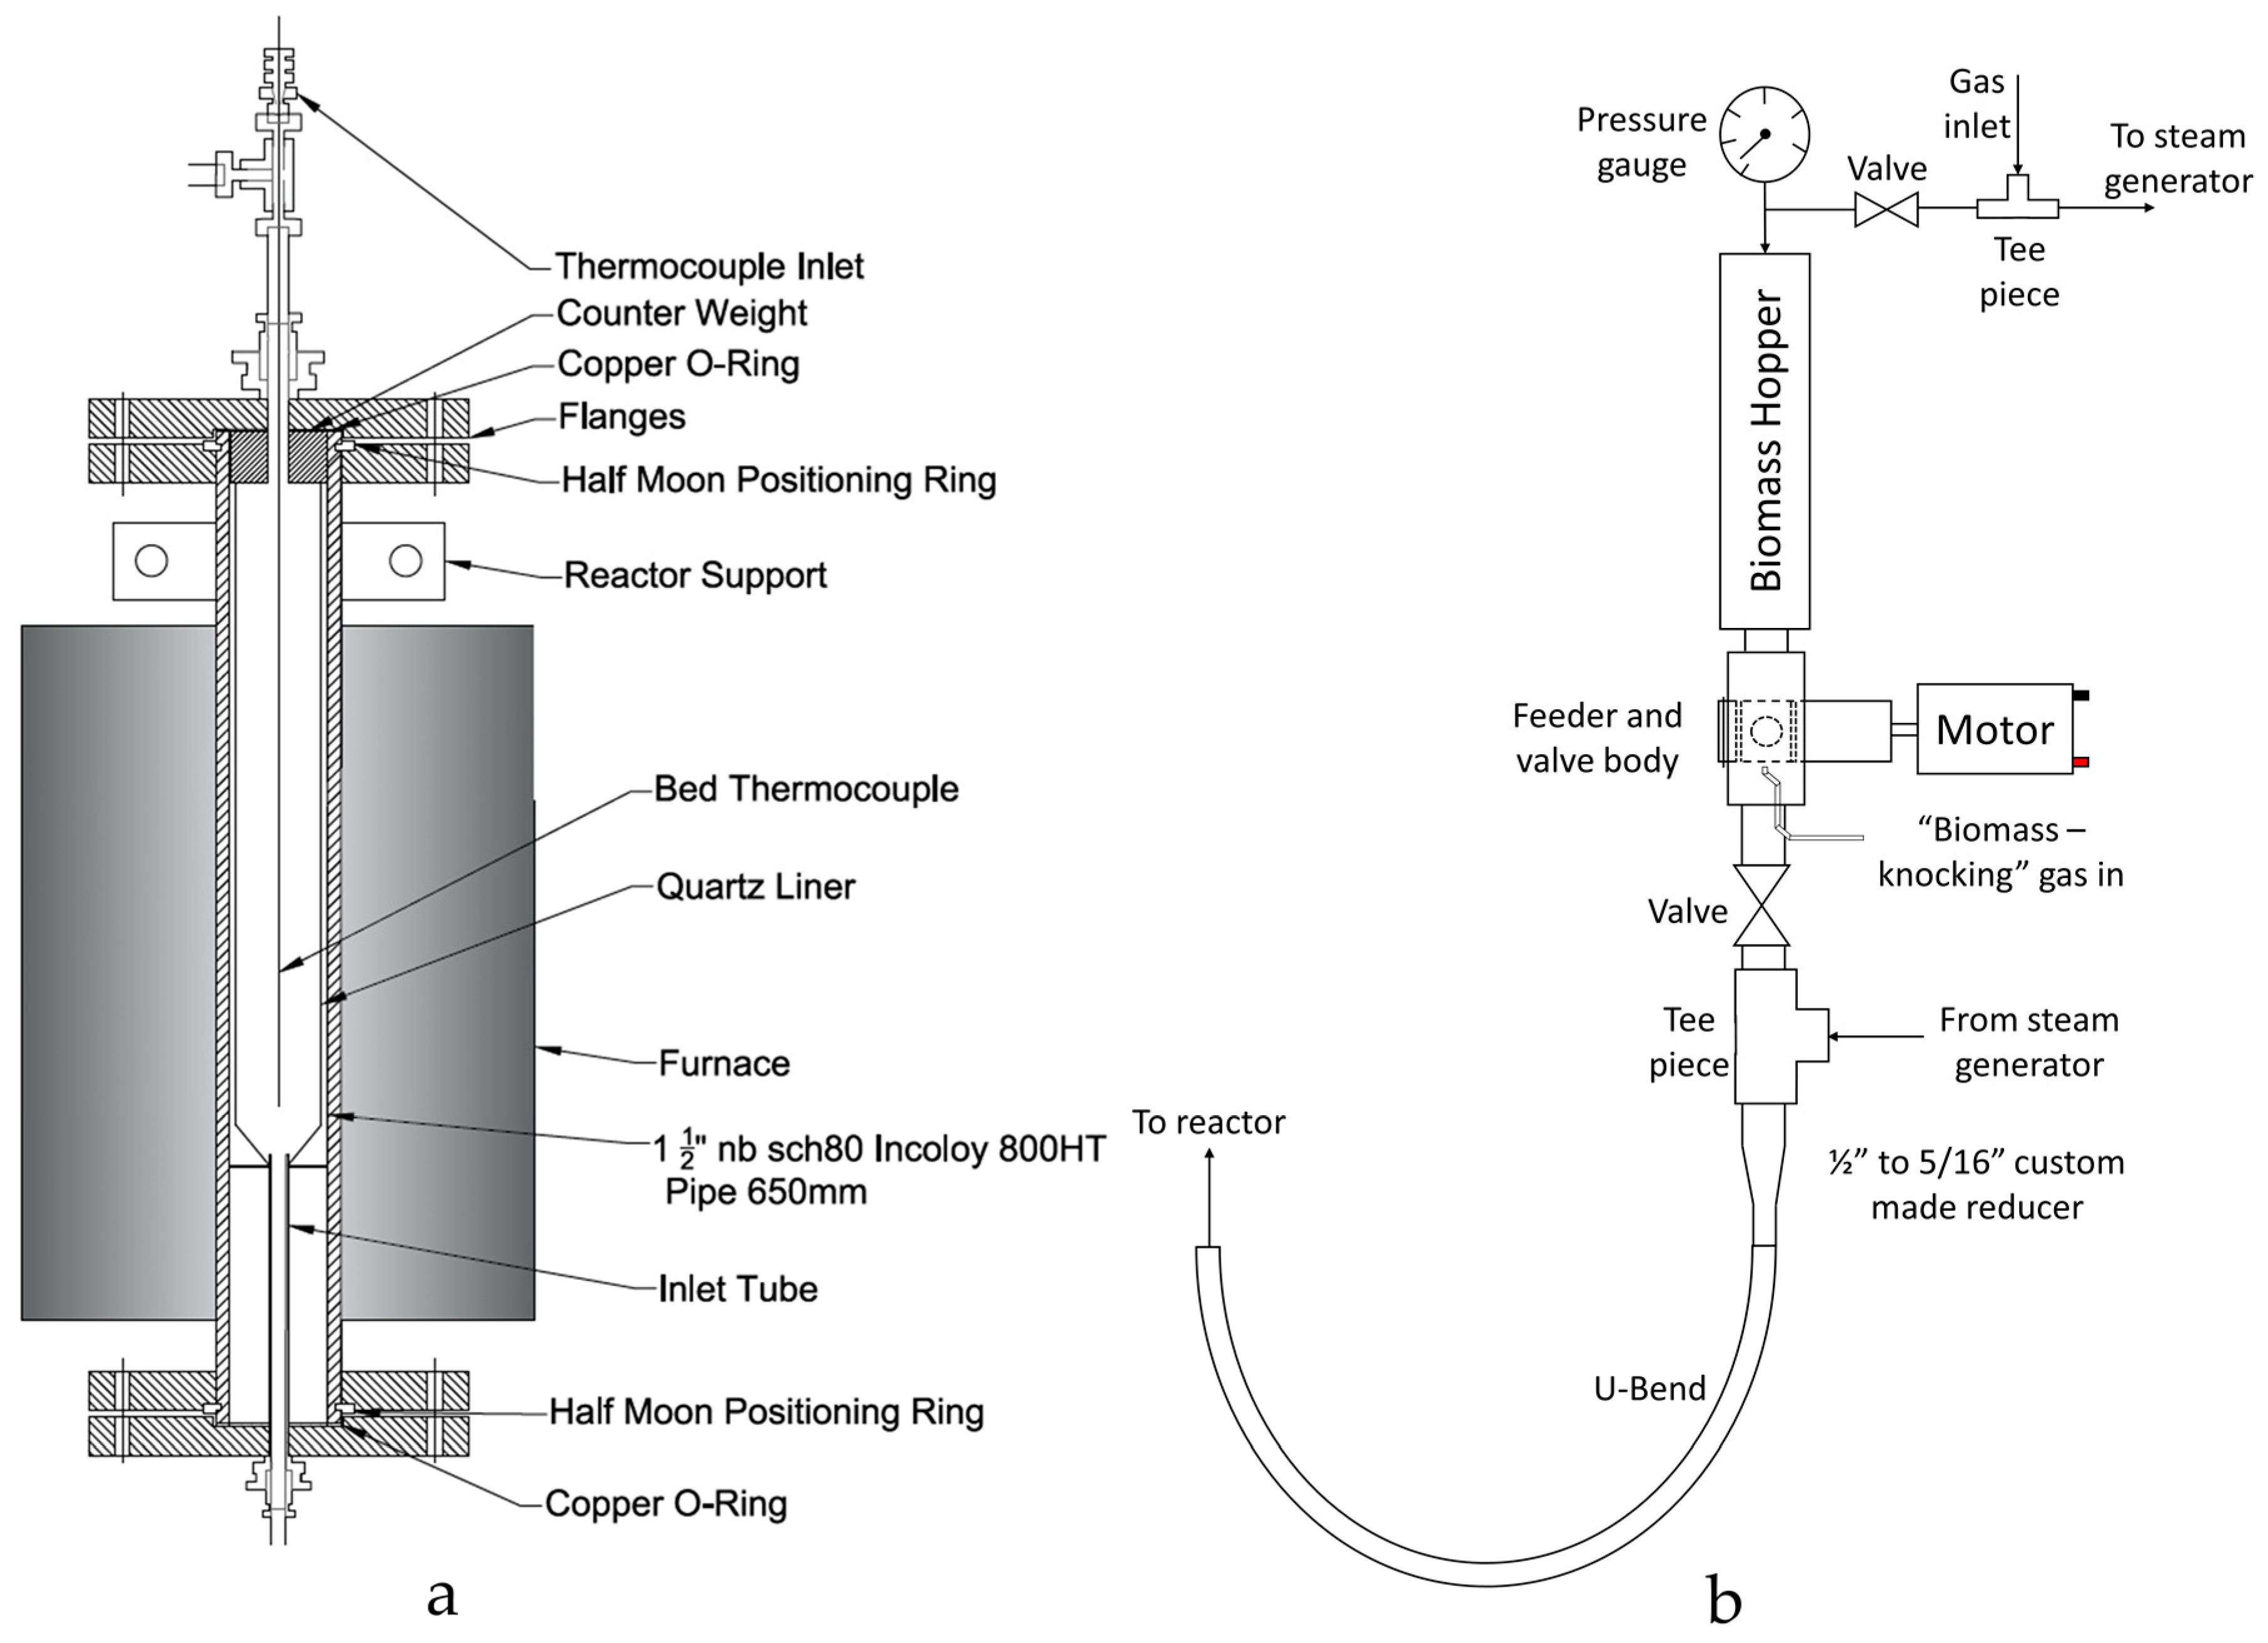
A new reactor was designed and constructed for this study. Schematic Computer Aided Design (CAD) drawings of the reactor body and continuously operated solids feeding system are displayed in
Figure 2. The reactor was based on a spout-fluidised bed design, similar that reported by Zhang et al. [
61] This configuration was chosen due to its effective heat transfer and gas-solid mixing. The absence of a gas distributor also allowed for the continuous transfer of solids into the bed entrained by the inlet gas flow.
3.2. Feeding System
The feeding system comprised of a rotating valve arrangement that transported biomass from a hopper into a gas stream which conveyed the biomass into the reactor (
Figure 2b). The custom-made plastic (Delrin, Polyoxymethylene supplied by DuPont, Stevenage, Hertfordshire, UK) rotary cup feeder—consisting of four 5 mm holes, each 4 mm deep—was housed inside a Swagelok ½″ plug valve and rotated by a small 6 V DC motor. When biomass feeding was required, the valves above and below the feeding system were opened, and the motor and “biomass-knocking” gas flow were started. The biomass-knocking gas flow refers to a small flow of N
2 (5 cm
3/s controlled by a Brooks 5850EM mass flow controller, Veenendaal, The Netherlands) which entered the system beneath the outlet of the feeder and ‘knocked’ the biomass out of the cups. The small flow of gas also helped prevent steam from condensing on the surfaces of the feeding system below the feeding valve which could not be heated due thermal constraints of the valve construct.
The biomass was fed into a ½″ to 5/16″ custom-made adapter- a critical component of the feeding system. The adaptor was designed to provide a smooth, gradual and “ridge-free” transition from the ½″ feeder valve to the 5/16″ tube of the reactor inlet minimising the chance of blockage formation. The biomass and biomass-knocking gas was blended with the rest of the inlet gas flow at the exit of the custom-made adaptor. At this stage, the gas flowrate was above the biomass’ terminal velocity and so the biomass was pneumatically conveyed into the reactor via the U-bend.
3.3. Steam Generation System
Steam was produced using a custom-made bubbler and evaporator/distributor column. The system consisted of a 300 mm long 1″ tube, half filled with DI water, wrapped in heating tape to produce a bubbler. N2 carrier gas entered from the bottom of the bubbler via a 1/8″ tube with several holes drilled into its length. The gas bubbled through the heated water and in doing so collected water vapour which then passed into a 3 m long distribution coil made of ¼″ tubing and then into a second heated column (1″ tube, 300 mm in length) filled with stainless steel balls (4 mm diameter) to disrupt flow patterns and ensure complete mixing. The entire steam generation system and all downstream gas lines were trace heated. The gas line temperatures were controlled by external type K thermocouples (TC direct), apart from the bubbler which had an internal thermocouple. A water inventory of 75 mL (≈50% of capacity) was maintained within the bubbler using a HPLC pump. The relative standard deviation in steam concentration when utilising this steam generator was ±10% of the set point.
The steam concentration was controlled via the bubbler temperature and carrier gas flow rate set points. The steam concentration at the inlet and outlet of the reactor were monitored via two humidity probes (HMT334, 0–100%, Vaisala, Bury St Edmunds, Suffolk, UK). The steam exiting the reactor was collected in an ice-cooled water and tar trap. A packed bed of CaCl2 downstream of the water and tar trap removed residual water vapour from the gas stream prior to the gas analysers.
3.4. Reactor Body
The main reactor body was a 650 mm length of Incoloy 800-HT pipe, with an outer diameter of 48.3 mm and a wall thickness of 5.1 mm (nominal pipe size 1½″, schedule 80, Philip Cornes & Co. Ltd., Birmingham, West Midlands, UK). Both ends of the tube were sealed with flanges, half-moon positioning rings and copper O-rings. The bottom flange had a bored through 5/16″ fitting for connecting the support plate/inlet tube (
Figure 2) which fits inside the reactor. The reactor main body housed an internal quartz reactor liner (Soham Scientific, Ely, Cambridgeshire, UK) to contain the fluidised bed. The internal quartz reactor consisted of a 33 mm I.D. (1.5 mm wall thickness) quartz tube that tapered in at the base (16 mm I.D.). The hole at the base was designed to sit over the spout jet which provides the inlet for both the gas and biomass. The quartz reactor was sealed against the base plate supporting ring (from which the spout protrudes) using a high temperature Kaowool sealing material. A counterweight positioned on top of the reactor provided the force needed for sealing.
The reactor was externally heated by a 1.5 kW vertical split tube furnace (Lenton Furnaces, Hope, Hope Valley, UK, CSC 12/90/300 V) which was controlled to the set-point temperature using a type N thermocouple attached to the outer wall of the reactor. Type K thermocouples were also positioned in the bed (via a Spectite fitting with Viton sealant) and on the outer wall of the reactor, with temperatures logged. Superwool insulating blanket (RS Components Ltd., Corby, Northamptonshire, UK) was used to insulate the reactor not covered by the furnace and all trace heated lines.
3.5. Downstream Gas Analysis
The concentrations of CO2, CO and CH4 in the gas stream exiting the reactor were measured using online non-dispersive infrared analysers (ADC MGA 3000, 0–50 vol % ±1% of the measured value, Hoddesdon, Hertfordshire, UK). O2 was measured using a chemical oxygen sensor cell (housed in the same unit). The concentration of H2 was measured via a calibrated thermal conductivity detector (ABB EL3020-Caldos27, 0–30 vol % ±1% of span, St. Neots, Cambridgeshire, UK). Post gas analysis the gases were sent to a flare to combust flammable or harmful gases before venting through local ventilation extraction.
3.6. Gas Supply
Gas was supplied from cylinders of (i) N
2 (99.998 vol %, oxygen-free, BOC, Guildford, UK); (ii) CO
2 (99.9 vol %), (iii) 10 mol. % H
2 (balance N
2, BOC) and (iv) air (99.9 vol %, BOC). A single point calibration was performed before each of the SESR experiments using a certified calibration (30 vol % CO
2, 10 vol % CO, 10 vol % CH
4, and 10 vol % H
2, BOC) and the 10 vol % H
2 gas mixture. Gas flow rates were controlled via calibrated rotameters (Roxspur Measurement & Control Ltd., Sheffield, UK). A summary of the flow rates utilised during each cycle phase is provided in
Table 3. During the main SESR phase the
U/
Umf was 3.6 for sand, (
ρsand = 2600 kg/m
3, 425–500 µm), calculated using correlation reported by Wen & Yu [
62].
3.7. Standard Operating Procedure
On completion of a pressure/leak test at 3 bar, the furnace was switched on and the reactor heated up, with a flow of 30 cm3/s N2 added. The combined sorbent/catalyst particles were dropped in to the bed along with 40 g of silica sand (425–500 µm, ρsand = 2600 kg/m3, purity > 98%, David Ball Co., plc, Bourn, Cambridgeshire, UK) through the top of the reactor when the internal reactor temperature had reached 500 °C. Further heating of the bed to the operating temperature (660 °C) resulted in the calcination of any carbonates or hydrates that may have formed during storage, weighing or transfer.
The NiO component of the sorbent/catalyst particle was then reduced in 5 vol % H2 (balanced N2) at 650 °C for 30 min. Prior TPR analysis as well as online measurements of the steam and H2 concentration at the outlet of the reactor confirmed that reduction of the Ni catalyst reached completion under these conditions. Following the reduction step, the gas flow was switched to 100 vol % N2 to purge the system of H2, then the steam generator heating and gas flow switched on.
Once a stable steam concentration was achieved, the biomass feeding system was turned on and the SESR reactions initiated. The SESR experiments were conducted at 660 ± 5 °C, 1 atm and 20 ± 2 vol % steam, which produced a stoichiometric molar steam to carbon ratio of 1.2:1. Oak wood (212–300 µm) was used as the biomass in this work and fed at a rate of 0.9 g/min ±10% relative standard deviation. Proximate and ultimate analysis, and heating value of the biomass (estimated by its ultimate analysis data) is available in
Table 4.
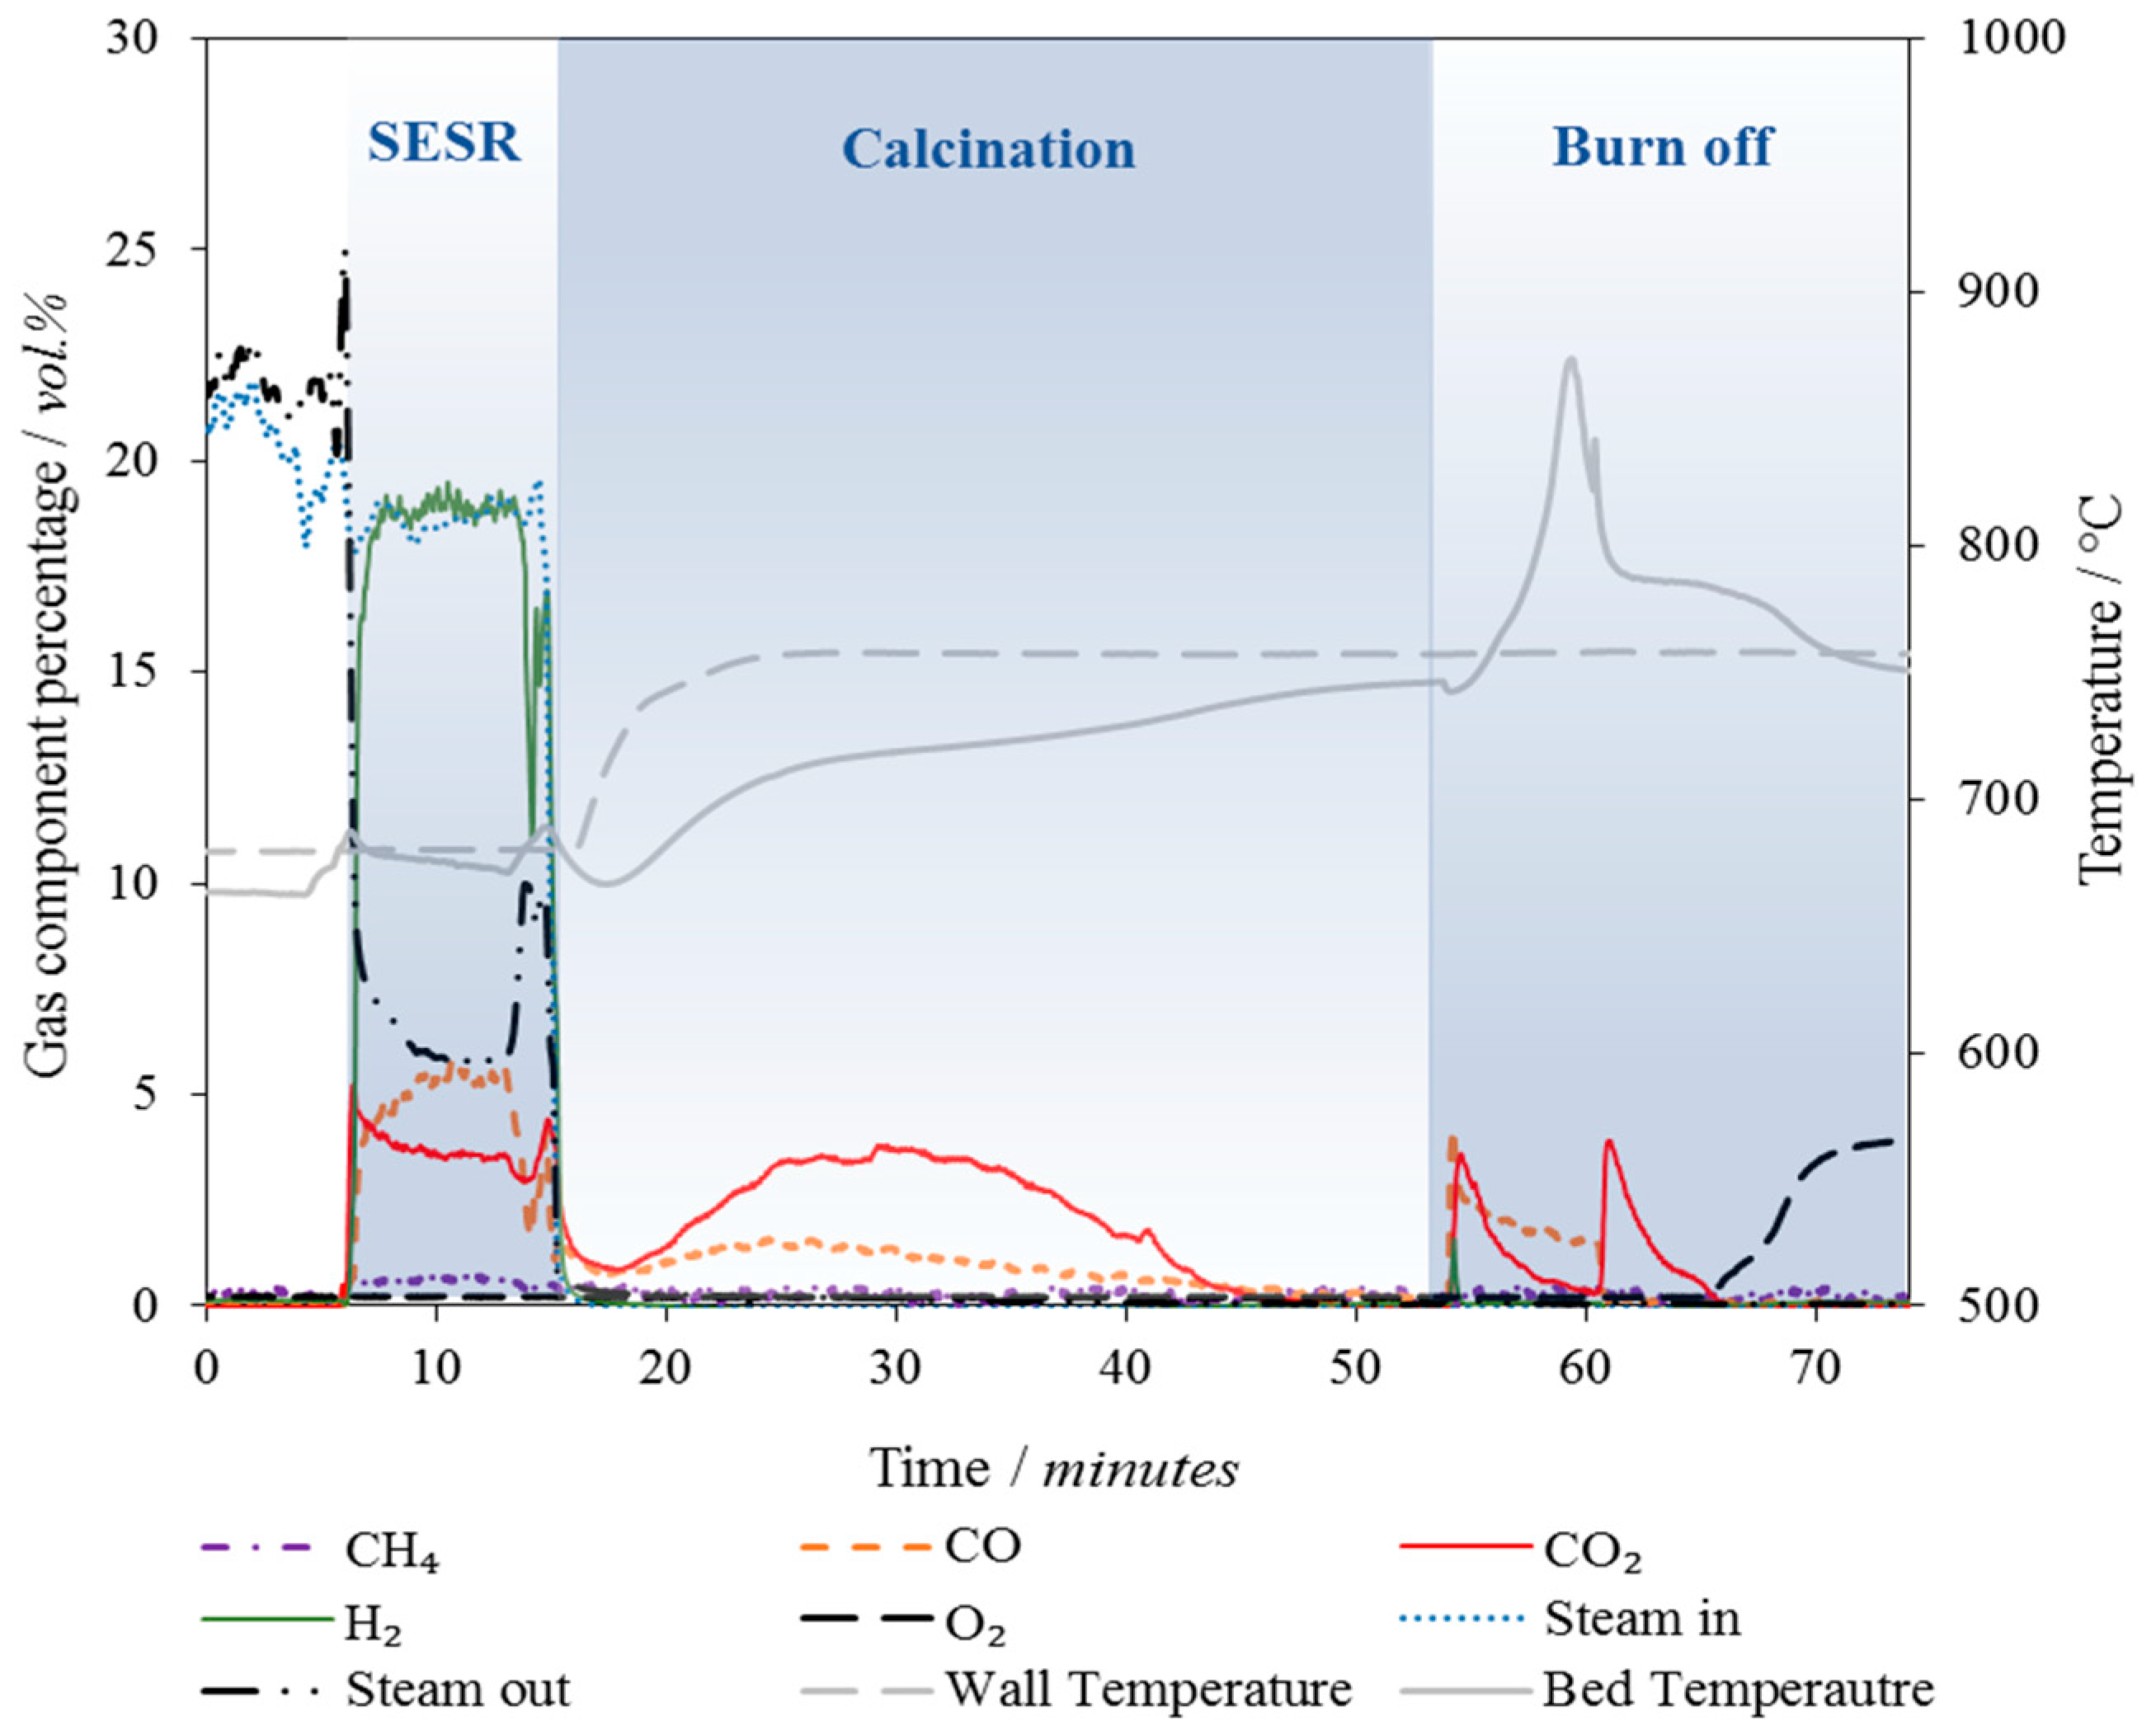
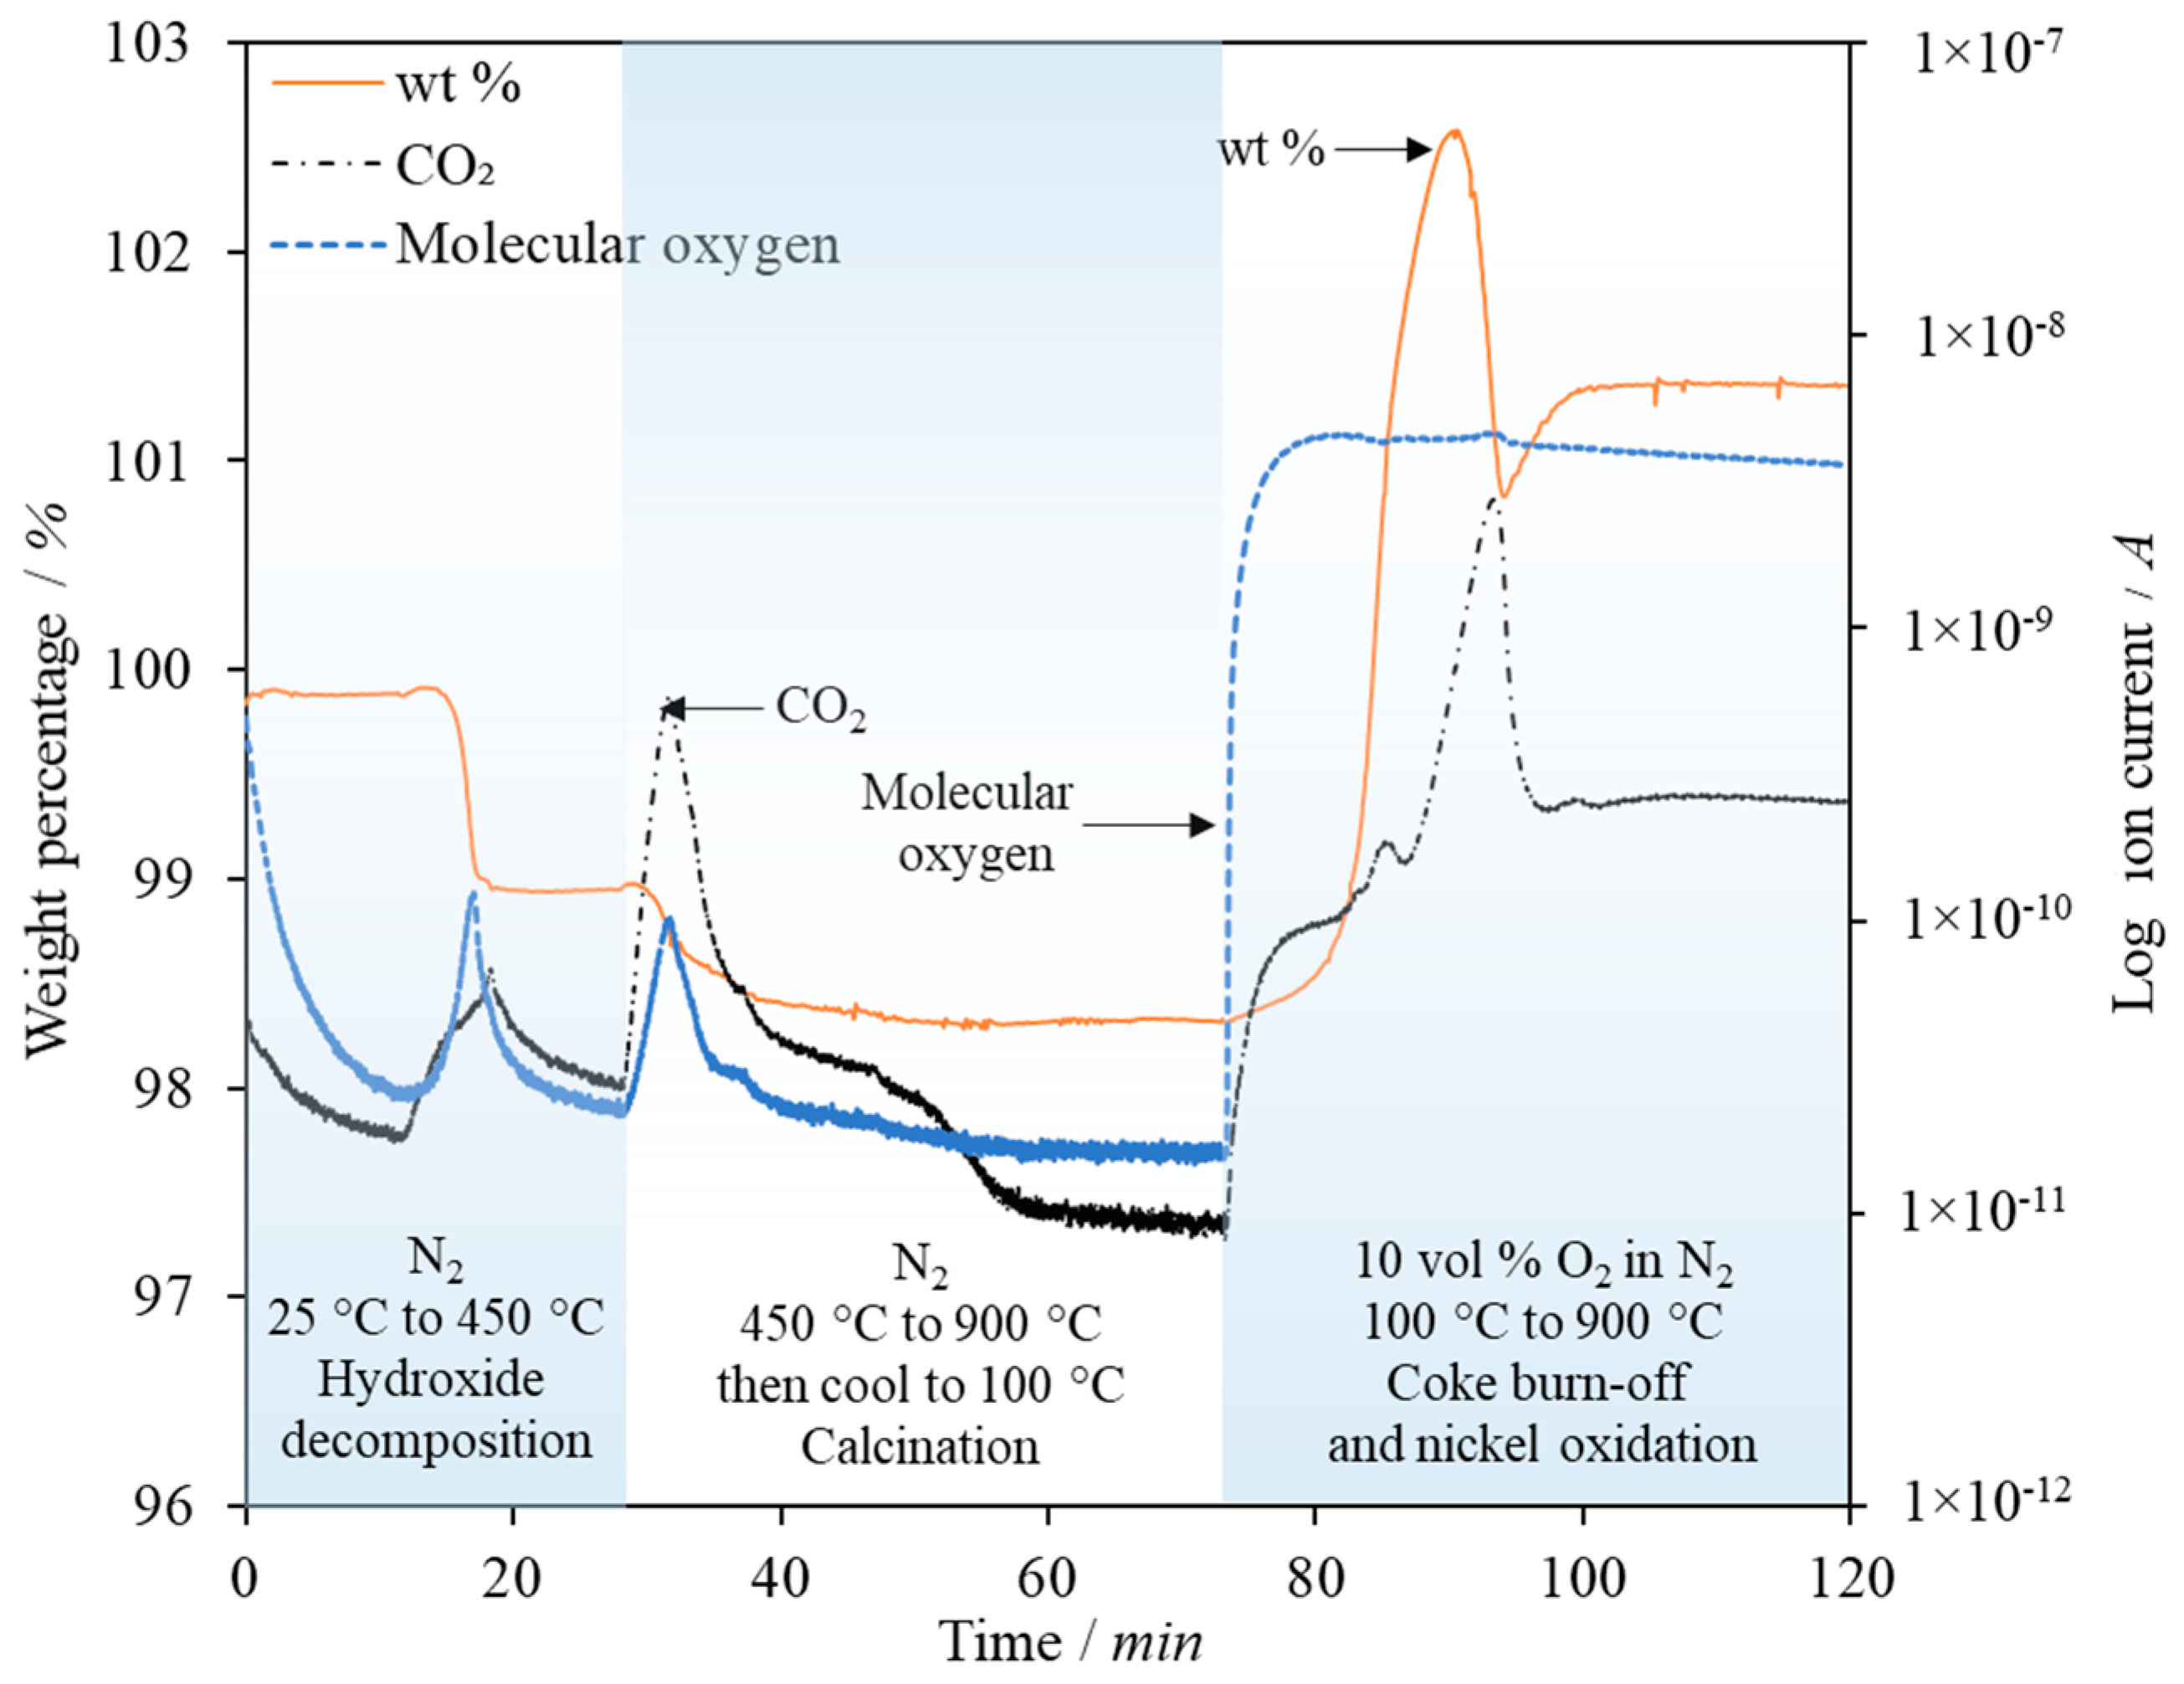
After a set 3 min time period (determined during the reactor commissioning and experimental design phase), the biomass feeding was turned off and the main N2 gas flow set to bypass the steam generation system, effectively shutting off the steam flow to the reactor. The reactor was then heated to 750 °C and the CaCO3 formed during the SESR process was calcined. On completion of the calcination reaction, air was added to the reactor to combust coke produced during the SESR and any char remaining in the bed. Online data logging of the gas analyser signals, relative humidity probes and thermocouples was achieved using a data acquisition card (Redlab 1208FS DAQ card, Meilhaus Computing, supplied by RS Components Ltd., Corby, Northamptonshire, UK) and an Agilent VEE control program.
5. Conclusions
Sorption enhanced steam reforming (SESR) of biomass using dual-function catalyst/CO2 sorbent combined particles was studied using a specially constructed single-stage spout-fluidised bed reactor, capable of continuous solid fuel feeding.
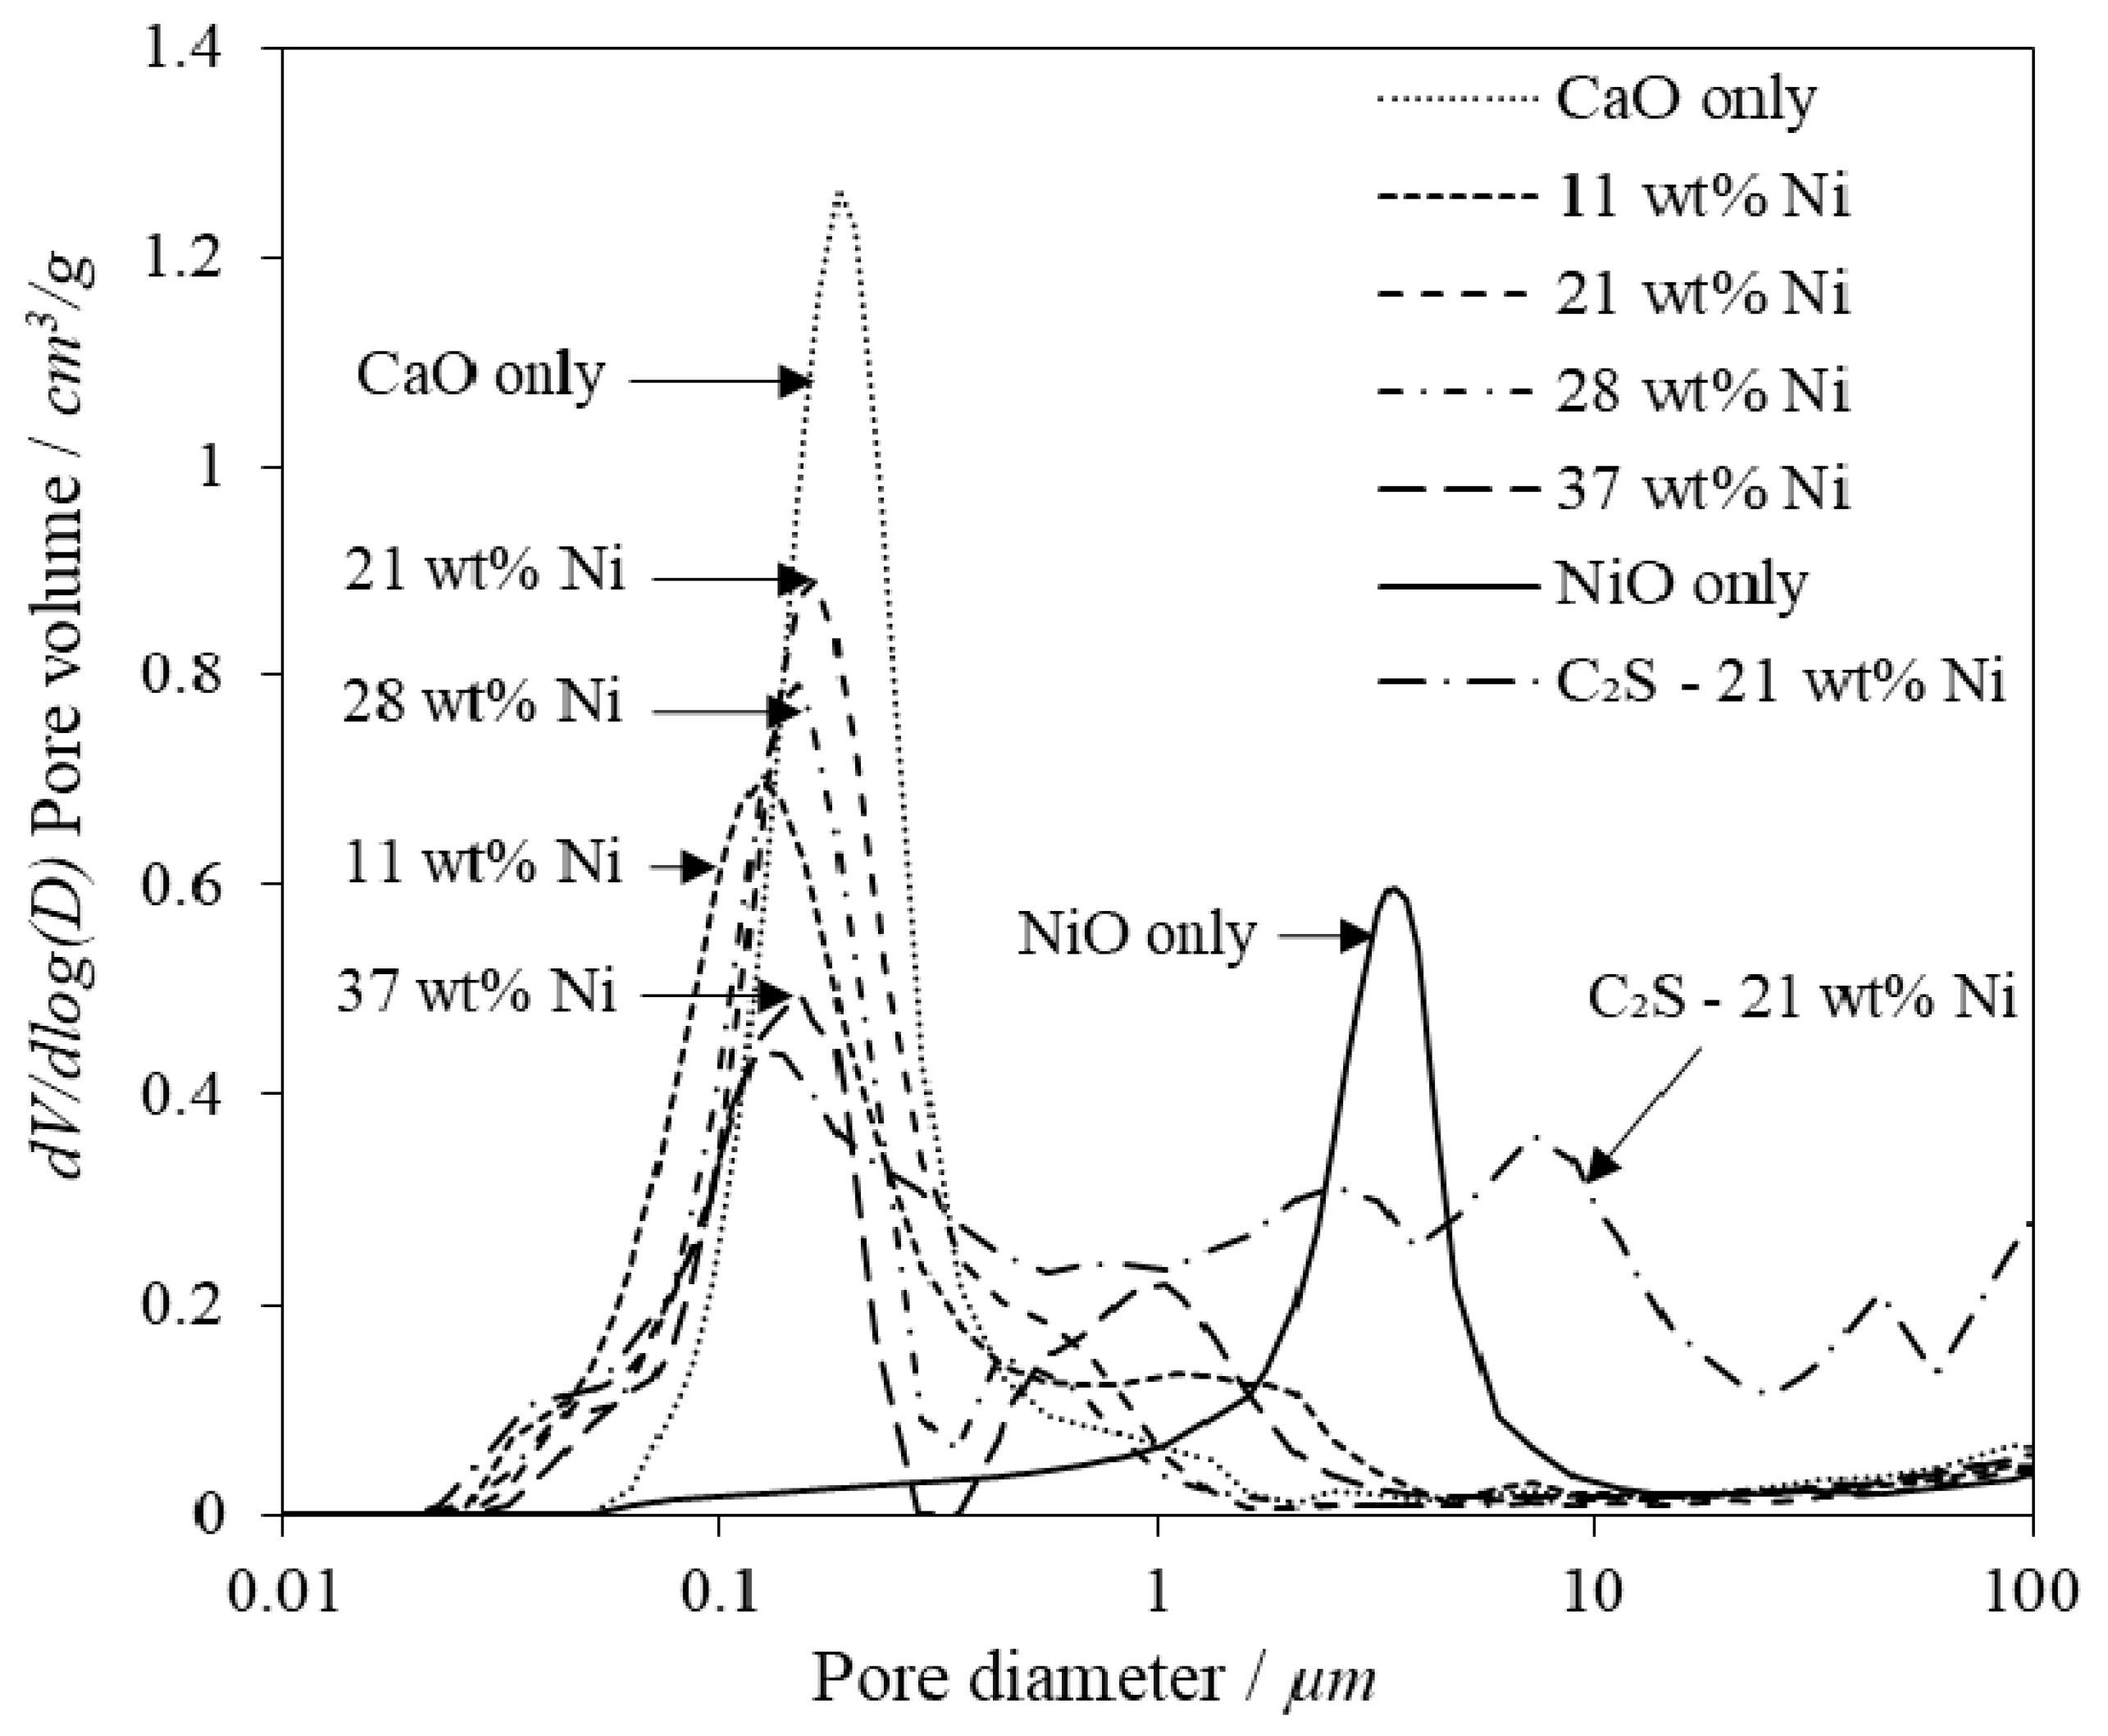
A set of combined particles of varying with varying CaO to Ni ratios were produced by a low-engineered wet mechanical mixing method. The influence of incorporating a dicalcium silicate support was also studied. Two particle size fractions were produced and their material properties characterised.
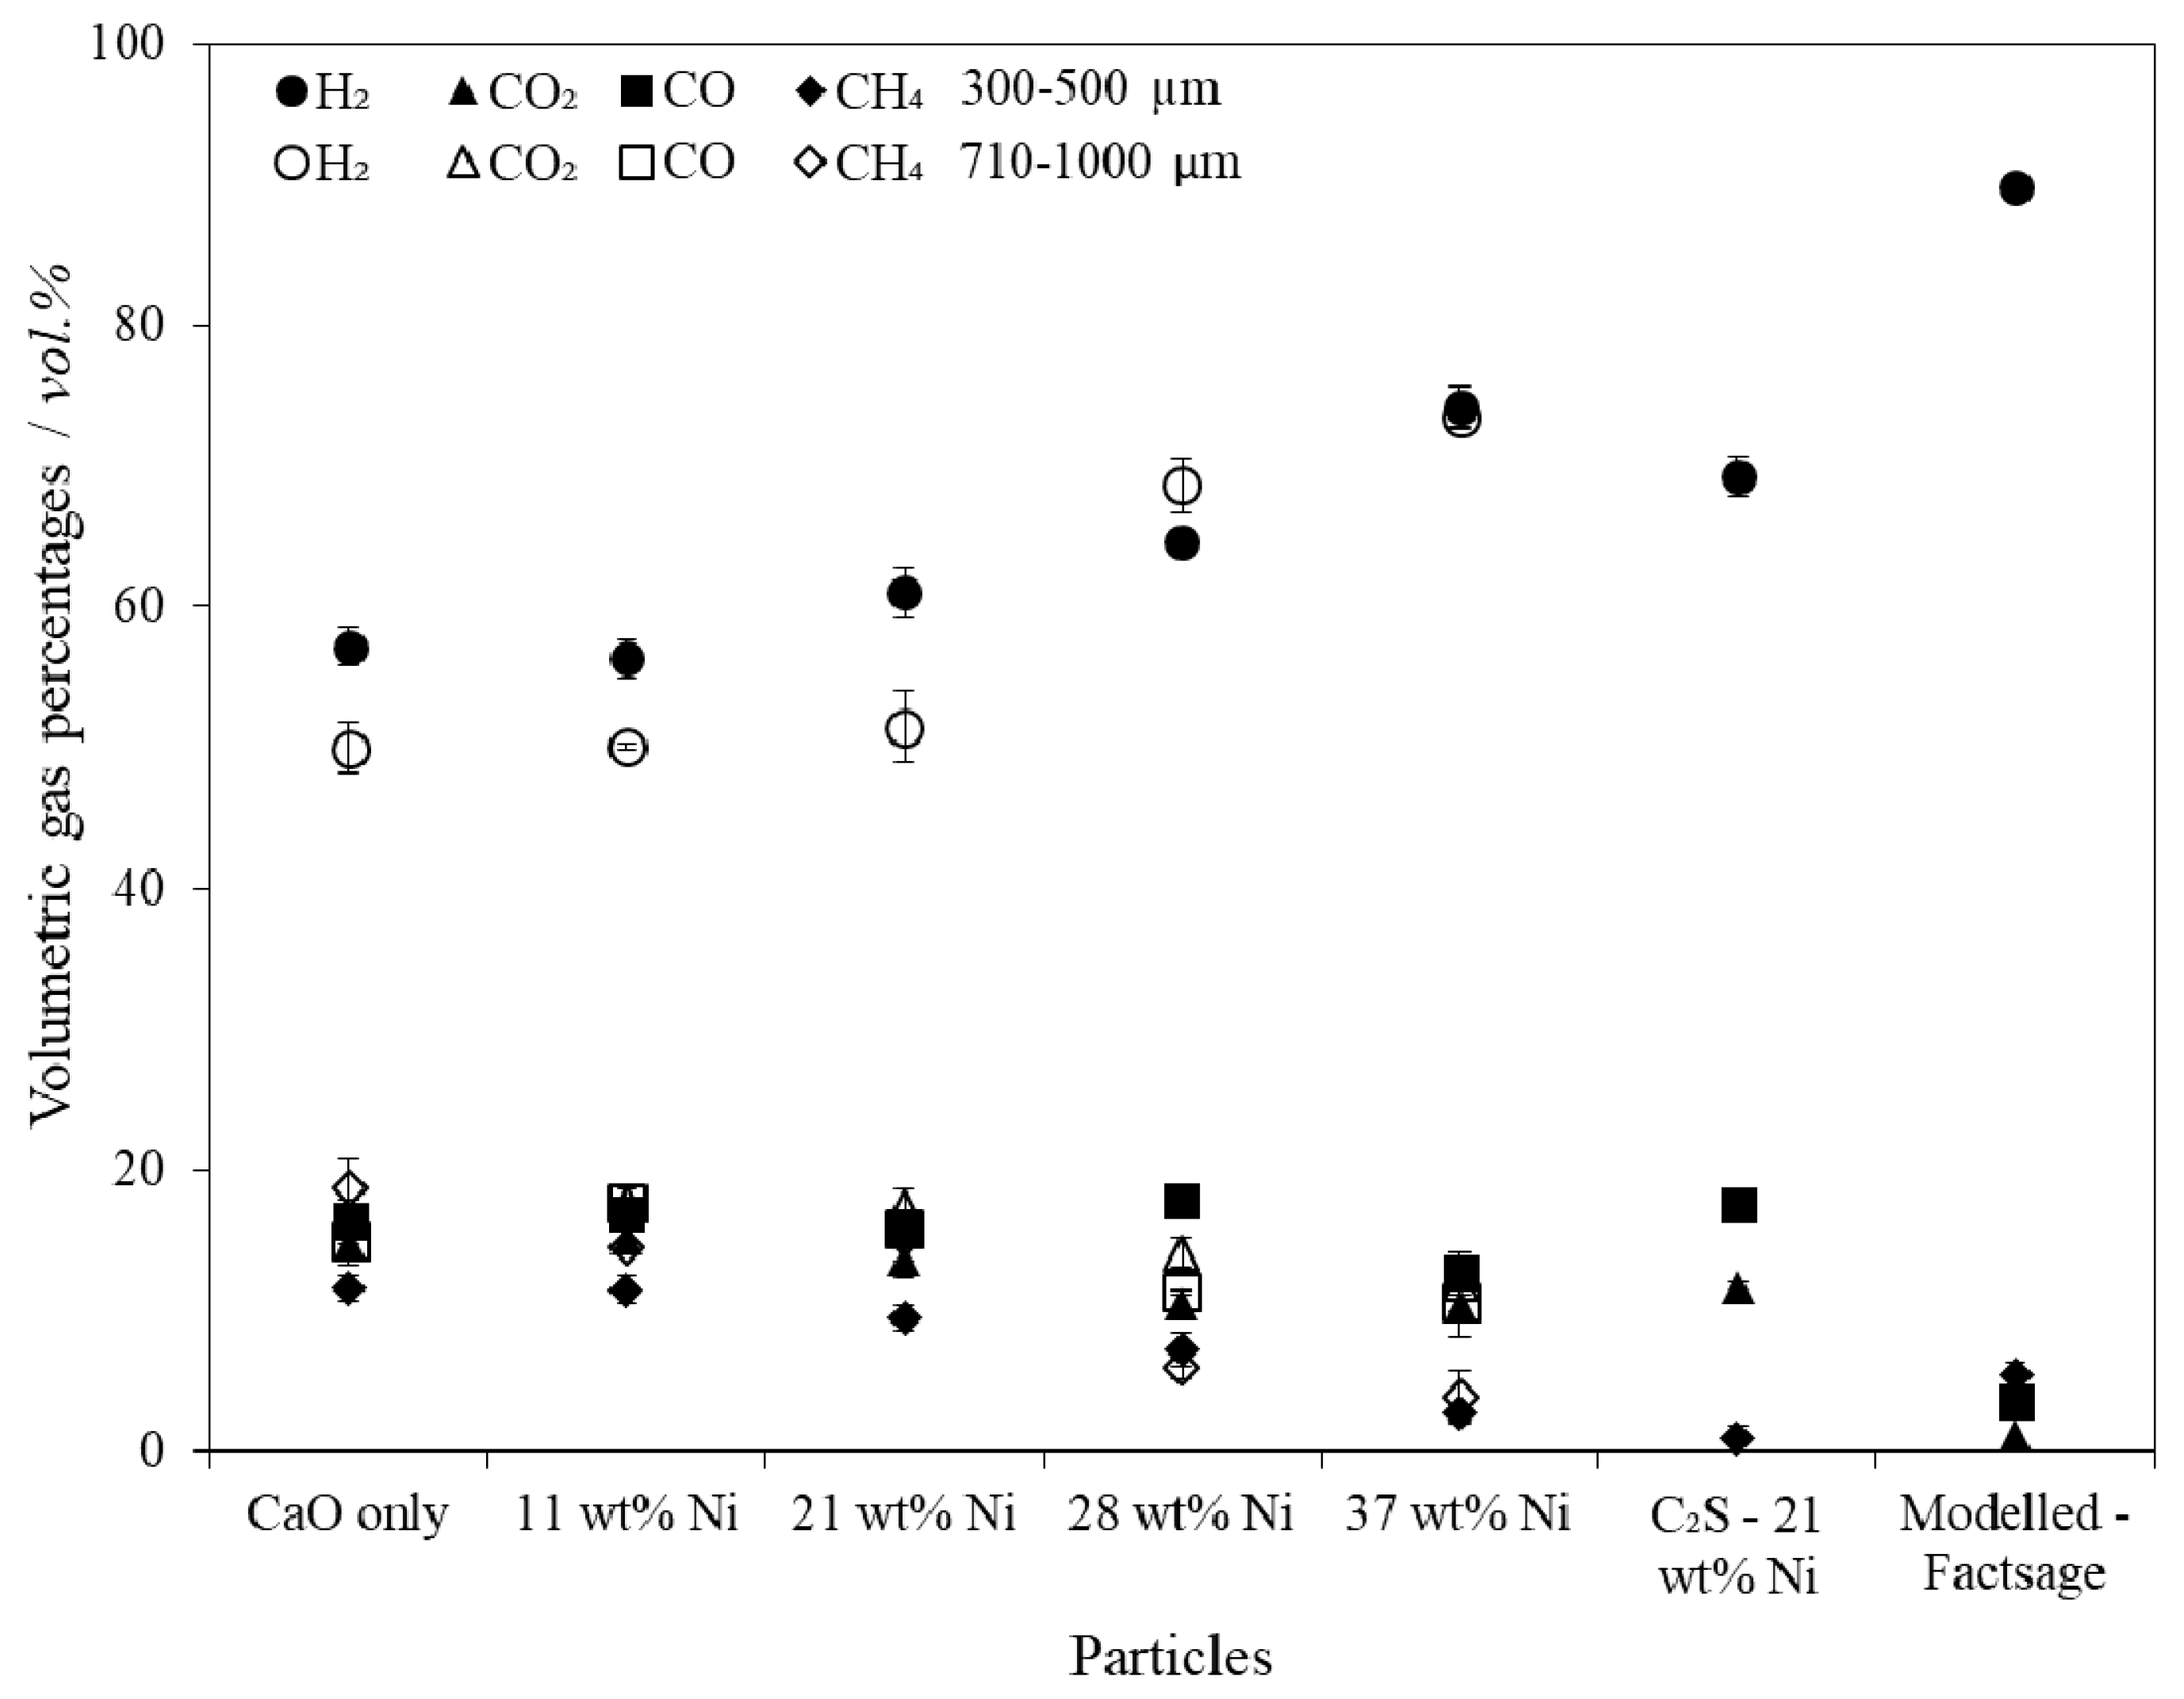
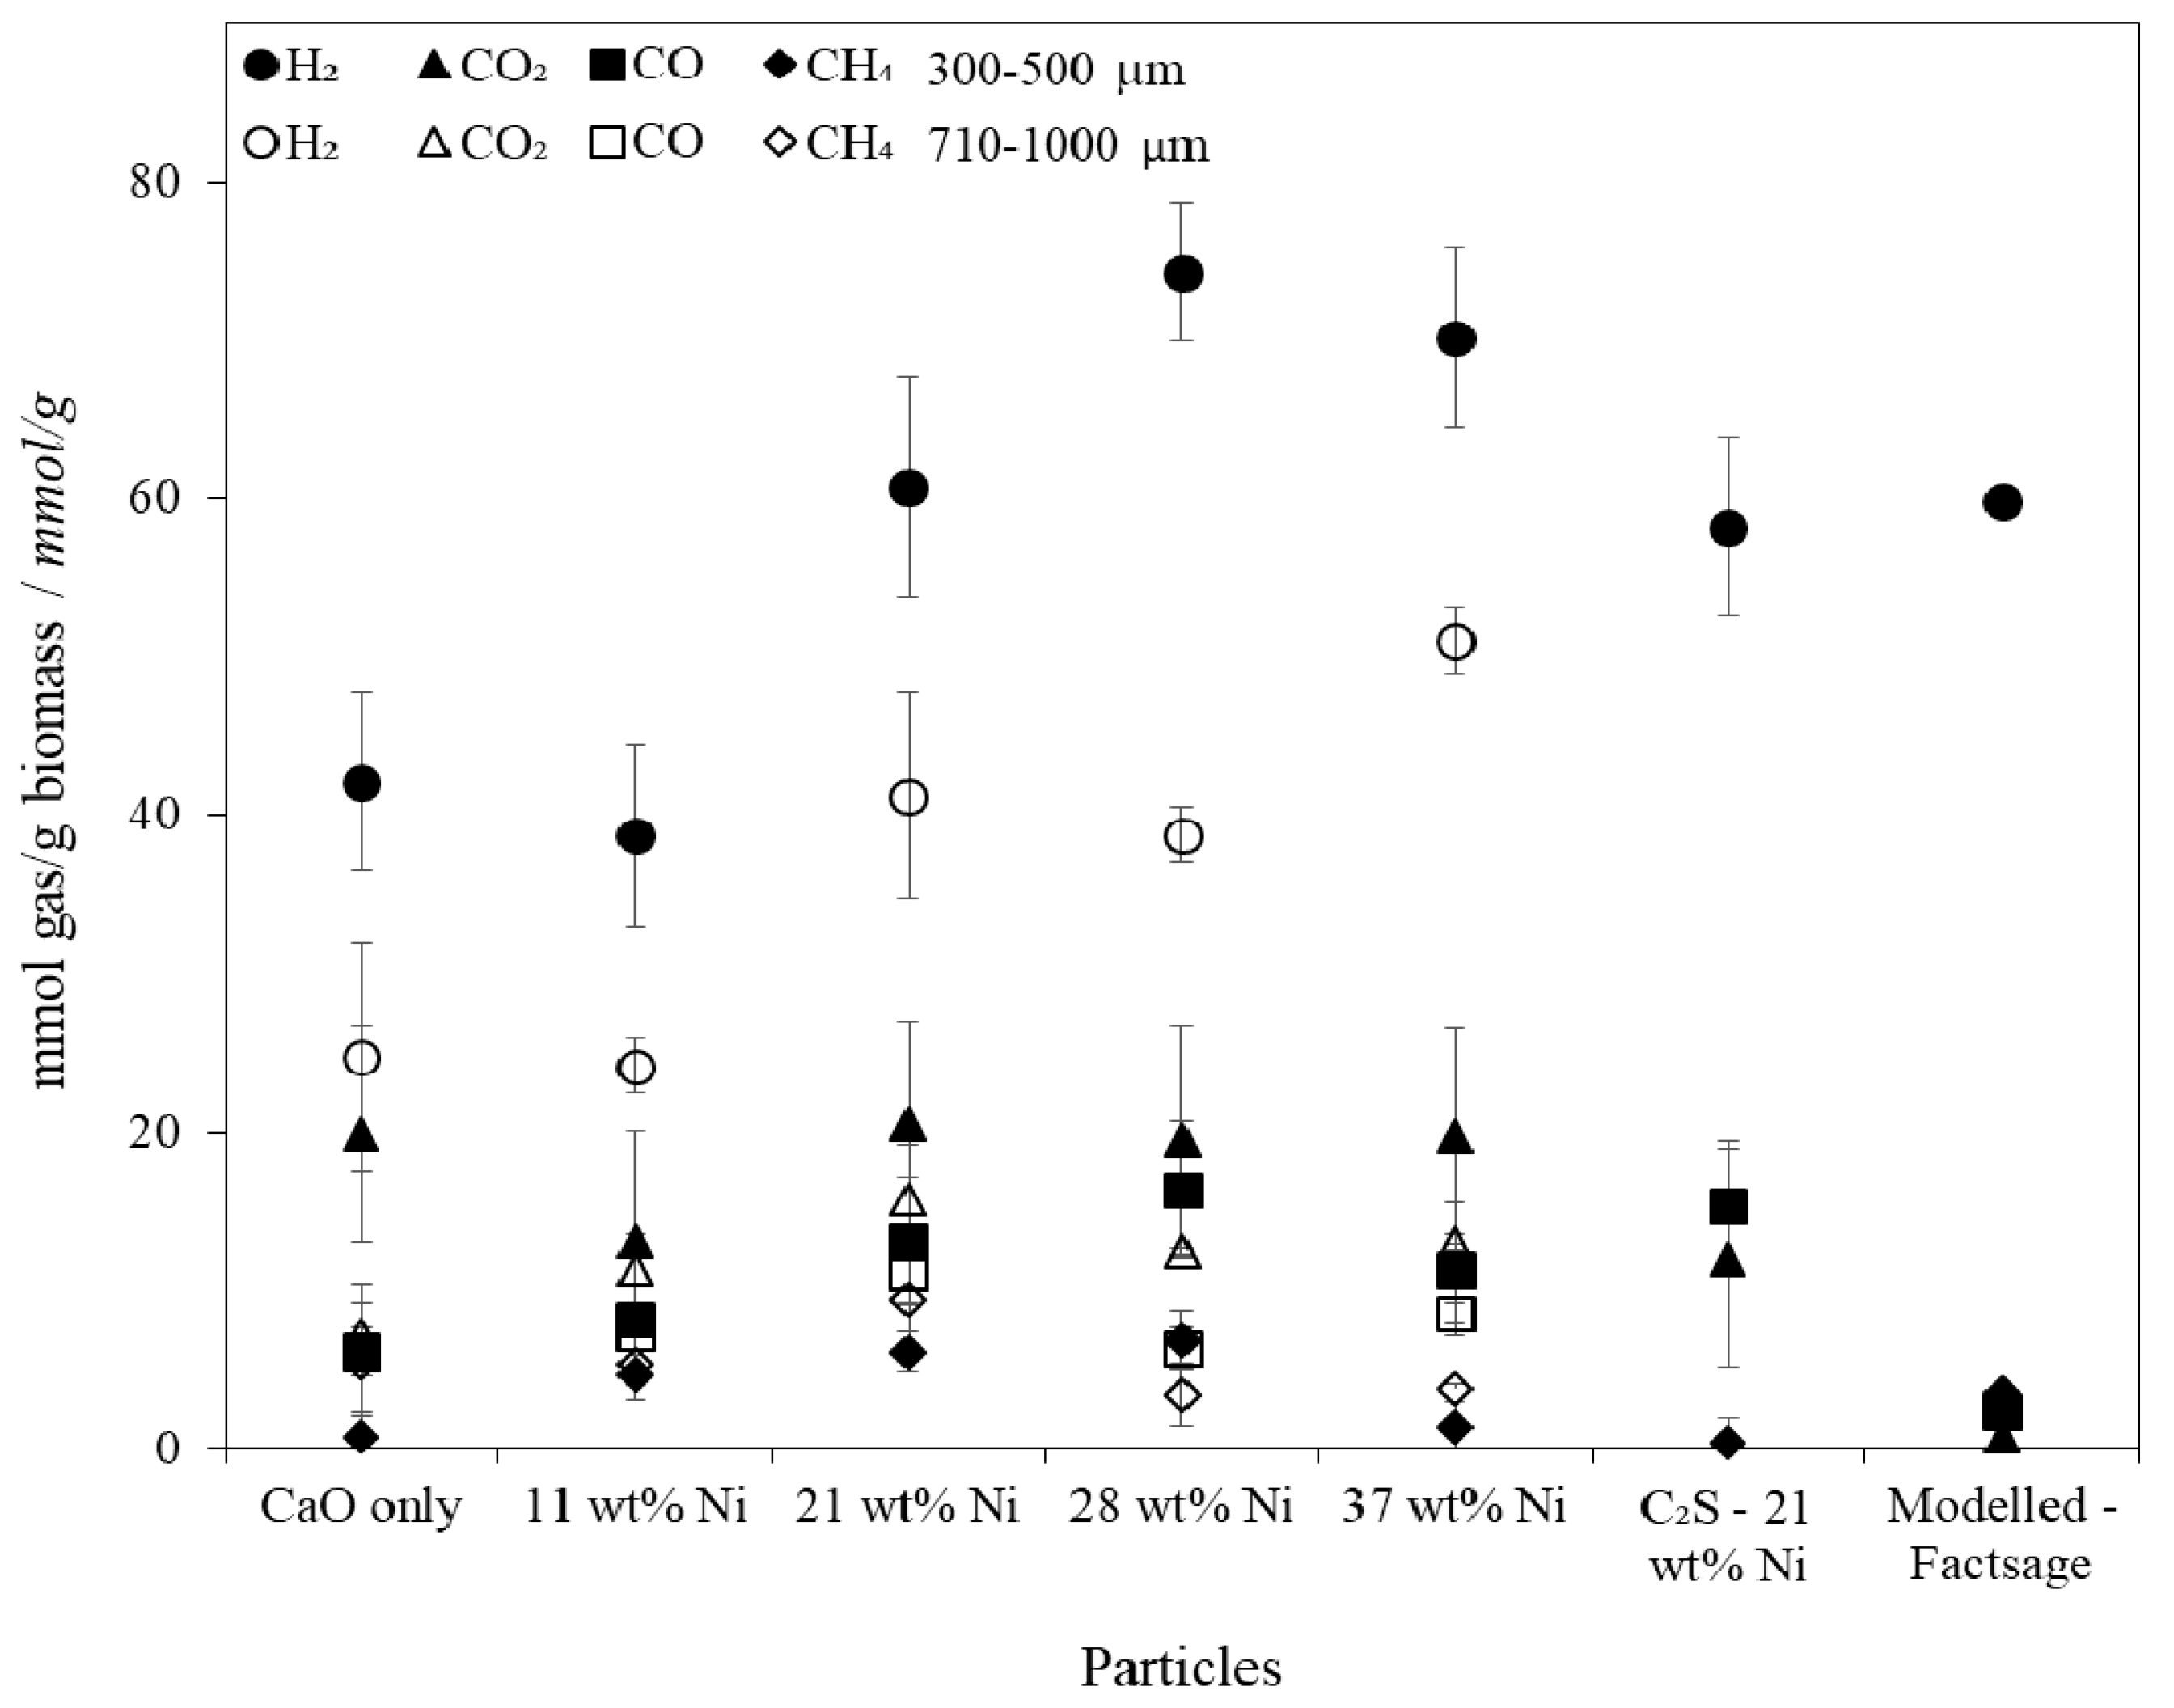
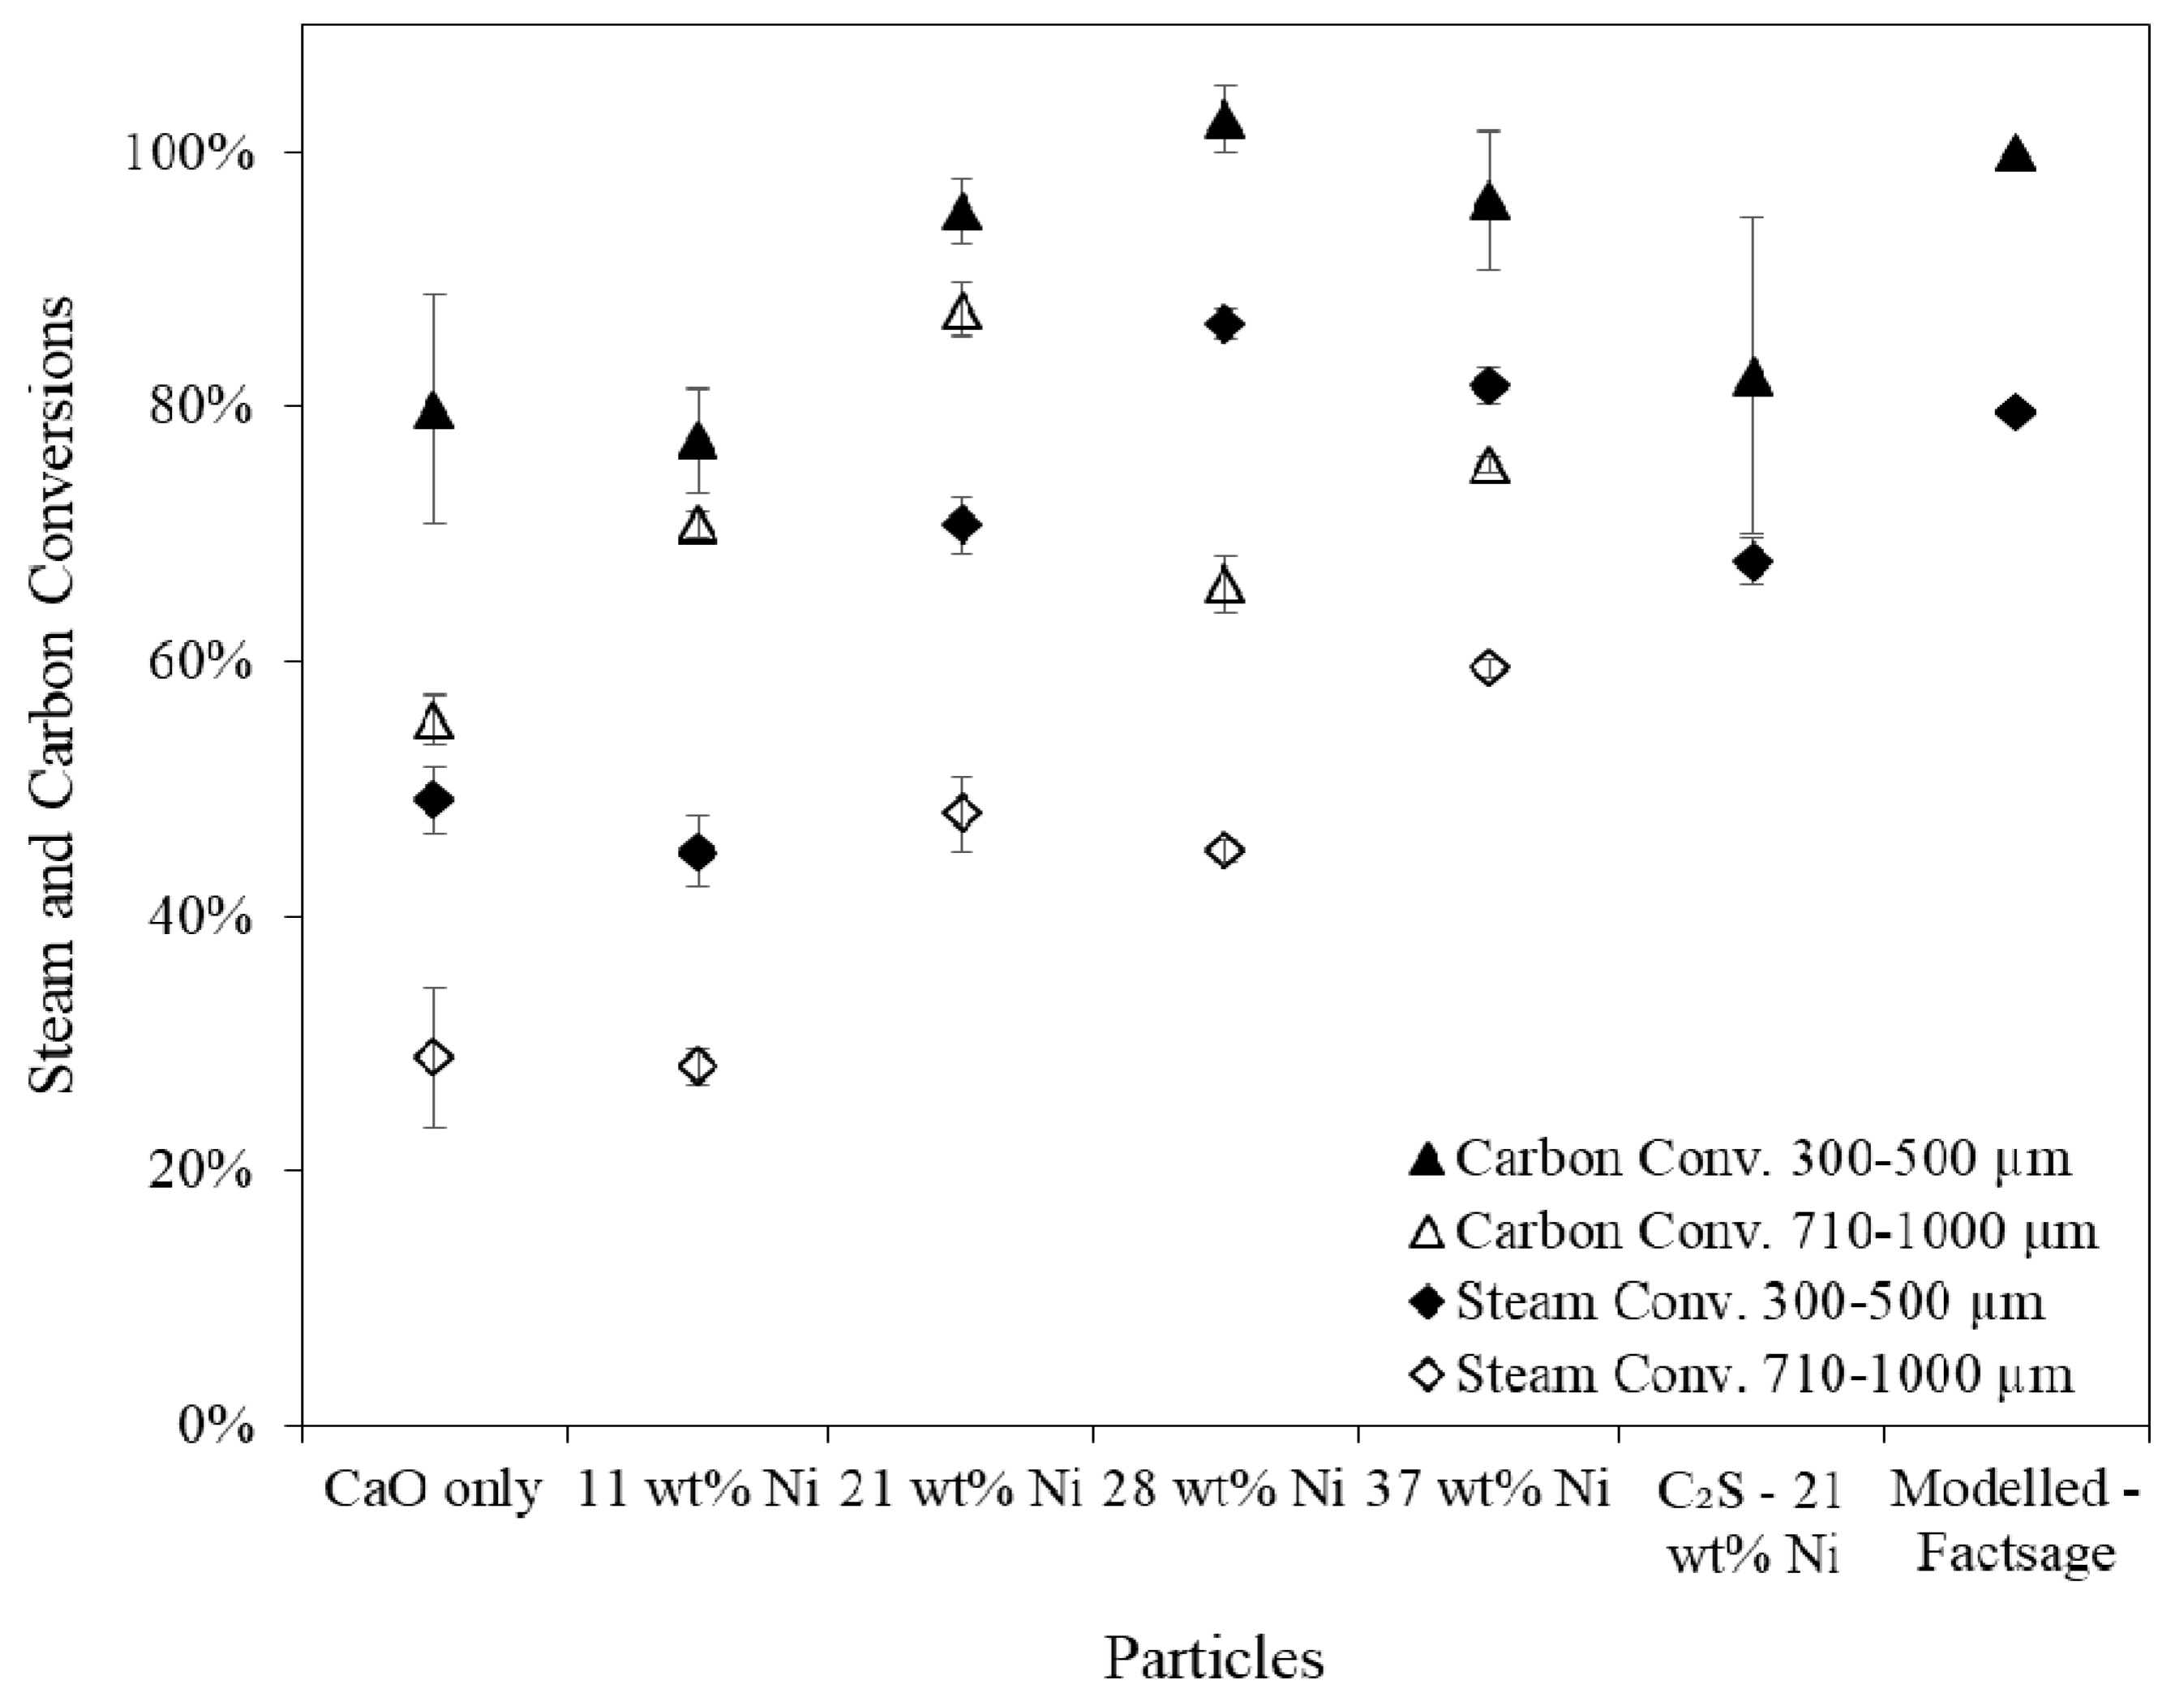
SESR performance testing in the fluidised spout-bed reactor revealed that the larger particle size fraction suffered from internal diffusional resistance which limited the extent of the SESR reactions. The unsupported particles with 21 wt % Ni produced 61 mmol H2/gbiomass (122 g H2/kgbiomass) at a purity of 61 vol % at 660 °C, 1 atm and a steam to carbon ratio of 1.2:1, which proved to be the most optimal combined particle when accounting for the raw material costs and the increased H2 yield and purity achieved with greater Ni contents. The H2 yields and purities achieved are consistent with the best reported results in the literature.
Coking on the surfaces of the particles and within the reactors’ feeding tube limited the long-term operation of the reactor but further development of the steam generation system to allow for higher steam to carbon ratios is expected to alleviate this issue. Further work should investigate the use of these combined particles over multiple cycles in a spouting bed reactor with higher steam to carbon ratios.

 ,
, 


