Preparation and Thermal Properties of Molecular-Bridged Expanded Graphite/Polyethylene Glycol Composite Phase Change Materials for Building Energy Conservation


Abstract
:1. Introduction
2. Materials and Methods
2.1. Materials
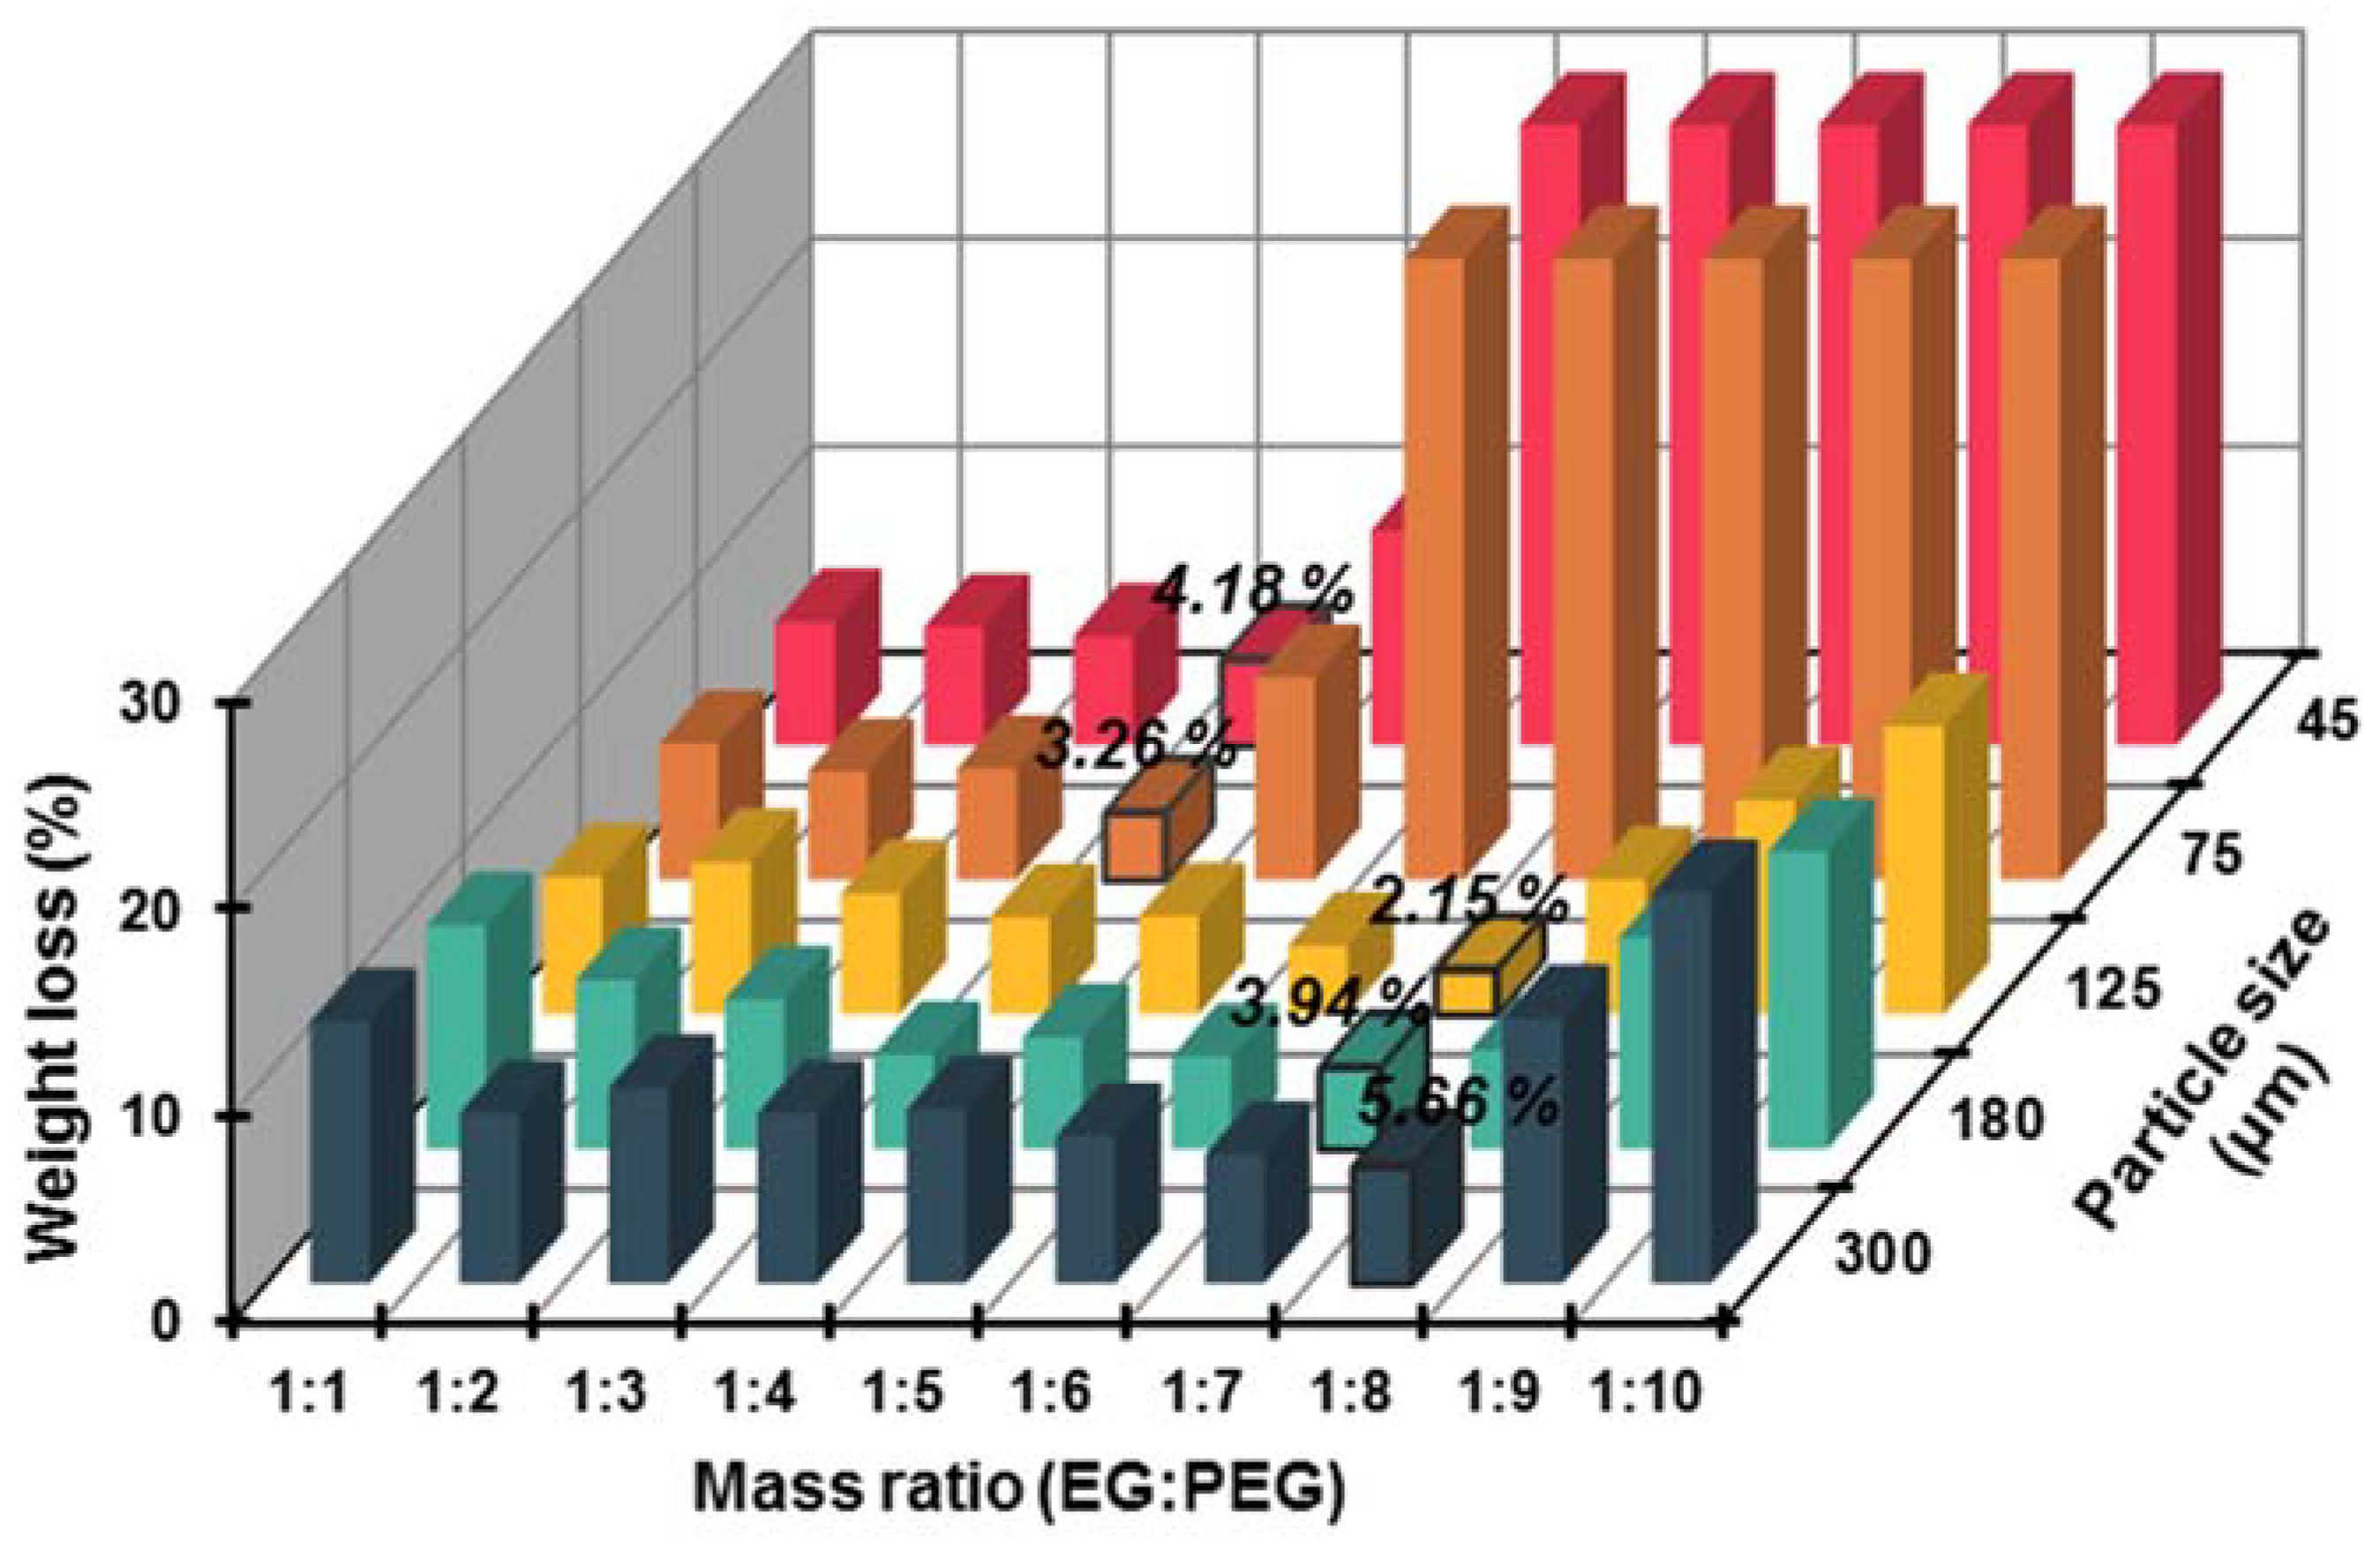
2.2. Selection of EG Matrix for PEG Absorption
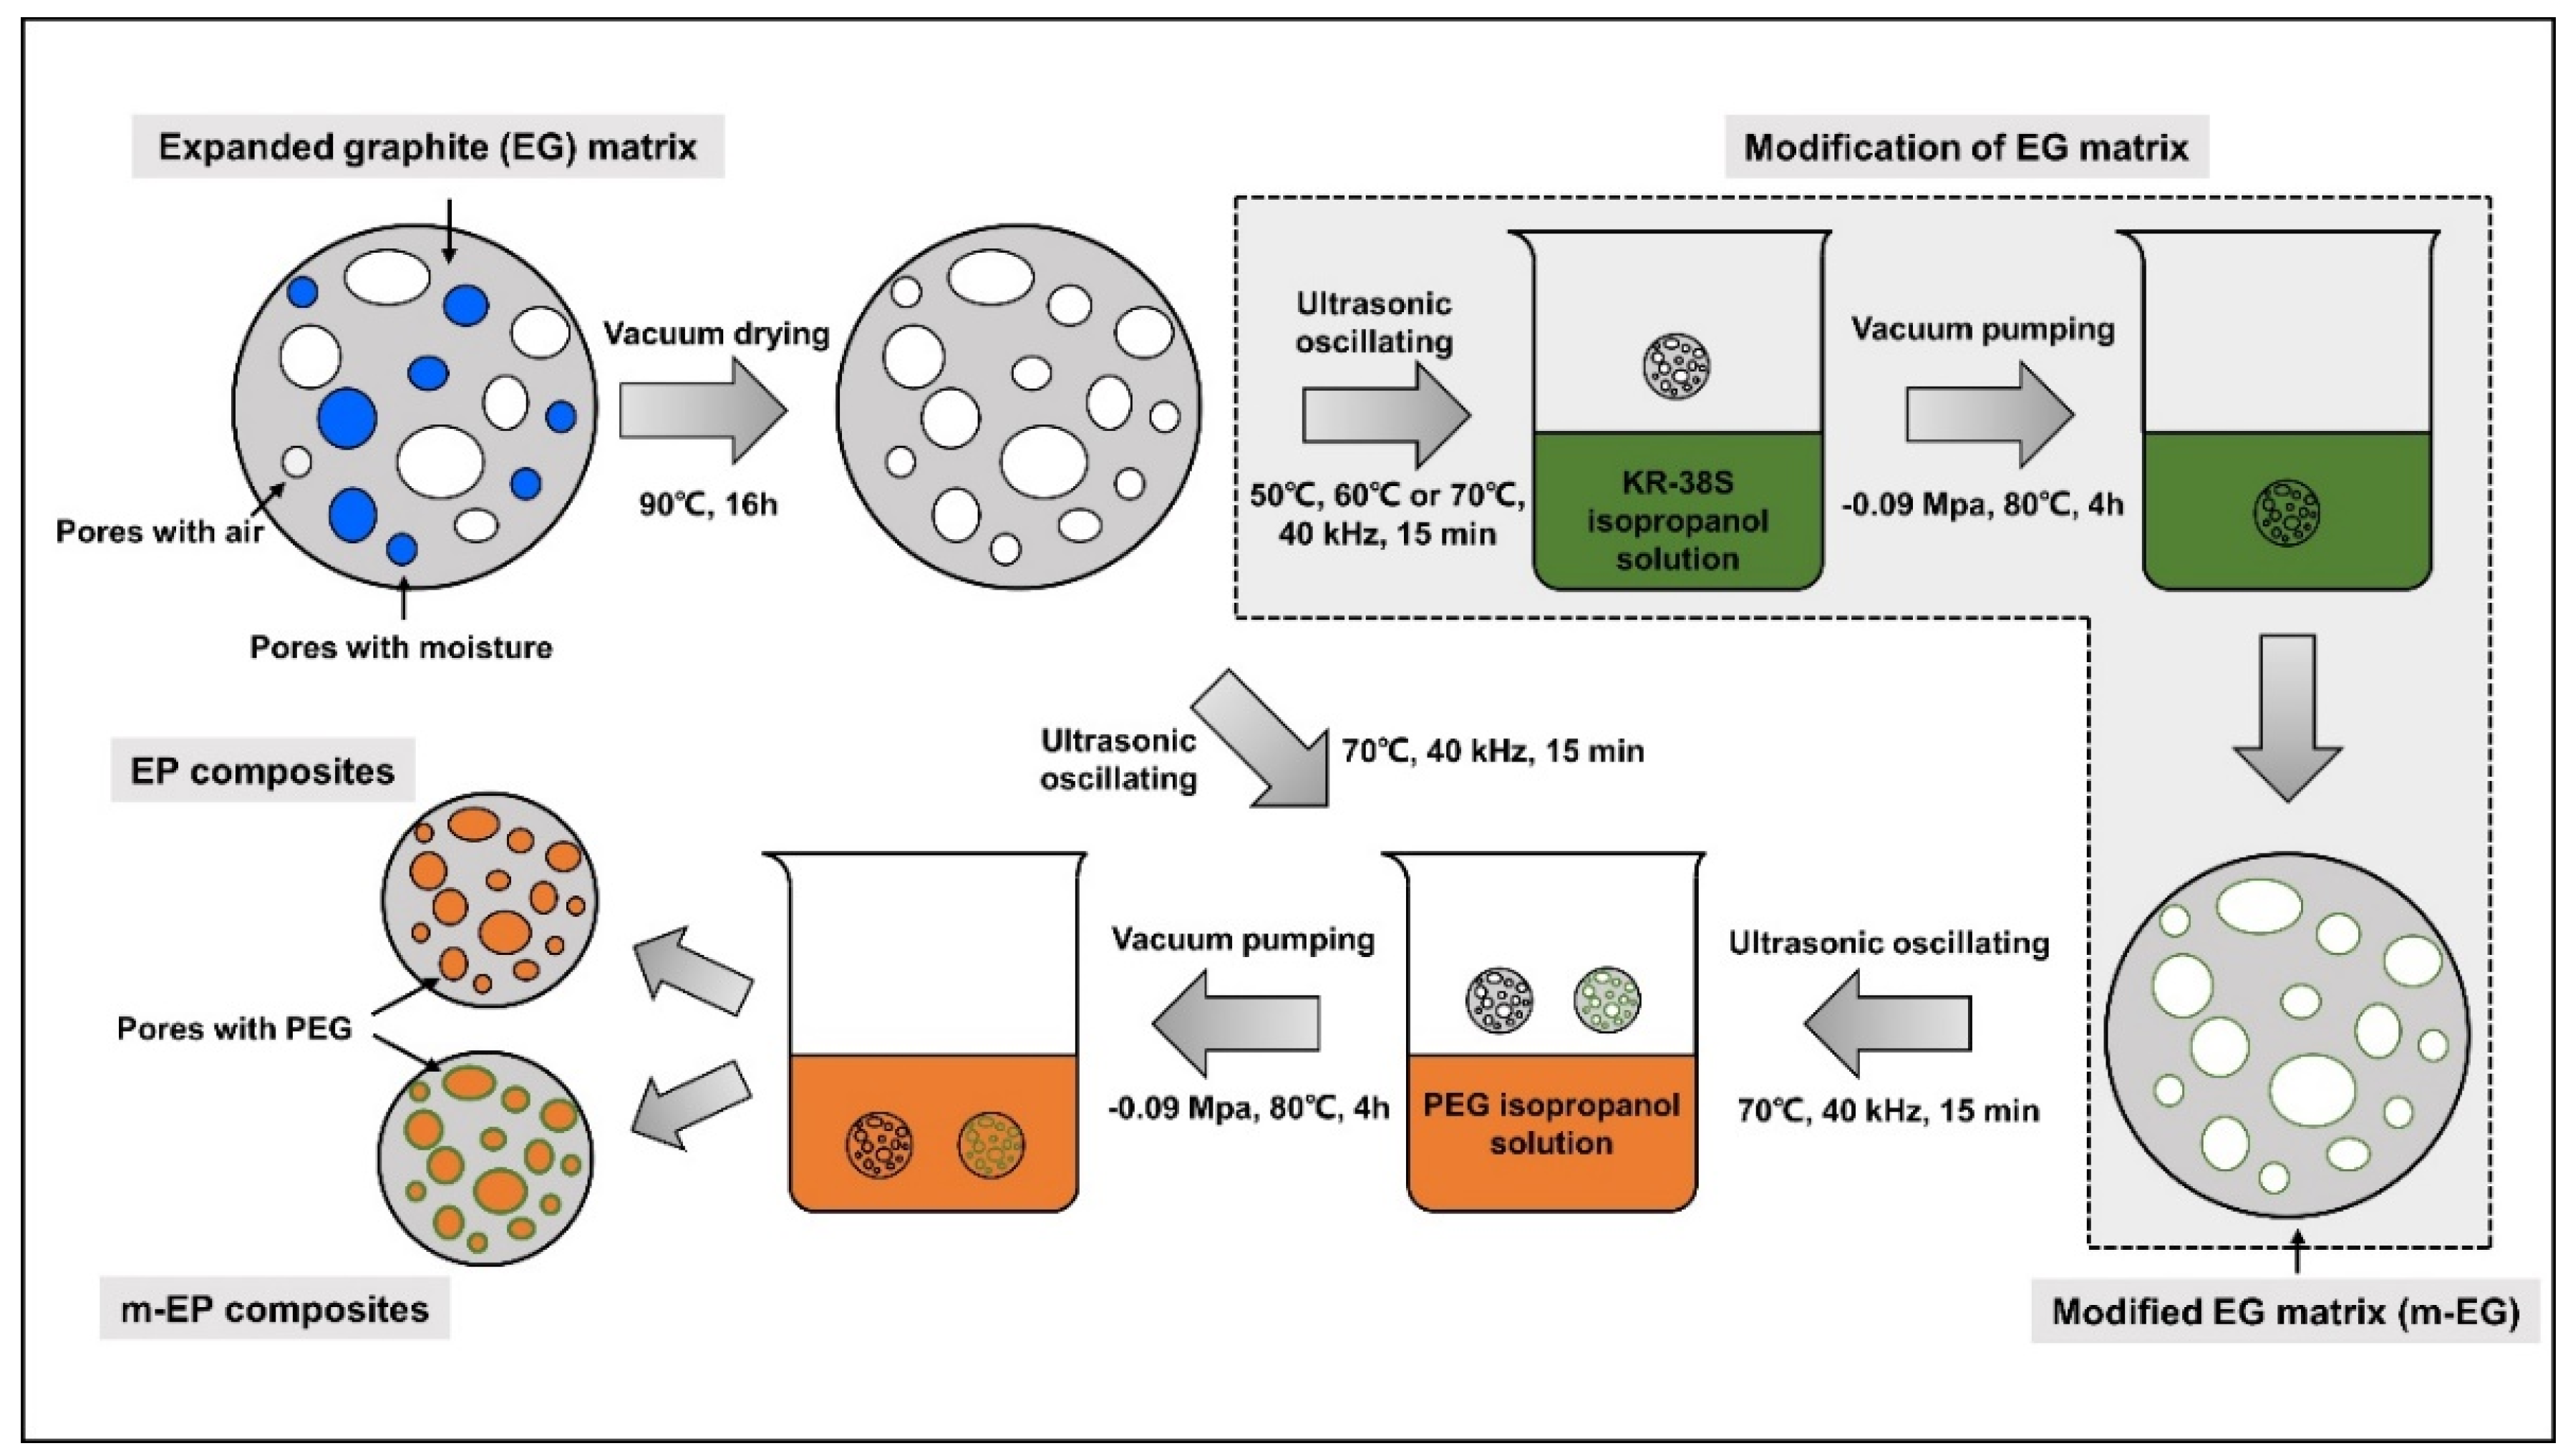
2.3. Preparation of Modifid EG (m-EG) and Molecular-Bridged EP (m-EP)
2.4. Characterization of m-EPs
3. Results and Discussion
3.1. Preparetion of m-EPs
3.1.1. Selection of EG Matrix
3.1.2. Modification of EG Matrix
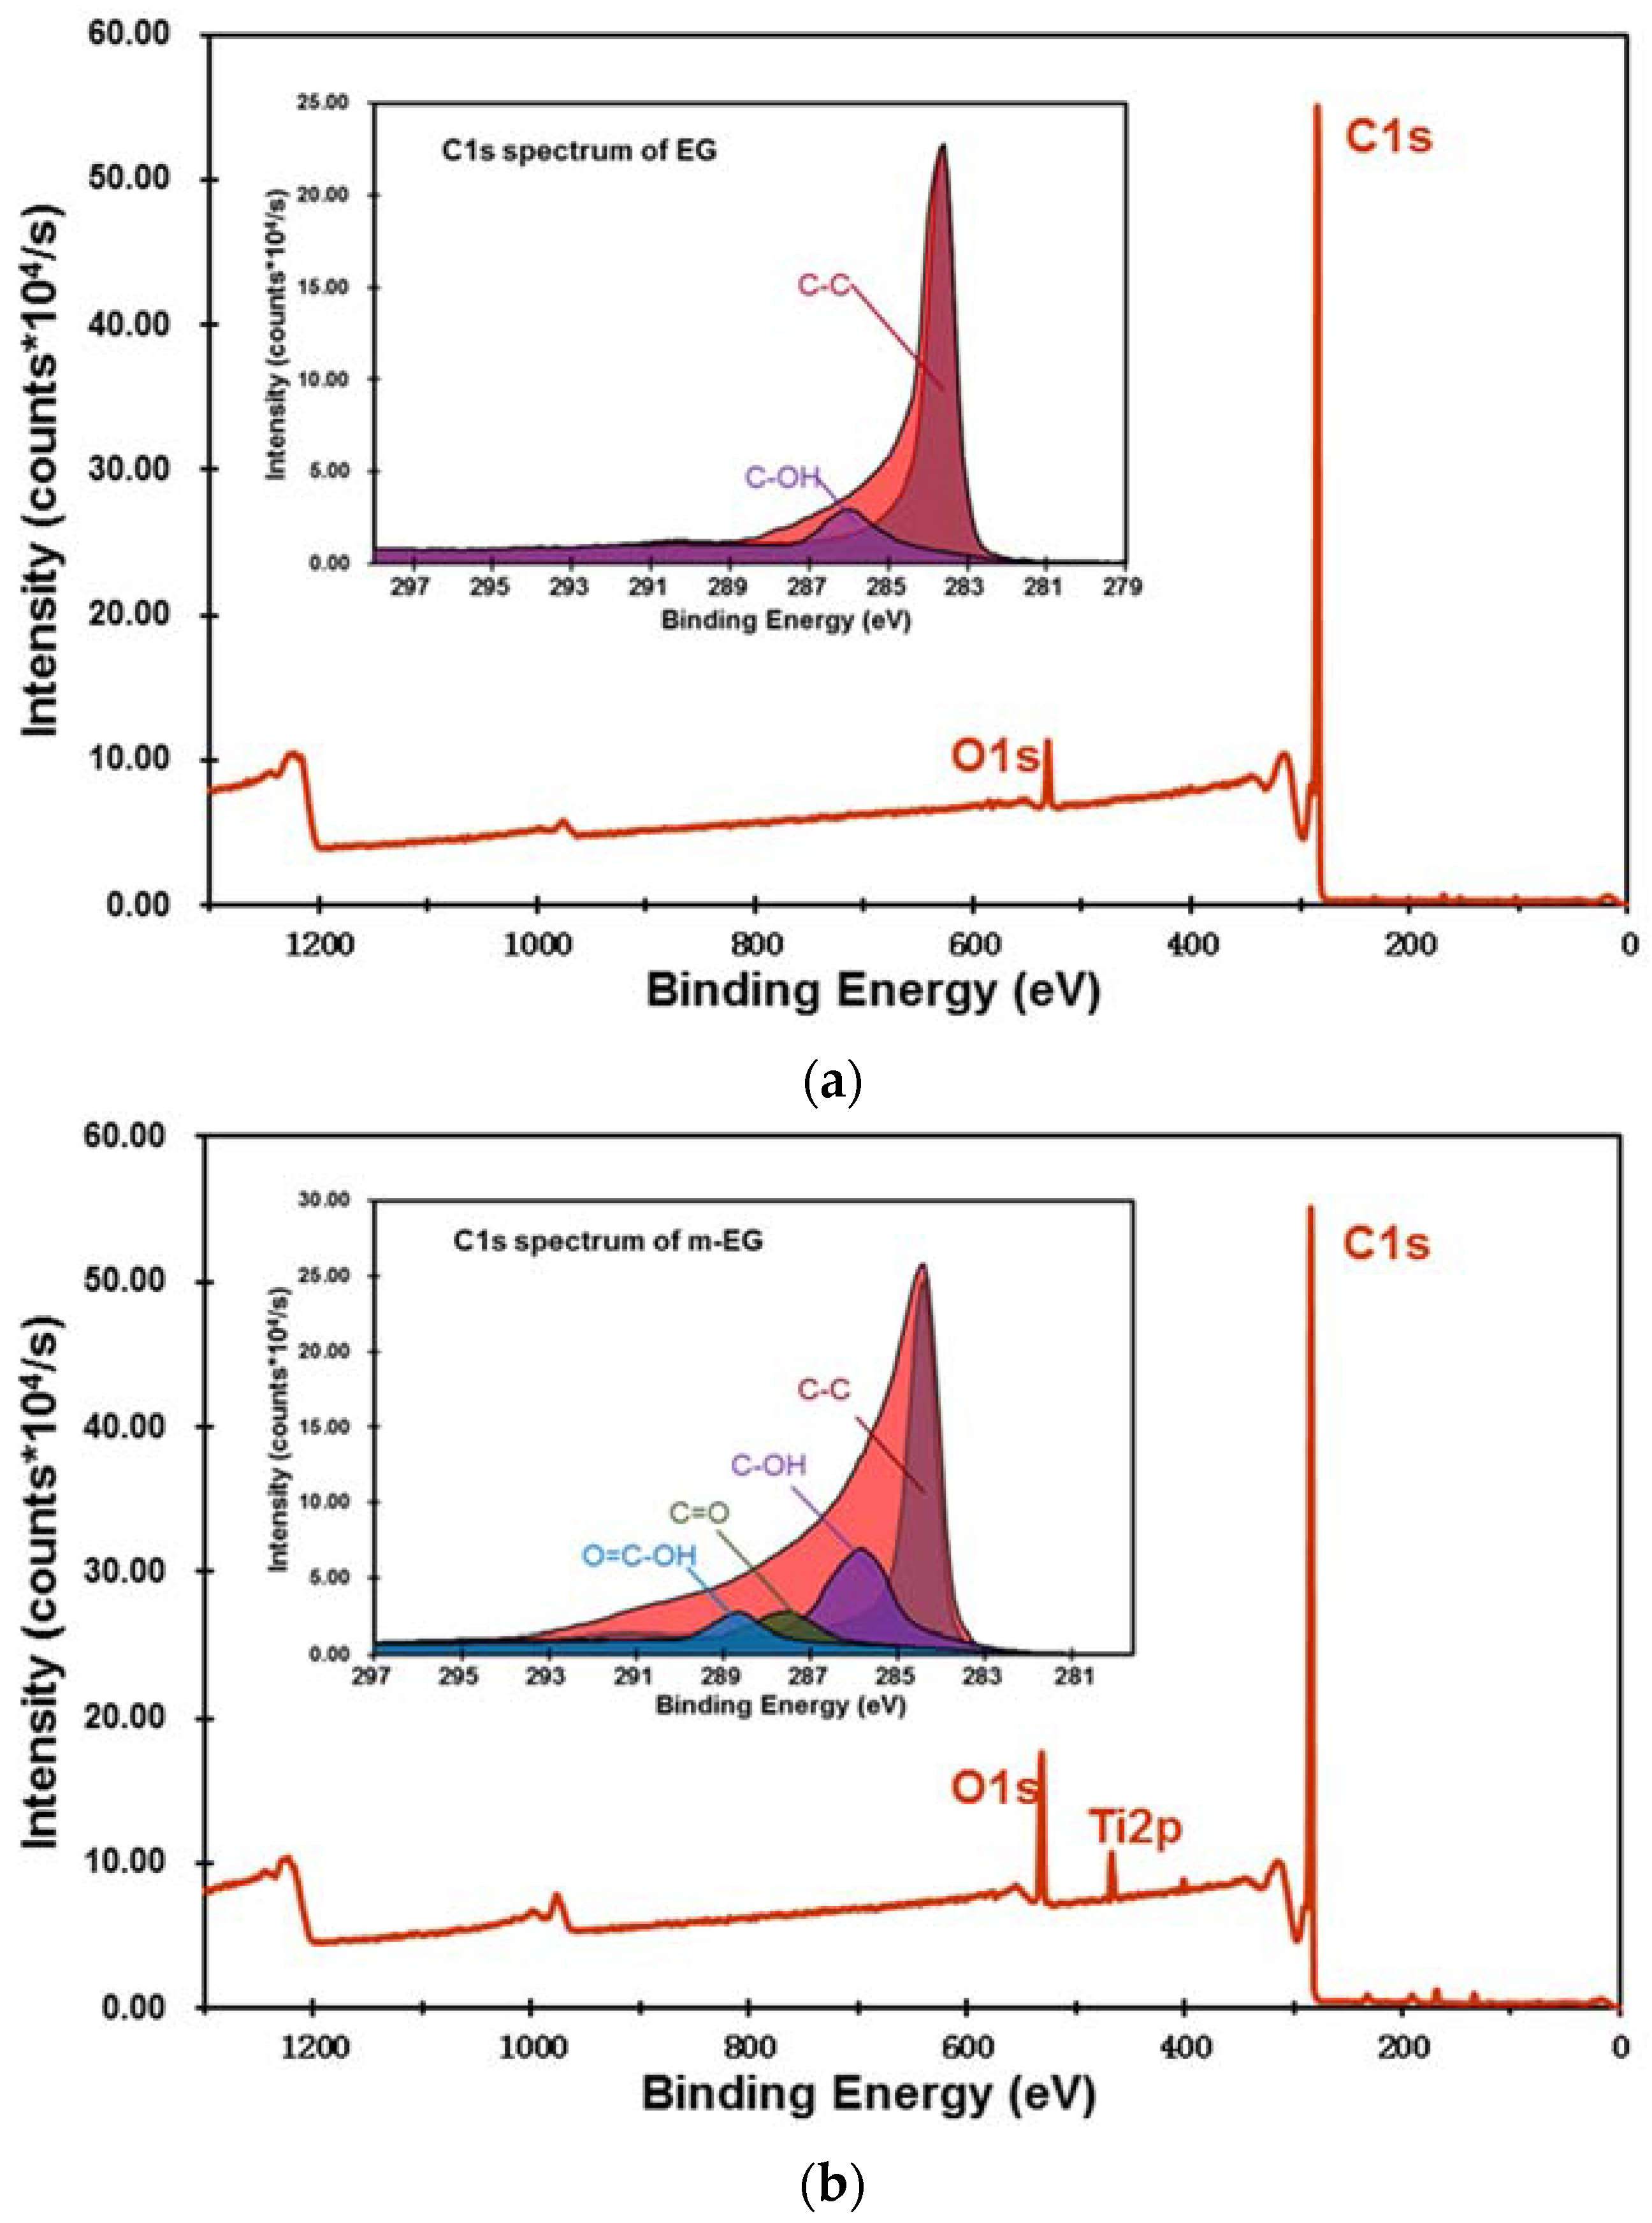
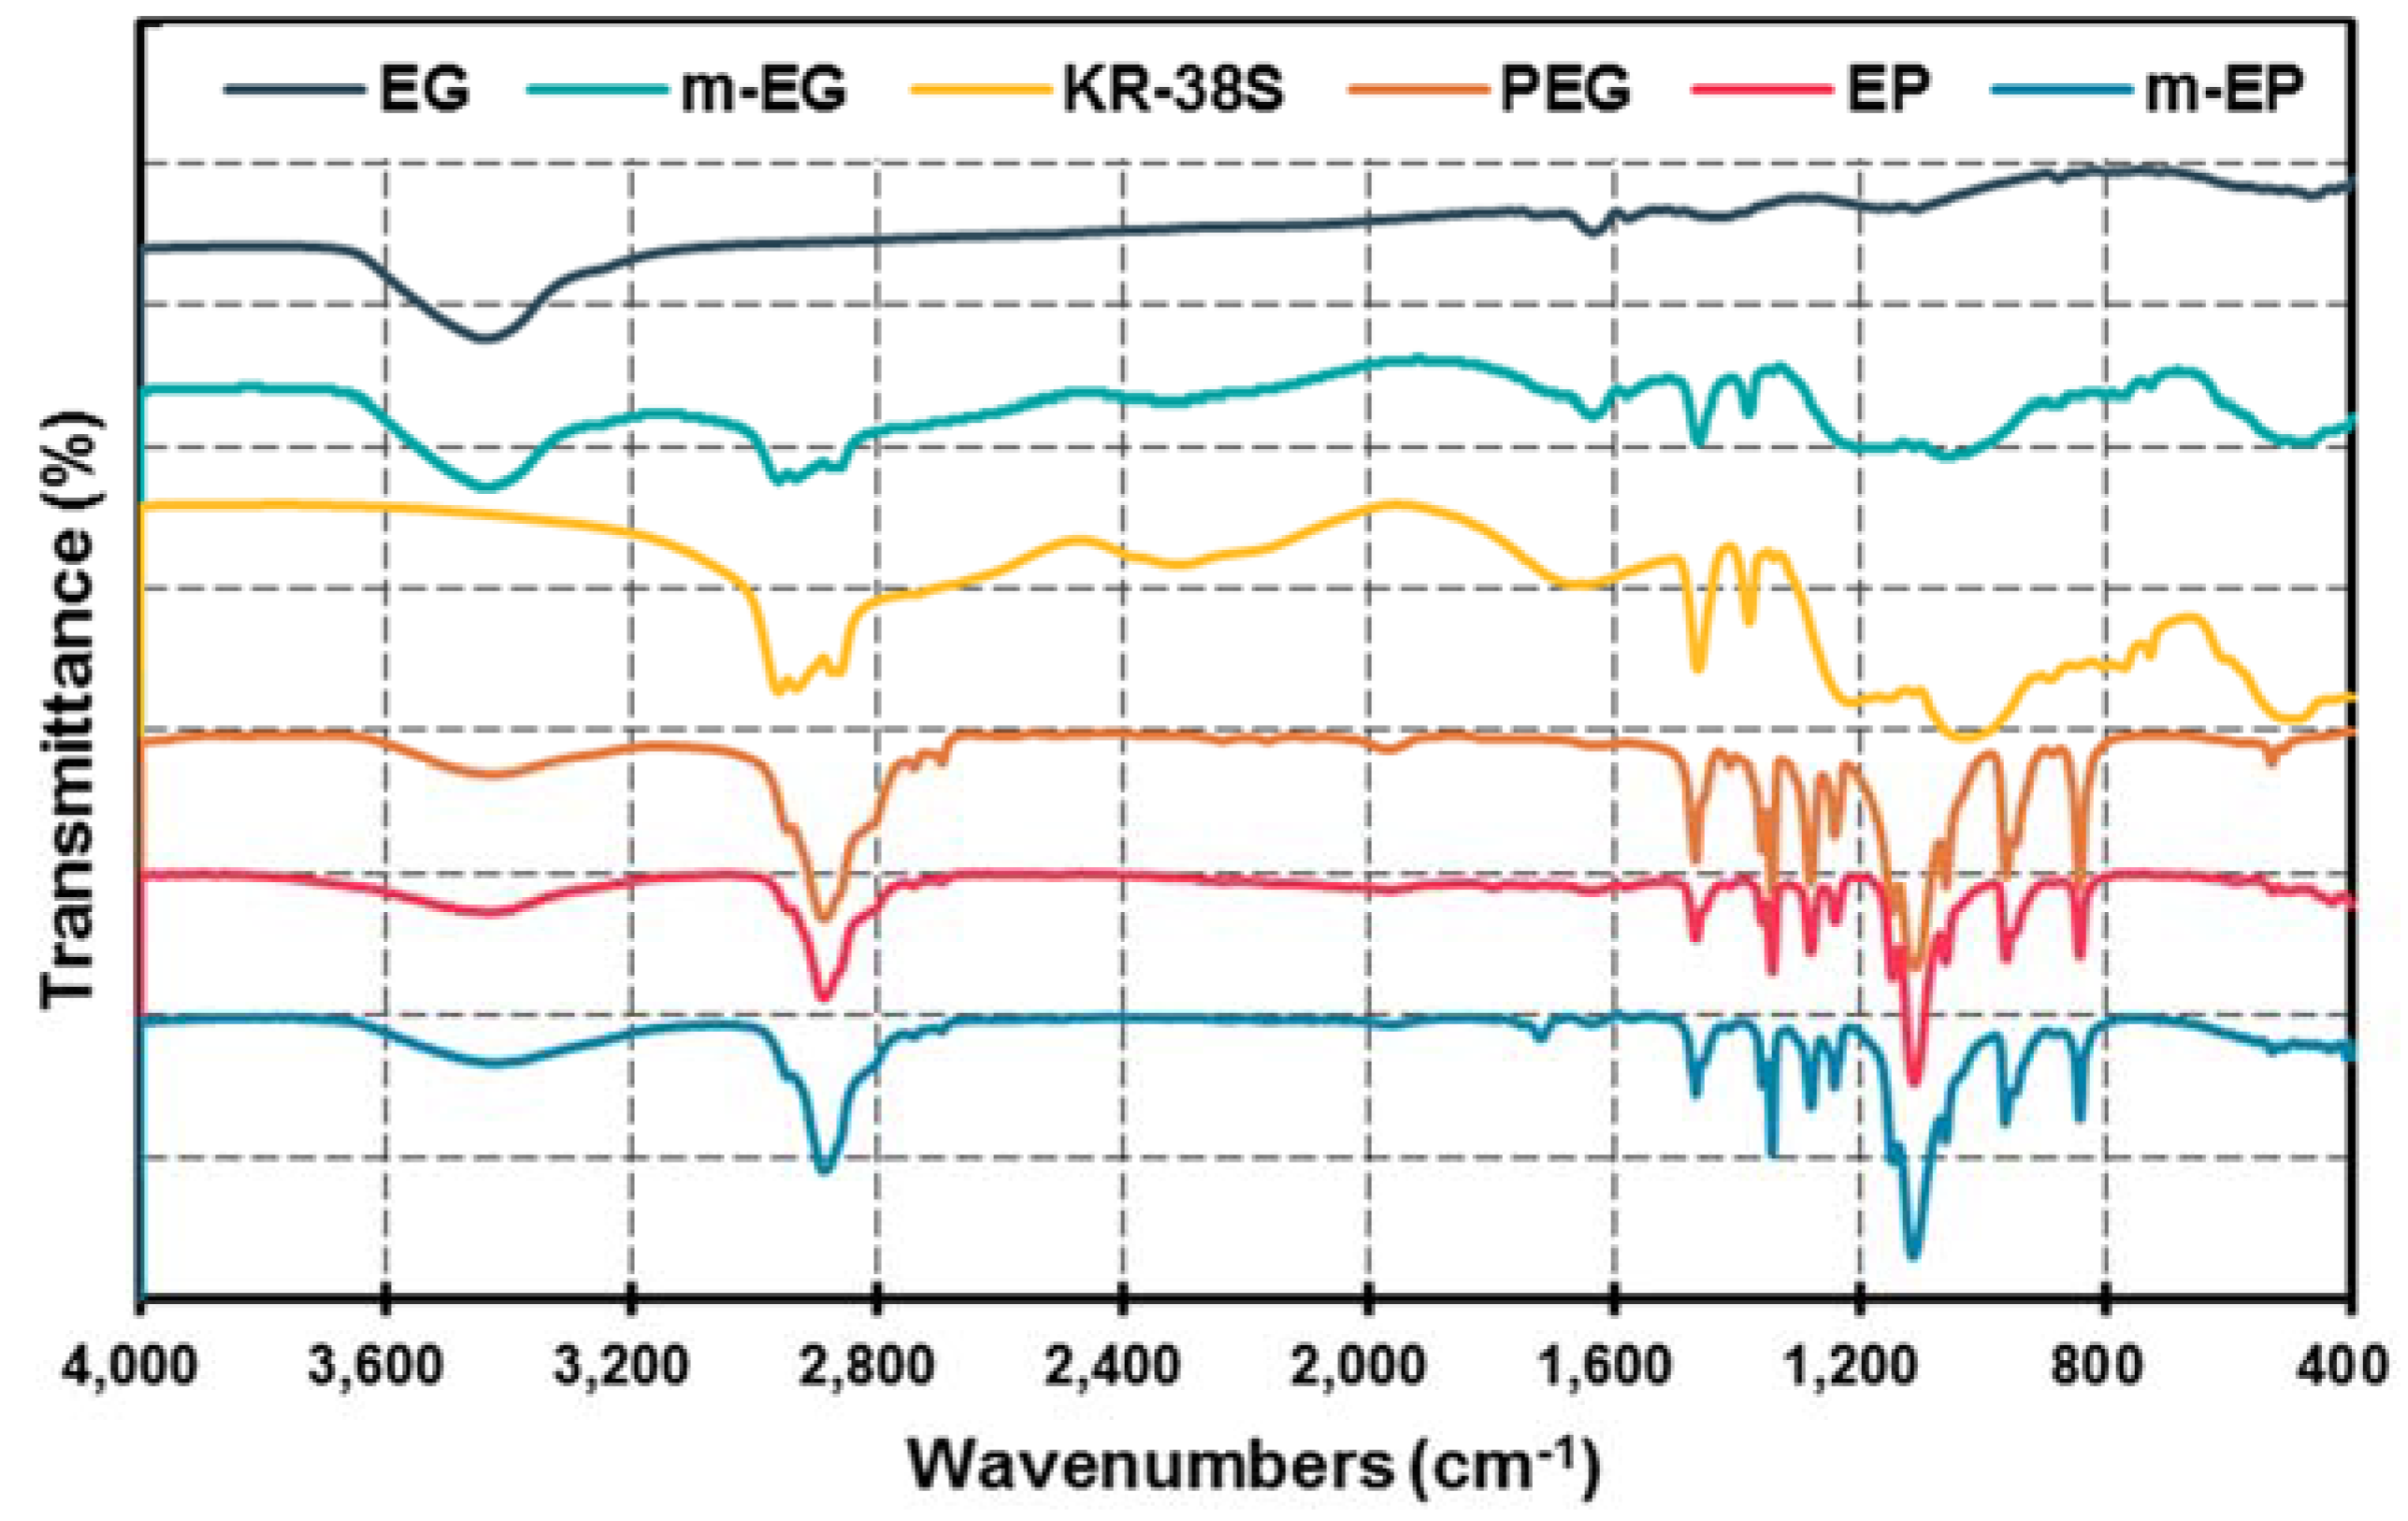
3.1.3. Preparation and Chemical Composition of m-EP
3.2. Thermal Properties of m-EPs
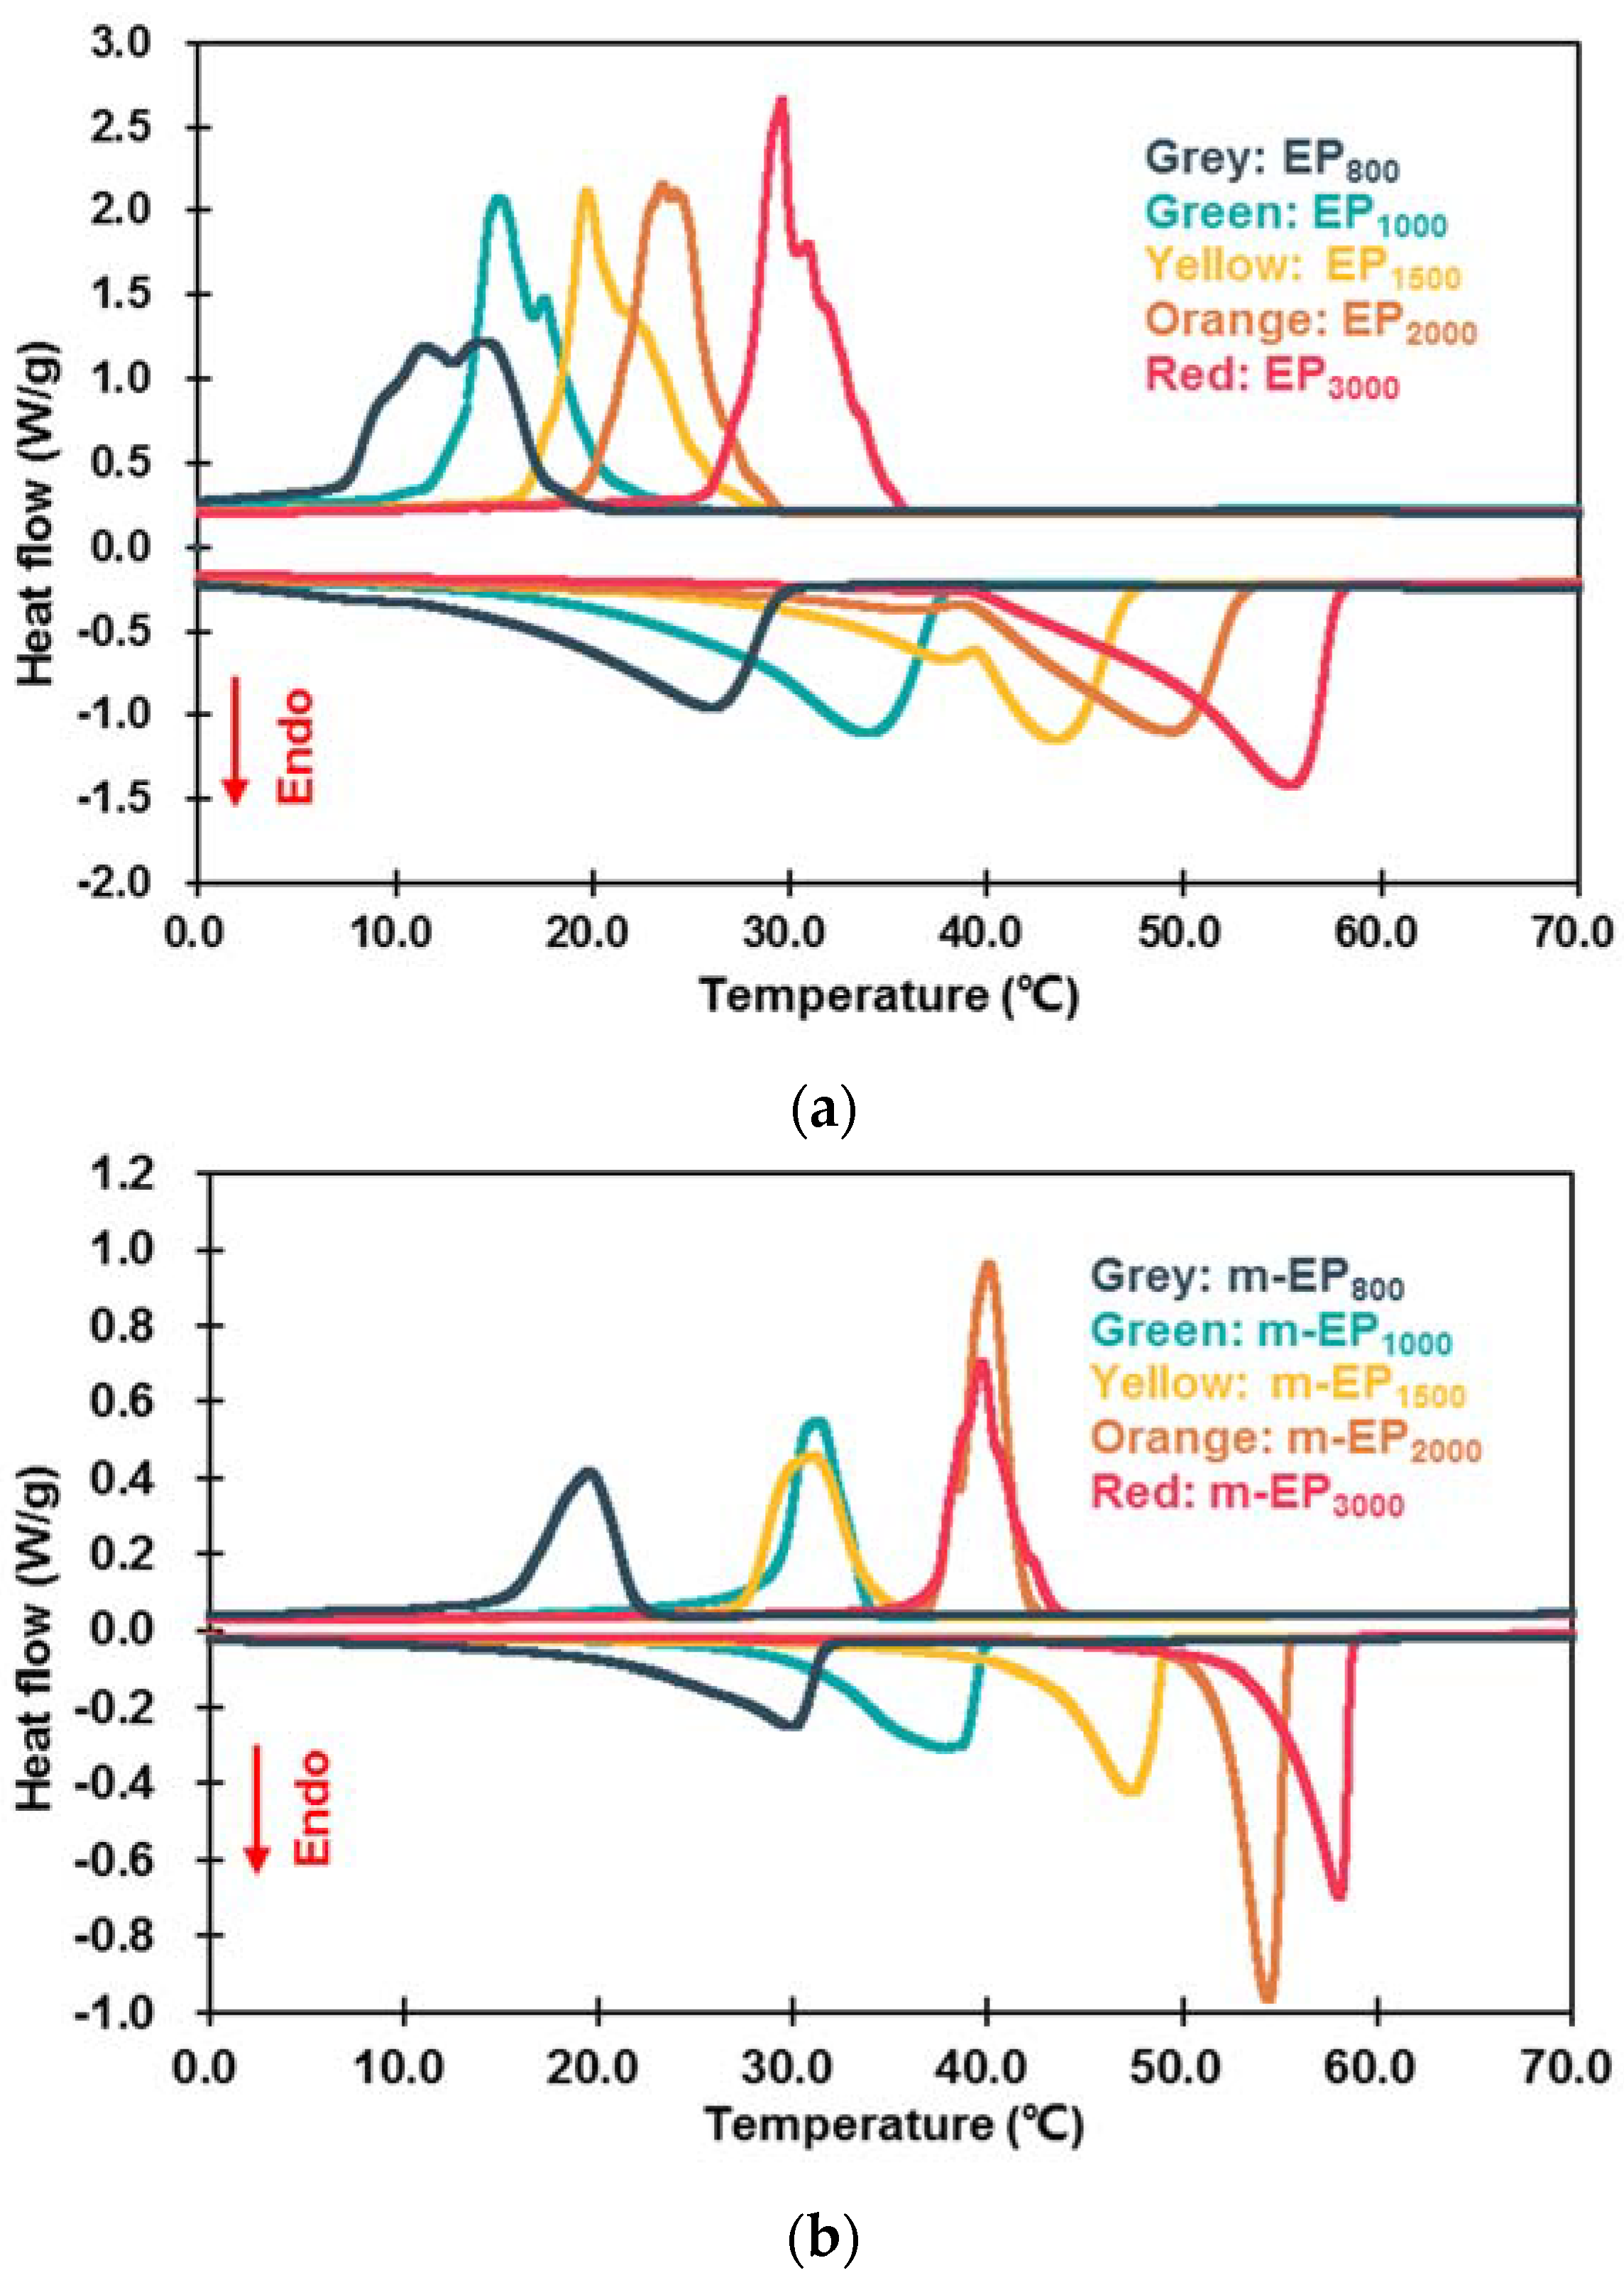
3.2.1. Latent Heat and Phase Change Temperature
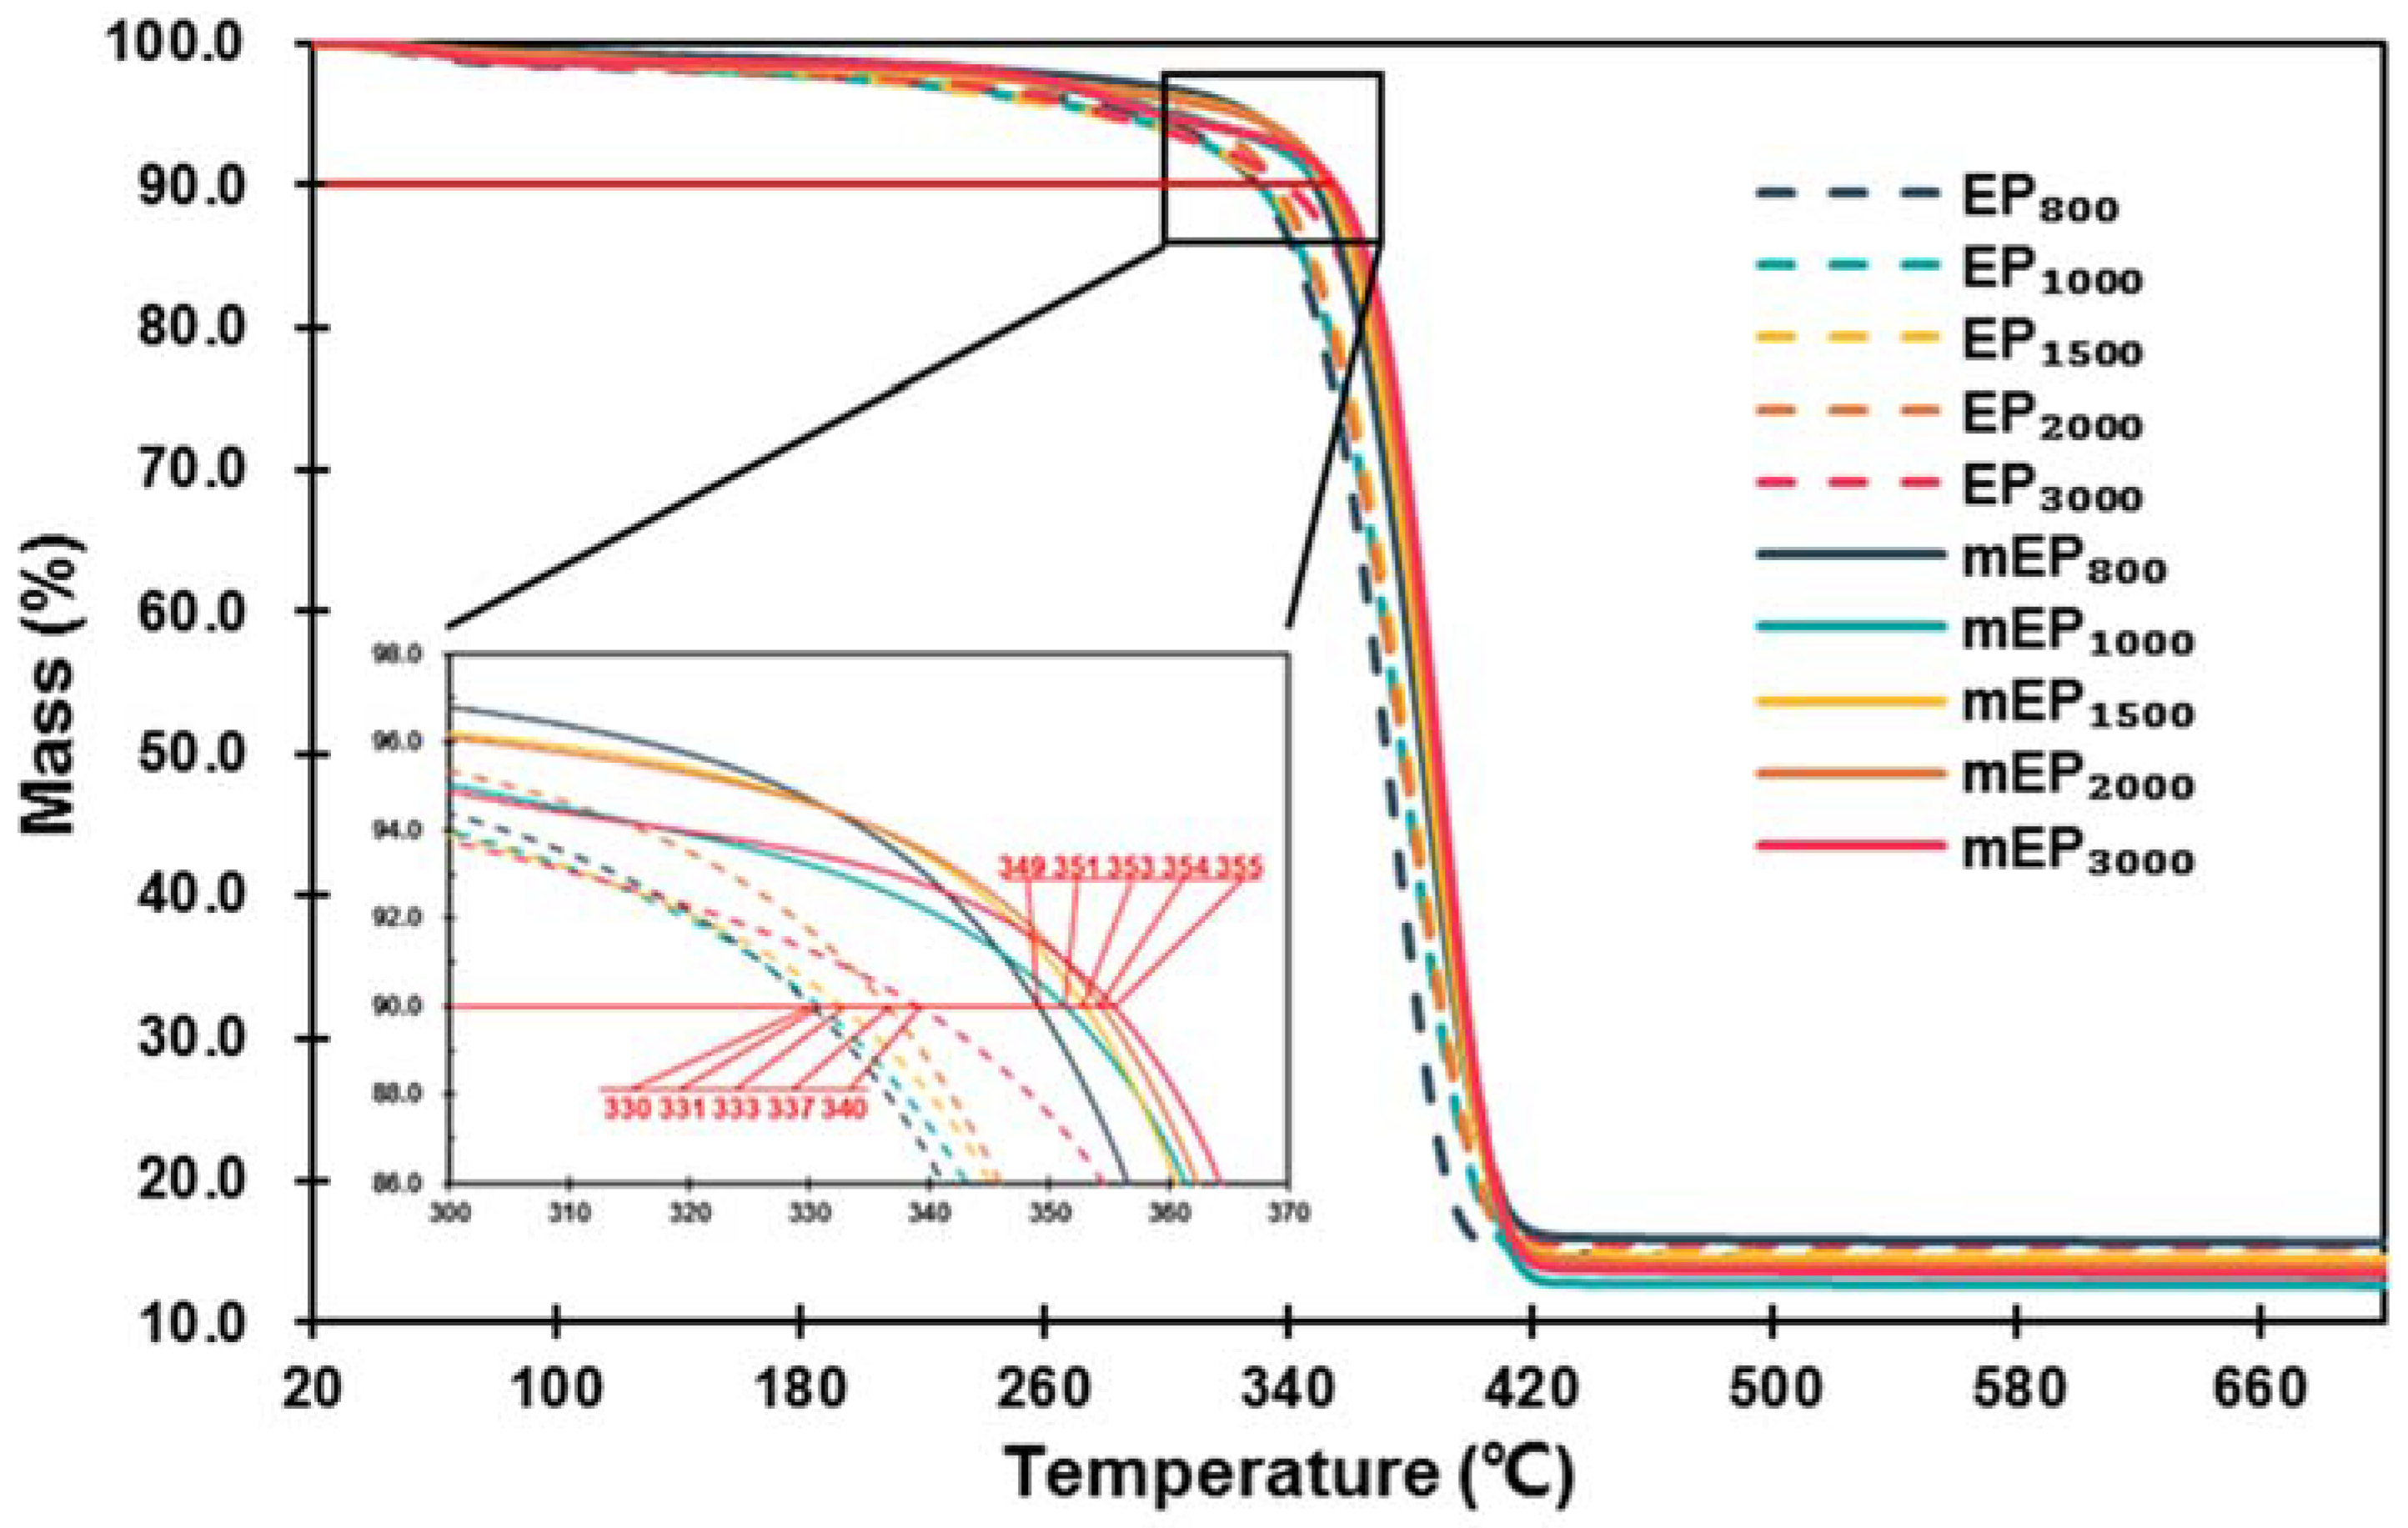
3.2.2. Thermal Stability
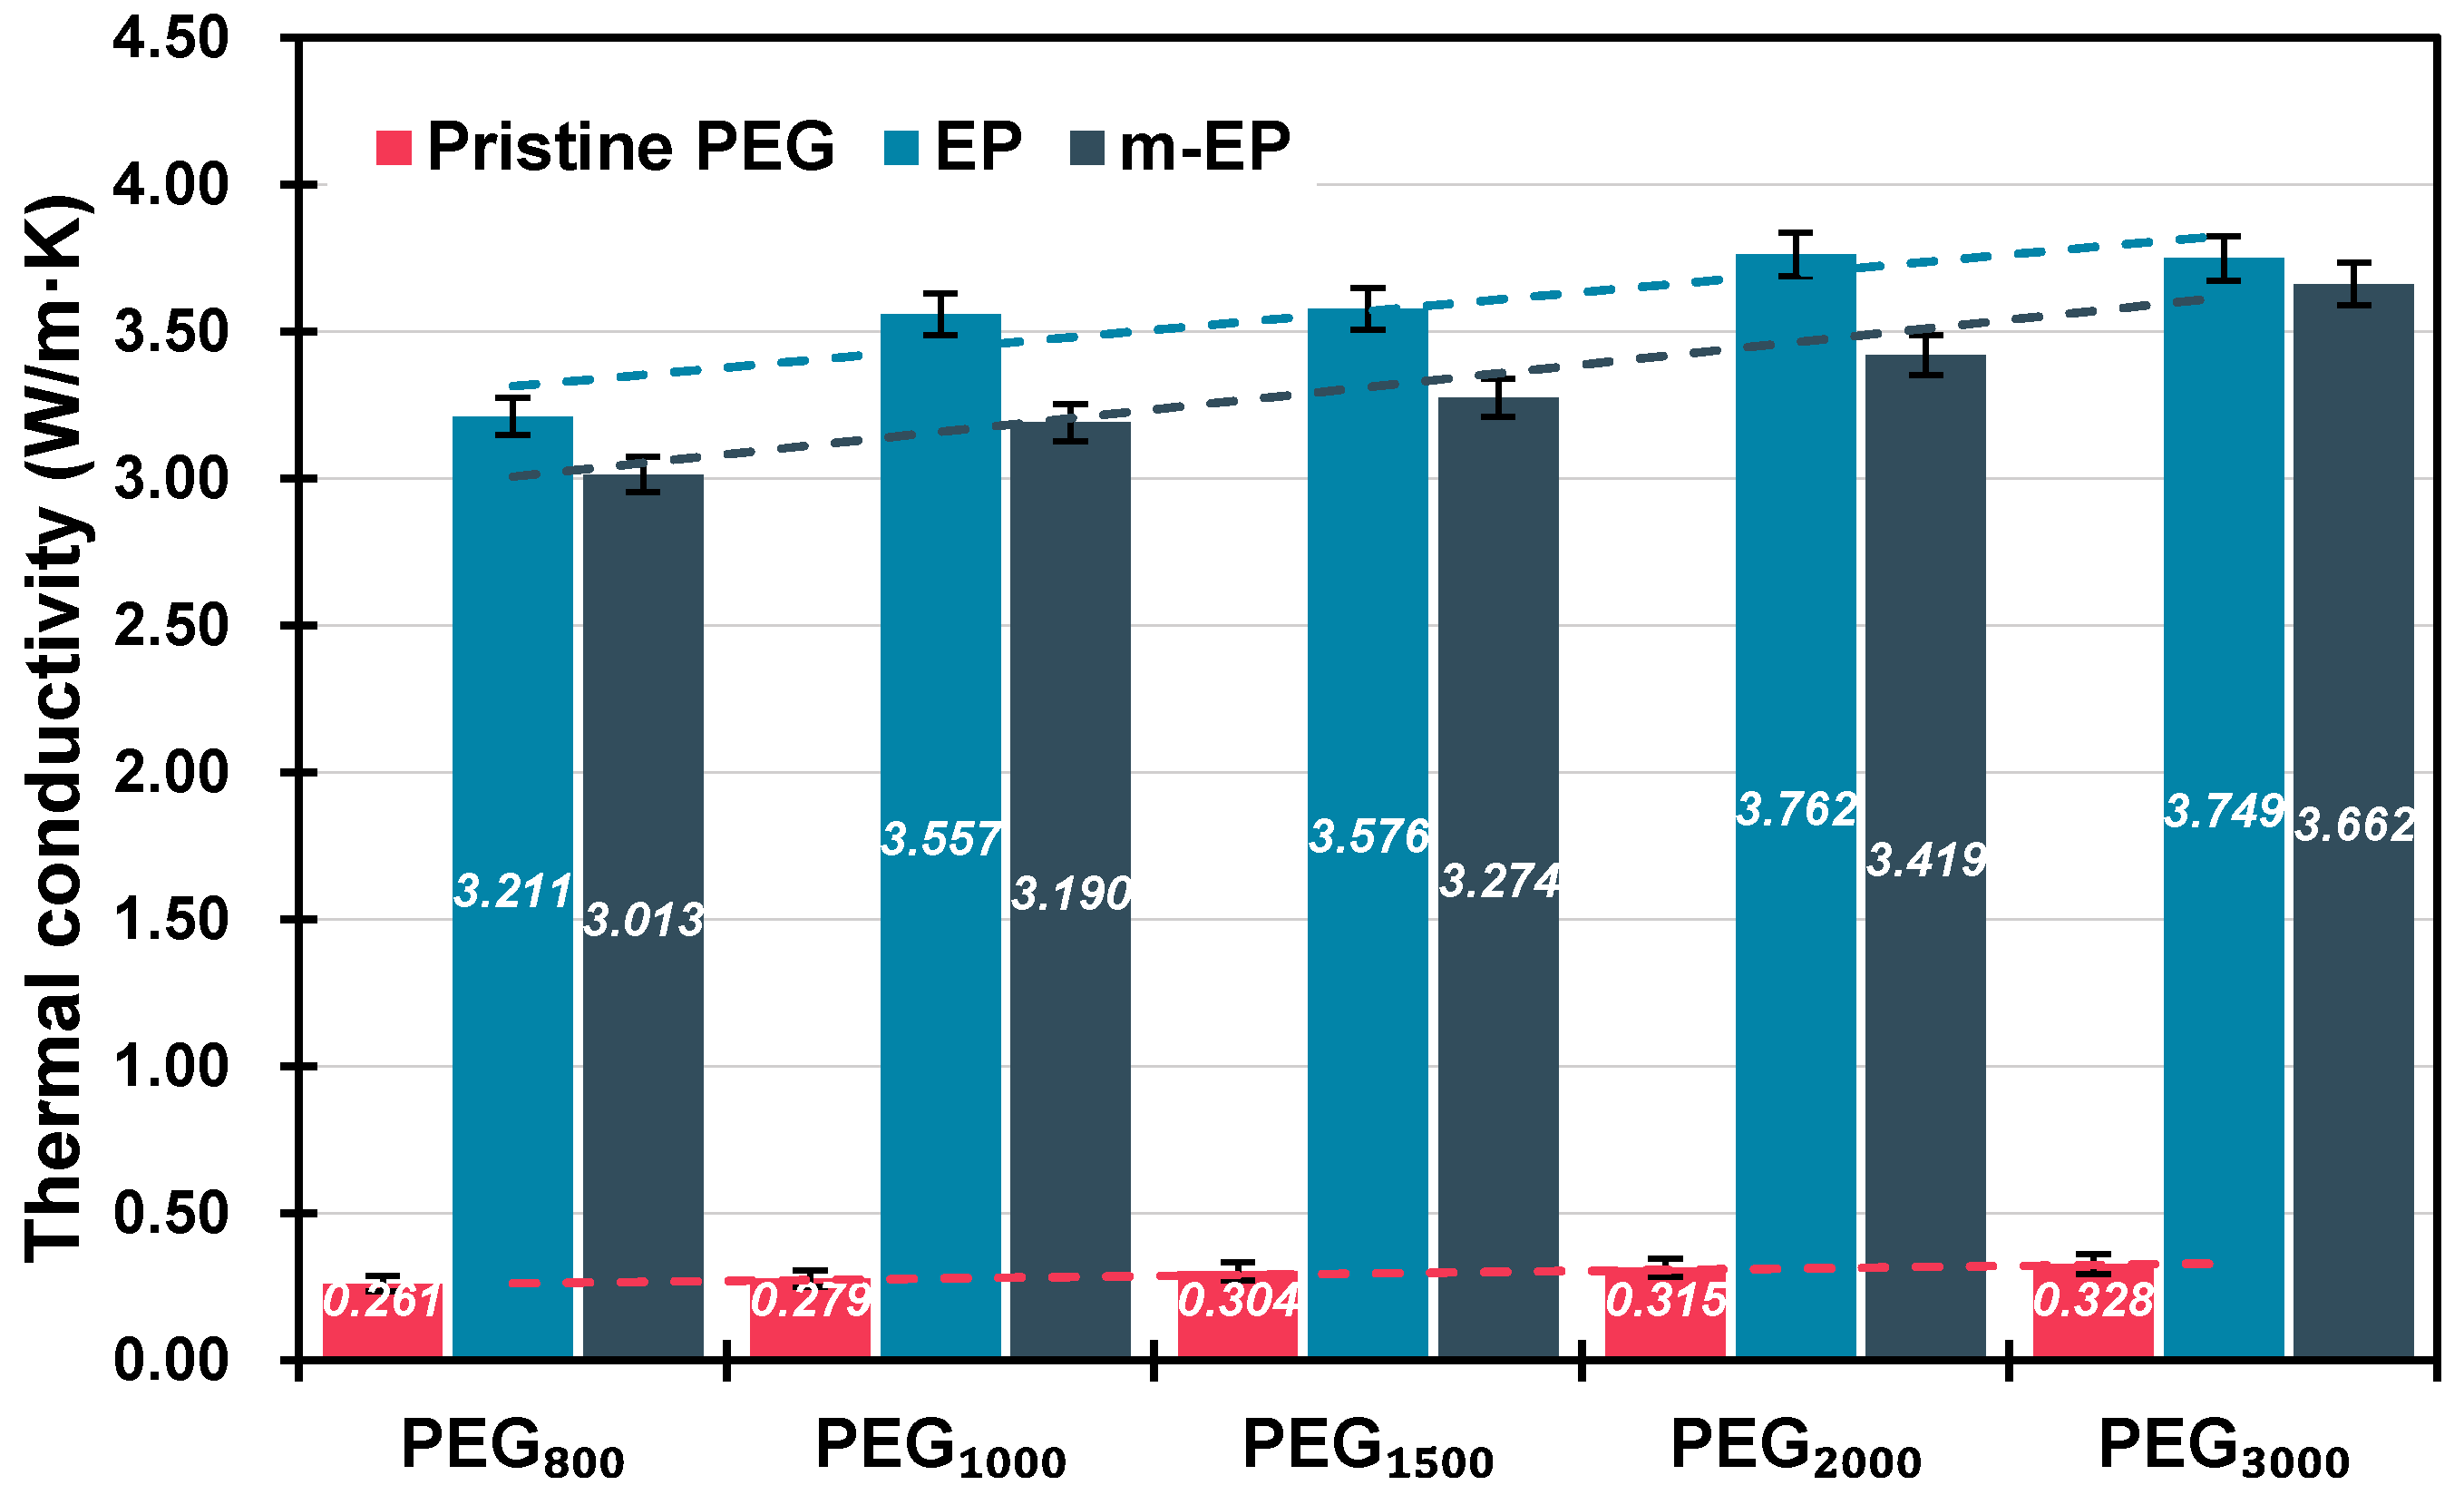
3.2.3. Thermal Conductivity
4. Conclusions
Author Contributions
Funding
Conflicts of Interest
References
- EIA. International Energy Outlook 2017; U.S. Energy Information Administration: Washington, DC, USA, 2017.
- BP. BP Energy Outlook 2017 Edition; BP PLC: London, UK, 2017. [Google Scholar]
- Grimaud, A.; Rougé, L. Polluting non-renewable resources, innovation and growth: Welfare and environmental policy. Resour. Energy Econ. 2005, 27, 109–129. [Google Scholar] [CrossRef]
- Qin, M.; Walton, G.; Belarbi, R.; Allard, F. Simulation of whole building coupled hygrothermal-airflow transfer in different climates. Energy Convers. Manag. 2011, 52, 1470–1478. [Google Scholar] [CrossRef]
- Wang, E.; Kong, X.; Rong, X.; Yao, C.; Yang, H.; Qi, C. A study on a novel phase change material panel based on tetradecanol/lauric acid/expanded perlite/aluminium powder for building heat storage. Materials 2016, 9, 896. [Google Scholar] [CrossRef] [PubMed]
- Šavija, B.; Zhang, H.; Schlangen, E. Influence of microencapsulated phase change material (PCM) addition on (Micro) mechanical properties of cement paste. Materials 2017, 10, e863. [Google Scholar] [CrossRef] [PubMed]
- Ismail, K.A.R.; Castro, J.N.C. PCM thermal insulation in buildings. Int. J. Energy Res. 2015, 21, 1281–1296. [Google Scholar] [CrossRef]
- Sharma, A.; Tyagi, V.V.; Chen, C.R.; Buddhi, D. Review on thermal energy storage with phase change materials and applications. Renew. Sustain. Energy Rev. 2009, 13, 318–345. [Google Scholar] [CrossRef]
- Kuznik, F.; David, D.; Johannes, K.; Roux, J.J. A review on phase change materials integrated in building walls. Renew. Sustain. Energy Rev. 2011, 15, 379–391. [Google Scholar] [CrossRef]
- Akeiber, H.; Nejat, P.; Majid, M.Z.A.; Wahid, M.A.; Jomehzadeh, F.; Famileh, I.Z.; Calautit, J.K.; Hughes, B.R.; Zaki, S.A. A review on phase change material (PCM) for sustainable passive cooling in building envelopes. Renew. Sustain. Energy Rev. 2016, 60, 1470–1497. [Google Scholar] [CrossRef]
- Raj, V.A.A.; Velraj, R. Review on free cooling of buildings using phase change materials. Renew. Sustain. Energy Rev. 2010, 14, 2819–2829. [Google Scholar] [CrossRef]
- Shon, J.; Kim, H.; Lee, K. Improved heat storage rate for an automobile coolant waste heat recovery system using phase-change material in a fin–tube heat exchanger. Appl. Energy 2014, 113, 680–689. [Google Scholar] [CrossRef]
- Li, M. A nano-graphite/paraffin phase change material with high thermal conductivity. Appl. Energy 2013, 106, 25–30. [Google Scholar] [CrossRef]
- Mesalhy, O.; Lafdi, K.; Elgafy, A.; Bowman, K. Numerical study for enhancing the thermal conductivity of phase change material (PCM) storage using high thermal conductivity porous matrix. Energy Convers. Manag. 2005, 46, 847–867. [Google Scholar] [CrossRef]
- Kuznik, F.; Virgone, J.; Johannes, K. In-situ study of thermal comfort enhancement in a renovated building equipped with phase change material wallboard. Renew. Energy 2011, 36, 1458–1462. [Google Scholar] [CrossRef]
- Onder, E.; Sarier, N.; Cimen, E. Encapsulation of phase change materials by complex coacervation to improve thermal performances of woven fabrics. Thermochim. Acta 2008, 467, 63–72. [Google Scholar] [CrossRef]
- Zhang, H.; Wang, X.; Wu, D. Silica encapsulation of n-octadecane via sol–gel process: A novel microencapsulated phase-change material with enhanced thermal conductivity and performance. J. Colloid Interface Sci. 2010, 343, 246–255. [Google Scholar] [CrossRef] [PubMed]
- Ma, B.; Zhou, X.; Liu, J.; You, Z.; Wei, K.; Huang, X. Determination of specific heat capacity on composite shape-stabilized phase change materials and asphalt mixtures by heat exchange system. Materials 2016, 9, 389. [Google Scholar] [CrossRef] [PubMed]
- Yu, J.X.; Liu, T.Q. Preparation and characterization of microencapsulated phase change coating. Appl. Mech. Mater. 2013, 204–208, 4173–4176. [Google Scholar] [CrossRef]
- Zhang, Z.; Fang, X. Study on paraffin/expanded graphite composite phase change thermal energy storage material. Energy Convers. Manag. 2006, 47, 303–310. [Google Scholar] [CrossRef]
- Sarı, A.; Karaipekli, A. Thermal conductivity and latent heat thermal energy storage characteristics of paraffin/expanded graphite composite as phase change material. Appl. Therm. Eng. 2007, 27, 1271–1277. [Google Scholar] [CrossRef]
- Xia, L.; Zhang, P.; Wang, R.Z. Preparation and thermal characterization of expanded graphite/paraffin composite phase change material. Carbon 2010, 48, 2538–2548. [Google Scholar] [CrossRef]
- Zeng, J.L.; Gan, J.; Zhu, F.R.; Yu, S.B.; Xiao, Z.L.; Yan, W.P.; Zhu, L.; Liu, Z.Q.; Sun, L.X.; Cao, Z. Tetradecanol/expanded graphite composite form-stable phase change material for thermal energy storage. Sol. Energy Mater. Sol. Cells 2014, 127, 122–128. [Google Scholar] [CrossRef]
- Wang, S.; Qin, P.; Fang, X.; Zhang, Z.; Wang, S.; Liu, X. A novel sebacic acid/expanded graphite composite phase change material for solar thermal medium-temperature applications. Sol. Energy 2014, 99, 283–290. [Google Scholar] [CrossRef]
- Ling, Z.; Chen, J.; Xu, T.; Fang, X.; Gao, X.; Zhang, Z. Thermal conductivity of an organic phase change material/expanded graphite composite across the phase change temperature range and a novel thermal conductivity model. Energy Convers. Manag. 2015, 102, 202–208. [Google Scholar] [CrossRef]
- Zhang, Z.; Shi, G.; Wang, S.; Fang, X.; Liu, X. Thermal energy storage cement mortar containing n-octadecane/expanded graphite composite phase change material. Renew. Energy 2013, 50, 670–675. [Google Scholar] [CrossRef]
- Li, M.; Wu, Z.; Tan, J. Heat storage properties of the cement mortar incorporated with composite phase change material. Appl. Energy 2013, 103, 393–399. [Google Scholar] [CrossRef]
- He, Y.; Zhang, X.; Zhang, Y.; Song, Q.; Liao, X. Utilization of lauric acid-myristic acid/expanded graphite phase change materials to improve thermal properties of cement mortar. Energy Build. 2016, 133, 547–558. [Google Scholar] [CrossRef]
- Lüth, H. Surfaces and Interfaces of Solids; Springer: Berlin, Germany, 1995. [Google Scholar]
- Shirley, D.A. High-resolution x-ray photoemission spectrum of the valence bands of gold. Phys. Rev. B 1972, 5, 4709–4714. [Google Scholar] [CrossRef]
- Xia, L.; Zhang, P. Thermal property measurement and heat transfer analysis of acetamide and acetamide/expanded graphite composite phase change material for solar heat storage. Sol. Energy Mater. Sol. Cells 2011, 95, 2246–2254. [Google Scholar] [CrossRef]


| Categories | Mr | Tonset-m (°C) | Tonset-c (°C) | ΔT (°C) | ΔHm (J/g) | ΔHc (J/g) | λ (W/m·K) |
|---|---|---|---|---|---|---|---|
| PEG800 | 800 | 21.79 | 23.56 | −1.77 | 143.51 | 126.63 | 0.2606 |
| PEG1000 | 1000 | 27.92 | 30.74 | −2.82 | 163.10 | 152.08 | 0.2790 |
| PEG1500 | 1500 | 43.36 | 31.04 | 12.32 | 170.34 | 159.24 | 0.3038 |
| PEG2000 | 2000 | 50.38 | 40.76 | 9.62 | 187.24 | 171.87 | 0.3151 |
| PEG3000 | 3000 | 55.15 | 43.24 | 11.91 | 186.50 | 160.86 | 0.3281 |
| Categories | Average Particle Size (μm) | Specific Surface Area (m2/g) | Pore Volume (cm3/g) | Average Pore Radius (μm) |
|---|---|---|---|---|
| EG45 | 45 | 52.1099 | 1.4110 | 0.2101 |
| EG75 | 75 | 45.7174 | 3.2946 | 0.2584 |
| EG125 | 125 | 41.5314 | 7.1265 | 0.3152 |
| EG180 | 180 | 40.1269 | 7.7437 | 0.3273 |
| EG300 | 300 | 32.9647 | 9.2215 | 0.3439 |
| Categories | Specific Surface Area (m2/g) | Pore Volume (cm3/g) | Average Pore Radius (μm) | Maximum Mass Ratio of EG to PEG |
|---|---|---|---|---|
| EG45 | 21.5468 | 0.0954 | 0.0109 | 1:4 |
| EG75 | 24.3368 | 0.1089 | 0.0142 | 1:4 |
| EG125 | 17.6056 | 0.1354 | 0.0379 | 1:7 |
| EG180 | 15.3005 | 0.2025 | 0.0326 | 1:7 |
| EG300 | 14.5487 | 0.2944 | 0.0335 | 1:8 |
| Categories | Before Absorption | After Absorption |
|---|---|---|
| EG45 |  | 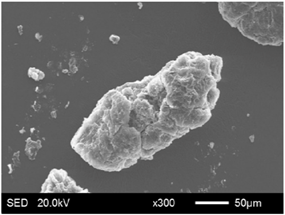 |
| EG75 |  | 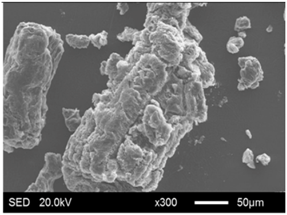 |
| EG125 | 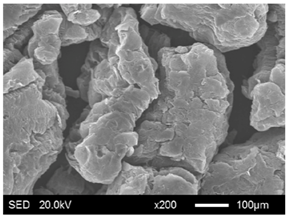 |  |
| EG180 | 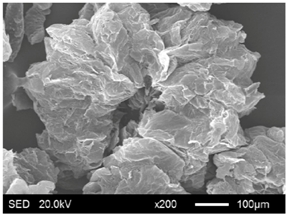 | 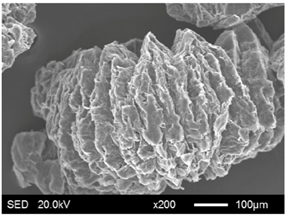 |
| EG300 |  | 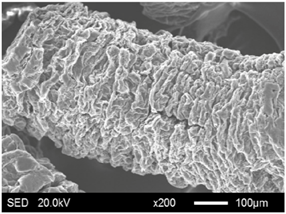 |
| Categories | Tonset-m (°C) | Tonset-c (°C) | ΔT (°C) | ΔHm (J/g) | ΔHc (J/g) | ηm (%) | ηc (%) |
|---|---|---|---|---|---|---|---|
| EP800 | 14.30 | 17.53 | −3.23 | 89.50 | 80.61 | 71.27 | 72.75 |
| EP1000 | 23.96 | 18.49 | 5.47 | 108.22 | 101.92 | 75.83 | 76.59 |
| EP1500 | 37.67 | 22.36 | 15.31 | 104.13 | 104.56 | 69.86 | 75.04 |
| EP2000 | 39.29 | 26.36 | 12.93 | 110.40 | 107.01 | 67.38 | 71.16 |
| EP3000 | 45.98 | 30.63 | 15.35 | 120.50 | 113.56 | 73.84 | 80.68 |
| m-EP800 | 22.64 | 21.90 | 0.74 | 97.66 | 92.91 | 77.77 | 83.85 |
| m-EP1000 | 30.18 | 33.64 | −3.46 | 121.89 | 116.80 | 85.41 | 87.77 |
| m-EP1500 | 42.67 | 33.93 | 8.74 | 122.94 | 114.88 | 82.48 | 82.45 |
| m-EP2000 | 51.95 | 41.66 | 10.29 | 143.79 | 137.53 | 87.77 | 91.45 |
| m-EP3000 | 54.63 | 41.27 | 13.36 | 141.60 | 124.12 | 86.77 | 88.18 |
© 2018 by the authors. Licensee MDPI, Basel, Switzerland. This article is an open access article distributed under the terms and conditions of the Creative Commons Attribution (CC BY) license (http://creativecommons.org/licenses/by/4.0/).
Share and Cite
Zhang, D.; Chen, M.; Liu, Q.; Wan, J.; Hu, J. Preparation and Thermal Properties of Molecular-Bridged Expanded Graphite/Polyethylene Glycol Composite Phase Change Materials for Building Energy Conservation. Materials 2018, 11, 818. https://doi.org/10.3390/ma11050818
Zhang D, Chen M, Liu Q, Wan J, Hu J. Preparation and Thermal Properties of Molecular-Bridged Expanded Graphite/Polyethylene Glycol Composite Phase Change Materials for Building Energy Conservation. Materials. 2018; 11(5):818. https://doi.org/10.3390/ma11050818
Chicago/Turabian StyleZhang, Dong, Meizhu Chen, Quantao Liu, Jiuming Wan, and Jinxuan Hu. 2018. "Preparation and Thermal Properties of Molecular-Bridged Expanded Graphite/Polyethylene Glycol Composite Phase Change Materials for Building Energy Conservation" Materials 11, no. 5: 818. https://doi.org/10.3390/ma11050818
APA StyleZhang, D., Chen, M., Liu, Q., Wan, J., & Hu, J. (2018). Preparation and Thermal Properties of Molecular-Bridged Expanded Graphite/Polyethylene Glycol Composite Phase Change Materials for Building Energy Conservation. Materials, 11(5), 818. https://doi.org/10.3390/ma11050818