Properties of Basil and Lavender Essential Oils Adsorbed on the Surface of Hydroxyapatite


 ,
, 
Abstract
1. Introduction
2. Materials and Methods
3. Results and Discussion
4. Conclusions
Acknowledgments
Author Contributions
Conflicts of Interest
References
- Predoi, D.; Predoi, M.V.; Iconaru, S.L.; El Kettani, M.E.C.; Leduc, D.; Prodan, A.M. Ultrasonic Measurements on β Cyclodextrin/Hydroxyapatite Composites for Potential Water Depollution. Materials 2017, 10, 681. [Google Scholar] [CrossRef] [PubMed]
- Iconaru, S.L.; Prodan, A.M.; Buton, N.; Predoi, D. Structural Characterization and Antifungal Studies of Zinc-Doped Hydroxyapatite Coatings. Molecules 2017, 22, 604. [Google Scholar] [CrossRef] [PubMed]
- Hui, L.; He, L.; Huan, L.; Xiao, L.; Zhou, L.; Guo, A. Chemical composition of lavender essential oil and its antioxidant activity and inhibition against rhinitisrelated bacteria. Afr. J. Microbiol. Res. 2010, 4, 309–313. [Google Scholar]
- Predoi, M.V. Guided waves dispersion equations for orthotropic multilayered pipes solved using standard finite elements code. Ultrasonics 2014, 54, 1825–1831. [Google Scholar] [CrossRef] [PubMed]
- Stoica, P.; Chifiriuc, M.C.; Rapa, M.; Bleotu, C.; Lungu, L.; Vlad, G.; Grigore, R.; Bertesteanu, S.; Stavropoulou, E.; Lazar, V. Fabrication, characterization and bioevaluation of novel antimicrobial composites based on polycaprolactone, chitosan and essential oils. Rom. Biotechnol. Lett. 2015, 20, 10521–10535. [Google Scholar]
- Samfira, I.; Rodino, S.; Petrache, P.; Cristina, R.T.; Butu, M.; Butnariu, M. Characterization and identity confirmation of essential oils by mid infrared absorbtion spectrophometry. Dig. J. Nanomater. Biostruct. 2015, 10, 557–566. [Google Scholar]
- Chouhan, S.; Sharma, K.; Guleria, S. Antimicrobial Activity of Some Essential Oils—Present Status and Future Perspectives. Medicines 2017, 4, 58. [Google Scholar] [CrossRef] [PubMed]
- Swamy, M.K.; Akhtar, M.S.; Sinniah, U.R. Antimicrobial Properties of Plant Essential Oils against Human Pathogens and Their Mode of Action: An Updated Review. Evid.-Based Complement. Altern. Med. 2016, 2016, 3012462. [Google Scholar] [CrossRef] [PubMed]
- Ciobanu, C.S.; Constantin, L.V.; Predoi, D. Structural and physical properties of antibacterial Ag-doped nano-hydroxyapatite synthesized at 100 °C. Nanoscale Res. Lett. 2011, 6, 613. [Google Scholar] [CrossRef] [PubMed]
- Rasband, W. Available online: http://imagej.nih.gov/ij (accessed on 10 January 2018).
- Barrett, E.P.; Joyner, L.G.; Halenda, P.P. The determination of pore volume and area distributions in porous substances. I. computations from nitrogen isotherms. J. Am. Chem. Soc. 1951, 73, 373–380. [Google Scholar] [CrossRef]
- Brunauer, S.; Emmet, P.H.; Teller, E. Adsorption of gases in multimolecular layers. J. Am. Chem. Soc. 1938, 60, 309–319. [Google Scholar] [CrossRef]
- Groza, A.; Surmeian, A. Characterization of the oxides present in a polydimethylsiloxane layer obtained by polymerisation of its liquid precursor in corona discharge. J. Nanomater. 2015, 2015, 204296. [Google Scholar] [CrossRef]
- Butoi, B.; Groza, A.; Dinca, P.; Balan, A.; Barna, V. Morphological and Structural Analysis of Polyaniline and Poly(O-anisidine) Layers Generated in a DC Glow Discharge Plasma by Using an Oblique Angle Electrode Deposition Configuration. Polymers 2017, 9, 732. [Google Scholar] [CrossRef]
- Clinical and Laboratory Standards Institute. Methods for Dilution Antimicrobial Susceptibility Tests for Bacteria That Grow Aerobically, Approved Standard, 9th ed.; CLSI: San Diego, CA, USA, 2012. [Google Scholar]
- Clinical and Laboratory Standards Institute (CLSI). Performance Standard for Antimicrobial Susceptibility Testing; Twenty Second Informational Supplement M100; CLSI: San Diego, CA, USA, 2014. [Google Scholar]
- Limban, C.; Chifiriuc, M.C. Antibacterial Activity of New Dibenzoxepinone Oximes with Fluorine and 663 Trifluoromethyl Group Substituents. Int. J. Mol. Sci. 2011, 12, 6432–6444. [Google Scholar] [CrossRef] [PubMed]
- Limban, C.; Marutescu, L.; Chifiriuc, M.C. Synthesis, Spectroscopic Properties and Antipathogenic Activity 665 of New Thiourea Derivatives. Molecules 2011, 16, 7593–7607. [Google Scholar] [CrossRef] [PubMed]
- Chifiriuc, M.C.; Palade, R.; Israil, A.M. Comparative analysis of disk diffusion and liquid medium 667 microdillution methods fortesting the antibiotic susceptibility patterns of anaerobic bacterial strains 668 isolated from intrabdominal infections. Biointerface Res. Appl. Chem. 2011, 1, 209–220. [Google Scholar]
- Iconaru, S.L.; Motelica-Heino, M.; Predoi, D. Study on Europium Doped Hydroxyapatite Nanoparticles by Fourier Transform Infrared Spectroscopy and Their Antimicrobial properties. J. Spectrosc. 2013, 2013, 284285. [Google Scholar] [CrossRef]
- Popa, C.L.; Groza, A.; Chapon, P.; Ciobanu, C.S.; Ghita, R.V.; Trusca, R.; Ganciu, M.; Predoi, D. Physicochemical Analysis of the Polydimethylsiloxane Interlayer Influence on a Hydroxyapatite Doped with Silver Coating. J. Nanomater. 2015, 2015, 250617. [Google Scholar] [CrossRef]
- Coates, J. Interpretation of Infrared Spectra, A Practical Approach, Encyclopedia of Analytical Chemistry; Meyers, R.A., Ed.; John Wiley & Sons Ltd.: Chichester, UK, 2000; pp. 10815–10837. [Google Scholar]
- Lafhal, S.; Vanloot, P.; Bombarda, I.; Kister, J.; Dupuy, N. Identification of metabolomic markers of lavender and lavandin essential oils using mid-infrared spectroscopy. Vib. Spectrosc. 2016, 85, 79–90. [Google Scholar] [CrossRef]
- Balasubramaian, K.; Kodam, K.M. Encapsulation of therapeutic lavender oil in an electrolyte assisted polyacrylonitrilenanofibres for antibacterial applications. RSC Adv. 2014, 4, 54892–54901. [Google Scholar] [CrossRef]
- Theophile, T. Infrared Spectroscopy—Materials Science, Engineering and Technology; InTech: London, UK, 2012; ISBN 978-953-51-0537-4. [Google Scholar]
- Available online: https://www.sigmaaldrich.com/catalog/product/aldrich/w212000?lang=en®ion=RO (accessed on 23 March 2018).
- Available online: https://www.sigmaaldrich.com/catalog/product/aldrich/61718?lang=en®ion=RO (accessed on 23 March 2018).
- Available online: https://www.sigmaaldrich.com/technical-documents/articles/analytical applications/gc/gc-analysis-of-lavender-flower-essential-oil-g006356.html (accessed on 23 March 2018).
- Herman, A.; Tambor, K.; Herman, A. Linalool Affects the Antimicrobial Efficacy of Essential Oils. Curr. Microbiol. 2016, 72, 165–172. [Google Scholar] [CrossRef] [PubMed]
- García-García, R.; López-Malo, A.; Palou, E. Bactericidal action of binary and ternary mixtures of carvacrol, thymol, and eugenol against Listeria innocua. J. Food Sci. 2011, 76, M95–M100. [Google Scholar] [CrossRef] [PubMed]
- Bassolé, I.H.N.; Lamien-Meda, A.; Bayala, B.; Tirogo, S.; Franz, C.; Novak, J.; Nebié, R.C.; Dicko, M.H. Composition and antimicrobial activities of Lippia multi-flora Moldenke, Mentha piperita L. and Ocimum basilicum L. essential oils and their major monoterpene alcohols alone and in combination. Molecules 2010, 15, 7825–7839. [Google Scholar] [CrossRef] [PubMed]
- Hammer, K.A.; Carson, C.F. Antibacterial and antifungal activities of essential oils. In Lipids and Essential Oils as Antimicrobial Agents; Thormar, H., Ed.; John Wiley & Sons: London, UK, 2011; pp. 255–306. [Google Scholar]
- Raut, J.S.; Karuppayil, S.M. A status review on the medicinal properties of essential oils. Ind. Crops Prod. 2014, 62, 250–264. [Google Scholar] [CrossRef]
- Conner. Naturally occurring compounds. In Antimicrobials in Foods; Davidison, P.M., Branen, A.L., Eds.; Marcel Dekker: New York, NY, USA, 1993; pp. 441–468. [Google Scholar]
- Aleksic, V.; Knezevic, P. Antimicrobial and antioxidative activity of extracts and essential oils of Myrtus communis L. Microbiol. Res. 2014, 169, 240–254. [Google Scholar] [CrossRef] [PubMed]
- Zanetti, S.; Cannas, S.; Molicotti, P. Evaluation of the antimicrobial properties of the essential oil of Myrtus communis L. against clinical strains of Mycobacterium spp. Interdiscip. Perspect. Infect. Dis. 2010, 2010, 931530. [Google Scholar] [CrossRef] [PubMed]
- Kadhim, M.J.; Sosa, A.A.; Hameed, I.H. Evaluation of anti-bacterial activity and bioactive chemical analysis of Ocimum basilicum using Fourier transform infrared (FT-IR) and gas chromatography-mass spectrometry (GC-MS) techniques. J. Pharmacogn. Phytochem. 2016, 8, 127–146. [Google Scholar]
- Cavanagh, H.M.A.; Wilkinson, J.M. Biological activities of Lavender essential oil. Phytother. Res. 2002, 16, 301–308. [Google Scholar] [CrossRef] [PubMed]
- Inouye, S.; Takizawa, T.; Yamaguchi, H. Antibacterial activity of essential oils and their major constituents against respiratory tract pathogens by gaseous contact. J. Antimicrob. Chemother. 2001, 47, 565–573. [Google Scholar] [CrossRef] [PubMed]
- Nelson, R.R. In vitro activity of five plant essential oils against methicillin resistant Staphylococcus aureus and vancomycin resistant Enterococcus faecium. J. Antimicrob. Chemother. 1997, 40, 305–306. [Google Scholar] [CrossRef] [PubMed]
- Sienkiewicz, M.; Łysakowska, M.; Pastuszka, M.; Bienias, W.; Kowalczyk, E. The Potential of Use Basil and Rosemary Essential Oils as Effective Antibacterial Agents. Molecules 2013, 18, 9334–9351. [Google Scholar] [CrossRef] [PubMed]
- Khan, A.W.; Hossain, S.J.; Uddin, S.N. Isolation, identification and determination of antibiotic susceptibility of Vibrio parahaemolyticus from Shrimp at Khulna Region of Bangladesh. Res. J. Microbiol. 2007, 2, 216–227. [Google Scholar]
- Trzcinski, K.; Cooper, B.S.; Hryniewicz, W.; Dowson, C.G. Expression of resistance to tetracyclines in strains of methicillin-resistant Staphylococus aures. J. Antimicrob. Chemother. 2000, 45, 763–770. [Google Scholar] [CrossRef] [PubMed]
- Elgayyar, M.; Draughon, F.A.; Golden, D.A.; Mount, J.R. Antimicrobial Activity of Essential Oils from Plants against Selected Pathogenic and Saprophytic Microorganisms. J. Food Prot. 2001, 64, 1019–1024. [Google Scholar] [CrossRef] [PubMed]
- Shiferaw, S.; Ahmad, M. Prevalence and antibiotic susceptibility of Staphylococcus aureus from lactating cow’s milk in Bahir Dar dairy farms. Afr. J. Microbiol. Res. 2016, 10, 1444–1454. [Google Scholar]
- Mahmoud, A.H.; Samy, M.N.; Abdelmohsen, U.R.; Abd El-Baky, R.M. Effect of tobacco tar on Staphylococcus aureus and Candida albicans biofilm formation. Afr. J. Microbiol. Res. 2000, 11, 372–384. [Google Scholar]
- Tripathi, K.D. Essentials of Medical Pharmacology, 7th ed.; Jaypee Brothers Medical Publishers: New Delhi, India, 2013; pp. 696–697. [Google Scholar]
- Taylor, P.C.; Schoenknecht, F.D.; Sherris, J.C.; Linner, E.C. Determination of minimum bactericidal concentrations of oxacillin for Staphylococcus aureus: Influence and significance of technical factors. Antimicrob. Agents Chemother. 1983, 23, 142–150. [Google Scholar] [CrossRef] [PubMed]
- Pankey, G.A.; Sabath, L.D. Clinical relevance of bacteriostatic versus bactericidal mechanisms of action in the treatment of Gram positive bacterial infections. Clin. Infect. Dis. 2004, 38, 864–870. [Google Scholar] [CrossRef] [PubMed]
- Lamb, H.M.; Figgitt, D.P.; Faulds, D. Quinupristin/dalfopristin: A review of its use in the management of serious gram-positive infections. Drugs 1999, 58, 1061–1097. [Google Scholar] [CrossRef] [PubMed]
- Bär, W.; Bäde-Schumann, U.; Krebs, A.; Cromme, L. Rapid method for detection of minimal bactericidal concentration of antibiotics. J. Microbiol. Methods 2009, 77, 85–89. [Google Scholar] [CrossRef] [PubMed]


| Sample | SBET (m2/g) | VP (cm3/g) | DP (nm) |
|---|---|---|---|
| HAp | 98.45 | 0.38 | 17.48 |
| HAp-B | 110.57 | 0.47 | 18.49 |
| HAp-L | 135.38 | 0.62 | 13.35 |
| HApIR Band Wave Number | IR Band Assignment | HAp-B IR Band Wave Number | IR Band Assignment | HAp-L IR Band Wave Number | IR Band Assignment |
|---|---|---|---|---|---|
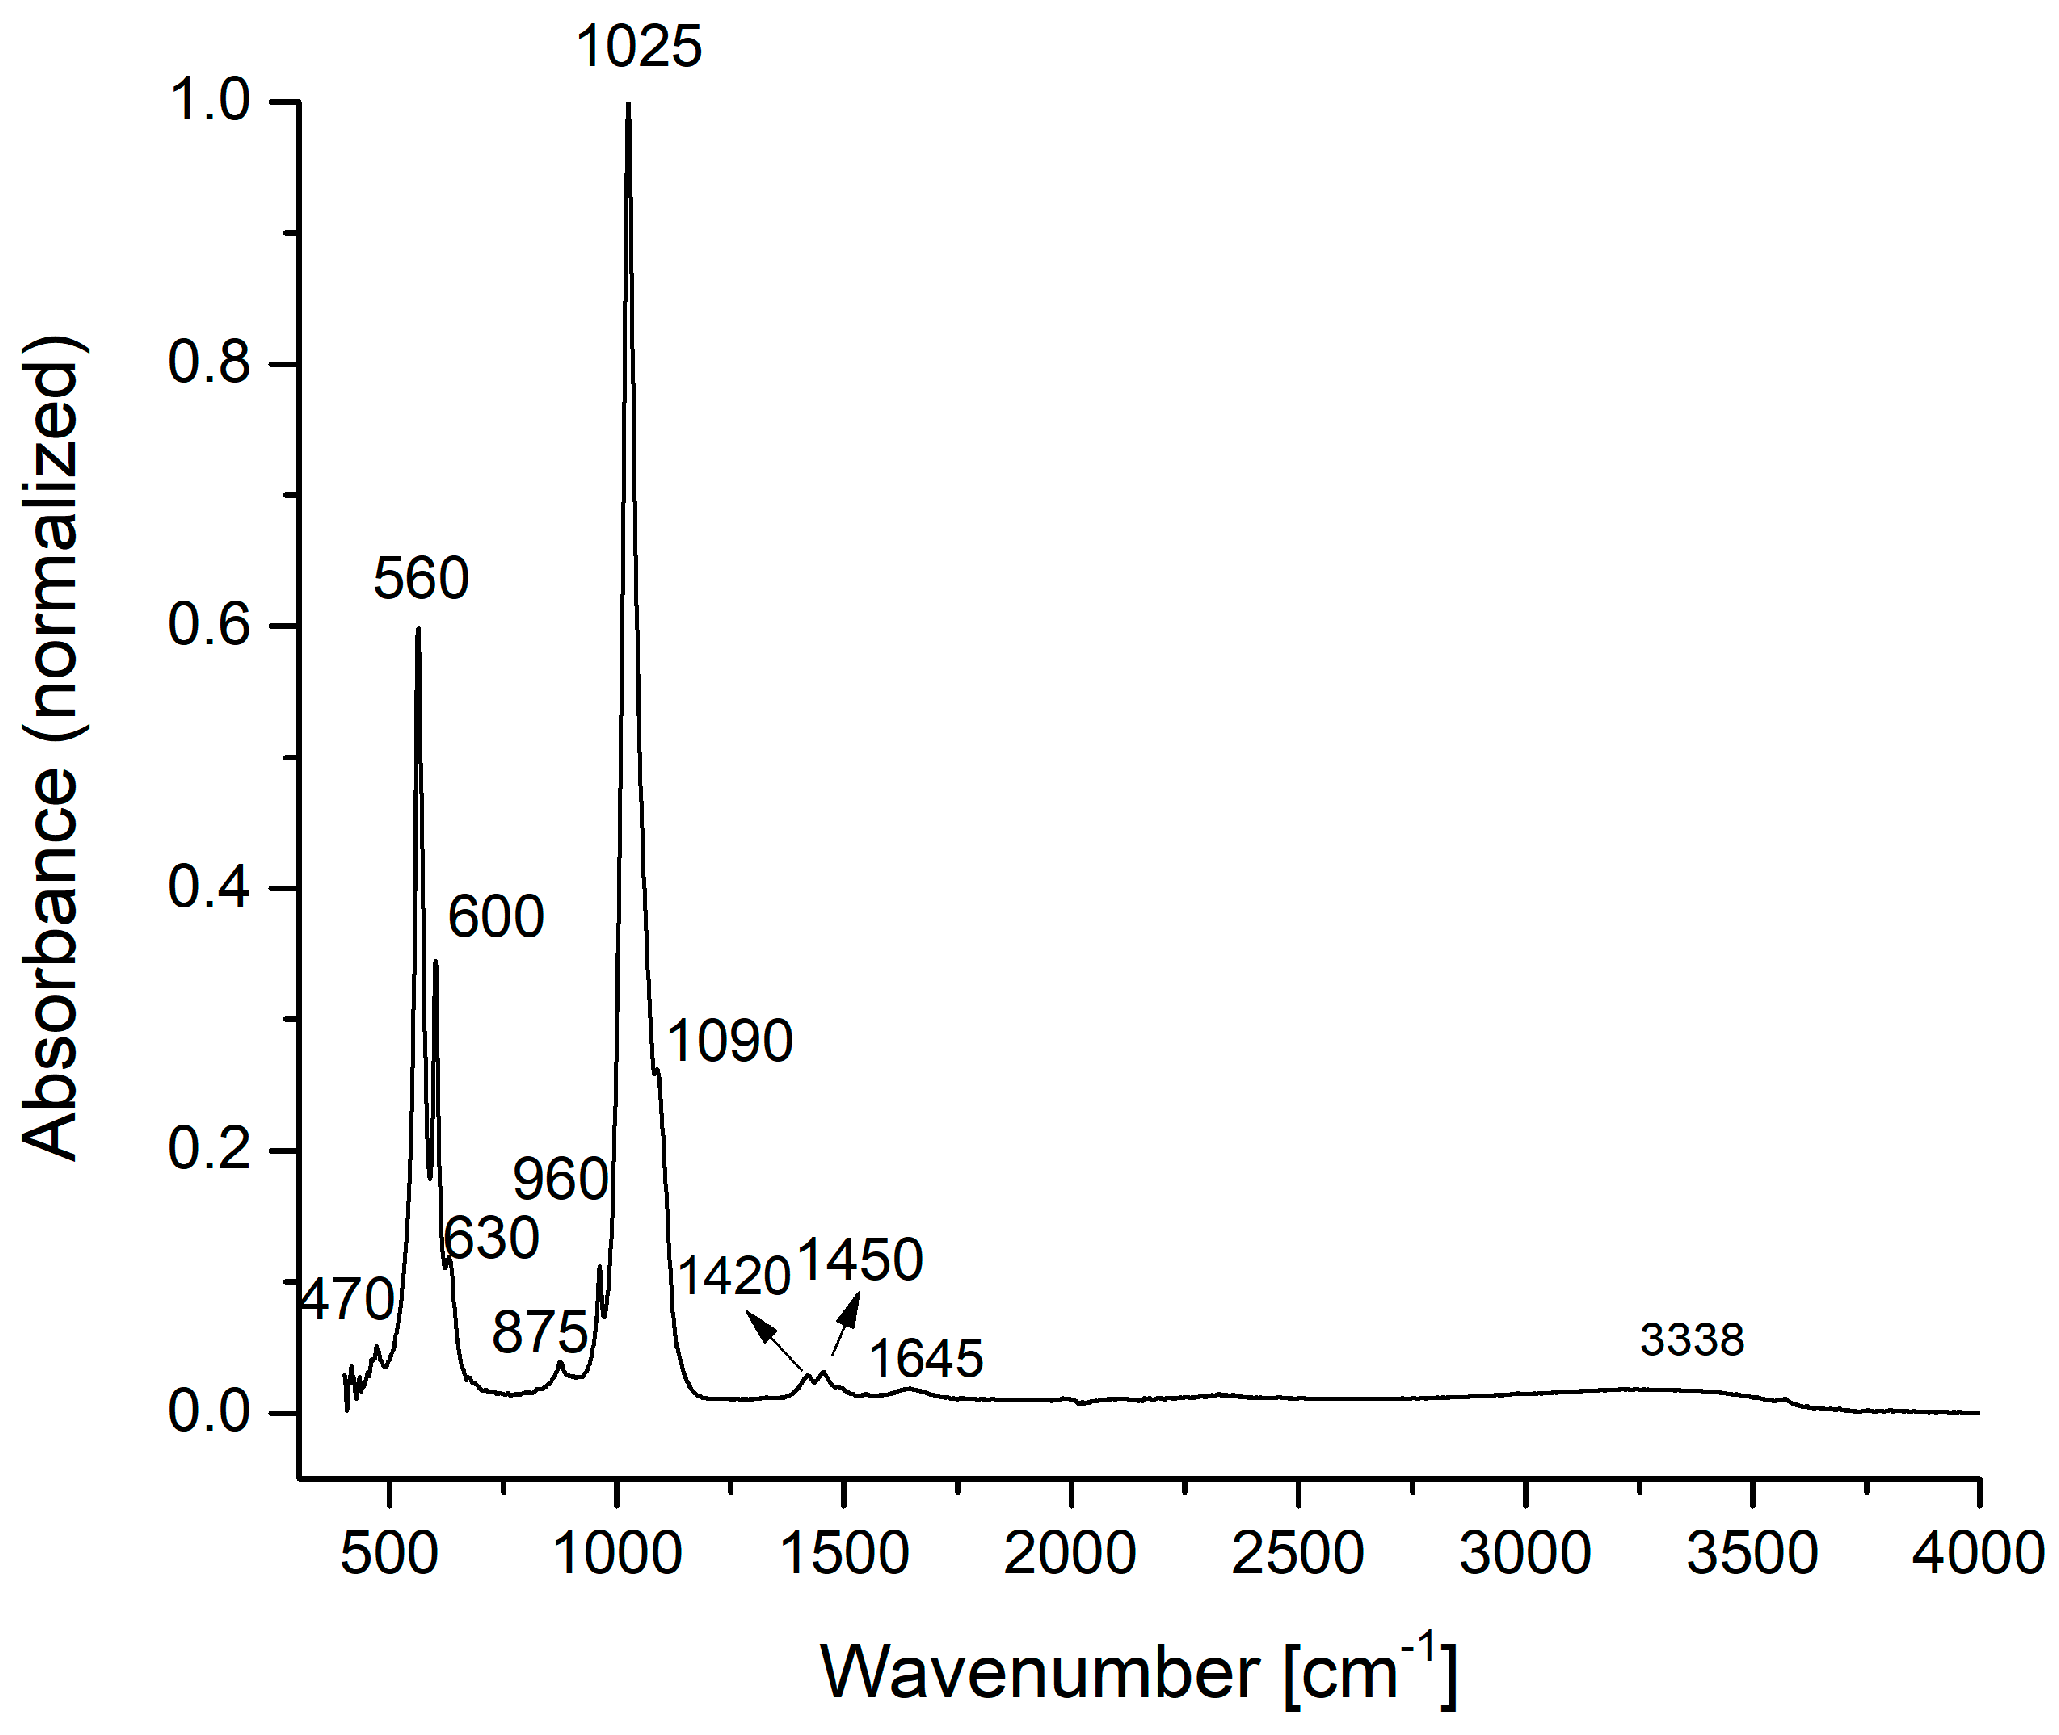
| 470, 560, 600, 630 | vibrations in [PO4]3− | 470, 560, 600, 630 | vibrations in [PO4]3− | 470, 560, 600, 630 | vibrations in [PO4]3− |
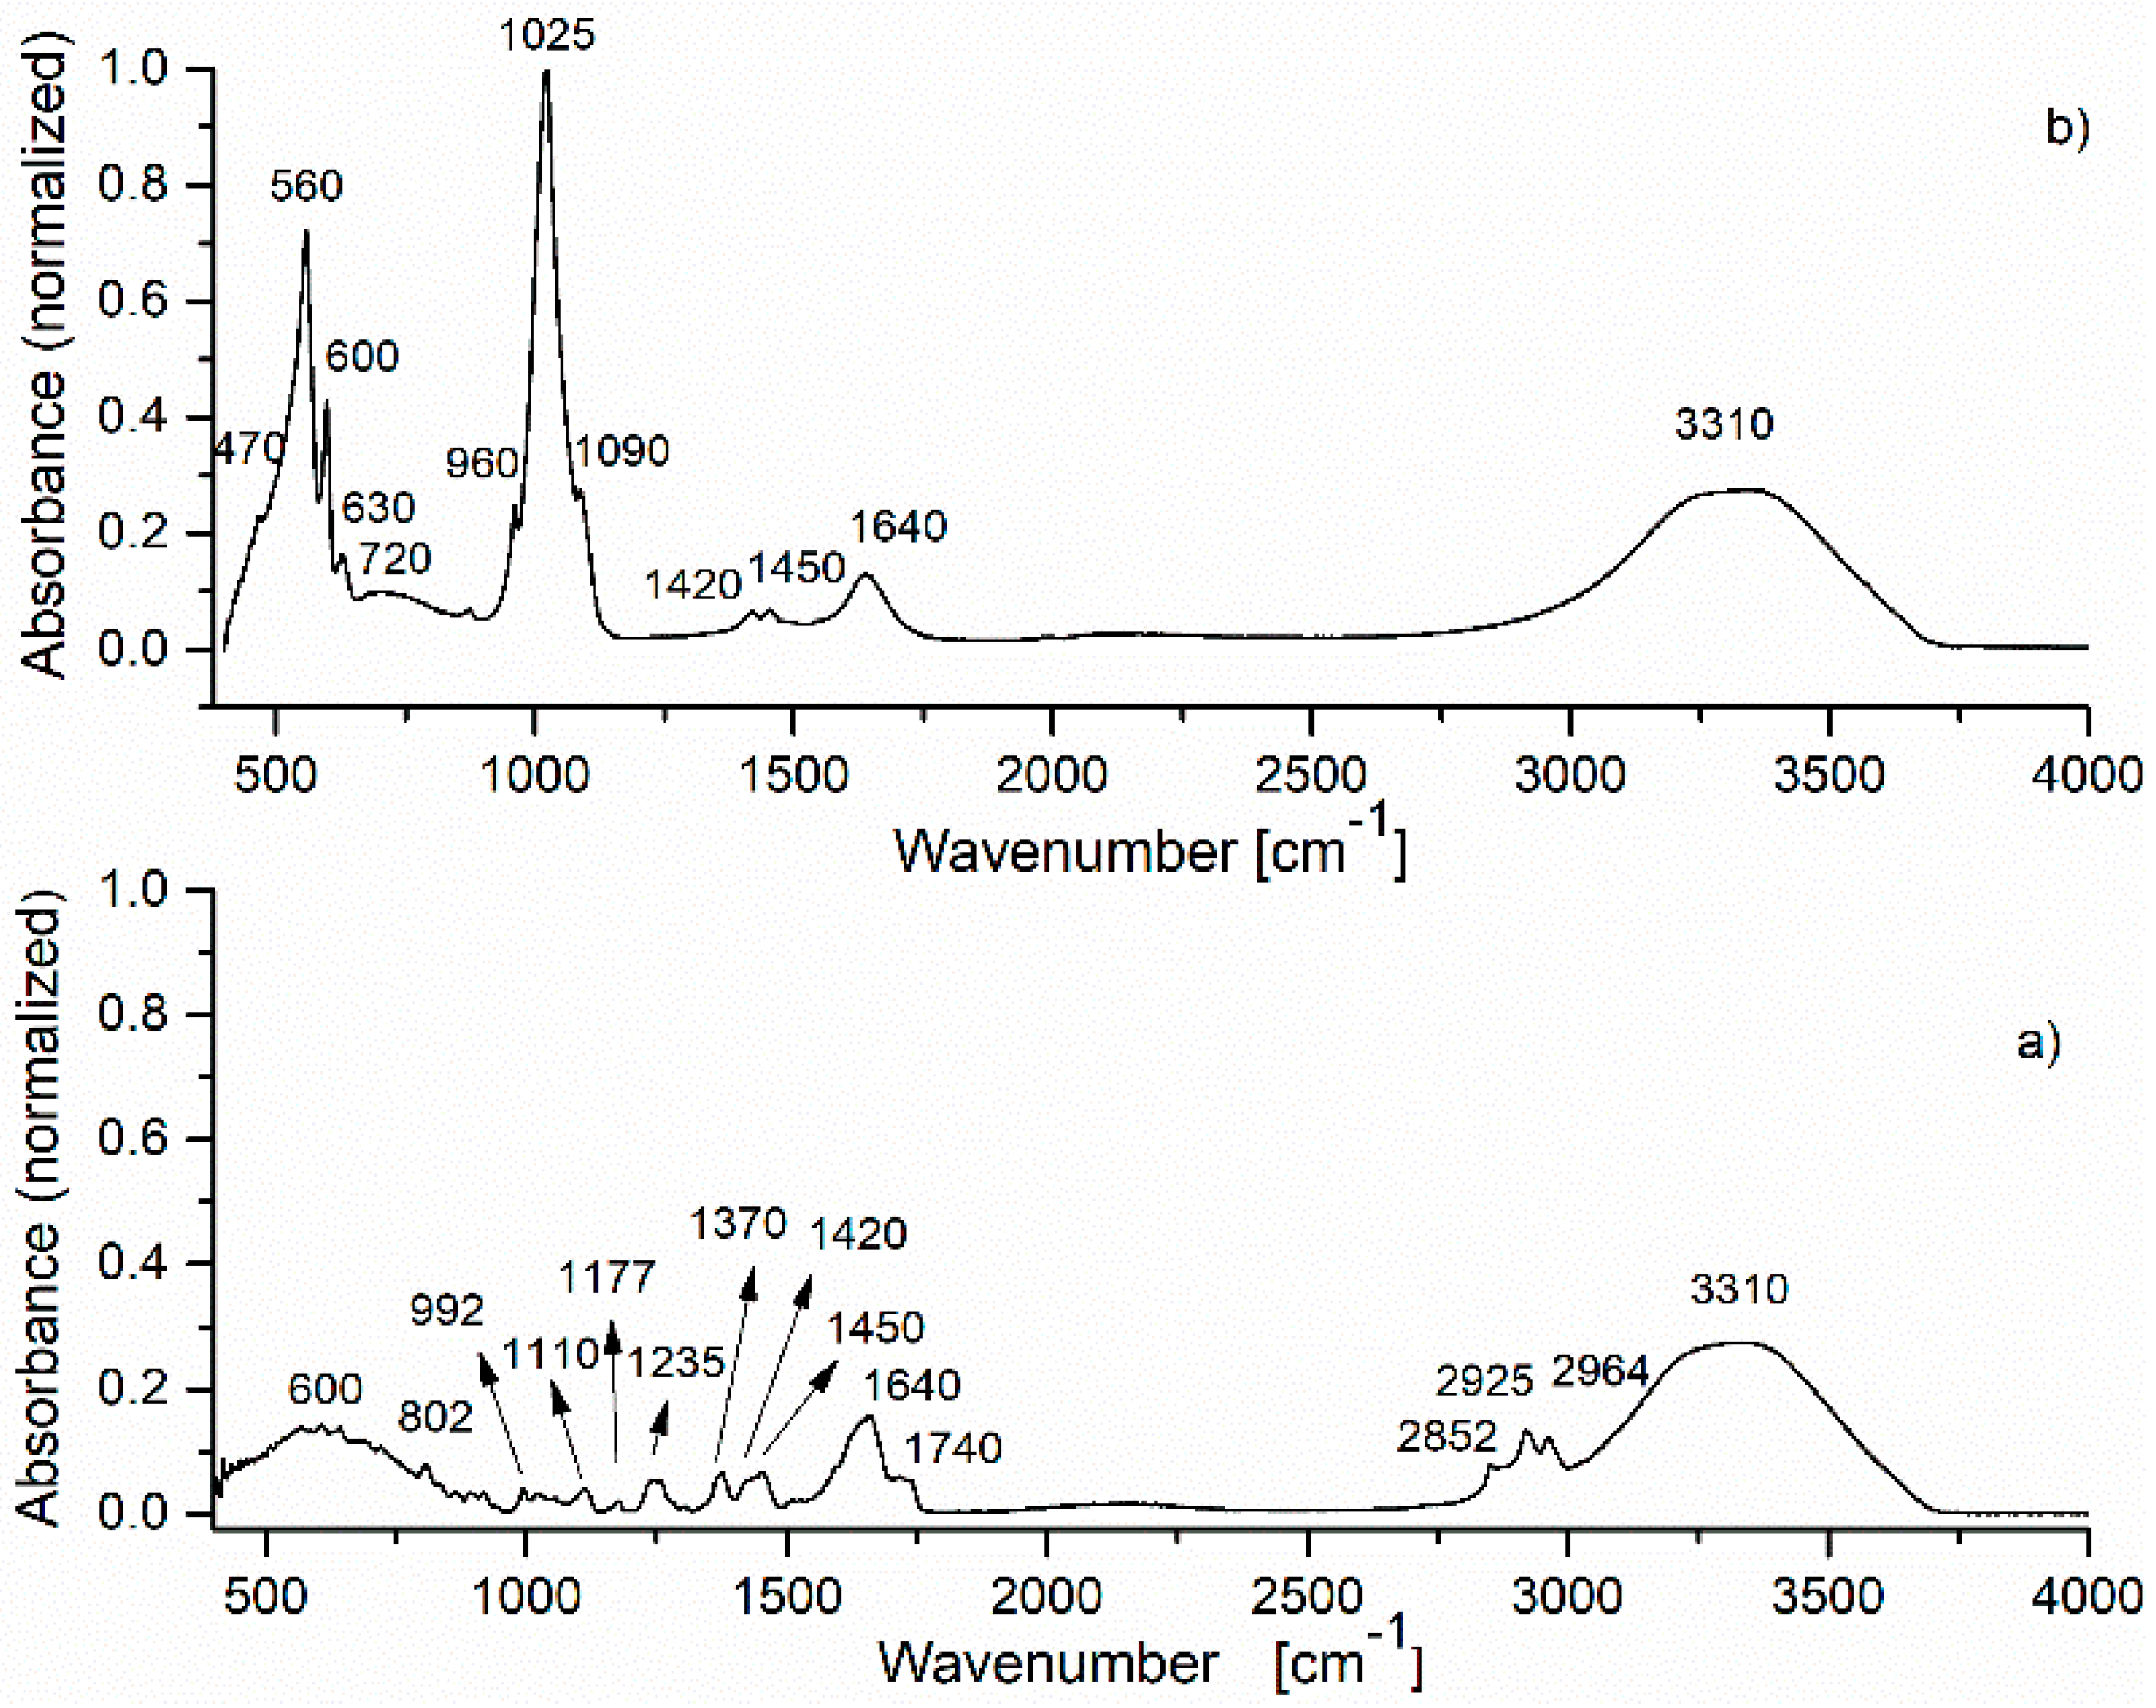
| 875, 1420, 1450 | vibrations in [CO3]2− | 720 | C–H deformations aromatic C-H out-of-plane bend | 692 | C–H deformations aromatic C–H out-of-plane bend |
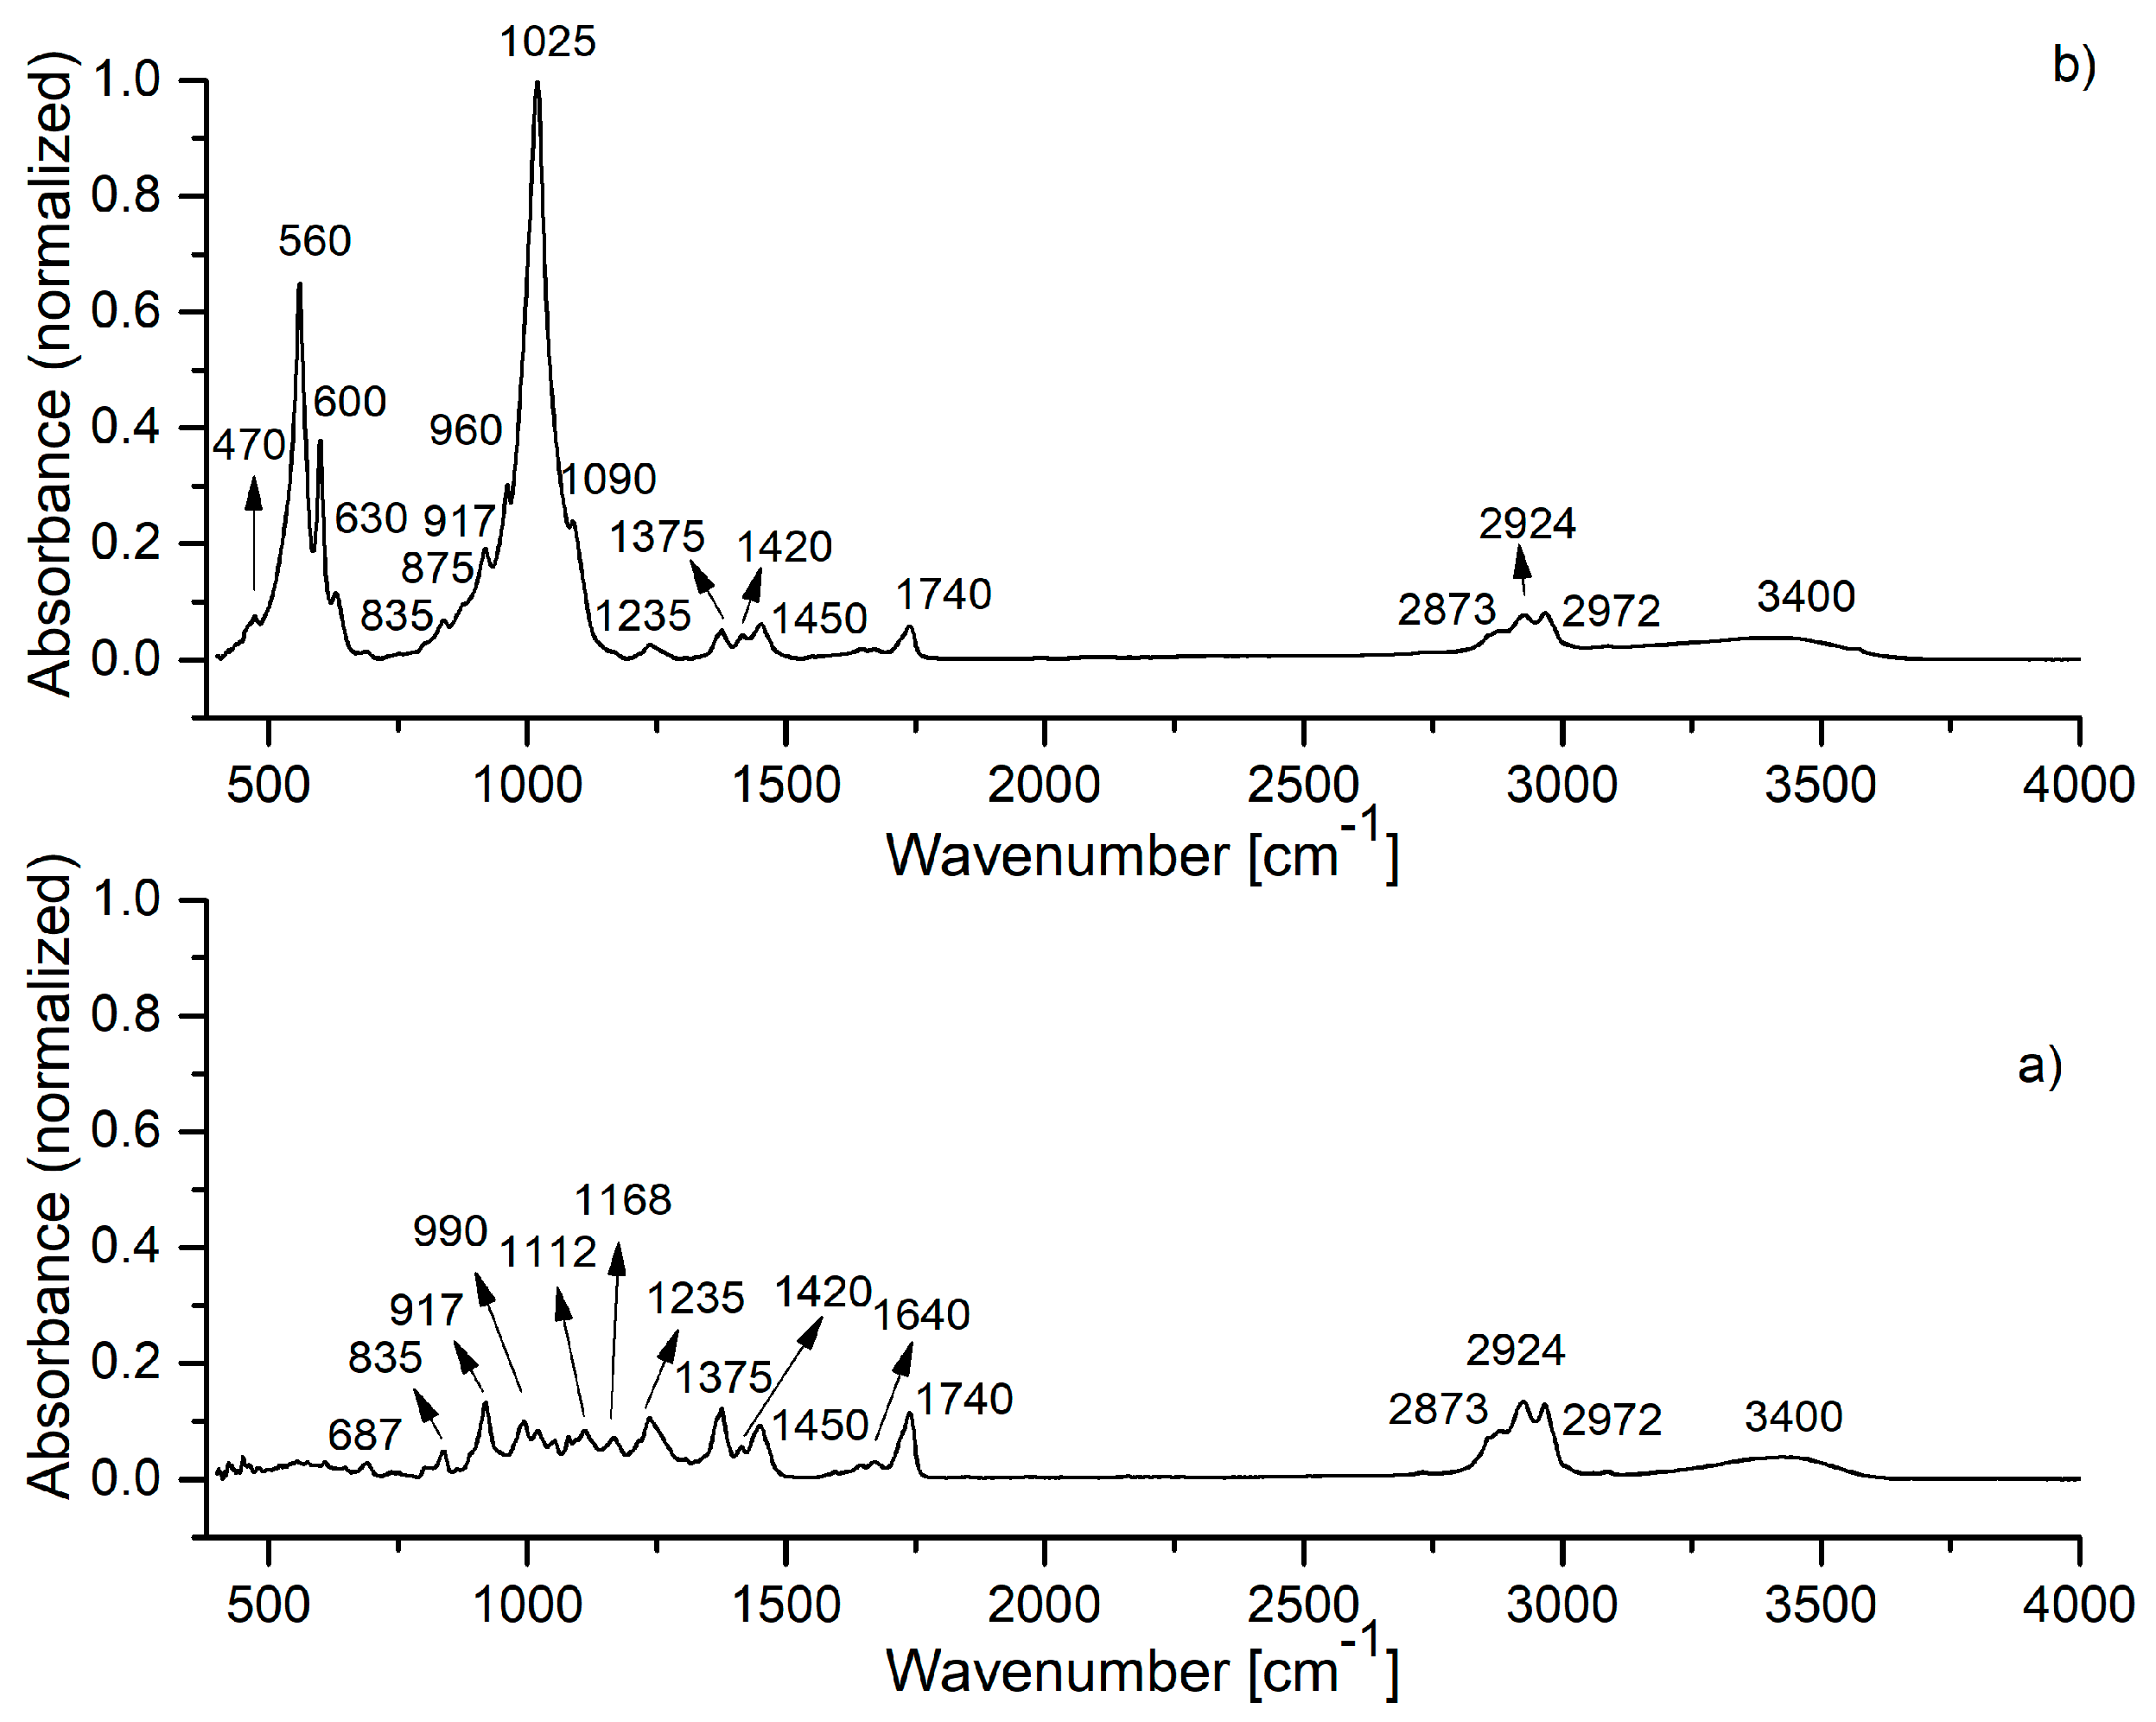
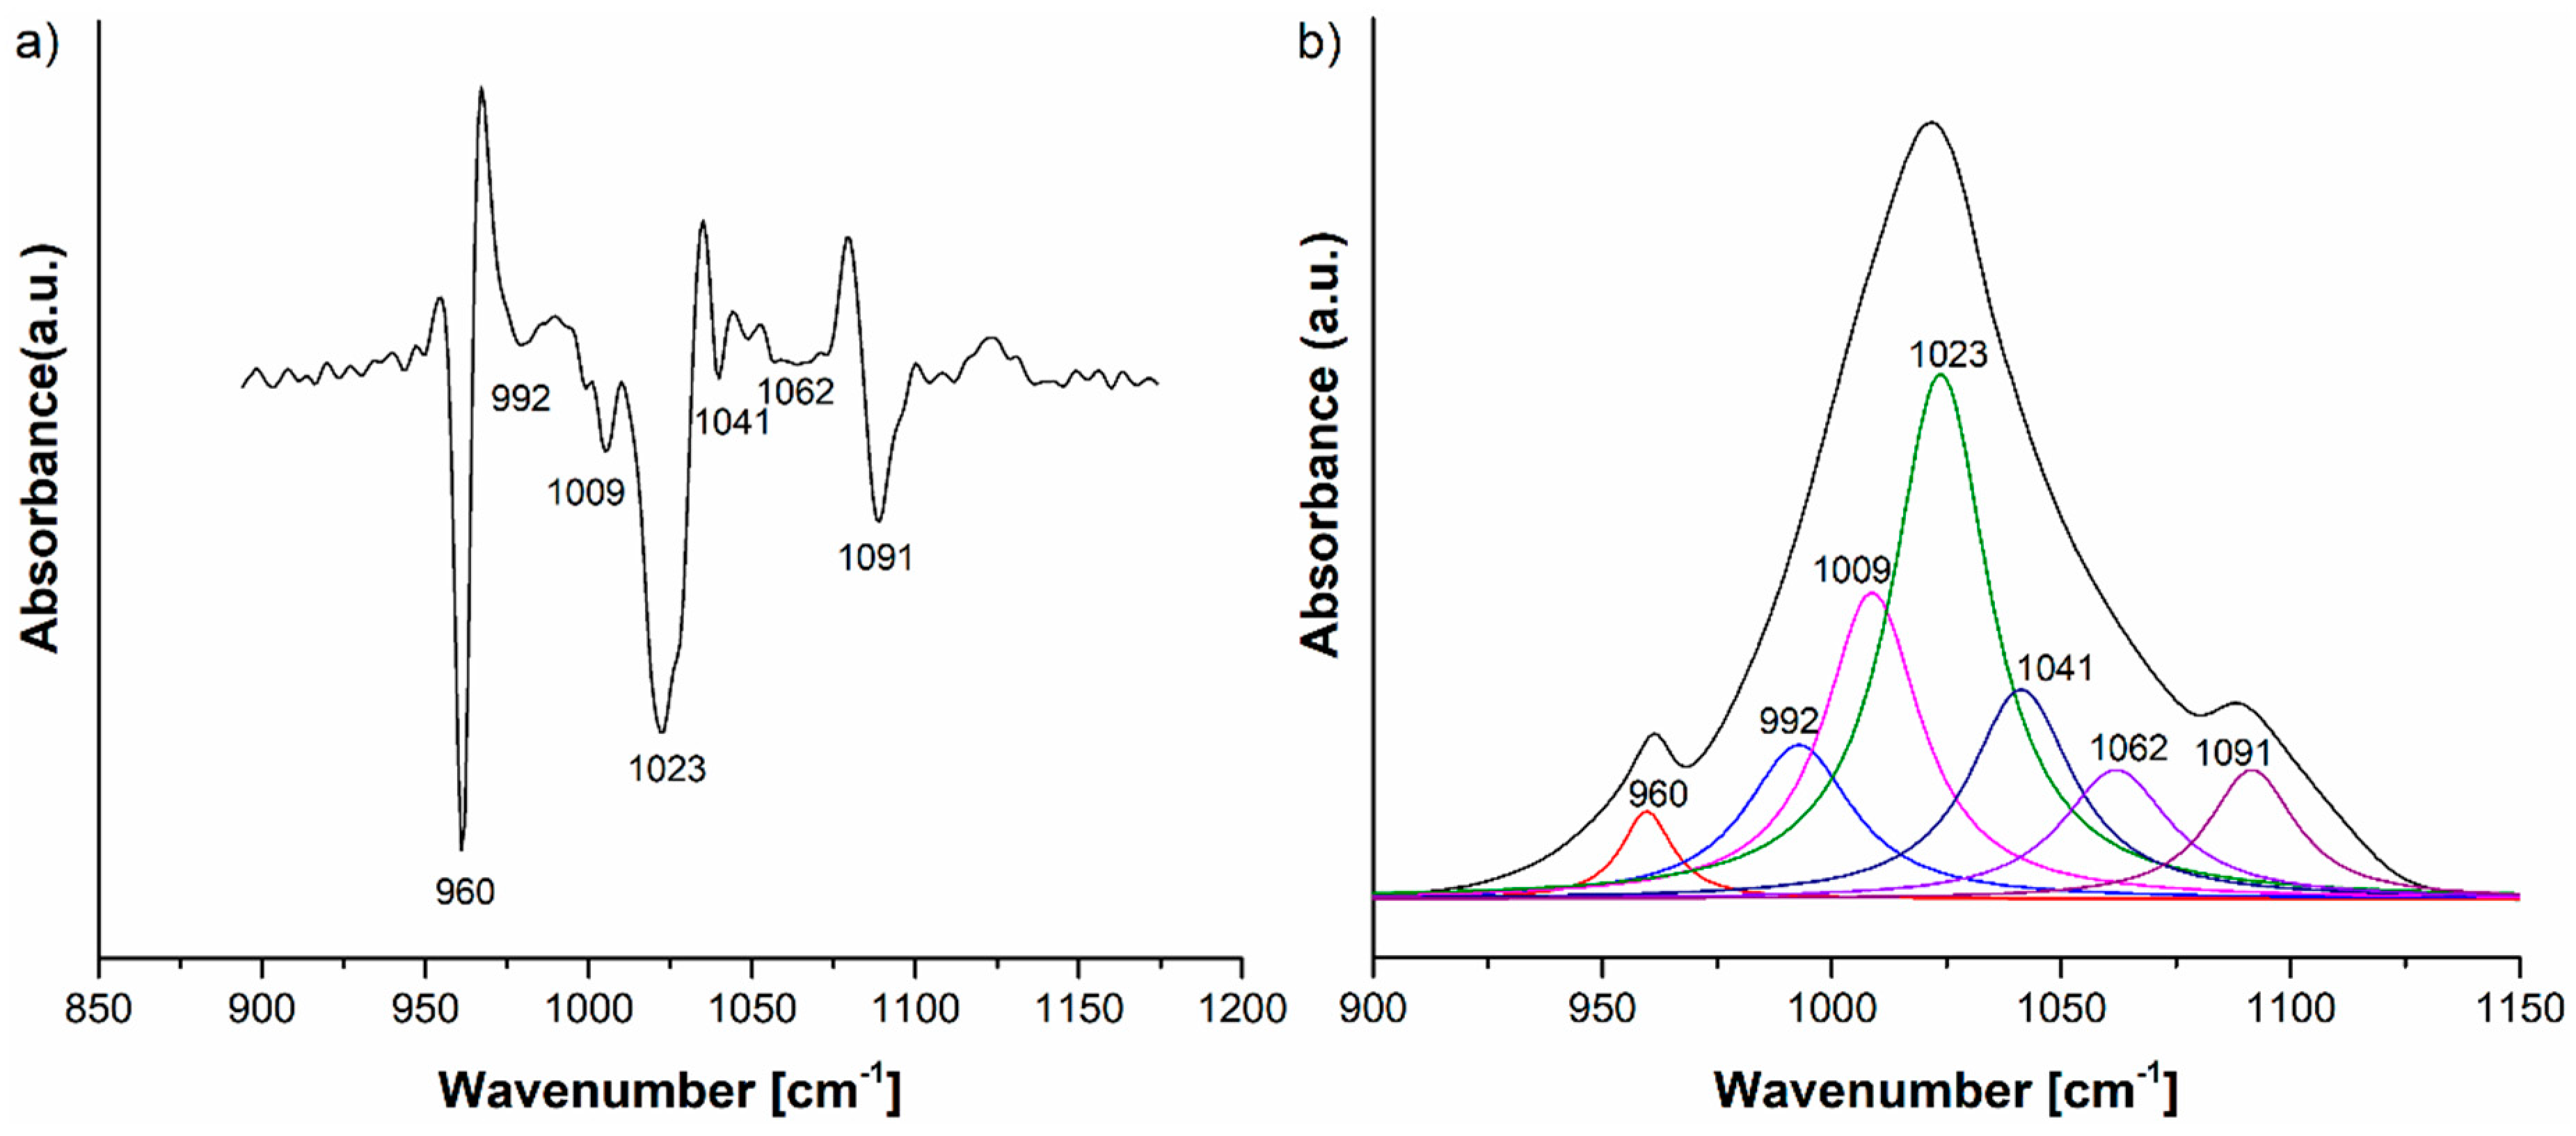
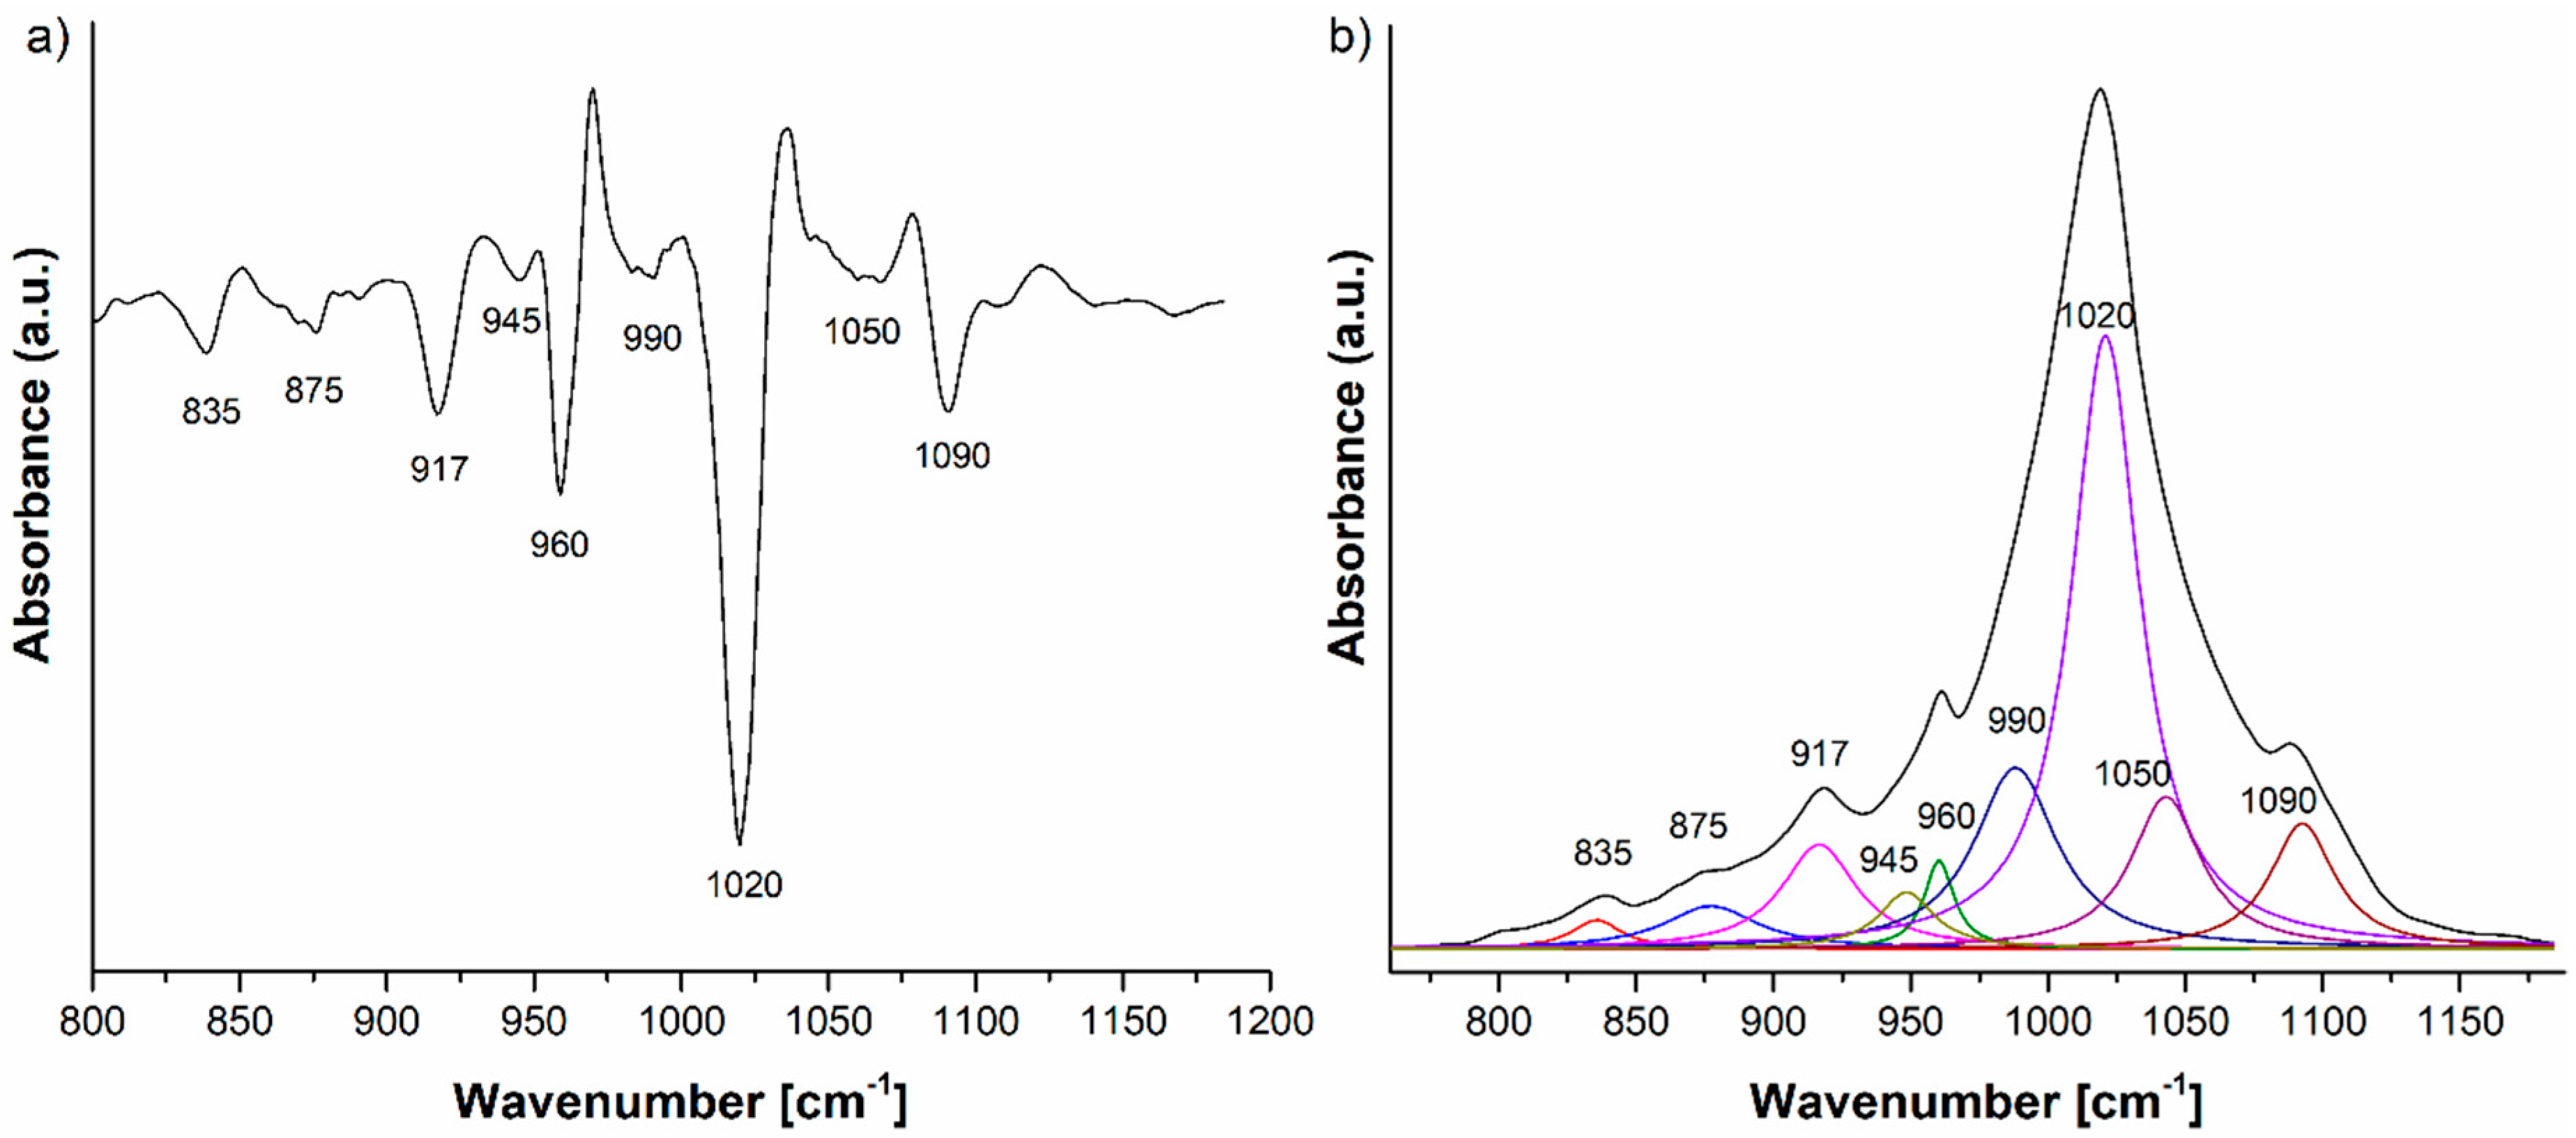
| 960, 1025, 1090 | vibrations in [PO4]3− | 875, 1420, 1450 | C–O vibrations in [CO3]2−/C–H vibrations | 835, 875, 1420, 1450 | C–O vibrations in [CO3]2−/C–H vibrations |
| 1645, 3338 | O–H vibrations | 960, 1025, 1090 | vibrations in [PO4]3− | 917 | C–H deformations |
| 1640 | H–-O–H vibrations | 960, 1025, 1090 | P–O vibrations in [PO4]3− | ||
| 3310 | H2O vibrations | 1235 | C–O stretching of ester group | ||
| 1375 | C–H in CH3 vibrations | ||||
| 1640 | C=C vibrations | ||||
| 1740 | C=O stretching vibrations | ||||
| 2873, 2924 | C–H vibrations in CH3 groups | ||||
| 2972 | C–H vibrations in CH2 group | ||||
| 3400 | O-H stretching vibrations |
| Wavenumber (cm−1) | Absorption Intensities of Lavender EO IR Bands in Its IR Spectrum | Absorption Intensities of Lavender EO in HAp-L IR Spectrum |
|---|---|---|
| 1235 | 0.01 | 0.024 |
| 1375 | 0.12 | 0.042 |
| 1420 | 0.058 | 0.042 |
| 1450 | 0.093 | 0.068 |
| 1740 | 0.11 | 0.064 |
| 2873 | 0.08 | 0.054 |
| 2924 | 0.139 | 0.077 |
| 2972 | 0.133 | 0.086 |
| 3400 | 0.046 | 0.04 |
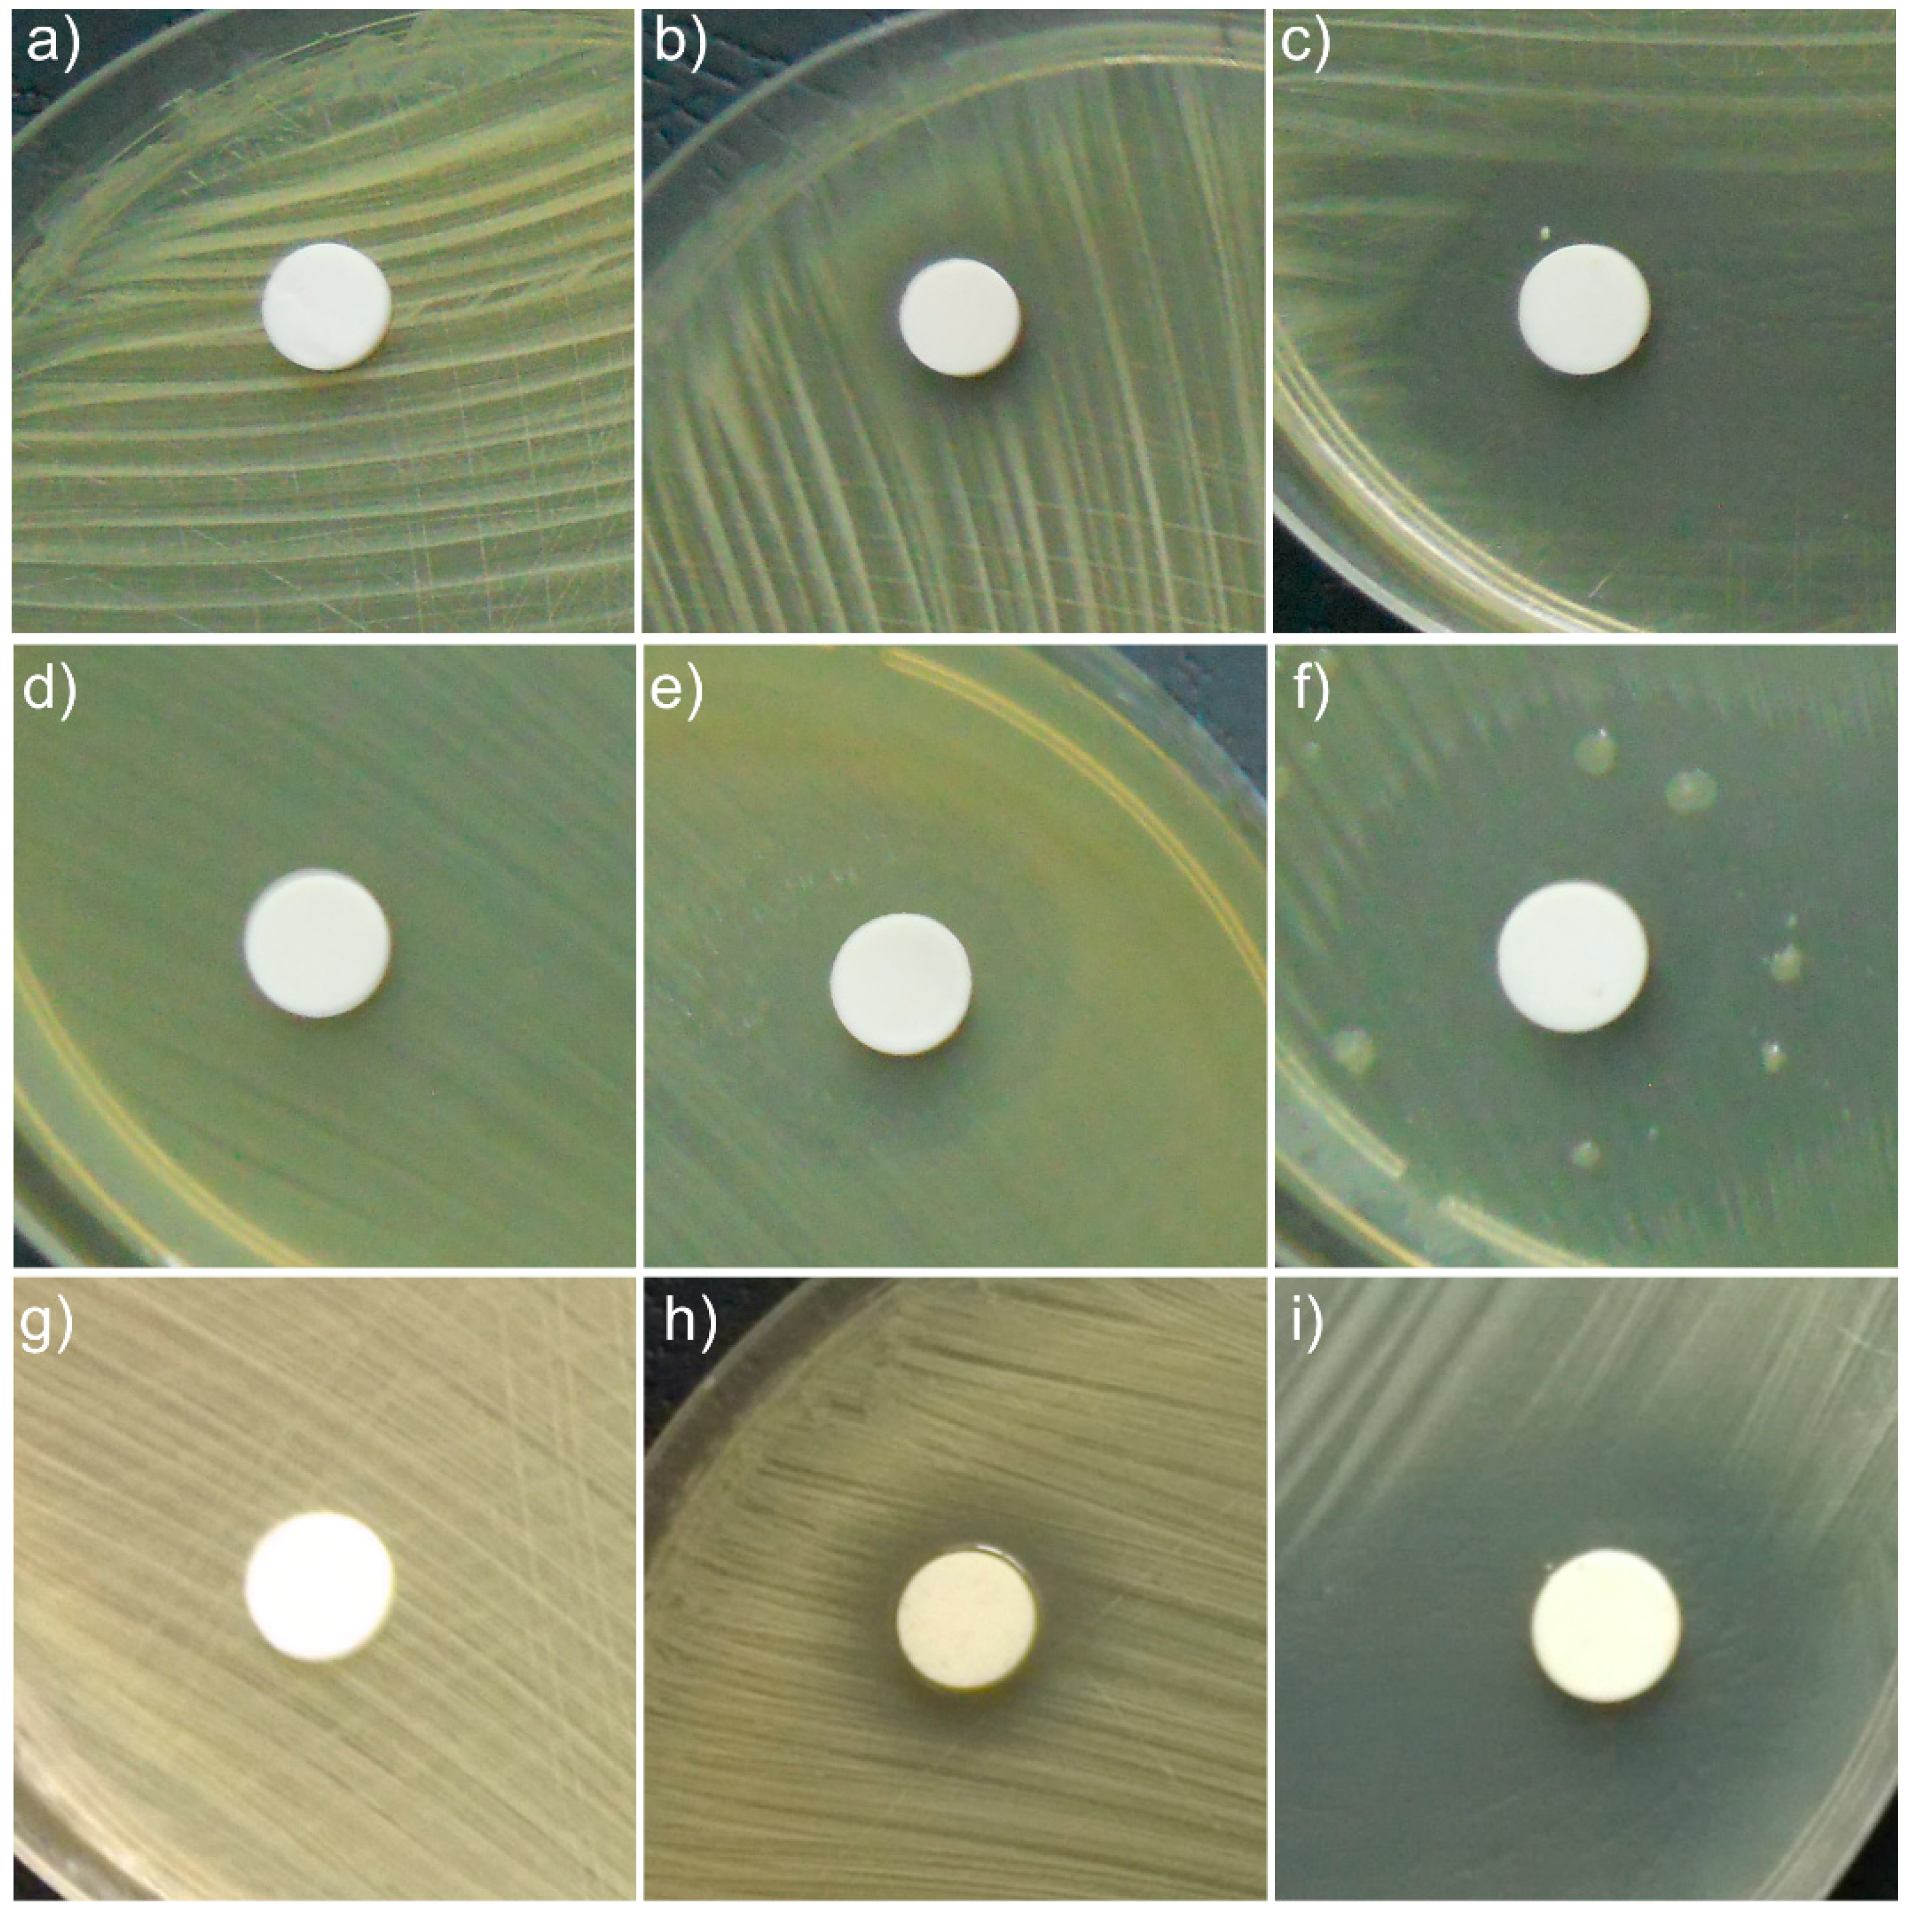
| Bacterial Strain | Inhibition Zone (mm) | ||
|---|---|---|---|
| HAp | HAp-B | HAp-L | |
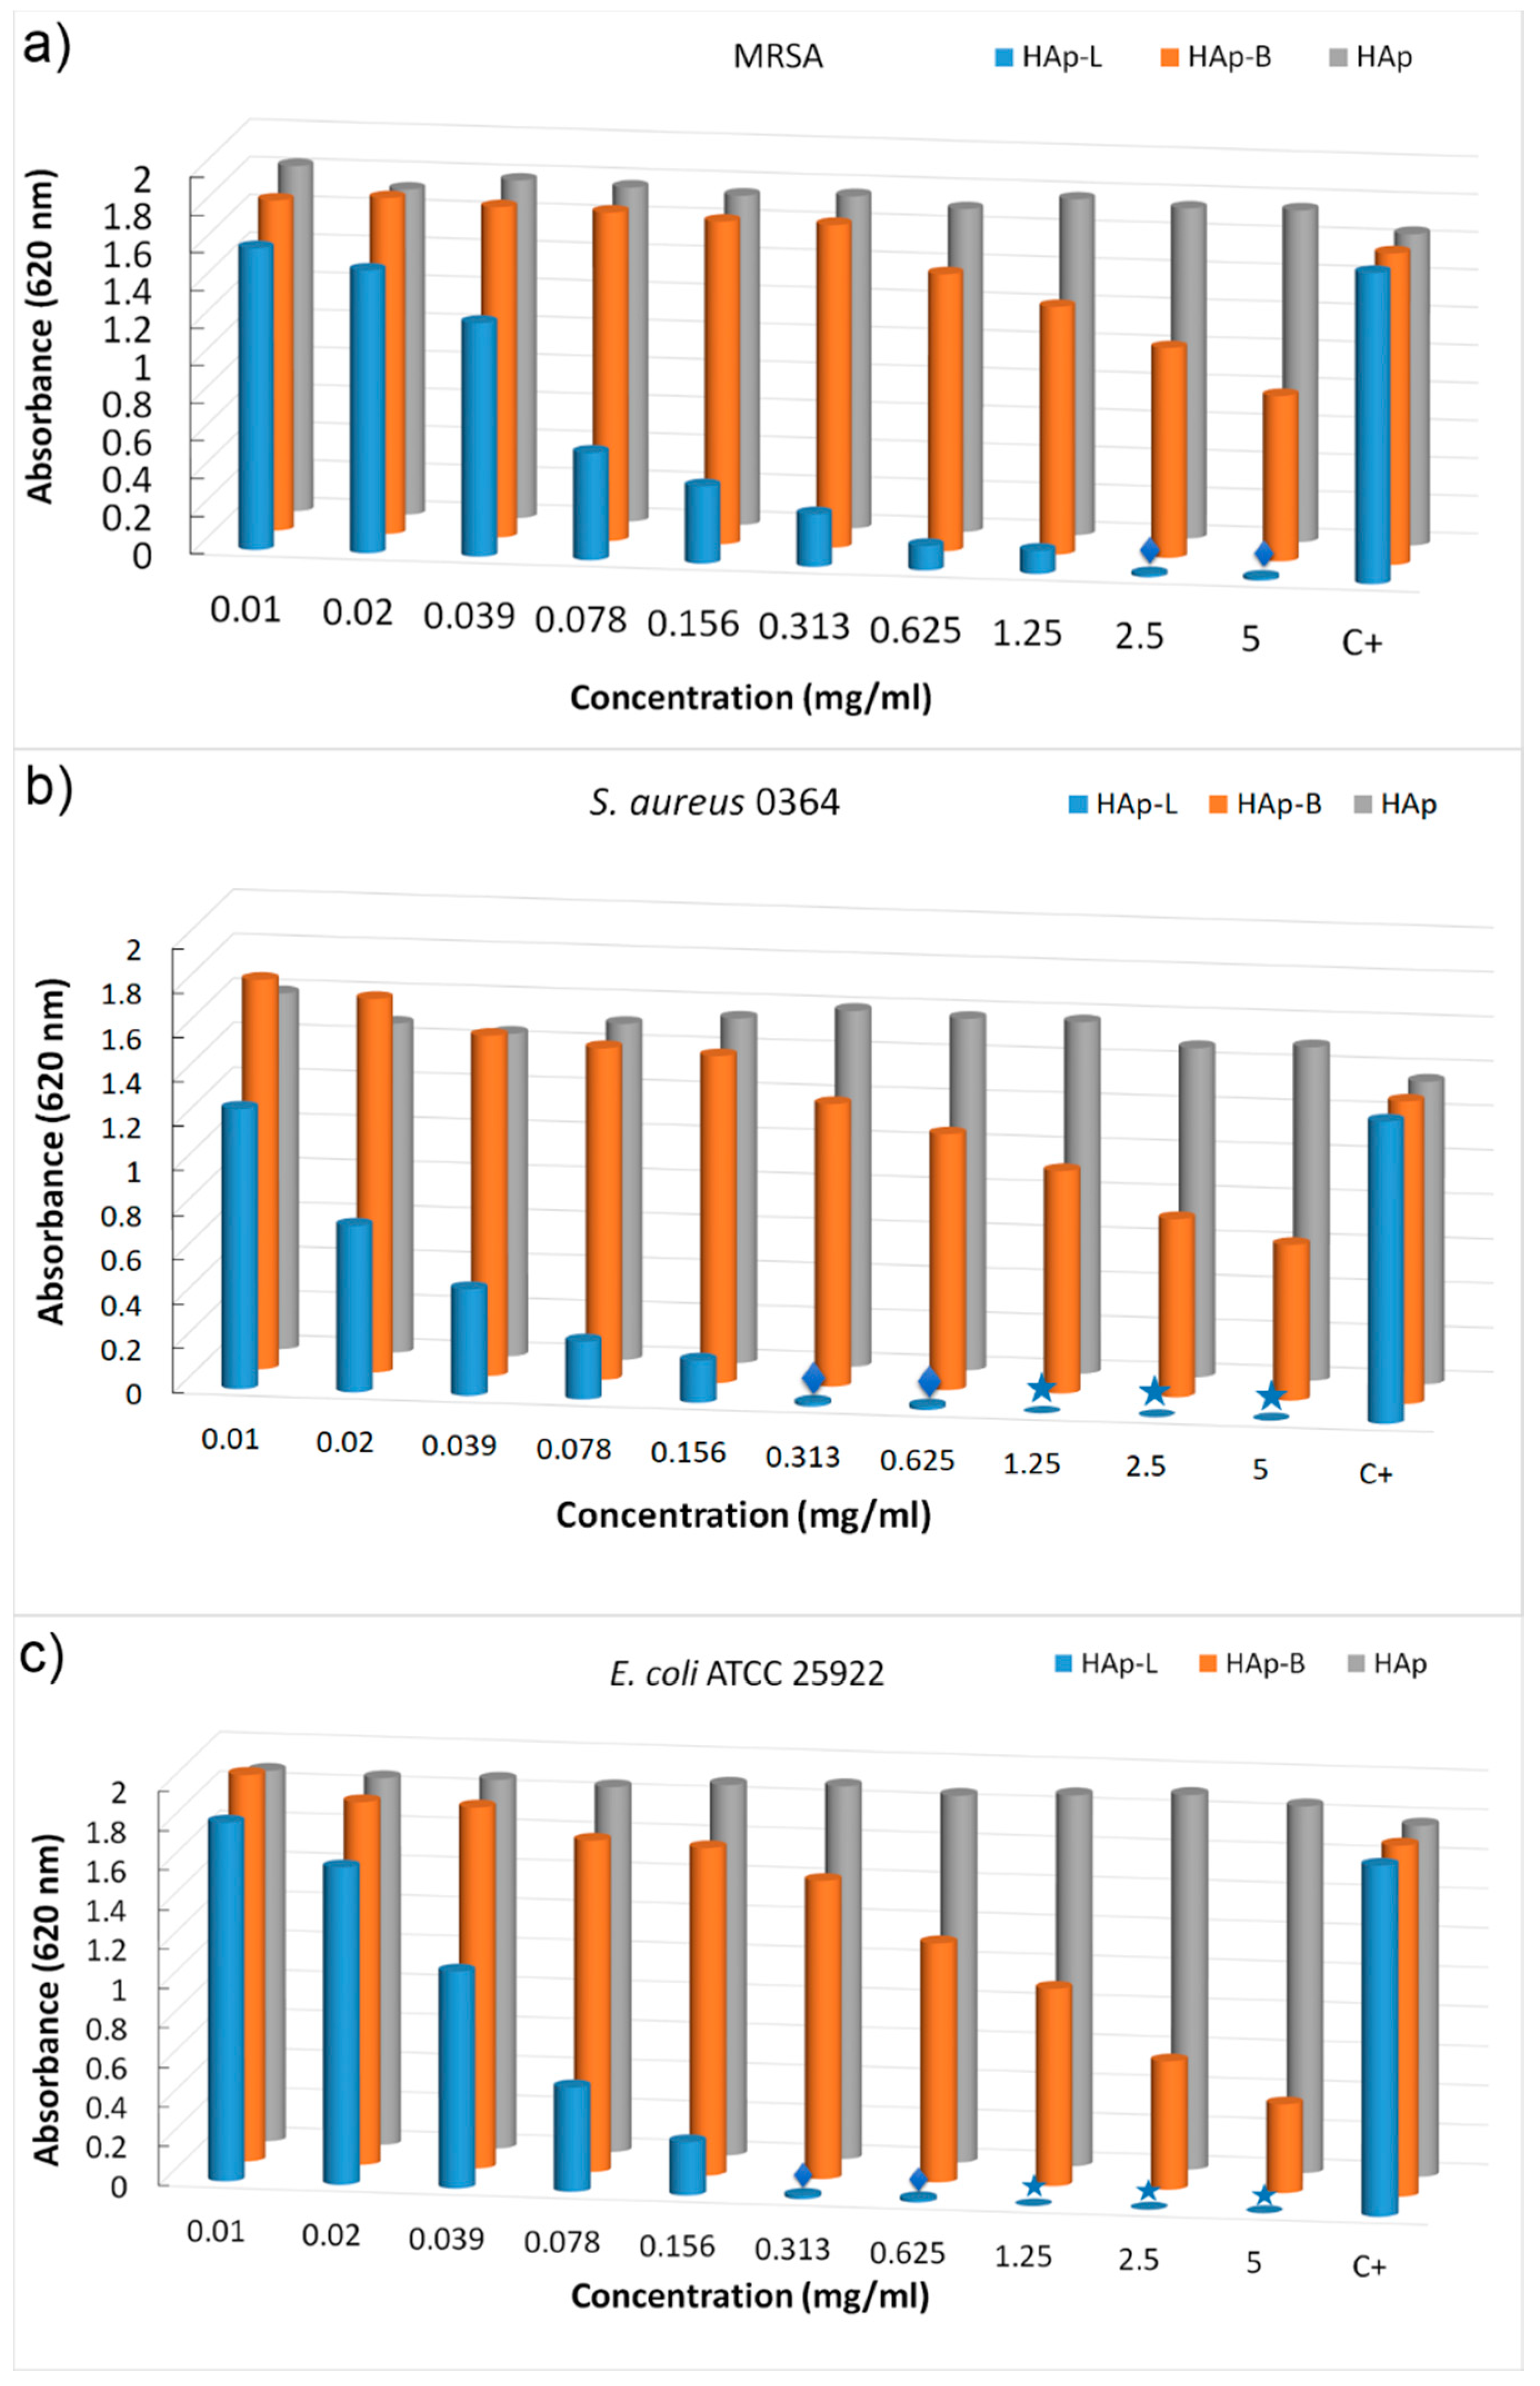
| MRSA | - | 9 ± 0.2 | 23.77 ± 0.3 |
| E. coli ATCC 25922 | - | 14.65 ± 0.5 | 25.27 ± 0.7 |
| S. aureus 0364 | - | 11.06 ± 0.4 | 25.83 ± 0.9 |
© 2018 by the authors. Licensee MDPI, Basel, Switzerland. This article is an open access article distributed under the terms and conditions of the Creative Commons Attribution (CC BY) license (http://creativecommons.org/licenses/by/4.0/).
Share and Cite
Predoi, D.; Groza, A.; Iconaru, S.L.; Predoi, G.; Barbuceanu, F.; Guegan, R.; Motelica-Heino, M.S.; Cimpeanu, C. Properties of Basil and Lavender Essential Oils Adsorbed on the Surface of Hydroxyapatite. Materials 2018, 11, 652. https://doi.org/10.3390/ma11050652
Predoi D, Groza A, Iconaru SL, Predoi G, Barbuceanu F, Guegan R, Motelica-Heino MS, Cimpeanu C. Properties of Basil and Lavender Essential Oils Adsorbed on the Surface of Hydroxyapatite. Materials. 2018; 11(5):652. https://doi.org/10.3390/ma11050652
Chicago/Turabian StylePredoi, Daniela, Andreea Groza, Simona Liliana Iconaru, Gabriel Predoi, Florica Barbuceanu, Regis Guegan, Mikael Stefan Motelica-Heino, and Carmen Cimpeanu. 2018. "Properties of Basil and Lavender Essential Oils Adsorbed on the Surface of Hydroxyapatite" Materials 11, no. 5: 652. https://doi.org/10.3390/ma11050652
APA StylePredoi, D., Groza, A., Iconaru, S. L., Predoi, G., Barbuceanu, F., Guegan, R., Motelica-Heino, M. S., & Cimpeanu, C. (2018). Properties of Basil and Lavender Essential Oils Adsorbed on the Surface of Hydroxyapatite. Materials, 11(5), 652. https://doi.org/10.3390/ma11050652