Improved Mechanical Properties and Energy Absorption of BCC Lattice Structures with Triply Periodic Minimal Surfaces Fabricated by SLM


Abstract
1. Introduction
2. Materials and Methods
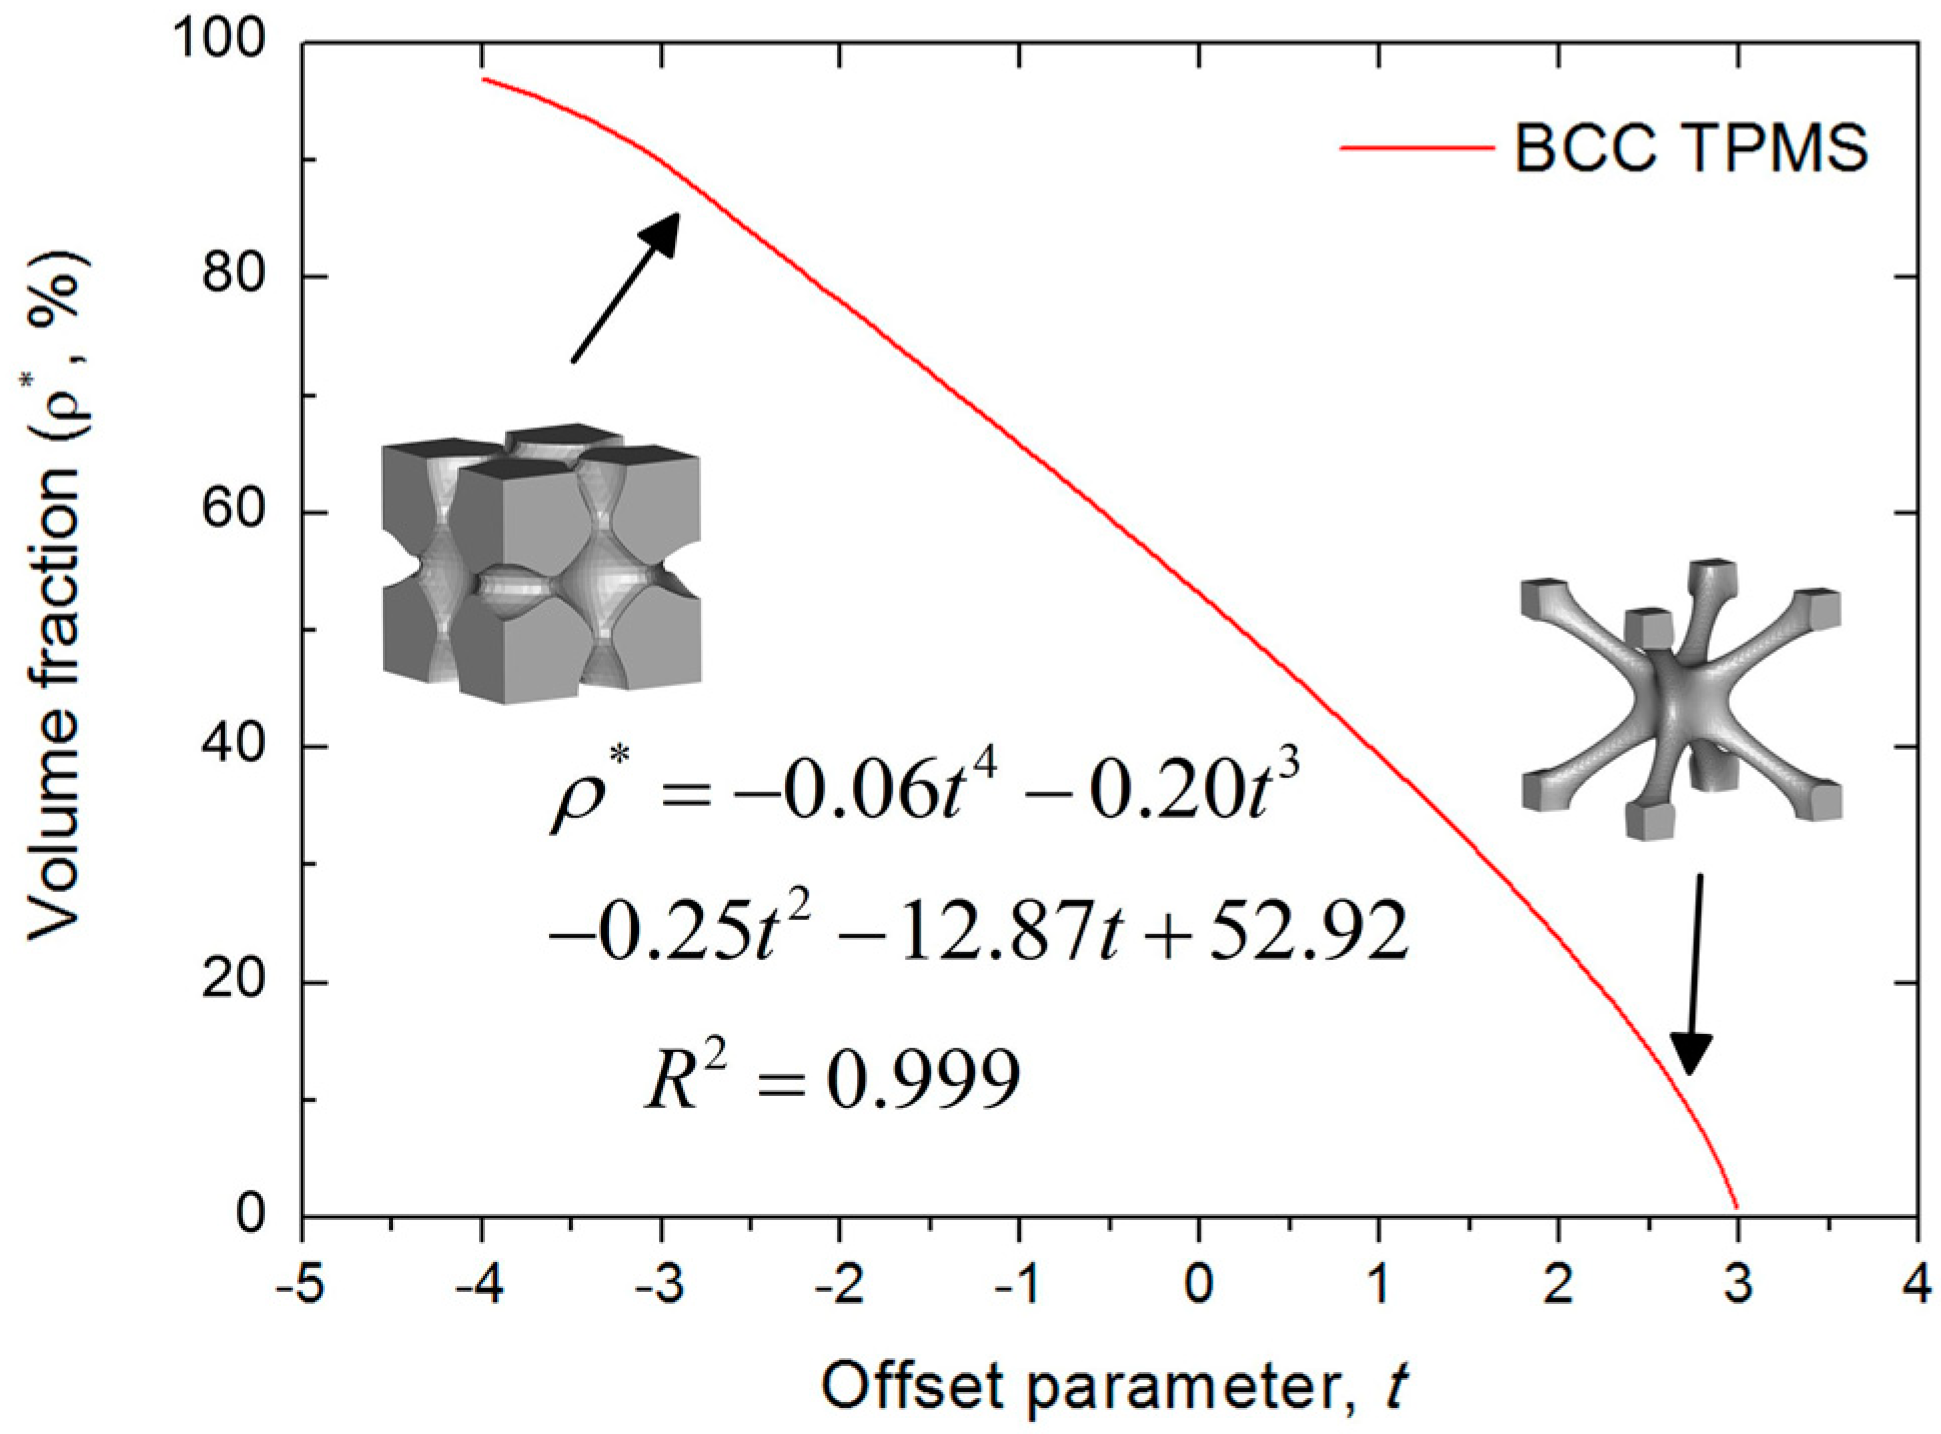
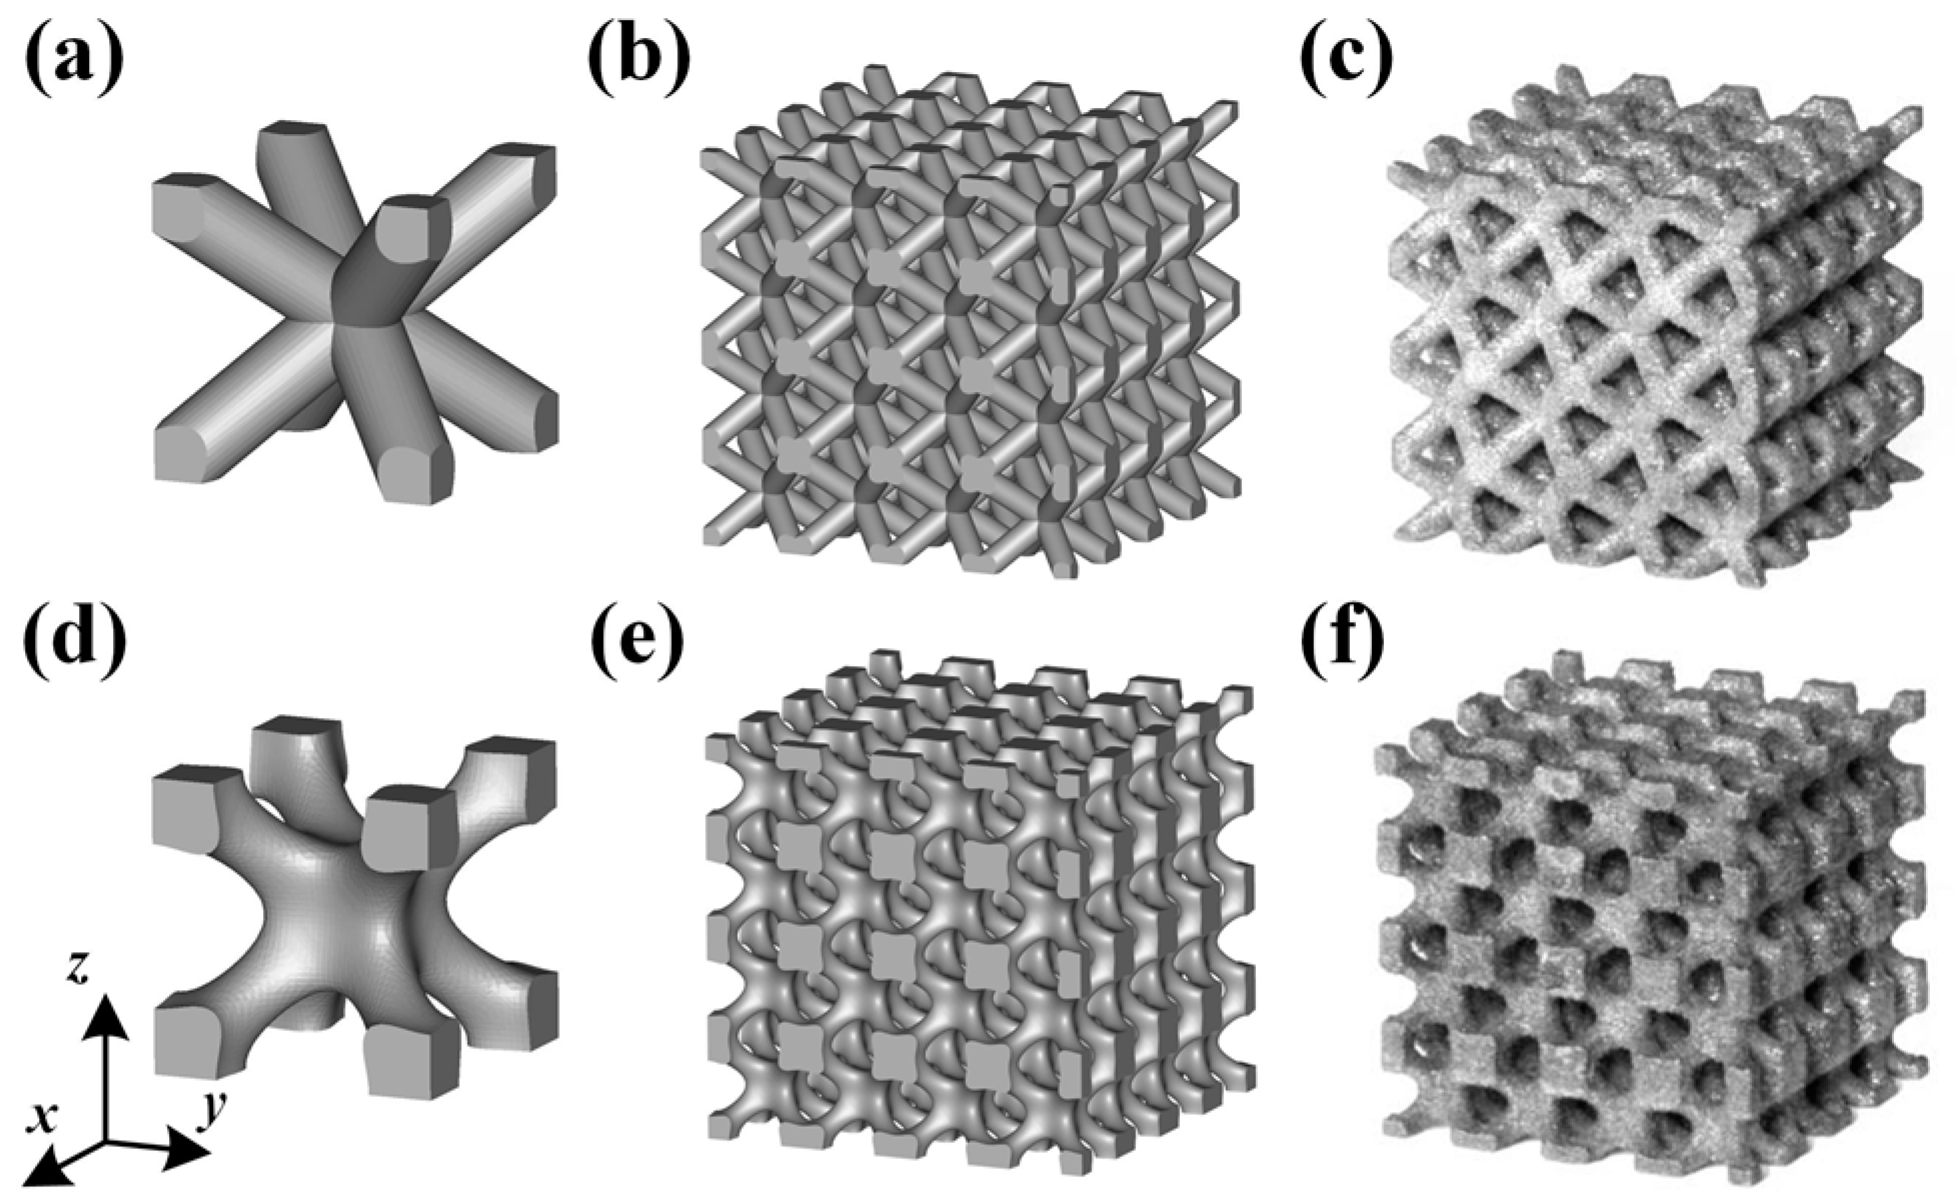
2.1. Design of BCC Lattice Structure
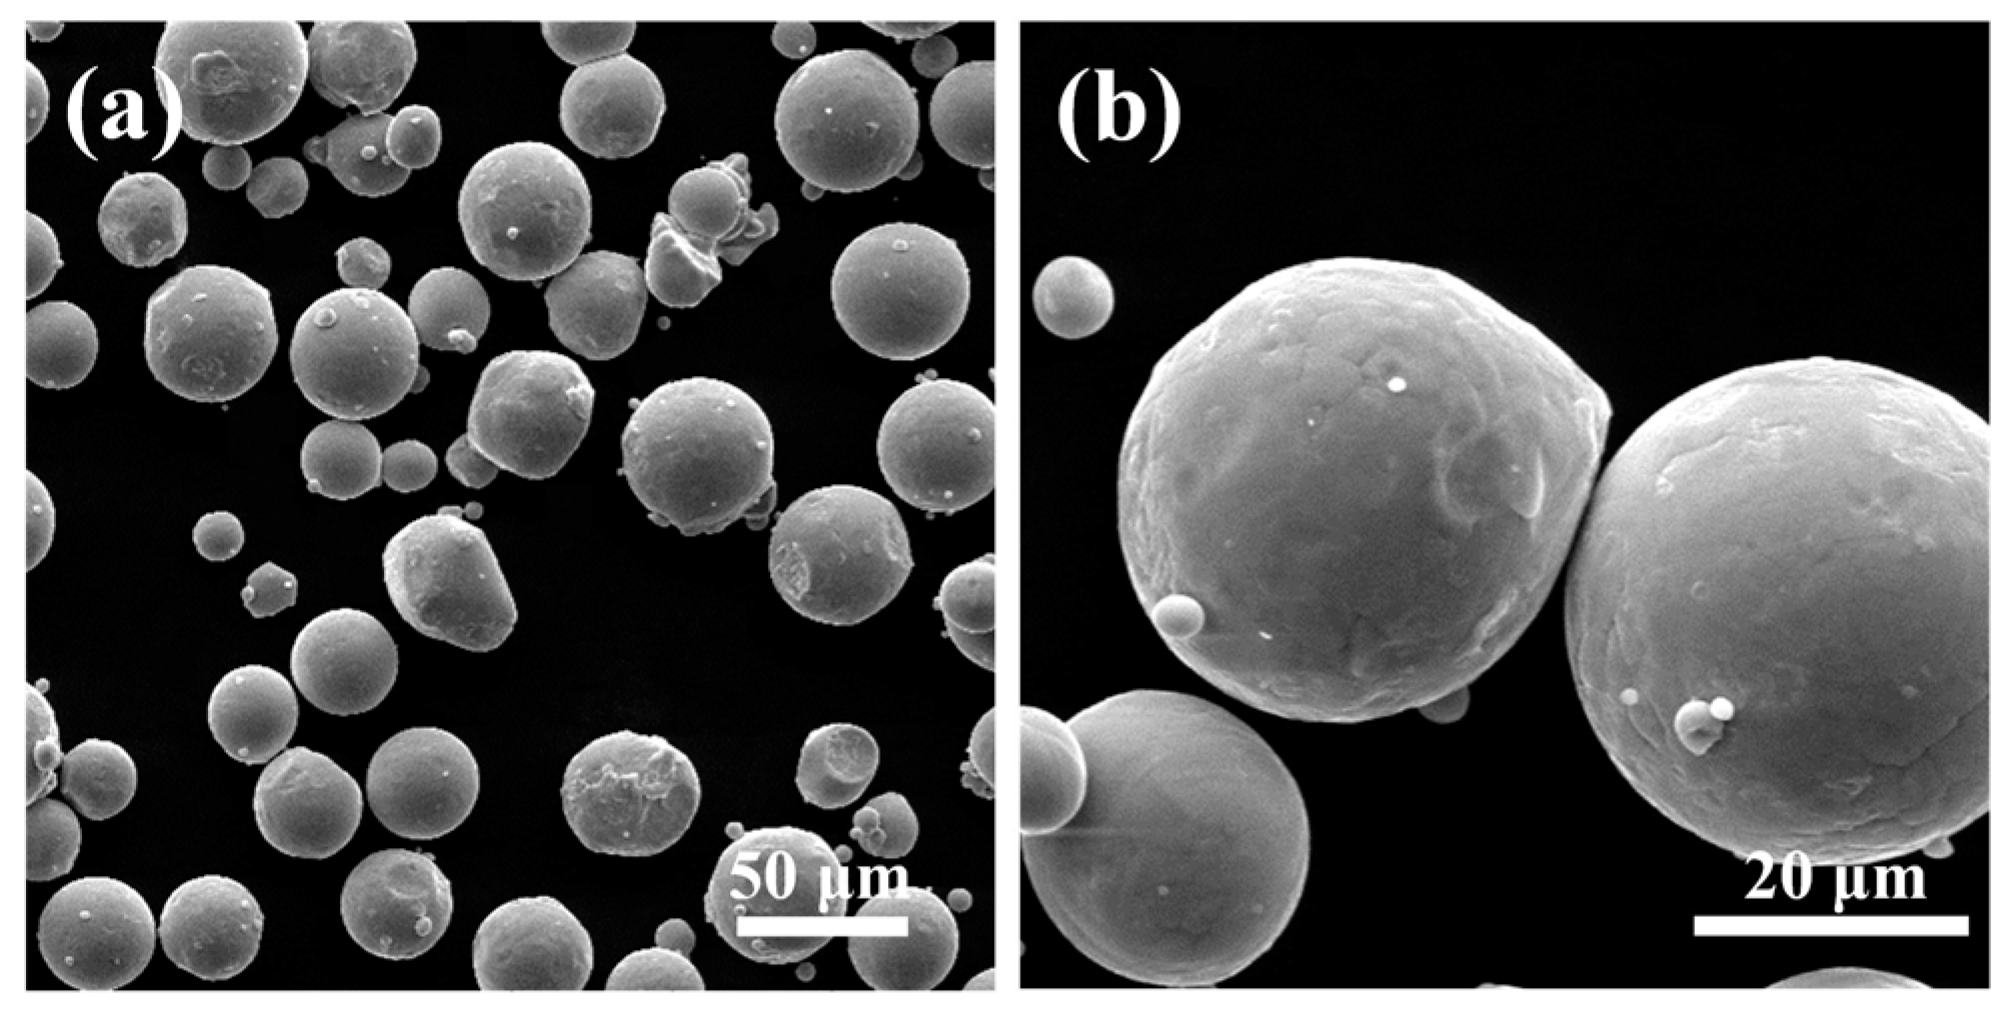
2.2. Materials
2.3. Fabrication of BCC Lattice Structures
2.4. Measurements
3. Results and Discussion
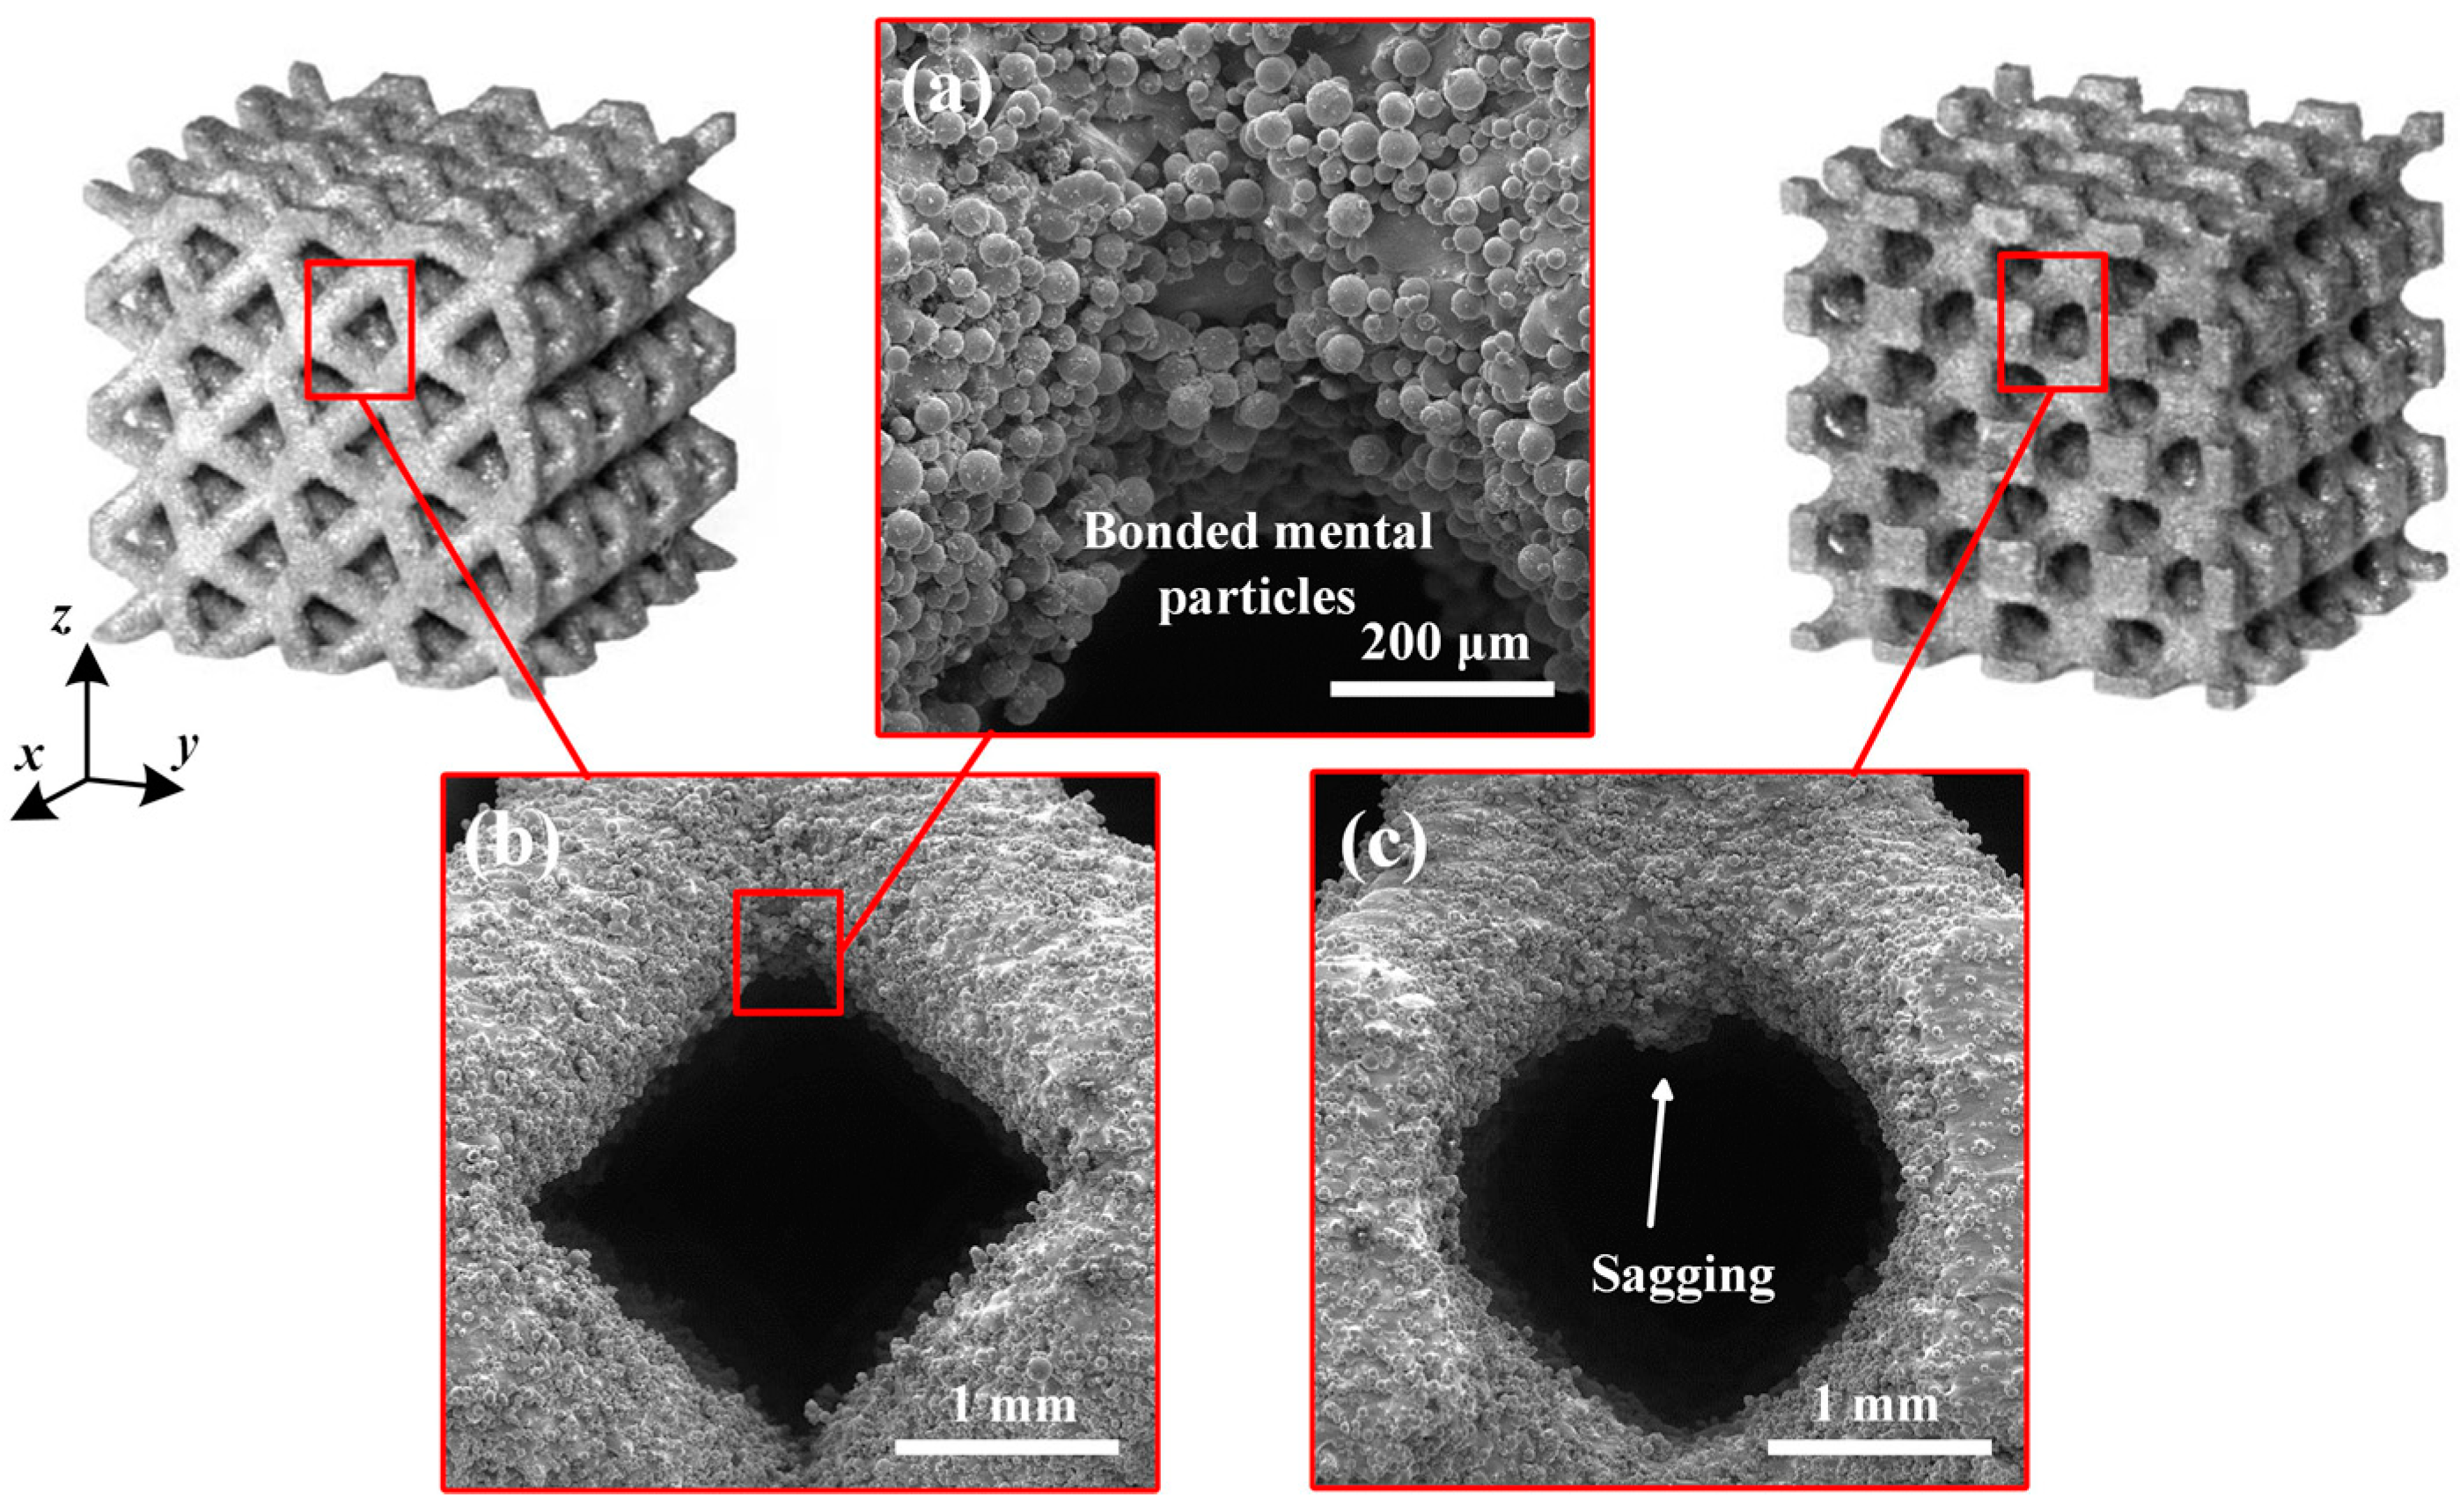
3.1. Geometry and Manufacturability
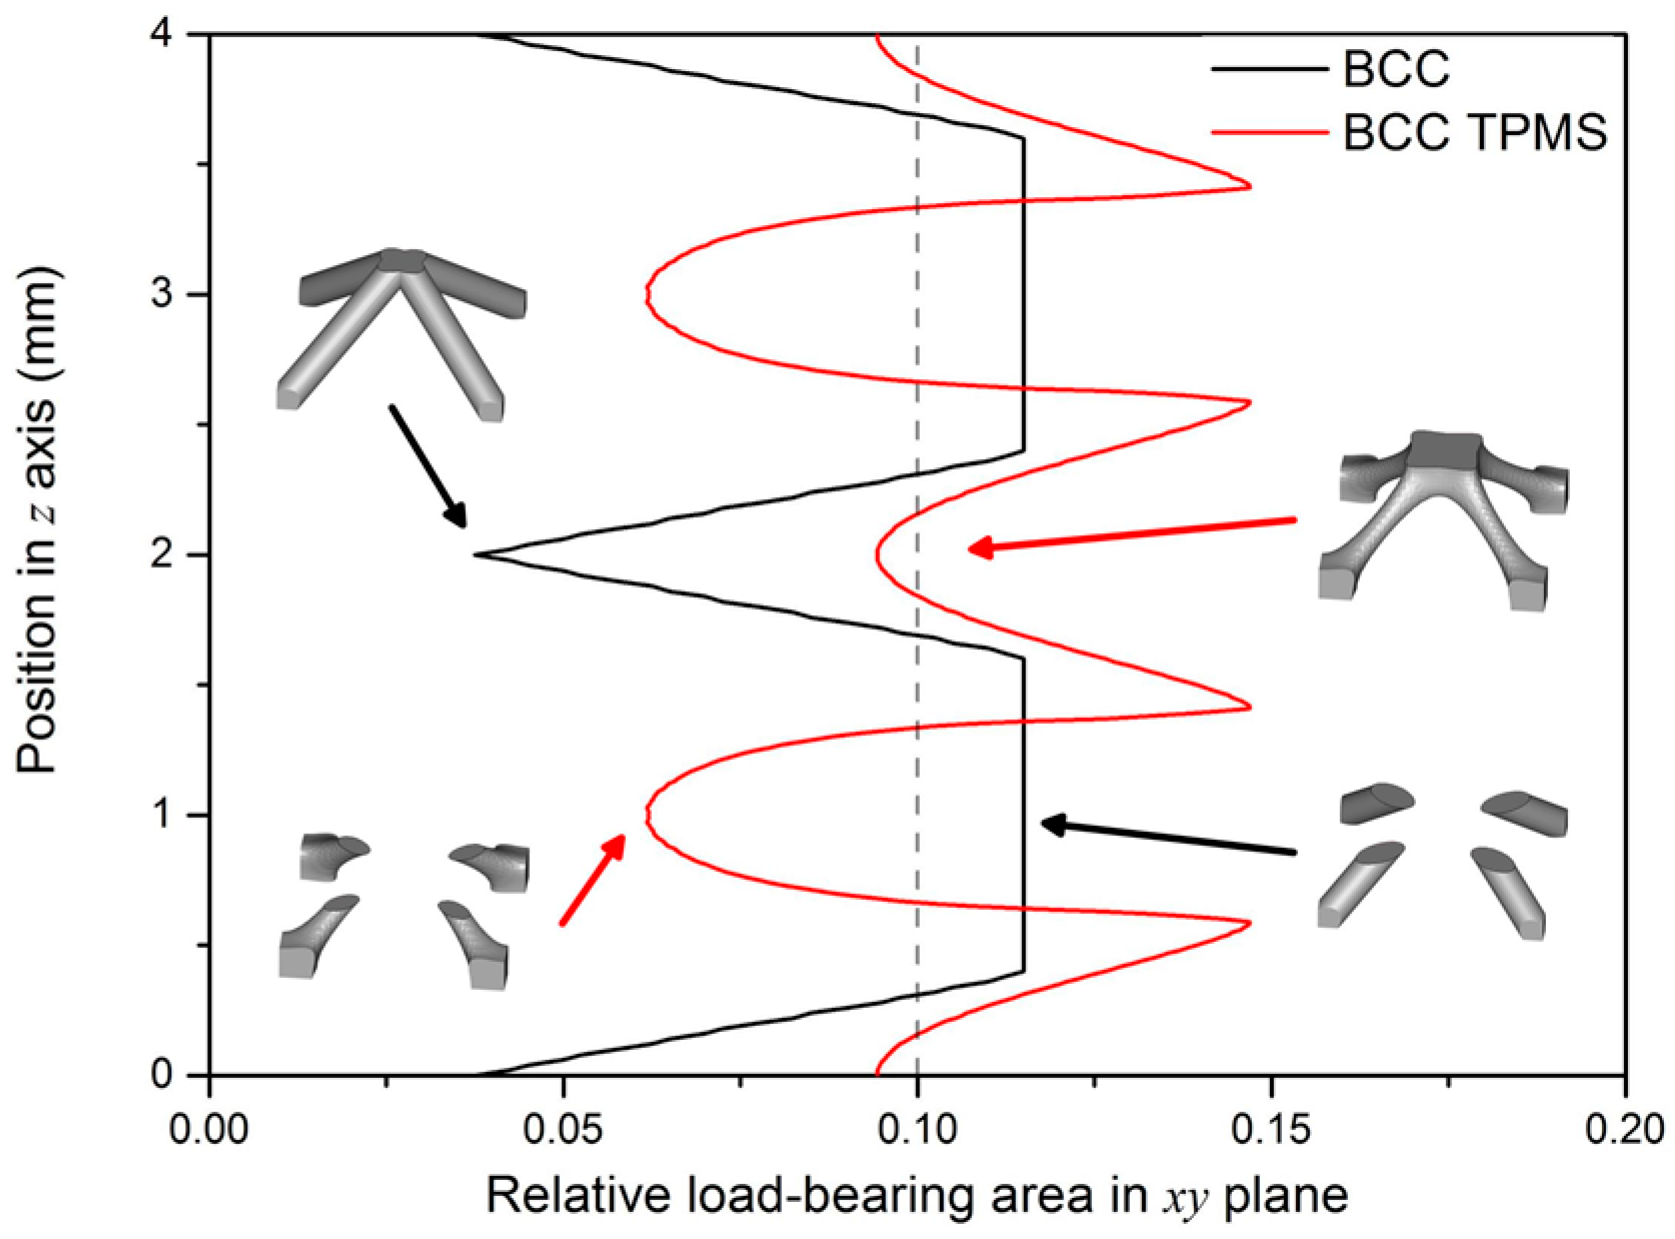
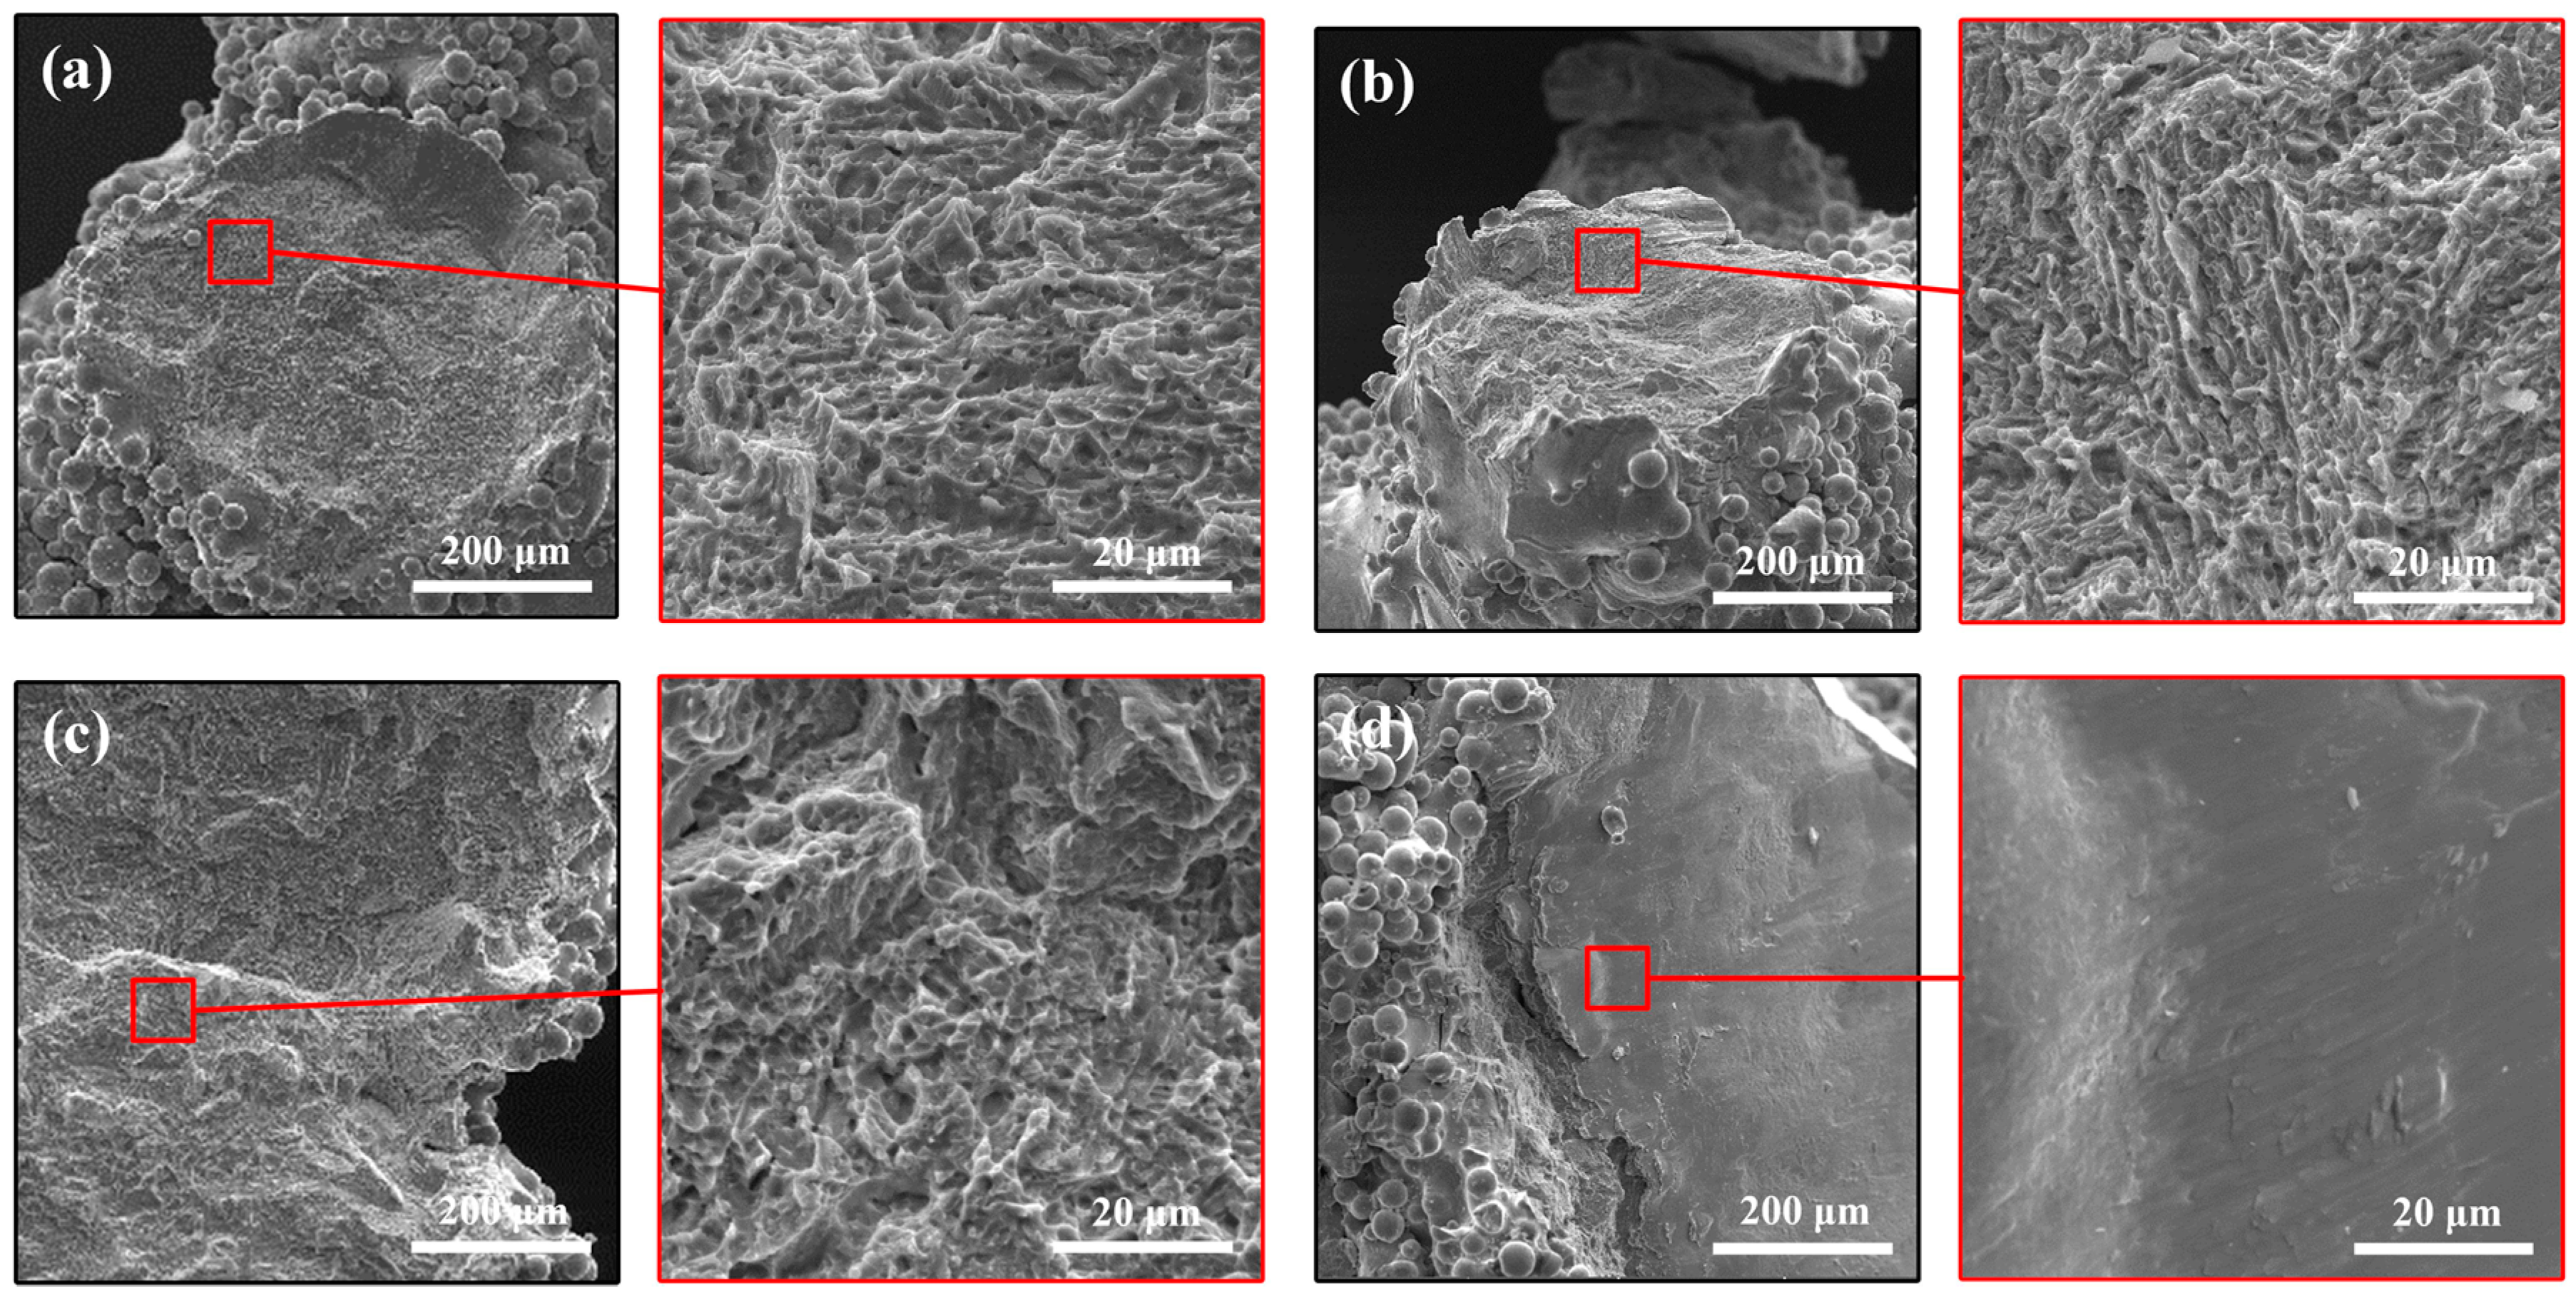
3.2. Deformation Behavior and Failure Mechanism
3.3. Mechanical Properties
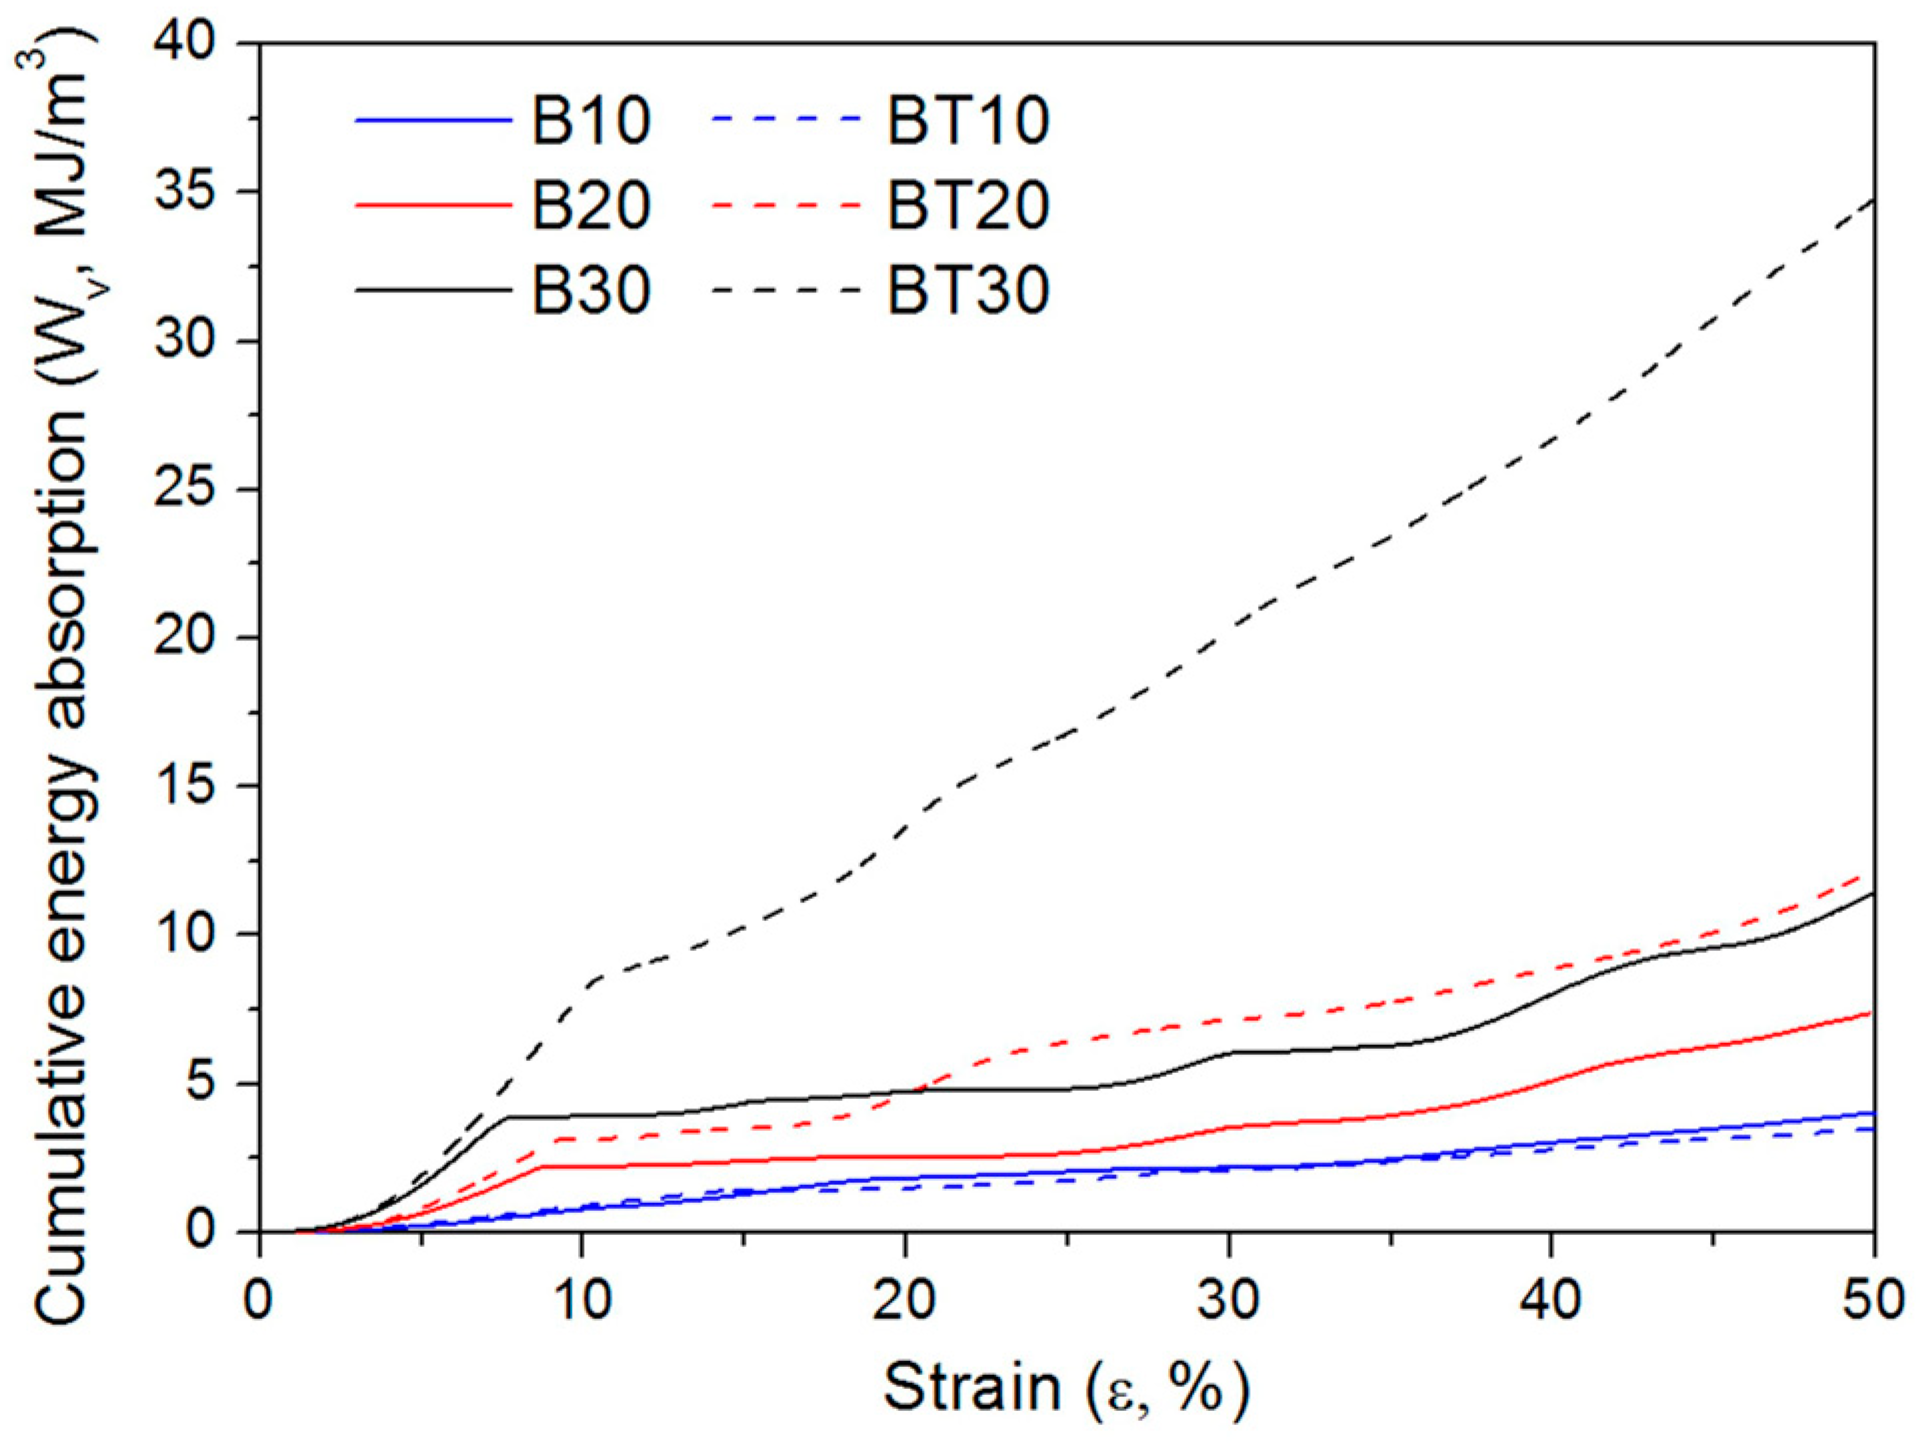
3.4. Energy Absorption under Compressive Deformation
4. Conclusions
Author Contributions
Funding
Conflicts of Interest
References
- Evans, A.G.; Hutchinson, J.W.; Fleck, N.A.; Ashby, M.F.; Wadley, H.N.G. The topological design of multifunctional cellular metals. Prog. Mater. Sci. 2001, 46, 309–327. [Google Scholar] [CrossRef]
- Zhang, J.; Chaisombat, K.; He, S.; Wang, C.H. Hybrid composite laminates reinforced with glass/carbon woven fabrics for lightweight load bearing structures. Mater. Des. (1980–2015) 2012, 36, 75–80. [Google Scholar] [CrossRef]
- Mines, R.A.W.; Tsopanos, S.; Shen, Y.; Hasan, R.; McKown, S.T. Drop weight impact behaviour of sandwich panels with metallic micro lattice cores. Int. J. Impact Eng. 2013, 60, 120–132. [Google Scholar] [CrossRef]
- Zhang, X.Y.; Fang, G.; Zhou, J. Additively manufactured scaffolds for bone tissue engineering and the prediction of their mechanical behavior: A review. Materials 2017, 10, 50. [Google Scholar] [CrossRef] [PubMed]
- Banhart, J. Manufacture, characterisation and application of cellular metals and metal foams. Prog. Mater. Sci. 2001, 46, 559–632. [Google Scholar] [CrossRef]
- Wang, J.; Evans, A.G.; Dharmasena, K.; Wadley, H.N.G. On the performance of truss panels with Kagomé cores. Int. J. Solids Struct. 2003, 40, 6981–6988. [Google Scholar] [CrossRef]
- Queheillalt, D.T.; Hass, D.D.; Sypeck, D.J.; Wadley, H.N.G. Synthesis of open-cell metal foams by templated directed vapor deposition. J. Mater. Res. 2011, 16, 1028–1036. [Google Scholar] [CrossRef]
- Zok, F.W.; Waltner, S.A.; Wei, Z.; Rathbun, H.J.; McMeeking, R.M.; Evans, A.G. A protocol for characterizing the structural performance of metallic sandwich panels: Application to pyramidal truss cores. Int. J. Solids Struct. 2004, 41, 6249–6271. [Google Scholar] [CrossRef]
- Brackett, D.J.; Ashcroft, I.A.; Wildman, R.D.; Hague, R.J.M. An error diffusion based method to generate functionally graded cellular structures. Comput. Struct. 2014, 138, 102–111. [Google Scholar] [CrossRef]
- Guo, N.; Leu, M.C. Additive manufacturing: Technology, applications and research needs. Front. Mech. Eng. 2013, 8, 215–243. [Google Scholar] [CrossRef]
- Aremu, A.O.; Brennan-Craddock, J.P.J.; Panesar, A.; Ashcroft, I.A.; Hague, R.J.M.; Wildman, R.D.; Tuck, C. A voxel-based method of constructing and skinning conformal and functionally graded lattice structures suitable for additive manufacturing. Addit. Manuf. 2017, 13, 1–13. [Google Scholar] [CrossRef]
- Mahshid, R.; Hansen, H.N.; Højbjerre, K.L. Strength analysis and modeling of cellular lattice structures manufactured using selective laser melting for tooling applications. Mater. Des. 2016, 104, 276–283. [Google Scholar] [CrossRef]
- Bai, L.; Zhang, J.; Chen, X.; Yi, C.; Chen, R.; Zhang, Z. Configuration optimization design of Ti6Al4V lattice structure formed by SLM. Materials 2018, 11, 1856. [Google Scholar] [CrossRef] [PubMed]
- Maxwell, J.C.L. On the calculation of the equilibrium and stiffness of frames. Lond. Edinb. Dublin Philos. Mag. J. Sci. 1864, 27, 294–299. [Google Scholar] [CrossRef]
- Deshpande, V.S.; Ashby, M.F.; Fleck, N.A. Foam topology: Bending versus stretching dominated architectures. Acta Mater. 2001, 49, 1035–1040. [Google Scholar] [CrossRef]
- Habib, F.N.; Iovenitti, P.; Masood, S.H.; Nikzad, M. Fabrication of polymeric lattice structures for optimum energy absorption using Multi Jet Fusion technology. Mater. Des. 2018, 155, 86–98. [Google Scholar] [CrossRef]
- Ushijima, K.; Cantwell, W.J. An investigation into the compressive properties of stainless steel micro-lattice sturctures. J. Sandw. Struct. Mater. 2010, 13, 303–329. [Google Scholar] [CrossRef]
- Ushijima, K.; Cantwell, W.J.; Chen, D.H. Prediction of the mechanical properties of micro-lattice structures subjected to multi-axial loading. Int. J. Mech. Sci. 2013, 68, 47–55. [Google Scholar] [CrossRef]
- Gümrük, R.; Mines, R.A.W.; Karadeniz, S. Static mechanical behaviours of stainless steel micro-lattice structures under different loading conditions. Mater. Sci. Eng. A 2013, 586, 392–406. [Google Scholar] [CrossRef]
- Tancogne-Dejean, T.; Mohr, D. Stiffness and specific energy absorption of additively-manufactured metallic BCC metamaterials composed of tapered beams. Int. J. Mech. Sci. 2018, 141, 101–116. [Google Scholar] [CrossRef]
- Papazetis, G.; Vosniakos, G.-C. Direct porous structure generation of tissue engineering scaffolds for layer-based additive manufacturing. Int. J. Adv. Manuf. Technol. 2016, 86, 871–883. [Google Scholar] [CrossRef]
- Liu, F.; Zhang, D.; Zhang, P.; Zhao, M.; Jafar, S. Mechanical properties of optimized diamond lattice structure for bone scaffolds fabricated via selective laser melting. Materials 2018, 11, 374. [Google Scholar] [CrossRef] [PubMed]
- Liu, Q.; Ruan, D.; Huang, X. Topology optimization of viscoelastic materials on damping and frequency of macrostructures. Comput. Methods Appl. Mech. Eng. 2018, 337, 305–323. [Google Scholar] [CrossRef]
- Melchels, F.P.; Bertoldi, K.; Gabbrielli, R.; Velders, A.H.; Feijen, J.; Grijpma, D.W. Mathematically defined tissue engineering scaffold architectures prepared by stereolithography. Biomaterials 2010, 31, 6909–6916. [Google Scholar] [CrossRef] [PubMed]
- Afshar, M.; Anaraki, A.P.; Montazerian, H.; Kadkhodapour, J. Additive manufacturing and mechanical characterization of graded porosity scaffolds designed based on triply periodic minimal surface architectures. J. Mech. Behav. Biomed. Mater. 2016, 62, 481–494. [Google Scholar] [CrossRef] [PubMed]
- Maskery, I.; Sturm, L.; Aremu, A.O.; Panesar, A.; Williams, C.B.; Tuck, C.J.; Wildman, R.D.; Ashcroft, I.A.; Hague, R.J.M. Insights into the mechanical properties of several triply periodic minimal surface lattice structures made by polymer additive manufacturing. Polymer 2017, 152, 62–71. [Google Scholar] [CrossRef]
- Bobbert, F.S.L.; Lietaert, K.; Eftekhari, A.A.; Pouran, B.; Ahmadi, S.M.; Weinans, H.; Zadpoor, A.A. Additively manufactured metallic porous biomaterials based on minimal surfaces: A unique combination of topological, mechanical, and mass transport properties. Acta Biomater. 2017, 53, 572–584. [Google Scholar] [CrossRef] [PubMed]
- Yang, N.; Quan, Z.; Zhang, D.; Tian, Y. Multi-morphology transition hybridization CAD design of minimal surface porous structures for use in tissue engineering. Comput.-Aided Des. 2014, 56, 11–21. [Google Scholar] [CrossRef]
- Yan, C.; Hao, L.; Hussein, A.; Young, P. Ti-6Al-4V triply periodic minimal surface structures for bone implants fabricated via selective laser melting. J. Mech. Behav. Biomed. Mater. 2015, 51, 61–73. [Google Scholar] [CrossRef] [PubMed]
- Yan, C.; Hao, L.; Hussein, A.; Young, P.; Raymont, D. Advanced lightweight 316L stainless steel cellular lattice structures fabricated via selective laser melting. Mater. Des. 2014, 55, 533–541. [Google Scholar] [CrossRef]
- Almeida, H.A.; Bartolo, P.J. Design of tissue engineering scaffolds based on hyperbolic surfaces: Structural numerical evaluation. Med. Eng. Phys. 2014, 36, 1033–1040. [Google Scholar] [CrossRef] [PubMed]
- Giannitelli, S.M.; Accoto, D.; Trombetta, M.; Rainer, A. Current trends in the design of scaffolds for computer-aided tissue engineering. Acta Biomater. 2014, 10, 580–594. [Google Scholar] [CrossRef] [PubMed]
- Maskery, I.; Aboulkhair, N.T.; Aremu, A.O.; Tuck, C.J.; Ashcroft, I.A.; Wildman, R.D.; Hague, R.J.M. A mechanical property evaluation of graded density Al-Si10-Mg lattice structures manufactured by selective laser melting. Mater. Sci. Eng. A 2016, 670, 264–274. [Google Scholar] [CrossRef]
- Smith, M.; Guan, Z.; Cantwell, W.J. Finite element modelling of the compressive response of lattice structures manufactured using the selective laser melting technique. Int. J. Mech. Sci. 2013, 67, 28–41. [Google Scholar] [CrossRef]
- Leary, M.; Mazur, M.; Elambasseril, J.; McMillan, M.; Chirent, T.; Sun, Y.; Qian, M.; Easton, M.; Brandt, M. Selective laser melting (SLM) of AlSi12Mg lattice structures. Mater. Des. 2016, 98, 344–357. [Google Scholar] [CrossRef]
- Cao, X.; Duan, S.; Liang, J.; Wen, W.; Fang, D. Mechanical properties of an improved 3D-printed rhombic dodecahedron stainless steel lattice structure of variable cross section. Int. J. Mech. Sci. 2018, 145, 53–63. [Google Scholar] [CrossRef]
- Von Schnering, H.G.; Nesper, R. Nodal surfaces of Fourier series: Fundamental invariants of structured matter. Z. Phys. B Condens. Matter 1991, 83, 407–412. [Google Scholar] [CrossRef]
- Yang, N.; Tian, Y.; Zhang, D. Novel real function based method to construct heterogeneous porous scaffolds and additive manufacturing for use in medical engineering. Med. Eng. Phys. 2015, 37, 1037–1046. [Google Scholar] [CrossRef] [PubMed]
- Choy, S.Y.; Sun, C.-N.; Leong, K.F.; Wei, J. Compressive properties of functionally graded lattice structures manufactured by selective laser melting. Mater. Des. 2017, 131, 112–120. [Google Scholar] [CrossRef]
- Qiu, C.; Yue, S.; Adkins, N.J.E.; Ward, M.; Hassanin, H.; Lee, P.D.; Withers, P.J.; Attallah, M.M. Influence of processing conditions on strut structure and compressive properties of cellular lattice structures fabricated by selective laser melting. Mater. Sci. Eng. A 2015, 628, 188–197. [Google Scholar] [CrossRef]
- British Standards Institution. Mechanical Testing of Metals—Ductility Testing—Compression Test for Porous and Cellular Metals; British Standards Institution: London, UK, 2011. [Google Scholar]
- Movahedi, N.; Linul, E. Quasi-static compressive behavior of the ex-situ aluminum-alloy foam-filled tubes under elevated temperature conditions. Mater. Lett. 2017, 206, 182–184. [Google Scholar] [CrossRef]
- Linul, E.; Marşavina, L.; Linul, P.-A.; Kovacik, J. Cryogenic and high temperature compressive properties of Metal Foam Matrix Composites. Compos. Struct. 2019, 209, 490–498. [Google Scholar] [CrossRef]
- Choy, S.Y.; Sun, C.-N.; Leong, K.F.; Wei, J. Compressive properties of Ti-6Al-4V lattice structures fabricated by selective laser melting: Design, orientation and density. Addit. Manuf. 2017, 16, 213–224. [Google Scholar] [CrossRef]
- Yang, L.; Yan, C.; Han, C.; Chen, P.; Yang, S.; Shi, Y. Mechanical response of a triply periodic minimal surface cellular structures manufactured by selective laser melting. Int. J. Mech. Sci. 2018, 148, 149–157. [Google Scholar] [CrossRef]
- Linul, E.; Movahedi, N.; Marsavina, L. The temperature and anisotropy effect on compressive behavior of cylindrical closed-cell aluminum-alloy foams. J. Alloys Compd. 2018, 740, 1172–1179. [Google Scholar] [CrossRef]
- Ataee, A.; Li, Y.; Fraser, D.; Song, G.; Wen, C. Anisotropic Ti-6Al-4V gyroid scaffolds manufactured by electron beam melting (EBM) for bone implant applications. Mater. Des. 2018, 137, 345–354. [Google Scholar] [CrossRef]
- Ashby, M.F. The properties of foams and lattices. Philos. Trans. R. Soc. A Math. Phys. Eng. Sci. 2006, 364, 15–30. [Google Scholar] [CrossRef] [PubMed]
- Gümrük, R.; Mines, R.A.W. Compressive behaviour of stainless steel micro-lattice structures. Int. J. Mech. Sci. 2013, 68, 125–139. [Google Scholar] [CrossRef]
- Gibson, L.J.; Ashby, M.F. Cellular Solids: Structure and Properties; Cambridge University Press: Cambridge, UK, 1997. [Google Scholar]
- ISO. Metallic Materials—Tensile Testing—Part 1: Method of Test at Room Temperature; International Organization for Standardization: Geneva, Switzerland, 2009. [Google Scholar]


| Num | ||||||
|---|---|---|---|---|---|---|
| CAD-Based BCC | TPMS-Based BCC | |||||
| 0% | 10% | 20% | 0% | 10% | 20% | |
| B10/ BT10 |  |  |  |  |  |  |
| B20/ BT20 |  |  |  |  |  |  |
| B30/ BT30 |  |  |  |  |  |  |
| Num | Elastic Modulus | Yield Strength | Compression Strength |
|---|---|---|---|
| B10 | 224.6 ± 3.1 | 9.68 ± 0.32 | 12.87 ± 0.26 |
| BT10 | 284.7 ± 13.9 | 11.55 ± 0.04 | 13.14 ± 0.24 |
| B20 | 873.3 ± 15.4 | 41.97 ± 0.42 | 47.23 ± 0.85 |
| BT20 | 1230.3 ± 10.1 | 54.25 ± 0.54 | 59.62 ± 0.94 |
| B30 | 1904.4 ± 59.9 | 97.14 ± 0.57 | 98.77 ± 1.30 |
| BT30 | 2451.1 ± 33.9 | 121.09 ± 1.79 | 134.93 ± 1.79 |
| B10 | BT10 | B20 | BT20 | B30 | BT30 | |
|---|---|---|---|---|---|---|
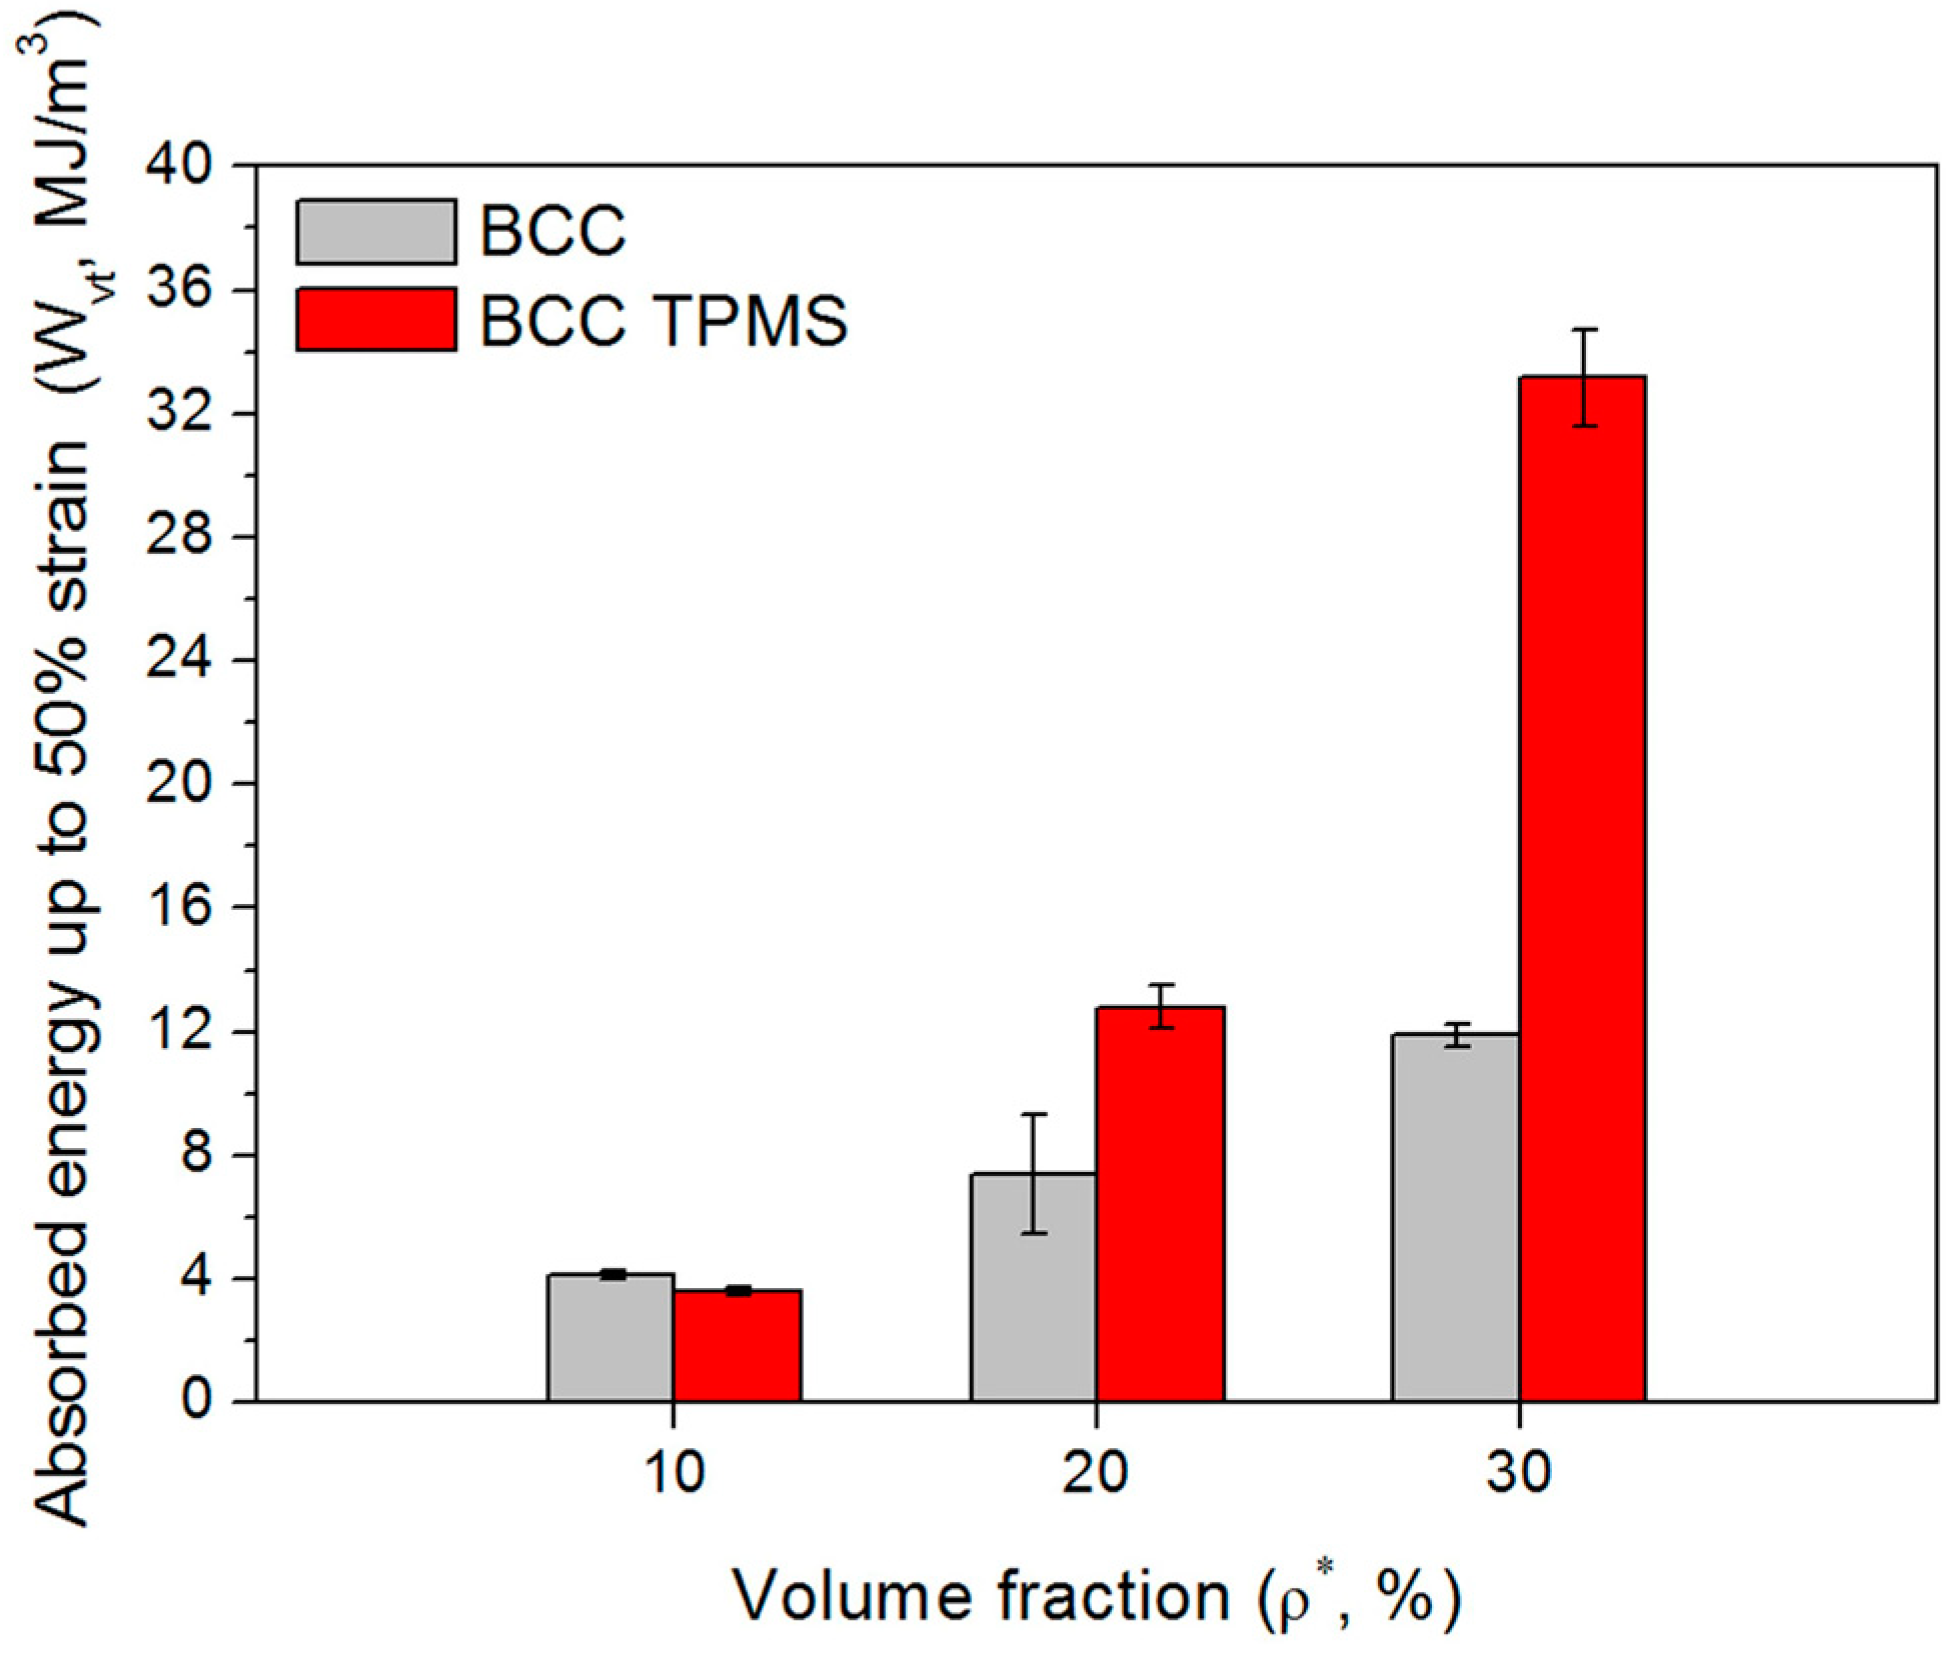
| (MJ/m3) | 4.13 ± 0.14 | 3.6 ± 0.13 | 7.39 ± 1.92 | 12.81 ± 0.68 | 11.88 ± 0.39 | 33.16 ± 1.57 |
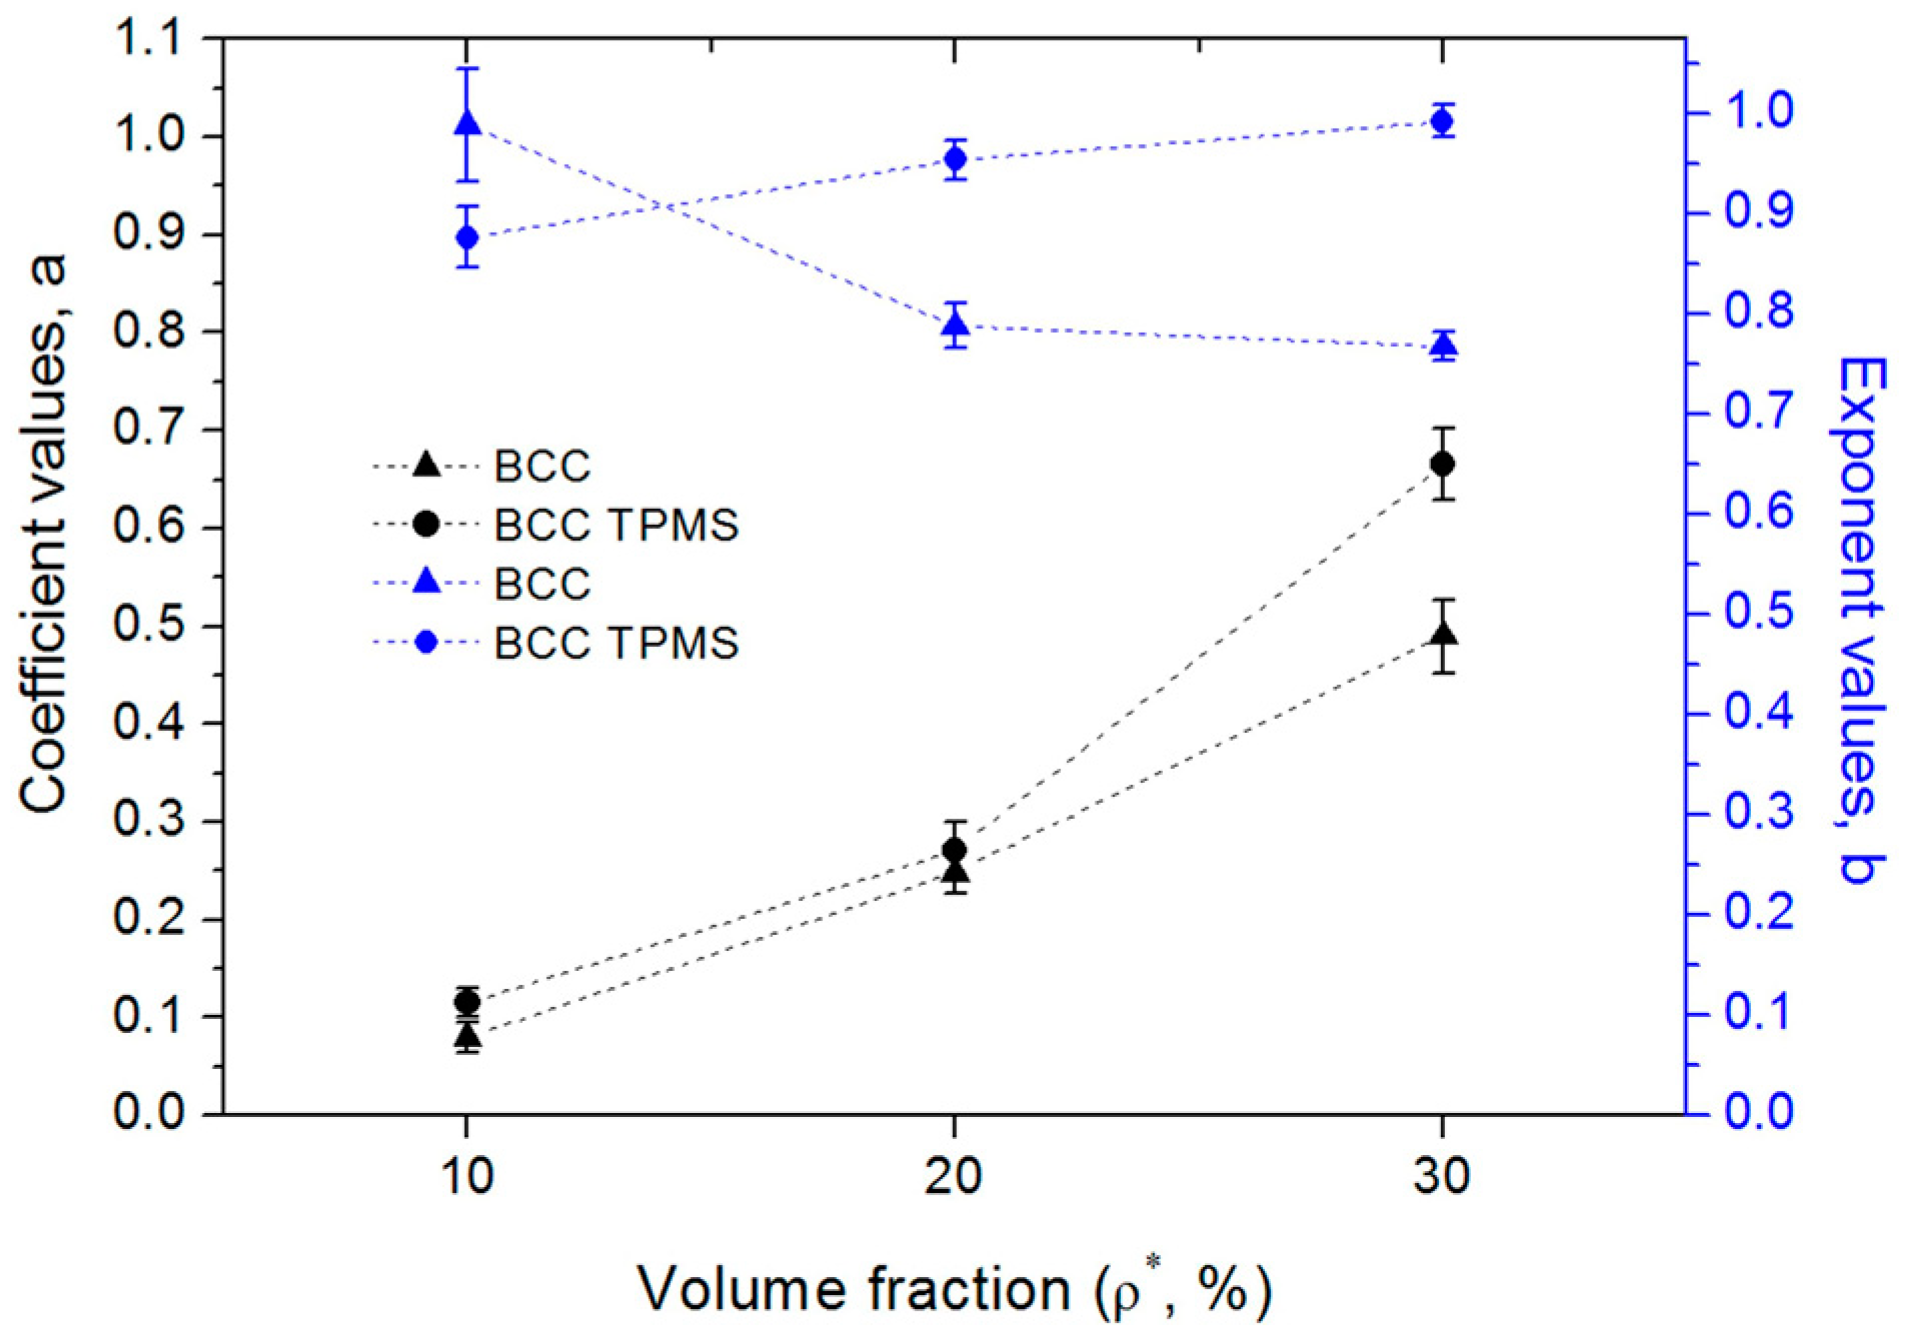
| B10 | BT10 | B20 | BT20 | B30 | BT30 | |
|---|---|---|---|---|---|---|
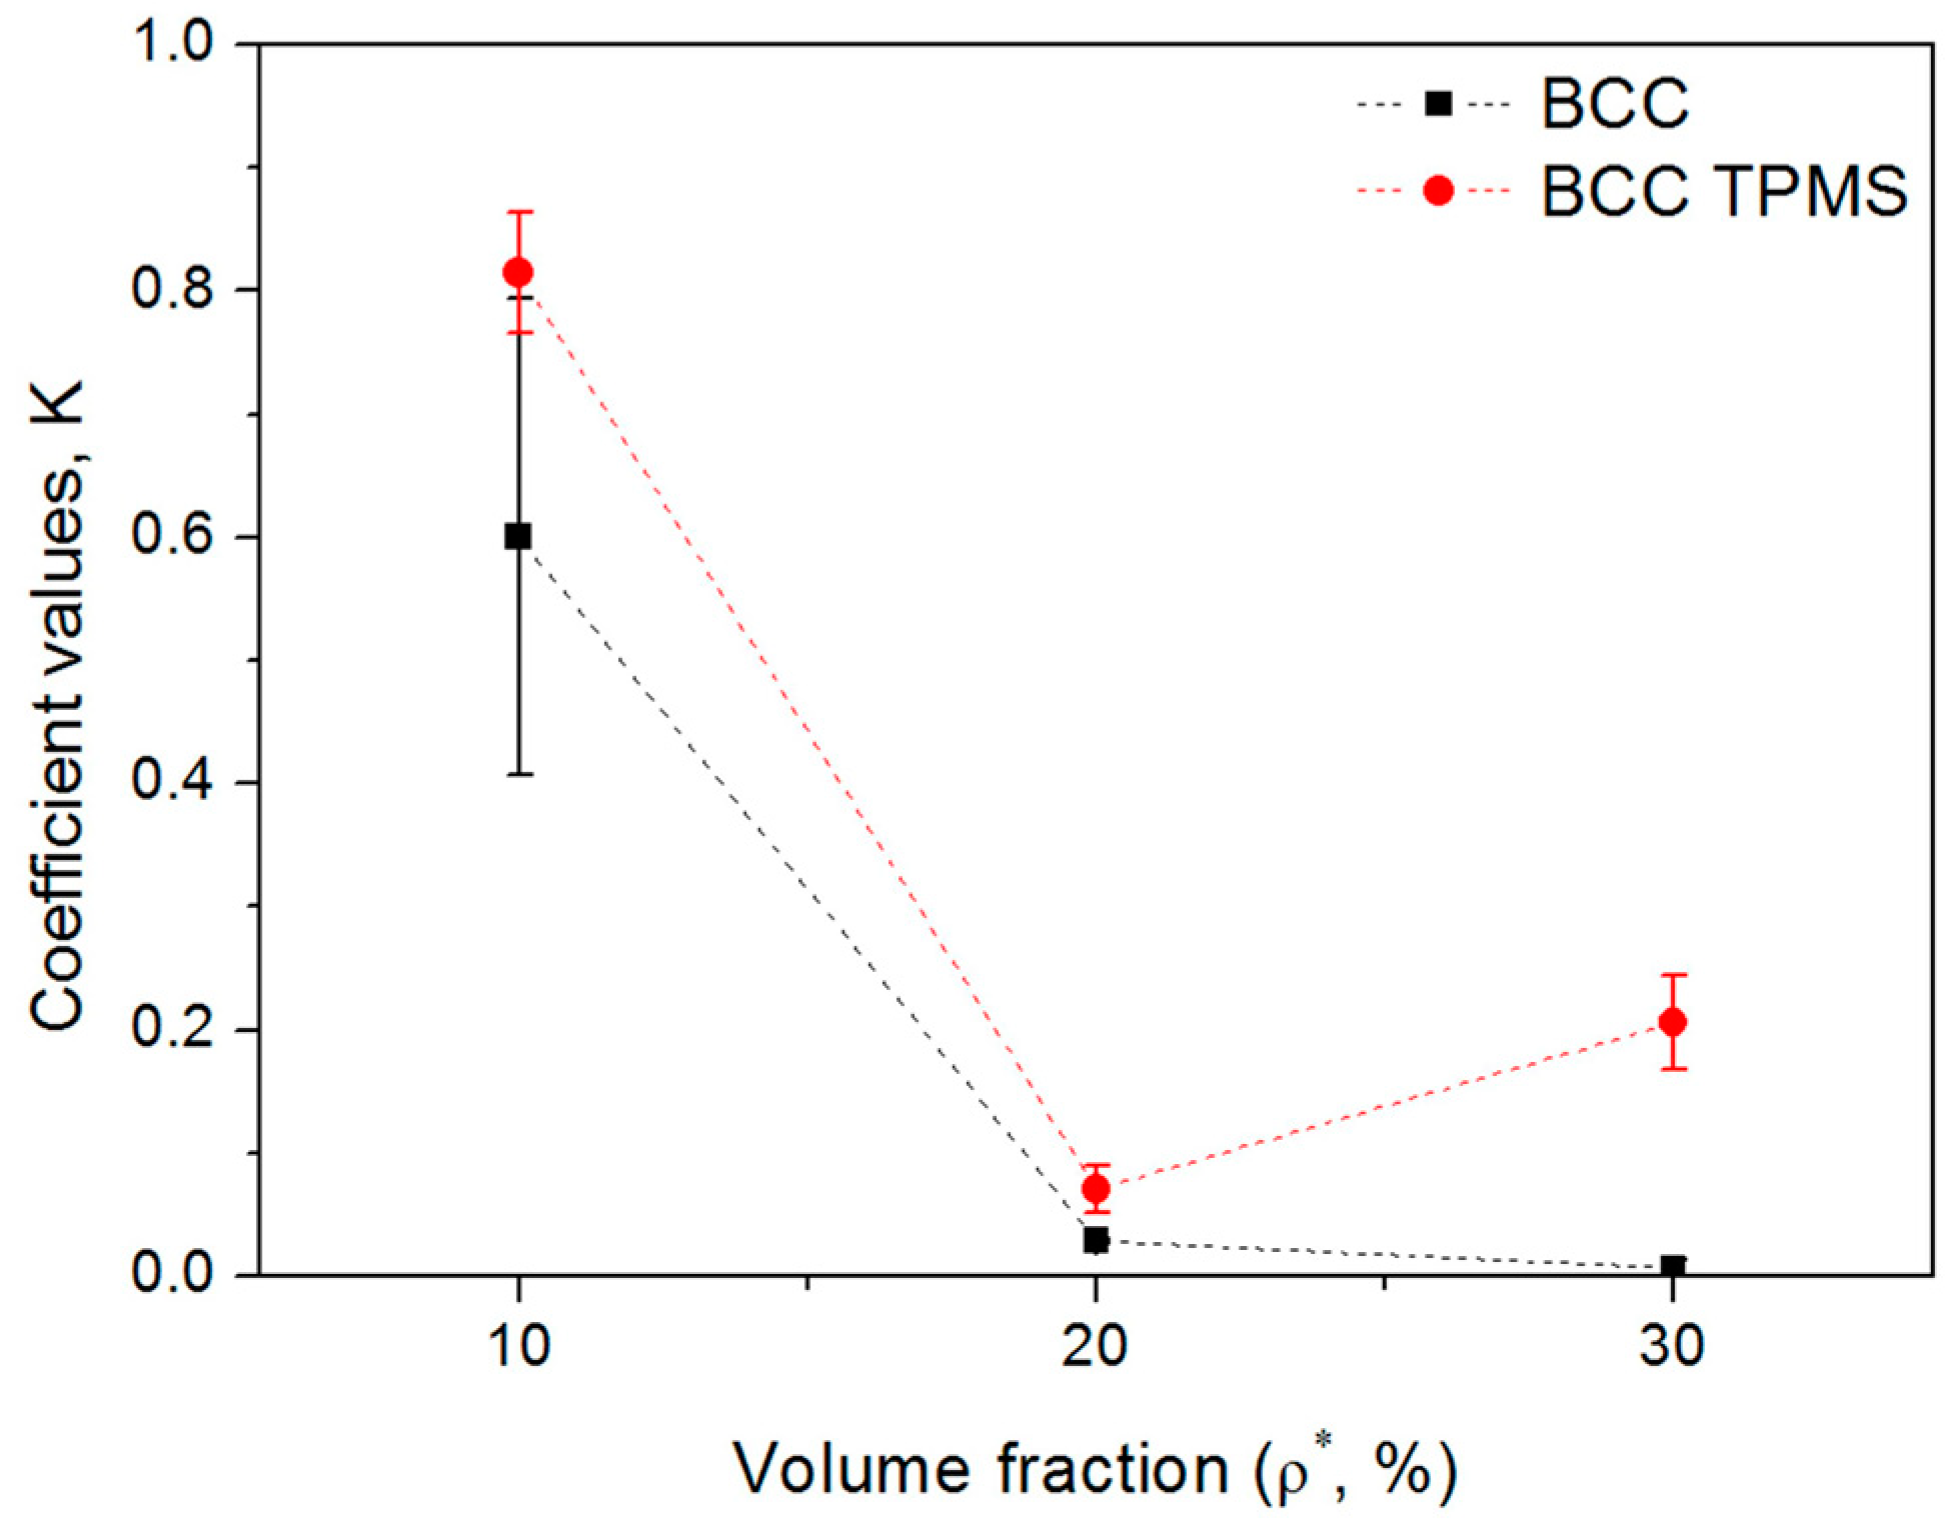
| 0.085 ± 0.151 | 0.114 ± 0.015 | 0.248 ± 0.022 | 0.271 ± 0.029 | 0.490 ± 0.037 | 0.667 ± 0.037 | |
| 0.989 ± 0.056 | 0.876 ± 0.027 | 0.788 ± 0.021 | 0.954 ± 0.020 | 0.769 ± 0.015 | 0.993 ± 0.016 |
© 2018 by the authors. Licensee MDPI, Basel, Switzerland. This article is an open access article distributed under the terms and conditions of the Creative Commons Attribution (CC BY) license (http://creativecommons.org/licenses/by/4.0/).
Share and Cite
Zhao, M.; Liu, F.; Fu, G.; Zhang, D.Z.; Zhang, T.; Zhou, H. Improved Mechanical Properties and Energy Absorption of BCC Lattice Structures with Triply Periodic Minimal Surfaces Fabricated by SLM. Materials 2018, 11, 2411. https://doi.org/10.3390/ma11122411
Zhao M, Liu F, Fu G, Zhang DZ, Zhang T, Zhou H. Improved Mechanical Properties and Energy Absorption of BCC Lattice Structures with Triply Periodic Minimal Surfaces Fabricated by SLM. Materials. 2018; 11(12):2411. https://doi.org/10.3390/ma11122411
Chicago/Turabian StyleZhao, Miao, Fei Liu, Guang Fu, David Z. Zhang, Tao Zhang, and Hailun Zhou. 2018. "Improved Mechanical Properties and Energy Absorption of BCC Lattice Structures with Triply Periodic Minimal Surfaces Fabricated by SLM" Materials 11, no. 12: 2411. https://doi.org/10.3390/ma11122411
APA StyleZhao, M., Liu, F., Fu, G., Zhang, D. Z., Zhang, T., & Zhou, H. (2018). Improved Mechanical Properties and Energy Absorption of BCC Lattice Structures with Triply Periodic Minimal Surfaces Fabricated by SLM. Materials, 11(12), 2411. https://doi.org/10.3390/ma11122411