Article

Investigation of the Localized Corrosion and Passive Behavior of Type 304 Stainless Steels with 0.2–1.8 wt % B

1
Ferrous Alloy Department, Korea Institute of Materials Science, Changwon 51508, Korea
2
Department of Metallurgical Engineering, Pusan National University, Busan 46241, Korea
*
Author to whom correspondence should be addressed.
Materials 2018, 11(11), 2097; https://doi.org/10.3390/ma11112097
Submission received: 5 May 2018 / Revised: 21 May 2018 / Accepted: 22 May 2018 / Published: 25 October 2018
(This article belongs to the Section Corrosion)

Abstract

:
The pitting corrosion resistance and passive behavior of type 304 borated stainless steels (Febalance–18Cr–12Ni–1.5Mn–(0.19, 0.78, and 1.76 wt %)B) manufactured through conventional ingot metallurgy were investigated. The alloys were composed of an austenitic matrix and Cr2B phase, and the volume fraction of Cr2B increased from 1.68 to 22.66 vol % as the B content increased from 0.19 to 1.76 wt %. Potentiodynamic polarization tests measured in aqueous NaCl solutions revealed that the pitting corrosion resistance was reduced as the B content increased and the pits were initiated at the matrix adjacent to the Cr2B phase. It was found that the reduced resistance to pitting corrosion by B addition was due to the formation of more defective and thinner passive film and increased pit initiation sites in the matrix.

1. Introduction

Boron (B)-containing austenitic stainless steels known as borated stainless steels (BSSs) have been widely used in the nuclear industry primarily due to their excellent thermal neutron attenuation capability. The BSSs are used in storage racks and transportation casks for the storage of spent nuclear fuel from power reactors [1,2,3,4,5,6,7,8,9,10,11]. Because the neutron absorption ability directly relies on the B content in the materials [3,6,8,10], the BSS should contain as much B as possible to be safely used as wet storage rack materials for spent nuclear fuel. In addition, desirable strength, formability, and corrosion resistance in a wet storage environment are also required. Eight types of BSSs based on AISI S30400 stainless steel, which meet the requirements of the mechanical properties, are specified in ASTM A 887–89 (ASTM International, West Conshohocken, PA, USA, 2004a) [12] from 304B with 0.20–0.29 wt % B to 304B7 with 1.75–2.25 wt % B [2,3,7,8,9,10,11].
A small addition of B of less than approximately 50 ppm to FeCrNi-based austenitic stainless steels is recognized to be beneficial to the creep resistance, hot workability, and intergranular corrosion resistance [13,14,15,16,17,18]. However, the solubility of B in the austenitic stainless steels is very limited—as low as approximately 100–150 ppm depending on the matrix composition [9,13,19]; thus, the addition of an excessive amount of B inevitably forms M2B (M stands for metal; Cr and/or Fe) type phase, which is known to degrade the mechanical and corrosion properties [4,5,6,7,8,13,20]. The corrosion damage of the stainless steel racks can accelerate the fracture of the structure; thus, the corrosion behavior of BSSs has been investigated and well documented. Loria et al. [13] reported the general corrosion behavior and intergranular corrosion susceptibility of type 304 stainless steel with 0.5 wt % B and without B in sulfuric acid solution. He et al. [8] investigated the general and localized corrosion behavior of BSSs (UNS S30464 and UNS S30465) in simulated groundwater at 60–90 °C. Lister et al. [7] also examined the general and pitting corrosion resistance of UNS S30464-S30466 alloys (made through powder metallurgy) and type 316 stainless steel with 1 wt % B (made through ingot metallurgy) in aqueous solutions containing Cl and NO3. In addition, Moreno et al. [6] focused on the pitting corrosion resistance of UNS S30466 alloy in aqueous solutions with NaCl and NaCl + Na2S. Upadhyay et al. [20] investigated the localized corrosion resistance of type 304 stainless steels with (1.2 wt %) and without B through electrochemical noise analyses and polarization tests. A consensus was found that lower corrosion resistance was obtained in the alloys with higher B content.
Although several researchers have investigated the various types of corrosion of BSSs, little work has been done on the passive behavior of BSSs. In general, the BSSs applied for wet spent fuel storage racks are installed in an on-site spent fuel storage pool, and they are exposed to a relatively mild corrosive environment with low Cl concentration and near-neutral pH. Under this condition, the overall corrosion resistance of the BSS rack primarily depends on the protectiveness of the passive film; thus, it is necessary to investigate the passive behavior of BSSs. Therefore, the present paper aims to investigate the passive behavior and the resistance to passivity breakdown of type 304 stainless steels (Febalance18Cr12Ni1.5Mn-based alloys, in wt %) containing 0.19–1.76 wt % B, which were manufactured through conventional ingot metallurgy.

2. Materials and Methods

2.1. Materials

The investigated alloys were Febalance18Cr12Ni1.5Mn-based alloys (type 304 stainless steels) containing 0.19–1.76 wt % B. The detailed chemical compositions of the alloys are given in Table 1. The alloys were fabricated through conventional ingot metallurgy. The ingots (50 kg) were reheated at 1150 °C for 1 h and then hot-rolled into plates with a thickness of 40 mm. The hot-rolled plates were solutionized at 1050 °C for 1 h followed by water quenching. The temperatures for reheating and solutionization were determined based on thermodynamic calculations, which were conducted using ThermoCalc software with the TCFE 7.0 database [21]. Based on the compositions in Table 1, the equilibrium between liquid, FCC, BCC, Cr2B, and Cr23C6 phases was estimated.
For microstructure observation, the alloy specimens (15 mm × 10 mm × 3 mm) were polished using a diamond suspension with a particle size of 1 μm and then etched using a mixed solution of 30 mL HCl + 20 mL HNO3 + 50 mL ethanol. The microstructures of the specimens were observed using an optical microscope (Epiphot, Nikon, Japan) and a scanning electron microscope (SEM, JSM-7100F, JEOL, Tokyo, Japan). In addition, the chemical composition of the second phase was investigated using electron probe microanalysis with wavelength dispersive spectrometry (EPMA-WDS, JXA-8530F, JEOL). Based on the micrographs, fractions and sizes of the second phases were measured using Image-Pro Plus 7.1 software (Media Cybernetics, Silver Spring, MD, USA). For the analyses of the second phase formed after solution treatment, a transmission electron microscope (TEM, JEM-2100F, JEOL, Japan) operating at 200 kV was used. In order to identify the second phase directly, a dual beam system (NOVA 200, FEI Company, Hillsboro, OR, USA) composed of both focused ion beam (FIB) and high-resolution SEM columns was used. Cross-section milling was performed with 30 kV Ga ions. Pt was deposited on the interface between the Omni-probe and sample, and the final cuts were made by FIB. The standard lift-out technique was used where the specimen was removed from the trench using an Omni-probe and placed on a Cu grid for TEM observation.

2.2. Pitting Corrosion Resistance

The resistance to pitting corrosion of the alloys was evaluated through polarization and immersion tests in aqueous solutions containing Cl. The polarization tests were conducted in 10 ppm and 58 ppm NaCl solutions at 20 ± 1 °C, and the potential sweep rate was 2 mV s−1. After the test, the pit initiation sites were observed using SEM and a surface profiler (Wyko NT8000, Veeco, Plainview, NY, USA [22]). The immersion tests were conducted in 3.5 wt % (=0.6 M) NaCl solution for 35 days at 20 ± 1 °C. For the immersion tests, the specimens (40 mm × 10 mm × 3 mm) were polished using a 1 μm sized diamond suspension.

2.3. Passive Film Properties

Passive behavior and passive film properties were investigated. For these investigations, a borate–phosphate–citric buffer solution with pH 8.5 (0.2 M boric acid + 0.05 M citric acid + 0.1 M tertiary sodium phosphate) was used, which is proven to form a stable and thick passive film on Fe-based alloys [23]. The polarization behavior of the alloy was examined through potentiodynamic polarization tests in the buffer solution at 20 ± 1 °C at a potential sweep rate of 2 mV s−1 in order to measure the potential range for the stable passive state and passive current density (ipassive).
Then the chemical and electronic properties of the passive films were investigated. The chemical composition of the passive film was examined through X-ray photoelectron spectroscopy (XPS, PHI 5000 VersaProbe, ULVAC-PHI, Kanagawa, Japan) using an Al Kα anode X-ray source (150 W, 15 kV, hν = 1486.6 eV). For the XPS analysis, the passive films were formed on the BSSs in the buffer solution (pH 8.5) by applying constant anodic potential of 0 VSCE for 3 h.
Regarding the electronic properties of the passive film, the point defect density of the space charge layer of the passive film was investigated through Mott–Schottky analysis. For this, the passive film was potentiostatically grown by applying constant anodic potential of 0.6 VSCE for 1 h in the borate–phosphate–citric buffer solution (pH 8.5), and then the capacitance of the passivated layer was measured at a frequency of 1000 Hz with an imposing sinusoidal voltage perturbation of ±0.01 V (peak-to-peak) during the negative potential sweep from 0.6 to −0.7 VSCE with a potential sweep rate of 0.01 V step−1.
All of the polarization tests and capacitance measurements (Mott–Schottky analysis) were conducted in a standard three-electrode setup with the metal specimen being a working electrode, a Pt plate (50 mm × 120 mm × 0.1 mm) as a counter electrode, and a saturated calomel reference electrode (SCE) as a reference electrode; the electrochemical tests were controlled by a potentiostat (Reference 600, GAMRY Instruments, Philadelphia, PA, USA). For the working electrode, the specimens (10 mm × 10 mm × 3 mm) were mounted in cold epoxy resin and then mechanically ground using SiC emery paper up to 2000 grit. The polarization test was performed on an exposed area of 0.2 cm2, which was controlled using electroplating tape. The polarization tests were performed on each specimen 3–5 times, and the capacitance of the passive layer was repetitively measured on each specimen three times in order to confirm reproducibility.

3. Results and Discussion
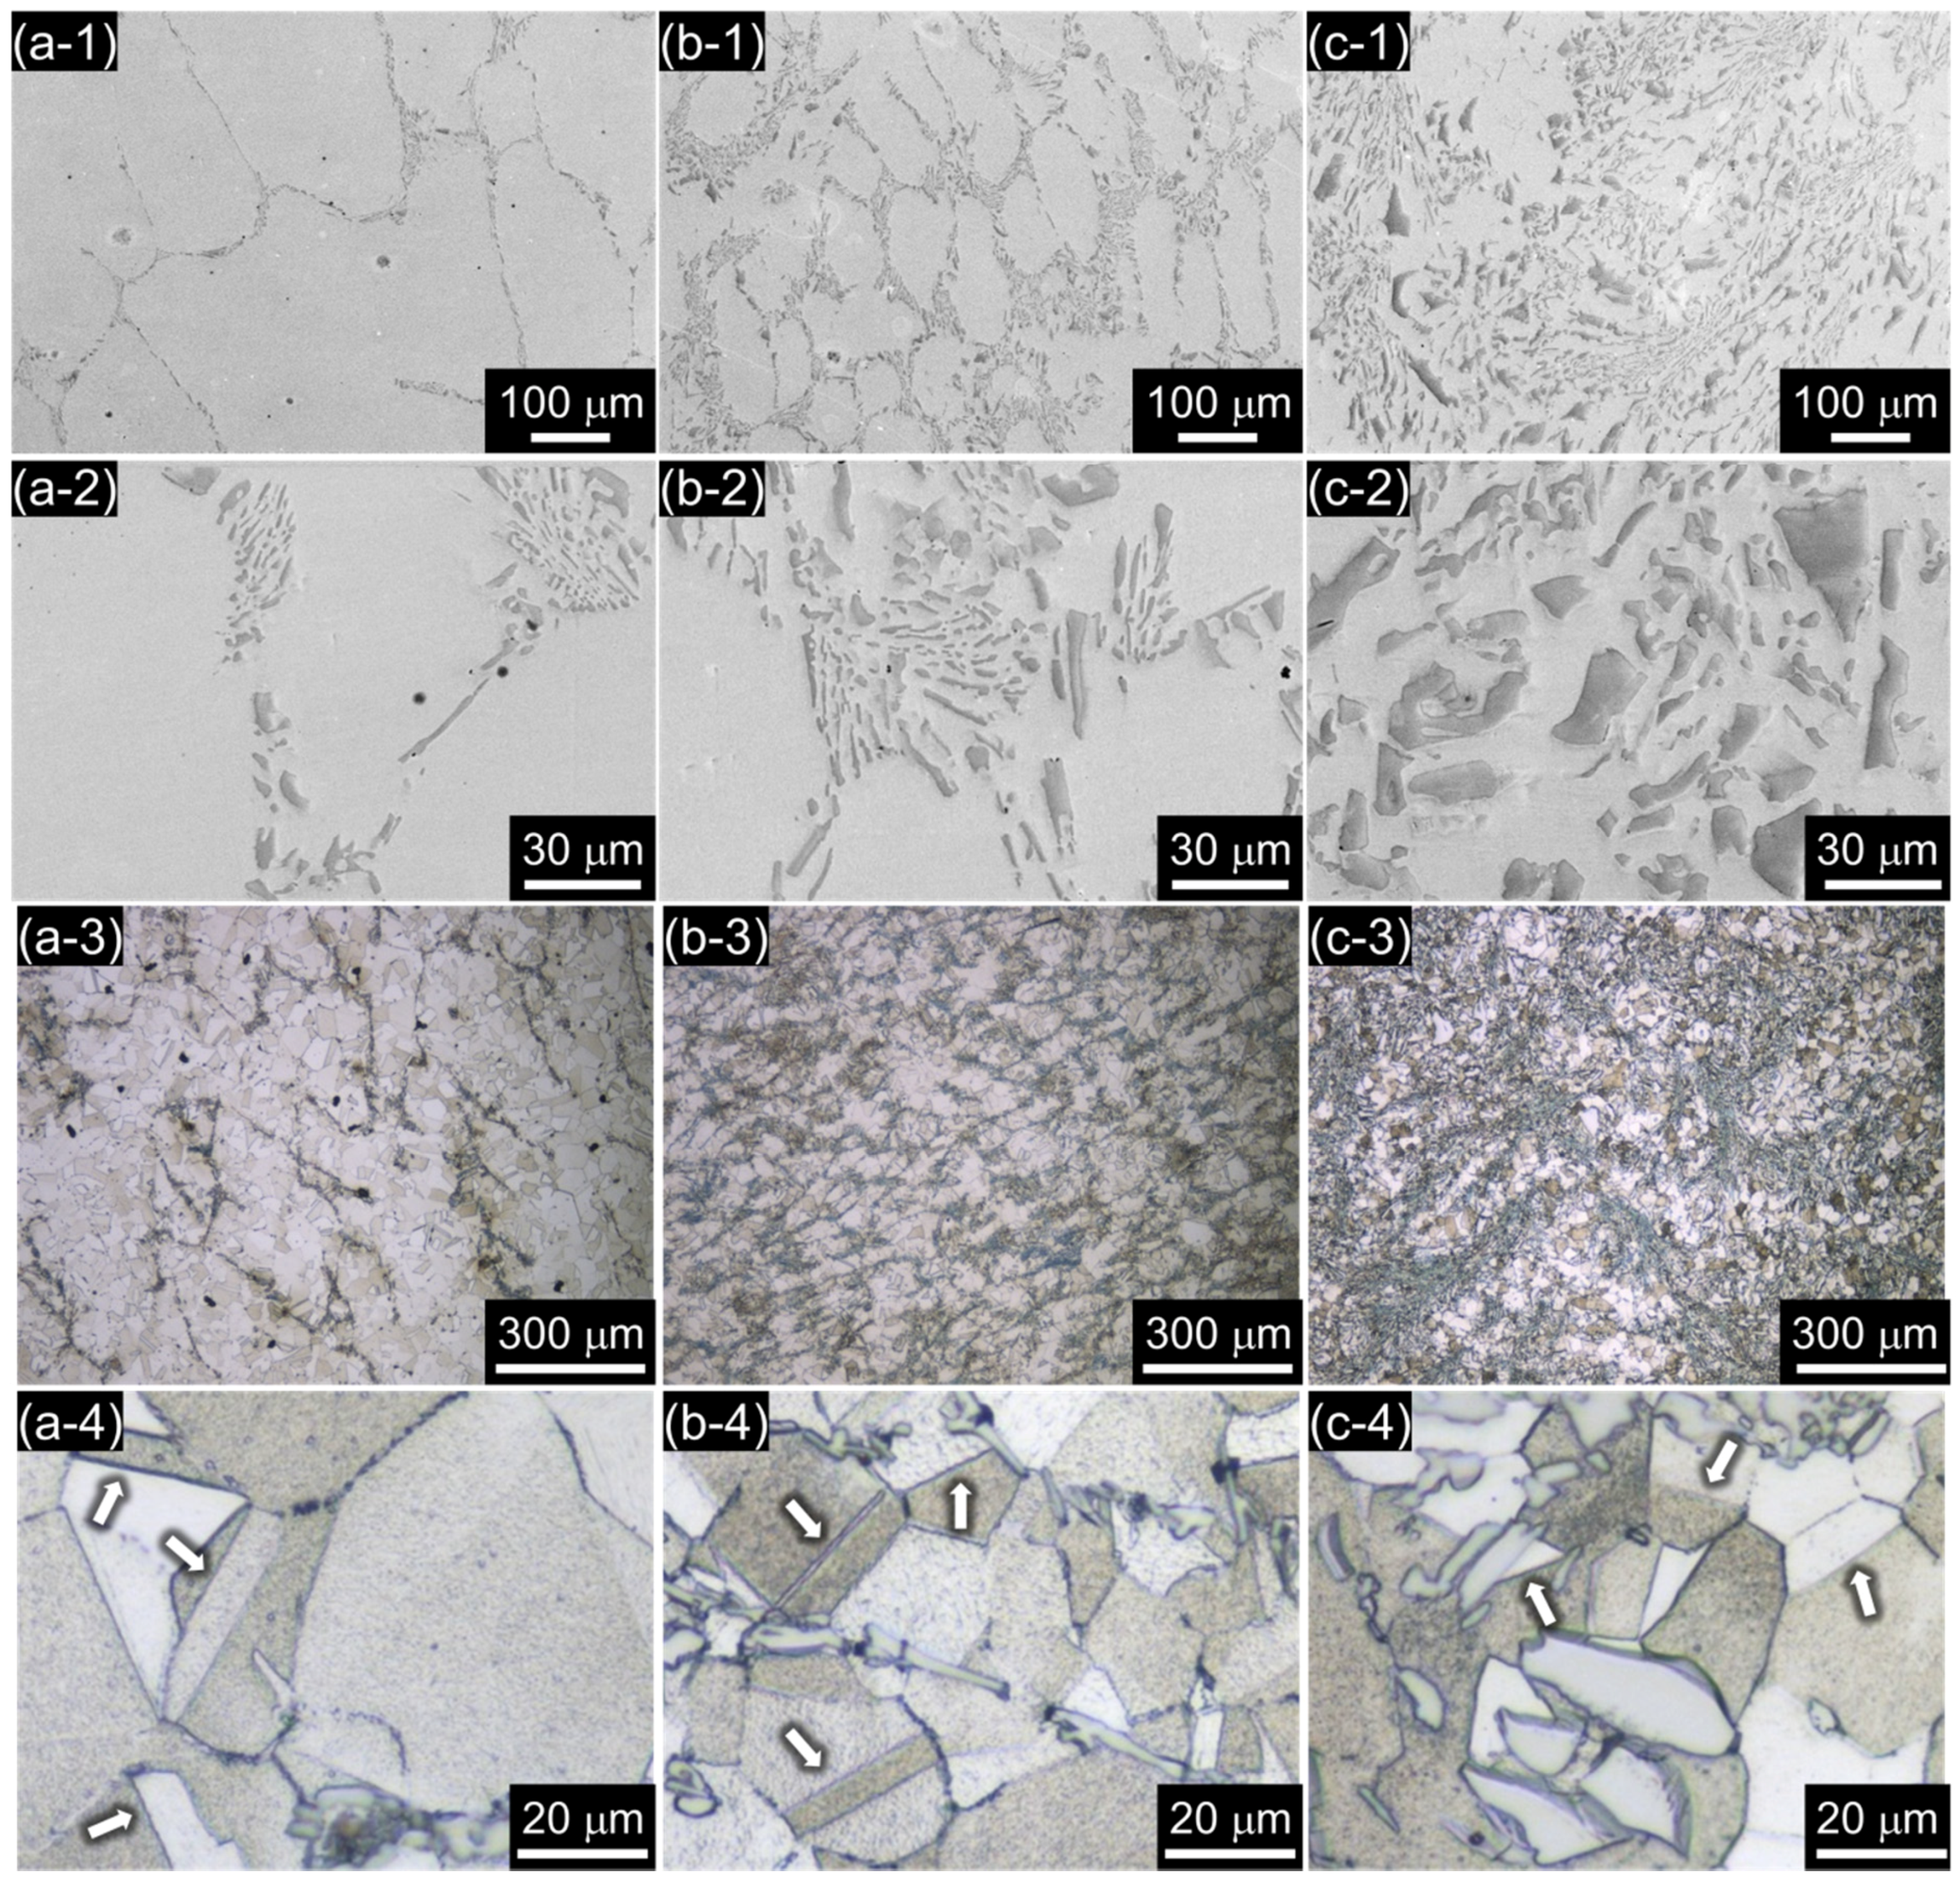
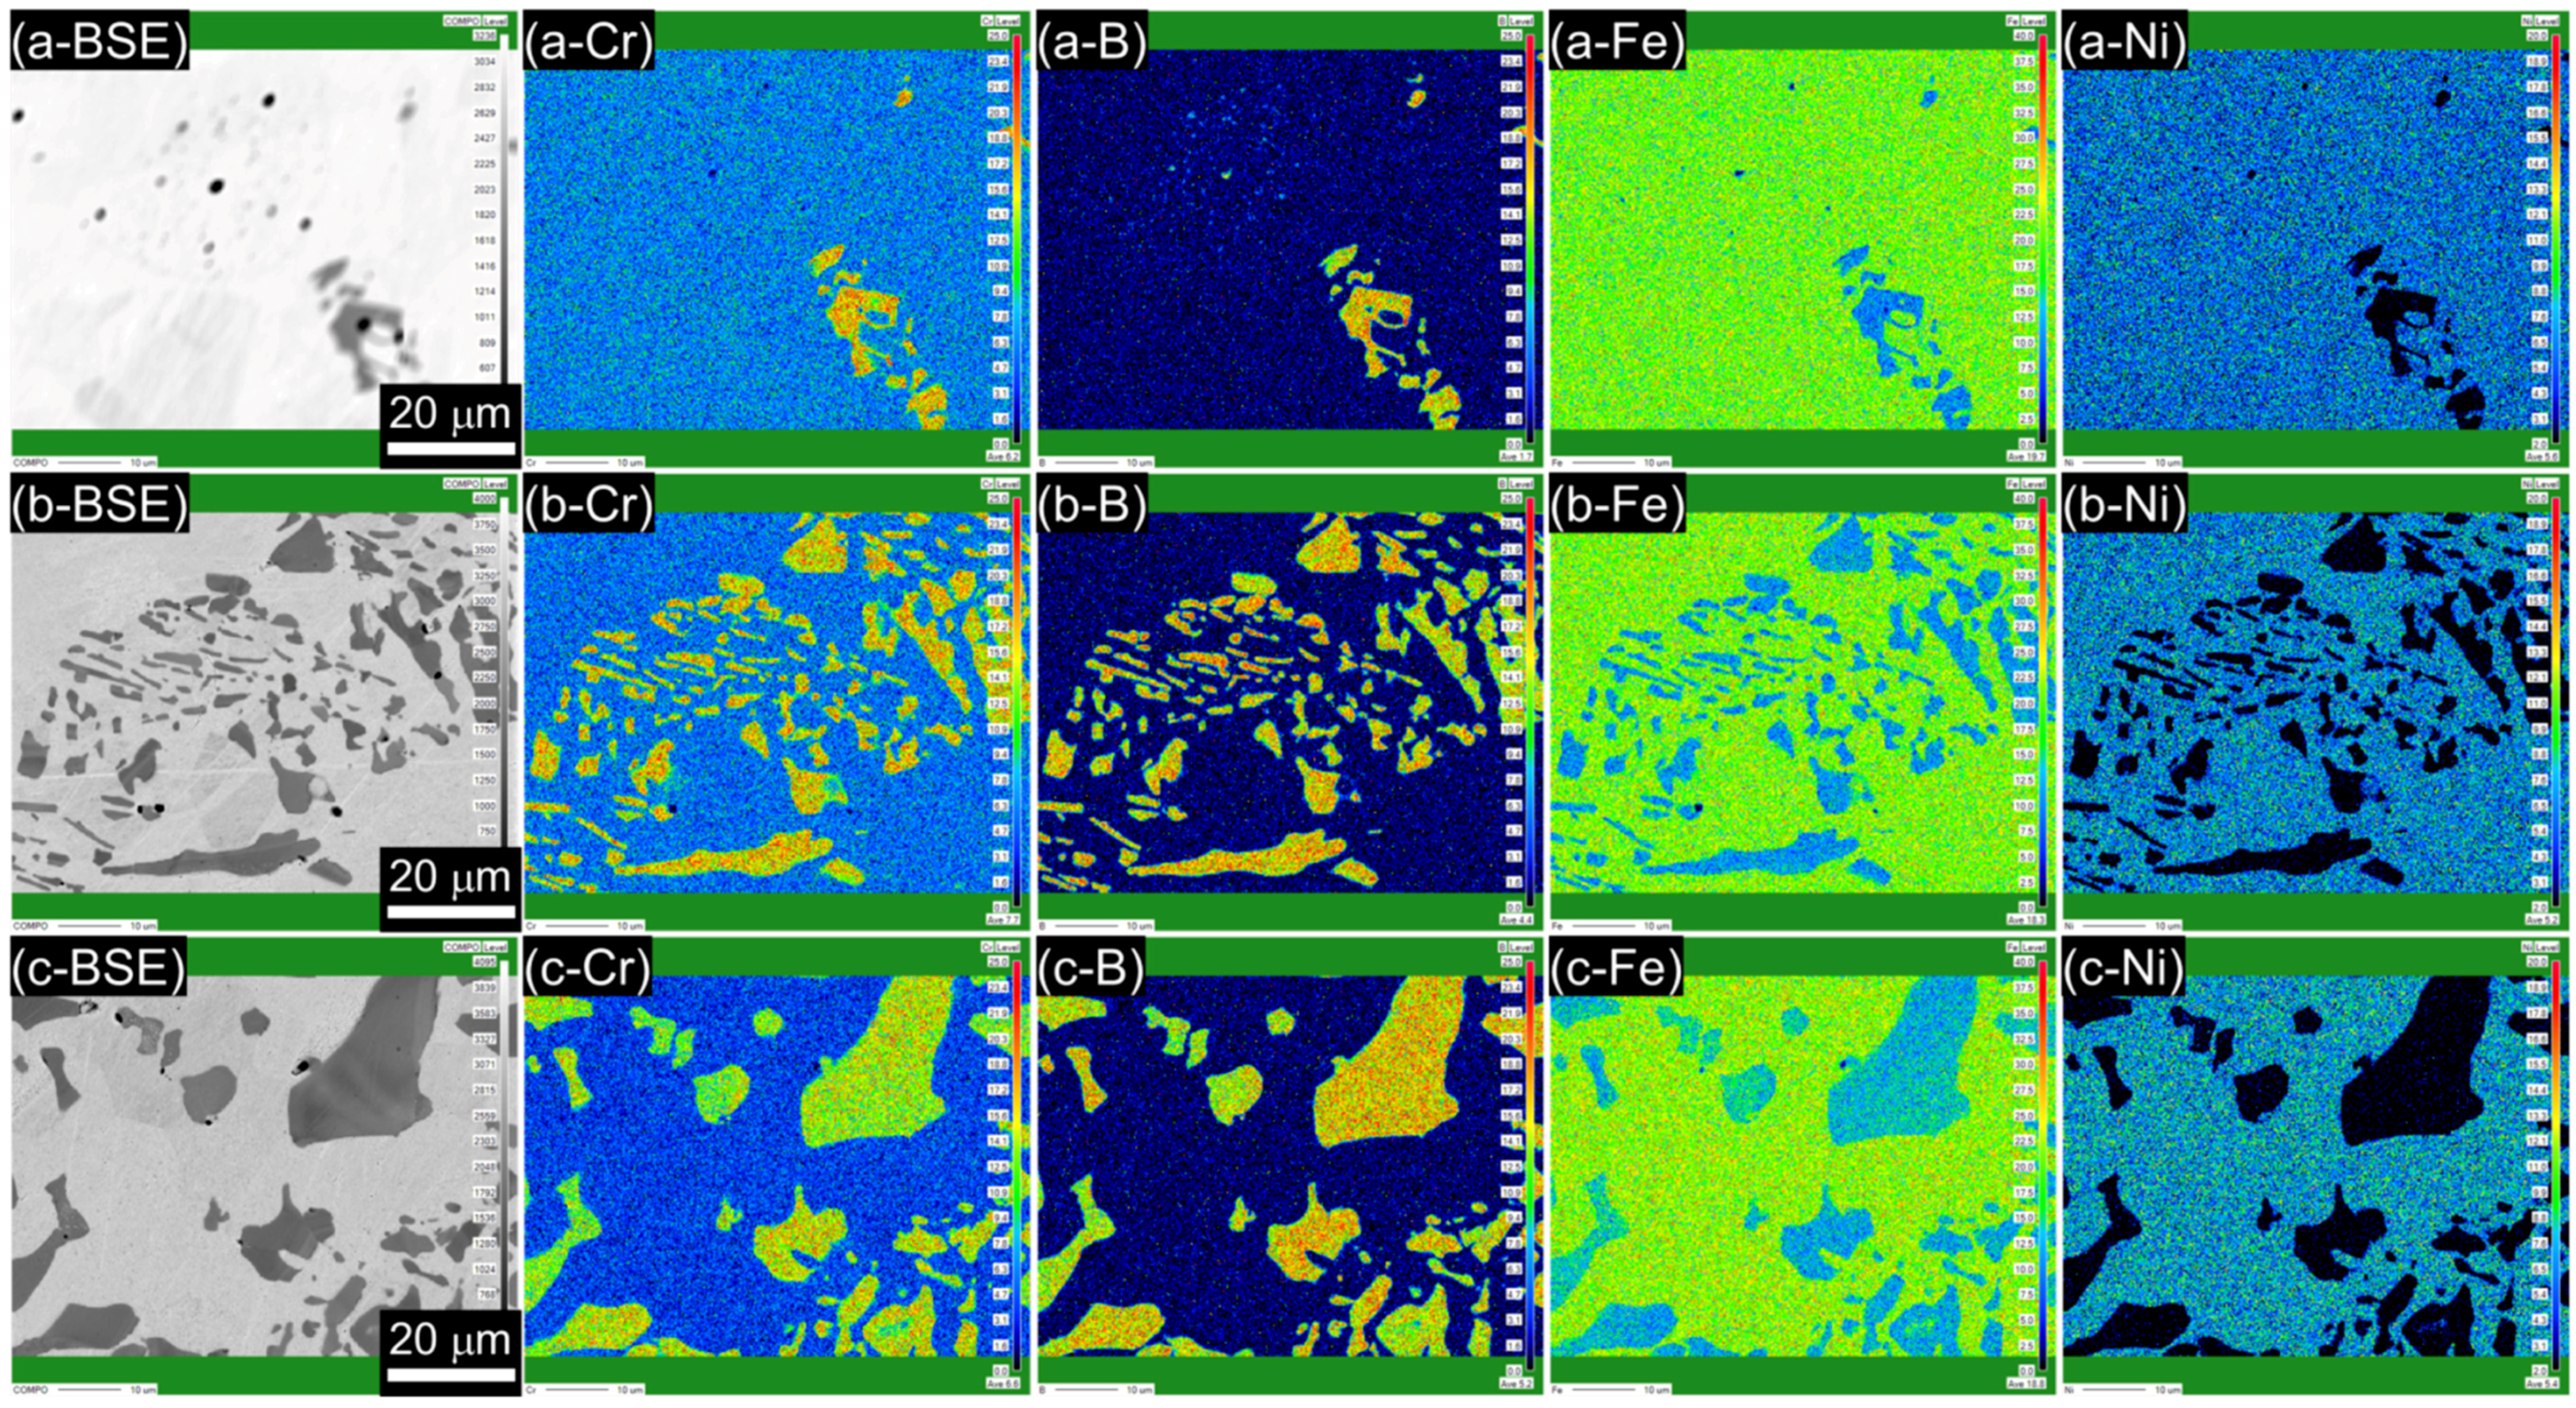
3.1. Microstructure

Figure 1 shows the equilibrium phase fractions as a function of temperature. In the case of B019 alloy, the pure liquid state is stable above 1424 °C, and the fraction of austenite phase increases as the temperature decreases. Therefore, during the cooling process from the liquid, austenite phase is firstly formed and then Cr and B become enriched in the liquid phase. When the remaining liquid reaches a critical temperature, a eutectic reaction occurs in which austenite and Cr2B are simultaneously produced in the liquid. These eutectic reactions similarly occur in B078 and B176 alloys. The melting points of the B019, B078, and B176 alloys are 1270, 1273, and 1274 °C, respectively. The differences in the melting points are induced by other alloying elements distributed in the austenite phase. In the case of B176 containing 1.76 wt % B, the eutectic reaction mainly occurred without producing a pro-eutectic phase. The results of the reactions were confirmed in the microstructure observations in Figure 2.
Figure 2a-1–c-2 is SEM images of B019, B078, and B176 alloys showing the distribution of the second phase in the matrix. The second phases were irregular in shape as well as size (ranging over 2–30 μm) and were not homogeneously distributed over the matrix. The microstructure of the B019 alloy (Figure 2a-1–a-4) shows the mixture of the second phases and austenite formed by the eutectic reaction around the austenite that first formed during cooling. On the other hand, in the case of the B176 alloy (Figure 2c-1–c-4), the second phase was distributed rather homogeneously in the austenite matrix. The measured fractions of the second phases in the B019, B078, and B176 alloys were 1.68 ± 0.49, 9.73 ± 0.28, and 22.66 ± 0.8 vol %, respectively, which are similar to the predicted values from the thermodynamic calculation.
In the B019 alloy (Figure 2a-2), second phases with needle-like shapes were observed, and as the B content increased to 0.78 and 1.76 wt % (Figure 2b-2 and c-2, respectively), both the volume fraction and number of the second phases increased, and the platelike-shaped second phases were frequently found in the B176 alloy.
The equilibrium phase diagrams in Figure 1 suggest that the relatively dark phase shown in the SEM images (Figure 2) is Cr2B and that the matrix is austenite, which was confirmed by the composition analysis through the EPMA (Figure 3). Figure 3a–c shows back-scattered electron (BSE) images and the elemental maps (Cr, B, Fe, and Ni) of the B019, B078, and B176 alloys. In the BSE images (Figure 3a-BSE–c-BSE), the second phase appears in dark gray in comparison with the matrix (light gray), which indicates that the second phase contains heavier elements than the matrix. Figure 3a-Cr–c-Fe clearly shows that Cr and B are enriched with the second phase where Fe is slightly depleted. Ni is rarely detected in the second phase as shown in Figure 3a-Ni–c-Ni.
Shown in Figure 4 are SEM micrographs of FIB sampling, bright field (BF) TEM images, and selected area diffraction patterns (SADP) of the second phase as well as the matrix taken from the B078 specimen. Based on the analyses of SADP, the second phase was confirmed to be Cr2B with orthorhombic structure (space group: Fddd) and the lattice parameters of Cr2B are a = 0.4275 nm, b = 0.7452 nm, and c = 1.4795 nm.
Because the second phase is the (Cr,B)-enriched phase, the concentrations of Cr and B in solid solution state in the matrix consequently decrease as the volume fraction of Cr2B increases. Most of the alloyed B was consumed by forming Cr2B; thus, the concentrations of B in solid solution state of the austenite matrices of the three BSSs were calculated to be less than approximately 2.0 × 10⁻⁵ wt %. Accordingly, the Cr content in the matrix decreased as the alloyed B content increased. The Cr contents of the austenitic matrices of B019, B078, and B176 alloys at solution treatment temperature were calculated to be 16.67, 13.65, and 9.21 wt %, respectively. On the other hand, Ni and Mn, which did not participate in forming Cr2B, were anticipated to be enriched in the austenitic matrix. Indeed, the calculated Ni contents of the austenitic matrices increased from 12.34 wt % for the B019 alloy to 14.85 wt % for the B176 alloy. Those of Mn also increased from 1.38 wt % for the B019 alloy to 1.68 wt % for the B176 alloy.
Figure 2a-3–c-4 is optical micrographs of the three alloys, which were polished and etched in acidic solution to identify the grain boundary. In the three alloys, the annealing twins (marked by arrows in Figure 2a-4–c-4) were frequently observed in the polycrystallized matrix, confirming that the matrix was recrystallized austenite. It is noted that the average grain diameter decreases as the B content increases, because the eutectic Cr2B effectively blocks grain boundary migration during the heat treatment.

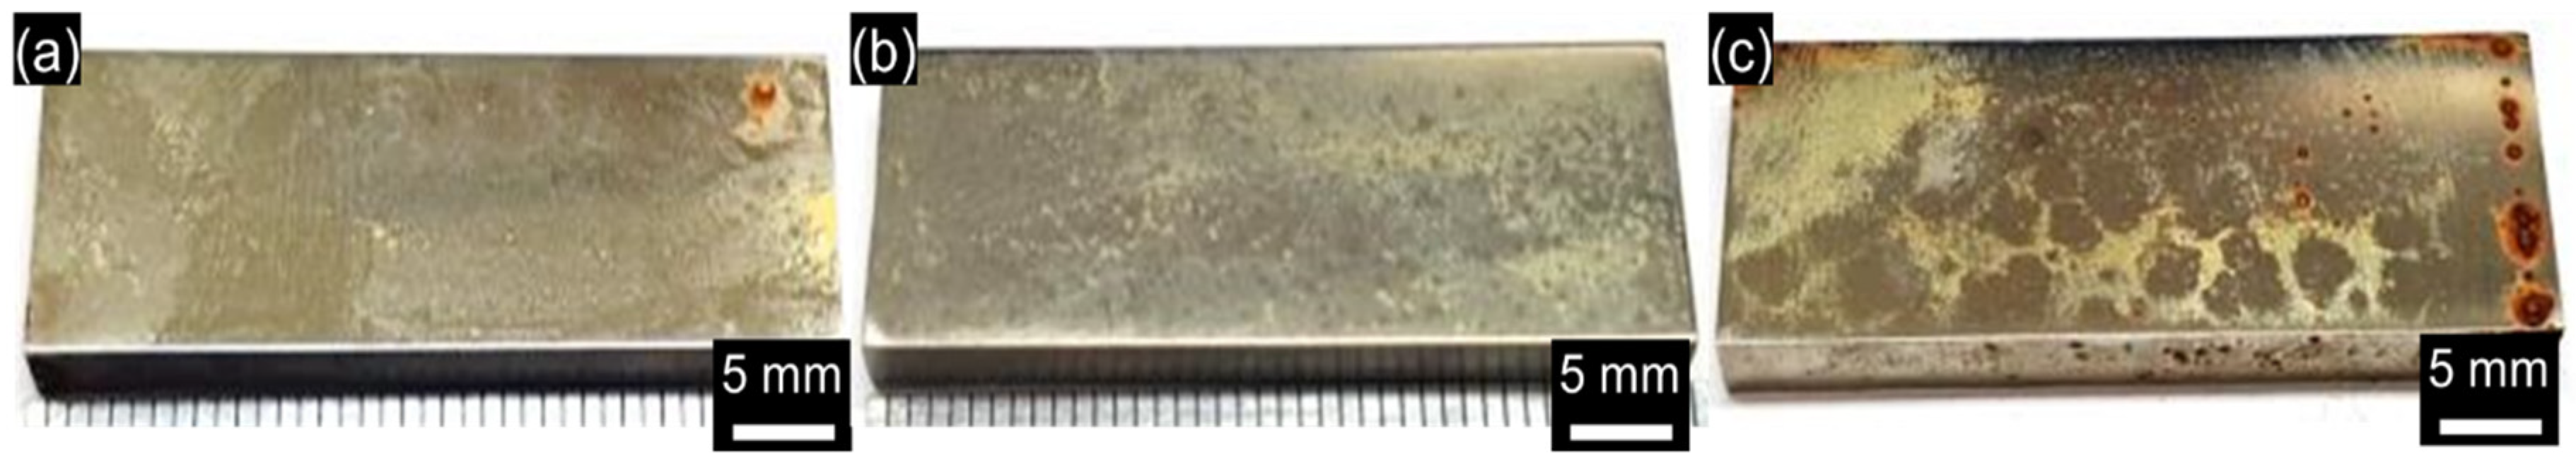
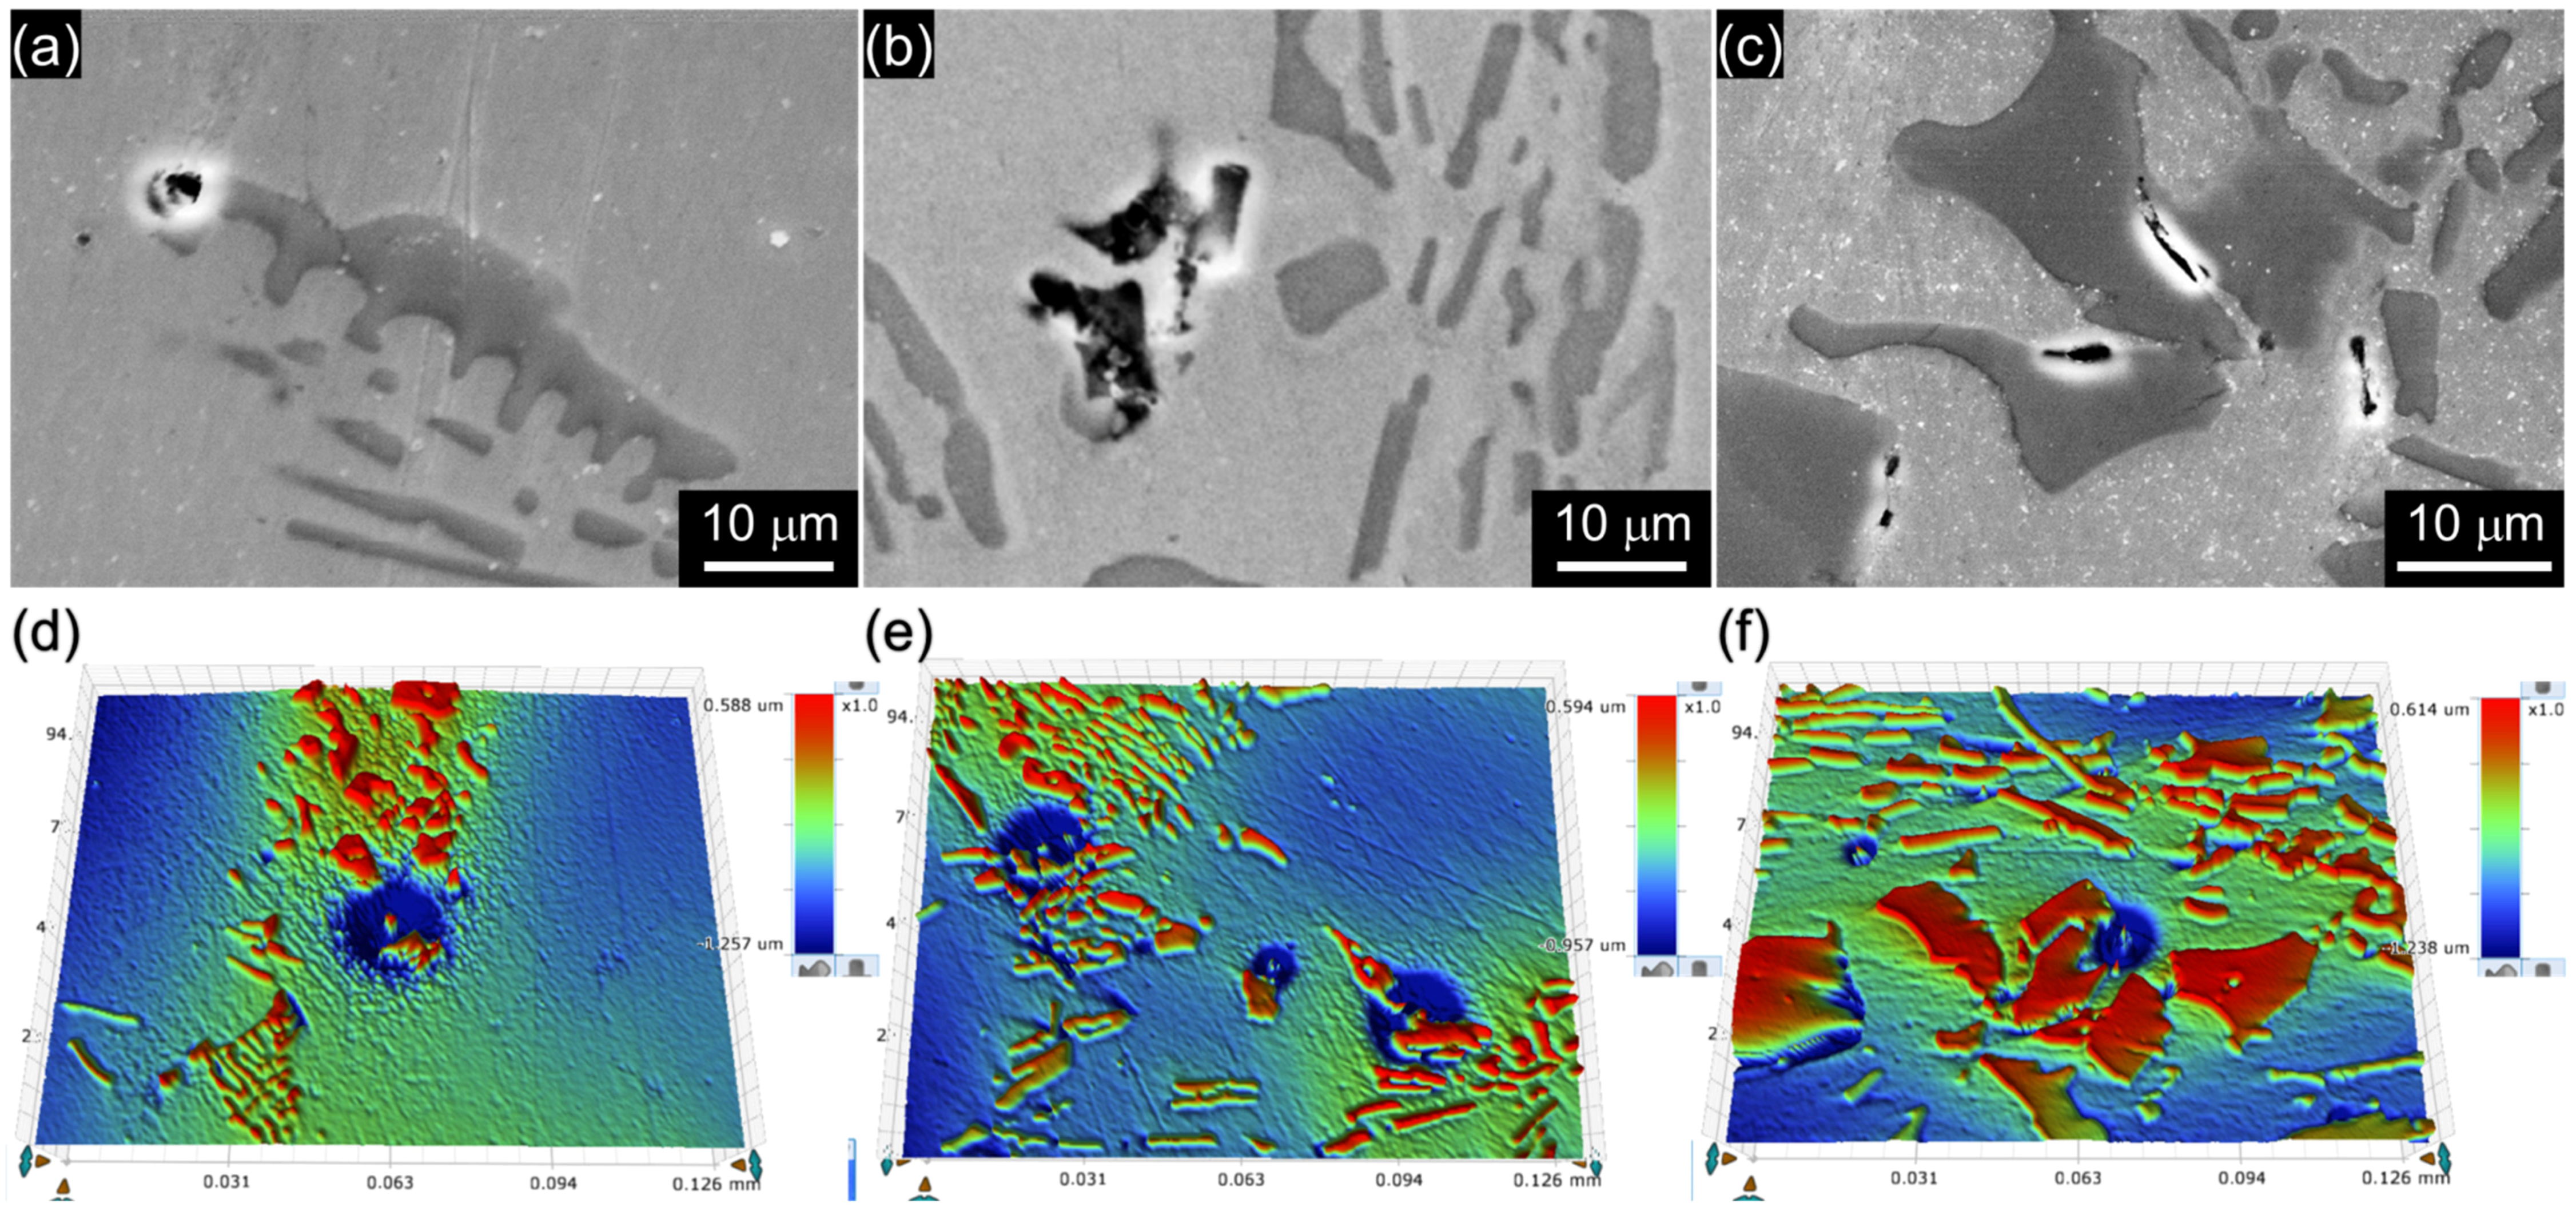
3.2. Pitting Corrosion Resistance

Figure 5a,b exhibits the potentiodynamic polarization curves of the B019, B078, and B176 alloys measured in 10 ppm and 58 ppm NaCl solutions, respectively. As shown in Figure 5a,b, the three BSSs passivate in the dilute NaCl solutions under the open circuit condition and do not exhibit active–passive transition. In the 10 ppm NaCl solution (Figure 5a), the Ecorr values of the three alloys were −0.274 VSCE, and those were slightly shifted to the lower potential of −0.353 VSCE in the NaCl solution with increased NaCl concentration (Figure 5b). For the three alloys, stable passivity appeared only in the limited potential range from the Ecorr to the pitting potential (Epit). The average Epit was calculated from repetitive polarization tests and is plotted in Figure 5c as a function of the B content. Higher Epit was obtained in more dilute NaCl solution, as expected, and it was clear that the Epit was linearly lowered with an increase in the B content in the alloys. Therefore, it could be concluded that the resistance to pitting corrosion of the BSSs was degraded as the B content increased.
Figure 6 shows the corroded surfaces of the three alloy specimens after immersion in a 3.5 wt % NaCl solution for 35 days. Figure 6 confirms the decrease in the resistance to pitting corrosion along with the increase in the B content in the alloys. The photos demonstrate that pitting corrosion is the primary corrosion type in this Cl-containing environment, and the number of pits and damaged area increase as the B content increases in the alloys.
Figure 7a–c shows SEM images of the pit initiation sites observed in B019, B078, and B176 specimens, respectively. In all of the alloys, pits are initiated at the matrix adjacent to the Cr2B and propagated into the matrix. Figure 7d–f exhibits 3-dimensional surface topographies of the pitted BSS specimens measured through a surface profiler. In the topographies, the higher phase (red color) than the matrix (green and blue color) is Cr2B due to its higher hardness than that of the matrix [24]. Figure 7d–f also clearly demonstrate that the pitting corrosion occurs at the boundary between the Cr2B and the matrix, which corrodes while the Cr2B remains intact [7,11,20].

3.3. Passive Film Analysis

The passive behavior of the BSSs was evaluated. Figure 8a shows potentiodynamic polarization curves of the alloys measured in the borate–phosphate–citric buffer solution at pH 8.5. All of the alloys exhibit passive behavior in this solution without active–passive transition, and the Ecorr values of the alloys are approximately −0.66 VSCE. In the polarization curves of the BSSs, there are three current peaks at −0.55, −0.33, and 0.57 VSCE, indicated by arrows in Figure 8a. Peak I at −0.55 VSCE is attributed to the oxidation of Fe to Fe2+, and Peak II at −0.33 VSCE is due to the reoxidation of Fe2+ to Fe3+. Peak III at 0.57 VSCE reflects the reoxidation reaction of Cr3+ to Cr6+. In addition, the rapid increase in the current density above approximately 0.65 VSCE is due to oxygen evolution (that is, transpassive reaction) [25,26,27,28]. The polarization curves exhibit that the potential range for the stable passivity extends from Ecorr (approximately −0.66 VSCE) to approximately 0.65 VSCE. In the passive potential range, the lowest ipassive is observed at approximately 0 VSCE. The average ipassive values (measured at 0 VSCE) of the alloys were calculated from the repetitively measured polarization curves 3–5 times and plotted versus the B content (Figure 8b). The minimum ipassive value increased from 7.32 to 10.05 μA cm−2 as the B content increased from 0.19 to 1.76 wt %; thus, it was concluded that the passive film with the highest resistance was formed on the BSS containing the lowest B content. It is worth mentioning the decrease in the grain size of the austenite matrix of the BSSs as shown in Figure 2a-3–c-4. The grain refinement is known to accelerate passivation, resulting in the formation of a thick and dense passive film [29,30,31]; thus, the ipassive is generally lowered when the grain size of the matrix decreases [32]. In this case, however, the ipassive of the BSSs apparently increased although the grain size of the austenite matrix decreased; thus, it is reasonable to conclude that the change in the grain size is not the dominant factor for determining the magnitude of the ipassive.
The chemical composition and structure of the passive film were examined using XPS. For this analysis, the passive film was potentiostatically formed in the borate–phosphate–citric buffer solution (pH 8.5), and the film formation potential was determined to be 0 VSCE, at which the lowest ipassive was observed as presented in Figure 8a. Figure 9a–c shows the concentration depth profiles of the B019, B078, and B176 alloys, respectively. Figure 9 demonstrates that stable passive films with similar structure and chemical composition were formed on the three BSSs. The passive films were primarily composed of Fe, Cr, and O with a small amount of Mn (less than 0.05 atom %). A notable difference among the passive films of the three BSSs was observed in the film thickness. The thickness of the passive film can be estimated from the concentration depth profile of O (Figure 9d) by taking the depth from the surface at which the 50% value of the O amplitude appears [31,33,34]. The thickness of the passive film formed on the B176 alloy was calculated to be 1.823 nm, while that on the B019 alloy was 2.469 nm. That is, a thinner passive film was formed on the BSS with higher B content. In addition, the Cr content was also affected by the B content in the matrix. As shown in Figure 9e, the Cr contents at the film surface of the B019, B078, and B176 alloys were 6.80, 7.39, and 9.89 atom %, respectively, and the Cr content inside the passive film was also slightly higher in the B176 alloy than in the other alloys.
Then, the point defect density in the passive film was measured through Mott–Schottky analysis. Generally, the passive film of stainless steel formed in an aqueous solution is known to contain large numbers of point defects such as oxygen vacancies (VO2+), metal vacancies (VMx−), and cation interstitials (Mix+); thus, the passive film behaves as an extrinsic semiconductor. The point defect density of the space charge layer in the passive film can be calculated through the capacitance measurement, which is Mott–Schottky analysis. For Mott–Schottky analyses, the specific interfacial capacitance (Ctotal) of the passivated surface is obtained using Ctotal = 1/ωZ, where ω is the angular frequency and Z is the imaginary part of the specific impedance. The measured capacitance (Ctotal) is a series combination of the double layer capacitance (Helmholtz layer capacitance, CH) and space charge layer capacitance (CSC). The CSC of the n-type semiconductor and the relationship between Ctotal, CH, and CSC are given as follows:
1 C S C 2 = 1 C t o t a l 2 1 C H 2 = ( 2 ε ε 0 e N D ) ( E a p p E f b k B t e )
where ε is the dielectric constant of the passive film (15.6 for the passive film of stainless steel [35,36]), ε0 is the vacuum permittivity (8.854 × 10¹⁴ F cm−1), e is the electron charge, Eapp is the applied potential, and k is the Boltzmann constant. Thus, for an n-type semiconductor, a graph of CSC−2 versus Eapp should be linear with a positive slope and CSC−2 is inversely proportional to donor density (ND). In the Mott–Schottky relationship, CH is sufficiently higher than CSC; therefore, it can be neglected in a series of combinations with the CSC. Thus, the measured capacitance (Ctotal) can be assumed to be equal to CSC.
Mott–Schottky plots of the BSSs are presented in Figure 10a, as measured in the borate–phosphate–citric buffer solution at pH 8.5. For the Mott–Schottky analysis, the passive film was formed by applying constant anodic potential of 0.6 VSCE for 1 h and capacitance was then measured at a constant frequency of 1 kHz with an imposing sinusoidal voltage perturbation of ±10 mV in a potential range from 0.6 VSCE to −0.7 VSCE. The XPS analysis (Figure 9) confirmed that the passive films formed on the BSSs were (Fe,Cr)-oxide, which is known to have n-type semiconductivity. In accordance with the Mott–Schottky relation (Equation (1)), the n-type semiconductor passive film exhibits a positive slope (∆Ctotal−2/∆V) in the Mott–Schottky plot, and the dominant and detective point defects in the n-type semiconductor passive film are VO2+ (shallow donor) and Cr6+ (deep donor). In order to investigate the densities of both donors, film formation for Mott–Schottky analysis was conducted by applying anodic potential between peak III (Cr3+ → Cr6+, shown in Figure 8a) and the transpassive potential where oxygen evolution occurred.
The Mott–Schottky plots of the BSSs shown in Figure 10a exhibit two potential sections showing linear increase, between −0.35 and 0 VSCE (Region I) and between 0 and 0.4 VSCE (Region II). Using the positive ∆Ctotal−2/∆V values in Regions I and II, the shallow and deep donor densities can be estimated, respectively.
The average point defect density values of the BSSs are presented in Figure 10b as a function of the B content. Figure 10b clearly shows that the densities of both shallow and deep donors increase with the increase in the B content. The average shallow donor density of the B019 alloy was 3.49 × 1020 cm−3 and that of the B176 alloy was 4.32 × 1020 cm−3. In addition, the average deep donor density increased from 17.51 × 1020 cm−3 for the B019 alloy to 24.27 × 1020 cm−3 for the B176 alloy. The high point defect density in the passive film implies a large amount of charge carrier in the passive film which well explains the higher ipassive of the B176 alloy than that of the B019 alloy in the polarization curves, as shown in Figure 8b. In addition, Figure 10b also demonstrates that the alloy containing more B forms more defective and, hence, less protective passive film; thus, the results from Figure 10b are partly responsible for the degraded resistance to pitting corrosion of the B176 alloy shown in Figure 5 and Figure 6.
The noticeable point in Figure 10b is the change in the Cr6+ concentration. The density of Cr6+ in the passive film significantly increased with the increase in B content in the BSSs, which corresponded to the XPS analysis result (Figure 9e). It is generally accepted that the passive film of stainless steel (FeCr-based alloys) containing higher Cr is more protective [28,36,37], resulting in the enhancement of the resistance against passive breakdown. However, in the case of BSSs, the passive film formed on the B176 alloy exhibited the lowest resistance to pitting corrosion although the film contained the highest Cr concentration. This discrepancy can be explained as follows: First, the overall resistance against pitting corrosion of the BSSs shown in Figure 5, Figure 6 and Figure 7 is primarily determined by the surface heterogeneity (i.e., Cr2B), which provides the pit initiation site, in comparison with the protective ability of the passive film. Second, the detrimental contribution of Cr2B to the overall passivation is considered. As discussed in Section 3.1, the Cr content in the solid solution state in the austenite matrix decreased from 16.67 to 9.21 wt % as the B addition increased from 0.19 to 1.76 wt % because of the Cr2B formation. Thus, the higher Cr concentration in the passive film on the BSS with higher B content is considered as evidence of the passivation of Cr2B. However, the electrical conductivity of the Cr2B is lower than that of the austenite matrix [38], and the volume fraction of Cr2B remarkably increases as the B addition increases; thus, the formation of a stable and continuous passive film on the B-containing alloy is inhibited. As a result, a thin (Figure 9d) and defective passive film is formed on the alloy with high B content.

4. Conclusions

The resistance to pitting corrosion and passive behavior of type 304 stainless steels (Febalance18Cr12Ni1.5Mn-based alloys, in wt %) containing 0.19–1.76 wt % B, which were manufactured through conventional ingot metallurgy, were investigated. The pitting corrosion resistance was evaluated through potentiodynamic polarization and immersion tests in aqueous solutions with Cl. The passive behavior was examined in a borate–phosphate–citric buffer solution at pH 8.5 through potentiodynamic polarization tests. The physicochemical and electronic properties of the passive film were examined using XPS and Mott–Schottky analyses. On the basis of the tests, the following conclusions could be drawn.
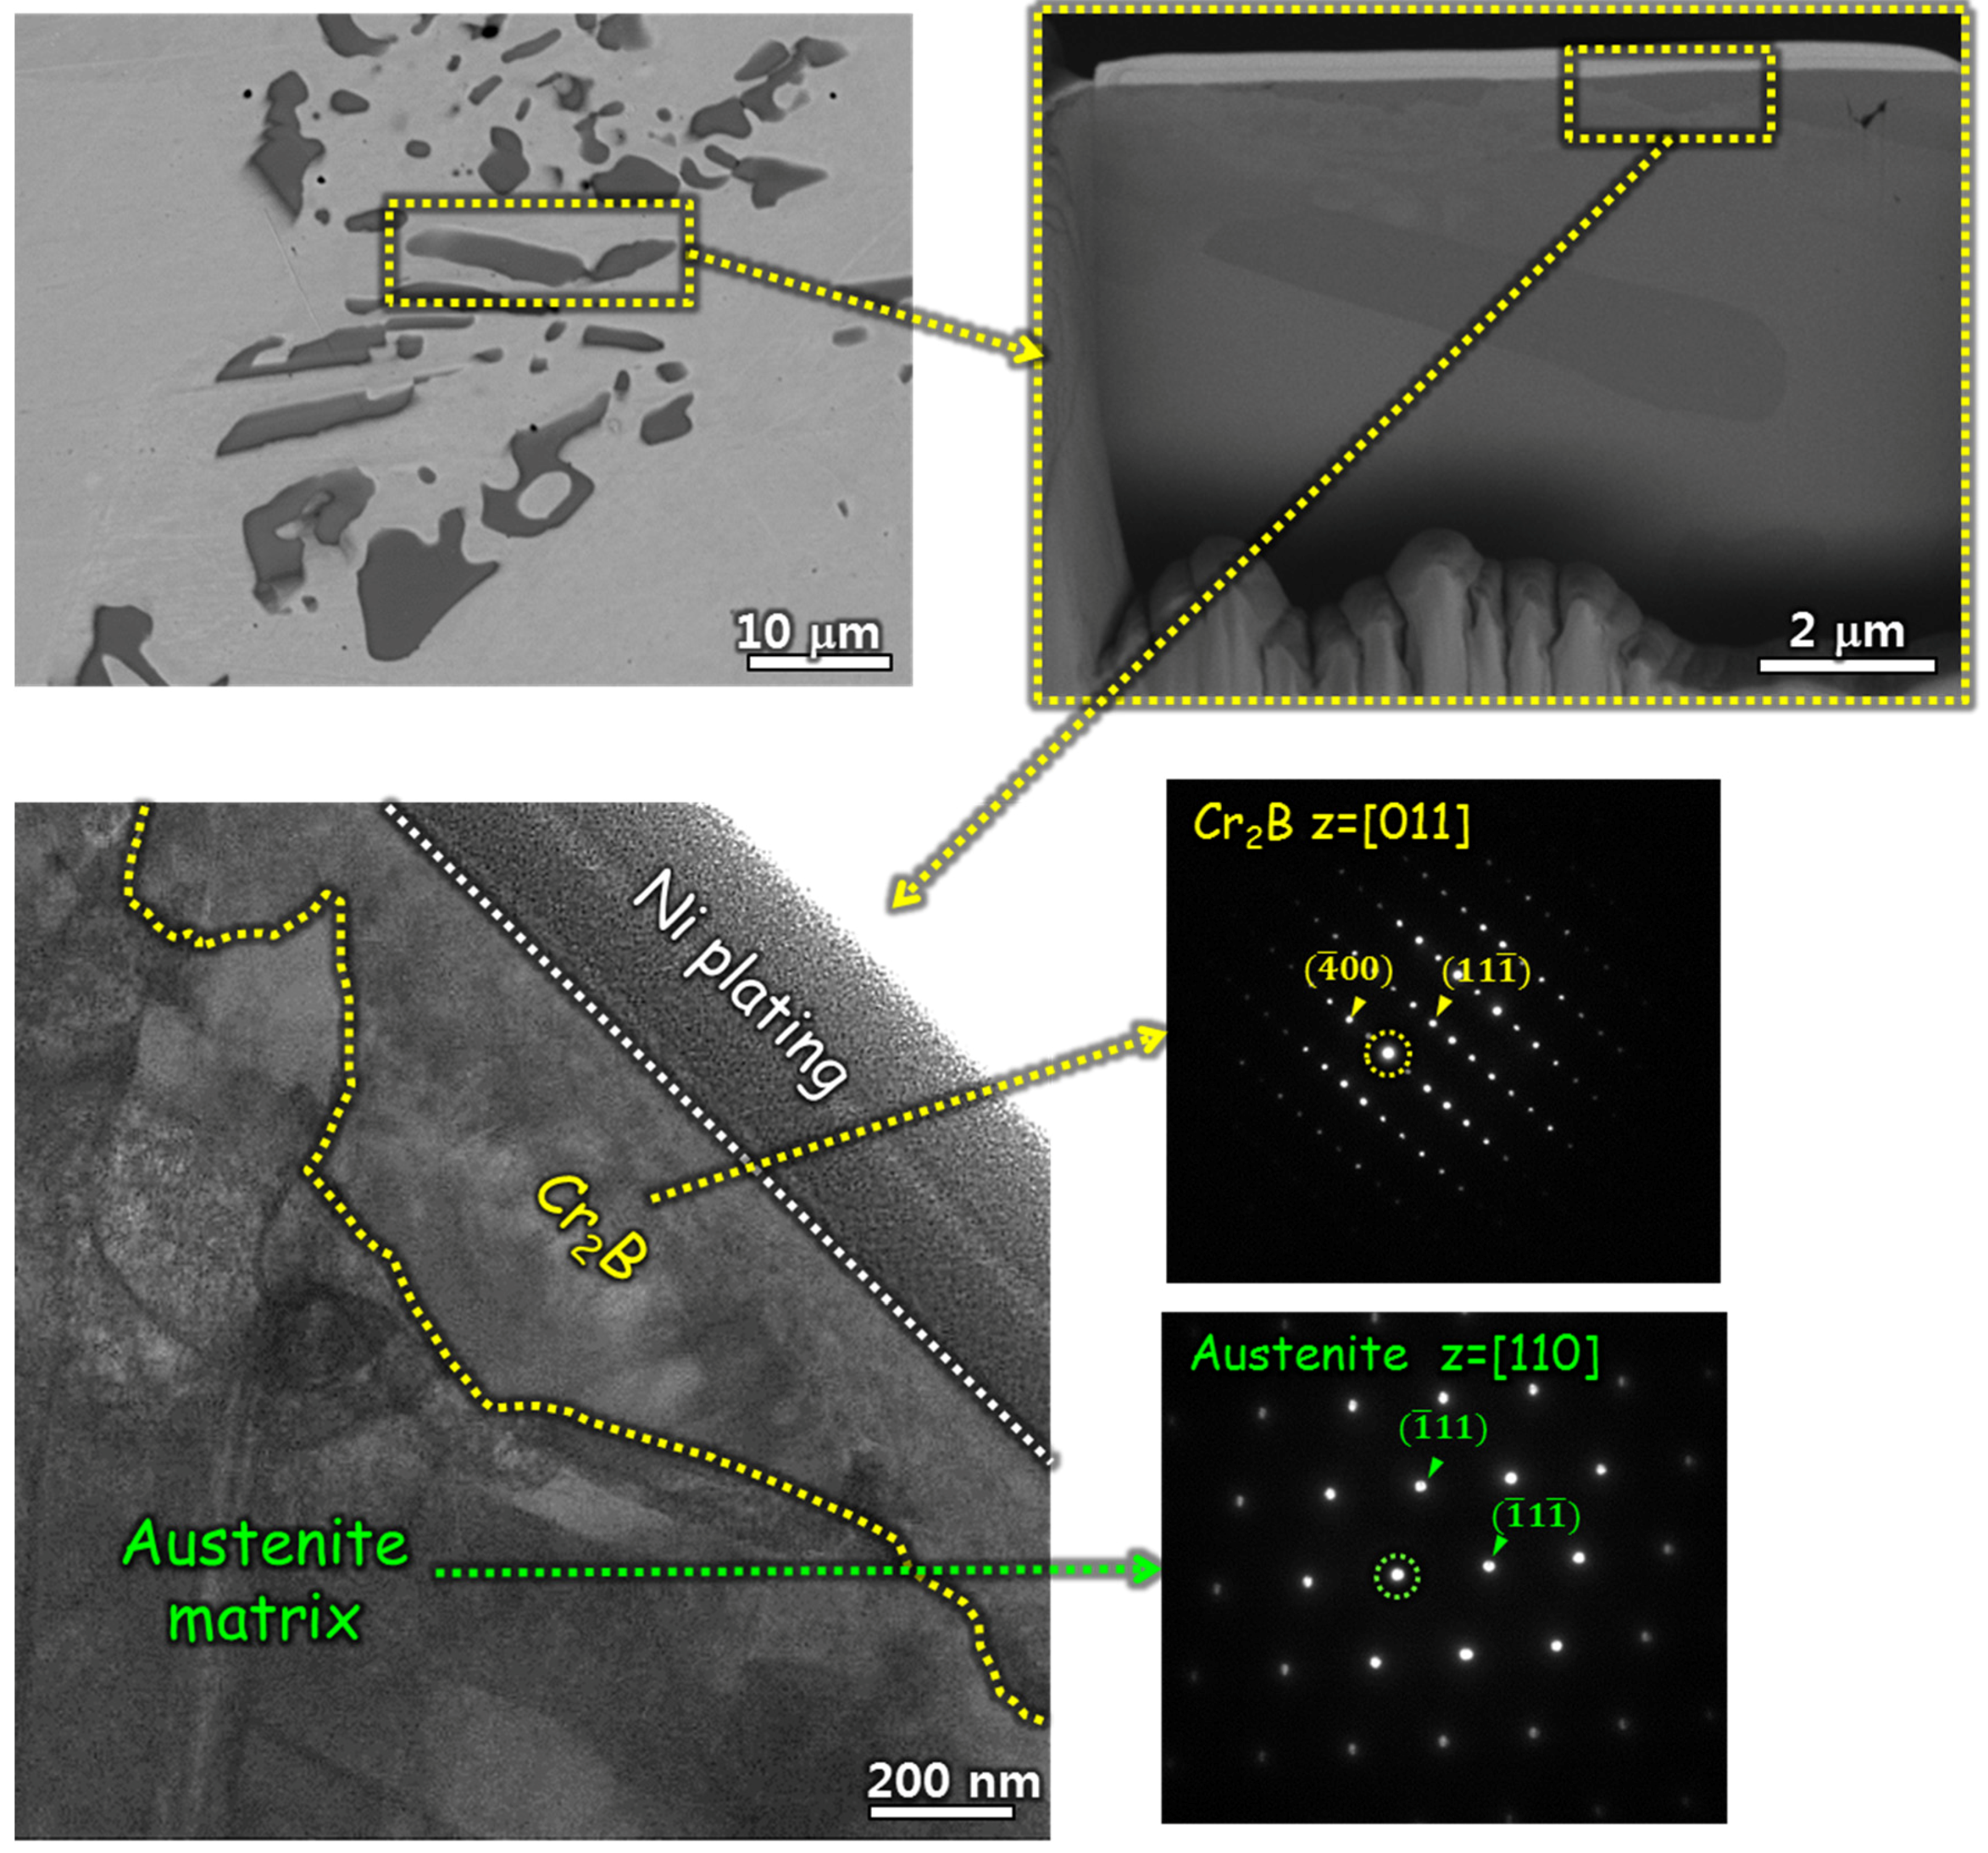
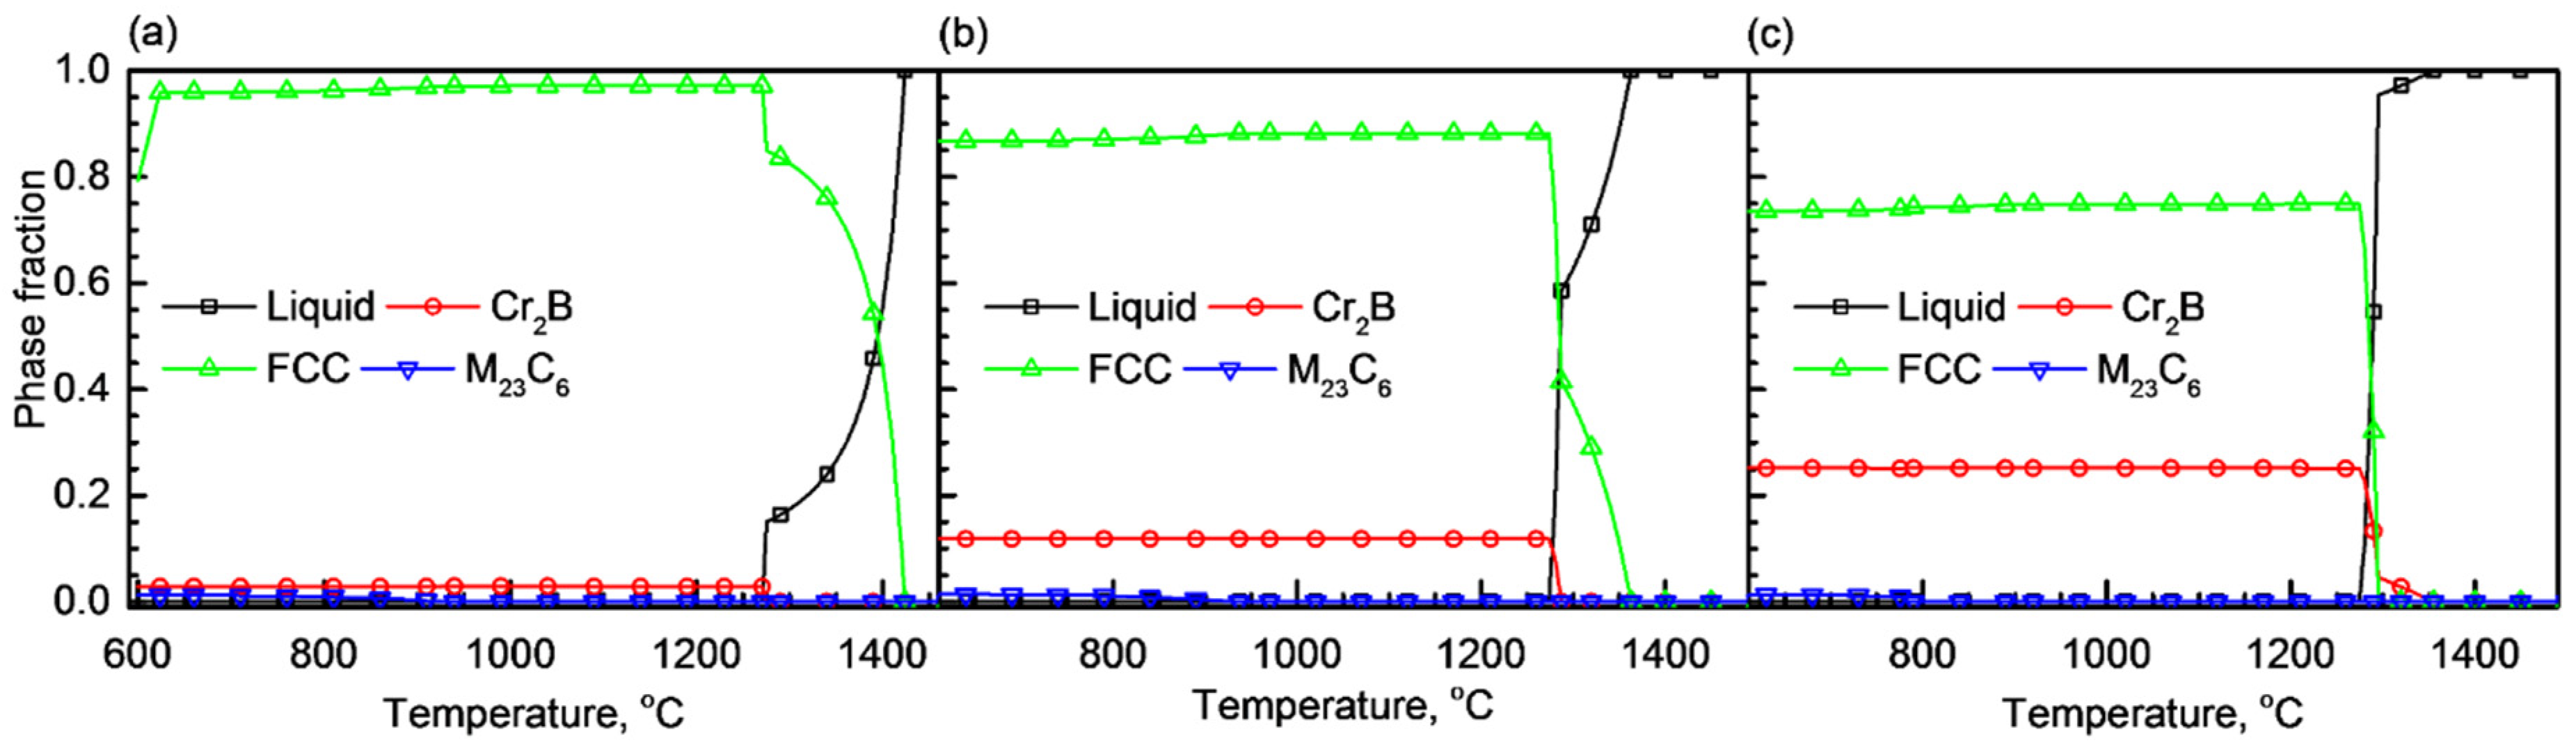
  • The borated stainless steels were composed of austenitic matrix and Cr2B phase. As the B content increased from 0.19 to 1.76 wt %, the volume fraction of Cr2B increased from 1.68 to 22.66 vol %, and the concentration of Cr in solid solution state in the austenitic matrix was lowered from 16.67 to 9.21 wt %. In addition, the grain size of the austenite matrix decreased as the Cr2B fraction increased.
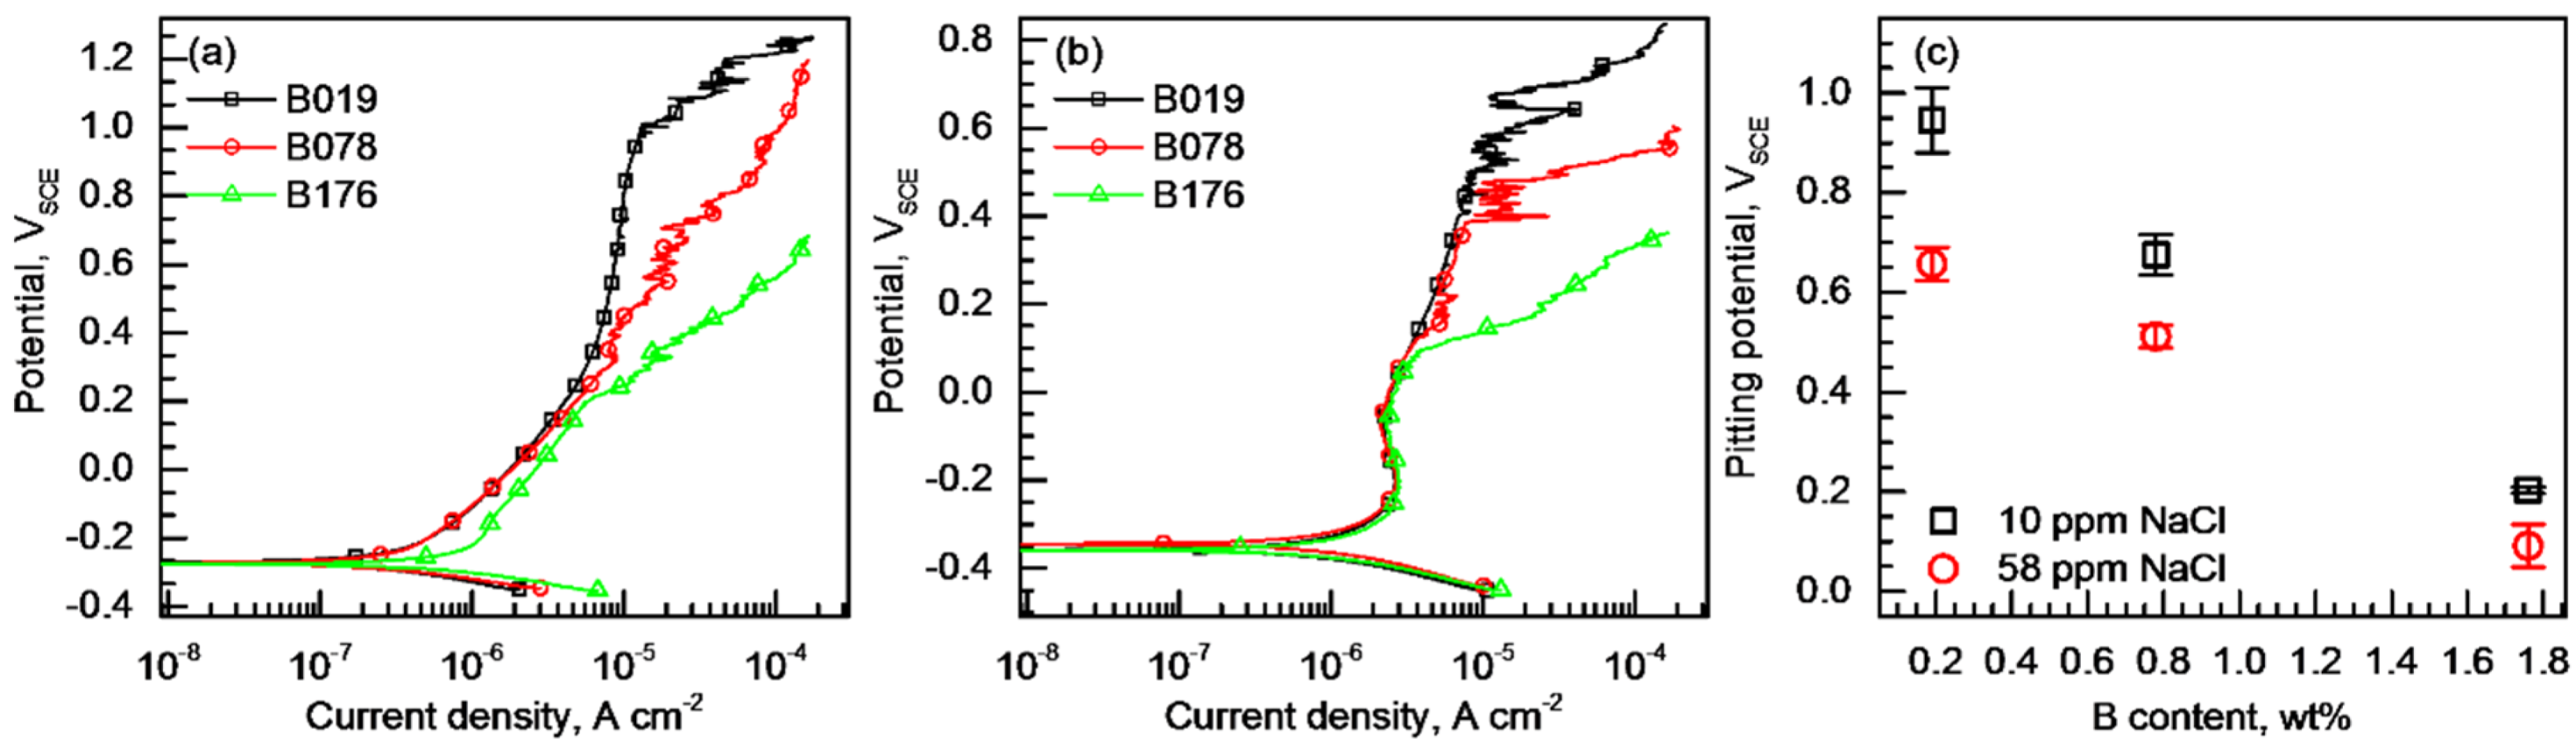
  • In various NaCl solutions, lower pitting corrosion resistance was observed in the alloy with higher B content. The pits were initiated at the matrix adjacent to the Cr2B and propagated into the matrix.
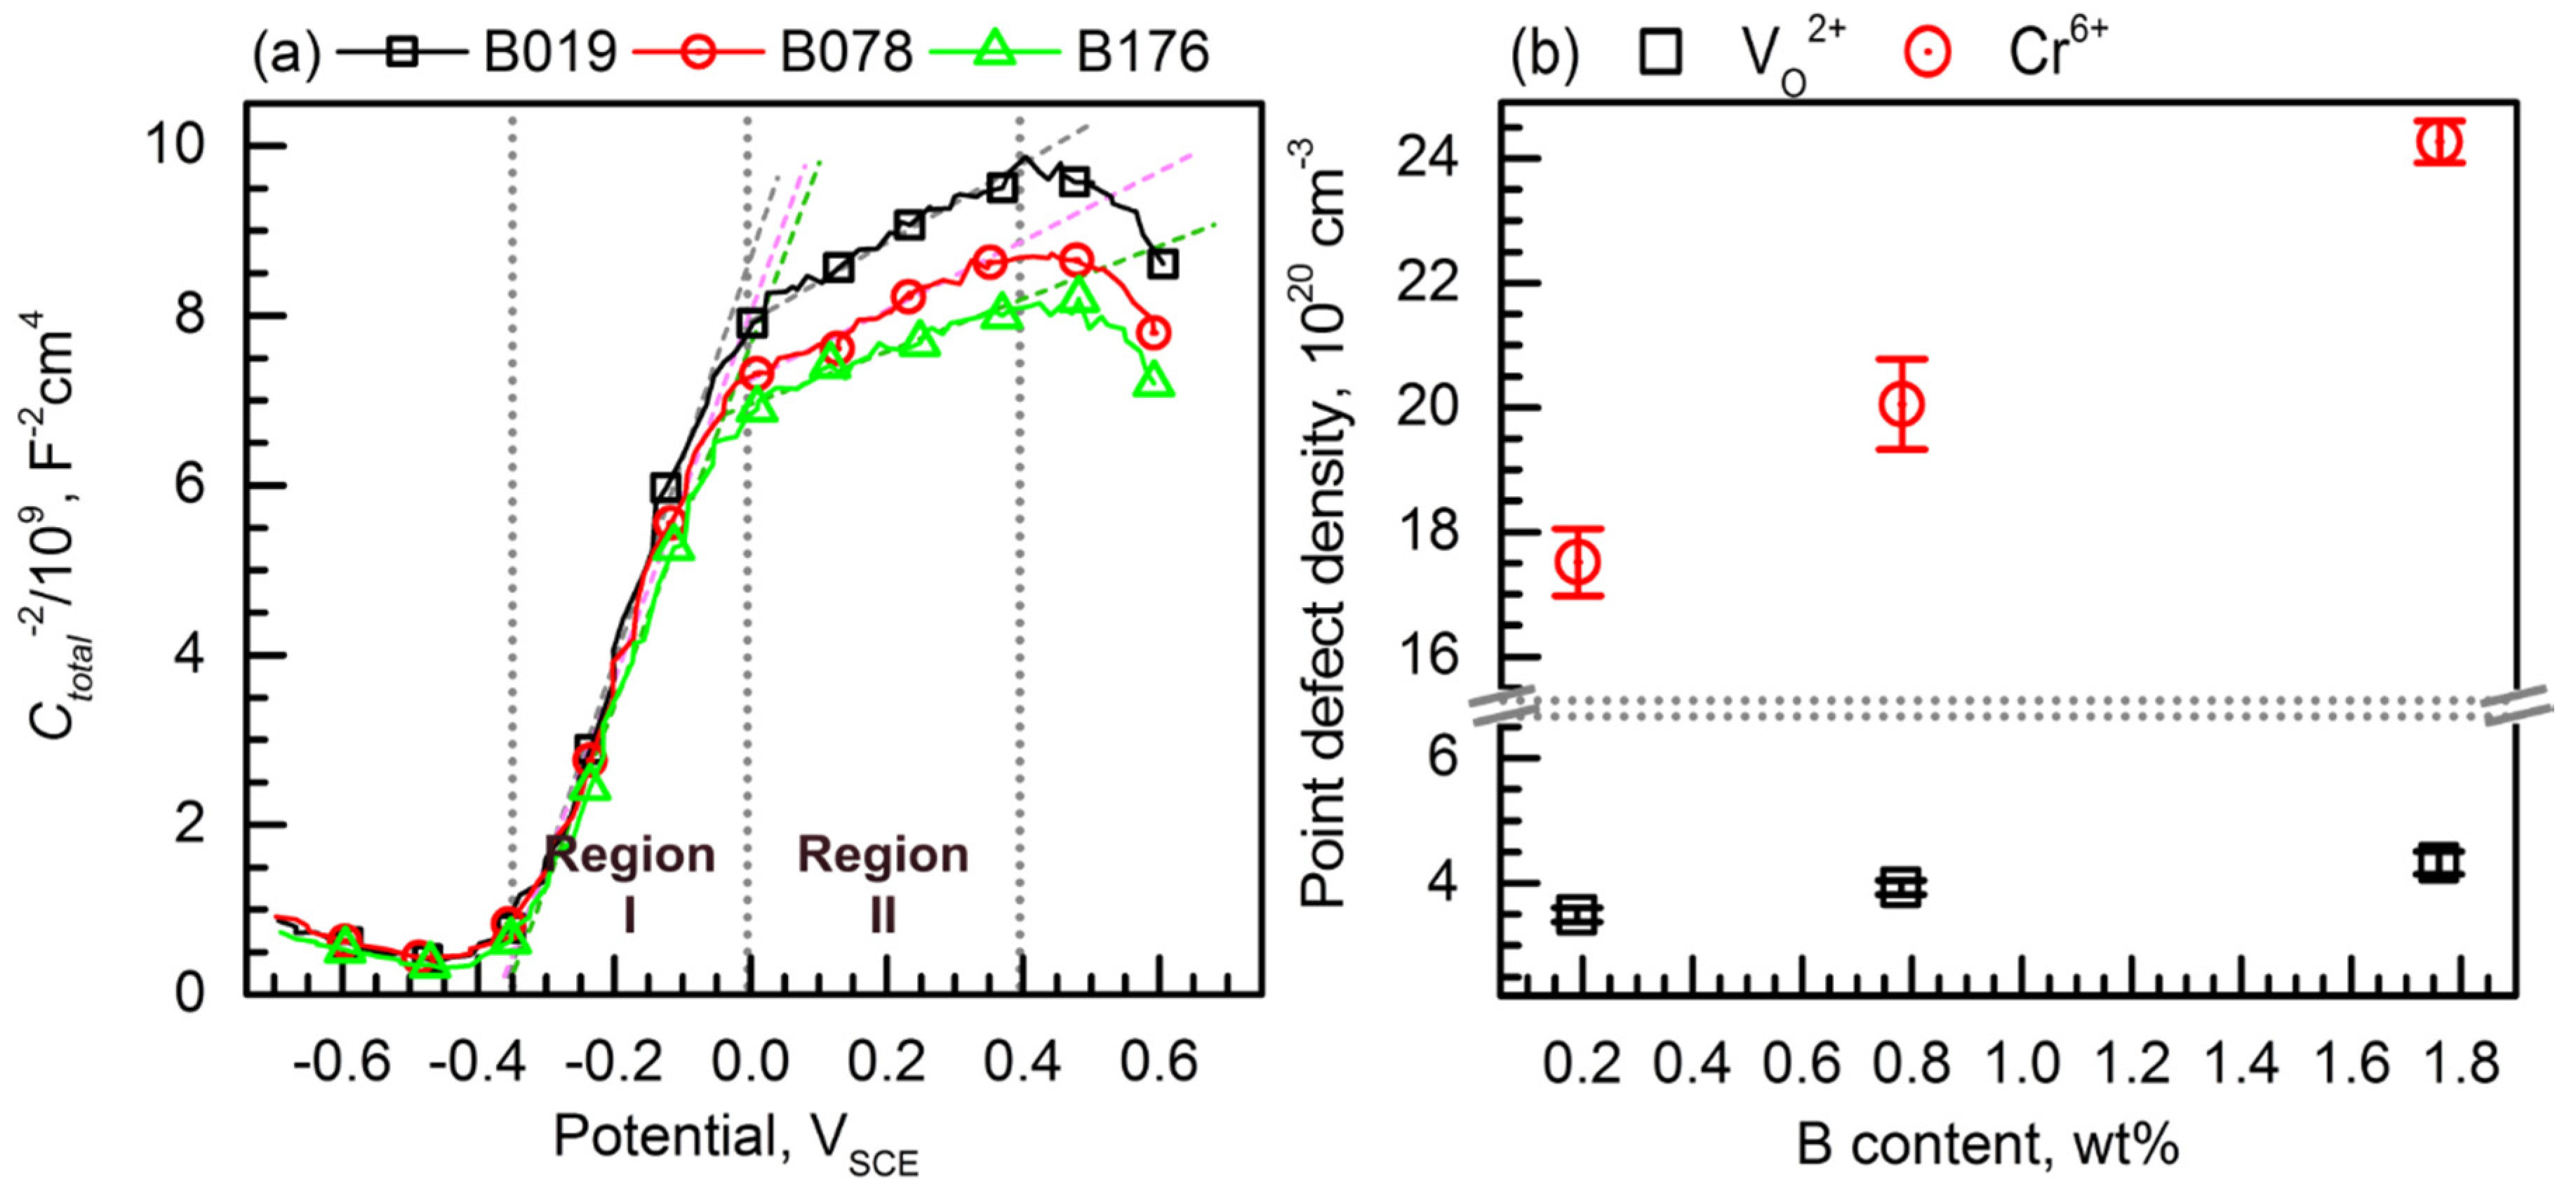
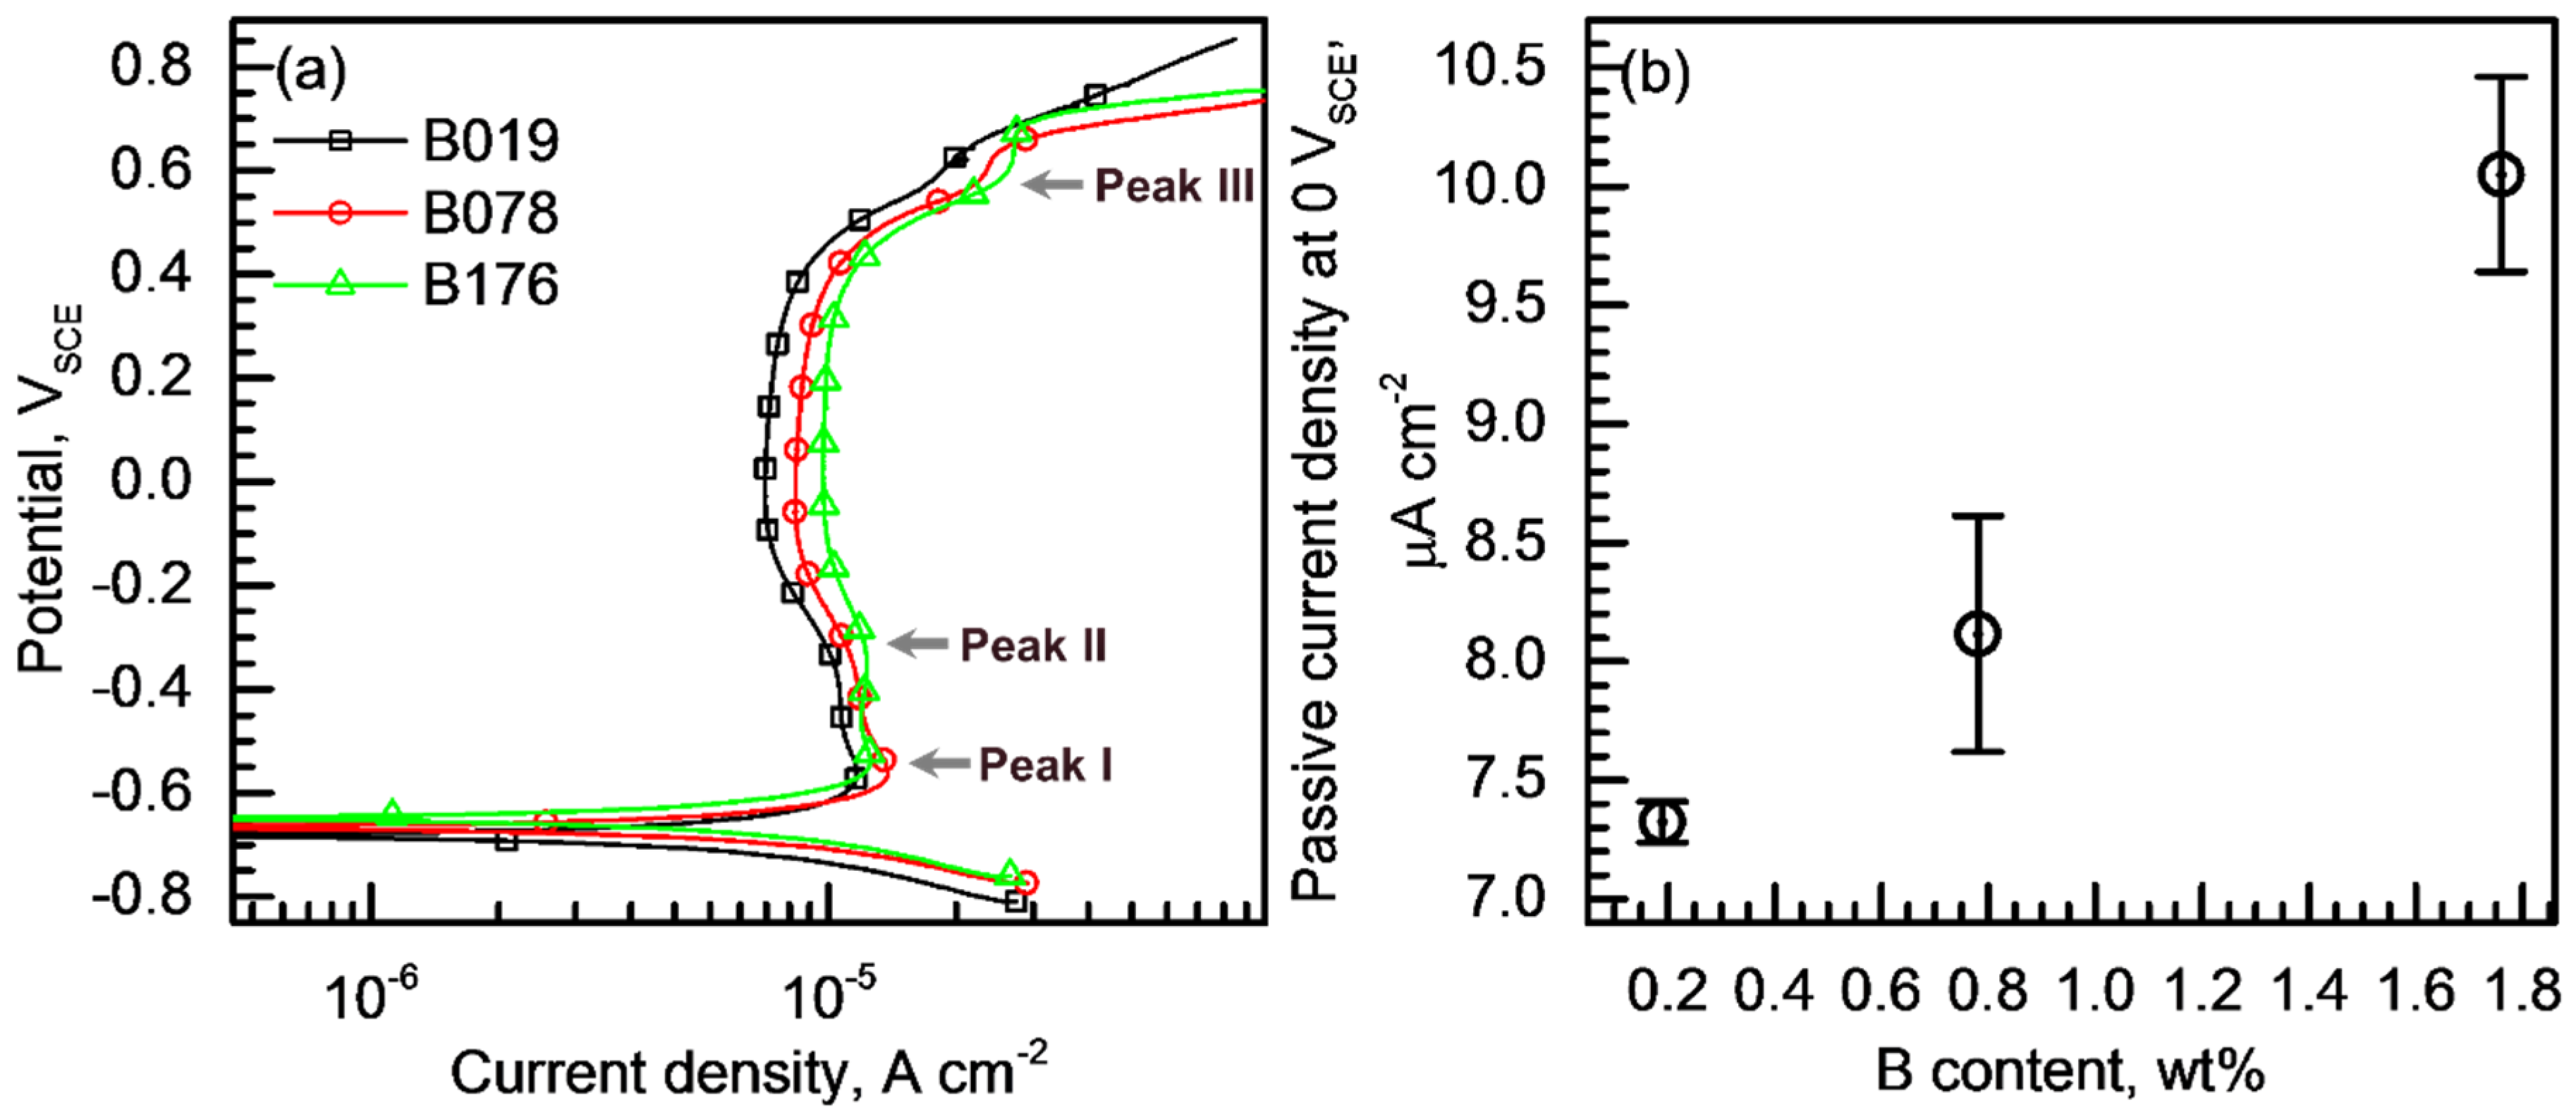
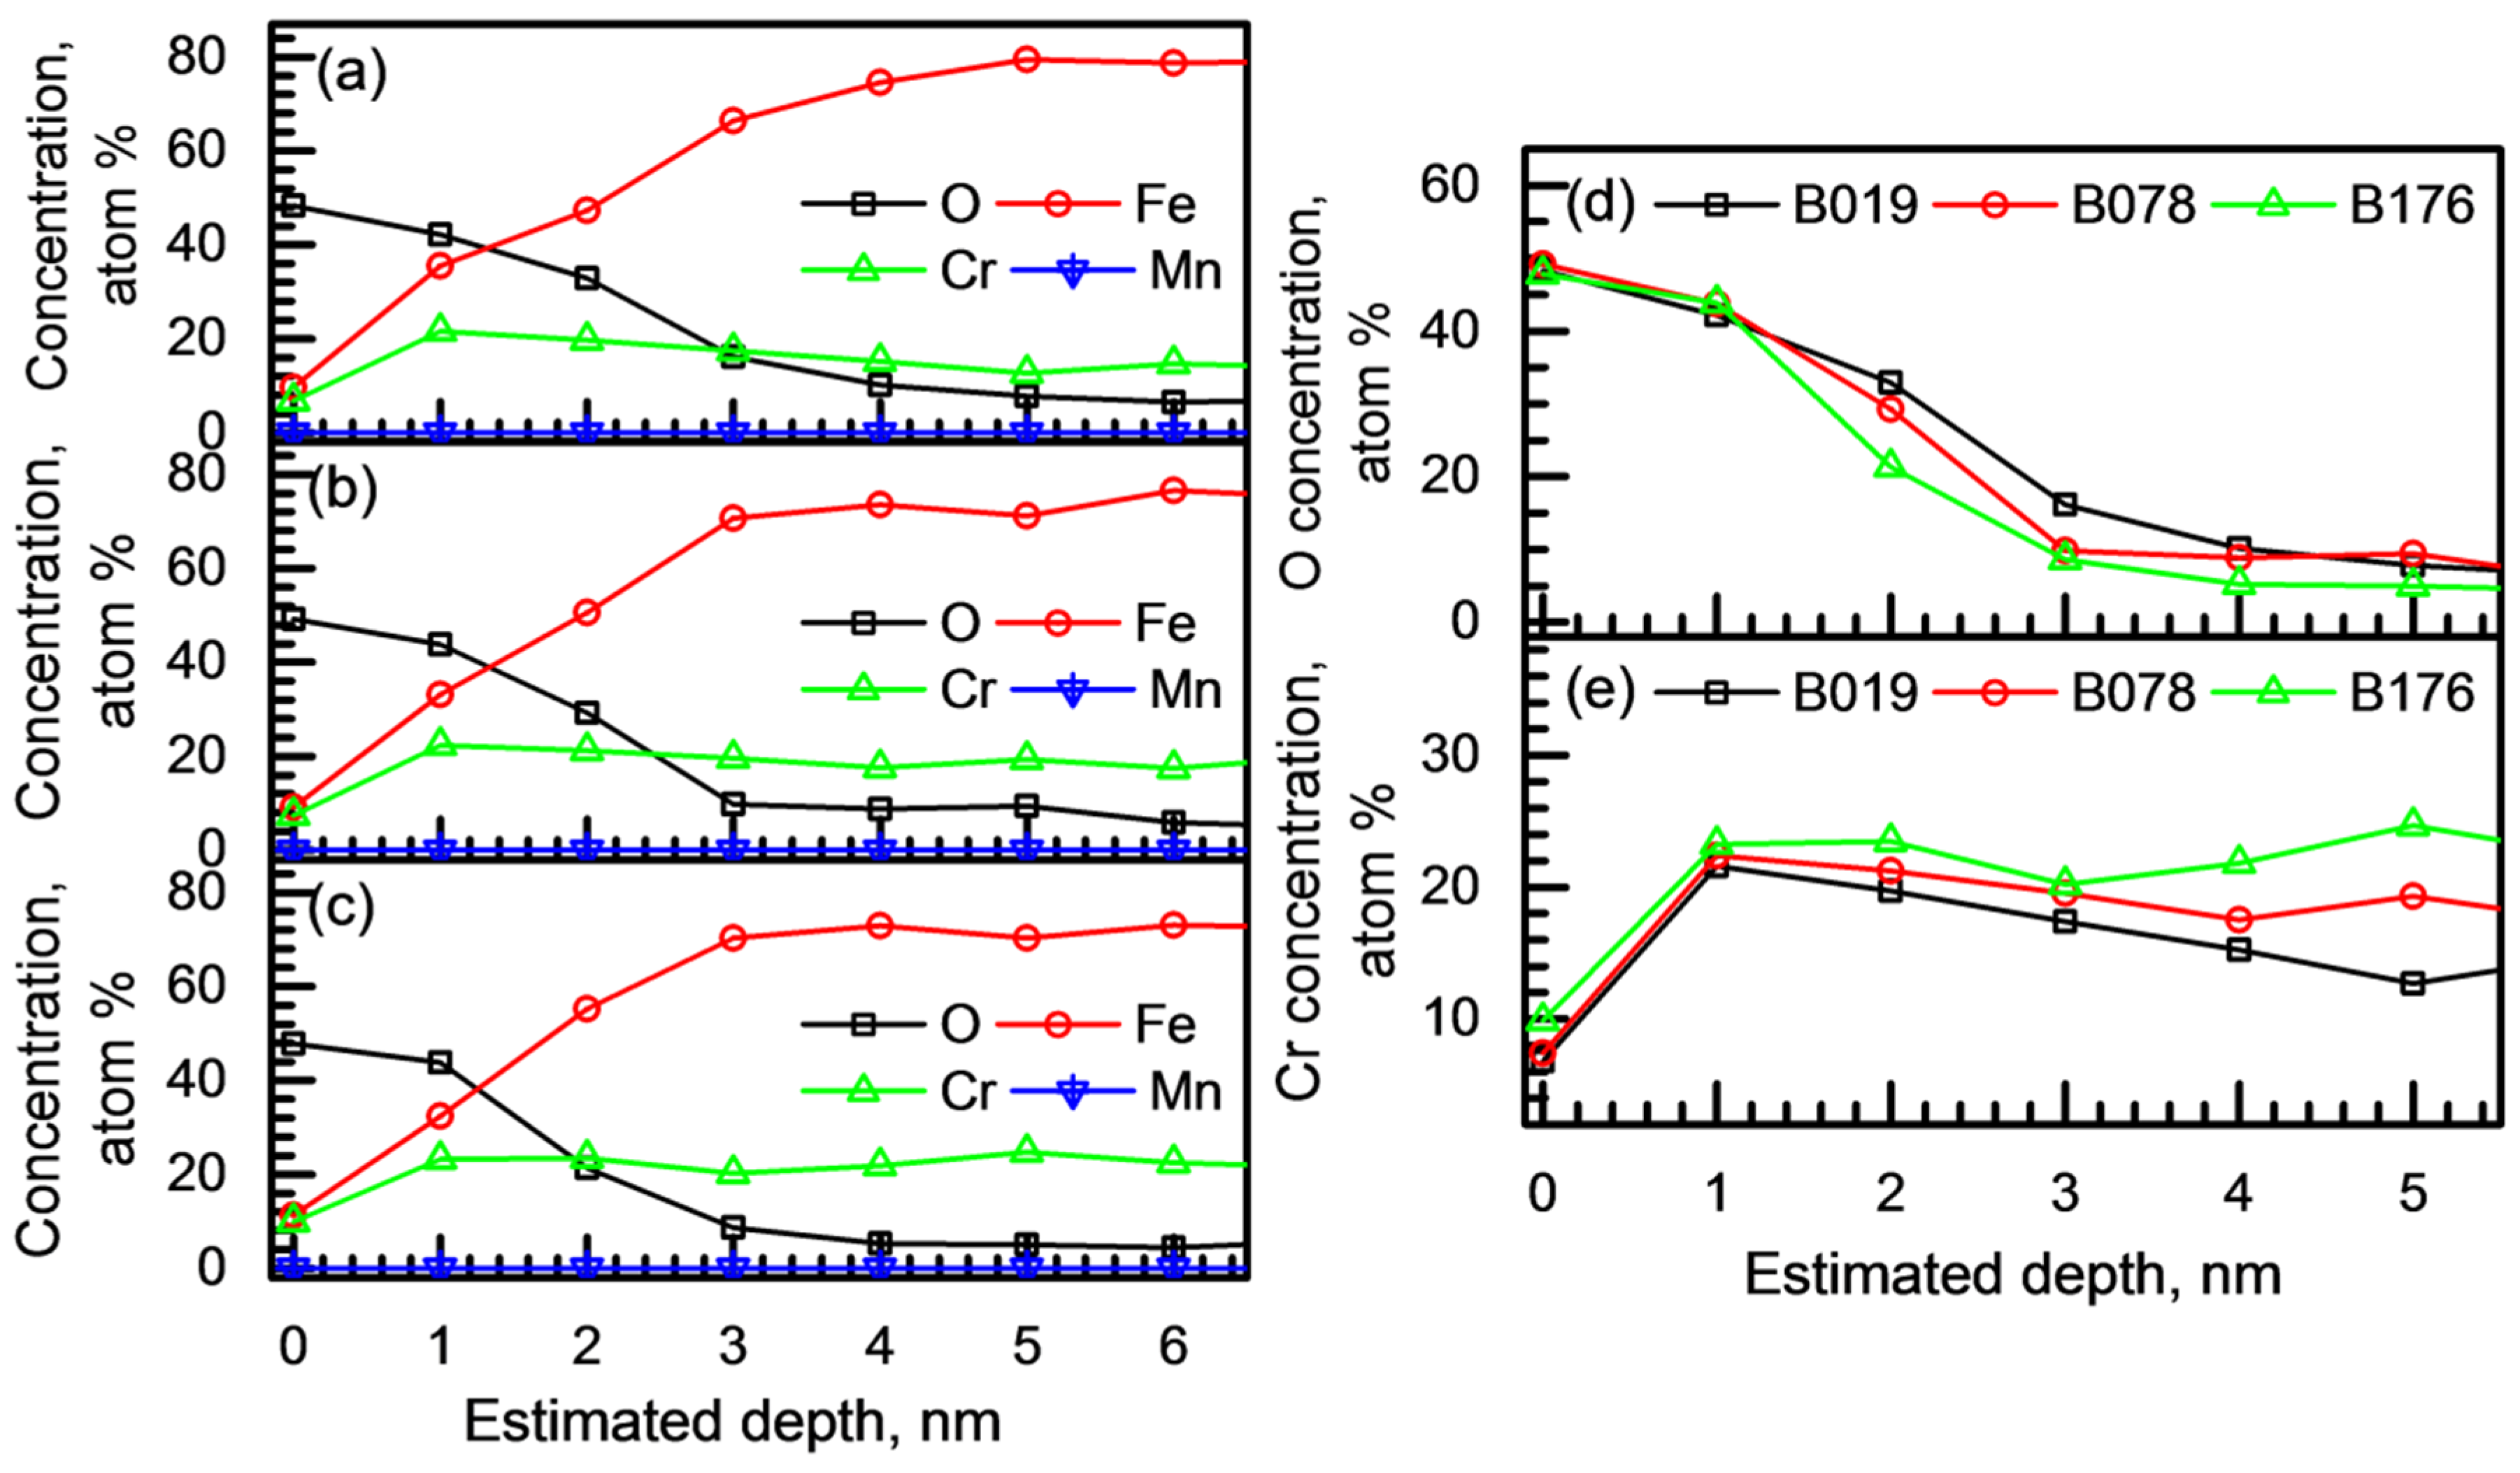
  • Regarding the passive behavior, the passive current density increased as the B content in the alloy increased. The passive films of the borated stainless steels formed in borate–phosphate–citric buffer solution (pH 8.5) were (Fe,Cr)-oxides. With an increase in the B addition, the passive film thickness decreased from 2.5 to 1.8 nm, and the Cr content in the passive film slightly increased. Furthermore, Mott–Schottky analysis confirmed that more defective passive film was formed on the alloy with higher B content.
  • The reduced resistance to pitting corrosion of the B-bearing type 304 stainless steel along with the increase in the B content was due to the formation of a more defective and thinner passive film and a larger number of pit initiation sites in the matrix.

Author Contributions

1. H.-Y.H. (corresponding author): Electrochemical tests and comprehensive analysis; 2. J.H.J.: Phase prediction and microstructural analysis; 3. T.-H.L.: Microstructure and composition analyses through TEM and EPMA; 4. C.W.: Sample preparation for microstructural analysis and phase quantification; 5. C.-H.L.: Alloy design and fabrication, and controlling the fabrication process; 6. J.M.: Accurate analysis of the second phases through TEM and EPMA; 7. C.-G.L.: Sample preparation for polarization and immersion tests.

Acknowledgments

This study was financially supported by Fundamental Research Program (grant number PNK5850) of the Korea Institute of Materials Science (KIMS).

Conflicts of Interest

The authors declare no conflict of interest.

References

  1. Machiels, A.; Lambert, R. Handbook of Neutron Absorber Materials for Spent Nuclear Fuel Transportation and Storage Applications, 2009 ed.; EPRI: Palo Alto, CA, USA, 2009; p. 2. [Google Scholar]
  2. Brown, R.S. Corrosion Resistance of Borated Stainless Steels; Carpenter Powder Products: Wyomissing, PA, USA, 1991; p. 657. [Google Scholar]
  3. Robino, C.V.; Cieslak, M.J. High-temperature metallurgy of advanced borated stainless steels. Metall. Mater. Trans. A 1995, 26, 1673–1685. [Google Scholar] [CrossRef]
  4. He, J.Y.; Soliman, S.E.; Bratta, A.J.; Balliett, T.A. Fracture Mechanism of Borated Stainless Steel. Nucl. Technol. 2000, 130, 218–225. [Google Scholar] [CrossRef]
  5. Fix, D.V.; Estill, J.C.; Wong, L.L.; Rebak, R.B. General and Localized Corrosion of Austenitic and Borated Stainless Steels in Simulated Concentrated Ground Waters. In Proceedings of the American Society of Mechanical Engineers Pressure Vessels and Piping Division (ASME-PVP) Conference, San Diego, CA, USA, 25–29 July 2004. [Google Scholar]
  6. Moreno, D.A.; Molina, B.; Ranninger, C.; Montero, F.; Izquierdo, J. Microstructural Characterization and Pitting Corrosion Behavior of UNS S30466 Borated Stainless Steel. Corrosion 2004, 60, 573–583. [Google Scholar] [CrossRef]
  7. Lister, T.E.; Mizia, R.E.; Erickson, A.W.; Matteson, B.S. General and Localized Corrosion of Borated Stainless Steels; INL/CON-07-135355; Idaho National Laboratory: Idaho Falls, ID, USA, 2008. [Google Scholar]
  8. He, X.; Ahn, T.; Sippel, T. Corrosion of Borated Stainless Steel in Water and Humid Air; NRC-02-07-006; Nuclear Regulatory Commission: Rockville, MD, USA, 2011. [Google Scholar]
  9. Shanmugarajan, B.; Chary, J.N.; Padmanabham, G.; Arivazhagan, B.; Shaju, K.A.; Bhaduri, A.K. Studies on autogenous laser welding of type 304B4 borated stainless steel. Opt. Laser Eng. 2013, 51, 1272–1277. [Google Scholar]
  10. RajaKumar, G.; Ram, G.D.J.; Rao, S.R.K. Microstructure and Mechanical properties of Borated Stainless Steel (304B) GTA and SMA welds. La Metall. Ital. 2015, 5, 47–52. [Google Scholar]
  11. Sivai Bharasi, N.; Pujar, M.G.; Nirmal, S.; Mallika, C.; Kamachi Mudali, U.; Angelo, P.C. Comparison of SCC Behavior of 304L Stainless Steels With and Without Boron Addition in Acidic Chloride Environment. J. Mater. Eng. Perform. 2016, 5, 2786–2798. [Google Scholar] [CrossRef]
  12. American Society for Testing and Materials (ASTM) A 887-89. Standard Specification for Borated Stainless Steel Plate, Sheet, and Strip for Nuclear Application; ASTM: West Conshohocken, PA, USA, 2004. [Google Scholar]
  13. Loria, E.A.; Isaacs, H.S. Type 304 stainless steel with 0.50% boron for storage of spent nuclear fuel. JOM 1980, 32, 10–17. [Google Scholar] [CrossRef]
  14. Hoffman, J.P.; De Jesus, A.S.M. The distribution of boron in stainless steels as revealed by a nuclear technique. J. S. Afr. Inst. Min. Metall. 1989, 89, 81–87. [Google Scholar]
  15. Levitin, V.V.; Syreishchikova, V.I. On the effect of boron on the nature of the carbide precipitation in austenitic steel on tempering. Fiz. Met. Metallovdenie 1959, 7, 308–310. [Google Scholar]
  16. Farrell, J.W.; Rosenthal, P.C. How boron affects corrosion of type 304 stainless steel. Met. Prog. 1960, 77, 101–103. [Google Scholar]
  17. Robinson, F.P.A.; Scurr, W.G. The effect of boron on the corrosion resistance of austenitic stainless steels. Corrosion 1977, 33, 408–417. [Google Scholar] [CrossRef]
  18. Dergach, T.A.; Sukhomlin, G.D. Effect of boron on the structure and intercrystalline-corrosion resistance of austenitic stainless steel. Prot. Met. 1990, 25, 390–394. [Google Scholar]
  19. Goldschmidt, H.J. Effect of Boron Additions to Austenitic Stainless Steels. J. Iron Steel Inst. 1971, 209, 900–911. [Google Scholar]
  20. Upadhyay, N.; Pujar, M.G.; Das, C.R.; Mallika, C.; Kamachi Mudali, U. Pitting Corrosion Studies on Solution-Annealed Borated Type 304L Stainless Steel Using Electrochemical Noise Technique. Corrosion 2014, 70, 781–795. [Google Scholar] [CrossRef]
  21. Sundman, B.; Jansson, B.; Andersson, J.O. The Thermo-Calc Databank System. Calphad 1985, 9, 153–190. [Google Scholar] [CrossRef]
  22. Novak, E.; Schmit, J. White-light optical profiler with integrated primary standard. In Proceedings of the XVII IMEKO World Congress Metrology in the 3rd Millennium, Dubrovnik, Croatia, 22–27 June 2003; pp. 183–186. [Google Scholar]
  23. Ha, H.-Y.; Kwon, H.-S. Effects of pH Levels on the Surface Charge and Pitting Corrosion Resistance of Fe. J. Electrochem. Soc. 2012, 159, C416–C421. [Google Scholar] [CrossRef]
  24. Jiang, S.Z.; Bao, Y.Z. A study of the brittleness and its improvement of high boron Cr–Ni stainless steels. Inst. Tech. Bull. 1993, 3, 194–198. [Google Scholar]
  25. Piao, T.; Park, S.-M. Spectroelectrochemical Studies of Passivation and Transpassive Breakdown Reactions of Stainless Steel. J. Electrochem. Soc. 1997, 144, 3371–3377. [Google Scholar] [CrossRef]
  26. Cho, E.A.; Kwon, H.S.; Macdonald, D.D. Photoelectrochemical analysis on the passive film formed on Fe–20Cr in pH 8.5 buffer solution. Electrochim. Acta 2002, 47, 1661–1668. [Google Scholar] [CrossRef]
  27. Kuczynska-Wydorska, M.; Flis-Kabulska, I.; Flis, J. Corrosion of low-temperature nitrided molybdenum-bearing stainless steels. Corros. Sci. 2011, 53, 1762–1769. [Google Scholar] [CrossRef]
  28. Ha, H.-Y.; Lee, T.-H.; Kim, S.-J. Role of nitrogen in the active–passive transition behavior of binary Fe–Cr alloy system. Electrochim. Acta 2012, 80, 432–439. [Google Scholar] [CrossRef]
  29. Obayi, C.S.; Tolouei, R.; Mostavan, A.; Paternoster, C.; Turgeon, S.; Okorie, B.A.; Obikwelu, D.O.; Mantovani, D. Effect of grain sizes on mechanical properties and biodegradation behavior of pure iron for cardiovascular stent application. Biomatter 2016, 6, e959874. [Google Scholar] [CrossRef] [PubMed]
  30. Sabooni, S.; Rashtchi, H.; Eslami, A.; Karimzadeh, F.; Enayati, M.H.; Raeissi, K.; Ngan, A.H.W.; Imani, R.F. Dependence of corrosion properties of AISI 304L stainless steel on the austenite grain size. Int. J. Mater. Res. 2017, 108, 552–559. [Google Scholar] [CrossRef]
  31. Lee, C.-G.; Ha, H.-Y.; Lee, T.-H.; Cho, K.-M. Effects of Nb on Pitting Corrosion Resistance of Ni-Free FeCrMnCN-Based Stainless Steels. J. Electrochem. Soc. 2017, 164, C591–C597. [Google Scholar] [CrossRef]
  32. Di Schino, A.; Kenny, J.M. Effects of the grain size on the corrosion behavior of refined AISI 304 austenitic stainless steels. J. Mater. Sci. Lett. 2002, 21, 1631–1634. [Google Scholar] [CrossRef]
  33. Hubschmid, C.; Landolt, D.; Mathieu, H.J. XPS and AES analysis of passive films on Fe-25Cr-X (X = Mo, V, Si and Nb) model alloys. Fresenius J. Anal. Chem. 1995, 353, 234–239. [Google Scholar] [CrossRef]
  34. Yang, M.Z.; Luo, J.L.; Yang, Q.; Qiao, L.J.; Qin, Z.Q.; Norton, P.R. Effects of Hydrogen on Semiconductivity of Passive Films and Corrosion Behavior of 310 Stainless Steel. J. Electrochem. Soc. 1999, 146, 2107–2112. [Google Scholar] [CrossRef]
  35. Paola, A.D. Semiconducting properties of passive films on stainless steels. Electrochim. Acta 1989, 34, 203–210. [Google Scholar] [CrossRef]
  36. Ha, H.-Y.; Jang, M.-H.; Lee, T.-H. Influences of Mn in solid solution on the pitting corrosion behaviour of Fe-23 wt %Cr-based alloys. Electrochim. Acta 2016, 19, 864–875. [Google Scholar] [CrossRef]
  37. Ha, H.-Y.; Lee, T.-H.; Oh, C.-S.; Kim, S.-J. Effects of combined addition of carbon and nitrogen on pitting corrosion behavior of Fe–18Cr–10Mn alloys. Scr. Mater. 2009, 61, 121–124. [Google Scholar] [CrossRef]
  38. Kislyi, P.S.; L’vov, S.N.; Nemchenko, V.F.; Samsonov, G.V. Physical properties of the boride phases of chromium. Sov. Powder Metall. Met. Ceram. 1962, 1, 441–443. [Google Scholar] [CrossRef]
Figure 1. Equilibrium phase diagrams of (a) B019, (b) B078, and (c) B176 alloys calculated using Thermo-Calc software.
Materials 11 02097 g001
Figure 2. Microstructures of (a) B019, (b) B078, and (c) B176 alloys. SEM images of the alloys taken at (a-1,b-1,c-1) low and (a-2,b-2,c-2) high magnification, and optical micrographs of the alloys taken at (a-3,b-3,c-3) low and (a-4,b-4,c-4) high magnification.
Materials 11 02097 g002
Figure 3. Elemental X-ray mapping of Cr, B, Fe, and Ni along with the corresponding back-scattered electron (BSE) images of the (a) B019, (b) B078, and (c) B176 alloys.
Materials 11 02097 g003
Figure 4. Procedure of focused ion beam (FIB) sampling, bright field (BF) imaging, and corresponding selected area diffraction (SAD) patterns of Cr2B and the austenite matrix taken from the B078 alloy.
Materials 11 02097 g004
Figure 5. Potentiodynamic polarization curves of the alloys measured in (a) 10 ppm and (b) 58 ppm NaCl solutions at 20 ± 1 °C at a potential sweep rate of 2 mV s−1; (c) Variation of the average pitting potentials of the alloys as a function of the B content.
Materials 11 02097 g005
Figure 6. Corrosion morphologies of (a) B019, (b) B078, and (c) B176 alloys after immersion tests in a 0.6 M NaCl solution at 20 ± 1 °C for 35 days.
Materials 11 02097 g006
Figure 7. SEM images of the pit initiation sites of (a) B019, (b) B078, and (c) B176 alloys. Three-dimensional surface topographies of the pit initiation sites of (d) B019, (e) B078, and (f) B176 alloys.
Materials 11 02097 g007
Figure 8. (a) Potentiodynamic polarization curves of the alloys measured in a borate–phosphate–citric buffer solution with pH 8.5 (0.2 M boric acid + 0.05 M citric acid + 0.1 M tertiary sodium phosphate) at 20 ± 1 °C at a potential sweep rate of 2 mV s−1; (b) Variation of the average passive current density values of the alloys as a function of the B content.
Materials 11 02097 g008
Figure 9. Chemical composition depth profiles of the passive films of (a) B019, (b) B078, and (c) B176 alloys analyzed through XPS; (d) O and (e) Cr concentration profiles of the passive films formed on the alloys. The passive films were formed in a borate–phosphate–citric buffer solution (pH 8.5) by applying constant anodic potential of 0 VSCE for 3 h.
Materials 11 02097 g009
Figure 10. (a) Mott–Schottky plots for the passive films formed on the borated stainless steels (BSSs). The passive films were formed in a borate–phosphate–citric buffer solution (pH 8.5) by applying constant anodic potential of 0.6 VSCE for 1 h, and the capacitance of the passivated layer was measured at a frequency of 1000 Hz with an imposing sinusoidal voltage perturbation of ±0.01 V (peak-to-peak); (b) Variations of the densities of the point defects (VO2+ and Cr6+) as a function of the B content.
Materials 11 02097 g010
Table 1. Chemical compositions (in wt %) of the investigated alloys.
AlloyFeCrNiMnAlCSiB
B019Balance17.711.91.350.0240.0560.250.19
B07818.412.31.550.0350.0660.260.78
B17618.312.41.570.0390.0730.281.76

