Structural and Magnetic Property of Cr3+ Substituted Cobalt Ferrite Nanomaterials Prepared by the Sol-Gel Method

 ,
,
Abstract
:1. Introduction
2. Methodology
2.1. Preparation of Samples
2.2. Characterization
3. Results and Discussion
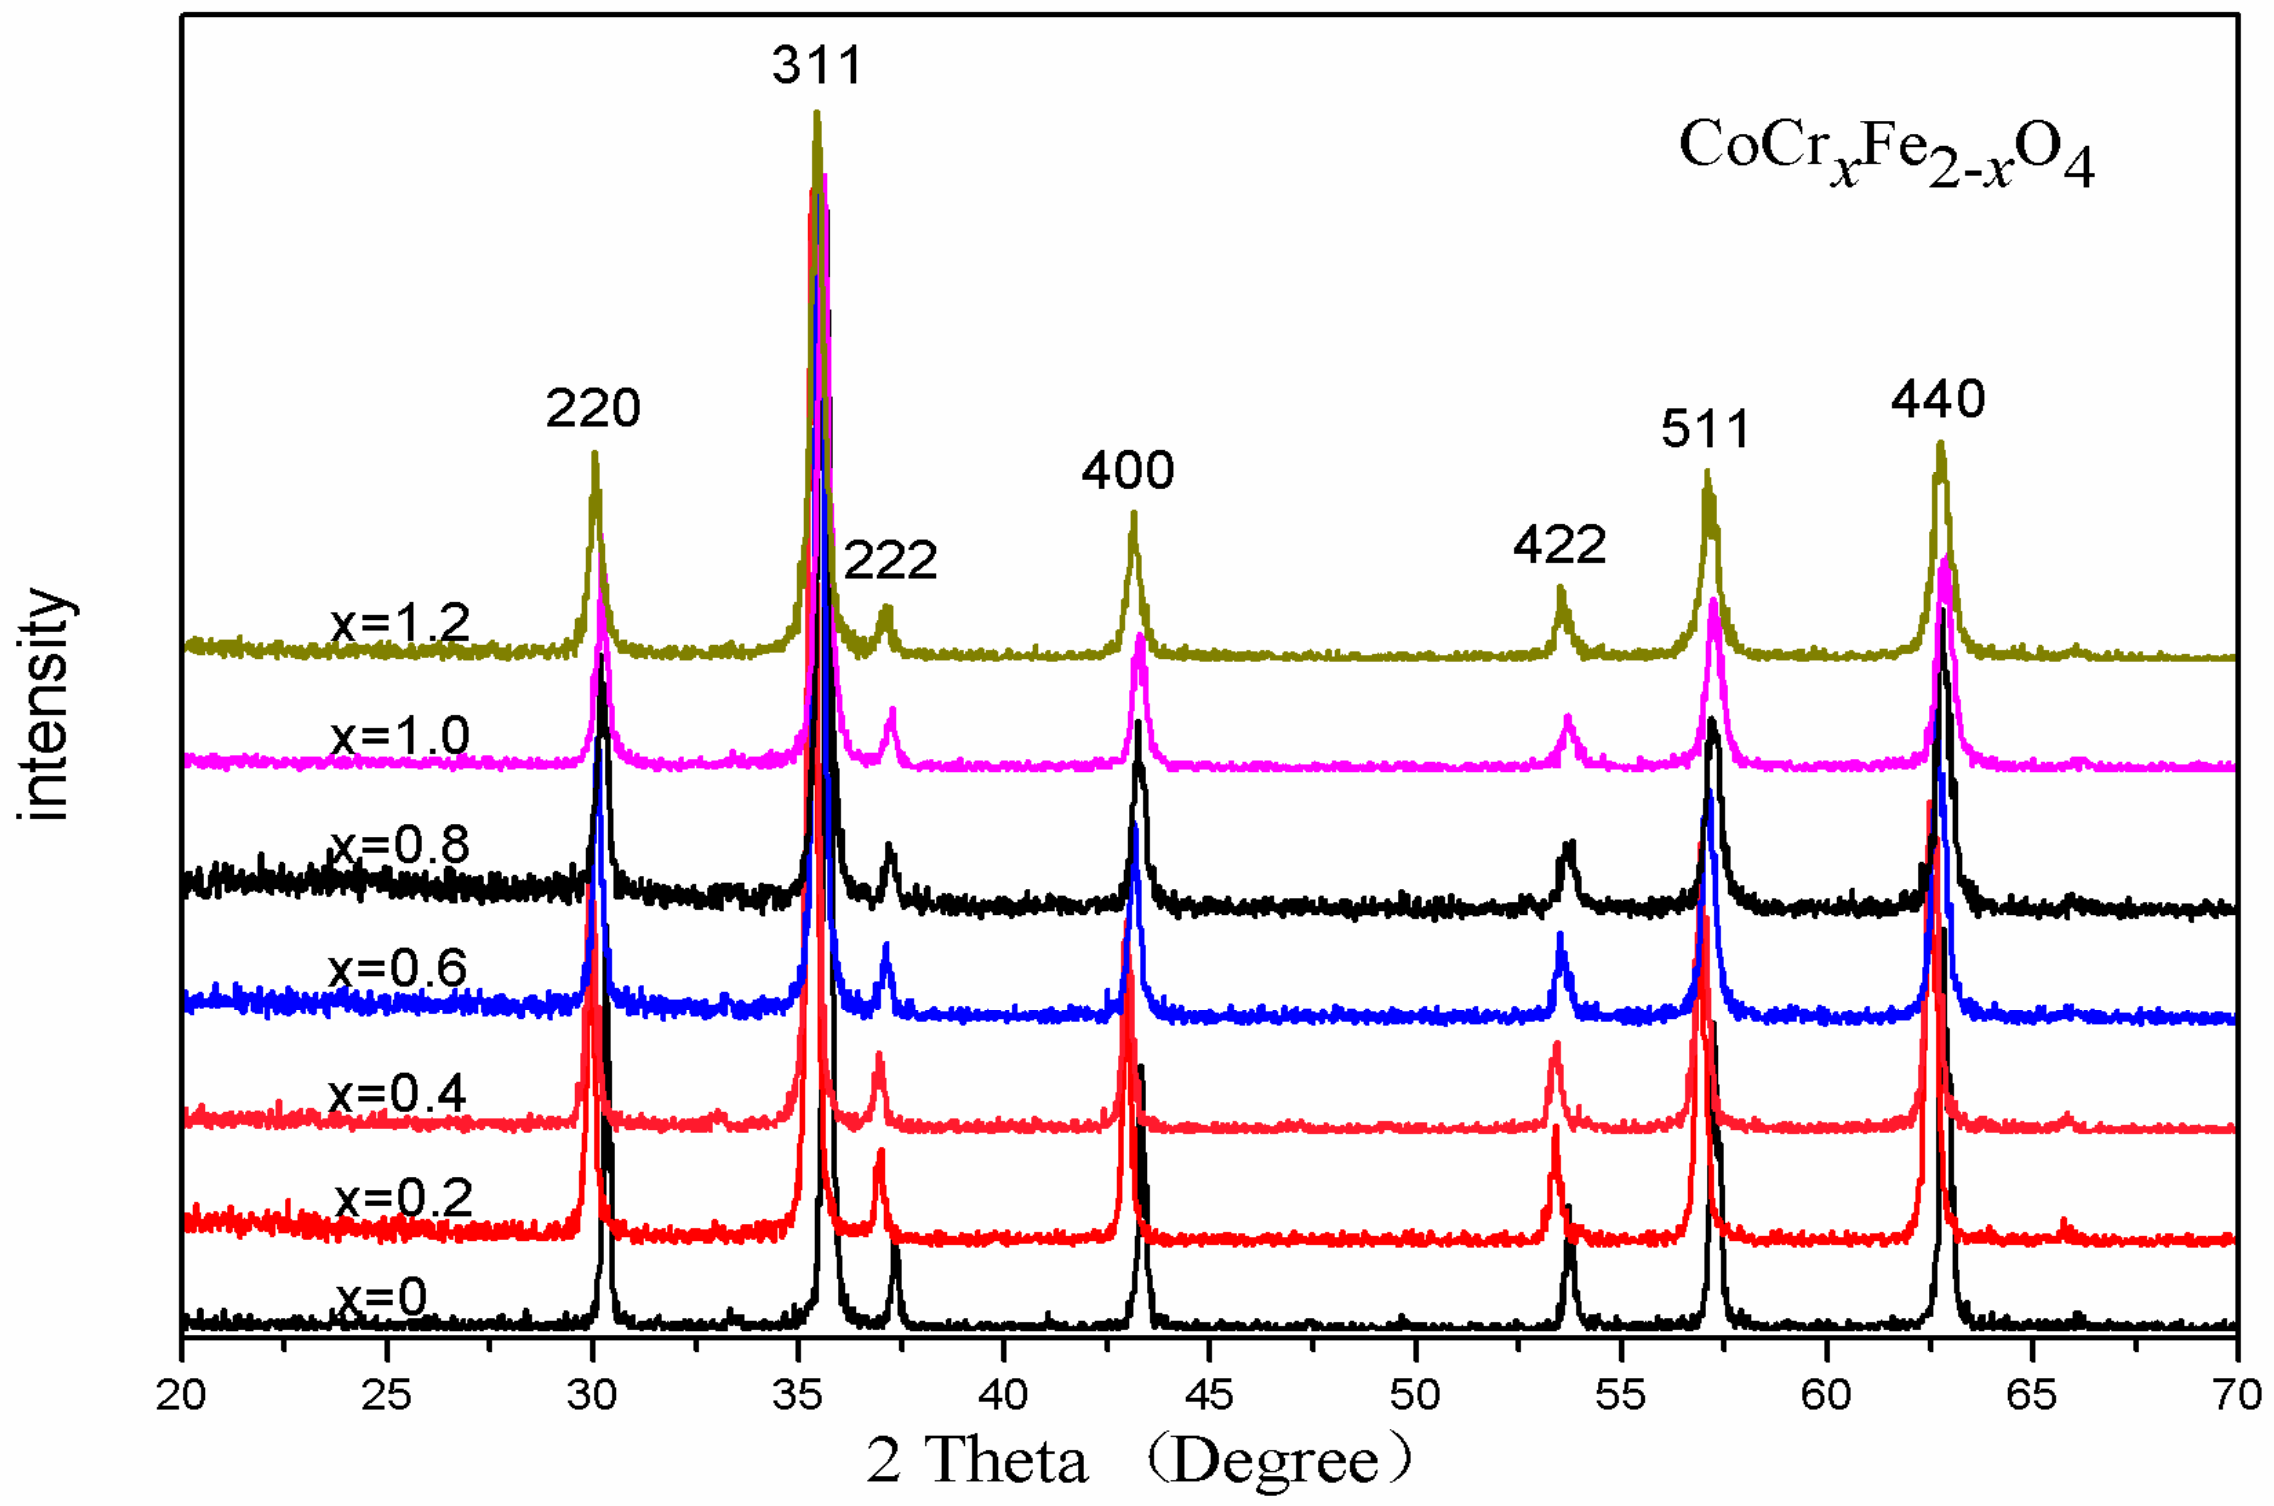
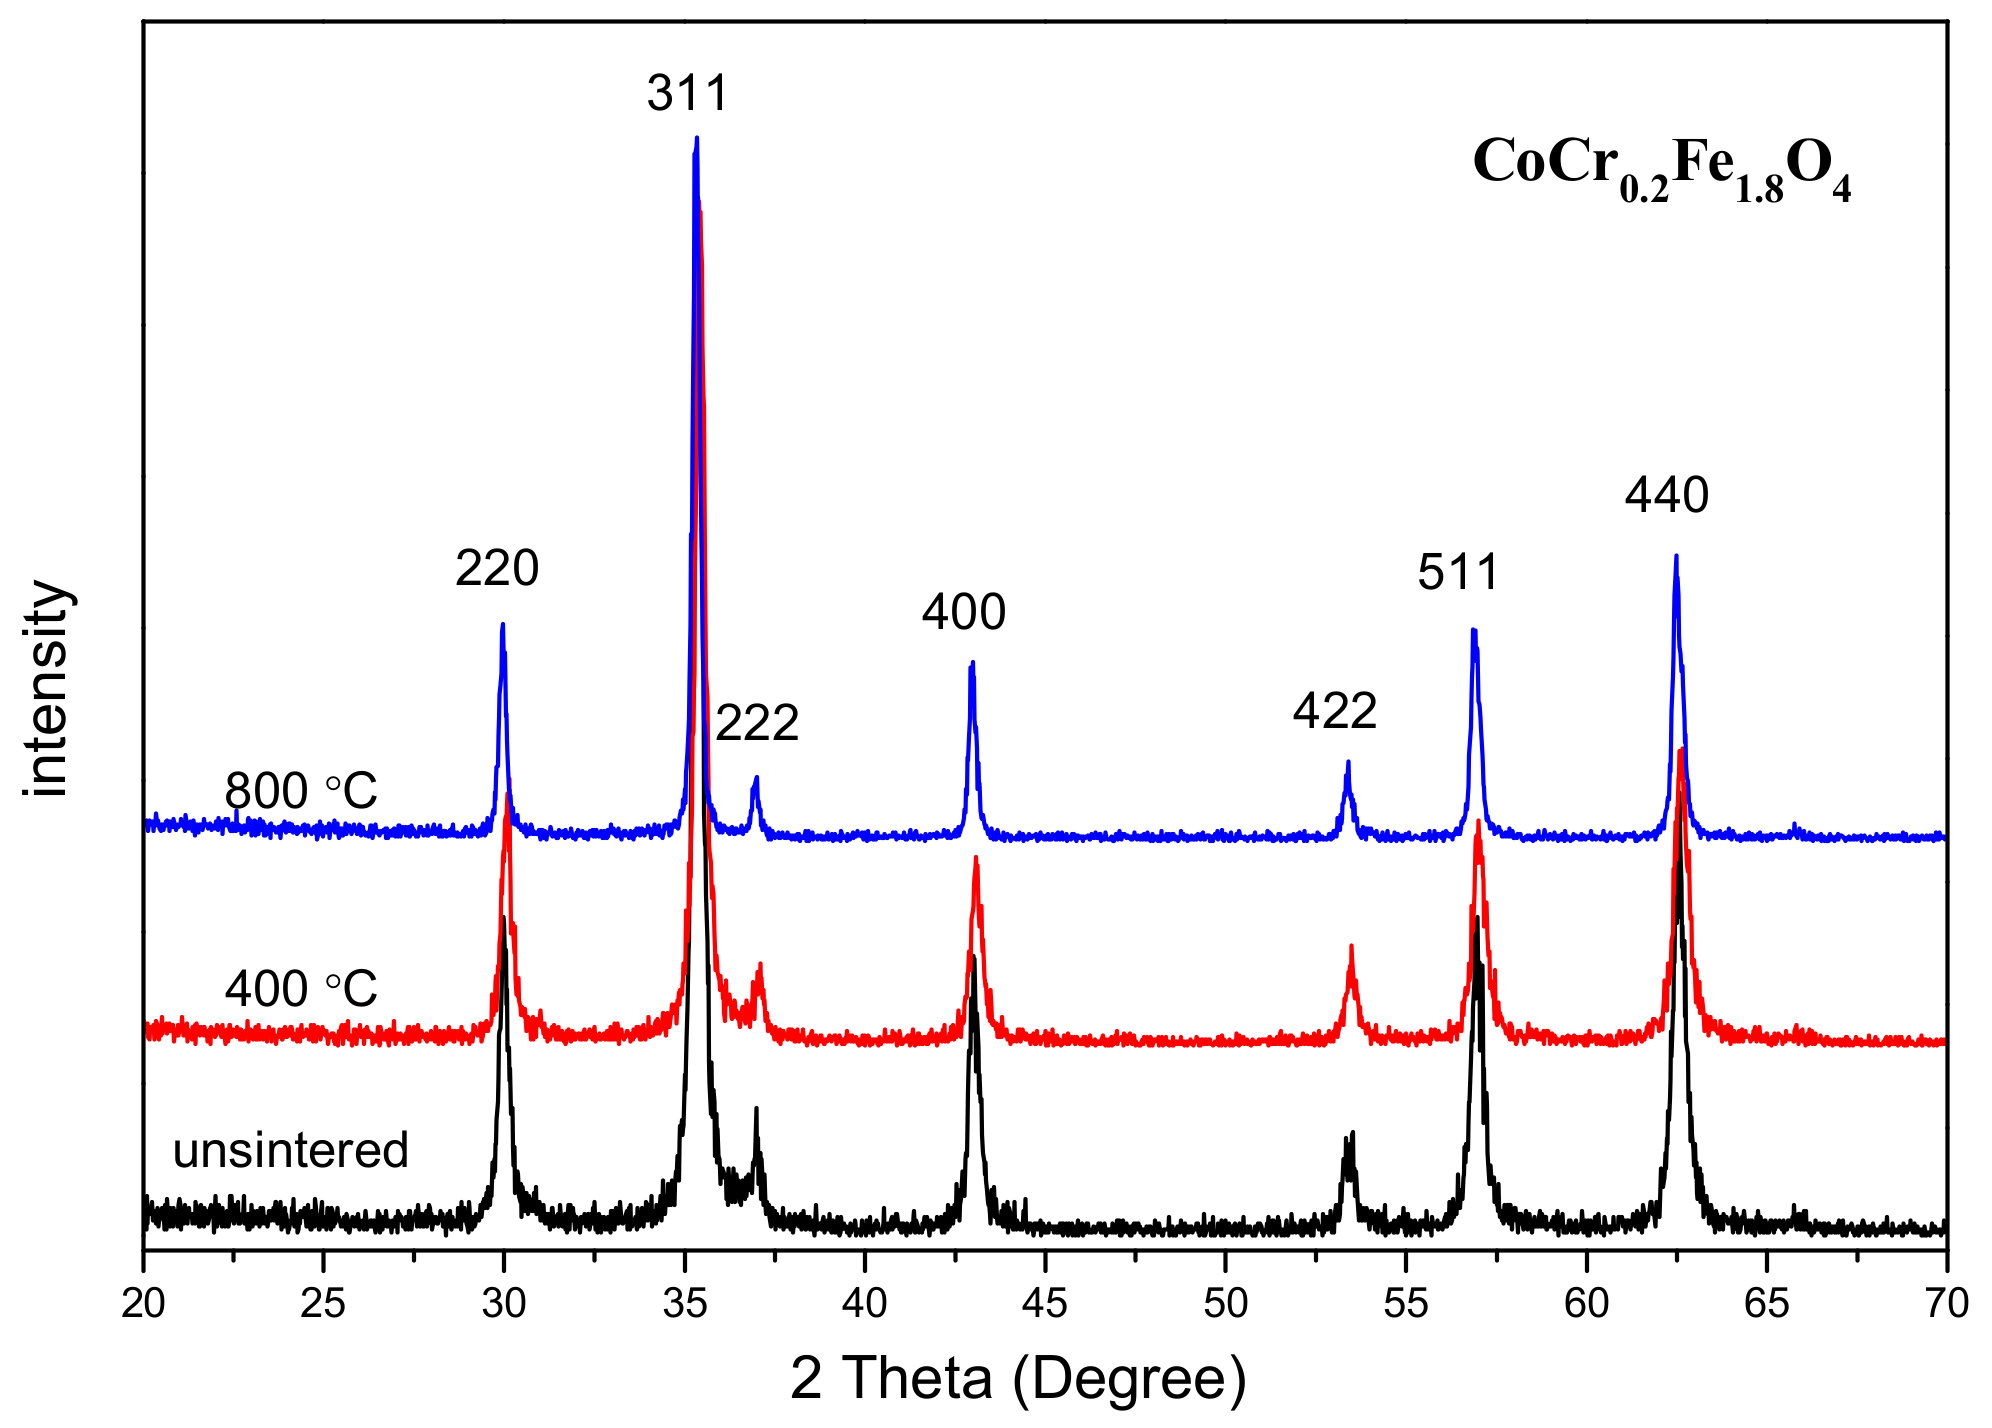
3.1. X-ray Diffraction Analysis
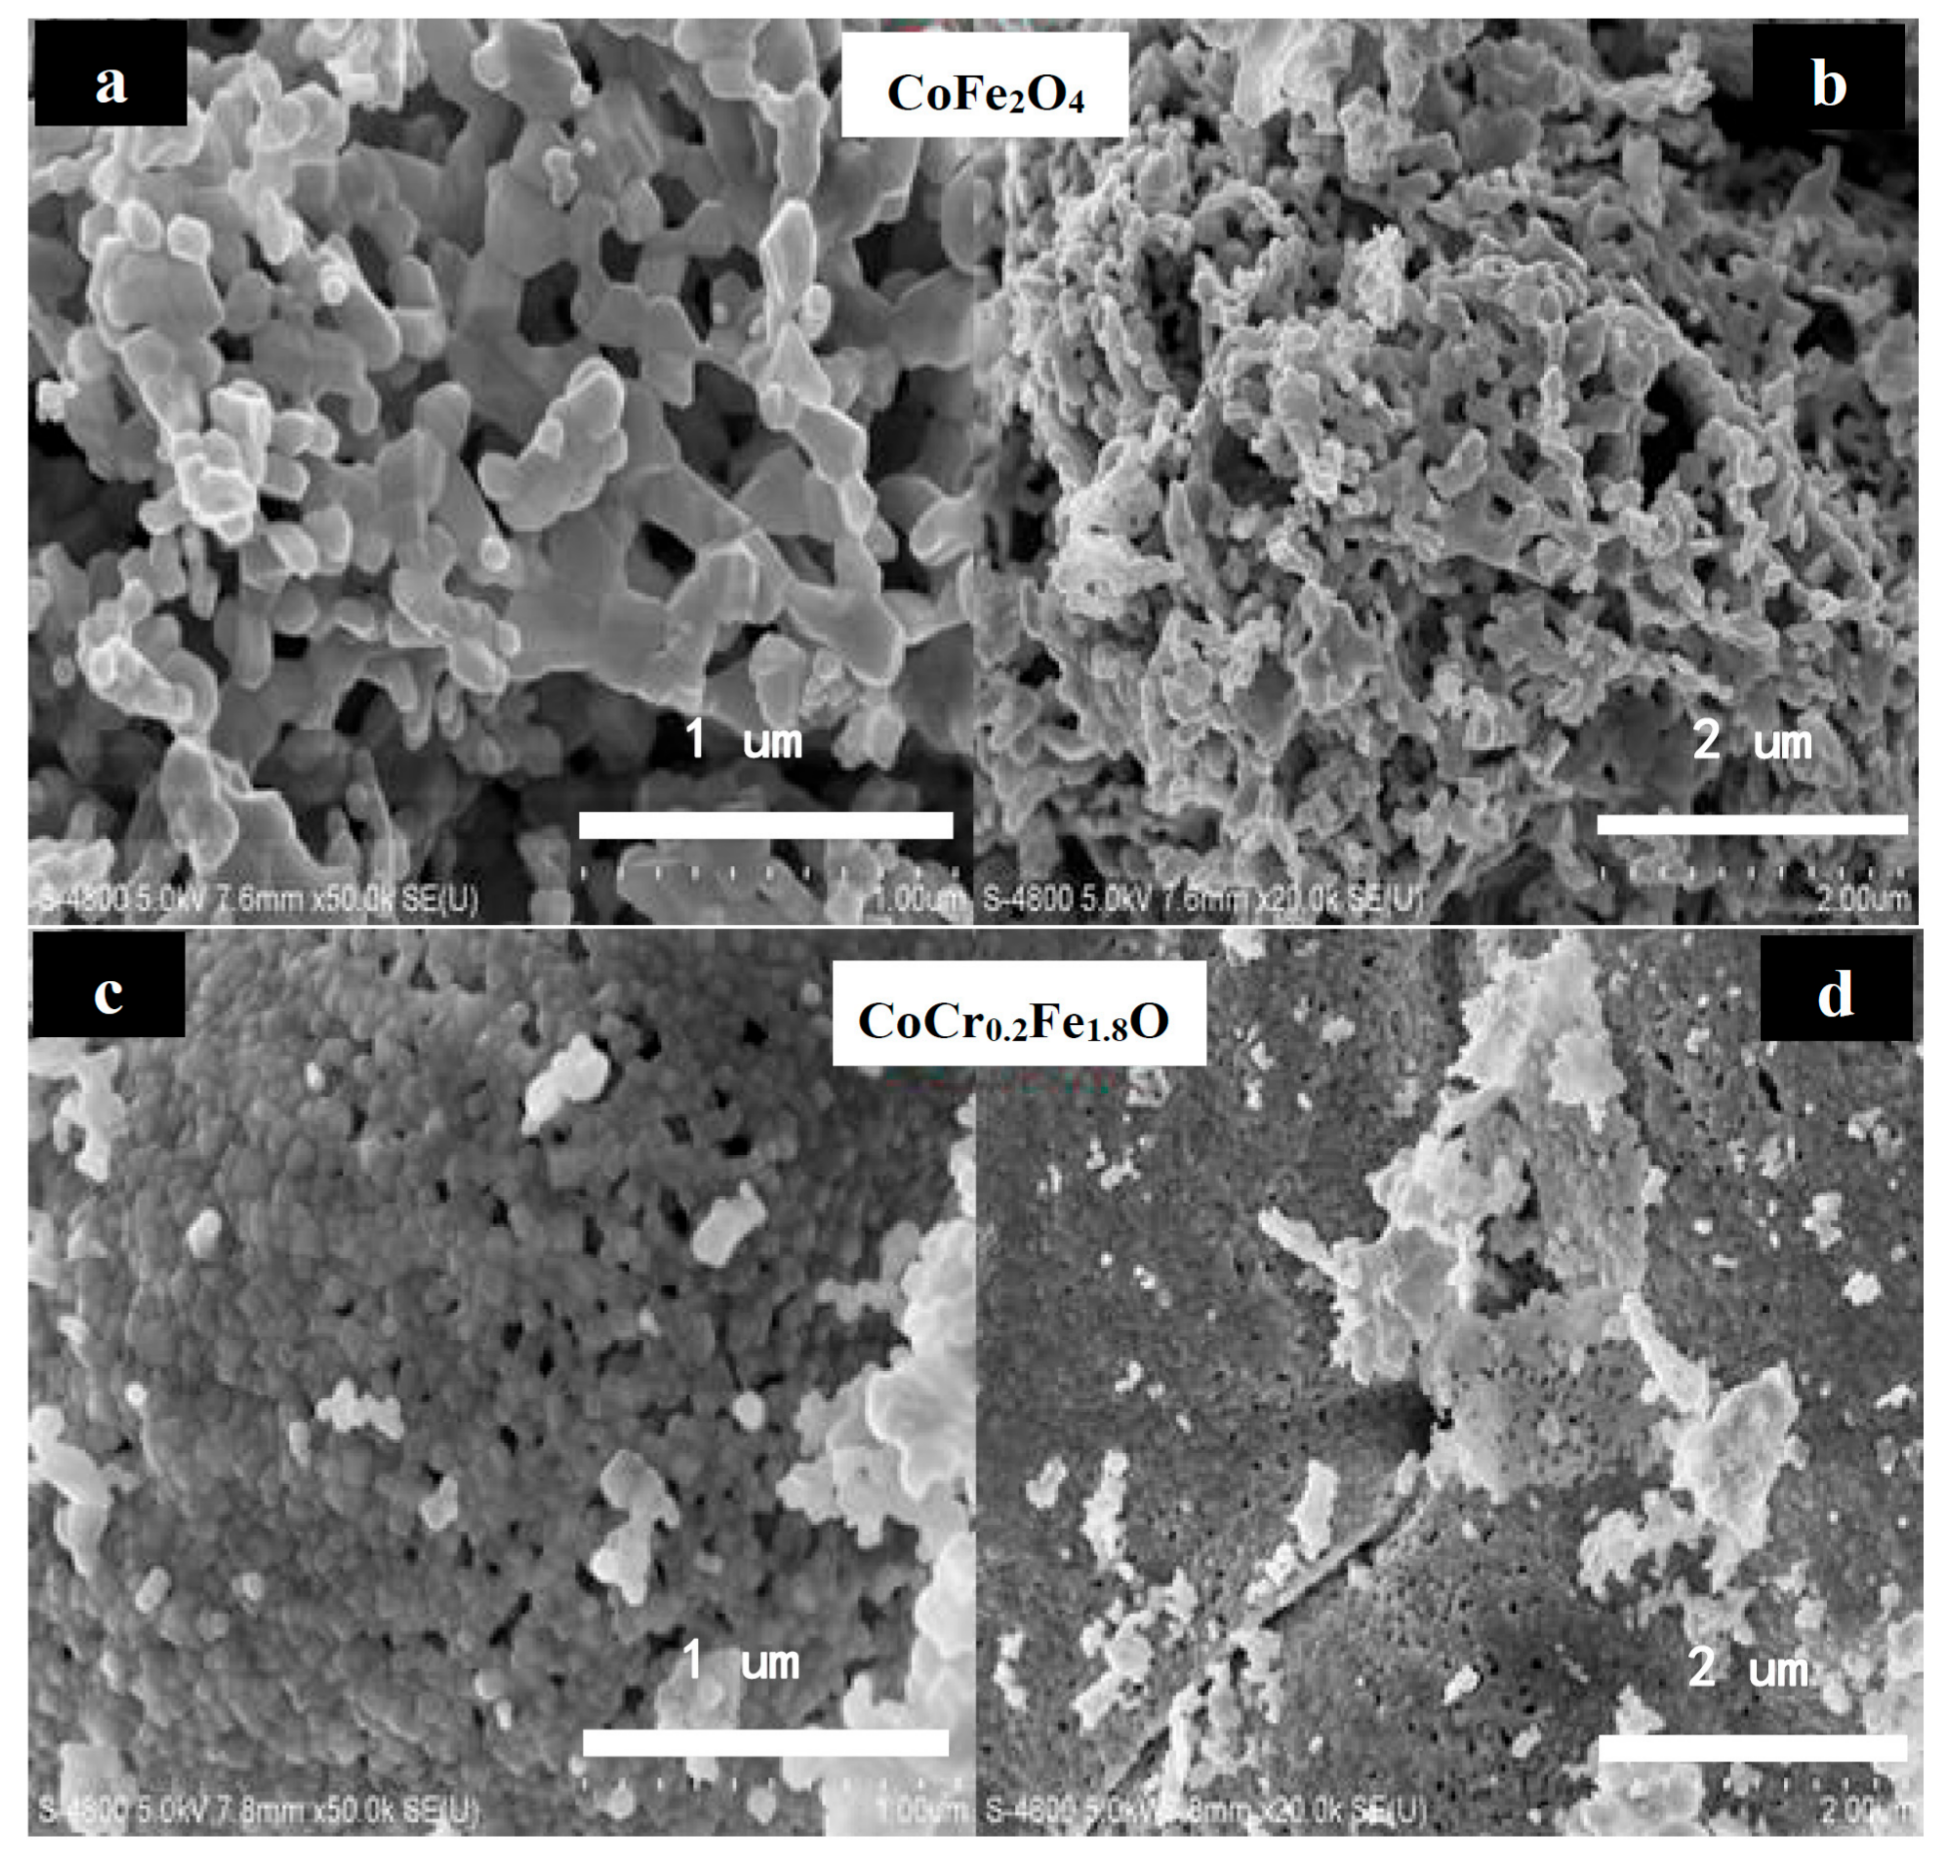
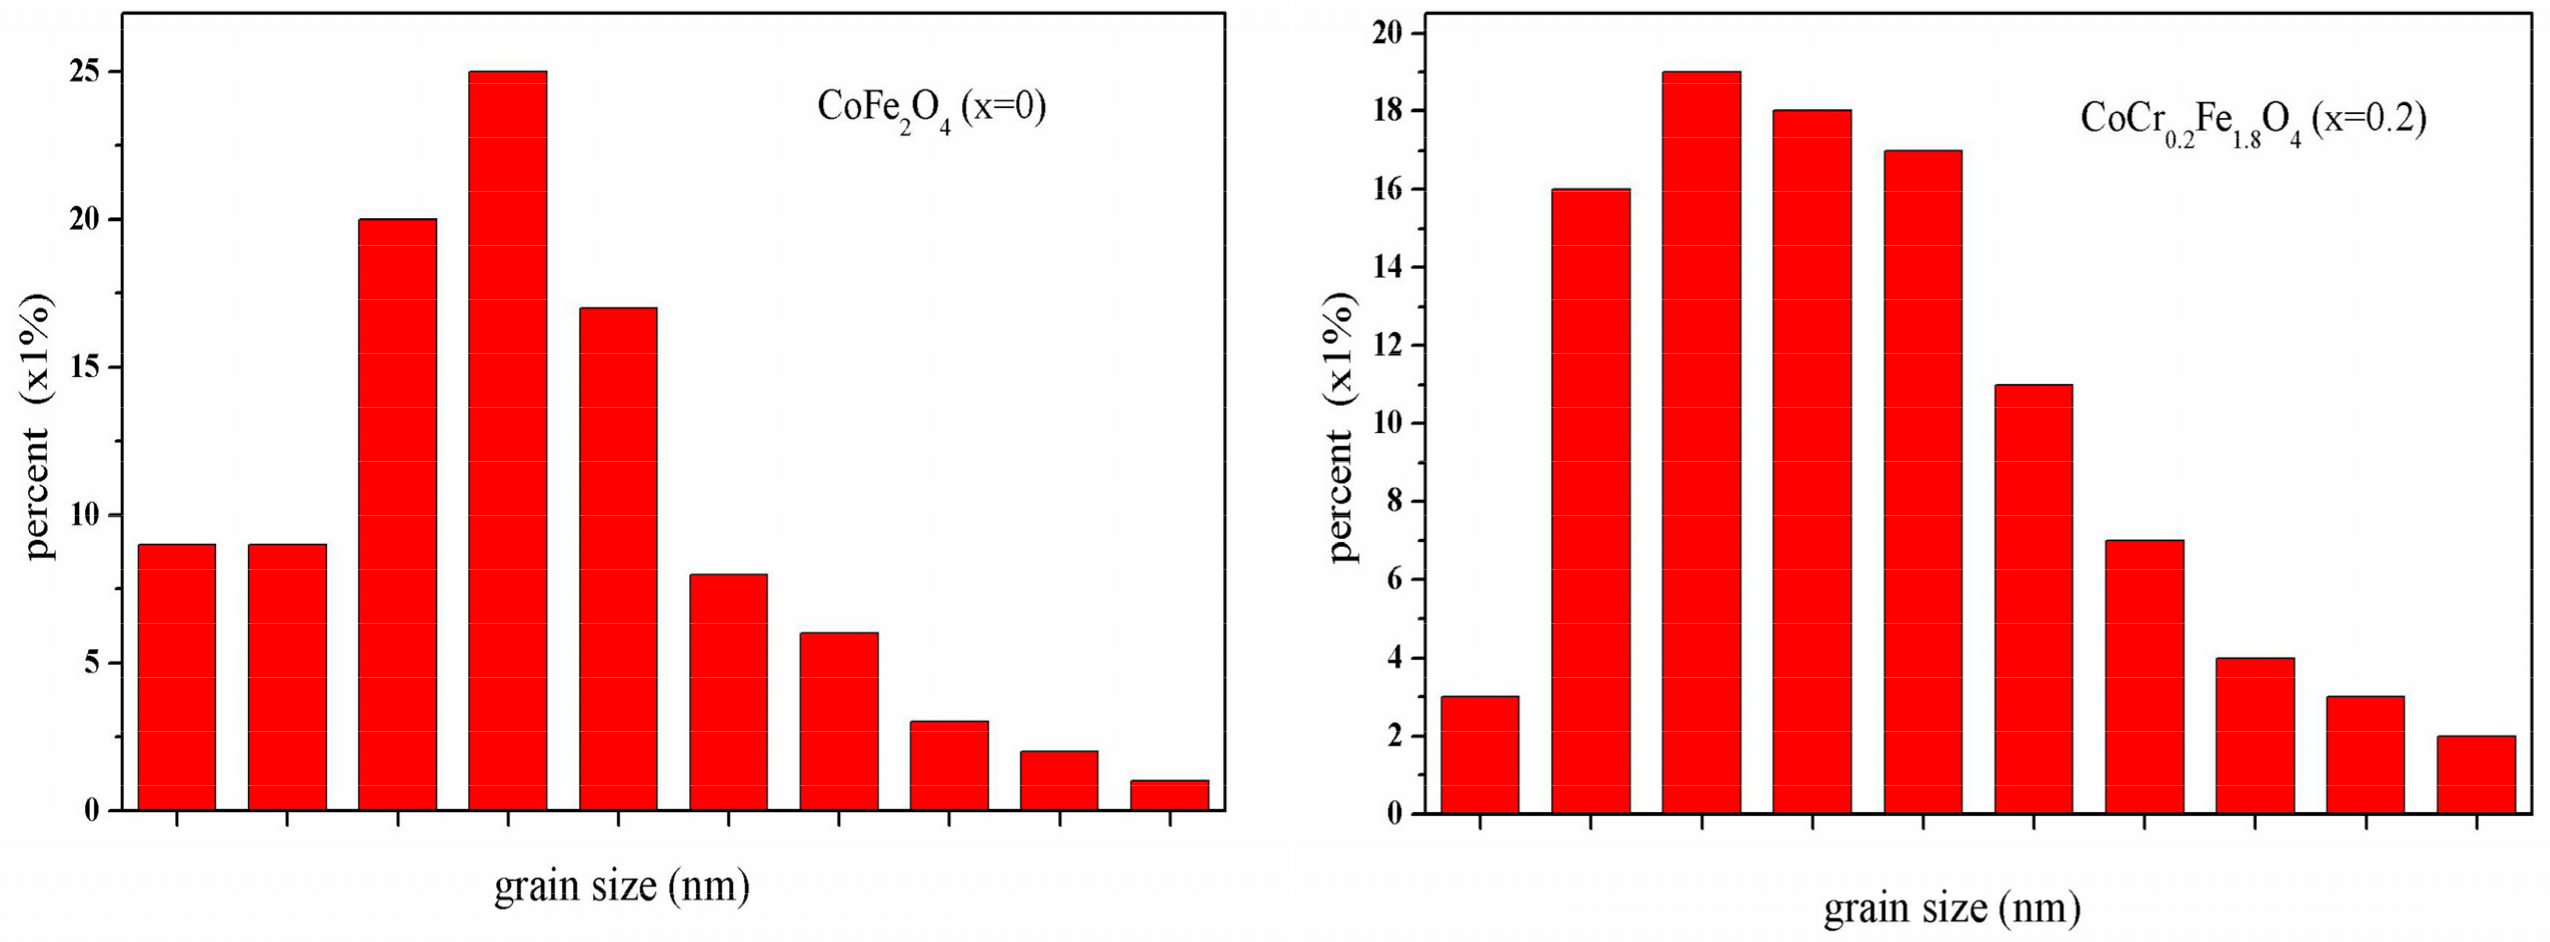
3.2. Scanning Electron Microscopy (SEM)
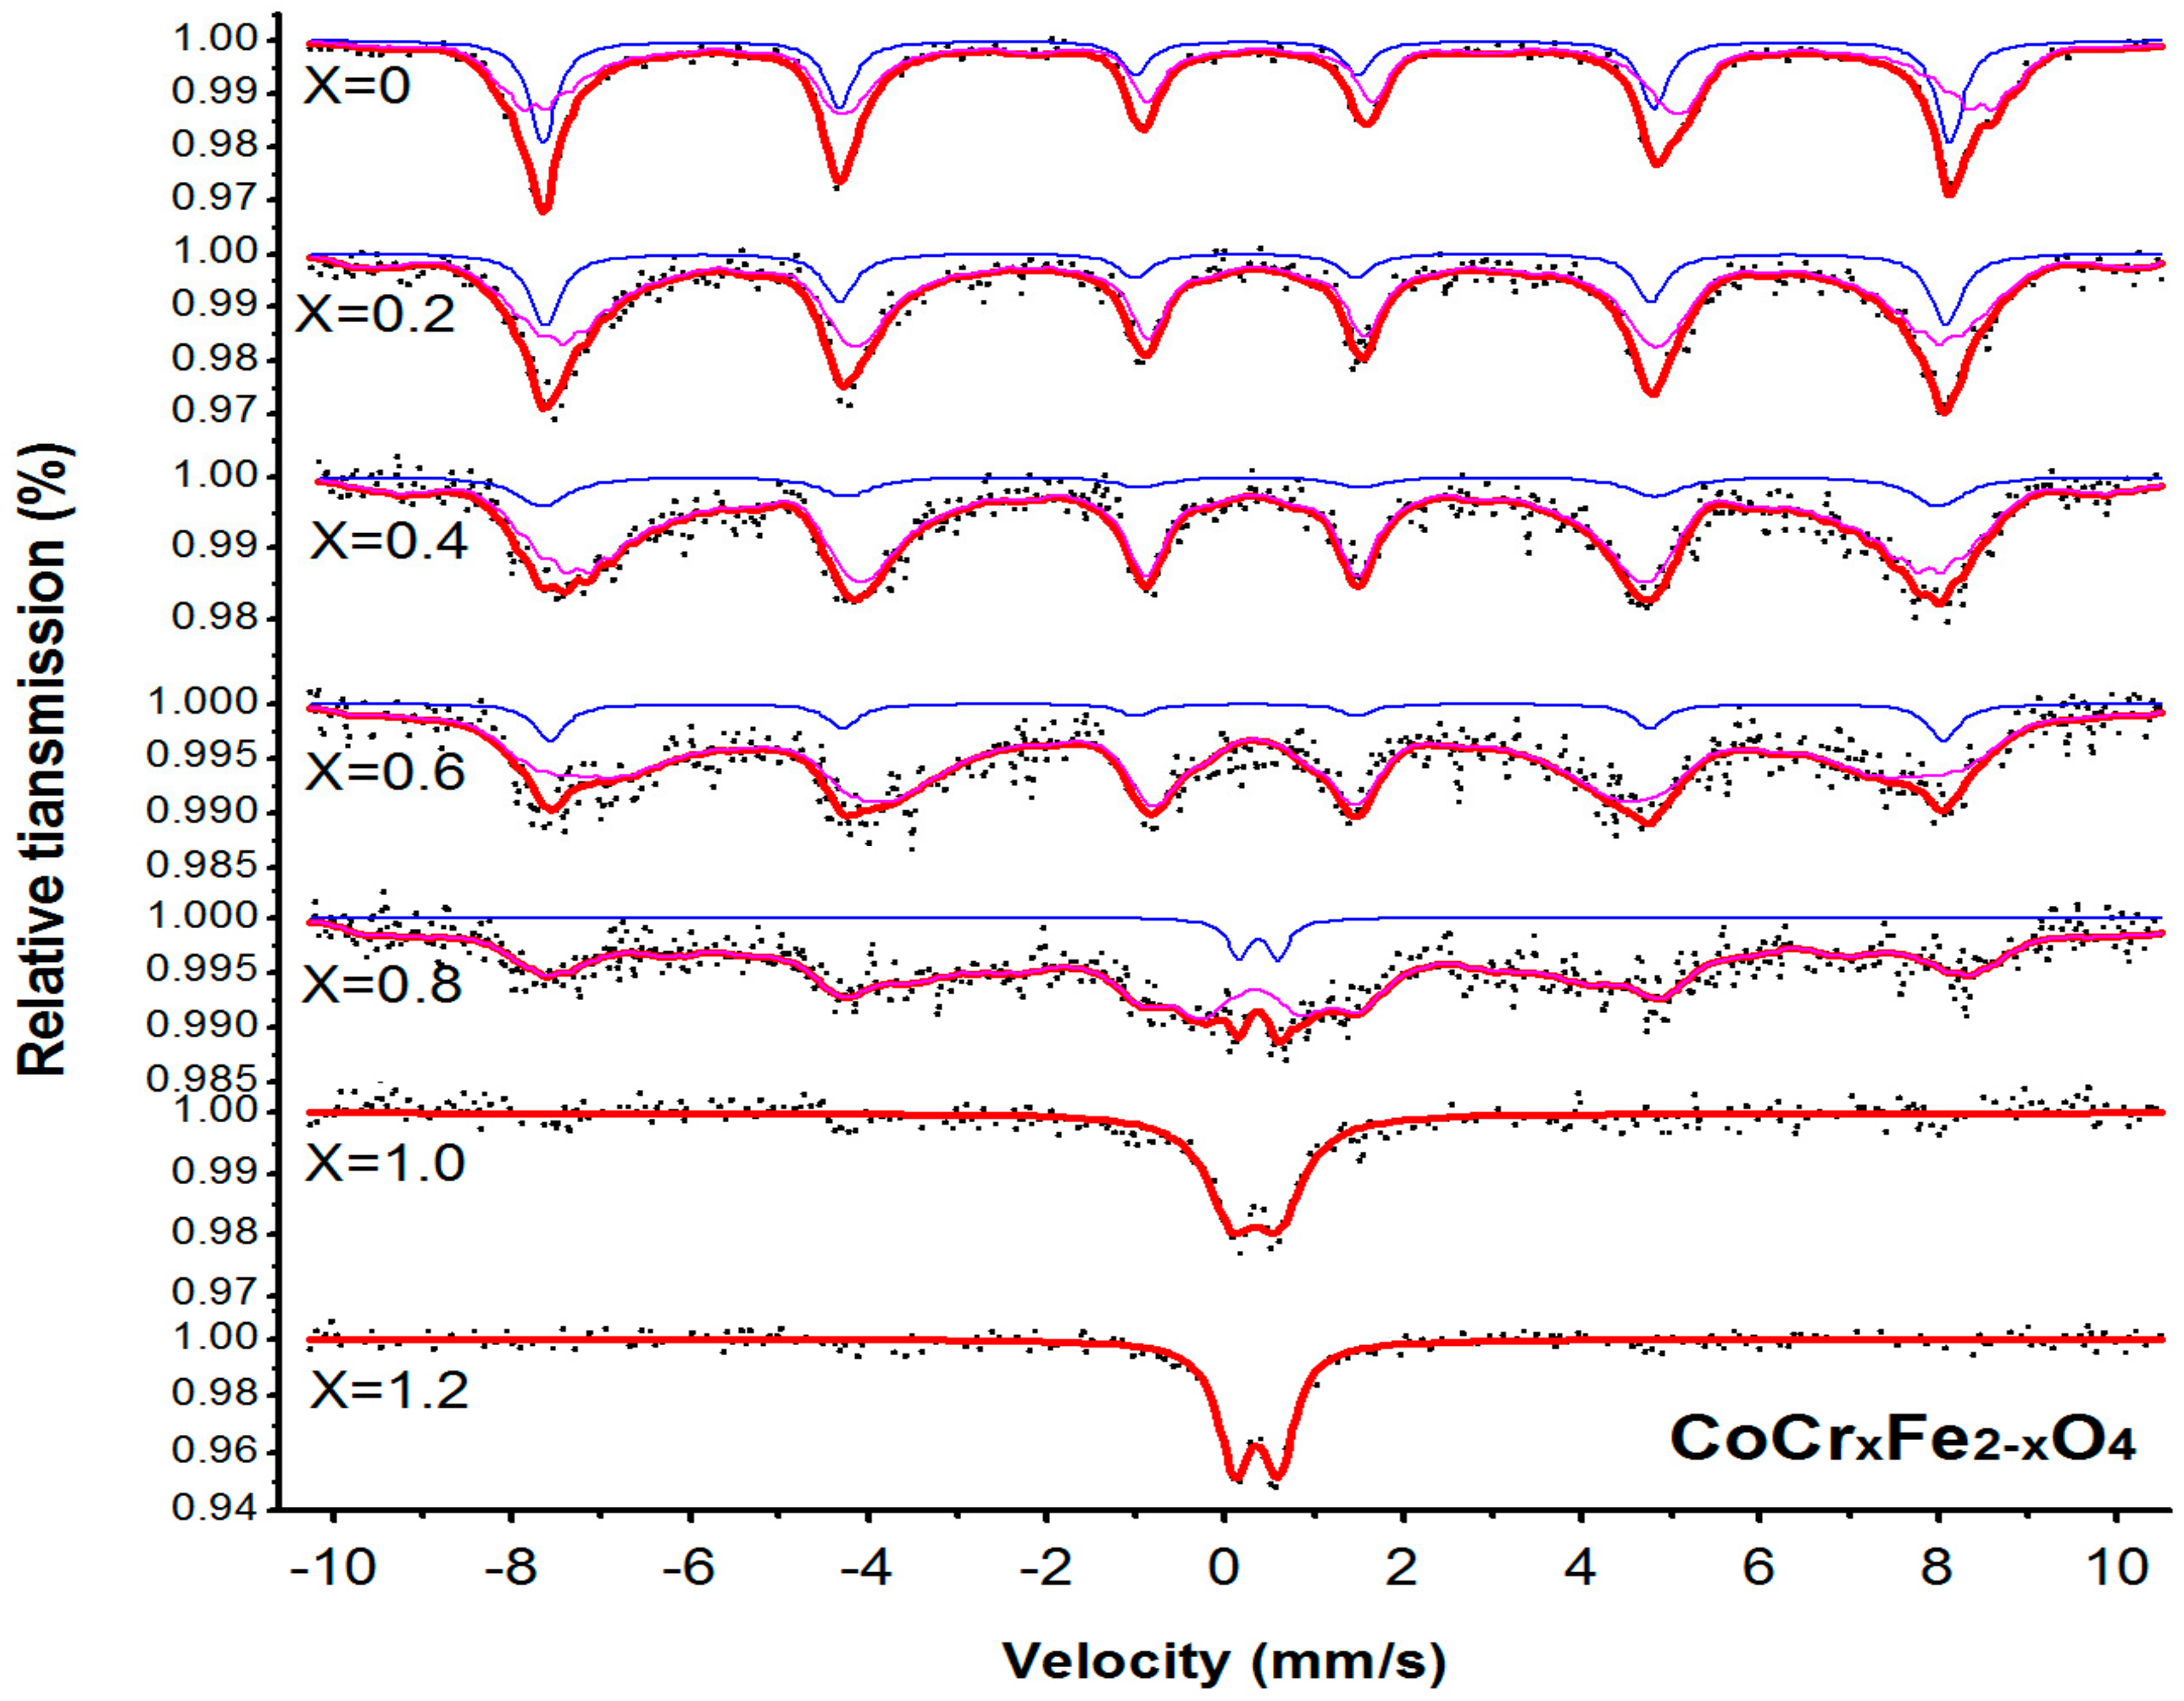
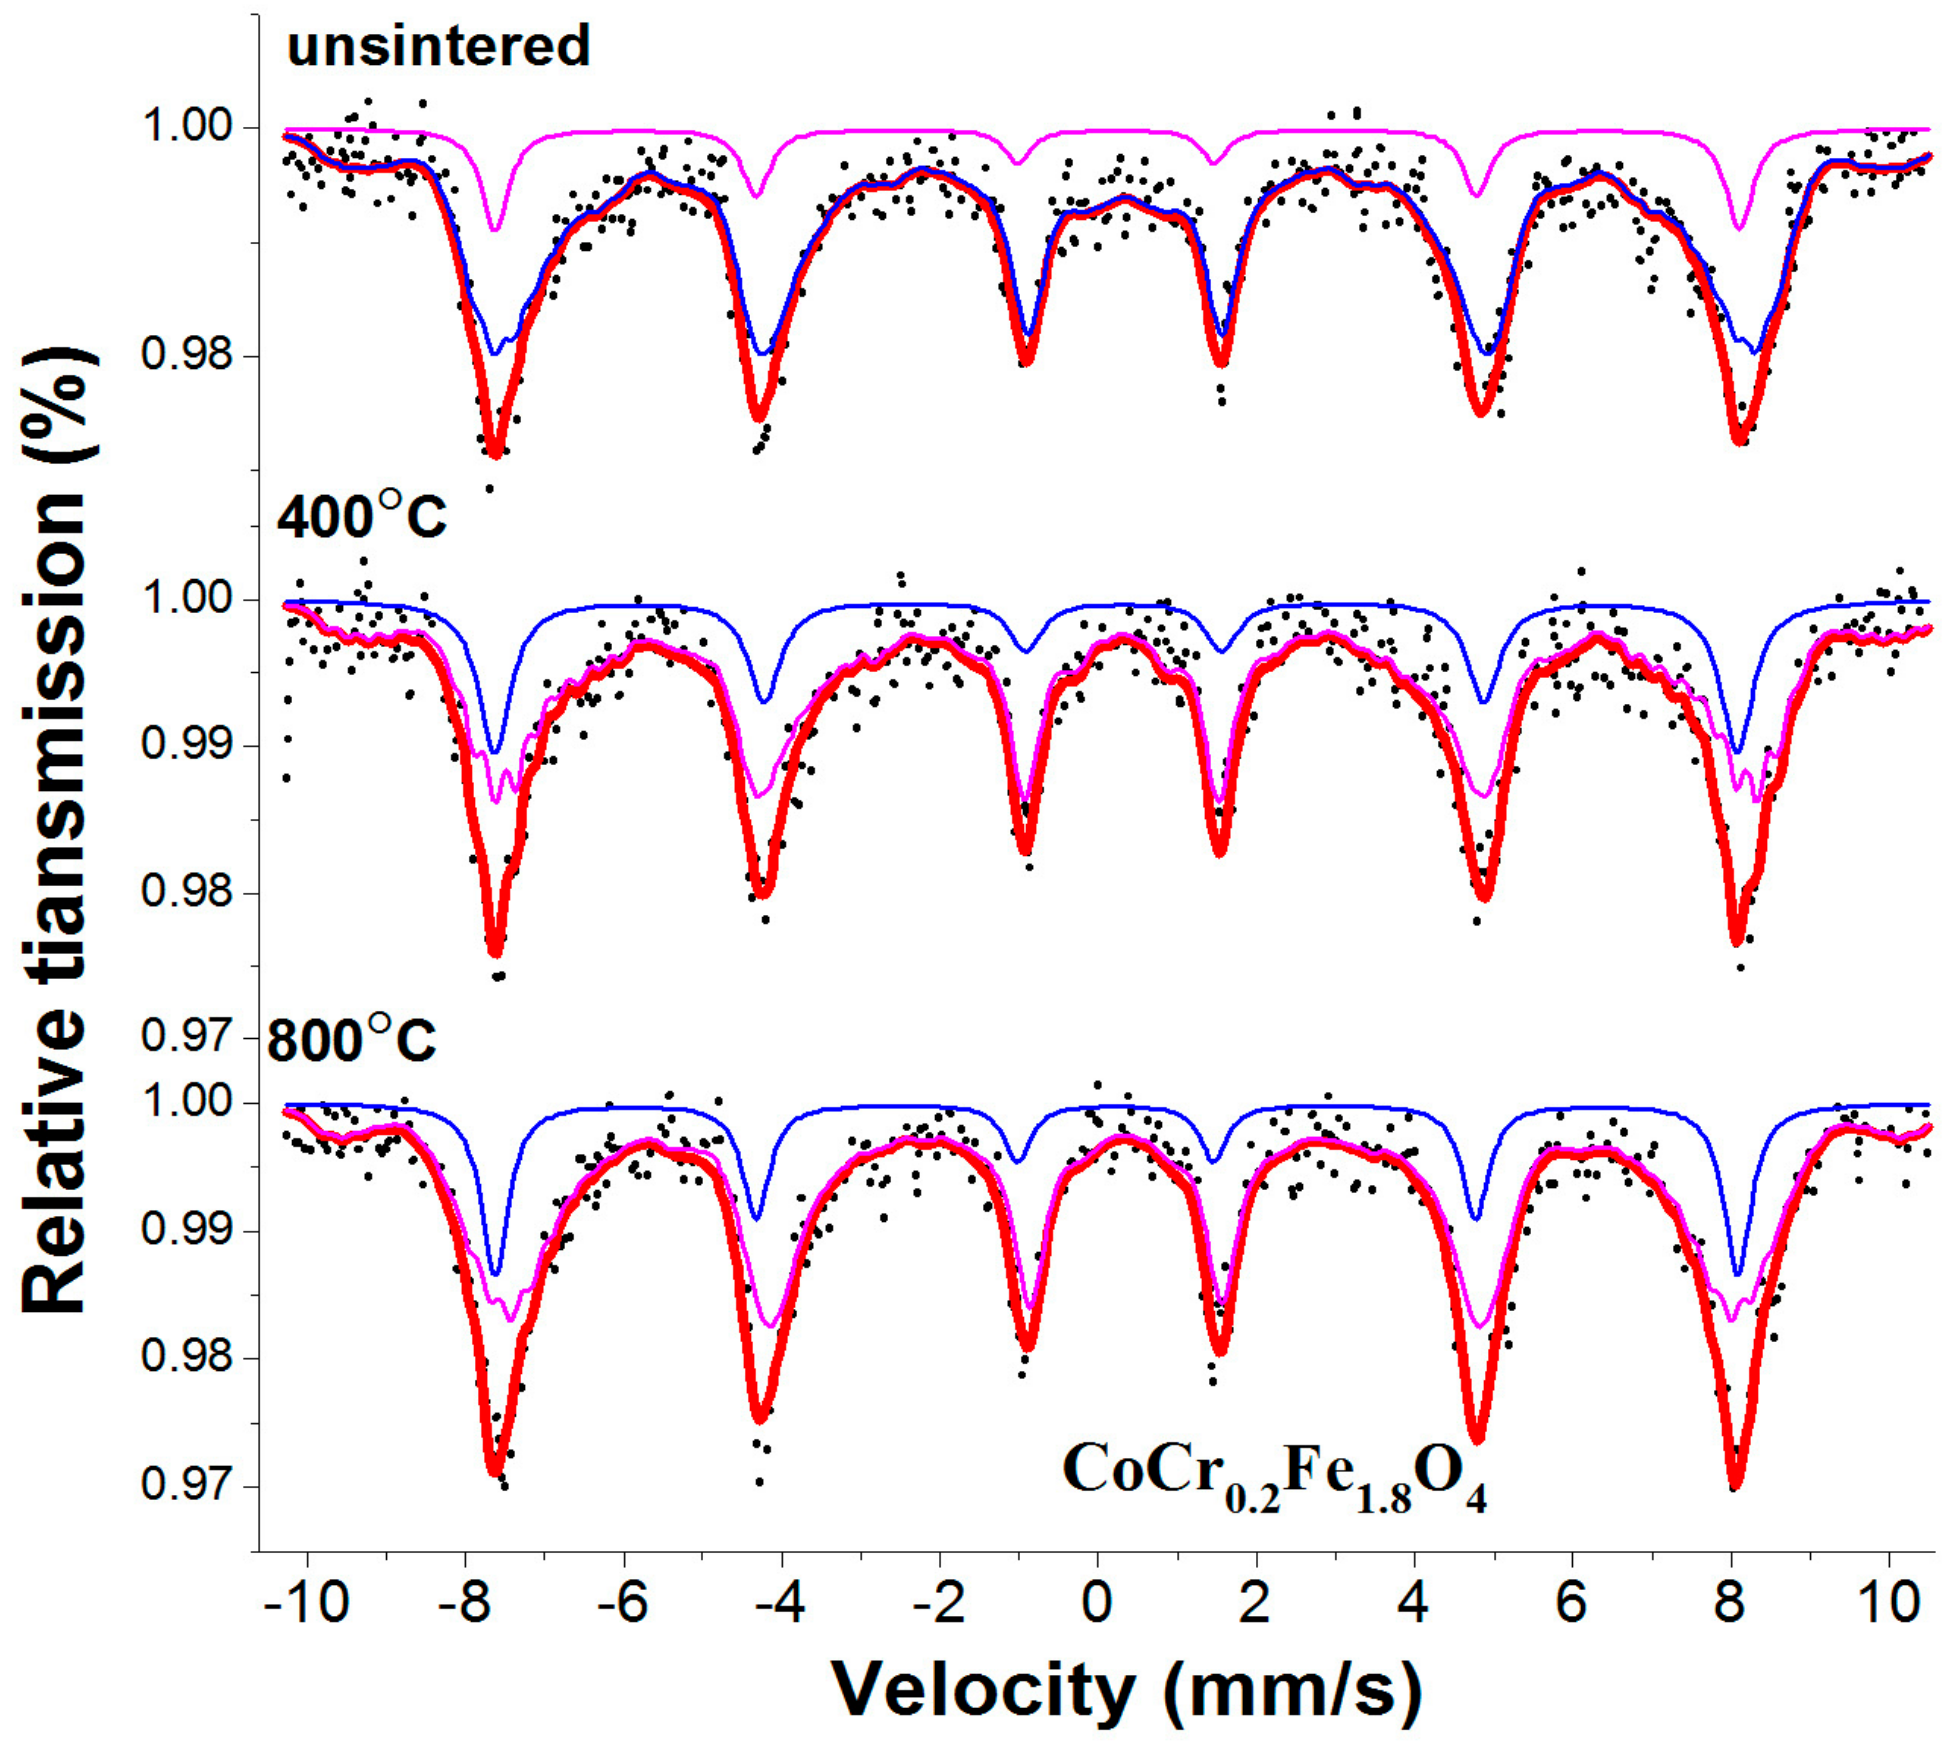
3.3. Mössbauer Spectroscopy
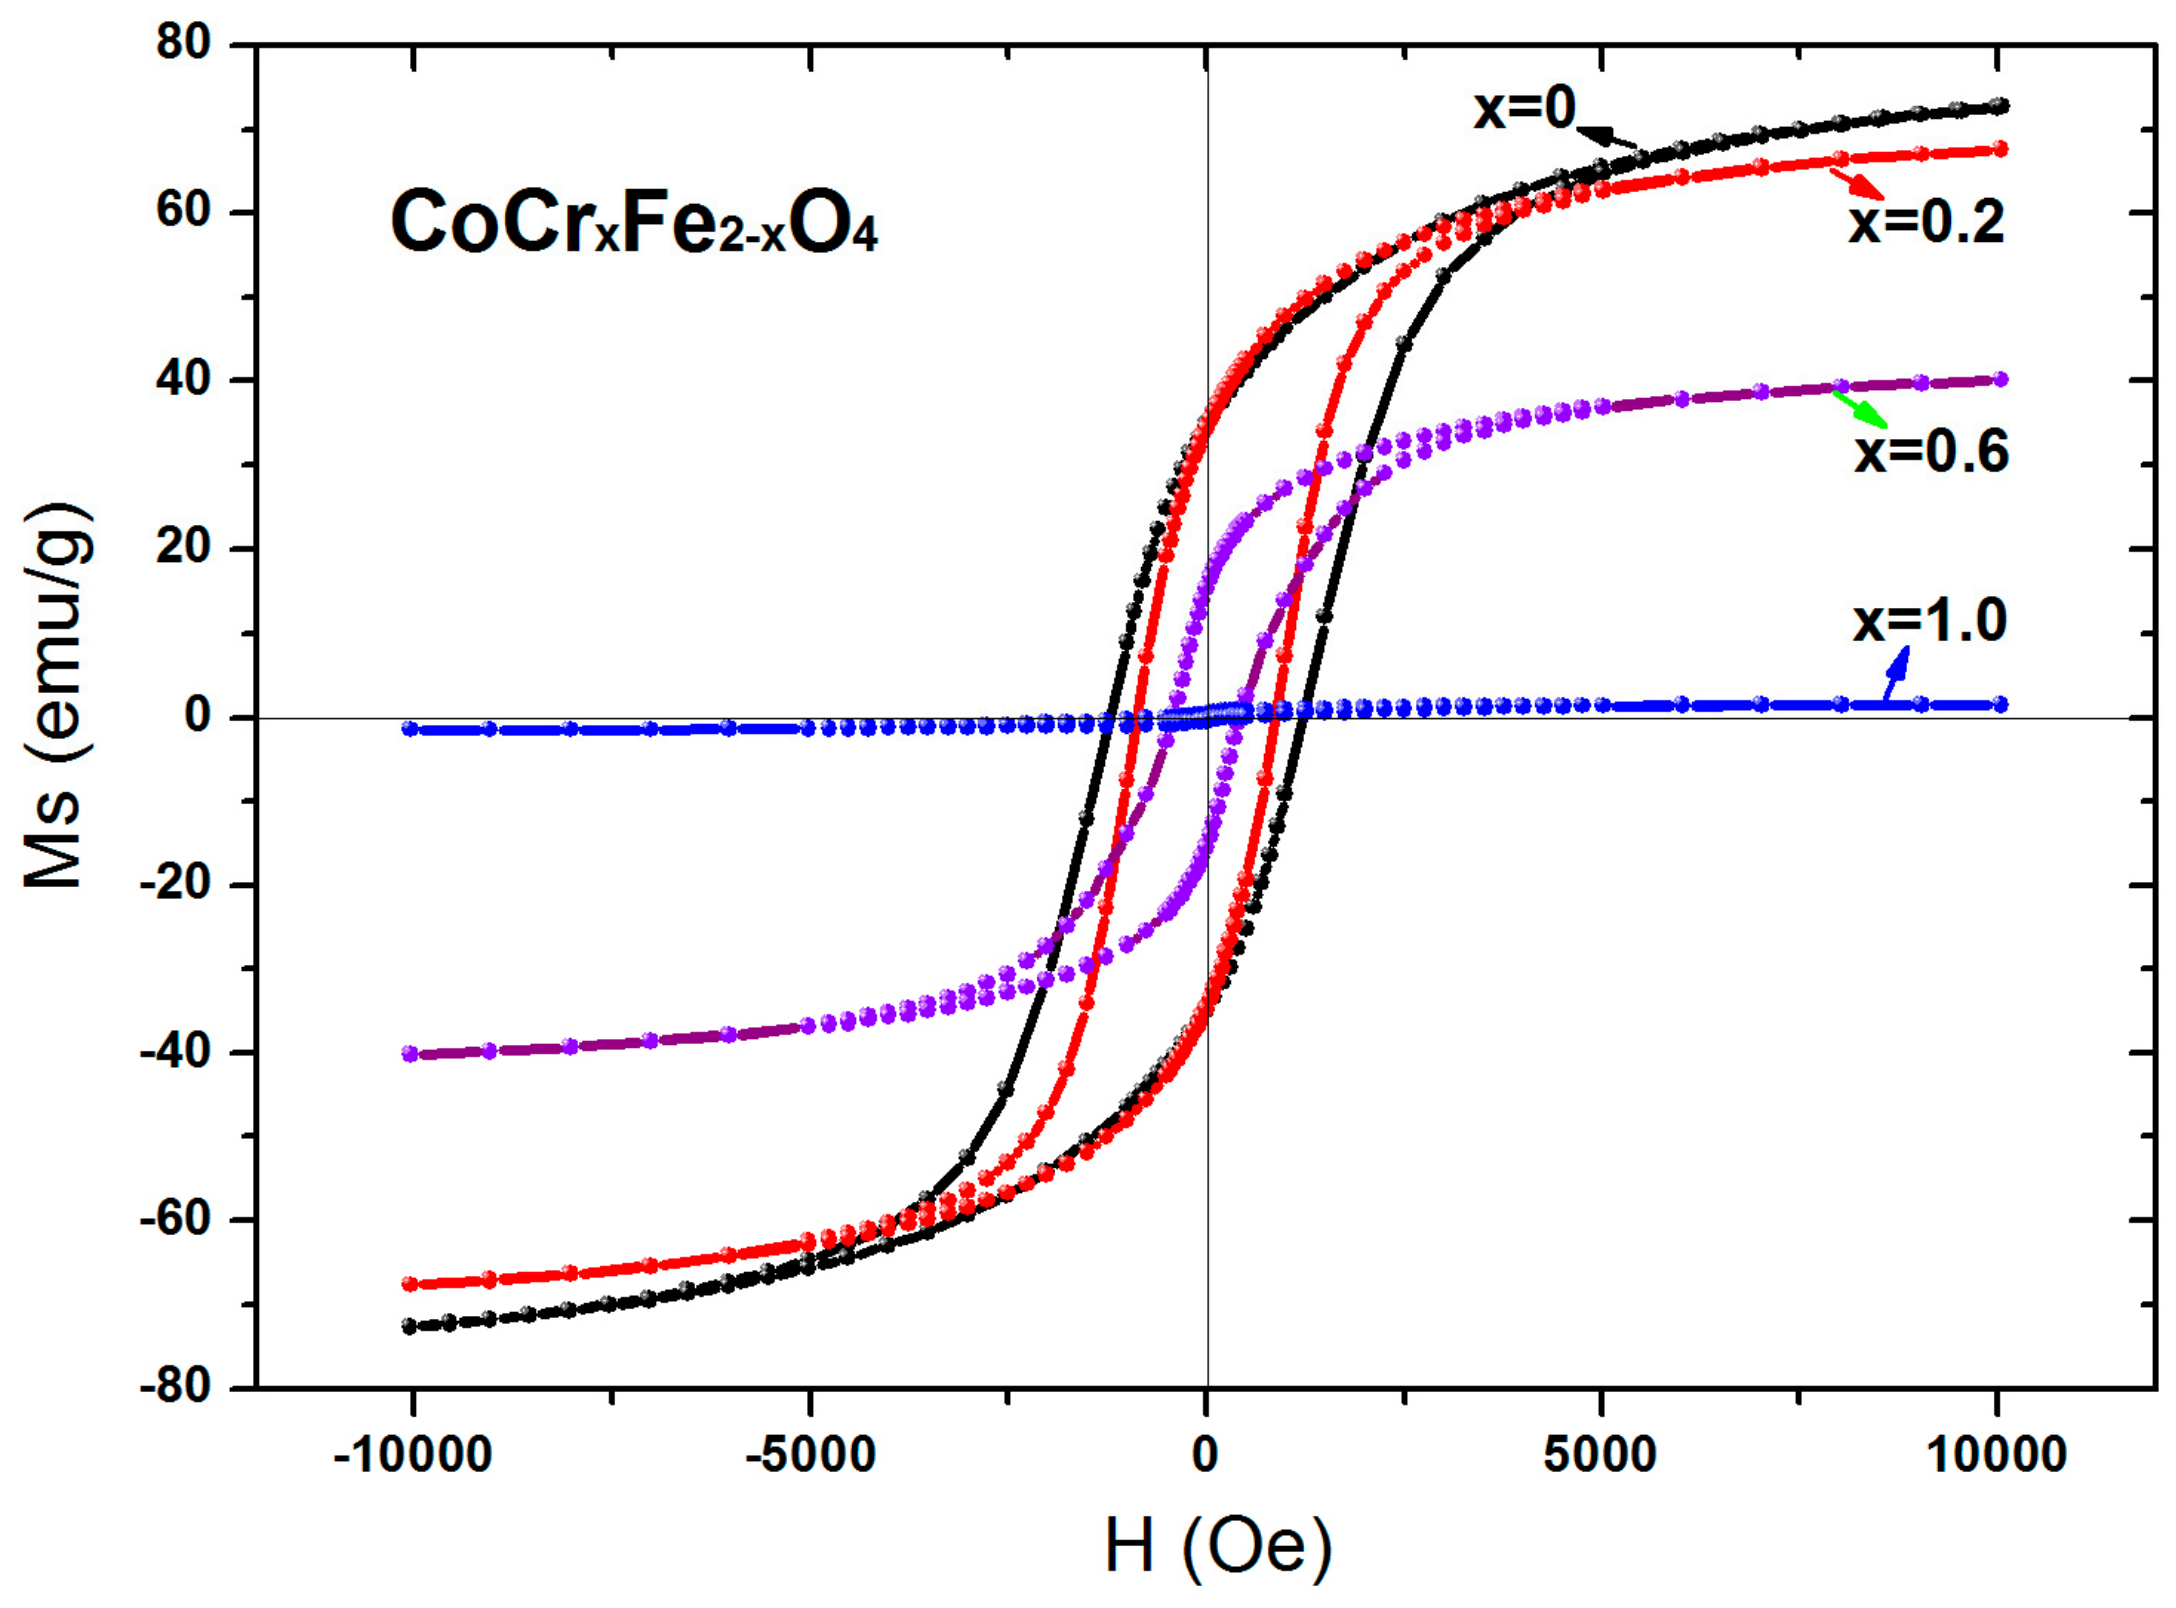
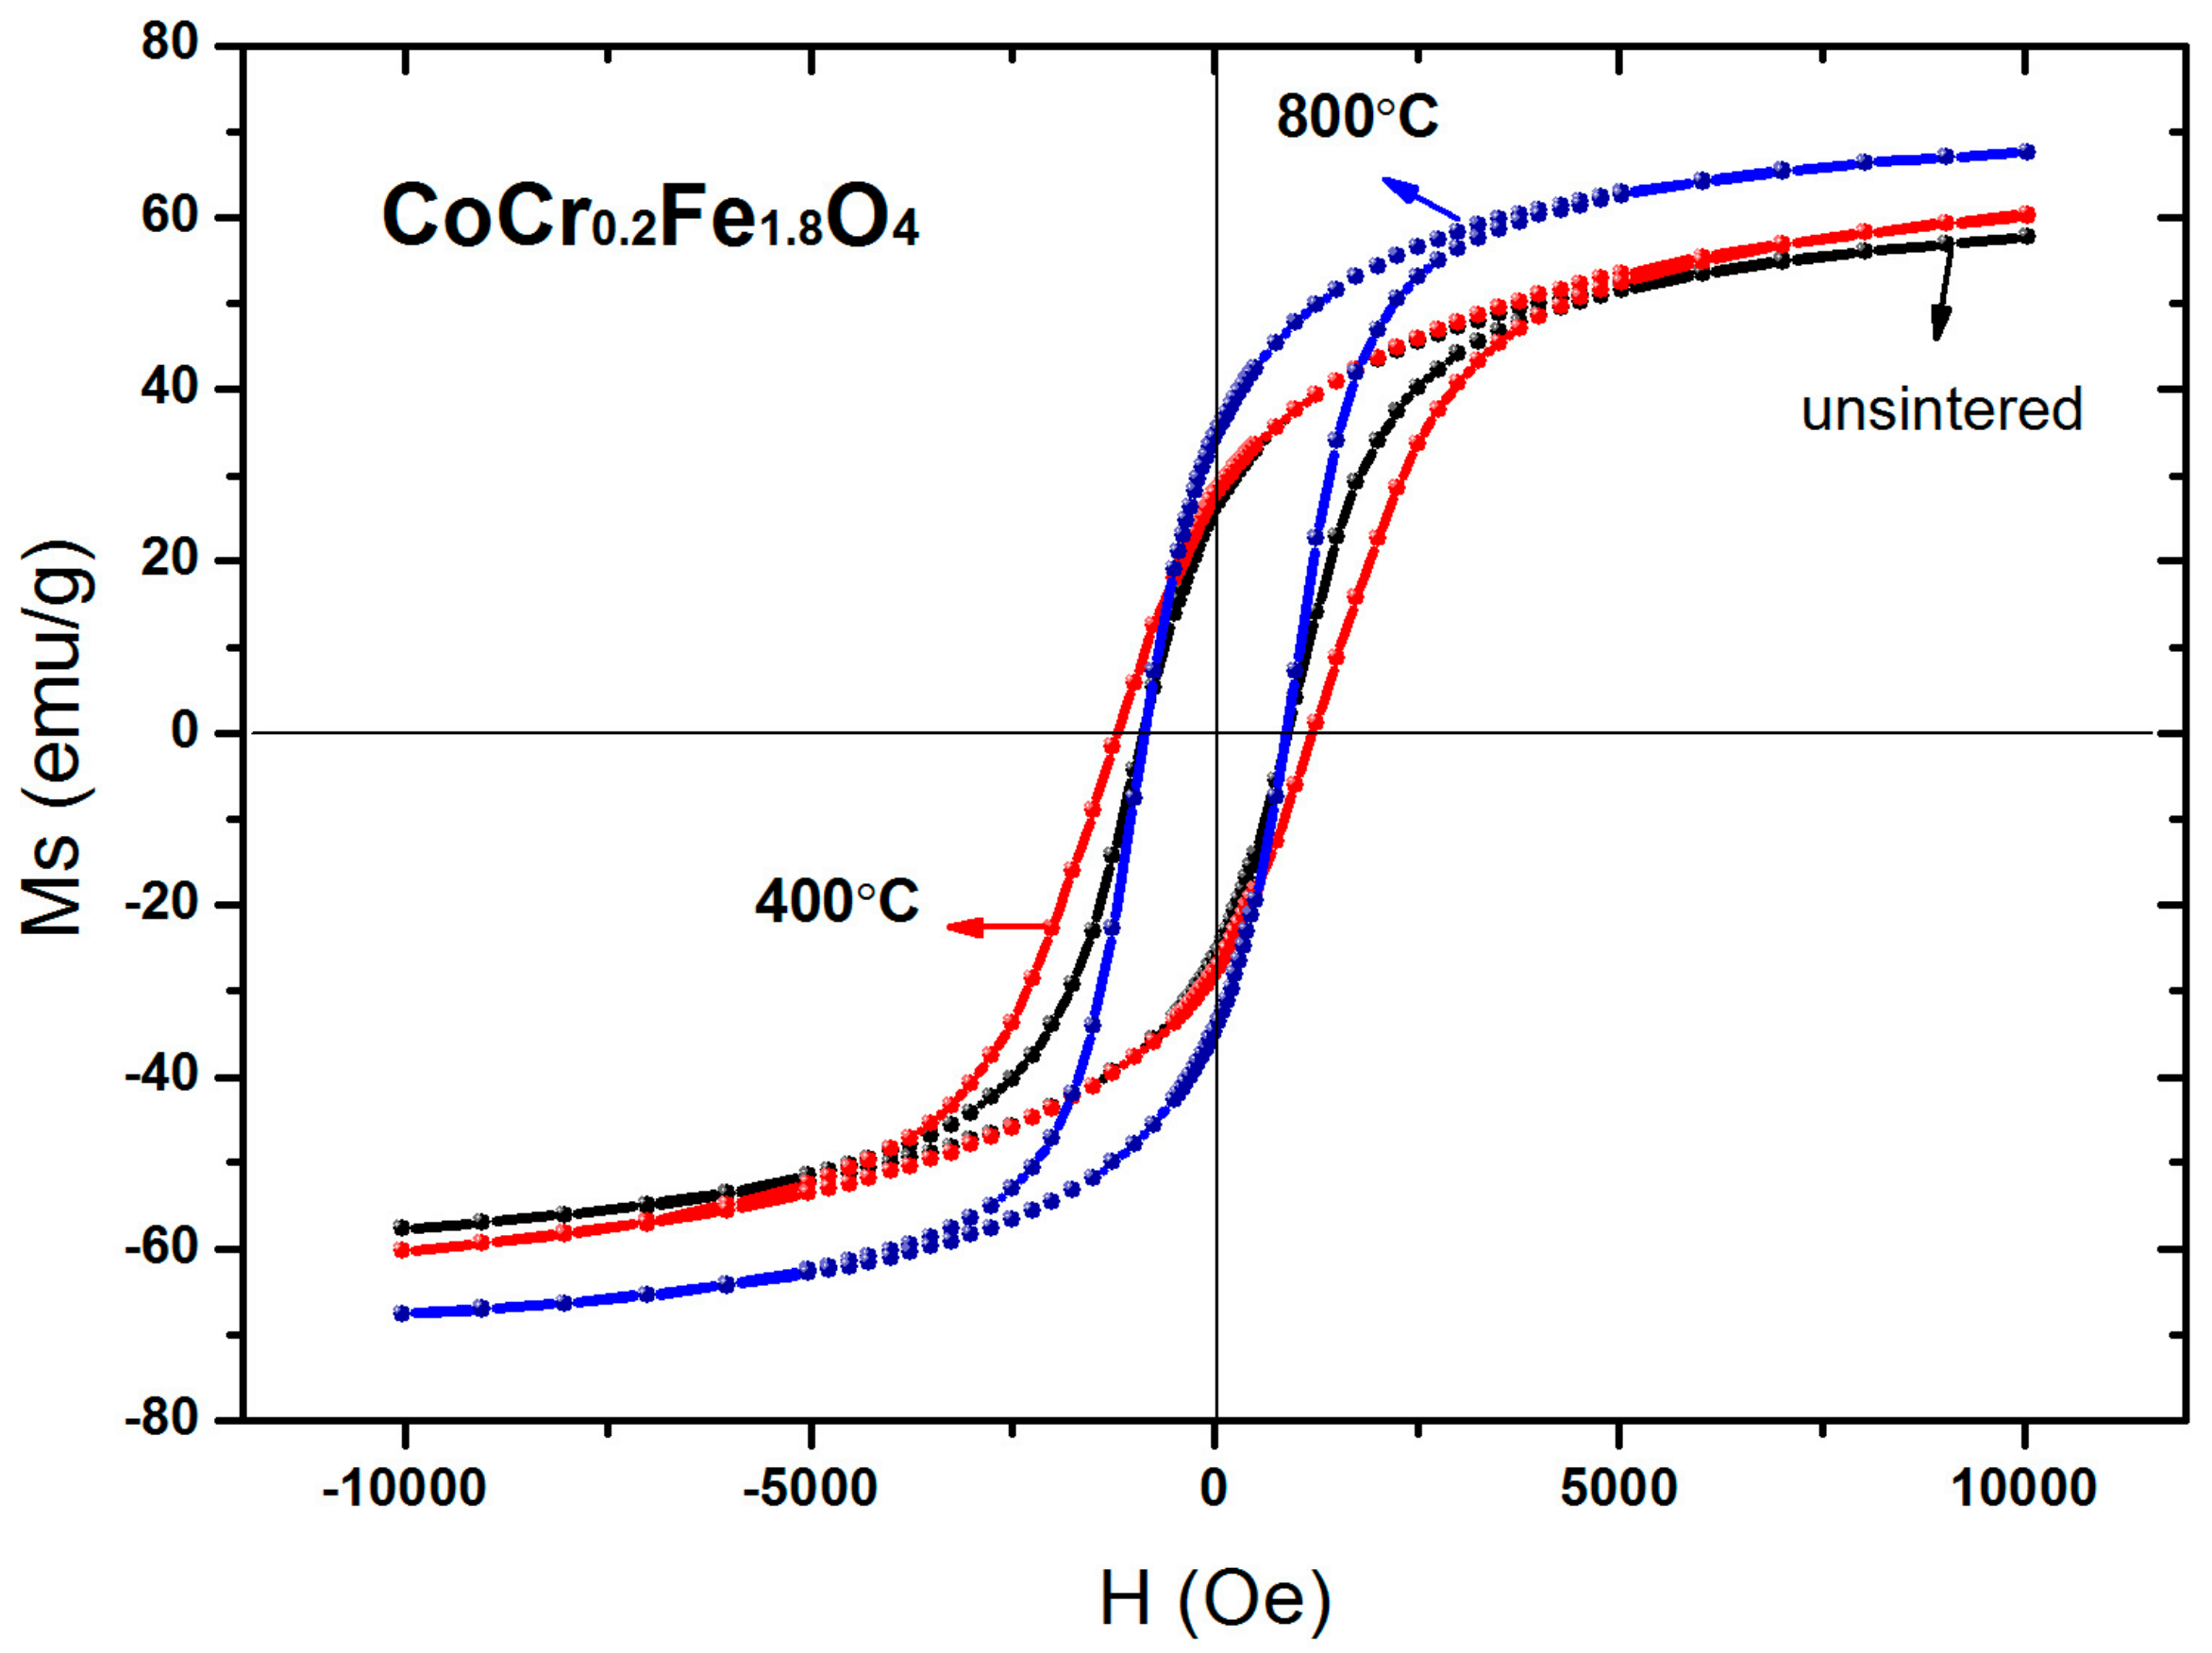
3.4. Magnetic Analysis
4. Conclusions
Author Contributions
Funding
Conflicts of Interest
References
- Mohamed, R.M.; Rashada, M.M.; Haraz, F.A.; Sigmund, W. Structure and magnetic properties of nanocrystalline cobalt ferrite powders synthesized using organic acid precursor method. J. Magn. Magn. Mater. 2010, 322, 2058–2064. [Google Scholar] [CrossRef]
- Amiri, S.; Shokrollahi, H. The role of cobalt ferrite magnetic nanoparticles in medical science. Mater. Sci. Eng. C 2013, 33, 1–8. [Google Scholar] [CrossRef] [PubMed]
- Sanpo, N.; Berndt, C.C.; Wen, C.; Wang, J. Transition metal-substituted cobalt ferrite nanoparticles for biomedical applications. Acta Biomater. 2013, 9, 5830–5837. [Google Scholar] [CrossRef] [PubMed]
- Chia, C.H.; Zakaria, S.; Yusoffa, M.; Goh, S.C.; Haw, C.Y.; Ahmadi, S.; Huang, N.M.; Lim, H.N. Size and crystallinity-dependent magnetic properties of CoFe2O4 nanocrystals. Ceram. Int. 2010, 36, 605–609. [Google Scholar] [CrossRef]
- Toksha, B.G.; Shirsath, S.E.; Mane, M.L.; Patange, S.M.; Jadhav, S.S.; Jadhav, K.M. Autocombustion High-Temperature Synthesis, Structural, and Magnetic Properties of CoCrxFe2−xO4 (0 ≤ x ≤ 1.0). J. Phys. Chem. C 2011, 115, 20905–20912. [Google Scholar] [CrossRef]
- Chae, K.P.; Lee, Y.B.; Lee, J.G.; Lee, S.H. Crystallographic and magnetic properties of CoCrxFe2−xO4 ferrite powders. J. Magn. Magn. Mater. 2000, 220, 59–64. [Google Scholar] [CrossRef]
- Bayoumi, W. Structural and electrical properties of zinc-substituted cobalt ferrite. J. Mater. Sci. 2007, 42, 8254–8261. [Google Scholar] [CrossRef]
- Lee, S.W.; Ryu, Y.G.; Yang, K.J. Magnetic properties of Zn2+ substituted ultrafine Co-ferrite grown by a sol-gel method. J. Appl. Phys. 2002, 91, 7610–7612. [Google Scholar] [CrossRef]
- Iqbal, M.J.; Siddiquah, M.R. Electrical and magnetic properties of chromium-substituted cobalt ferrite nanomaterials. J. Alloys Compd. 2008, 453, 513–518. [Google Scholar] [CrossRef]
- Köseoğlu, Y.; Oleiwi, M.I.O.; Yilgin, R.; Kocbay, A.N. Effect of chromium addition on the structural, morpholog ical and magnetic properties of nano-crystalline cobalt ferrite system. Ceram. Int. 2012, 38, 6671–6676. [Google Scholar] [CrossRef]
- Han, M.; Vestal, C.R.; Zhang, Z.J. Quantum Couplings and Magnetic Properties of CoCrxFe2−xO4 (0 < x < 1) Spinel Ferrite Nanoparticles Synthesized with Reverse Micelle Method. J. Phys. Chem. B 2004, 108, 583–587. [Google Scholar]
- Rizal, C.; Kolthammer, J.; Pokharel, R.K.; Choi, B.C. Magnetic properties of nanostructured Fe-Co alloys. J. Appl. Phys. 2013, 113, 113905. [Google Scholar] [CrossRef]
- Singhal, S.; Jauhar, S.; Singh, J.; Chandra, K.; Bansal, S. Investigation of structural, magnetic, electrical and optical properties of chromium substituted cobalt ferrites (CoCrxFe2−xO4, 0 ≤ x ≤ 1) synthesized using sol gel auto combustion method. J. Mol. Struct. 2012, 1012, 182–188. [Google Scholar] [CrossRef]
- Bayoumy, W.A.; Gabal, M.A. Synthesis characterization and magnetic properties of Cr-substituted NiCuZn nanocrystalline ferrite. J. Alloys Compd. 2010, 506, 205–209. [Google Scholar] [CrossRef]
- Lin, Q.; Xu, J.; Yang, F.; Lin, J.; Yang, H.; He, Y. Magnetic and Mössbauer Spectroscopy Studies of Zinc-Substituted Cobalt Ferrites Prepared by the Sol-Gel Method. Materials 2018, 11, 1799. [Google Scholar] [CrossRef] [PubMed]
- He, Y.; Lei, C.; Lin, Q.; Dong, J.; Yu, Y.; Wang, L. Mössbauer and Structural properties of La-substituted Ni0.4Cu0.2Zn0.4Fe2O4 nanocrystalline ferrite. Sci. Adv. Mater. 2015, 7, 1809–1815. [Google Scholar] [CrossRef]
- Gabal, M.A.; Al Angari, Y.M. Low-temperature synthesis of nanocrystalline NiCuZn ferrite and the effect of Cr substitution on its electrical properties. J. Magn. Magn. Mater. 2010, 322, 3159–3165. [Google Scholar] [CrossRef]
- Lv, H.; Zhang, H.; Zhang, B.; Ji, G.; He, Y.; Lin, Q. A proposed electron transmission mechanism between Fe3+/Co2+ and Fe3+/Fe3+ in the spinel structure and its practical evidence in quaternary Fe0.5Ni0.5Co2S4. J. Mater. Chem. C 2016, 4, 5476–5482. [Google Scholar] [CrossRef]
- GöZüak, F.; köseoğlu, Y.; Baykal, A.; Kavas, H. Synthesis and characterization of Co1−xZnxFe2O4 magnetic nanoparticles via a PEG-assisted route. J. Magn. Magn. Mater. 2009, 321, 2170–2177. [Google Scholar] [CrossRef]
- Singhal, S.; Barthwal, S.K.; Chandra, K. XRD, magnetic and Mössbauer spectral studies of nano size aluminum substituted cobalt ferrites (CoAlxFe2−xO4). J. Magn. Magn. Mater. 2006, 306, 233–240. [Google Scholar] [CrossRef]
- He, Y.; Yang, X.; Lin, J.; Lin, Q.; Dong, J. Mössbauer spectroscopy, Structural and magnetic studies of Zn2+ substituted magnesium ferrite nanomaterials prepared by Sol-Gel method. J. Nanomater. 2015, 2015, 854840. [Google Scholar] [CrossRef]
- Bhukal, S.; Namgyal, T.; Mor, S.; Bansal, S.; Singhal, S. Structural, electrical, optical and magnetic properties of chromium substituted Co-Zn nanoferrites Co0.6Zn0.4CrxFe2−xO4 (0 ≤ x ≤ 1.0) prepared via sol-gel auto-combustion method. J. Mol. Struct. 2012, 1012, 162–167. [Google Scholar] [CrossRef]
- Gabal, M.A.; Al Angari, Y.M.; Al-Agel, F.A. Synthesis, characterization and magnetic properties of Cr-substituted Co-Zn ferrites Nanopowders. J. Mol. Struct. 2013, 1035, 341–347. [Google Scholar] [CrossRef]
- Lin, Q.; Lei, C.; He, Y.; Xu, J.; Wang, R. Mössbauer and XRD studies of Ni0.6Cu0.2Zn0.2CexFe2−xO4 ferrites by Sol-Gel auto-combustion. J. Nanosci. Nanotechnol. 2015, 15, 2997–3003. [Google Scholar] [CrossRef] [PubMed]
- Shabrawy, S.E.I.; Bocker, C.; Tzankov, D.; Georgieva, M.; Harizanova, R.; Rüssel, C. The effect of zinc substitution on the magnetism of magnesium ferrite nanostructures crystallized from borate glasses. Ceram. Int. 2017, 43, 3804–3810. [Google Scholar] [CrossRef]
- Motavallian, P.; Abasht, B.; Abdollah-Pour, H. Zr doping dependence of structural and magnetic properties of cobalt ferrite synthesized by sol-gel based Pechini method. J. Magn. Magn. Mater. 2018, 451, 577–586. [Google Scholar] [CrossRef]
- Ahmad, S.; Kumar, D.; Syed, I.; Satar, R.; Ansari, S. Structural, Spectroscopic and Magnetic Study of Nanocrystalline Cerium-Substituted Magnesium Ferrites. Arab. J. Sci. Eng. 2016, 42, 1–10. [Google Scholar] [CrossRef]
- Sutka, A.; Mezinskis, G. Sol-gel auto-combustion synthesis of spinel-type ferrite nanomaterials. Front. Mater. Sci. 2012, 6, 128–141. [Google Scholar] [CrossRef]
- Ahmad, N.; Alam, M.; Ansari, A.A.; Alrayes, B.F.; Ahmed, M.; Alotaibi, M.A. Nickel Ferrite Nanomaterials: Synthesis, Characterization and Properties. Nanosci. Nanotechnol. Lett. 2017, 9, 1688–1695. [Google Scholar] [CrossRef]
- Borhan, A.I.; Slatineanu, T.; Iordan, A.R.; Palamaru, M.N. Influence of chromium ion substitution on the structure and properties of zinc ferrite synthesized by the sol-gel auto-combustion method. Polyhedron 2013, 56, 82–89. [Google Scholar] [CrossRef]
- Kumar, A.; Shen, J.; Yang, W.; Zhao, H.; Sharma, P.; Varshney, D.; Li, Q. Impact of Rare Earth Gd3+ Ions on Structural and Magnetic Properties of Ni0.5Zn0.5Fe2−xGdxO4 Spinel Ferrite: Useful for Advanced Spintronic Technologies. J. Supercond. Nov. Magn. 2018, 31, 1173–1182. [Google Scholar] [CrossRef]
- Harzali, H.; Marzouki, A.; Saida, F.; Megriche, A.; Mgaidi, A. Structural, magnetic and optical properties of nanosized Ni0.4Cu0.2Zn0.4R0.05Fe1.95O4 (R = Eu3+, Sm3+, Gd3+ and Pr3+) ferrites synthesized by co-precipitation method with ultrasound irradiation. J. Magn. Magn. Mater. 2018, 460, 89–94. [Google Scholar] [CrossRef]
- Ahmad, S.I.; Ansari, S.A.; Kumar, D.R. Structural, morphological, magnetic properties and cation distribution of Ce and Sm co-substituted nano crystalline cobalt ferrite. Mater. Chem. Phys. 2018, 208, 248–257. [Google Scholar] [CrossRef]
- Lin, J.; He, Y.; Du, X.; Lin, Q.; Yang, H.; Shen, H. Structural and Magnetic Studies of Cr3+ Substituted Nickel Ferrite Nanomaterials Prepared by Sol-Gel Auto-Combustion. Crystals 2018, 8, 384. [Google Scholar] [CrossRef]


| Content (x) | Lattice Parameter (Å) | Average Crystallite Size(Å) | Density (g/cm3) |
|---|---|---|---|
| 0 | 8.35497 | 556 | 5.3468 |
| 0.2 | 8.40877 | 436 | 5.2250 |
| 0.4 | 8.40790 | 382 | 5.2094 |
| 0.6 | 8.38461 | 340 | 5.2355 |
| 0.8 | 8.36538 | 284 | 5.2543 |
| 1.0 | 8.36368 | 276 | 5.2400 |
| 1.2 | 8.37912 | 244 | 5.1937 |
| Temperature (°C) | Lattice Parameter (Å) | Average Crystallite Size (Å) | Density (g/cm3) |
|---|---|---|---|
| unsintered | 8.40551 | 280 | 5.2311 |
| 400 | 8.39683 | 313 | 5.2473 |
| 800 | 8.40877 | 436 | 5.2250 |
| Content (x) | Component | I.S. (mm/s) | Q.S. (mm/s) | H (T) | Γ (mm/s) | A0 (mm/s) |
|---|---|---|---|---|---|---|
| 0 | Sextet (A) | 0.237 | −0.004 | 48.946 | 0.360 | 32.4 |
| Sextet (B) | 0.375 | −0.024 | 45.695 | 0.322 | 67.6 | |
| 0.2 | Sextet (A) | 0.223 | 0.007 | 48.724 | 0.409 | 20.1 |
| Sextet (B) | 0.317 | −0.065 | 44.454 | 0.355 | 79.9 | |
| 0.4 | Sextet (A) | 0.222 | −0.112 | 48.581 | 0.662 | 11.8 |
| Sextet (B) | 0.303 | 0.011 | 43.279 | 0.347 | 88.2 | |
| 0.6 | Sextet (A) | 0.235 | 0.010 | 48.473 | 0.408 | 7.6 |
| Sextet (B) | 0.303 | −0.059 | 39.210 | 0.437 | 92.4 | |
| 0.8 | Sextet (B) | 0.327 | 0.074 | 34.844 | 0.418 | 97.0 |
| Double | 0.373 | 0.437 | - | 0.271 | 3.0 | |
| 1.0 | Double | 0.336 | 0.520 | - | 0.663 | 100 |
| 1.2 | Double | 0.351 | 0.491 | - | 0.444 | 100 |
| Temperature (°C) | Component | I.S. (mm/s) | Q.S. (mm/s) | H (T) | Γ (mm/s) | A0 (mm/s) |
|---|---|---|---|---|---|---|
| unsintered | Sextet (A) | 0.234 | 0.009 | 48.790 | 0.412 | 11.8 |
| Sextet (B) | 0.336 | −0.004 | 43.424 | 0.386 | 88.2 | |
| 400 | Sextet (A) | 0.273 | −0.104 | 48.716 | 0.491 | 21.8 |
| Sextet (B) | 0.325 | 0.051 | 43.557 | 0.283 | 78.2 | |
| 800 | Sextet (A) | 0.223 | 0.007 | 48.724 | 0.409 | 20.1 |
| Sextet (B) | 0.317 | −0.065 | 44.454 | 0.355 | 79.9 |
| Content (x) | Ms (emu/g) | Hc (Oe) | Mr (emu/g) | nB |
|---|---|---|---|---|
| 0 | 72.58 | 1005.33 | 34.71 | 3.05 |
| 0.2 | 67.66 | 878.10 | 34.39 | 2.83 |
| 0.6 | 40.20 | 401.44 | 15.51 | 1.67 |
| 1.0 | 1.51 | 301.20 | 0.39 | 0.006 |
| Temperature (°C) | Ms (emu/g) | Hc (Oe) | Mr (emu/g) | nB |
|---|---|---|---|---|
| unsintered | 57.74 | 877.06 | 26.20 | 2.42 |
| 400 | 60.35 | 1254.18 | 27.75 | 2.53 |
| 800 | 67.66 | 878.10 | 34.39 | 2.83 |
© 2018 by the authors. Licensee MDPI, Basel, Switzerland. This article is an open access article distributed under the terms and conditions of the Creative Commons Attribution (CC BY) license (http://creativecommons.org/licenses/by/4.0/).
Share and Cite
Lin, J.; Zhang, J.; Sun, H.; Lin, Q.; Guo, Z.; Yang, H.; He, Y. Structural and Magnetic Property of Cr3+ Substituted Cobalt Ferrite Nanomaterials Prepared by the Sol-Gel Method. Materials 2018, 11, 2095. https://doi.org/10.3390/ma11112095
Lin J, Zhang J, Sun H, Lin Q, Guo Z, Yang H, He Y. Structural and Magnetic Property of Cr3+ Substituted Cobalt Ferrite Nanomaterials Prepared by the Sol-Gel Method. Materials. 2018; 11(11):2095. https://doi.org/10.3390/ma11112095
Chicago/Turabian StyleLin, Jinpei, Jiaqi Zhang, Hao Sun, Qing Lin, Zeping Guo, Hu Yang, and Yun He. 2018. "Structural and Magnetic Property of Cr3+ Substituted Cobalt Ferrite Nanomaterials Prepared by the Sol-Gel Method" Materials 11, no. 11: 2095. https://doi.org/10.3390/ma11112095
APA StyleLin, J., Zhang, J., Sun, H., Lin, Q., Guo, Z., Yang, H., & He, Y. (2018). Structural and Magnetic Property of Cr3+ Substituted Cobalt Ferrite Nanomaterials Prepared by the Sol-Gel Method. Materials, 11(11), 2095. https://doi.org/10.3390/ma11112095