Prediction of Defect Formation during Resin Impregnation Process through a Multi-Layered Fiber Preform in Resin Transfer Molding by a Proposed Analytical Model


Abstract
:1. Introduction
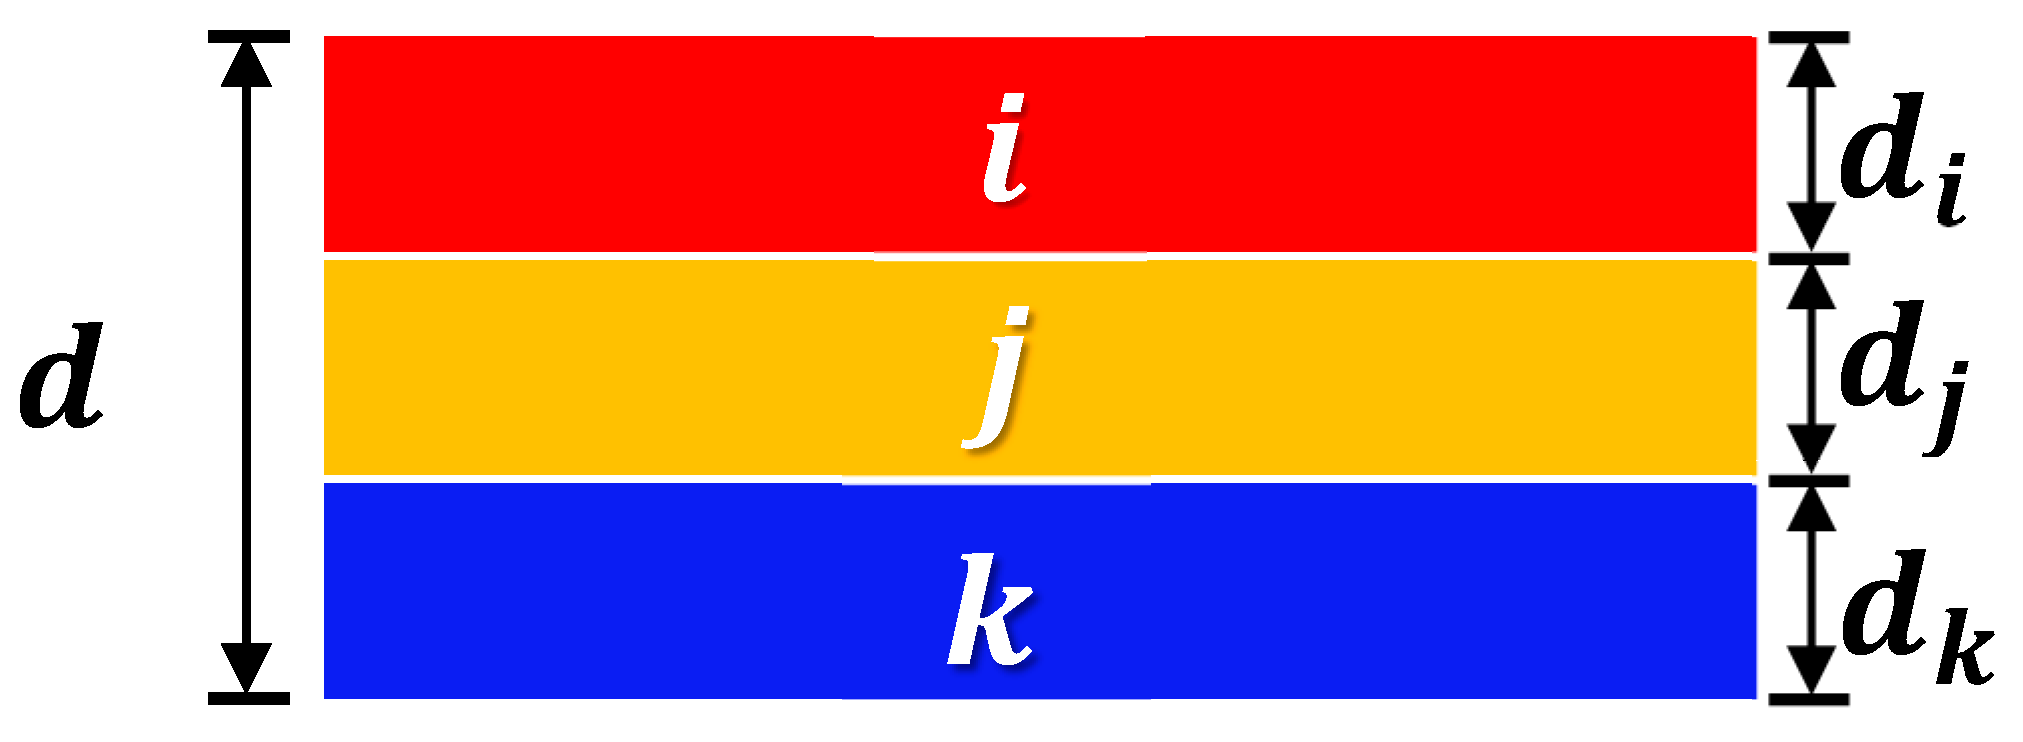
2. Materials and Methods
3. Experiments
4. Results
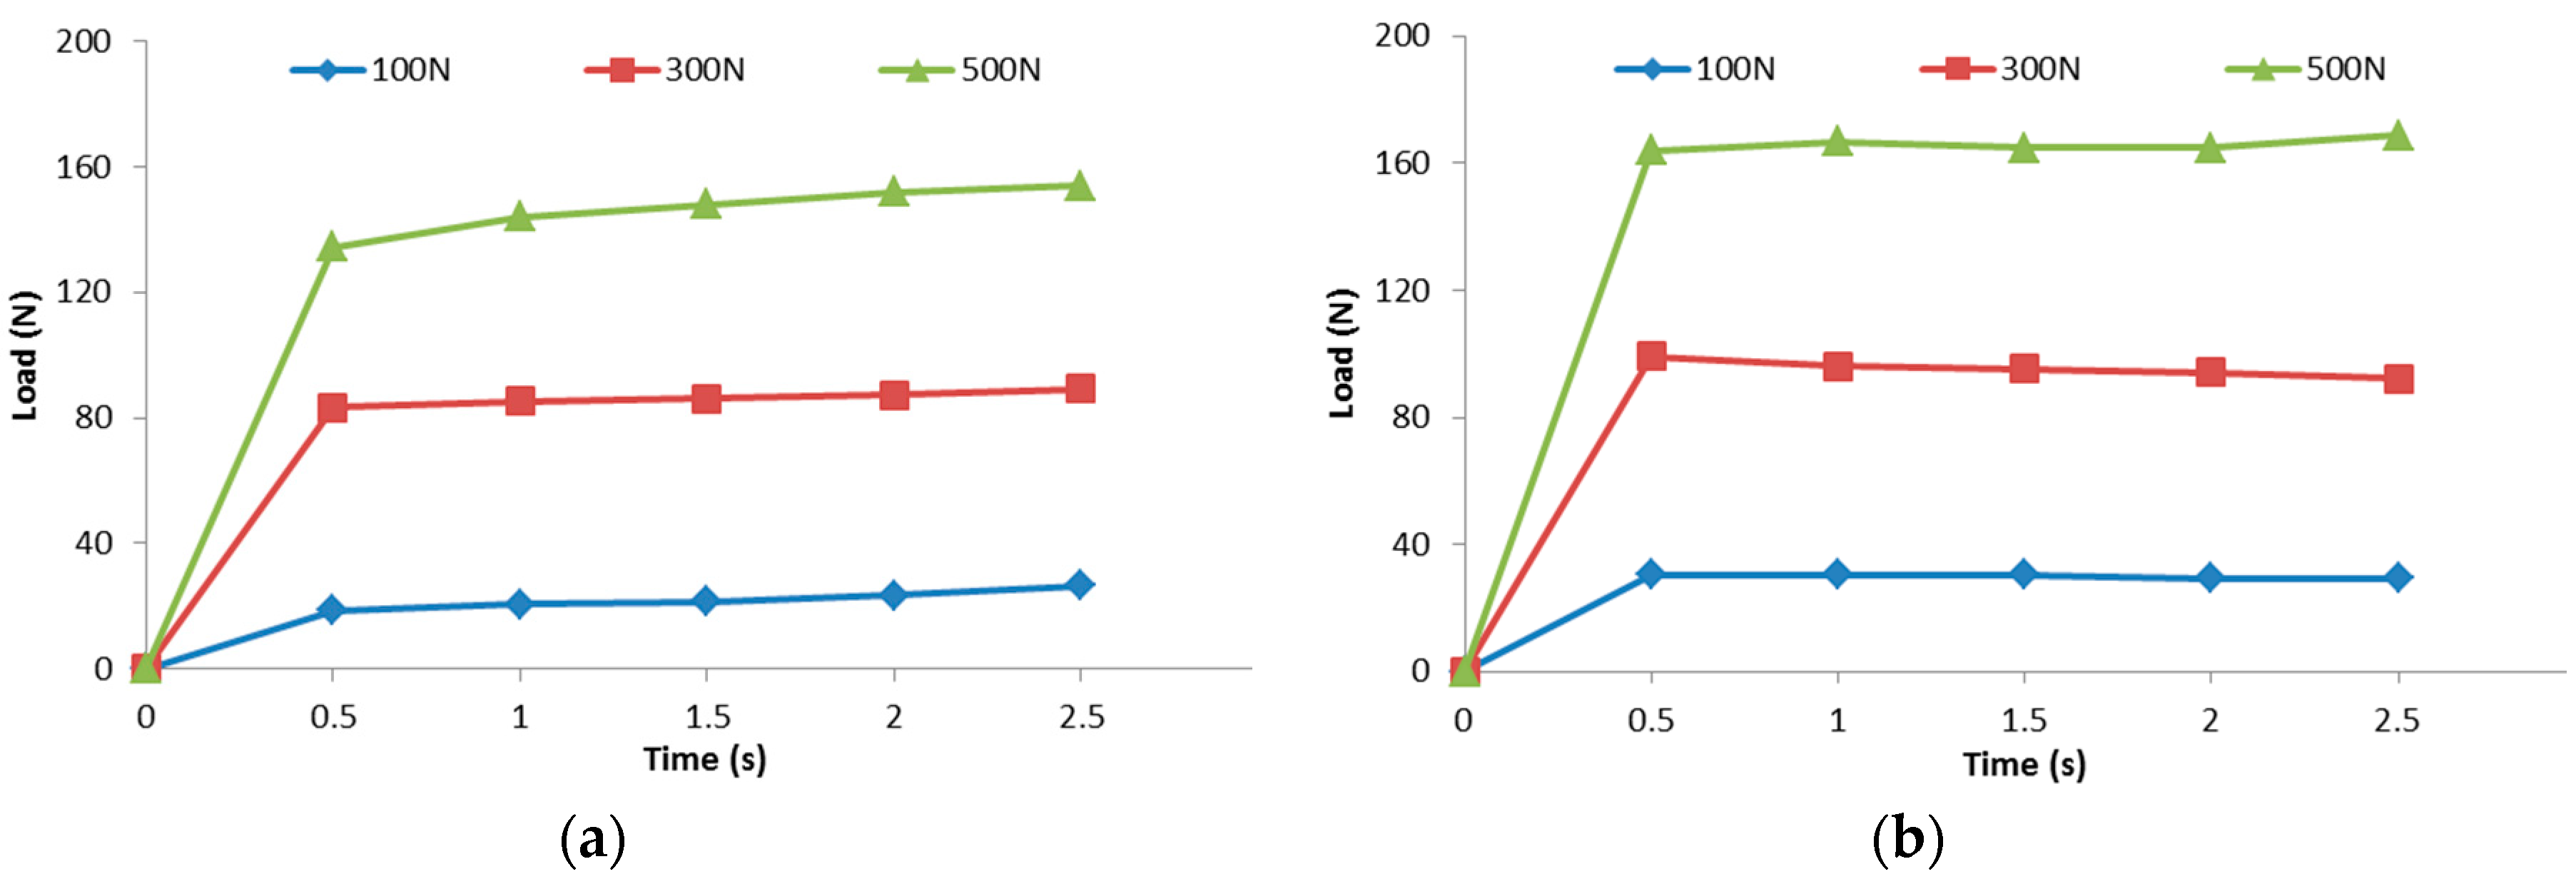
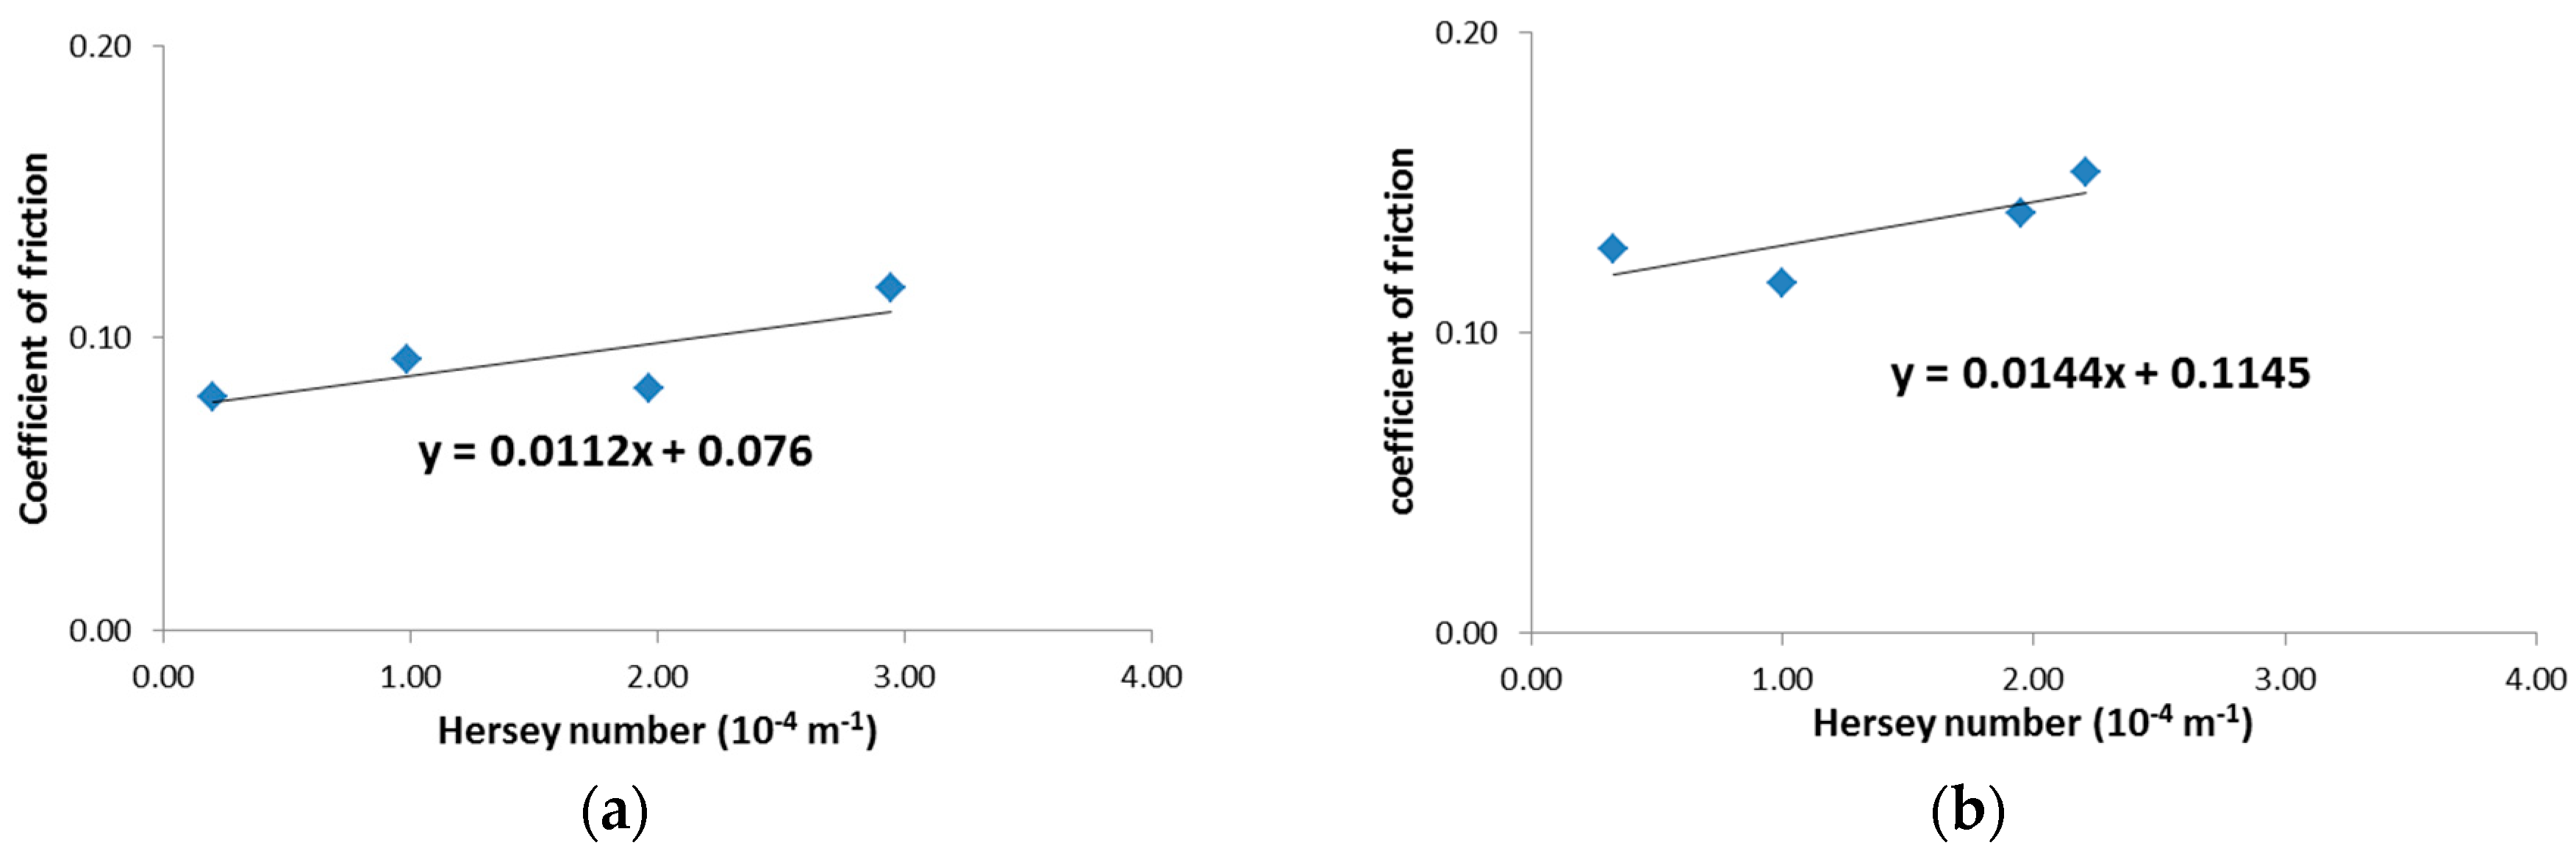
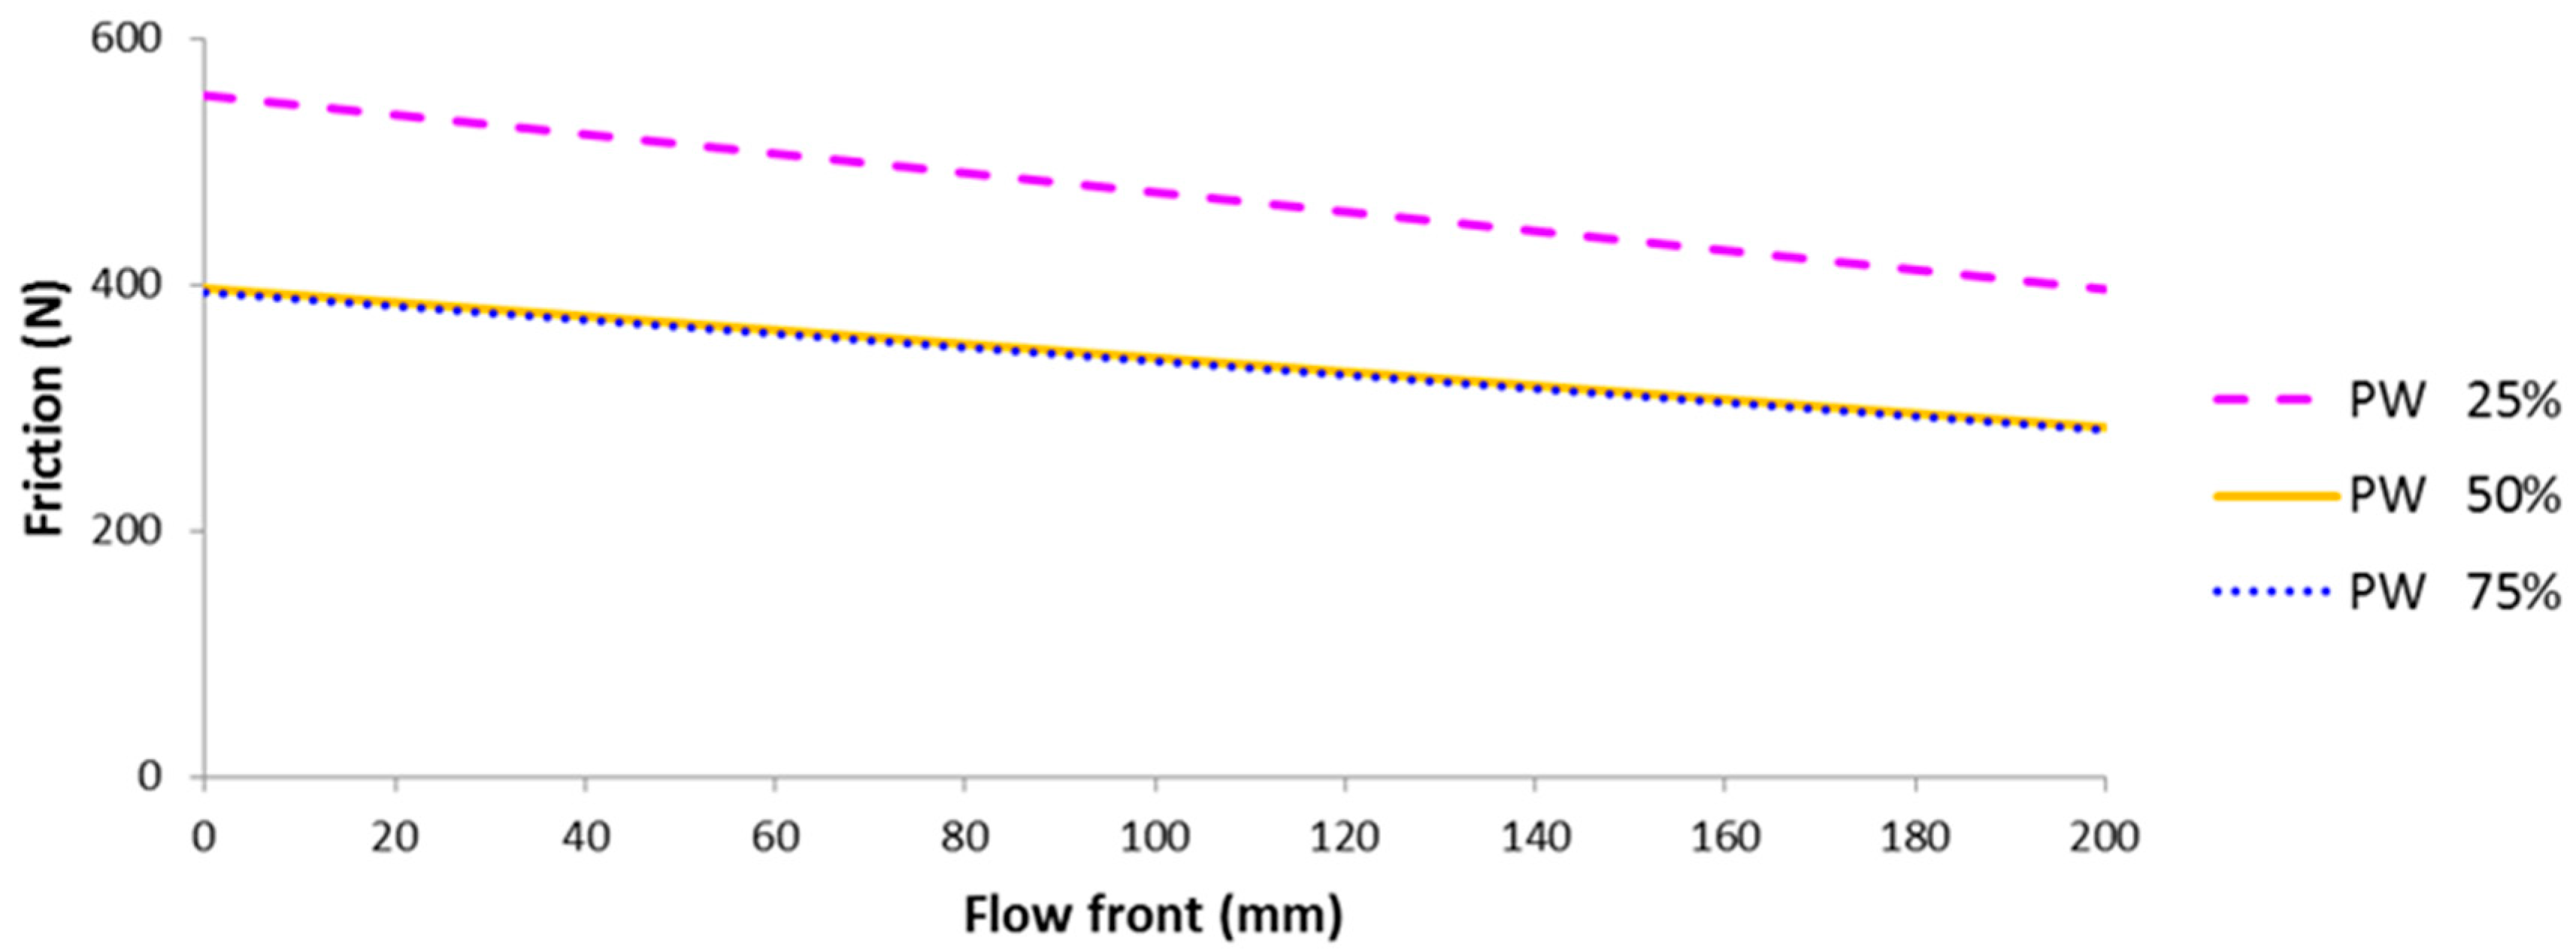
4.1. Friction Force
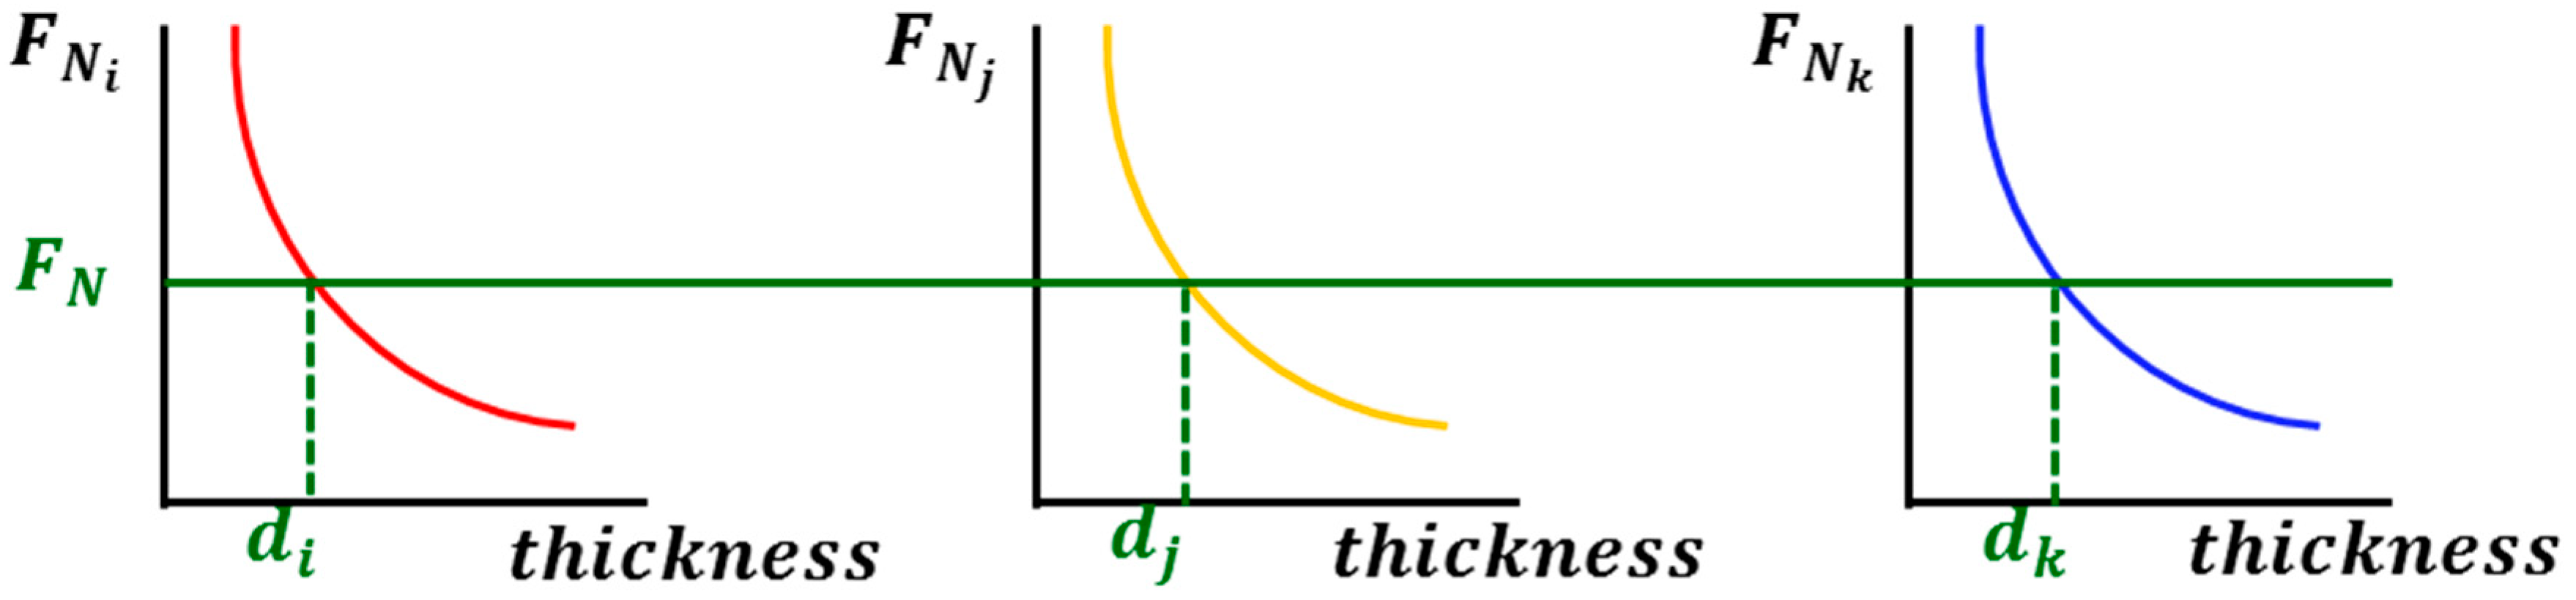
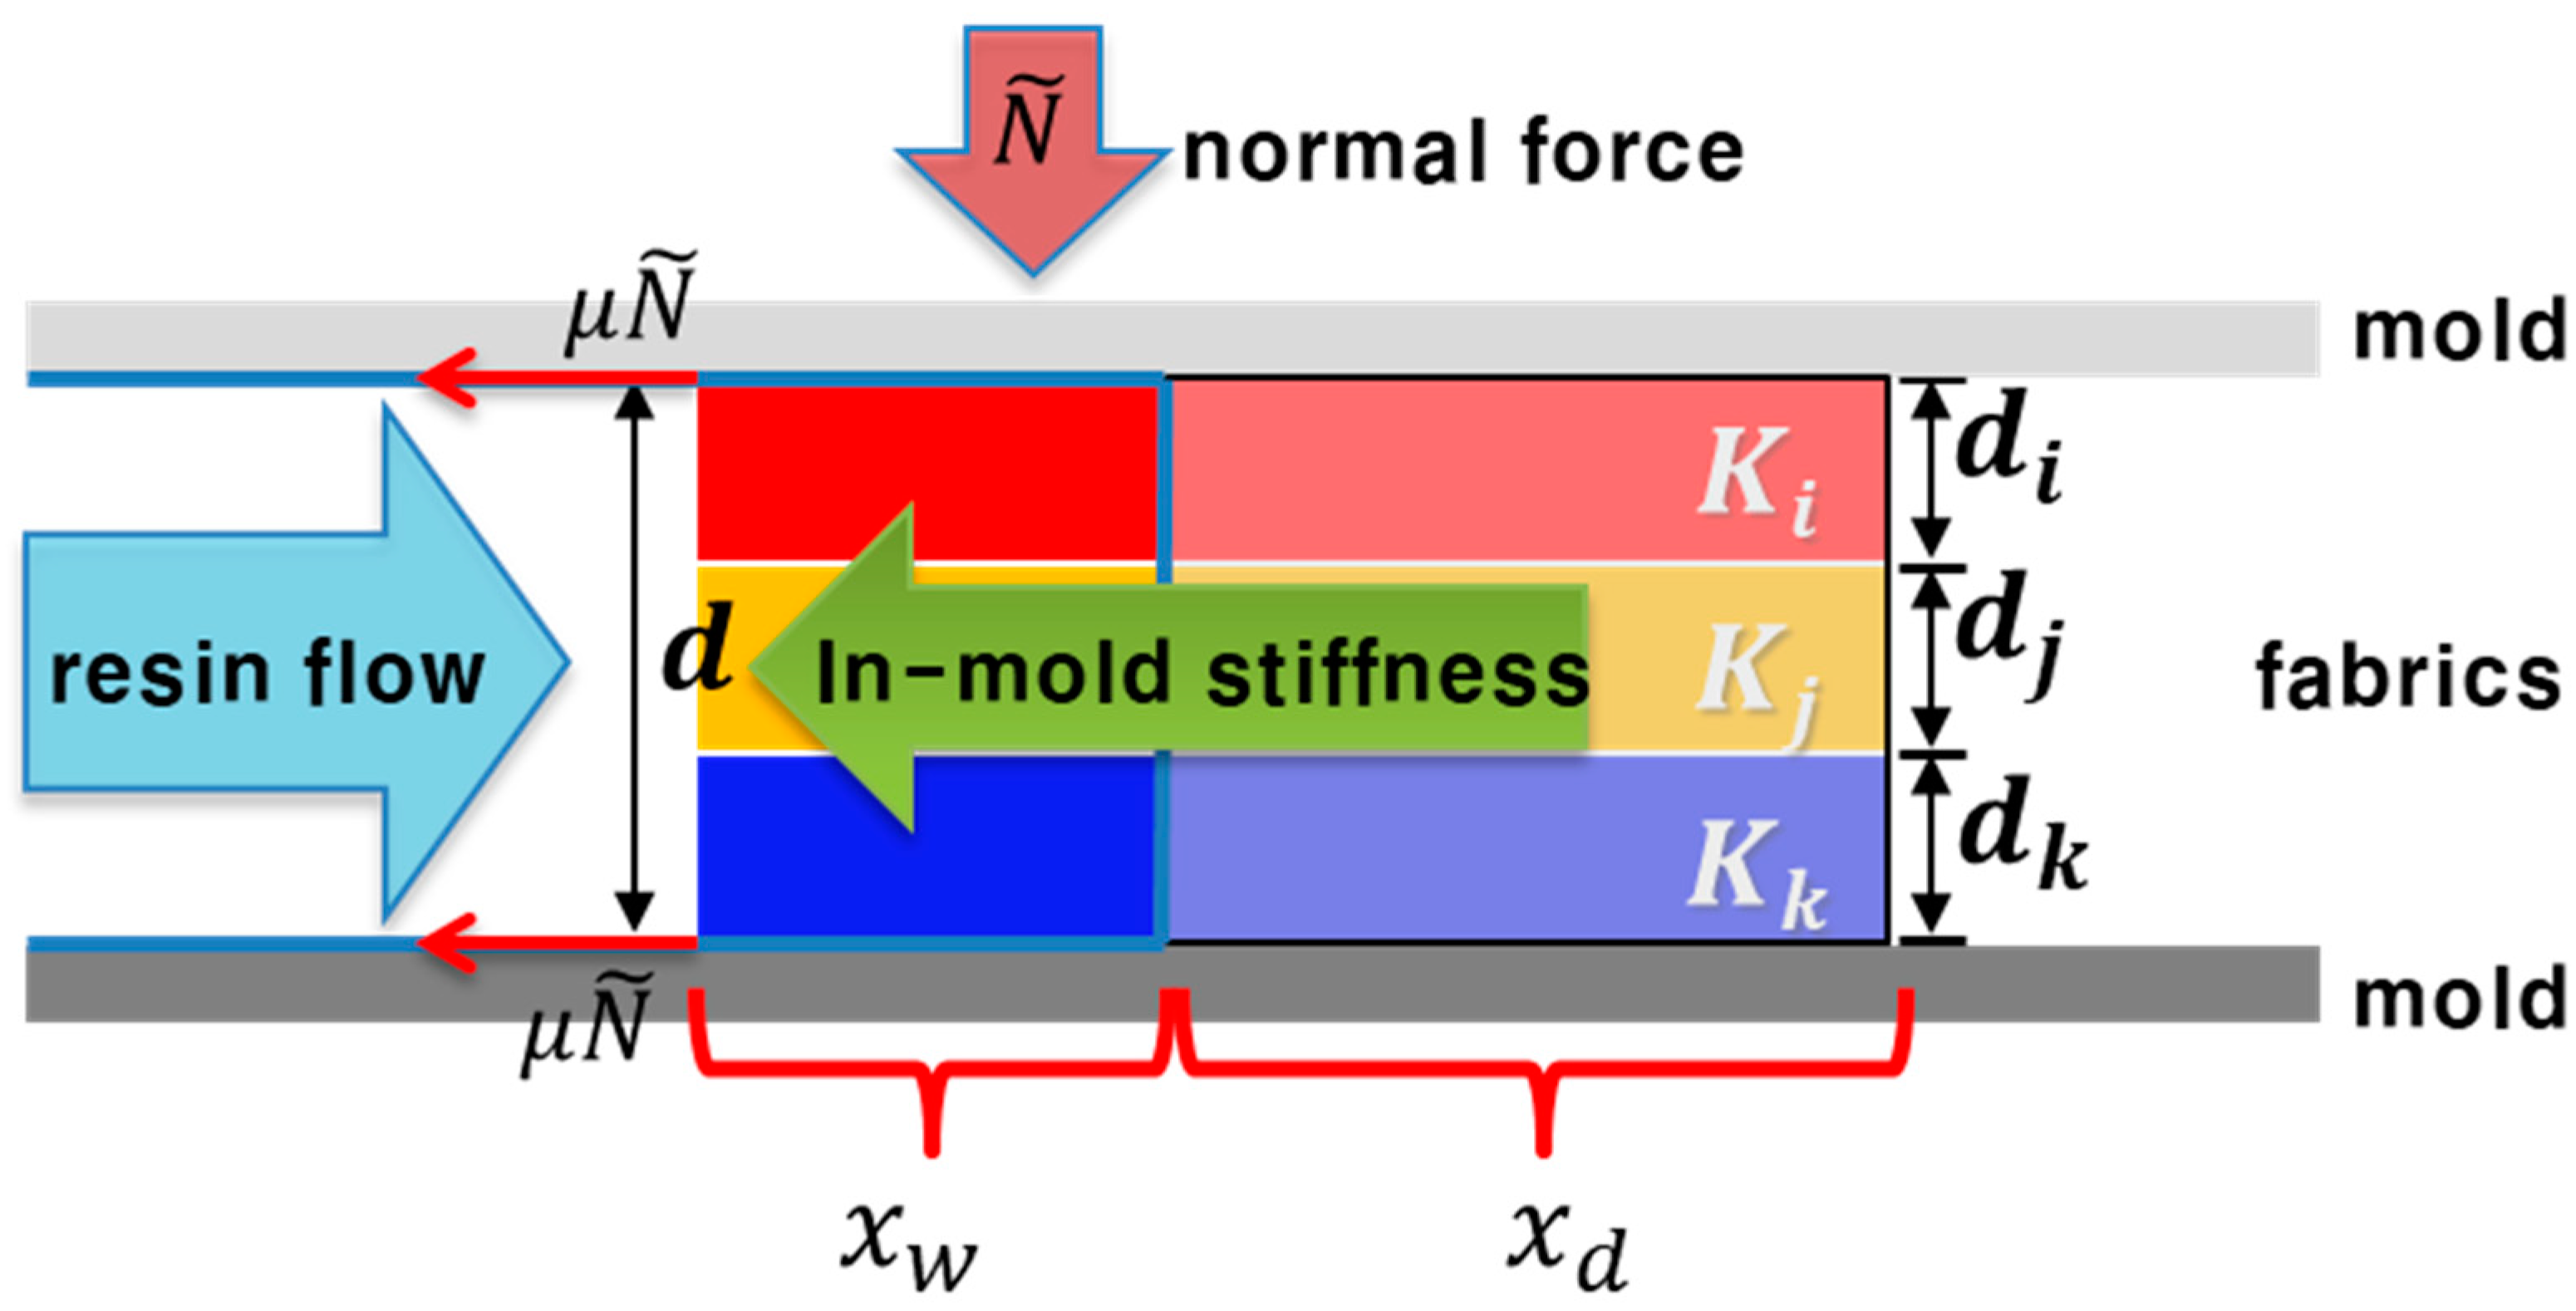
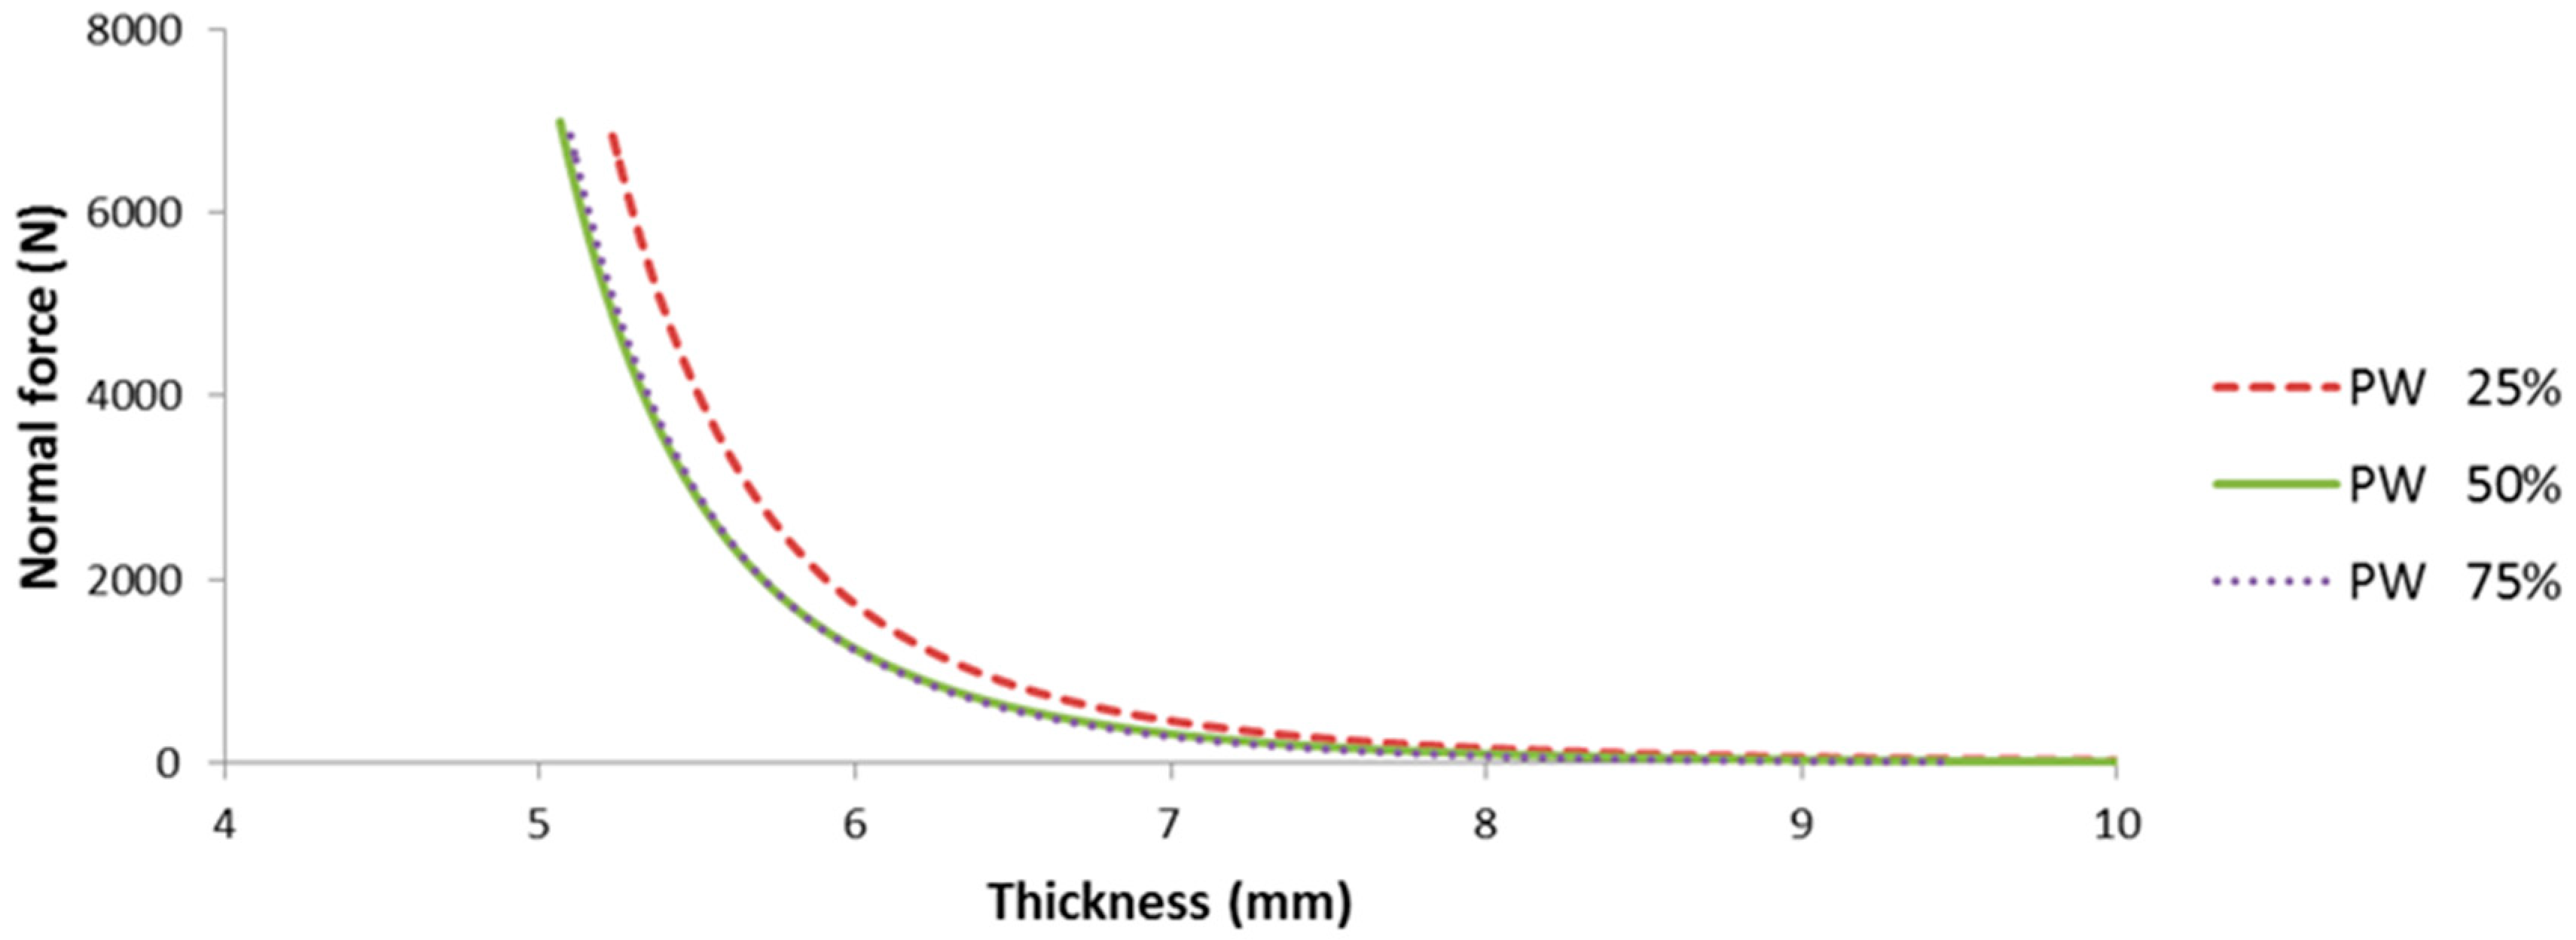
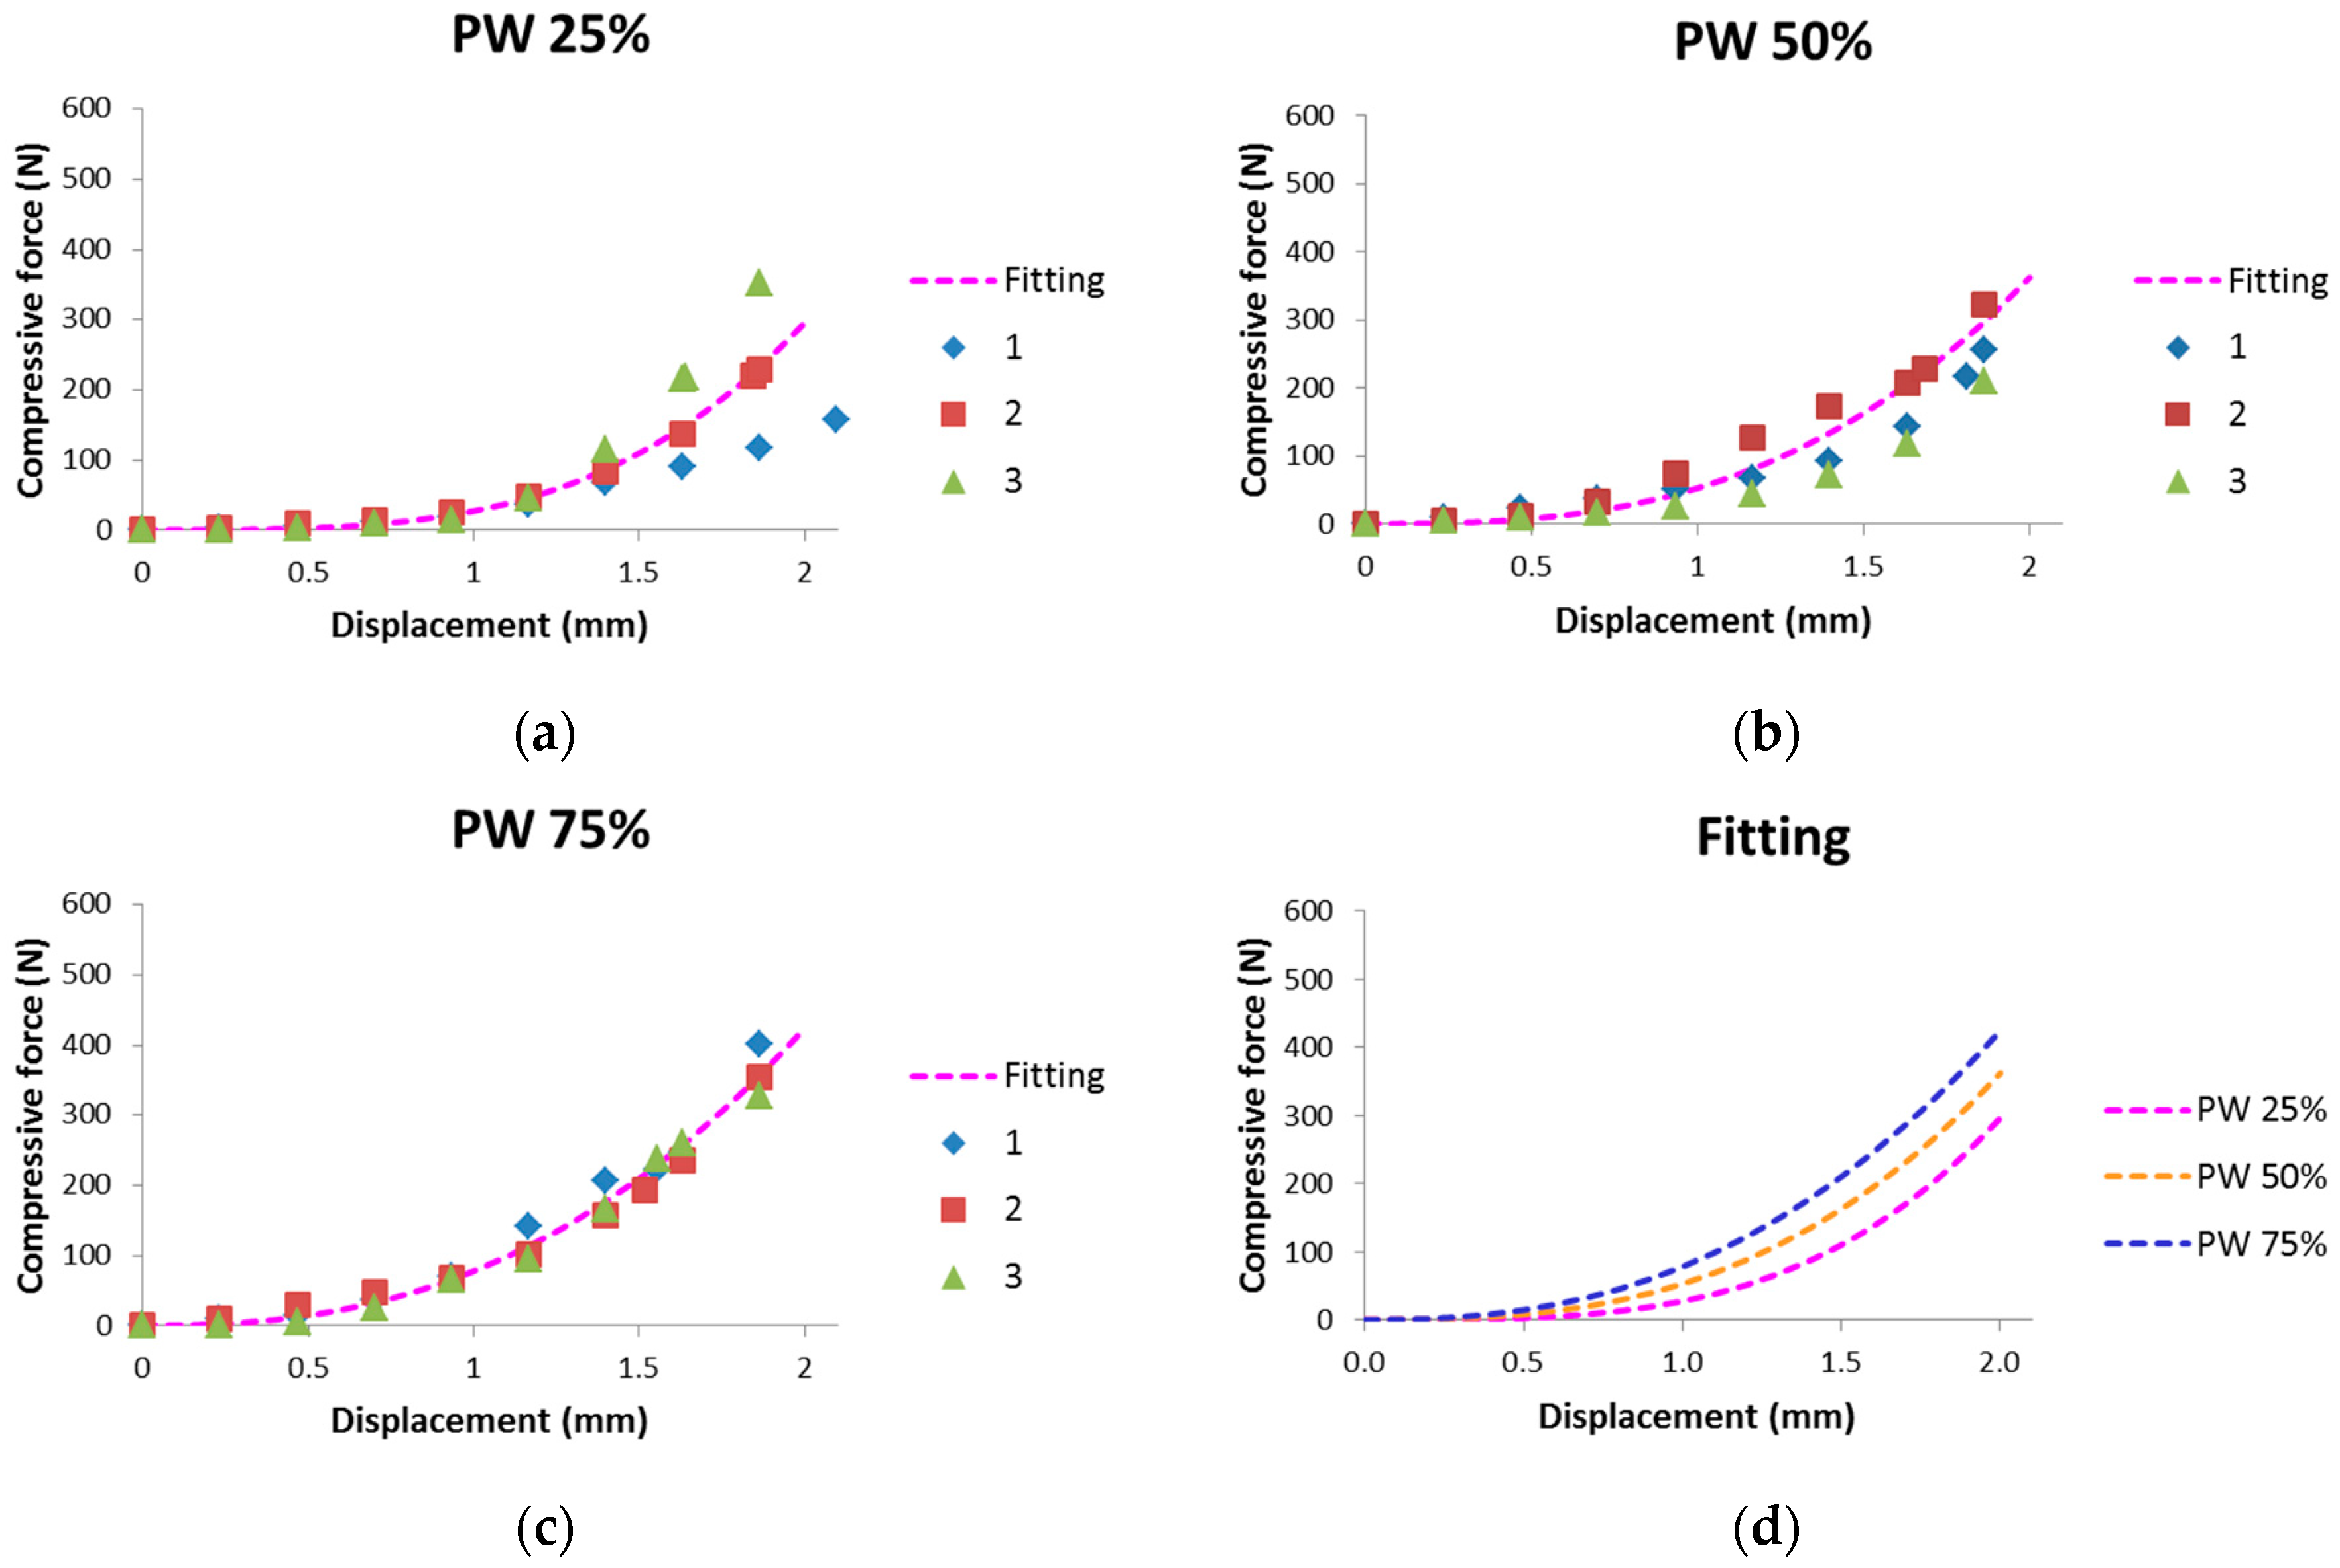
4.2. In-Mold Stiffness
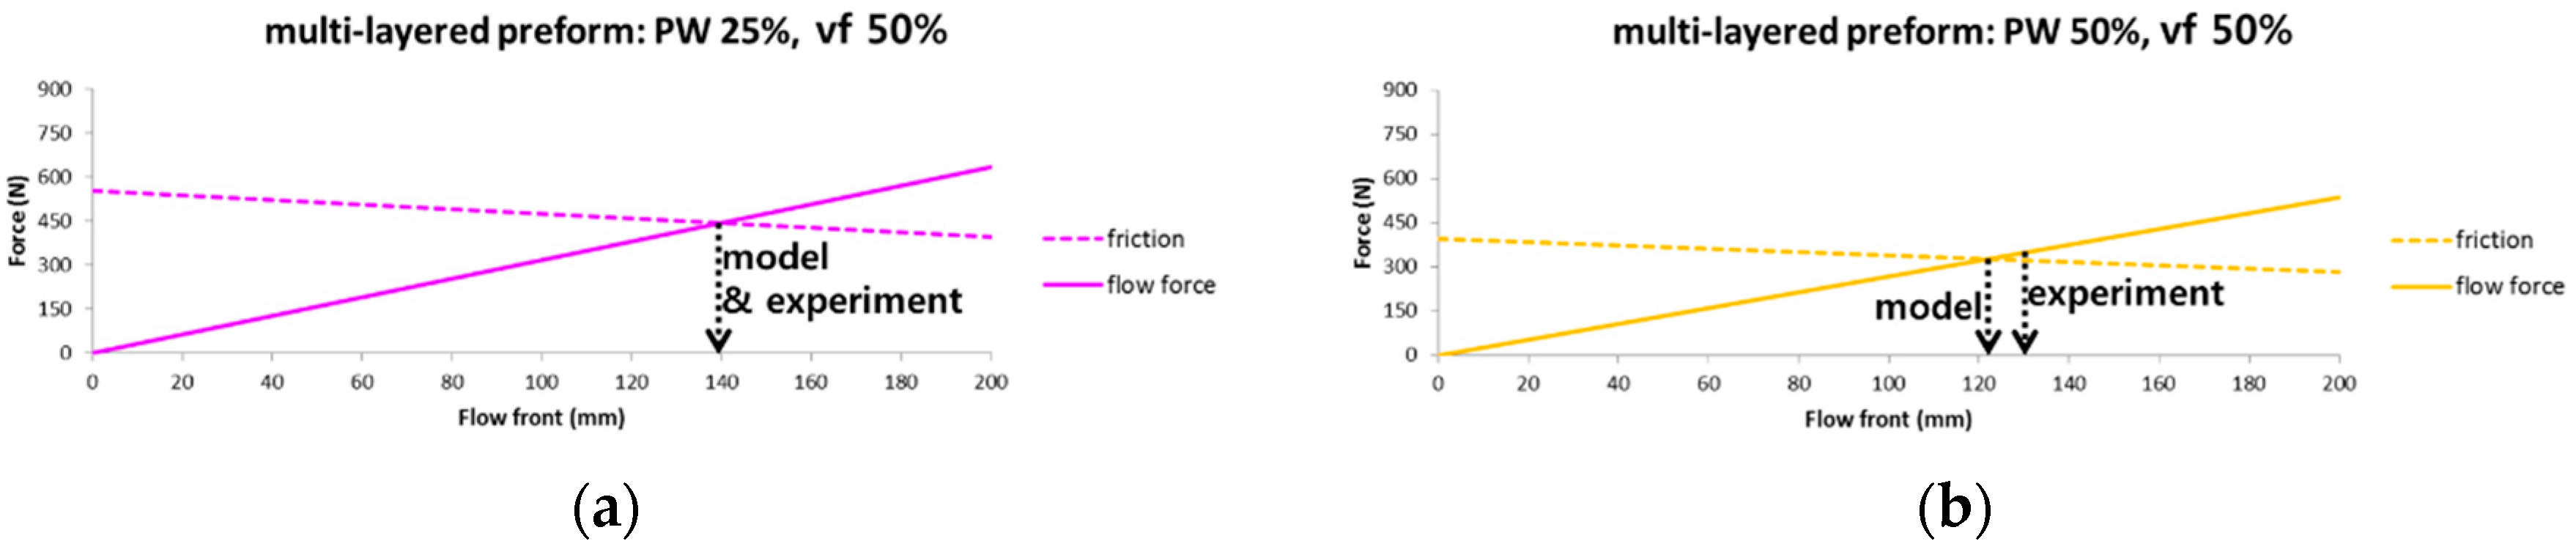
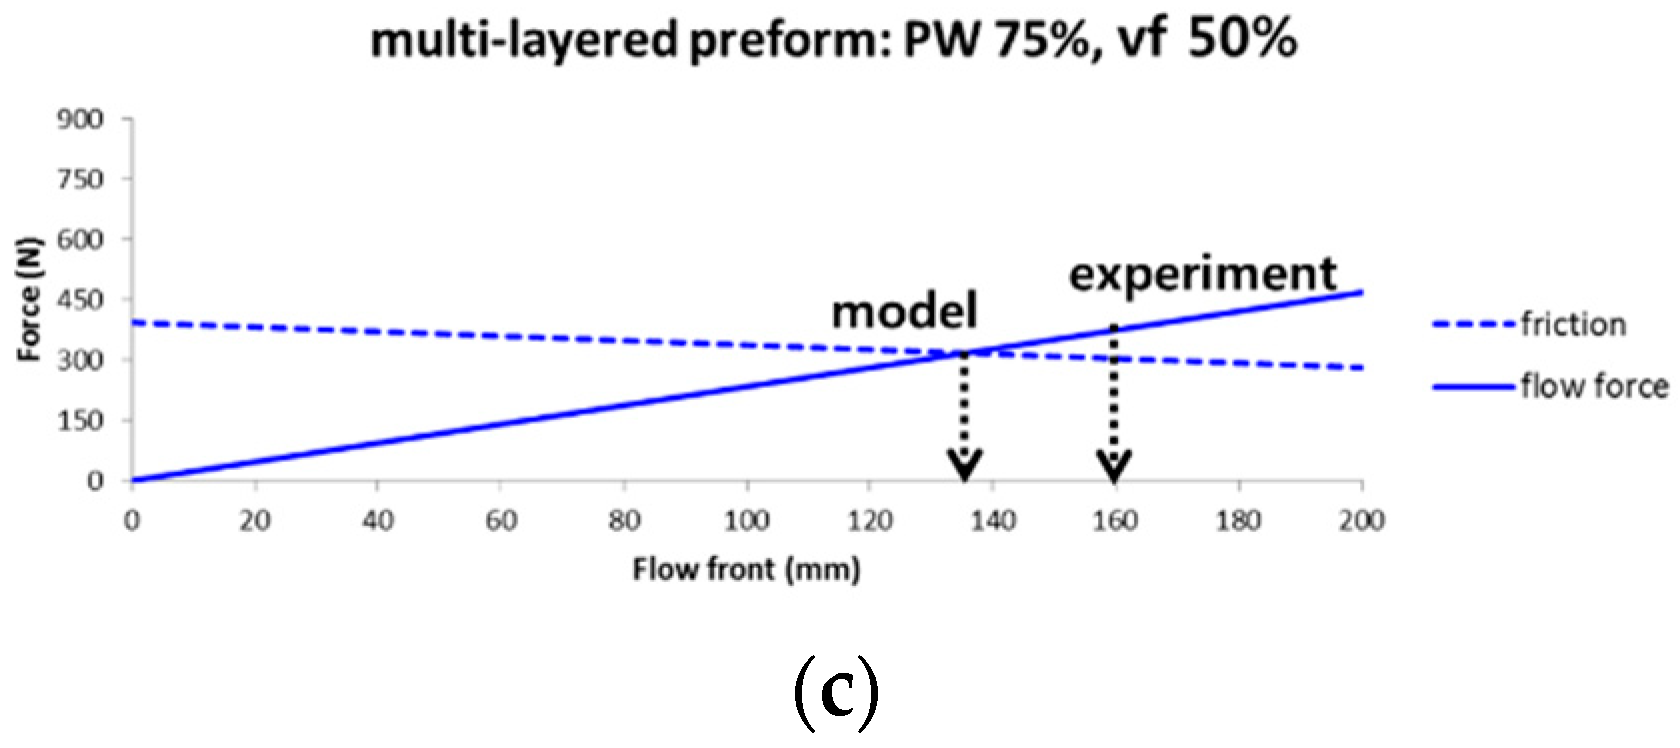
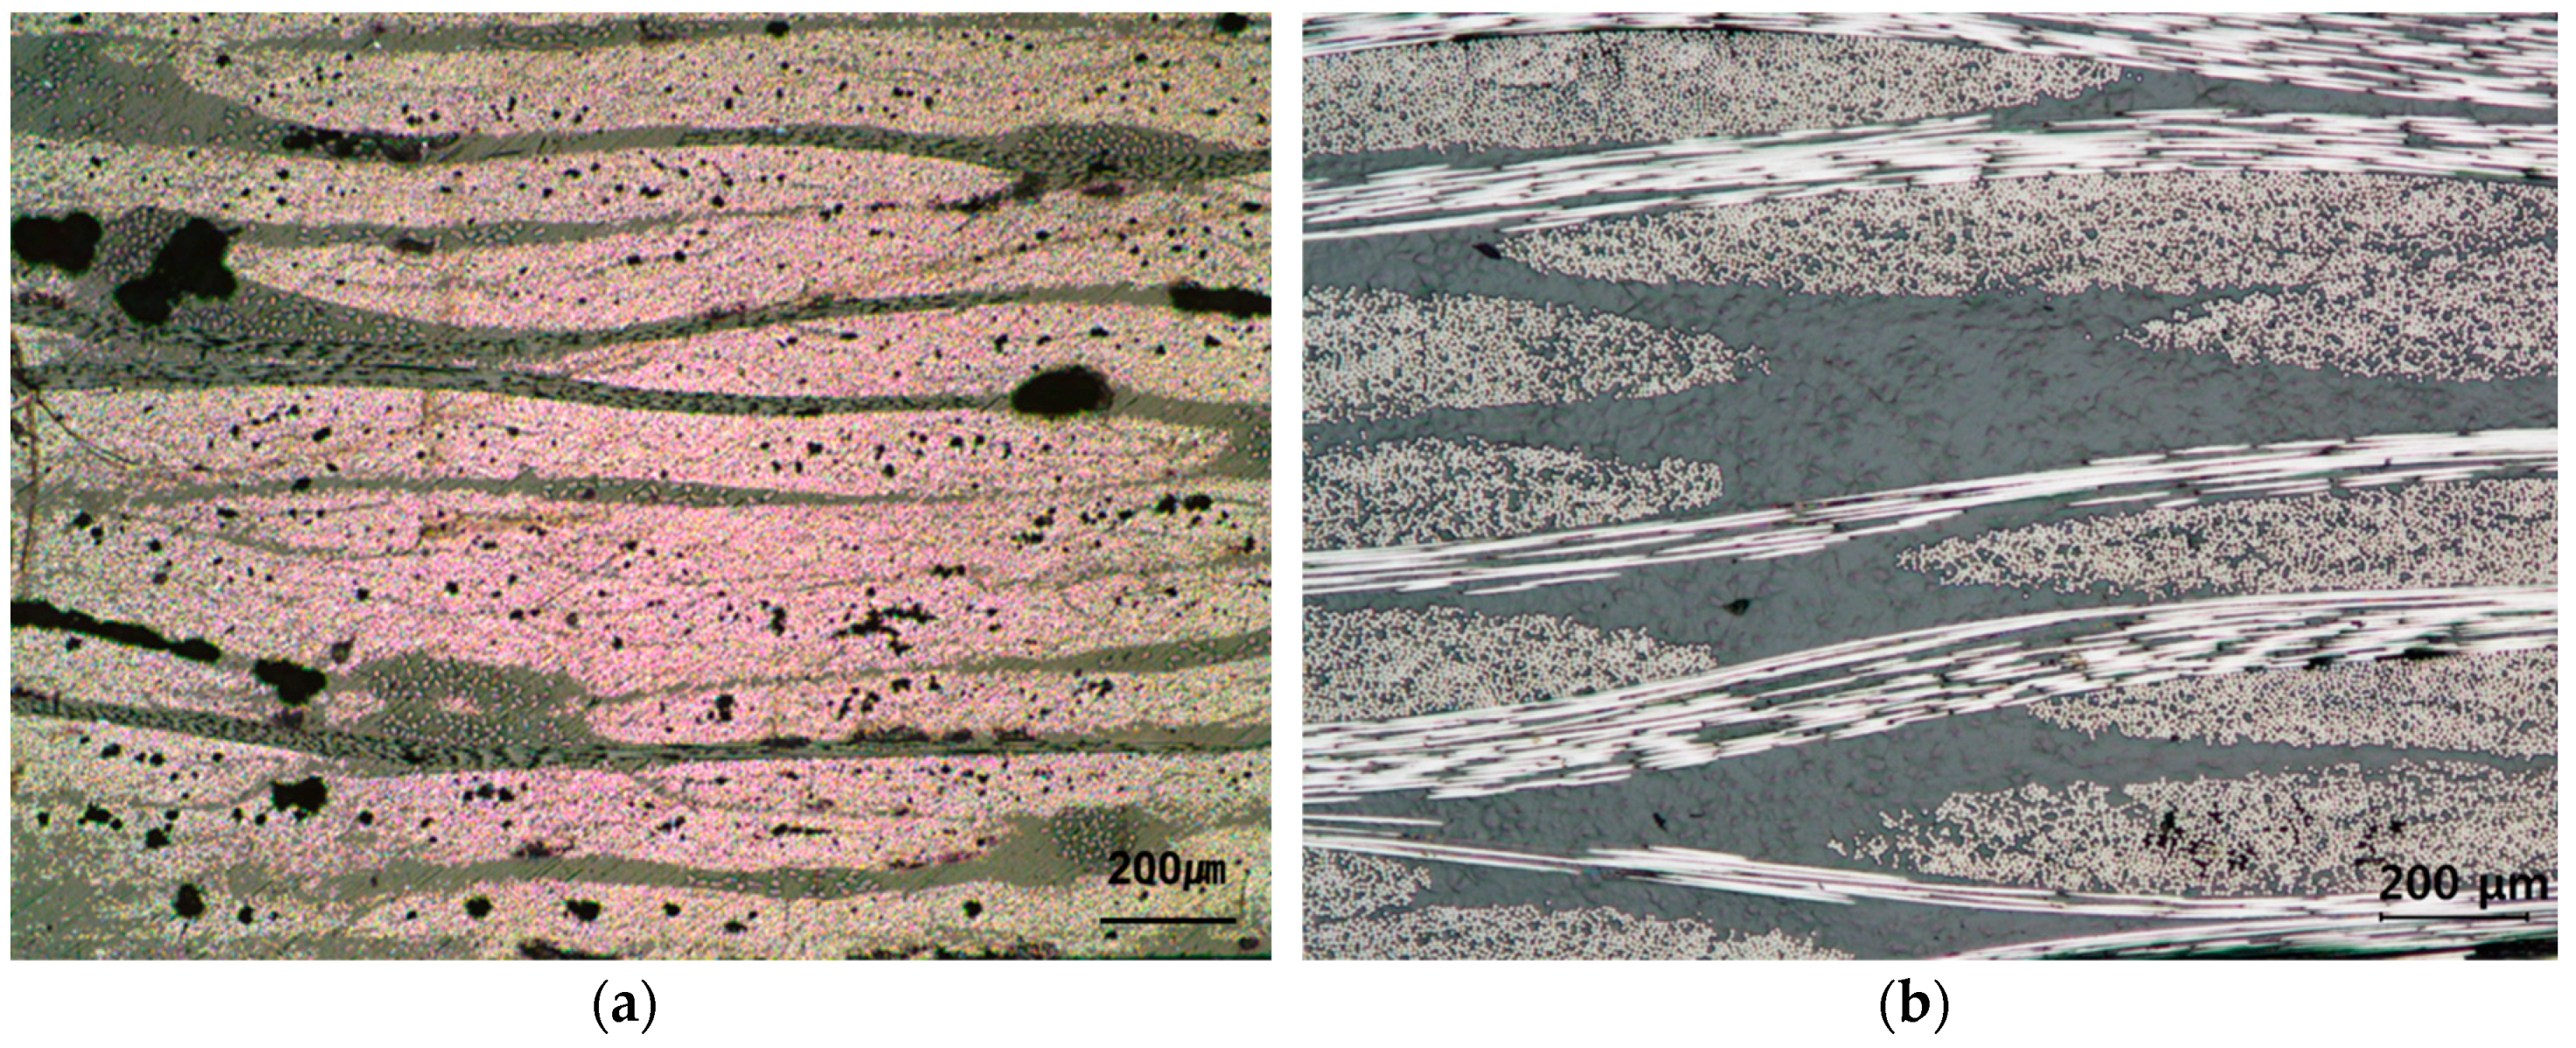
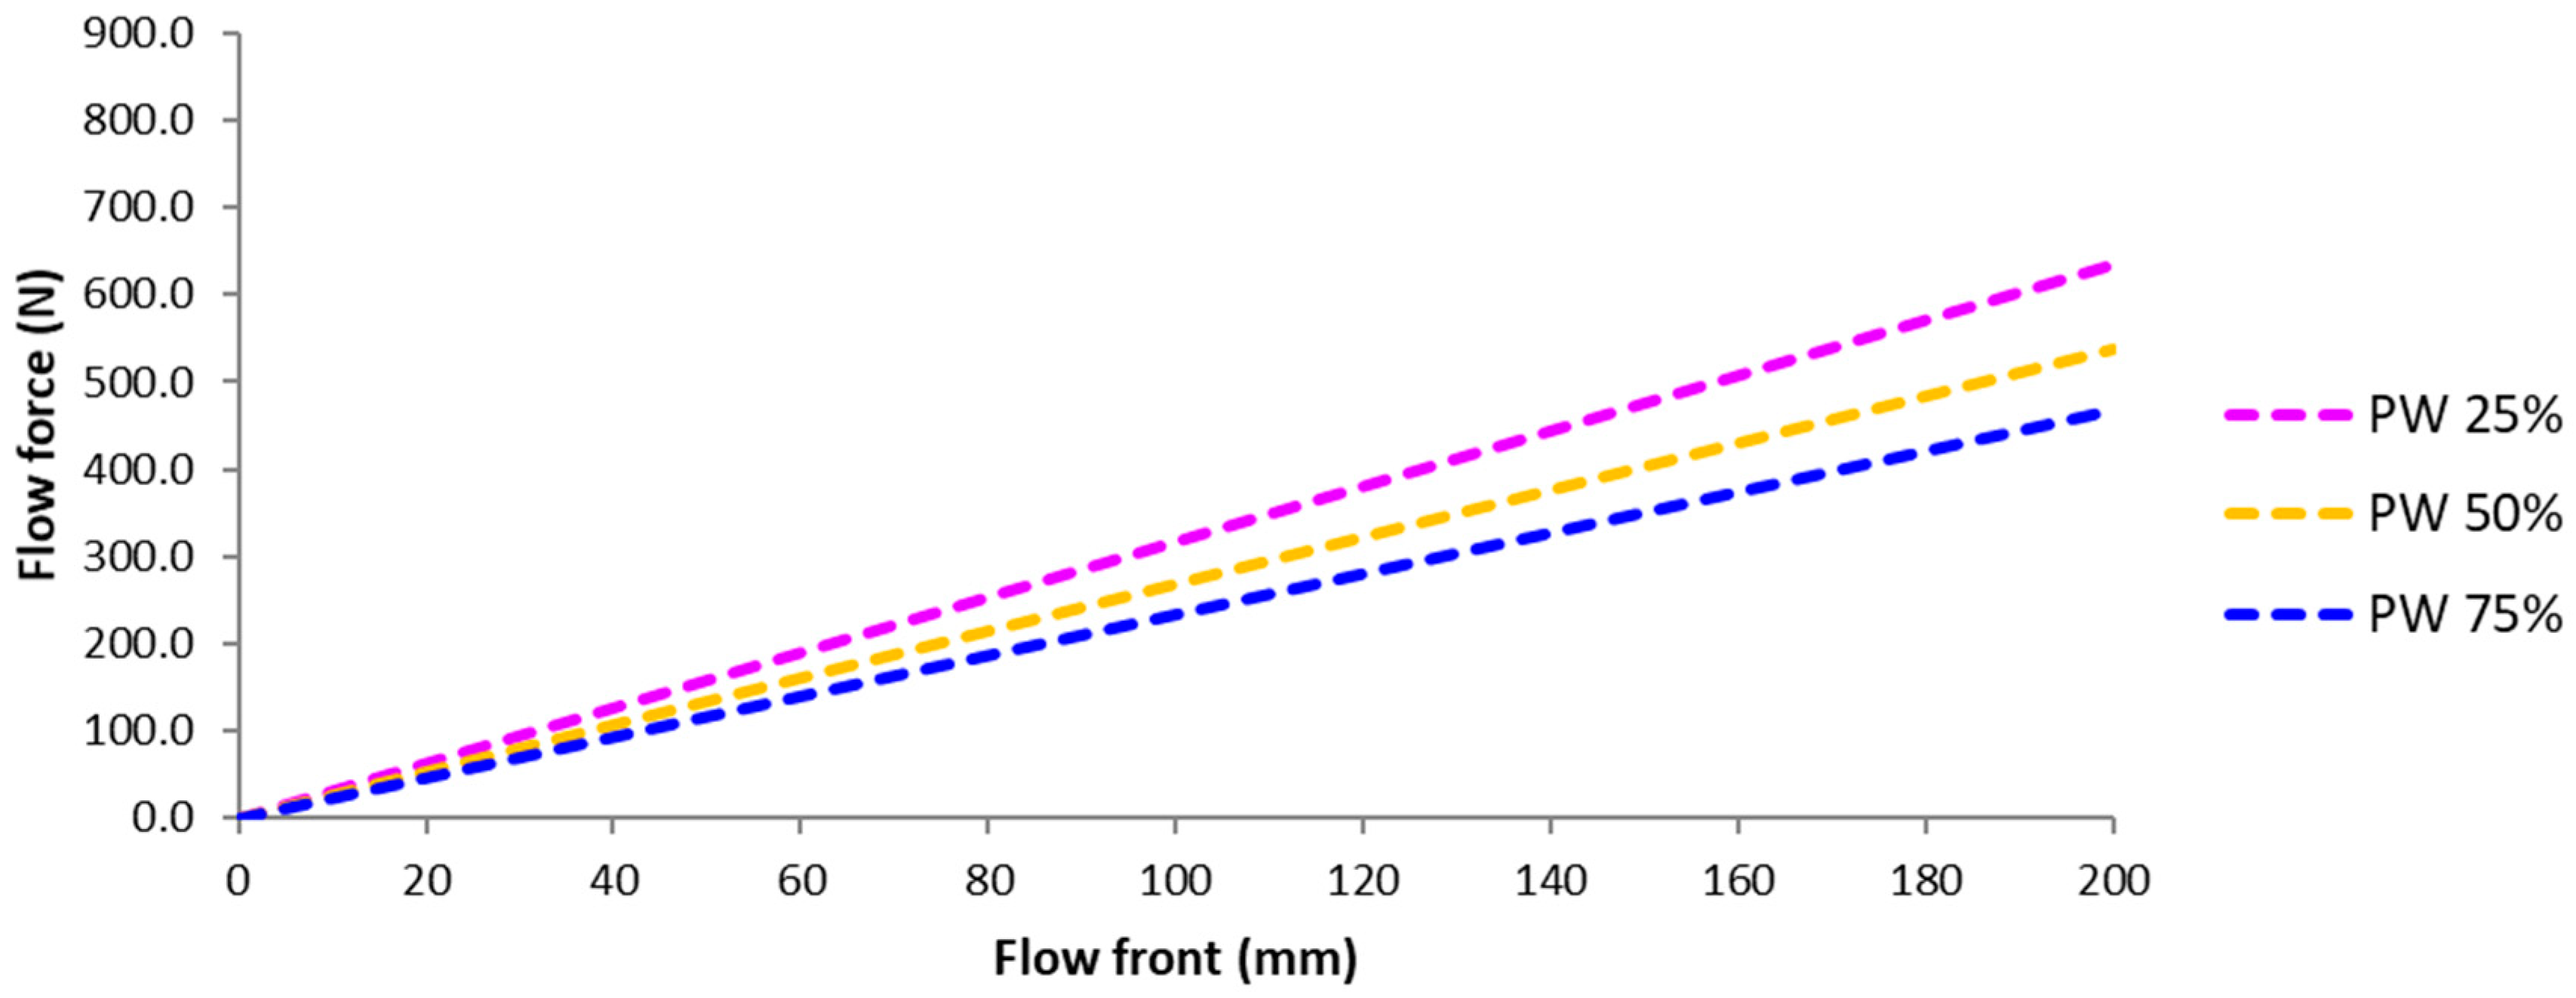
4.3. Flow Induced Deformation of the Multi-Layered Fiber Preform
5. Discussion
Author Contributions
Funding
Conflicts of Interest
References
- Henning, F.; Möller, E. Handbuch Leichtbau: Methoden, Werkstoffe, Fertigung; Hanser Verlag: Cincinnati, OH, USA, 2011. [Google Scholar]
- Muhammad, P.; Suhara, P.; Birat, K.C.; Mohini, S.; Jimi, T. Emerging trends in automotive lightweighting through novel composite materials. Mater. Sci. Appl. 2016, 7, 26–38. [Google Scholar]
- Feraboli, P.; Masini, A.; Bonfatti, A. Advanced composites for the body and chassis of a production high performance car. Int. J. Veh. Des. 2007, 44, 233–246. [Google Scholar] [CrossRef]
- Liu, B.; Bicketon, S.; Advani, S.G. Modeling and simulation of resin transfer moulding (RTM)–Gate control, venting and dry spot prediction. Compos. A Appl. Sci. Manuf. 1996, 27, 135–141. [Google Scholar] [CrossRef]
- Trochu, F.; Ruiz, E.; Achim, V.; Soukane, S. Advanced numerical simulation of liquid composite molding for process analysis and optimization. Compos. A Appl. Sci. Manuf. 2006, 37, 890–902. [Google Scholar] [CrossRef]
- Pillai, K.M. Modeling the unsaturated flow in liquid composite molding processes: A review and some thoughts. J. Compos. Mater. 2004, 38, 2097–2118. [Google Scholar] [CrossRef]
- Shojaei, A.; Ghaffarian, S.R.; Karimian, S.M.H. Modeling and simulation approaches in the resin transfer molding process: A review. Polym. Compos. 2003, 24, 525–544. [Google Scholar] [CrossRef]
- Wang, J.; Simacek, P.; Advani, S.G. Use of Centroidal Voronoi Diagram to fine optimal gate locations to minimize mold filling time in resin transfer molding. Compos. A Appl. Sci. Manuf. 2016, 87, 243–255. [Google Scholar] [CrossRef]
- Park, C.H.; Lee, W.I. Modeling void formation and unsaturated flow in liquid composite molding processes: A survey and review. J. Reinf. Plast. Compos. 2011, 30, 957–977. [Google Scholar] [CrossRef]
- Saad, A.; Echchelh, A.; Hattabi, M.; Ganaouli, M.E. Review of modeling and simulation of void formation in liquid composite molding. Compos. Mech. Comput. Appl. Int. J. 2018, 9, 51–93. [Google Scholar] [CrossRef]
- Bickerton, S.; Sozer, E.M.; Graham, P.J.; Advani, S.G. Fabric structure and mold curvature effects on preform permeability and mold filling in the RTM process. Part I. Experiments. Compos. A Appl. Sci. Manuf. 2000, 31, 423–438. [Google Scholar] [CrossRef]
- Dong, C. Experimental investigation on the fiber preform deformation due to mold closure for composites processing. Int. J. Adv. Manuf. Technol. 2014, 71, 585–591. [Google Scholar] [CrossRef]
- Dusserre, G.; Jourdain, E.; Bernhart, G. Effect of deformation on knitted glass preform in-plane permeability. Polym. Compos. 2011, 32, 18–28. [Google Scholar] [CrossRef]
- Vanaerschot, A.; Cox, B.N.; Lomov, S.V.; Vandepitte, D. Experimentally validated stochastic geometry description for textile composite reinforcements. Compos. Sci. Technol. 2016, 122, 122–129. [Google Scholar] [CrossRef] [Green Version]
- Yun, M.; Carella, T.; Simacek, P.; Advani, S. Stochastic modeling of through the thickness permeability variation in a fabric and its effect on void formation during vacuum assisted resin transfer molding. Compos. Sci. Technol. 2017, 149, 100–107. [Google Scholar] [CrossRef]
- Yun, M.; Simacek, P.; Binetruy, C.; Advani, S. Random field generation of stochastically varying through the thickness permeability of a plain woven fabric. Compos. Sci. Technol. 2018, 159, 199–207. [Google Scholar] [CrossRef]
- Endruweit, A.; Gehrig, S.; Ermanni, P. Mechanism of hydrodynamically induced in-plane deformation of reinforcement textile in resin injection processes. J. Compos. Mater. 2003, 37, 1675–1692. [Google Scholar] [CrossRef]
- Seong, D.G.; Kim, S.; Um, M.K.; Song, Y.S. Flow induced deformation of unidirectional fiber preform during the mold filling stage in liquid composite molding process. J. Compos. Mater. 2018, 52, 1265–1277. [Google Scholar] [CrossRef]
- Sorrentino, L.; Bellini, C.; Gerevini, E. New methodology to determine the compressibility curve in a RIFT process. J. Compos. Mater. 2014, 48, 1233–1240. [Google Scholar] [CrossRef]
- Sorrentino, L.; Bellini, C. Analysis of laminate thickness influence on compressibility behavior in a rift process. Int. J. Eng. Technol. 2014, 6, 1259–1267. [Google Scholar]
- Chen, Z.R.; Ye, L.; Kruckenberg, T.A. A micromechanical compaction model for woven fabric preforms. Part I: Single layer. Compos. Sci. Technol. 2006, 66, 3254–3262. [Google Scholar] [CrossRef]
- Chen, Z.R.; Ye, L. A micromechanical compaction model for woven fabric preforms. Part II: Multilayer, Compos. Sci. Technol. 2006, 66, 3263–3272. [Google Scholar]
- Adams, K.L.; Rebenfeld, L. Permeability characteristics of multilayer fiber reinforcements. Part II: Theoretical model. Polym. Compos. 1991, 12, 186–190. [Google Scholar] [CrossRef]
- Bruschke, M.V.; Advani, S.G. A finite element/control volume approach to mold filling in anisotropic porous media. Polym. Compos. 1990, 11, 398–405. [Google Scholar] [CrossRef]
- Advani, S.G.; Sozer, E.M. Process Modeling in Composites Manufacturing; Marcel Dekker: New York, NY, USA, 2002. [Google Scholar]
- Astroem, B.; Pipes, R.B.; Advani, S.G. On flow through aligned fiber beds and its application to composites processing. J. Compos. Mater. 1992, 26, 1351–1373. [Google Scholar] [CrossRef]
- Merotte, J.; Simacek, P.; Advani, S.G. Resin flow analysis with fiber preform deformation in through thickness direction during compression resin transfer molding. Compos. A Appl. Sci. Manuf. 2010, 41, 881–887. [Google Scholar] [CrossRef]
- Standard Test Method for Thickness of Nonwoven Fabrics, ASTM Standard D5729; ASTM International: West Conshohocken, PA, USA, 2004.
- Adams, K.L.; Russel, W.B.; Rebenfeld, L. Radial penetration of a viscous liquid into a planar anisotropic porous medium. Int. J. Multiph. Flow 1988, 14, 203–215. [Google Scholar] [CrossRef]
- Weitzenböck, J.R.; Shenoi, R.A.; Wilson, P.A. Radial flow permeability measurement. Part A Theory Compos. A Appl. Sci. Manuf. 1999, 30, 781–796. [Google Scholar] [CrossRef]
- Arbter, R.; Beraud, J.M.; Binetruy, C.; Bizet, L.; Bréard, J.; Comas-Cardona, S.; Demaria, C.; Endruweit, A.; Ermanni, P.; Gommer, F.; et al. Experimental determination of the permeability of textiles: A benchmark exercise. Compos. A Appl. Sci. Manuf. 2011, 42, 1157–1168. [Google Scholar] [CrossRef]
- Gorczyca, J.L. A Study on the Frictional Behavior of a Plain-Weave Fabric during the Thermostamping Process. Ph.D. Thesis, University of Massachusetts Lowell, Lowell, MA, USA, January 2004. [Google Scholar]


| Structure | Supplier | Model | Yarn (K) | FAW* (g/m2) | Thickness (mm) |
|---|---|---|---|---|---|
| UD | Zoltek | UD150 | 50 | 182 | 0.21 |
| PW | Mitsubishi | TR30M | 3 | 200 | 0.23 |
| Ratio of PW (%) | 25 (27.6) * | 50 | 75 (71.4) * | |
|---|---|---|---|---|
| Number of layer | UD | 21 | 14 | 8 |
| PW | 8 | 14 | 20 | |
| Fabric | UD | PW | |
|---|---|---|---|
| Friction coefficient | Dry fabric (with standard deviation) | 0.130 (±0.012) | 0.160 (±0.008) |
| Wet fabric (regression value) | 0.076 | 0.115 | |
| Type of Deformation (Occurrence of Deformation, O/X) | PW 25% | PW 50% | PW 75% | |||||||||
|---|---|---|---|---|---|---|---|---|---|---|---|---|
| Friction Force | Flow Force (Model) | Flow Force (Exp.) | In-Mold Stiffness Force | Friction Force | Flow Force (Model) | Flow Force (Exp.) | In-mold Stiffness Force | Friction Force | Flow Force (Model) | Flow Force (Exp.) | In-Mold Stiffness Force | |
| - | (N) | (N) | (N) | (N) | (N) | (N) | (N) | (N) | (N) | (N) | (N) | (N) |
| Local (X) | 553 | 0.880 | - | 33.3 | 396 | 0.520 | - | 52.8 | 393 | 0.369 | - | 77.9 |
| Rigid body (O) | 443 | 444 | 495 | >1000 | 323 | 349 | 346 | >1000 | 304 | 375 | 300 | >1000 |
© 2018 by the authors. Licensee MDPI, Basel, Switzerland. This article is an open access article distributed under the terms and conditions of the Creative Commons Attribution (CC BY) license (http://creativecommons.org/licenses/by/4.0/).
Share and Cite
Seong, D.G.; Kim, S.; Lee, D.; Yi, J.W.; Kim, S.W.; Kim, S.Y. Prediction of Defect Formation during Resin Impregnation Process through a Multi-Layered Fiber Preform in Resin Transfer Molding by a Proposed Analytical Model. Materials 2018, 11, 2055. https://doi.org/10.3390/ma11102055
Seong DG, Kim S, Lee D, Yi JW, Kim SW, Kim SY. Prediction of Defect Formation during Resin Impregnation Process through a Multi-Layered Fiber Preform in Resin Transfer Molding by a Proposed Analytical Model. Materials. 2018; 11(10):2055. https://doi.org/10.3390/ma11102055
Chicago/Turabian StyleSeong, Dong Gi, Shino Kim, Doojin Lee, Jin Woo Yi, Sang Woo Kim, and Seong Yun Kim. 2018. "Prediction of Defect Formation during Resin Impregnation Process through a Multi-Layered Fiber Preform in Resin Transfer Molding by a Proposed Analytical Model" Materials 11, no. 10: 2055. https://doi.org/10.3390/ma11102055
APA StyleSeong, D. G., Kim, S., Lee, D., Yi, J. W., Kim, S. W., & Kim, S. Y. (2018). Prediction of Defect Formation during Resin Impregnation Process through a Multi-Layered Fiber Preform in Resin Transfer Molding by a Proposed Analytical Model. Materials, 11(10), 2055. https://doi.org/10.3390/ma11102055