1. Introduction
Bimetallic nanoparticles are of wide interest since they show physical and chemical properties that are distinct from those of their monometallic counterparts, and they present a combination of the properties associated with the two metals and create synergistic effects, which signifies the whole being greater than the sum of its parts [
1]. Bimetallic nanoparticles have emerged as a new class of catalysts mainly in energy issue, with potential applications in advanced energy conversion and storage (ECS) devices, including fuel cells, photo-electrochemical water splitting cells, solar cells, Li-ion batteries, and supercapacitors, among others [
2].
It is known that platinum (Pt) is one of the best single metal catalysts and is used mainly in the chemical industry, the petrochemical industry, automobile exhaust purification, and fuel cells because of its excellent reactivity and stability [
3]. Improving the activity and utilization efficiency of Pt catalysts is therefore the key issue in the development of relevant catalysis fields. Normally, there are two types of target products to reduce Pt loading: Pt monometallic nanoparticles (NPs) with open surface structure [
4] and Pt-based bi- (or multi-) metallic NPs [
5]. Meanwhile, synthesis of Pt-based bimetallic NPs, as an alternative strategy, has received considerable attention as well because of their enhanced catalytic activities as compared to conventional Pt monometallic NPs [
6,
7,
8,
9]. For example, Pt-Au bimetallic NPs exhibited higher electrocatalytic activity and durability for oxygen reduction reactions than Pt monometallic catalysts [
6,
7]. Moreover, the superior activities of both Pt-Ru and Pt-Rh bimetallic NPs were also ascertained in preferential oxidation of CO in hydrogen [
8,
9].
Among Pt-based nanocatalysts, Pt-Pd is one of the most attractive bimetallic systems due to its highly promising application as a catalyst in formic acid oxidation and fuel cells [
10,
11,
12]. Furthermore, Pt-Pd nanocatalysts have been considered as preferred substitutes of Pt-Ru catalysts for low-temperature direct formic acid fuel cell (DFAFC) technology owing to the much cheaper price of Pd [
12]. PdPt bimetallic NPs can be produced generally by either successive co-reduction of Pt and Pd species or a seed-mediated growth method [
13].
As it is known, the structure of bimetallic nanoparticles mainly depends on the synthesis methods and the miscibility of the two components [
14]. The experimentally synthesized Pt-Pd bimetallic NPs can be classified into three configurations: Pt-core/Pd-shell, Pd-core/Pt-shell, and Pt-Pd alloyed nanostructures [
10,
15,
16]. It is well-known that the catalytic activity of these NPs strongly depends not only on the particle size but also the Pt/Pd ratio [
17]. Therefore, the effects of core sizes, shell thicknesses, and alloy compositions are urgent topics that should be addressed for further tailored design of highly active Pt-Pd nanocatalysts. Furthermore, considering that catalysts are generally used at different temperatures, the structural and thermal stabilities of PdPt bimetallic NPs are also important issues that need to be clarified [
18]. Although considerable experimental and theoretical studies have been dedicated to design, synthesis, characterization and performance evaluation of Pt-Pd bimetallic NPs [
19], there is still lacking a full atomic-level understanding of structural and thermal stabilities of PdPt bimetallic NPs with different configurations and compositions.
In this work, PdPt alloyed-bimetallic NPs were synthesized through the polyol method, and characterized using spherical aberration (Cs) corrected scanning transmission electron microscopy (STEM). High-angle annular dark-field (HAADF)-STEM images of the bimetallic nanoparticles were obtained. The contrast of the images shows that NPs have an alloy structure with an average size of 8.2 nm. In addition, a systematic study on the structural and thermal stabilities and atomic surface segregation of cubo-octahedral Pt and Pd monometallic and PtPd alloyed-bimetallic NPs using the classical molecular dynamics simulations was performed. Additionally, the dynamics of thermally driven structural evolutions and the atomic diffusive behaviors of the NPs were explored.
3. Results and Discussion
Parallel beam X-ray diffraction (XRD) measurements were carried out to determine the structure of the nanoparticles.
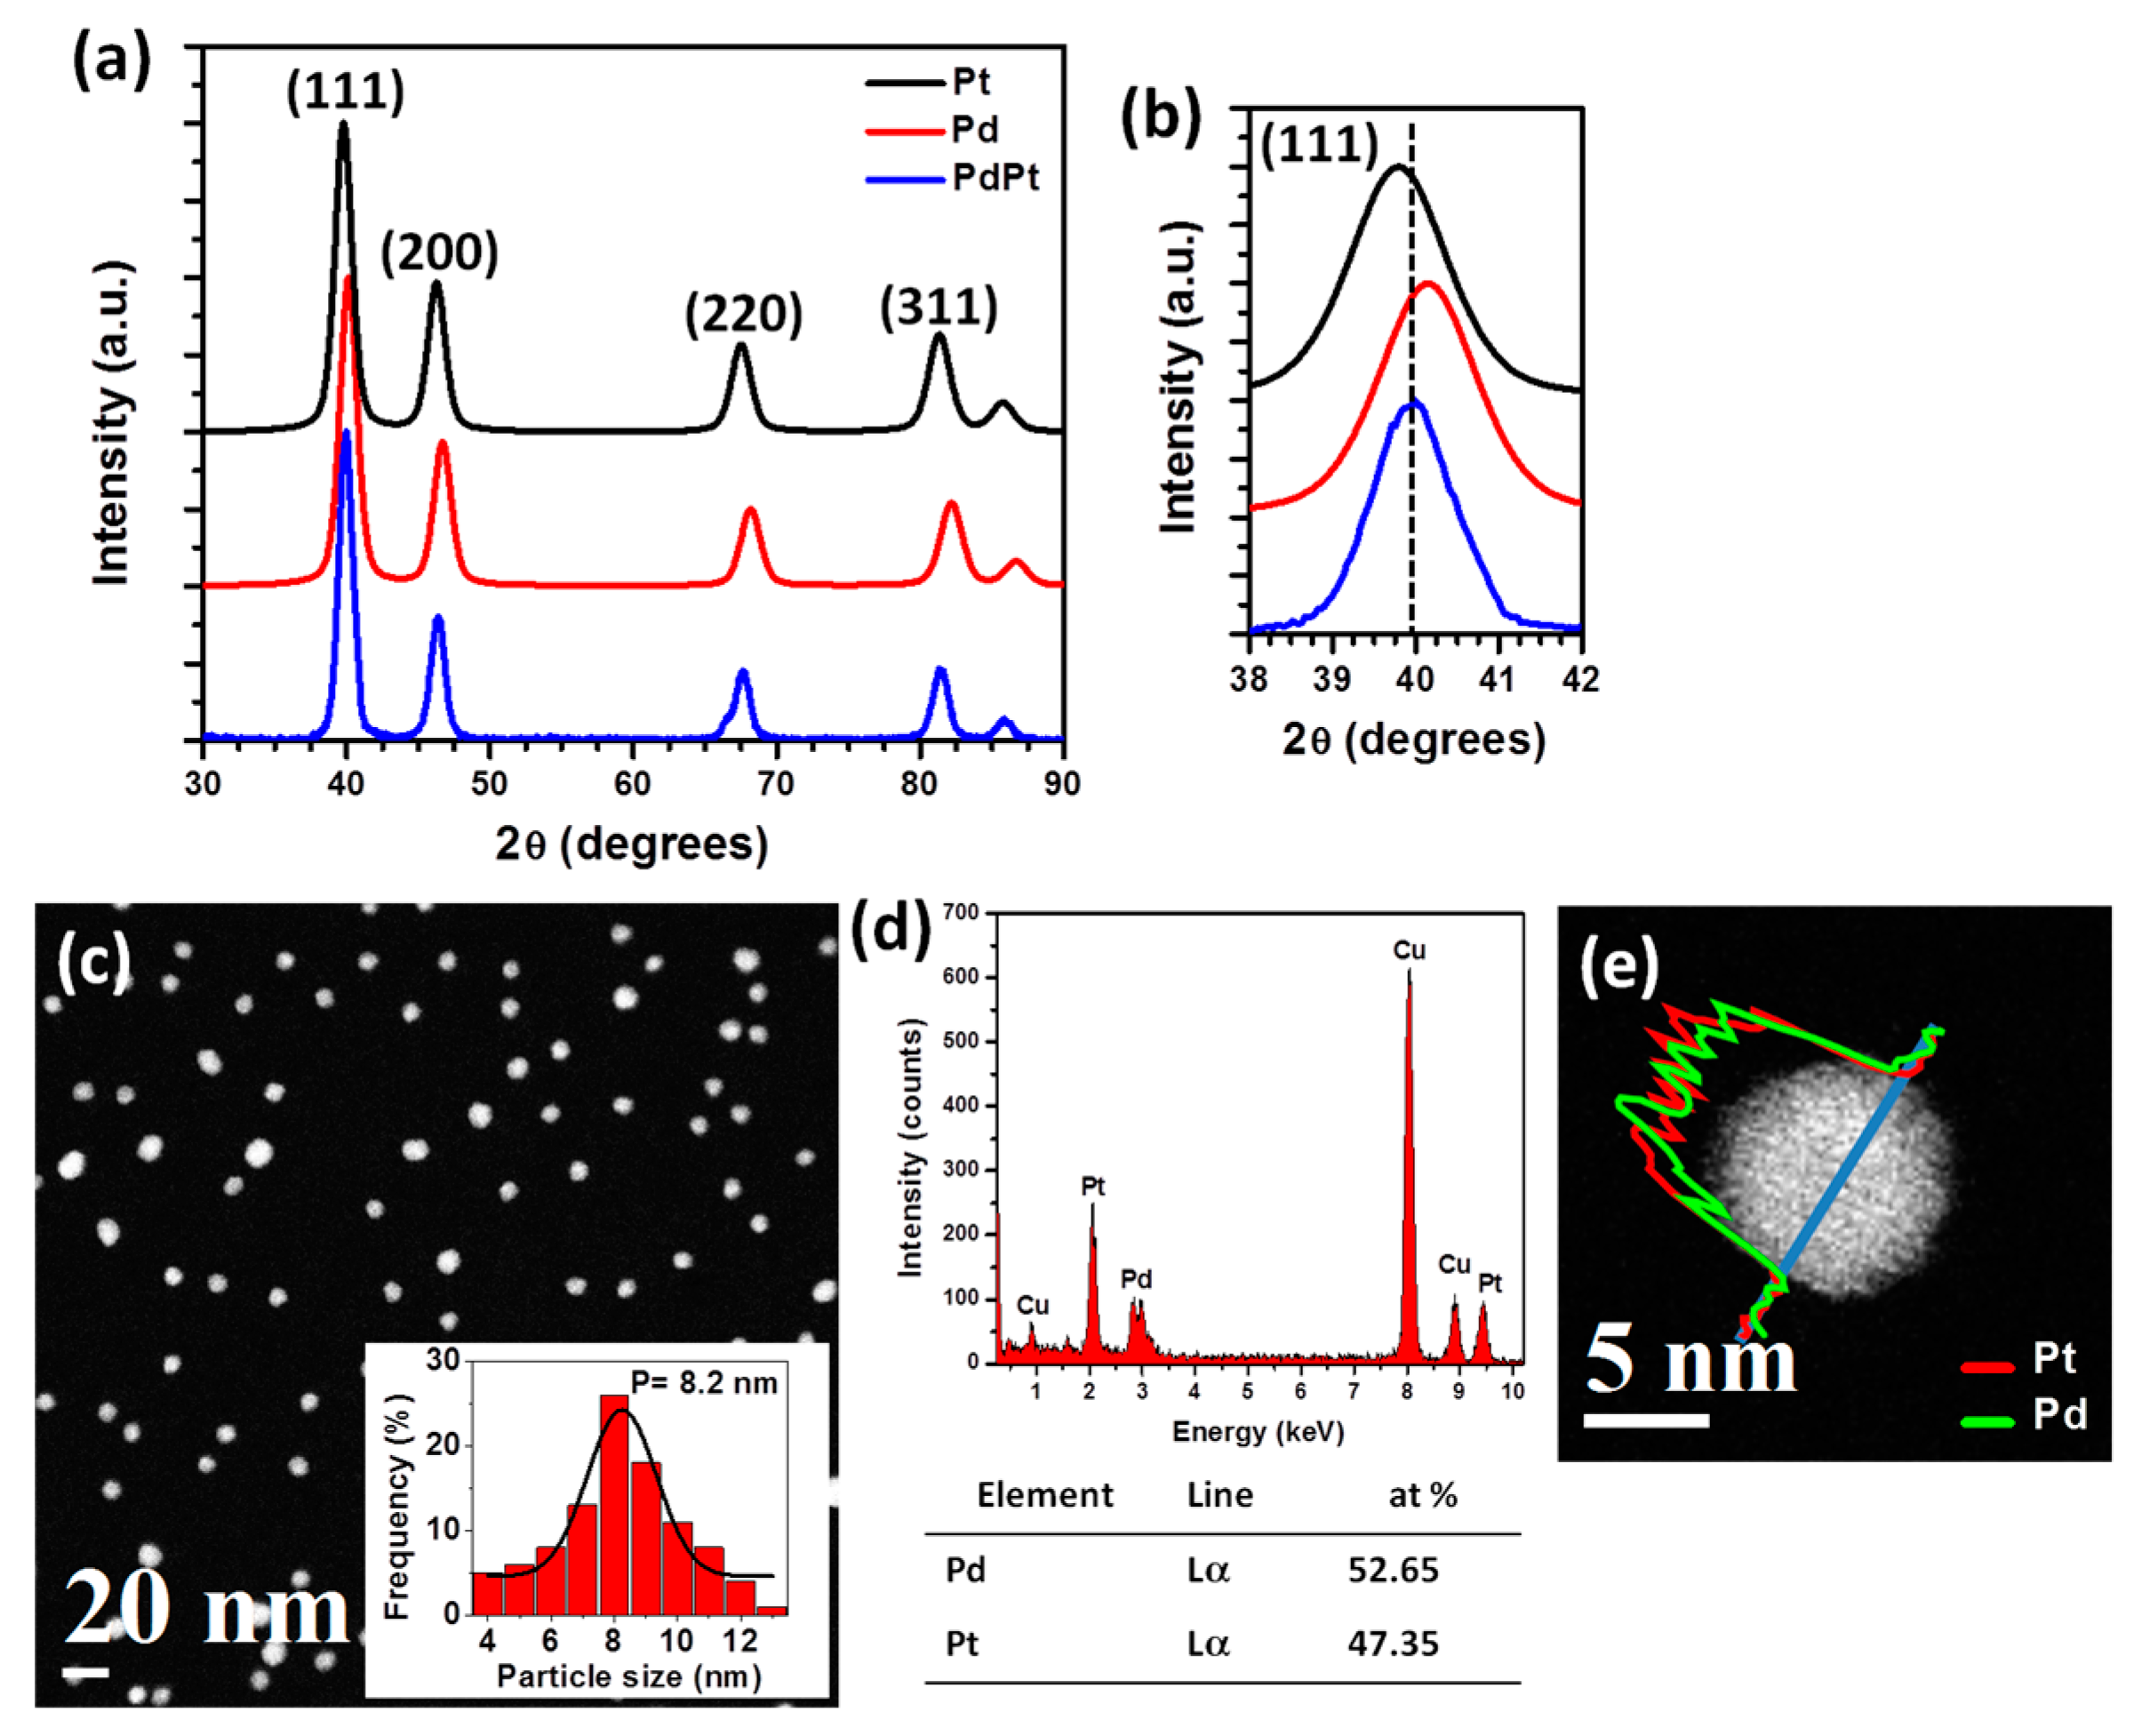
Figure 1a shows the XRD patterns of the Pt, Pd and PdPt nanoparticles. Indexing XRD patterns correspond to the face-centered-cubic (FCC) lattice of Pt (JCPDF 04-0802), Pd (JCPDF 46-1043) and PdPt alloy (JCPDF 65-6418) structures. Lattice parameters of Pt and Pd are close, 0.3923 and 0.389 nm respectively, while the parameter of PdPt, 0.3896 nm, is between those two values, although nearer of the Pd-parameter. Consequently, the reflection positions of the PdPt planes are different from those of the pure Pt and Pd elements, but they are between both of these. The analysis of the position of the diffraction peaks can help or orient to identify the structure of the bimetallic nanoparticles. As can be observed in the
Figure 1b, the position of the (111) Bragg reflection (or peak) of the PdPt is in 2
θ = 39.98°; this diffraction angle is between those of Pt (39.8°) and Pd (40.15°), it indicates an average lattice parameter as usually expected for an alloyed structure, that would be the structure of PdPt. The properties of polycrystalline materials depend, among other things, on the crystallite size. In the case of nanoparticles, the crystallite size is associate with the average nanoparticle size [
29]. The average crystalline domain size (t) of the bimetallic nanoparticles was calculated using the Scherrer equation [
30]:
where
λ is the X-ray wavelength in nanometers (nm),
β is the full width at half maximum of the diffraction peak in radians, and
K is a constant related to crystallite shape, normally taken as 0.9; the (111) diffraction peak of the XRD profile was used, leading to an average size of 8 nm.
Figure 1c shows a low magnification high-angle annular dark field of scanning transmission electron microscopy (HAADF-STEM) image of the PdPt bimetallic nanoparticles. As can be observed in the image, the nanoparticles showed a particle size distribution almost homogeneous, with an average particle size of 8.2 nm (inset plot); this value is similar to the obtained by XRD. Average particle size was calculated by using ImageJ program (v. 1.5), which is a free package for image processing and manipulation, the average particle size was measured assuming a spherical shape of the nanoparticles. It is very important to mention that coalescence of the nanoparticles was not observed, also the image shows a homogeneous contrast of the nanoparticles giving a confirmation of the alloyed structure; while contrast variation within a single nanoparticle is not observed, which is a key point for core-shell structure identification [
31].
Figure 1d shows the energy dispersive X-ray spectrum (EDS) acquired from the bimetallic nanoparticles showing both Pt and Pd peaks suggesting that both elements are present in the sample (Cu signal is from the copper grid). The atomic percentage of the Pd and Pt elements is about 52.65 at% and 47.35 at%, respectively. The compositional distribution of single bimetallic nanoparticle was obtained using EDS line scan profile. As described in
Figure 1e, the line profile shows that the intensity of Pt and Pd is the same. This result suggests strong evidence for the formation of a bimetallic PtPd nanoparticle.
As mentioned above, Pd, Pt and PdPt have almost similar lattice parameter. So that it is necessary a characterization technique that can give us more information, in this sense scanning transmission electron microscopy (STEM) is a technique that allows obtaining atomic information and, therefore, to understand the property-structure relationships.
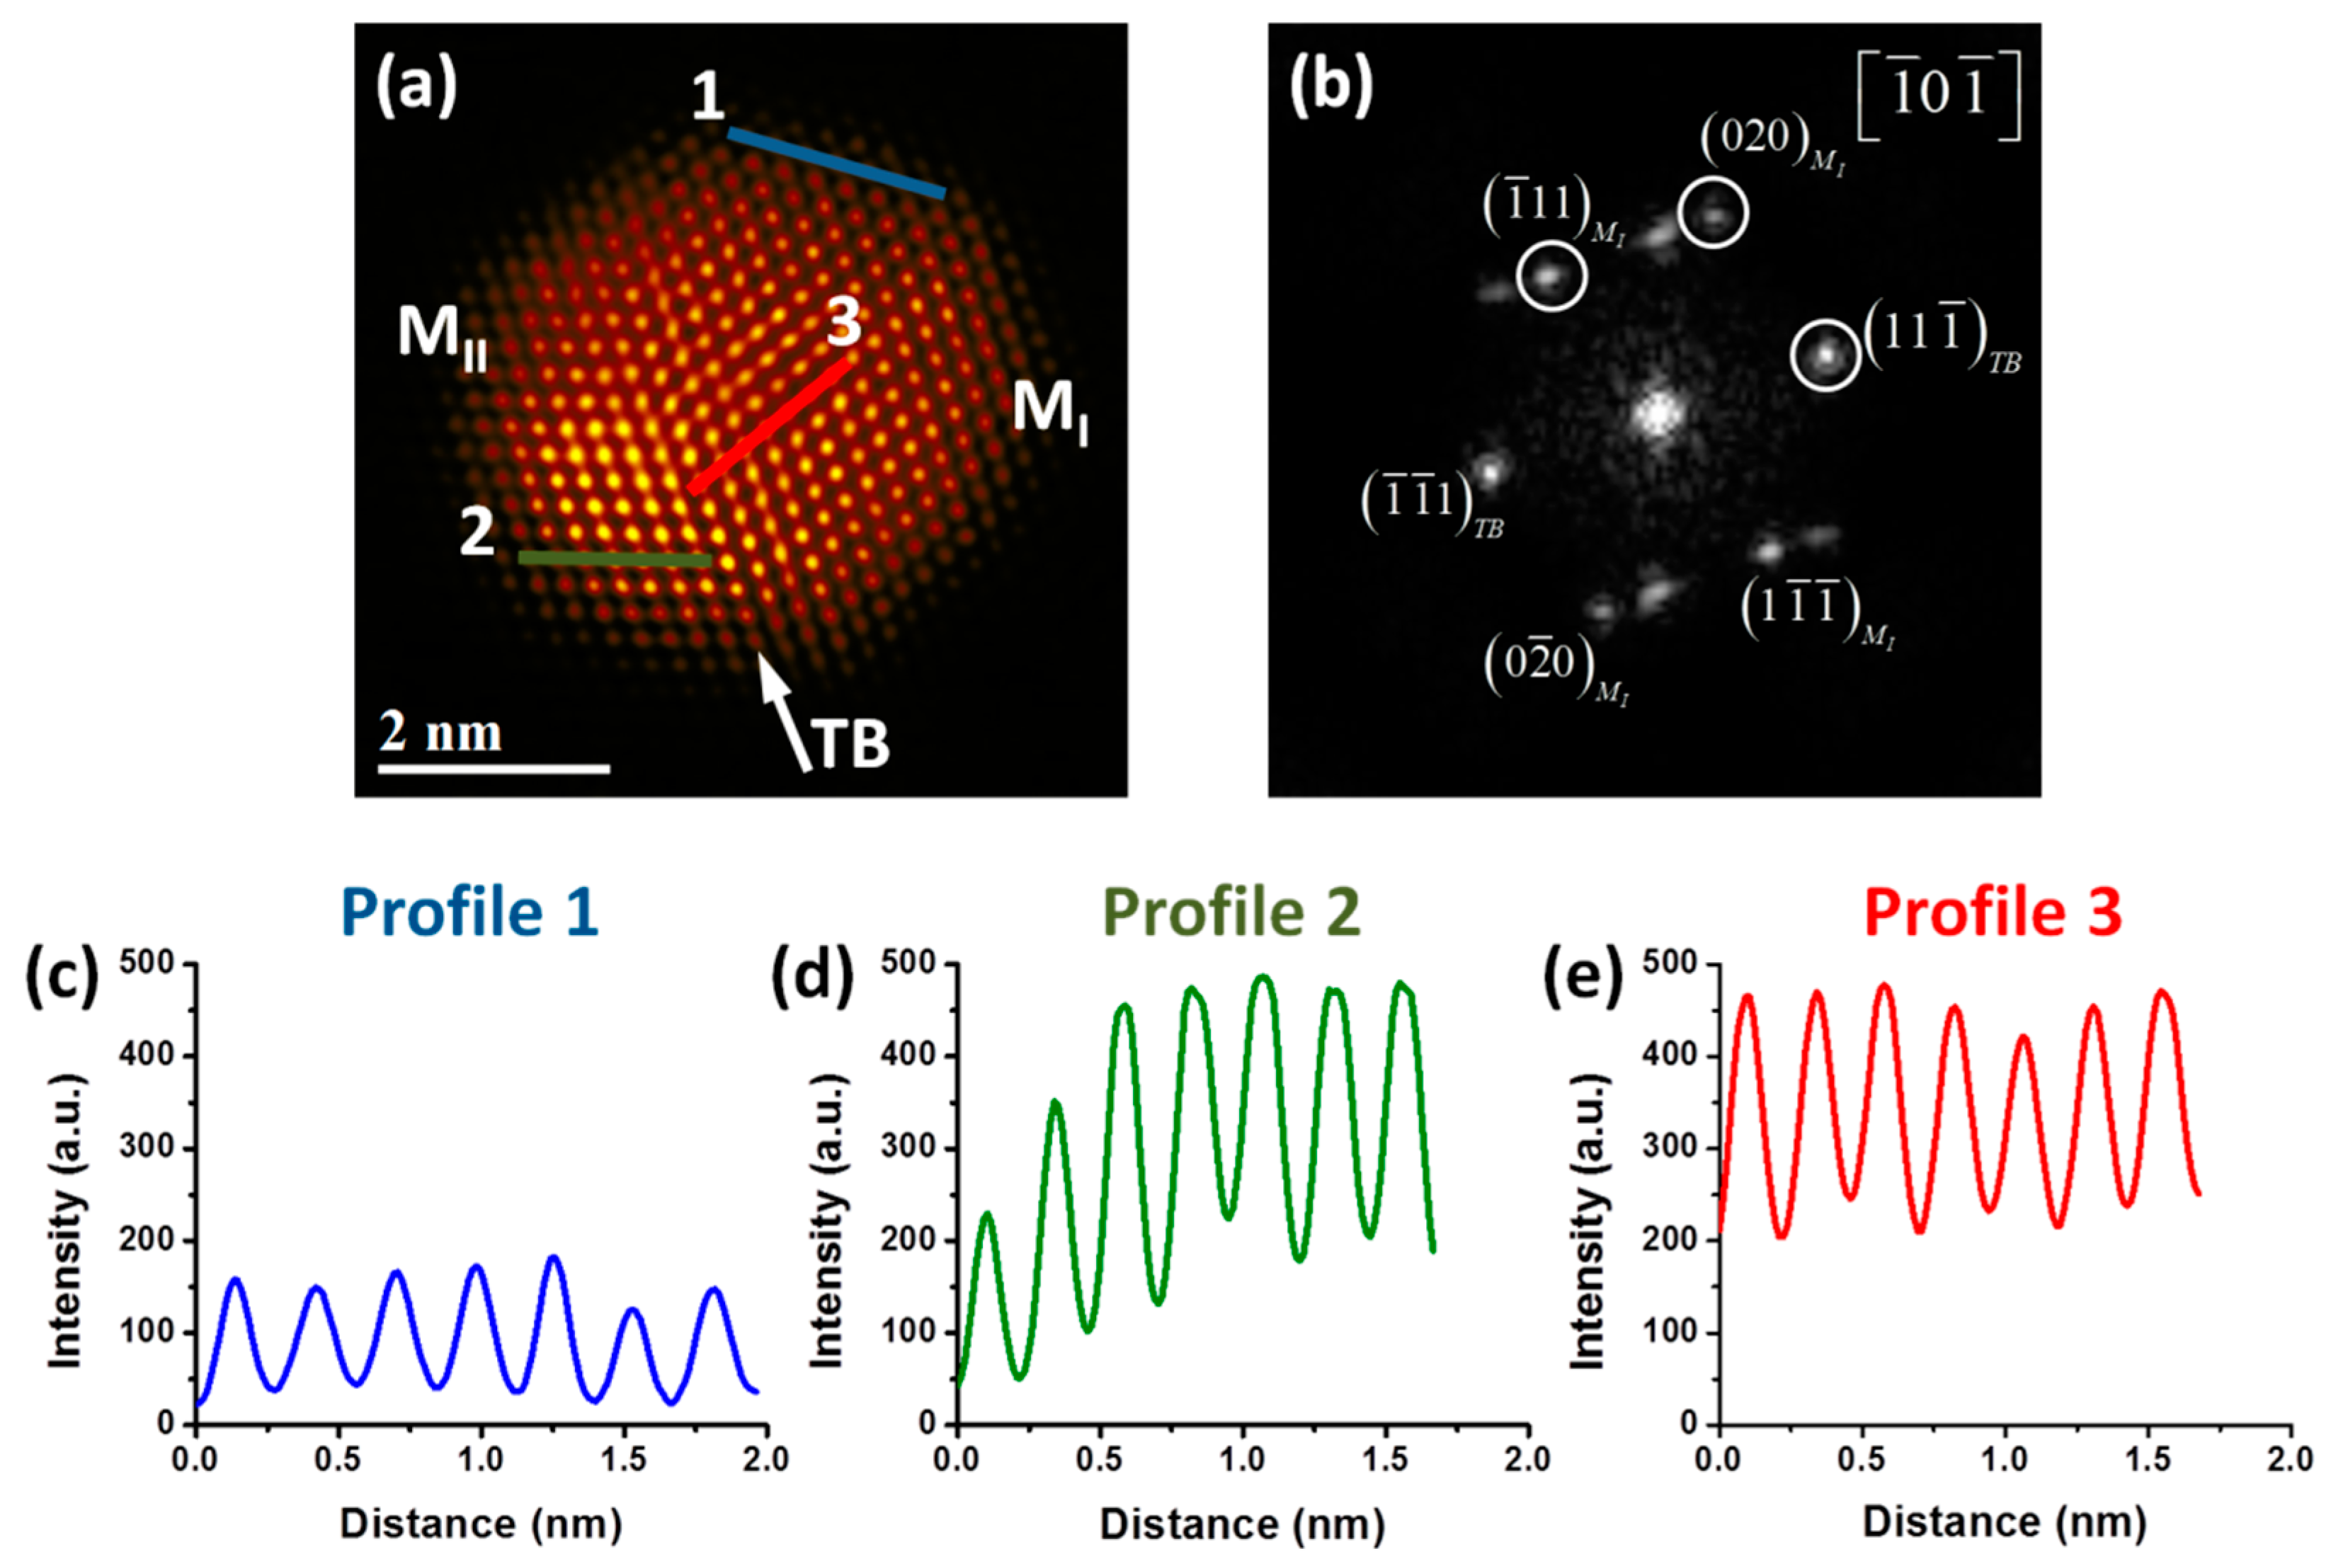
Figure 2a shows a high-resolution HAADF-STEM image of a PdPt bimetallic nanoparticle that displays two crystals (M
I and M
II) separated by a single twin boundary (TB), which causes perturbation of the nanoparticle surface and it can be indexed as the [111] plane. Fast Fourier transform (FFT), seen in
Figure 2b, shows a dual-spot diffraction characteristic of twinning, where d-spacings of M
I 0.2246, 0.2257 and 0.2018 nm were obtained, which correspond to (11-1), (1-1-1) and (020) crystalline planes respectively. Similarly, d-spacings of M
II 0.2311, 0.2257 and 0.2016 nm were obtained, which correspond to (11-1), (1-1-1) and (020) crystalline planes respectively. Therefore, the nanoparticle is viewed along the [-10-1] zone axis confirmed by the FFT. The presence of twining defects in the produced alloyed nanoparticles is also a key feature of the material, because they improve the catalytic activity in heterogeneous catalysis, and also tend to modify the facet types and proportions of surface atoms [
32]. Also, in
Figure 2a differences in contrast are clearly visible; an effect that is associated with the atomic number of the elements in the sample (Z contrast) in HAADF-STEM images [
33]. Therefore, the strong brightness zones of the image correspond to the heaviest element (Pt) and the low brightness zones correspond to the lightest element (Pd). To visualize better this contrast, Apply_CLUT (color look-up table) script was used in the image [
34]. As can be clearly observed from the figure, few regions are more intense than the others ones, indicating a smaller quantity of Pt atoms in the surface that Pd. The difference in intensity brightness is an indication of the presence of both Pd and Pt atoms at the surface. A study about the identification of the atoms in PdPt bimetallic alloy nanoparticles using HAADF-STEM images has been reported previously by our group [
35]. This study showed a semi-quantitative method to analyze the atomic distribution of the elements, which is dependent of their atomic number. Intensity profiles were performed to analyze the intensity brightness of the different atomic columns, and it is important to mention that the graphics have the same intensity scale for a better comparison. Intensity profile 1, seen in
Figure 2c, was measured along the M
I crystal of the nanoparticle. The intensity columns are uniform, indicating that the atomic columns are from the same type of atom, which according to the HAADF-STEM image could be associated with the Pd atoms. Intensity profile 2, shown in
Figure 2d, was measured along the M
II crystal of the nanoparticle, which shows more diverse intensity columns than profile 1: the difference in intensity among the first and last columns is higher, indicating clearly that some columns are Pt rich compared to other ones, and that the Pt atoms are not uniform in the surface. This behavior is the result of Pt rich columns, which appear much brighter in the image, and with more intensity scale in the graphic. Intensity profile 3, shown in
Figure 2e, was measured in the middle portion of the nanoparticle (M
I crystal). In this profile, the intensity columns are almost uniform and higher, indicating that in this zone there are mainly Pt rich columns.
The above results show that there is high amount of Pd atoms in the particle surface; however, to get more information about the surface atomic segregation phenomenon, molecular dynamics simulations were performed. As it is known, for investigating the melting behavior of a nanoparticle there are different criteria to identify the phase transition temperature from solid to liquid state. One of them is the variation of the potential energy with temperature, which has been used for calculating the melting points of each nanoparticle.
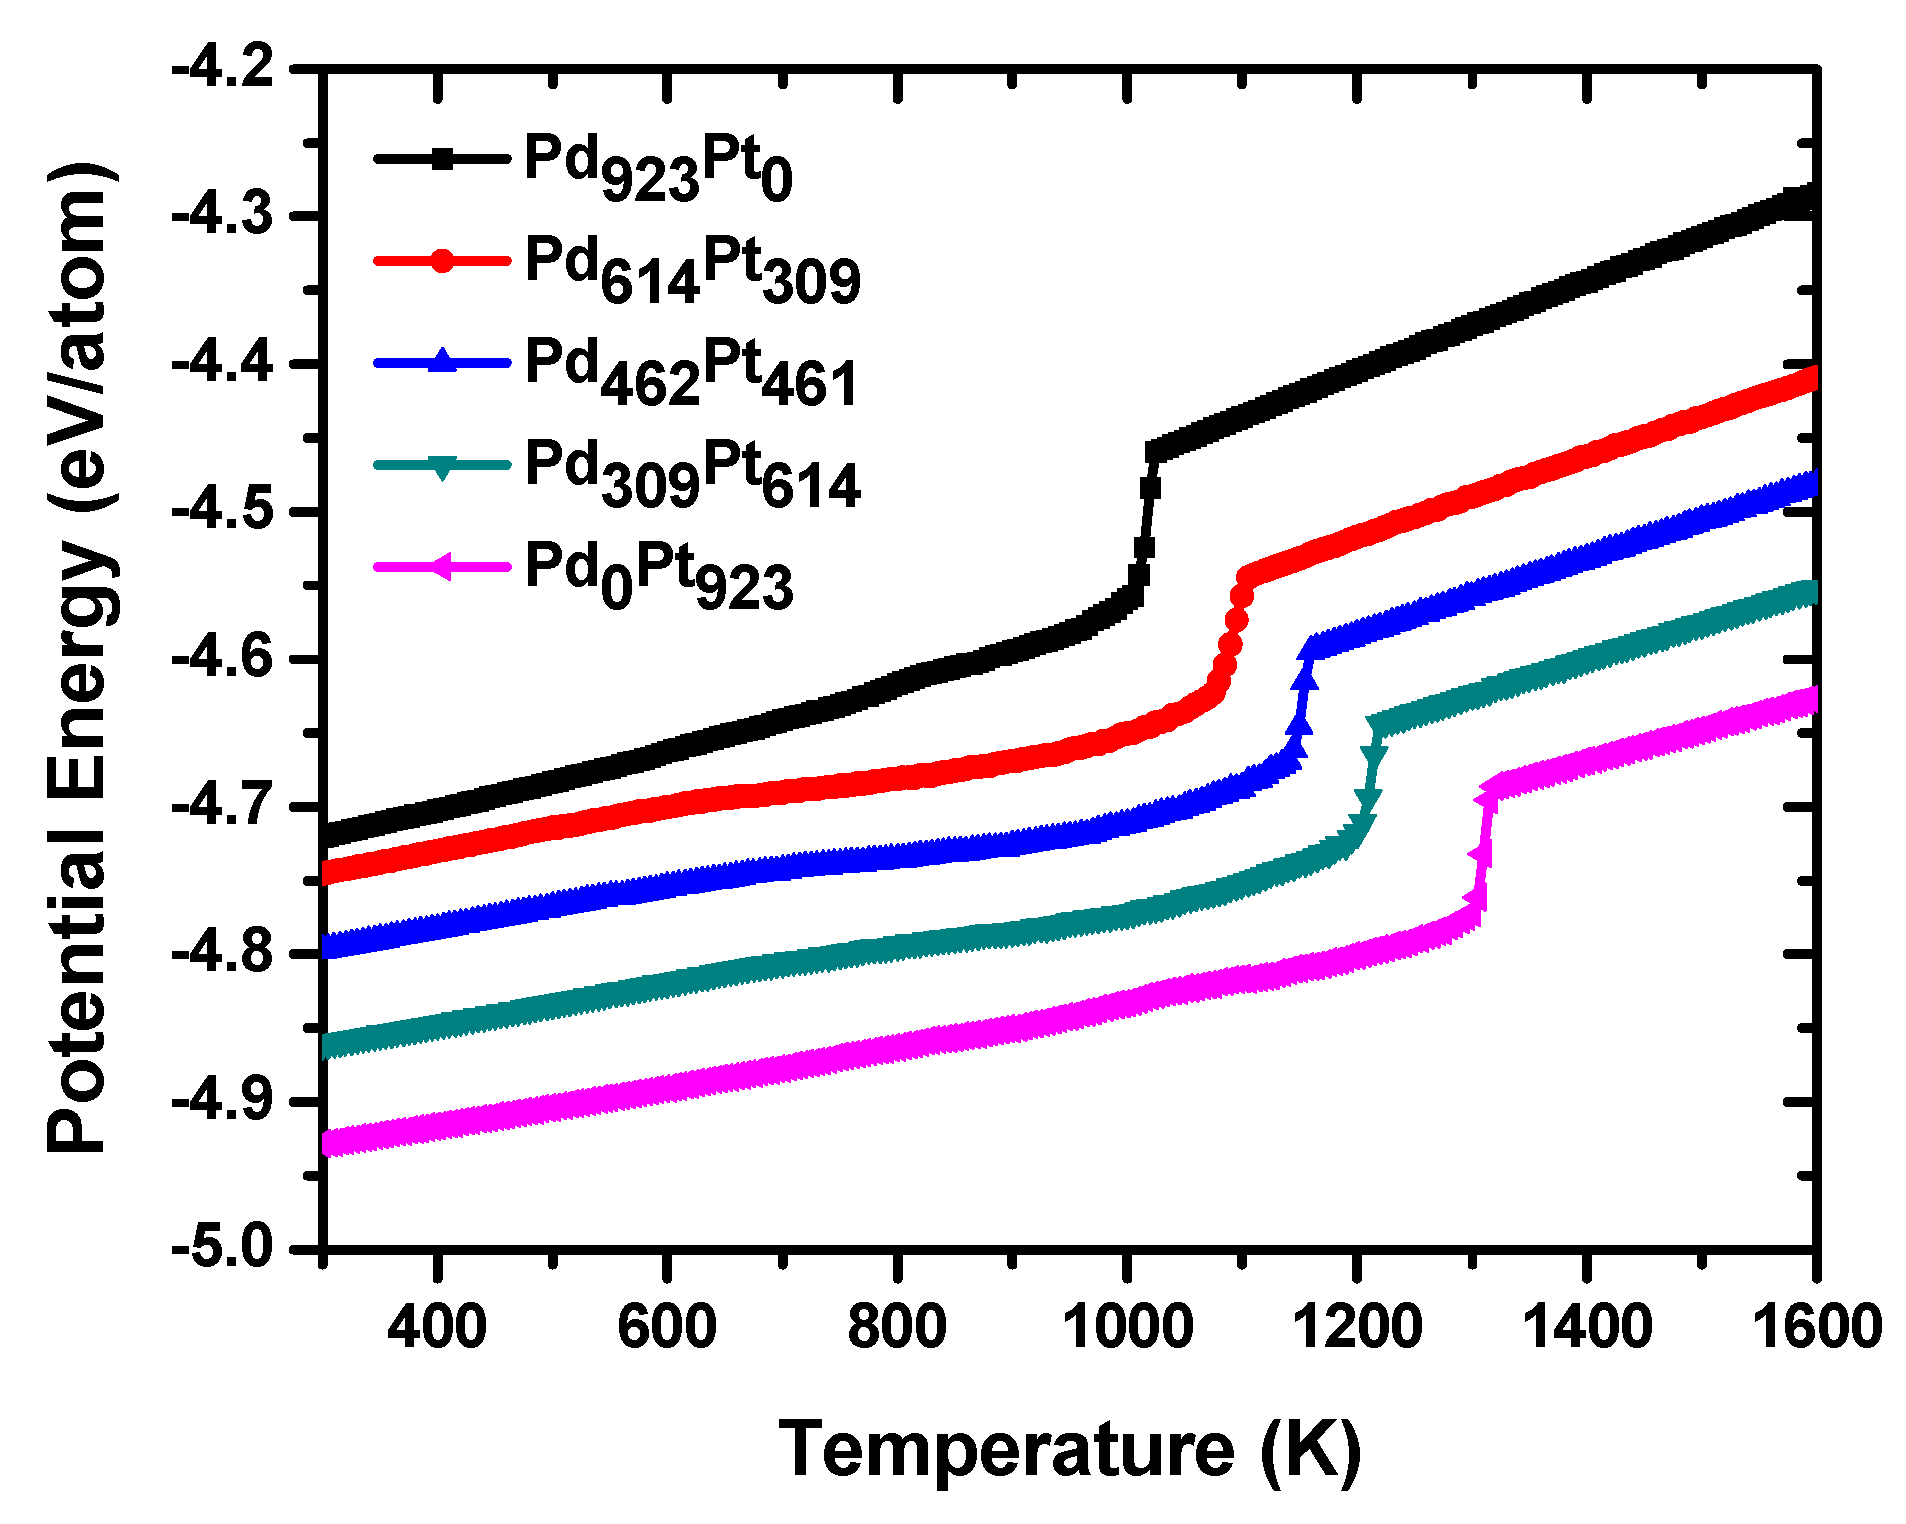
Figure 3 shows the dependence of the average potential energy versus temperature for the PdPt (2:1), PdPt (1:1) and PdPt (1:2) alloyed bimetallic and Pd
923 and Pt
923 monometallic NPs during the heating process from 300 to 1600 K. Two important features stand out in the figure: both the thermal stability and the melting points of the nanoalloys increase as the Pt content increases and on the other hand, the three nanoalloys are more thermally stable than the Pd nanoparticles, but have a less thermal stability than Pt
923. As the heating process develops, all nanoparticles exhibit a line arity period in their potential energy curves which is different for each structure and depends significantly on the atomic composition. In the case of monometallic systems, this period of linearity is somewhat longer than in the case of nanoalloys and has slight oscillations before the occurrence of the solid-liquid phase transition. The fact that the linear stage in Pt is larger than in Pd nanoparticle can be explained by the fact that the first nanostructure is thermally more stable than the second one as it is known from previous reports [
19,
36] and consequently that a greater amount of thermal energy is required to melt the particle. As will be seen later, these small oscillations in the curves of potential energy obey to slight morphological and structural changes in the particles, which do not affect much to their original structure. As expected, in the case of bimetallic systems this period of linearity increases as the content of platinum increases in the nanoalloys because the latter element is more stable than palladium; therefore, of all nano-alloys, those that are richest in platinum are the most thermally stable. In these periods of linearity both nanoalloys undergo almost imperceptible structural transformations, so that their morphologies are almost identical to those of the original structures at 300 K. After this stage, an important period of non-linearity occurs for each of the nanoalloys; in these periods the slopes of curves are changing continuously until a sudden increase in the potential energy occurs. The melting point of each nanoparticle can be identified from its corresponding caloric curve; that is, the temperature value at which a sudden increase in potential energy occurs. From the figure, it can be seen that for Pt
923, the melting temperature (1304 K) is higher than that of Pd
923 nanoparticle (1010 K), and these temperature values are less than the corresponding bulk melting points [
37,
38]. The period of nonlinearity is longer in the nanoalloys that have a higher content of palladium and plays a very important role during the melting process because in it, the Pd atoms begin to diffuse towards the surface of the particles. In the same way, and as it will be corroborated later, both nanoalloys do not undergo significant structural and morphological changes until temperatures close to the melting point are reached; here, nanoparticles begin to undergo strong structural transformations, beginning a superficial premelting phenomenon, and the crystalline lattice begins to be destroyed. Because the phenomenon of melting starts from the surface and evolves into the inner of particles, those structures whose surface is richer in Pd atoms melt at lower temperatures since the latter has a surface energy lower than that of Pt. This fact explains why those structures that are richer in Pt atoms show a shift to the right at their melting points, getting closer and closer to the melting temperature of the pure Pt nanoparticle. During the stages of surface premelting and melting transition, an interesting phenomenon occurs in all nano-alloys: Pt and Pd atoms are exchanged and a considerable number of atoms are in a liquid-like state, i.e., there is a significant contribution of the atomic anharmonic motion. Temperature values that are very close to the melting transition temperatures can be considered to be like the limit points for the stability of crystalline matrix in each nanostructure and for temperatures above these values, the last begins to be destroyed. While on the one hand, the Pd atoms are migrating towards the surface of particles, on the other, the Pt ones diffuse towards their inner cores taking place the phenomenon of intermixing. Once the melting transition is completed, all the particles are in liquid state and remain so until the completion of the heating process at 1600 K.
For the case of bimetallic NPs, melting points for both nanoalloys are the following: 1087 K for PdPt (2:1), 1140 K for PdPt (1:1), and 1200 K for PdPt (1:2), and each one is included between the values corresponding to the monometallic systems. However, the significant differences observed in melting points could be explained not only by considering the number of atoms of each species in nanoalloys, but by the way in which the Pd and Pt atoms are distributed in the clusters.
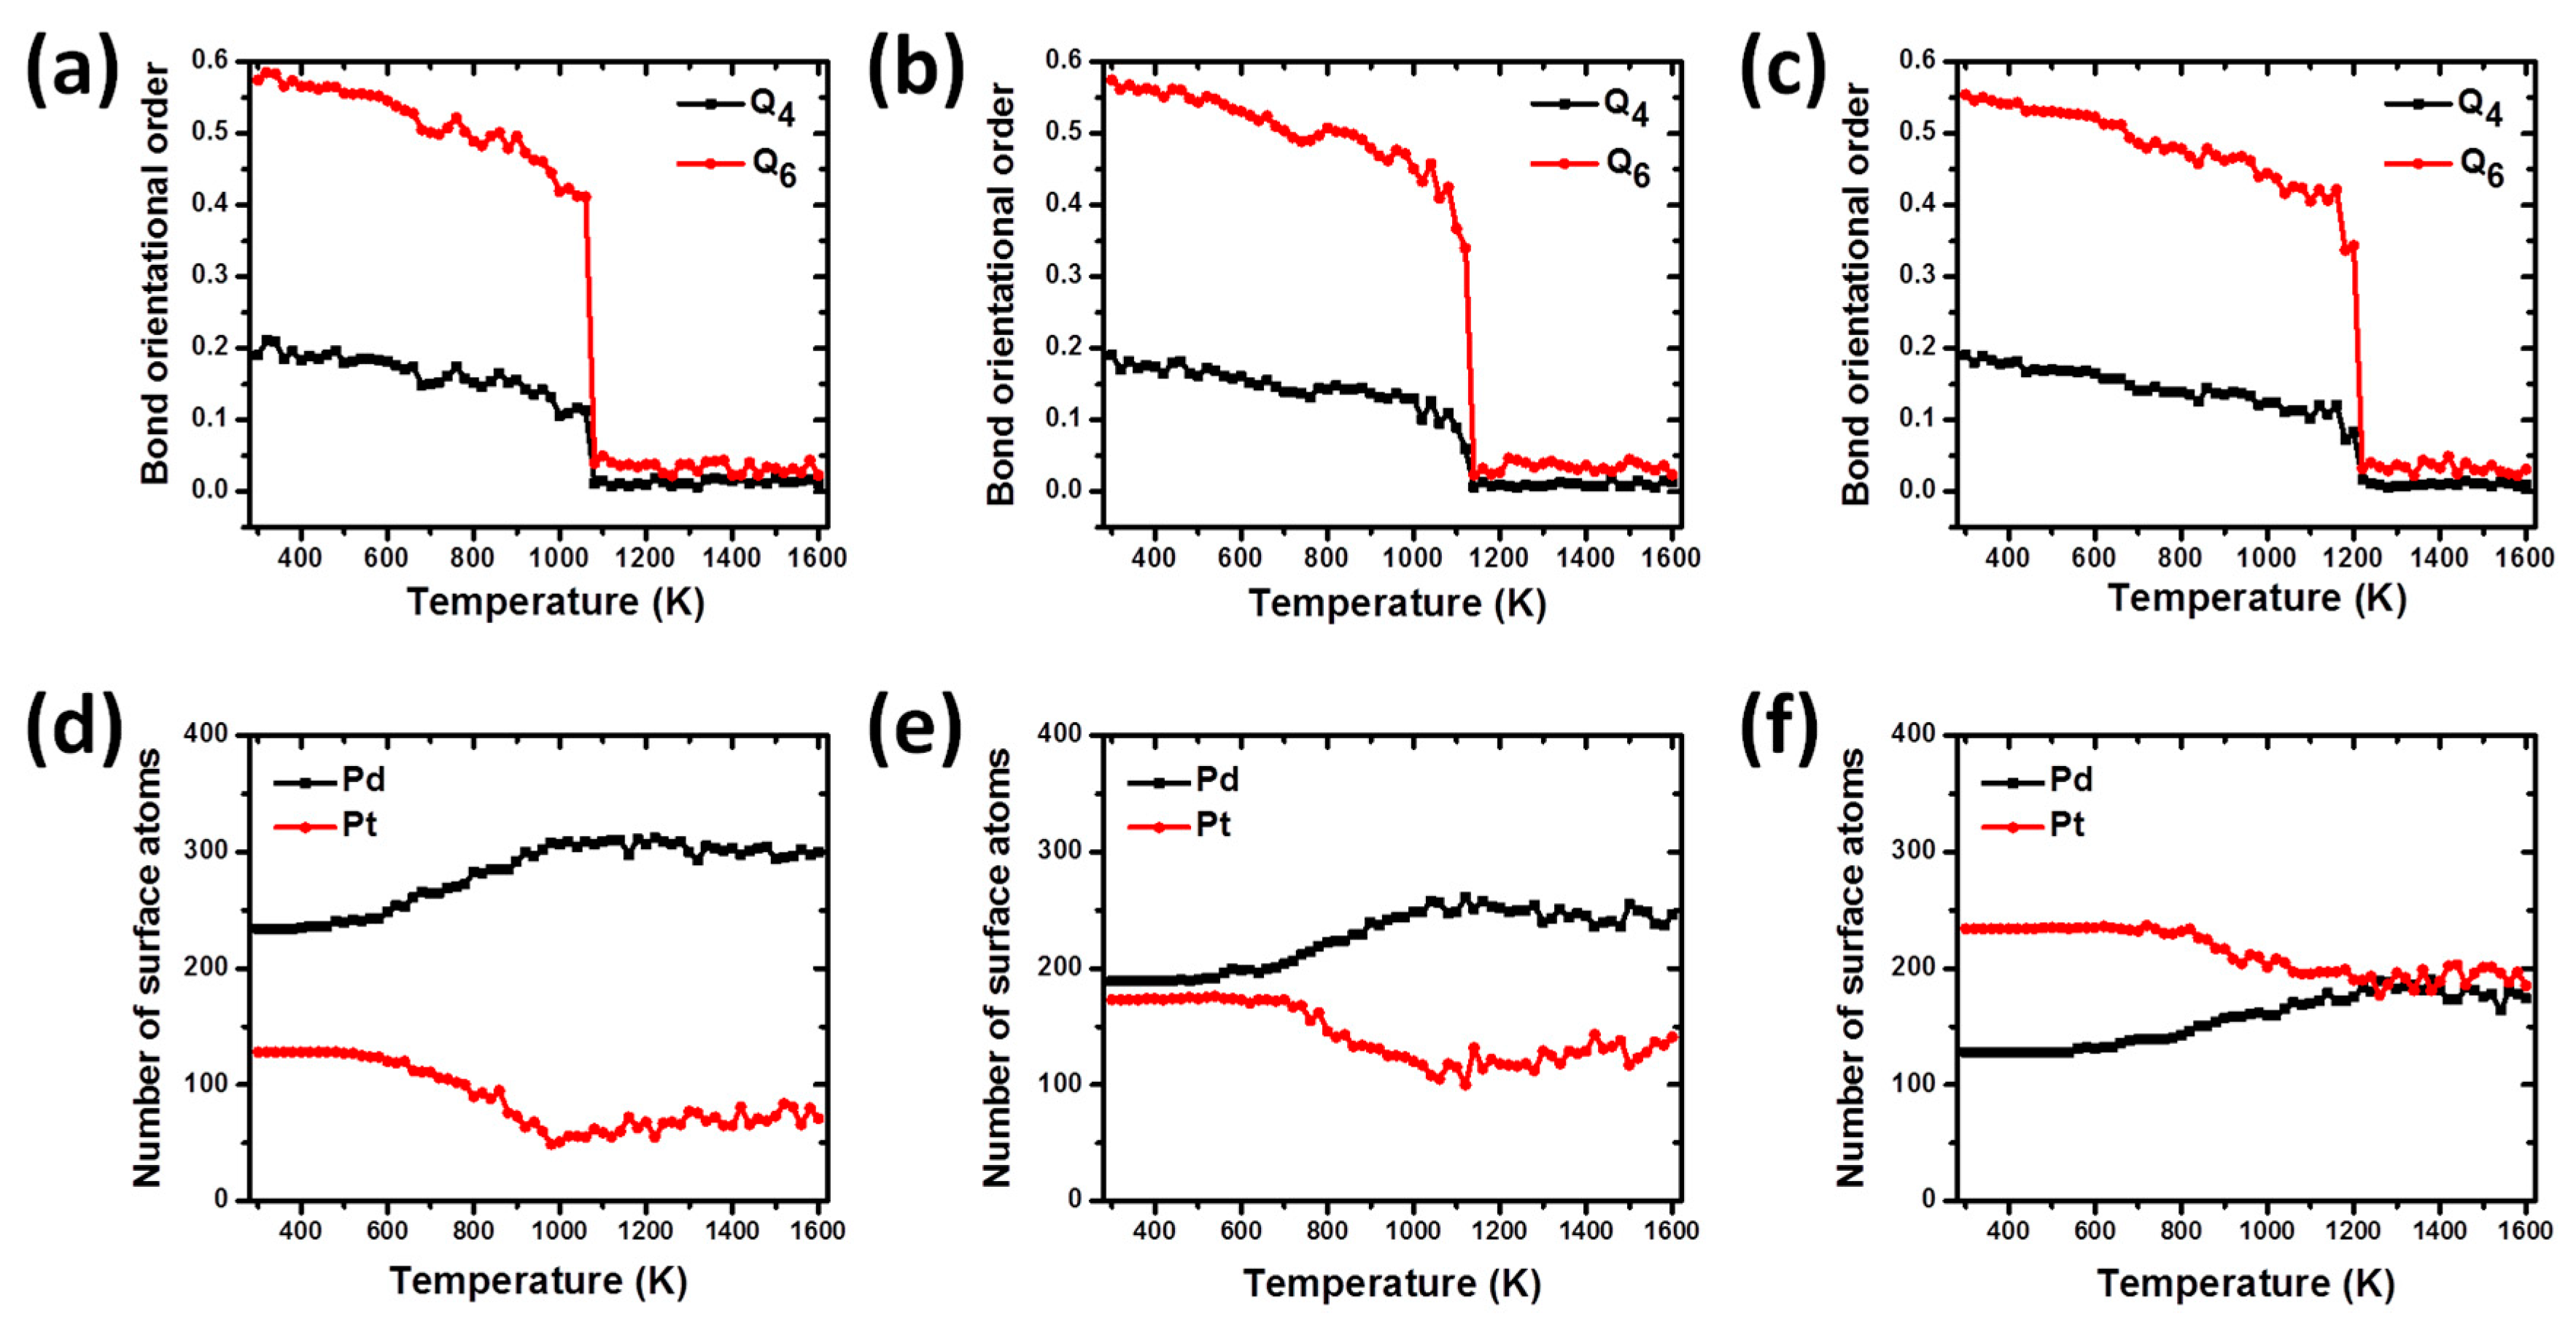
Figure 4 shows both the temperature-dependent global bond order parameters
Q4 and
Q6, and the number of Pd and Pt surface atoms for the Pd-Pt-alloyed bimetallic nanoparticles. All the values shown in plots were theoretically calculated for each nanostructure upon heating process. The calculation of global bond order parameter is a very useful method to investigate the structural evolution of nanoparticles [
28]. As it is known, there are several criteria to identify the local and global orientation symmetries of clusters. One of these criteria is the bond order parameter method [
39], which is very useful to analyze and get information about the cluster structure as well as to distinguish between atoms in solid (close packed) and liquid states originated during melting processes. It is not only a sensitive indicator of the melting transition, but also a measure for identifying the structural change of nanoparticles upon heating and freezing processes. The global order parameter
Ql, is defined as:
where:
N is the total number of atoms in the particle,
Nnb(
i) is the number of first neighbors for the
i-th atom, and
q6m(
i) measures the local order around the
i-th atom considering the average of the spherical harmonics
Y6m of the bonds with the
Nnb(
i) neighbors:
Before starting the relaxation and simulation of nanoalloys, the values for the bond order parameters
Q4 and
Q6 were calculated for the designed models, obtaining a good agreement with the values reported for ideal structures [
28]. As can be seen from the
Figure 4, the bond order parameter curves for the bimetallic nanoparticles show a slight decrease from 300 to 1060 K for PdPt (2:1), as seen in
Figure 4a, 1080 K for PdPt (1:1), shown in
Figure 4b, and 1160 K, as seen in
Figure 4c, for the PdPt (1:2) nanoparticles. These results show that in this temperature range, the structures do not show significant structural changes and the nanoparticles are experiencing contractions and expansions around their centers of mass. At this stage, slight oscillations are observed in each of the curves and generally they can be attributed to the fact that all atoms are experiencing chaotic and disordered movements due to excess thermal energy absorbed by the systems. However, after the mentioned temperatures, a rapid and sudden drop in these values occurs until the phase transition temperature from solid to liquid is reached. During this solid-liquid transition particles undergo strong changes in their morphology and are in an amorphous state. The last temperature values are in good agreement to those observed in the caloric curves, where they were identified as the melting points for both nanoparticles.
One of the methodologies used to investigate the atomic segregation on the surface of Pd-Pt alloyed nanoparticles is the “cone” algorithm [
28] which is based on identifying the number of atoms on the particle surface from their geometric positions. The dependence of the number of Pd and Pt atoms on the surface particles as a function of temperature can be observed in
Figure 4. As can be seen,
Figure 4d shows that for the nanoalloy PdPt (2:1) there is a greater amount of Pd atoms on the surface in relation to those of Pt at the beginning of heating process. These Pd atoms remain all the time on the particle surface, while those in the interior keep on migrating to the surface during the premelting stage, which is longer than in the case of the alloy PdPt (1:1) and PdPt (1:2). It is known that the melting phenomenon starts in the surface and evolves towards the interior of the particle until it is completely melted. At this point, the structure begins to undergo considerable structural transformations and the phenomenon of atomic diffusion begins to occur, showing a clear tendency of the Pd atoms to segregate on the particle surface and in addition, of Pt atoms to diffuse towards its inner core.
A similar behavior is observed for nanoalloy PdPt (1:1), shown in
Figure 4e, in the variation of the number of the atomic species on the particle surface: the Pd atoms prefer to remain on the particle surface throughout the heating process. In this case, the amount of surface Pd atoms at the end of the heating process is lower than that observed in the alloy PdPt (2:1) (246 and 300, respectively); and this could be explained by the fact that the last nanostructure has the highest number of Pd atoms and this metallic species prefers to diffuse towards the surface of nanoparticles.
On the other hand, for the nanoalloy PdPt (1:2), seen in
Figure 4f, the number of Pd surface atoms on the structure is smaller than that of Pt ones, in a temperature range from 300 to 1200 K. In the temperature range from 300 to 800 K, the number of Pd and Pt atoms on the particle surface remains approximately constant at the values of 143 for Pd and 232 for Pt. In this temperature interval, the nanoparticle does not exhibit significant structural changes, retaining many of the distinctive features of the original structure. However, after 800 K and before 1200 K, an increase in the amount of Pd atoms on the surface can be observed as well as a decrease in the number of Pt atoms, until both atomic species have almost the same amount of atoms. The above results show that as temperature increases, the Pd atoms show a tendency to migrate towards the particle surface in all Pd-Pt bimetallic NPs. This behavior has also been observed in others Pt-based bimetallic systems where is necessary to anneal the sample at high temperatures to promote surface segregation [
1]. In addition, both Pt and Pd are totally miscible and their bulk melting temperature is 2045 K and 1827 K, respectively, so according to the segregation rules reported previously by G. Guisbiers et al., the segregated element is the one with the lowest surface energy, therefore Pd goes to the surface due to Pd having a lower surface energy compared to Pt [
40]. This evidence shows a trend of Pd atoms to segregate on the surface of nanoparticles and to remain there even after the completion of the heating process in correspondence with the results published in previous works [
19,
41], i.e., C. Fernández-Navarro et al. [
42] studied the dynamics of Pd-Pt nanoparticles in a process of heating until reaching the melting condition, and compared the melting process in an unsupported particle against that of a particle supported on a graphite substrate. Their results exhibited a local rearrangement of metal atoms near the carbon substrate in such a way that the metal lattice had a better match with the carbon substrate, and that the Pd atoms migrated to preferentially occupy the region in direct contact with the carbon substrate.
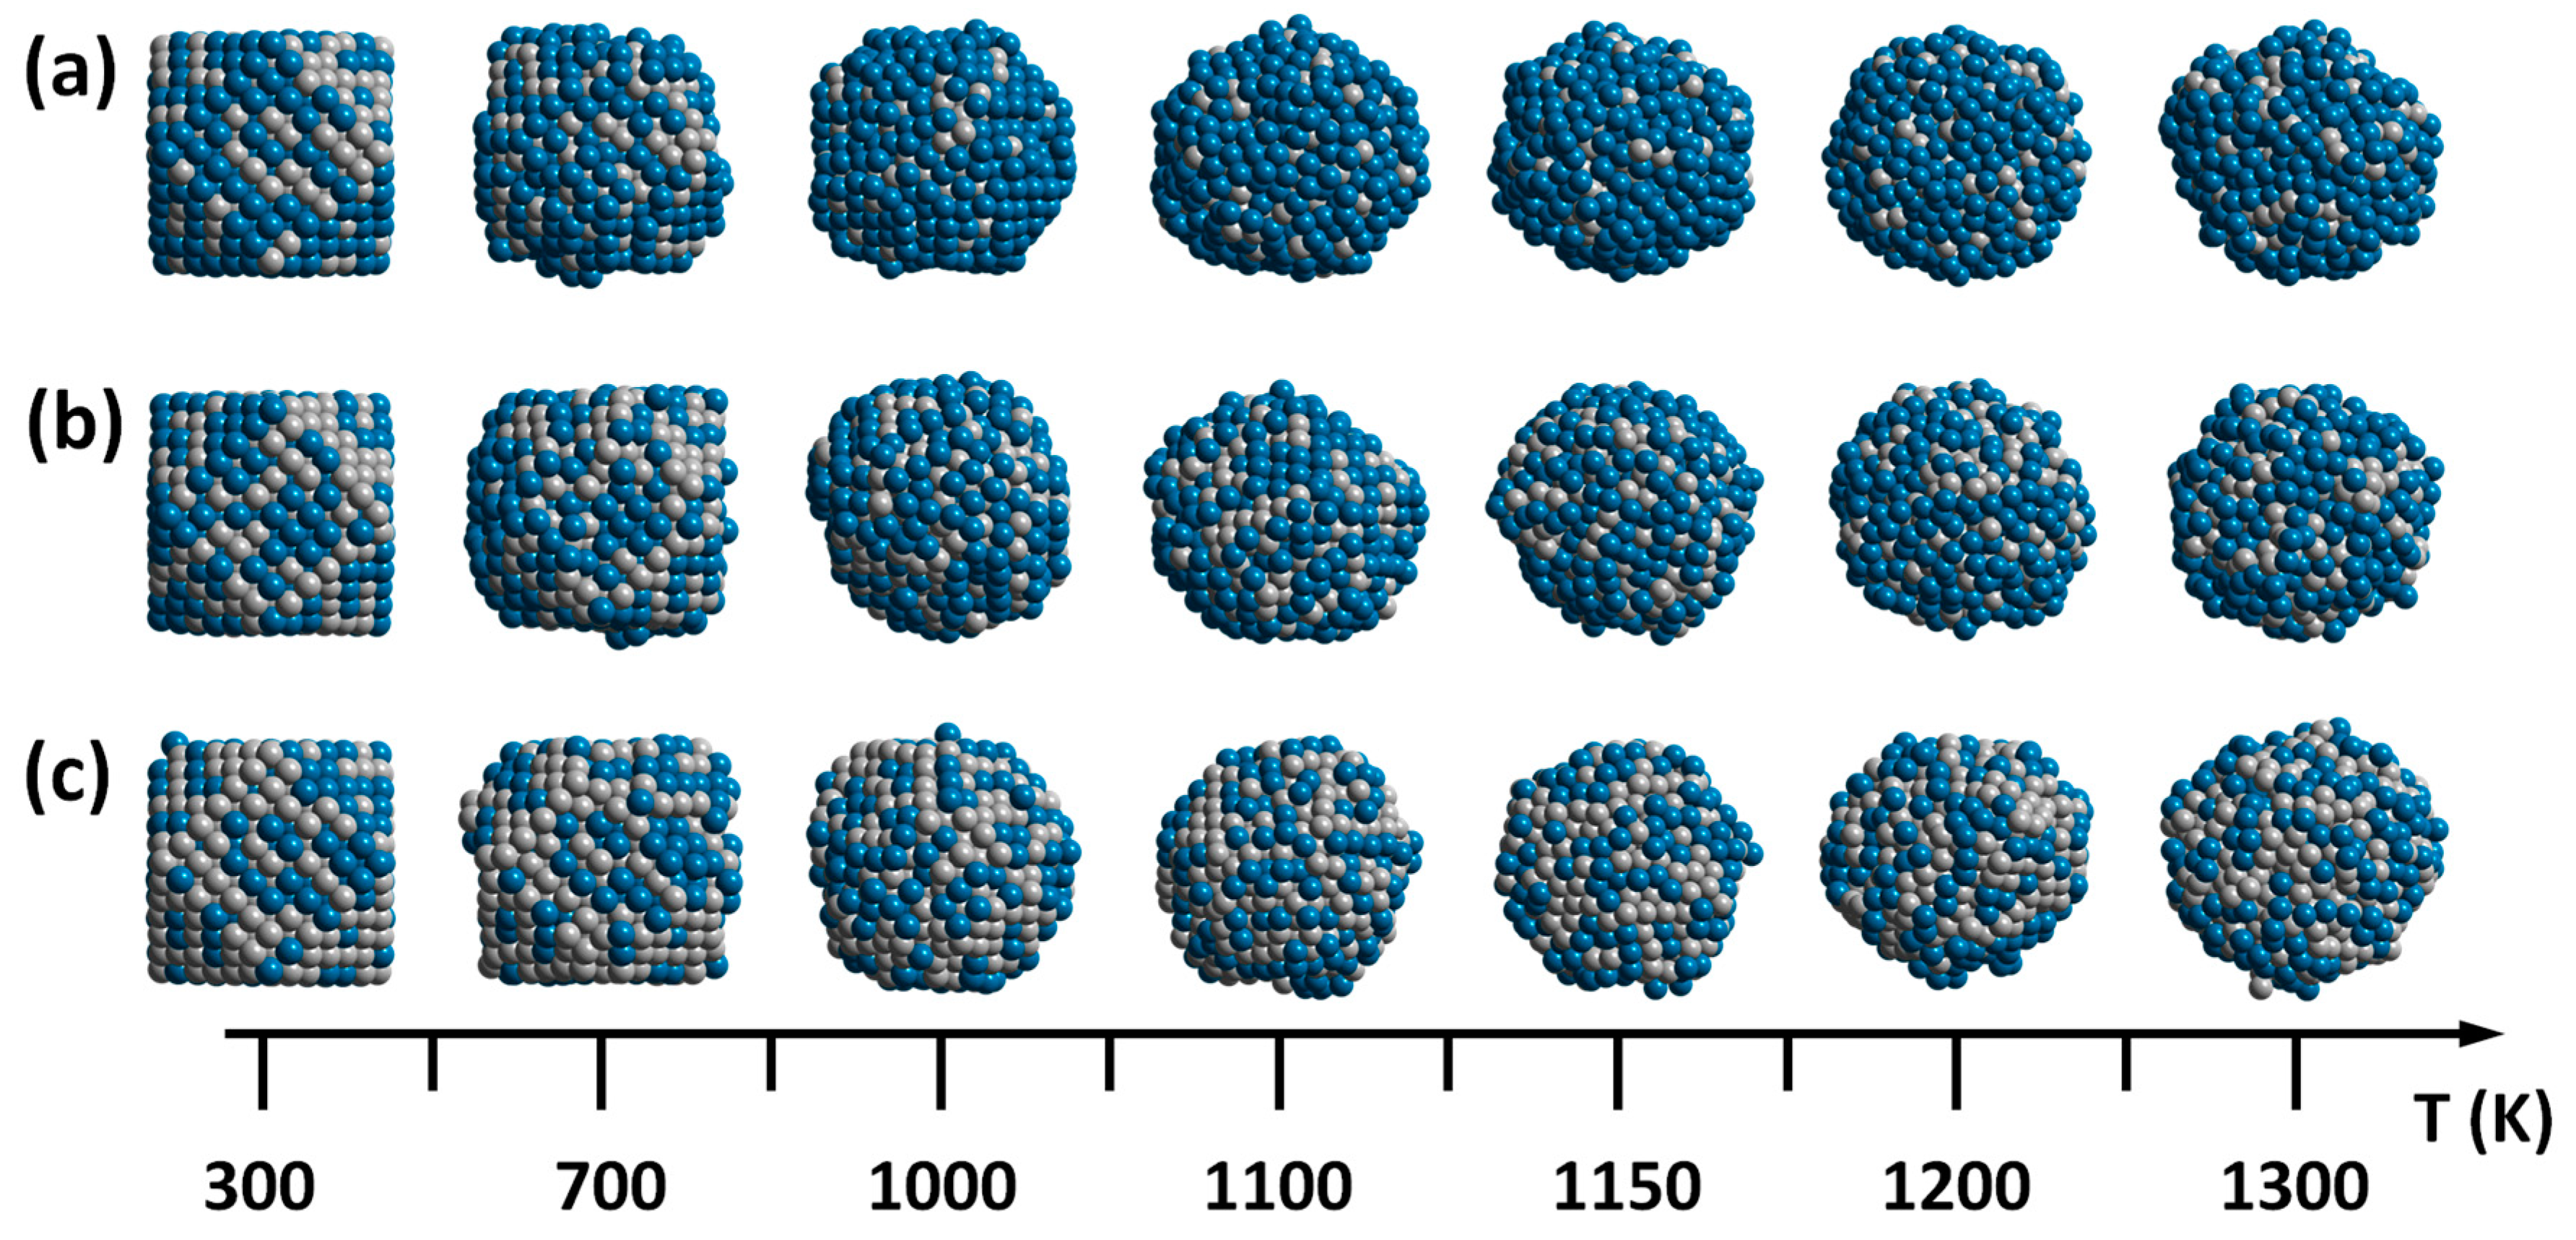
Figure 5a–c represents the final configurations after 1000 ps MD run of the PdPt (2:1), PdPt (1:1), and PdPt (1:2) nanoparticles at various temperatures, respectively. The bimetallic nanoparticles retain their initial cubo-octahedral structure at 300 K, which is bounded by {100} and {111} facets. However, it is clear from the figures that the evolution in the structure of the particles depends on the concentration of the components and the temperature. As mentioned previously, the PdPt (2:1) has a lower melting point than those of PdPt (1:1) and PdPt (1:2), which can be clearly observed from the configurations of
Figure 5, where the {100} and {111} facets of the nanoparticle remain almost without significant deformations between 300 K and a temperature below 1000 K; in addition this configuration tends to form a core-shell structure, due to the fact that Pd is enriched in the shell and therefore reduced in the core. The configuration PdPt (1:1), the {100} and {111} facets remain almost without deformation until 1100 K. In this case, less Pd atoms enrich the surface of these nanoparticles. In the configuration PdPt (1:2), the {100} and {111} facets remain almost without deformation until 1200 K and an alloy structure is formed in the surface of the nanoparticle with more Pt atoms. At the end of the heating process the nanoparticles have an amorphous structure, where the atoms can pack as close as possible, in order to maximize the cohesive energy.
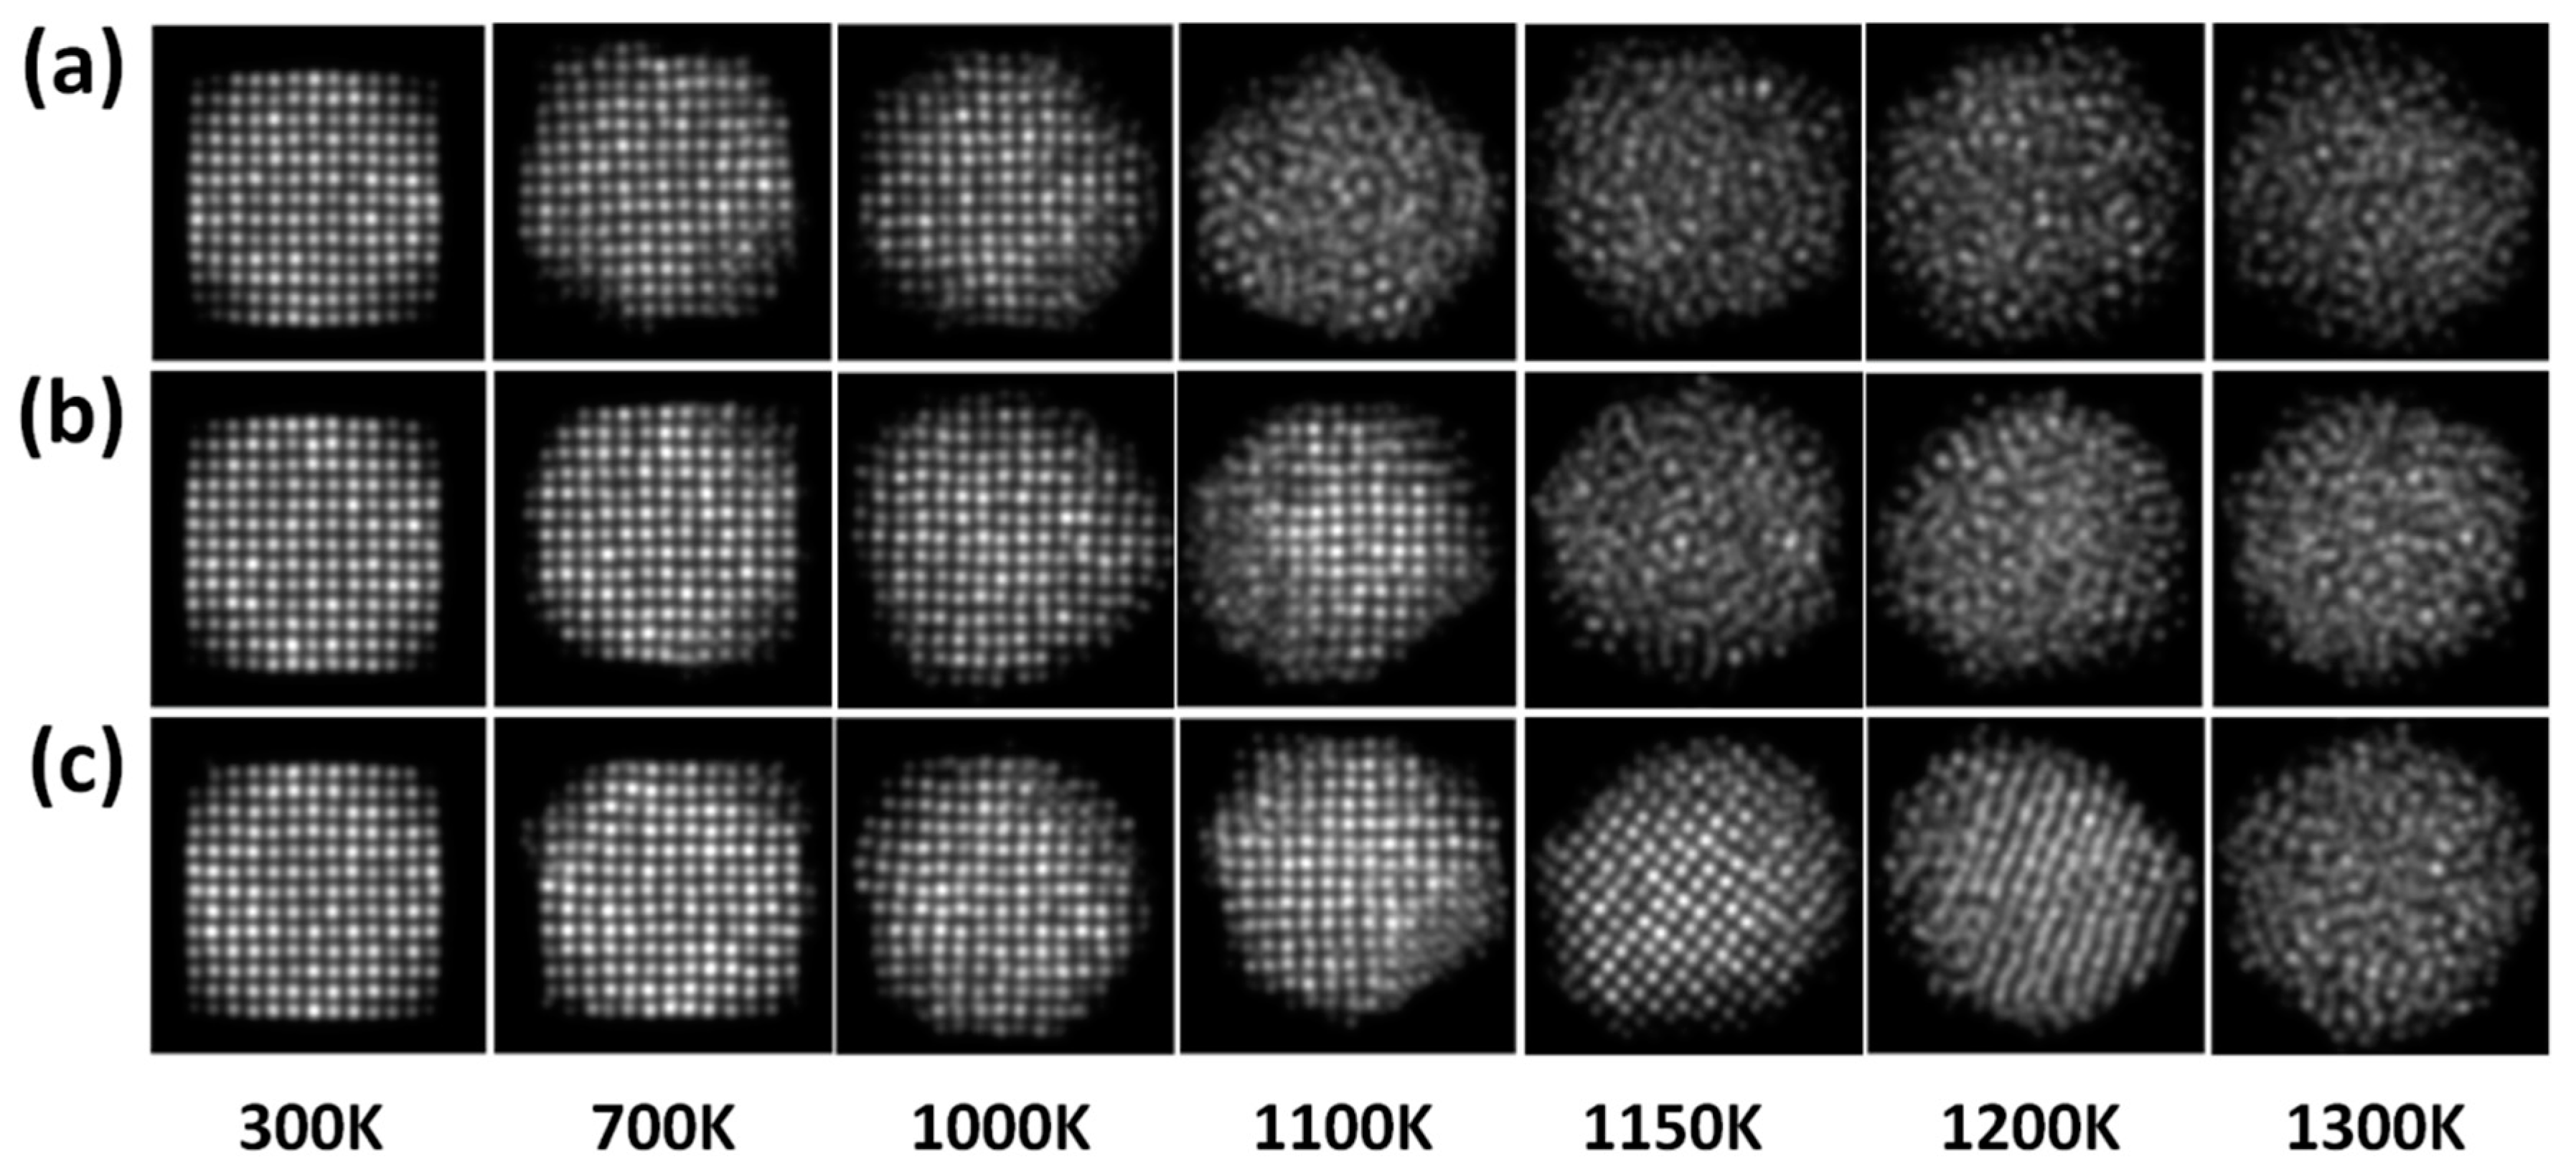
Figure 6a–c shows the simulated HAADF-STEM images of PdPt (2:1), PdPt (1:1), and PdPt (1:2) nanoparticles obtained at the same temperatures used for the final configurations as shown in
Figure 5. The simulated images were acquired using the optical parameters of the electron microscope. The aim of simulated HAADF-STEM images is to understand the effect of the contrast associate to the Pd and Pt elements (Z-contrast) and to analyze in detail the structure in the image. The images were recorded using the same intensity scale, with the purpose of comparing the intensity contrast among them. As can be observed from the simulated images, in all cases the intensity (brightness) contrast significantly decreases as temperature increases. As is known, the contrast in high resolution electron microscopy images is more sensitive to the crystallographic nature of specimens [
43], that is, in a crystalline specimen the intensity of the scattered electron beams has a maximum at certain specific angles due to the interplanar spacings. However, in an amorphous specimen, all the atoms are randomly distributed through its volume, so they are not really arranged inside it, but there are a few interatomic spacings that tend to occur in the amorphous structure. Therefore, a diffuse contrast is observed in the images [
44].
After the completion of cooling processes, significant surface reconstructions can be made for the final nanostructures at 300 K given that from the melted nanostructures a great diversity of structures could occur after the liquid to solid phase transition. Something important that must be pointed out is that after carrying out the cooling processes, of the total of simulated replicas, seven of them fell into FCC twinned-type bimetallic NPs while the rest ended in decahedral nanostructures.
Figure 7 shows the results obtained at 300 K after the completion of the cooling process (crystallization) for the PdPt (1:1) nanoparticle. In this work, only the results corresponding to the PdPt composition (1:1) are shown to have a greater similarity with the experimental results and consequently, a better comparison criterion.
Figure 7a shows the model of the PdPt (1:1) alloyed bimetallic nanoparticle. In the image, most of Pd atoms are located on the particle surface, and it was constructed from the calculation of the average of atomic positions of each metallic species at 300 K (ten samples were considered, as mentioned above).
Figure 7b shows the simulated HAADF-STEM image of model; to better visualize the contrast of the image, the Apply_CLUT (color look-up table) script was used. The simulated image displays some crystalline defect (twin boundary), which causes perturbation in the nanoparticle. FFT of the simulated image, as seen in
Figure 7c, shows a dual-spot diffraction characteristic of twinning and the nanoparticle is viewed along the [-10-1] zone axis.
Figure 7d shows the intensity profiles measurements over two directions; the intensity profiles show diverse intensities; this behavior is characteristic of Pd rich columns and Pt rich columns. Finally,
Figure 7e shows the atoms colored after a common neighbor analysis (CNA) using OVITO program (v. 2.9) [
45]; which is used to determine the local crystalline order of the bimetallic nanoparticles, to possibly identify dislocations, stacking faults, deformation twinning, and structural evolution [
46]. From the figure, green and red coloring represent atoms with an FCC and HCP (twinning) stacking, respectively. As can be observed there is good agreement between the experimental and the simulation results.

 ,
, 


