A Study of the Effect of 2 at.% Sn on the Microstructure and Isothermal Oxidation at 800 and 1200 °C of Nb-24Ti-18Si-Based Alloys with Al and/or Cr Additions


Abstract
1. Introduction
2. Experimental
3. Results
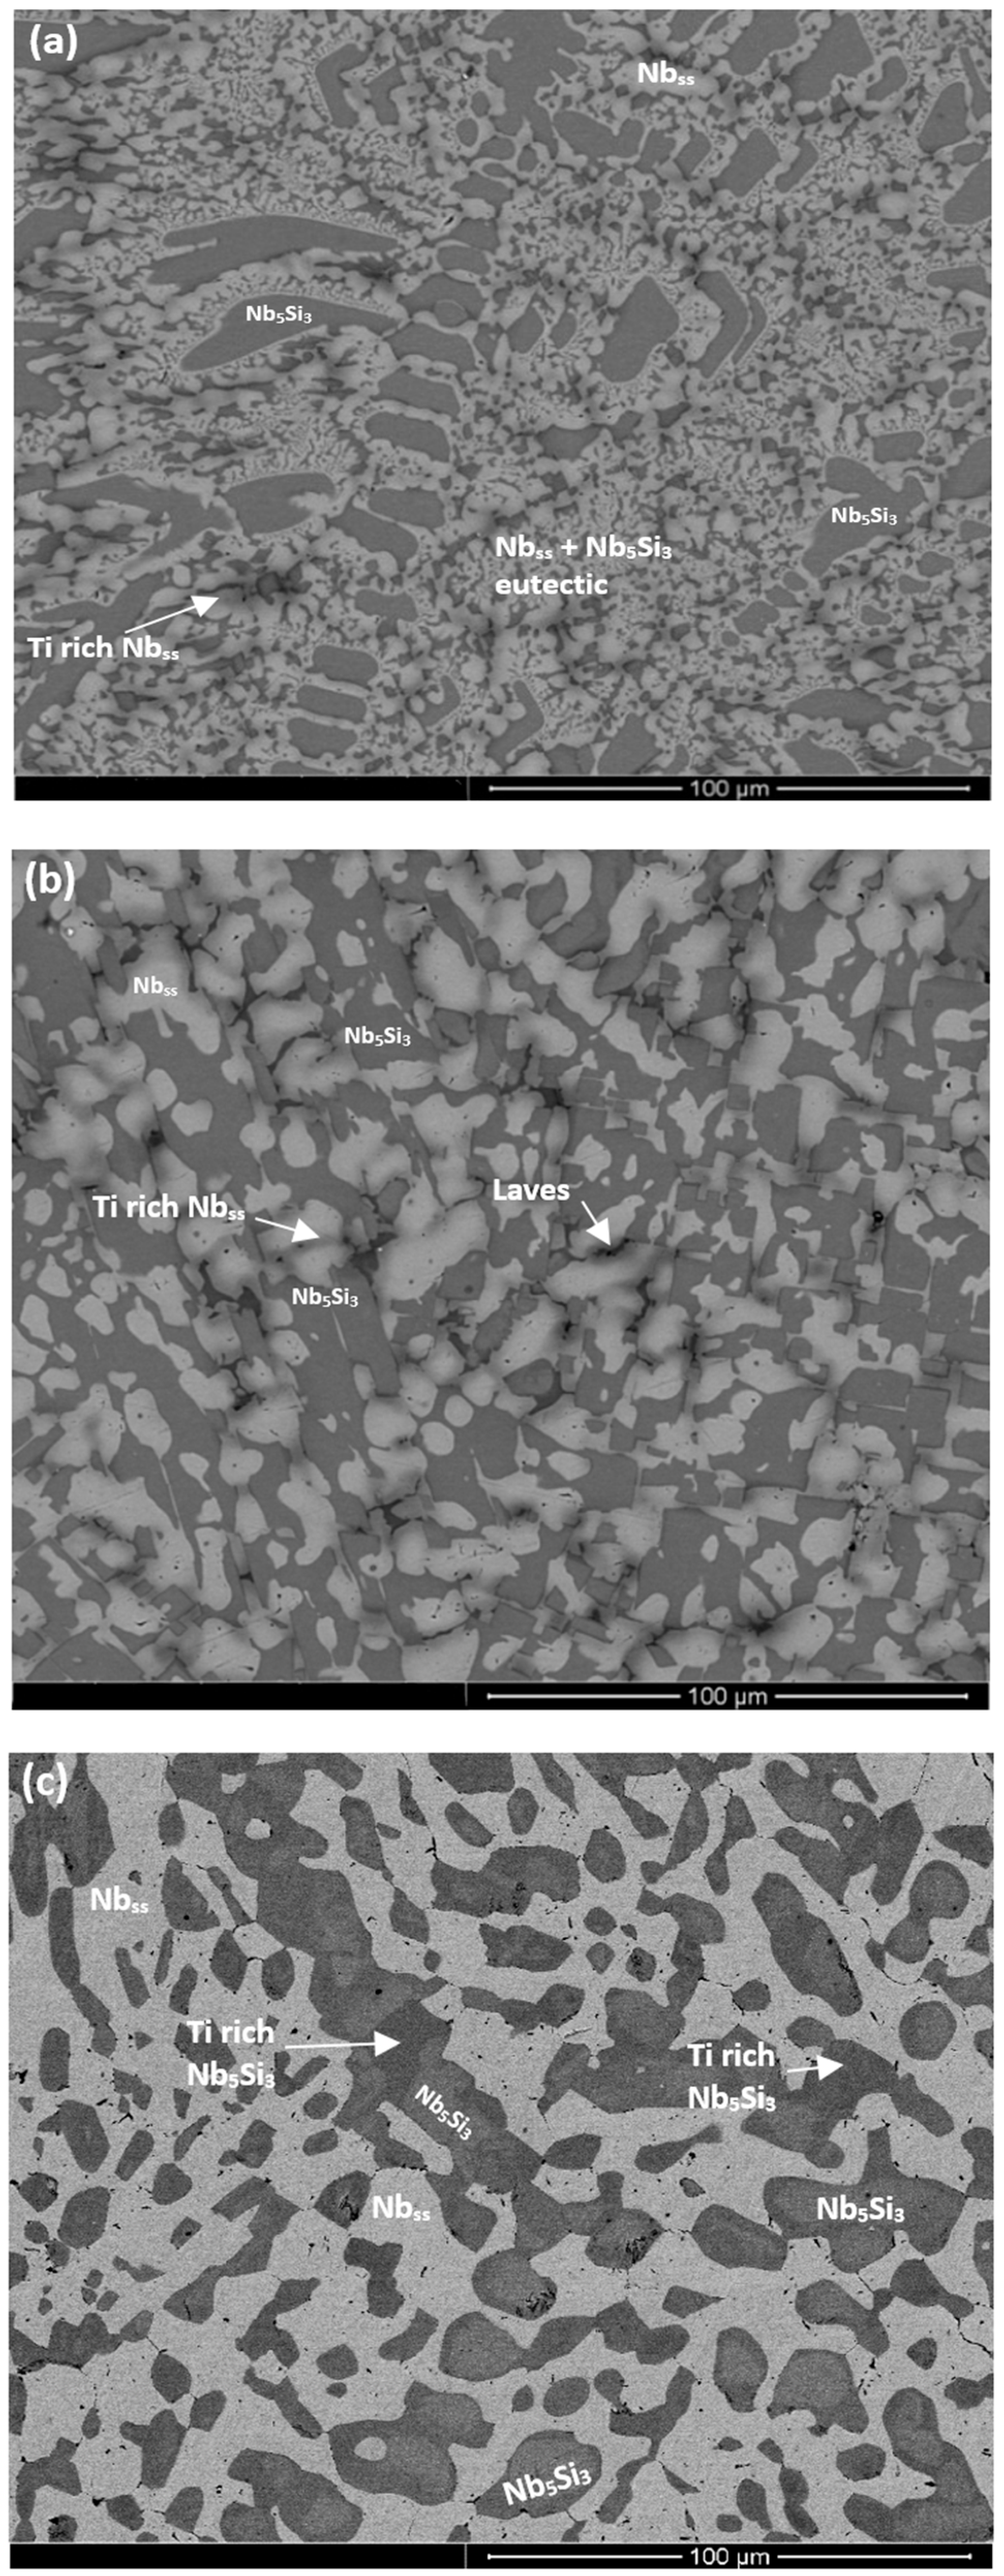
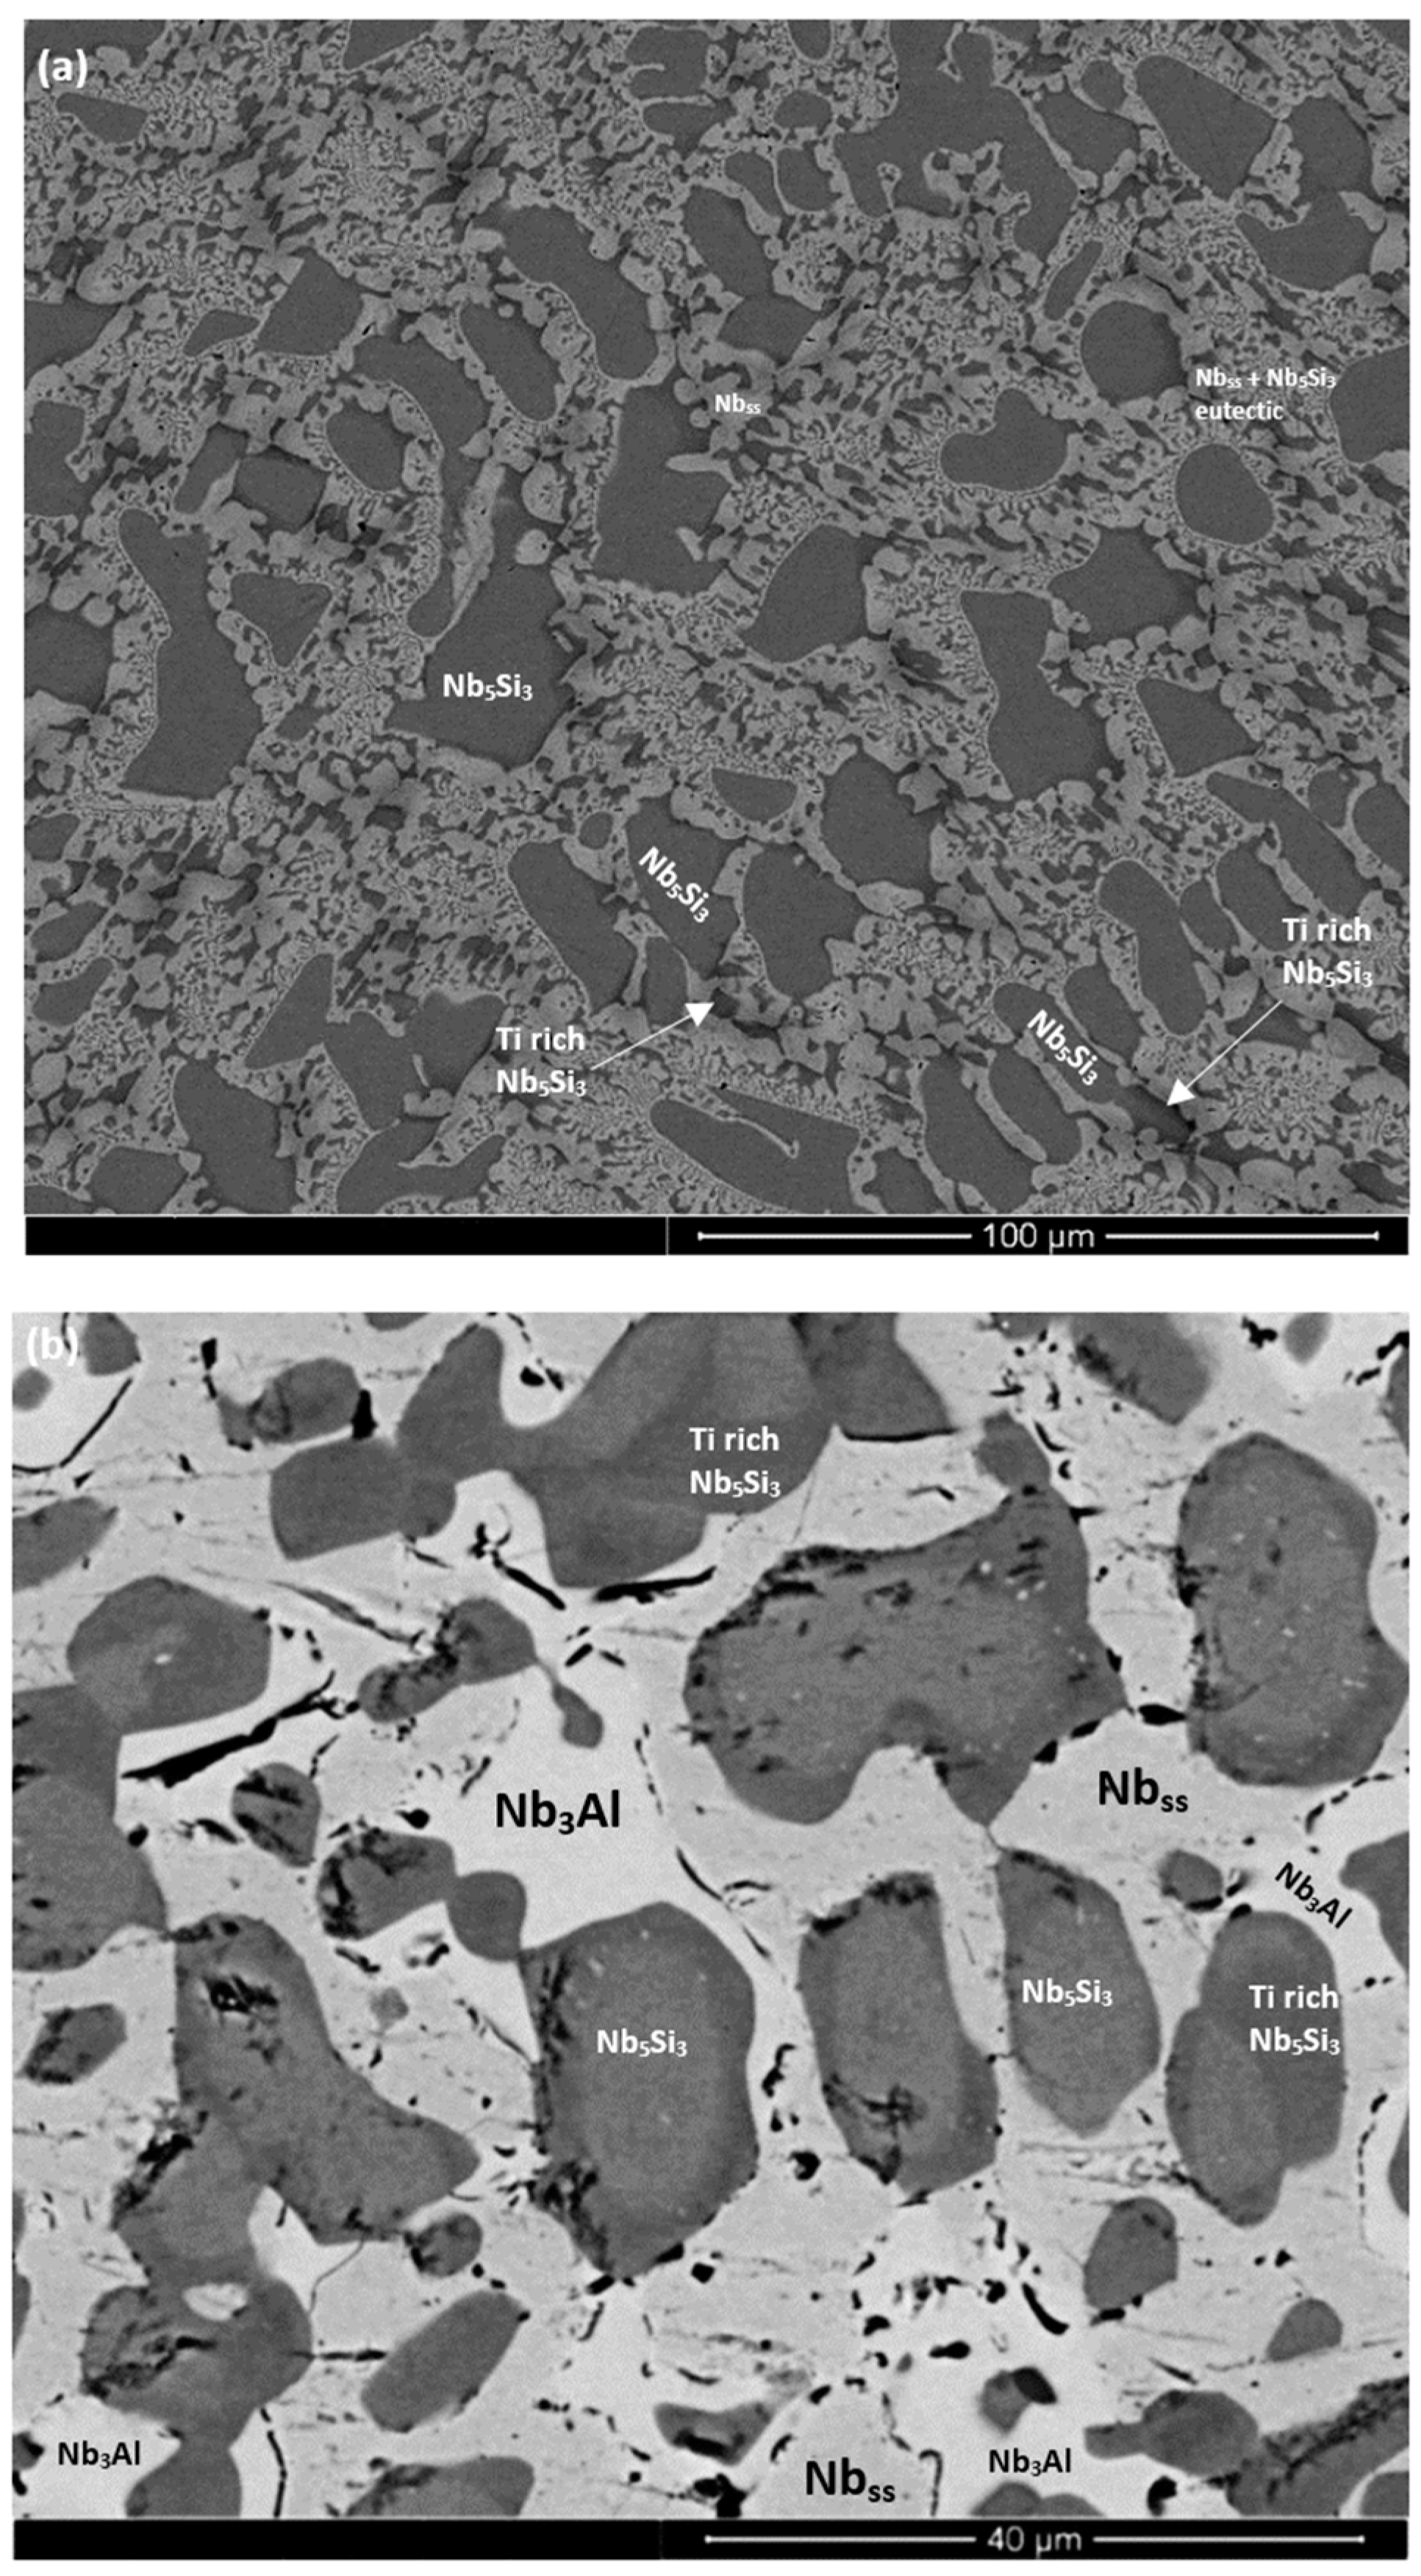
3.1. Cast Alloys
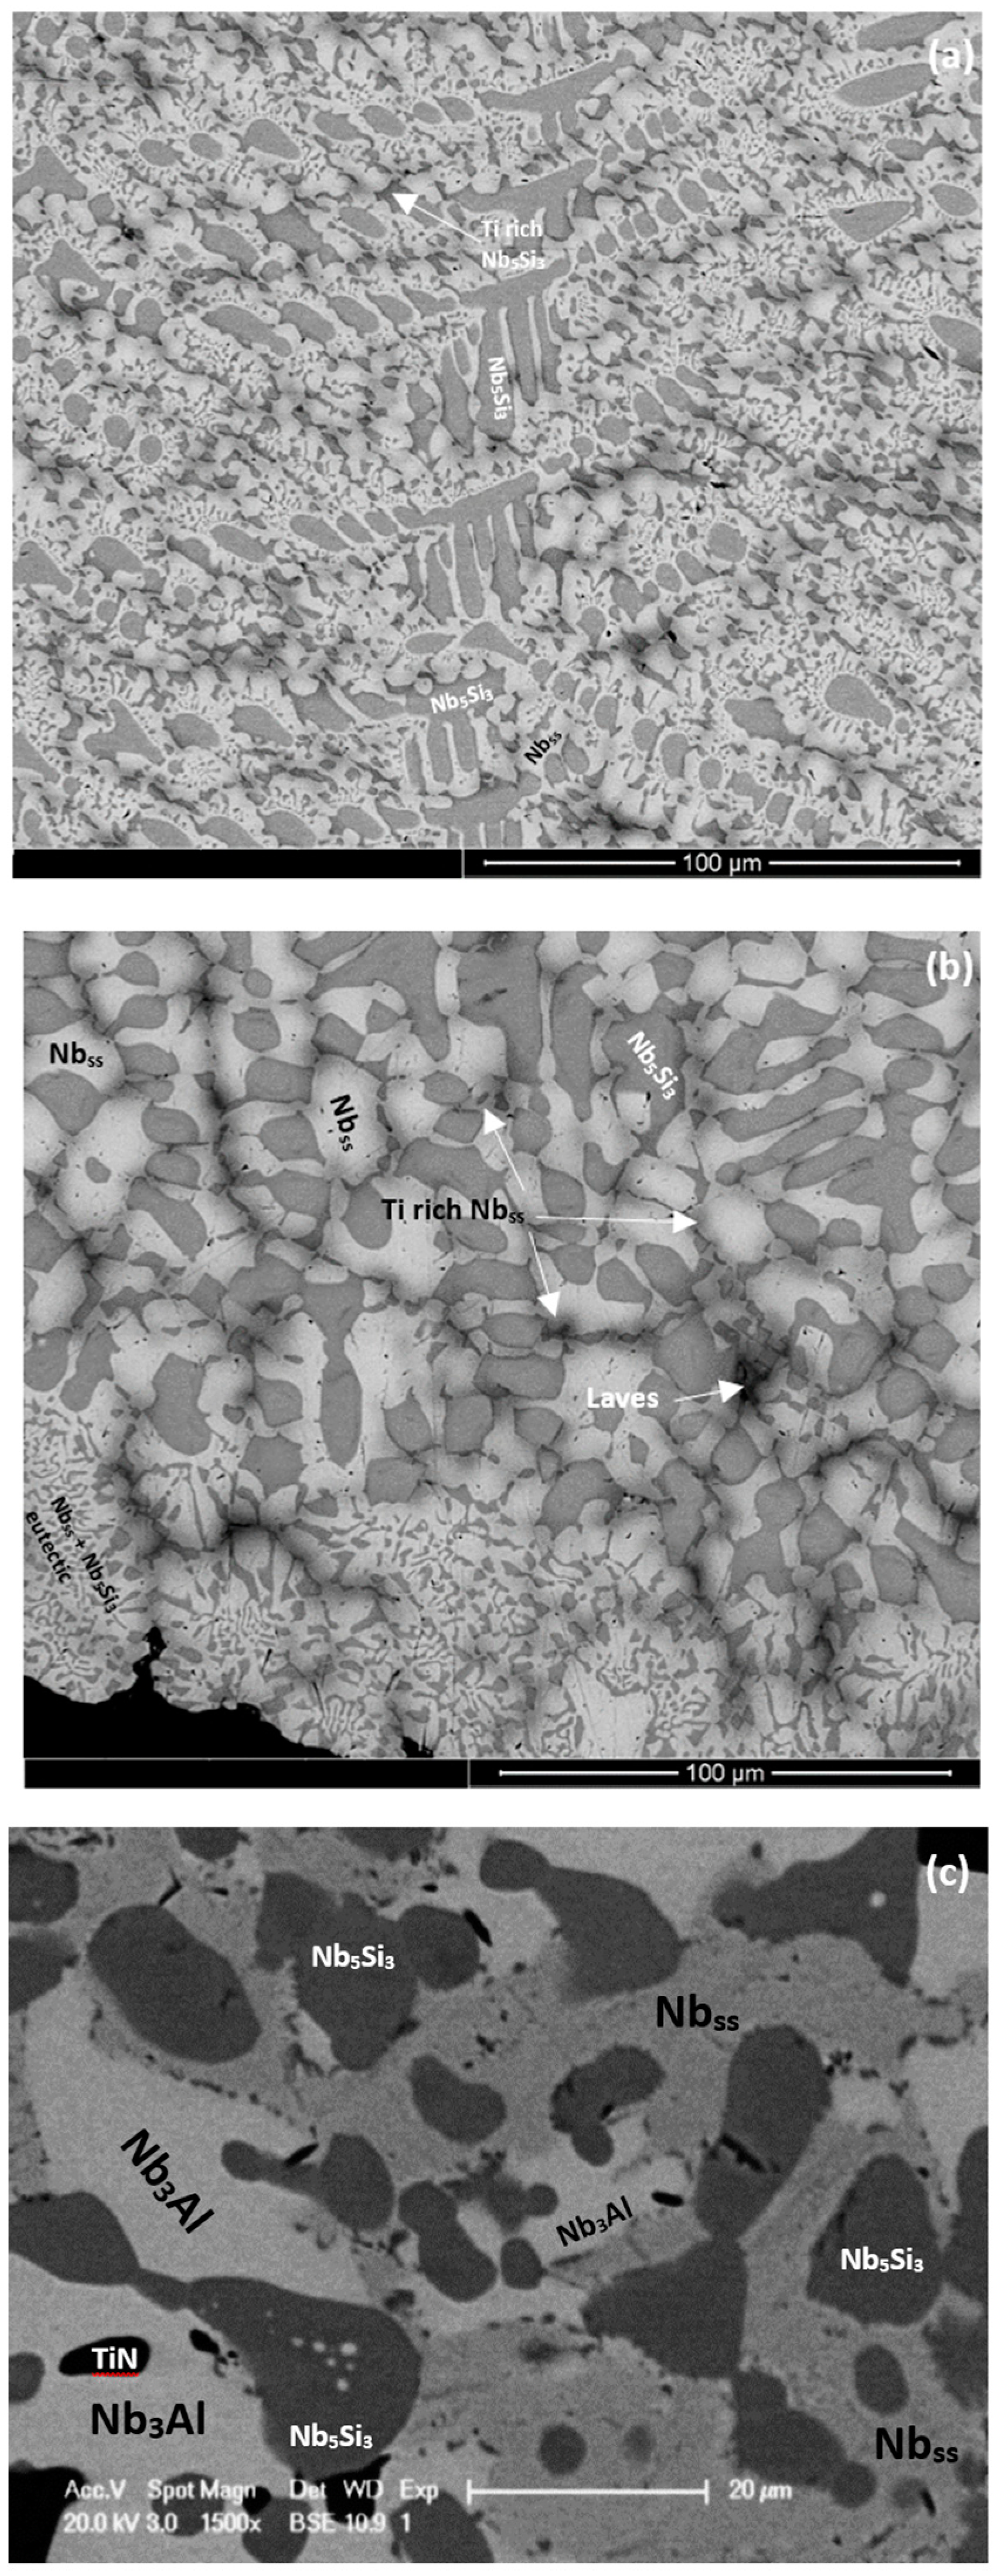
3.2. Heat-Treated Alloys
3.3. Oxidation at 800 °C
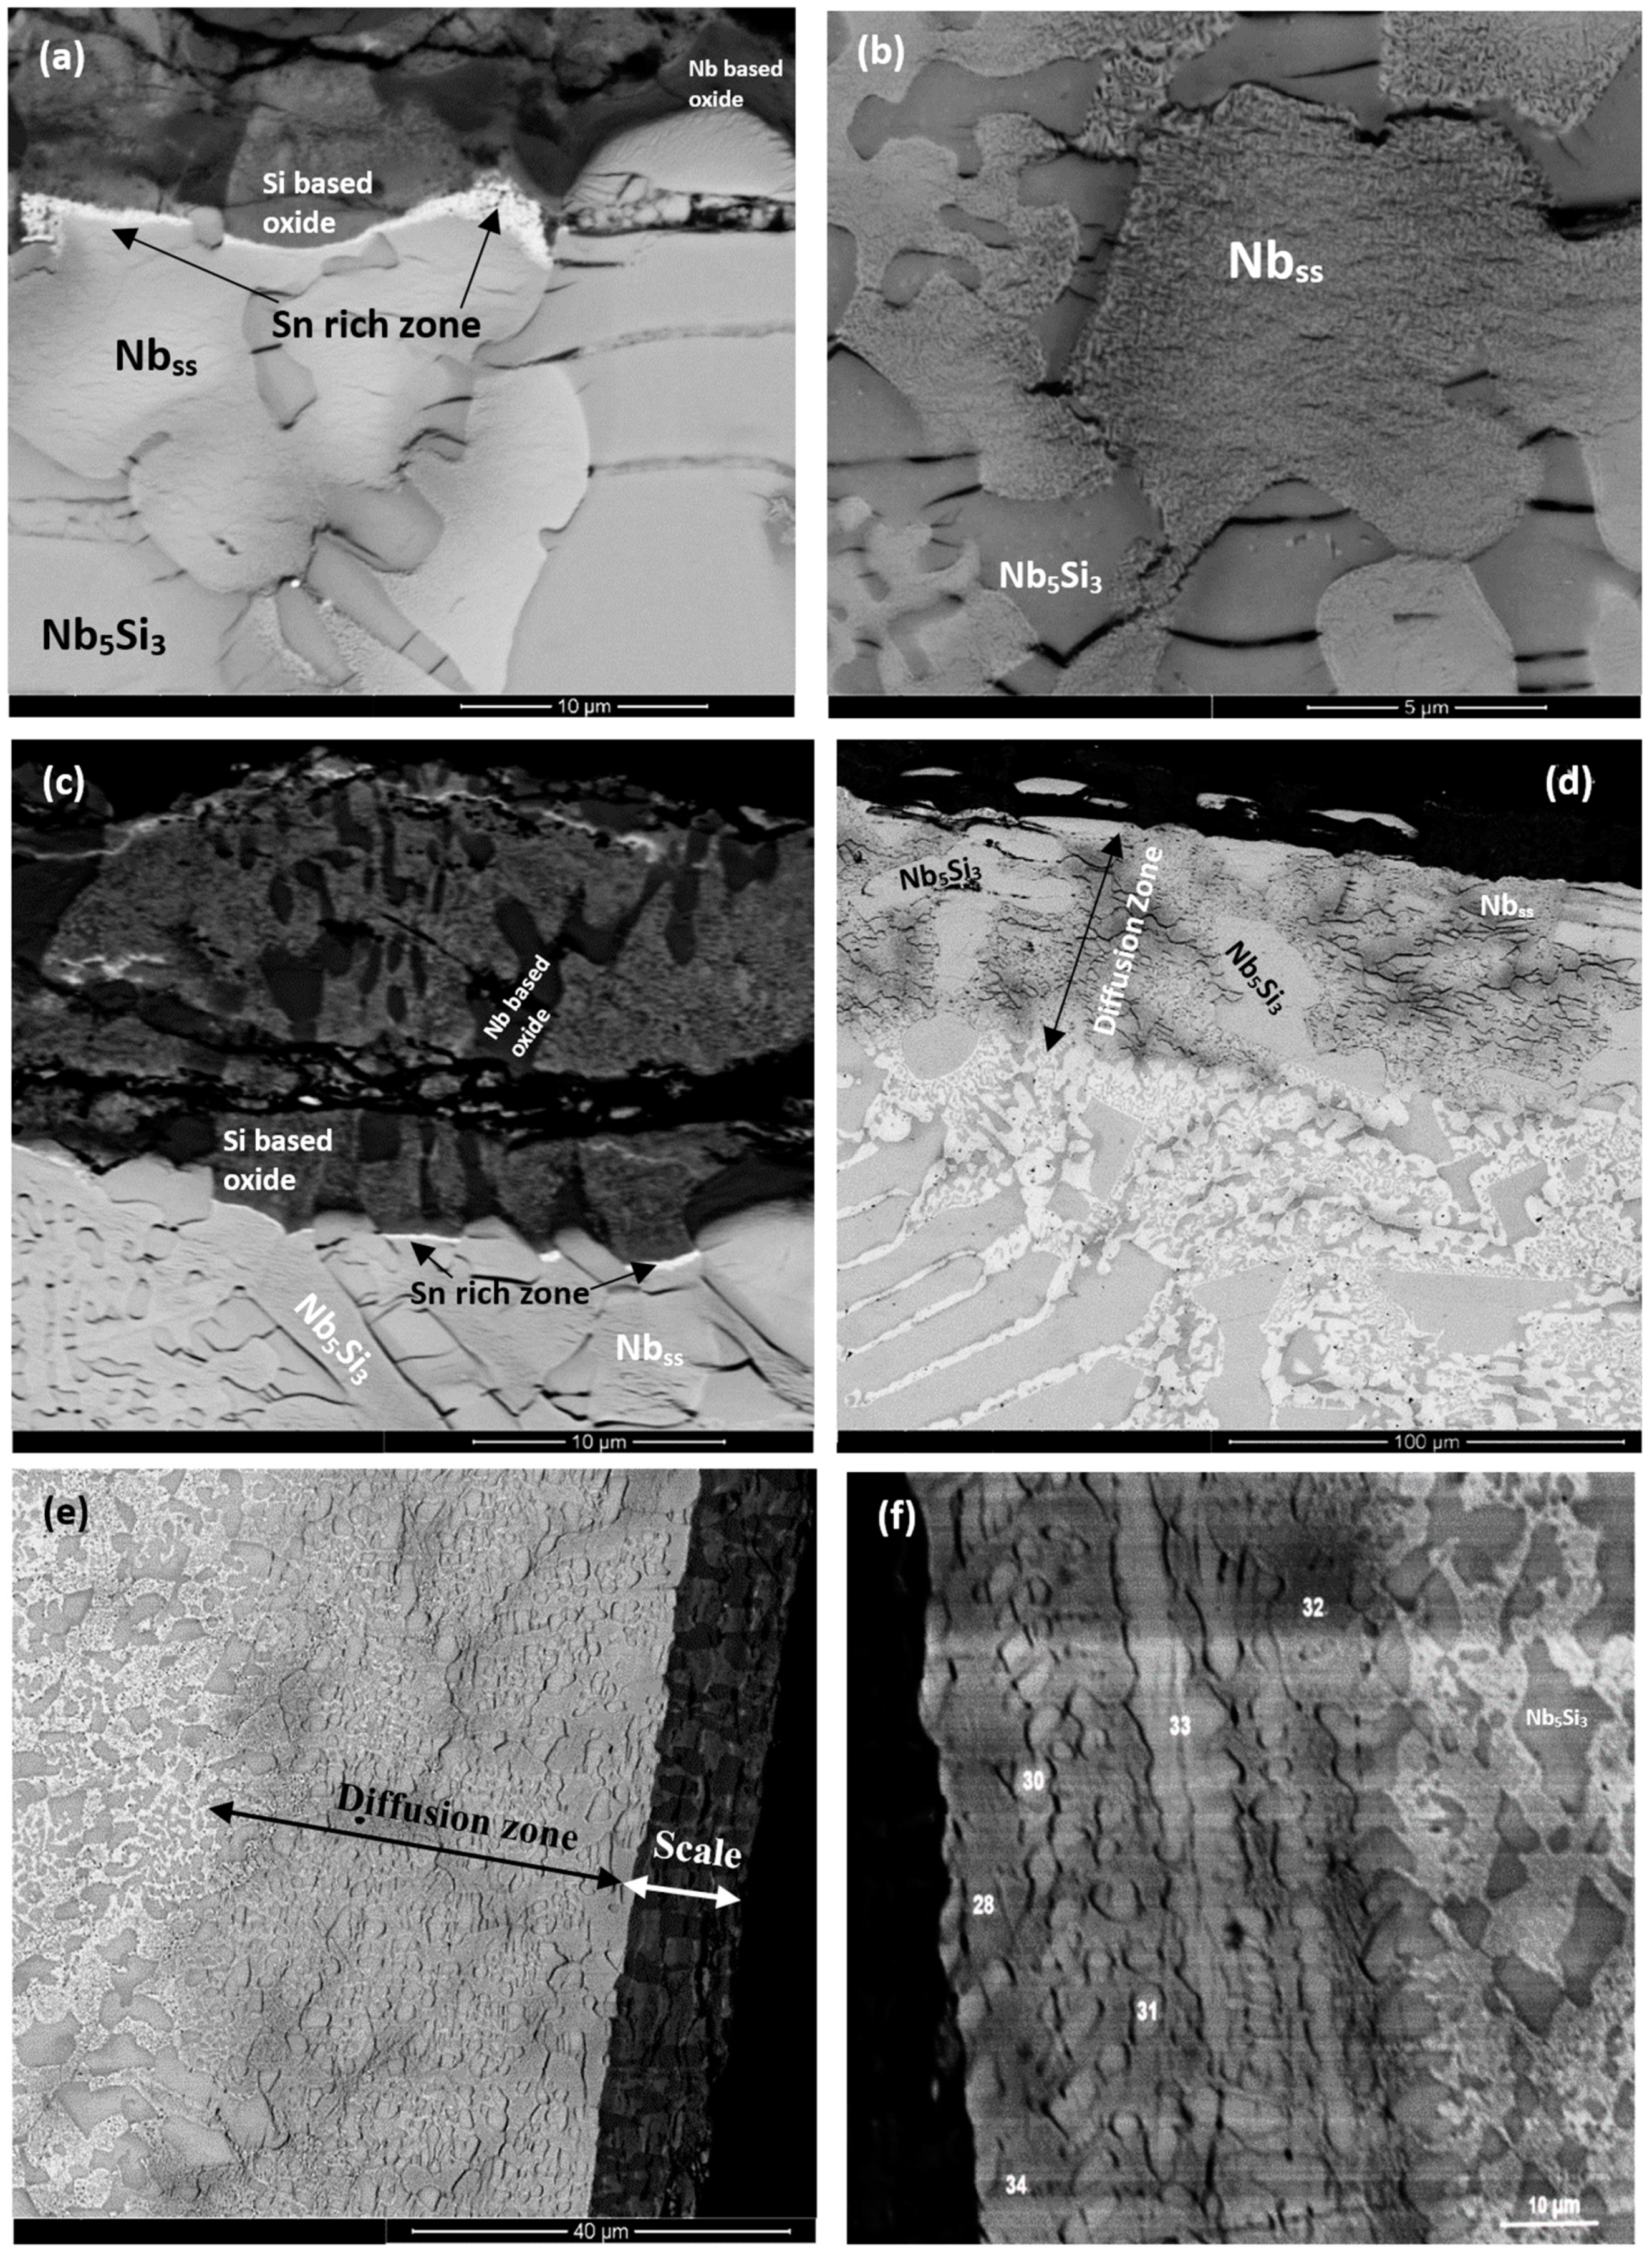
3.4. Oxidation at 1200 °C
4. Discussion
4.1. Macrosegregation of Si
4.2. Microstructures
4.2.1. Cast Microstructures
4.2.2. Heat-treated Microstructures
4.2.3. Composition of Phases
4.3. Oxidation
4.3.1. Tin Rich Areas
Surface Segregation of Sn
4.4. Summary and Conclusions
- There was macrosegregation of Si and Ti in the alloys ZX3 and ZX5 and only of Si in the alloy ZX7. The synergy of Al and Sn had the strongest effect on the increase of the macrosegregation of Si.
- Nbss was stable in all alloys. Tin and Ti exhibited opposite partitioning behaviour in the Nbss.
- βNb5Si3 was present in the microstructures of all three cast alloys and had partially transformed to αNb5Si3 in the alloy ZX3. Aluminium in synergy with Sn increased the sluggishness of the βNb5Si3 to αNb5Si3 transformation during solidification. After the heat treatment the transformation of βNb5Si3 to αNb5Si3 had been completed in all three alloys. Fine Nbss precipitates from the βNb5Si3 → Nbss + αNb5Si3 transformation were observed inside some αNb5Si3 grains in the alloys ZX5 and ZX7.
- In the alloys ZX5 and ZX7 the A15-Nb3X (X = Al, Si, Sn) formed after the heat treatment. Therefore, the synergy of Al and Sn can promote the stability of A15-Nb3X intermetallic in Nb-silicide-based alloys even at low Sn concentration.
- A Nbss + Nb5Si3 eutectic was observed in all three alloys with composition close to that of the metastable eutectic and there was evidence of anomalous eutectic in the parts of the alloys ZX3 and ZX7 that had solidified under high cooling rates and/or high melt undercooling. A very fine ternary Nbss + Nb5Si3 + NbCr2 eutectic was also observed in parts of the alloy ZX3 that had solidified under high cooling rate.
- At 800 °C none of the alloys suffered from catastrophic pest oxidation. The smaller oxidation rate constant was exhibited by the alloy ZX7. A thin Sn-rich layer formed continuously between the scale and Nbss in the alloys ZX3 and ZX5.
- At 1200 °C the scales formed on all three alloys spalled off, the alloys exhibited parabolic oxidation in the early stages followed by linear oxidation and the alloy ZX5 gave the smaller rate constant values. A thicker continuous Sn-rich zone formed between the scale and substrate in all three alloys. This zone was noticeably thicker near the corners of the specimen of the alloy ZX7 and continuous around the whole specimen. The Nb3Sn, Nb5Sn2Si, and NbSn2 compounds were observed in the Sn-rich zone. The formation of Sn-rich zone was supported by different theories for surface segregation of solute elements in alloys.
- At both temperatures the scales formed on all three alloys consisted of Nb-rich and Nb and Si-rich oxides and Ti-rich oxide also was formed in the scales of the alloys ZX3 and ZX7 at 1200 °C. The formation of a Sn-rich layer/zone did not prevent the contamination of the bulk of the specimens by oxygen, as both the Nbss and Nb5Si3 were contaminated by oxygen in the bulk of the oxidised specimens, the former more severely than the latter.
Supplementary Materials
Author Contributions
Funding
Acknowledgements
Conflicts of Interest
References
- Bewlay, B.P.; Jackson, M.R. Chapter 3.22: High temperature in situ composites: Processing and properties. In Comprehensive Composite Materials; Kelly, A., Zweben, C., Eds.; Elsevier: Amsterdam, The Netherlands, 2003; pp. 579–615. [Google Scholar]
- Tsakiropoulos, P. On Nb silicide-based alloys: Alloy design and selection. Materials 2018, 11, 844. [Google Scholar] [CrossRef] [PubMed]
- Tsakiropoulos, P. On the Nb silicide-based alloys: Part I—The bcc Nb solid solution. J. Alloys Compd. 2017, 708, 961–971. [Google Scholar] [CrossRef]
- Tsakiropoulos, P. On the alloying and properties of tetragonal Nb5Si3 in Nb-silicide-based alloys. Materials 2018, 11, 69. [Google Scholar] [CrossRef] [PubMed]
- Tsakiropoulos, P. Alloying and properties of C14-NbCr2 and A15-Nb3X (X = Al, Ge, Si, Sn) in Nb-silicide-based alloys. Materials 2018, 11, 395. [Google Scholar] [CrossRef] [PubMed]
- Menon, E.S.K.; Mendiratta, M.G.; Dimiduk, D.M. High temperature oxidation mechanisms in Nb-silicide bearing multicomponent alloys. Struct. Intermet. 2001, 591–600. [Google Scholar]
- Jackson, M.R.; Bewlay, B.P.; Zhao, J.-C. Niobium Silicide-based Composites Resistant to Low Temperature Pesting. U.S. Patent 6,419,765, 16 July 2002. [Google Scholar]
- Jackson, M.R.; Bewlay, B.P.; Zhao, J.-C. Niobium-Silicide-based Composites Resistant to High temperature Oxidation. U.S. Patent 6,913,655 B2, 5 July 2005. [Google Scholar]
- Geng, J.; Tsakiropoulos, P.; Shao, G. A thermo-gravimetric and microstructural study of the oxidation of Nbss/Nb5Si3-based in situ composites with Sn addition. Intermetallics 2007, 15, 270–281. [Google Scholar] [CrossRef]
- Knittel, S.; Mathieu, S.; Portebois, L.; Vilasi, M. Effect of tin addition on Nb-Si based in situ composites. Part II: Oxidation behaviour. Intermetallics 2014, 47, 43–52. [Google Scholar] [CrossRef]
- Prokoshkin, D.A.; Vasileva, E.V. Alloys of Niobium; Samarin, A.M., Ed.; Translated from Russian by Kaner, N.; Translation edited by Gleiser, M.; Israel Program for Scientific Translations: Jerusalem, Israel, 1965. [Google Scholar]
- Vellios, N.; Tsakiropoulos, P. Development of Nb-Silicide-based Alloys with Sn addition. University of Surrey: Guildford, UK, 2007; Unpublished work. [Google Scholar]
- Tsakiropoulos, P. Alloying and hardness of eutectics with Nbss and Nb5Si3 in Nb-silicide-based alloys. Materials 2018, 11, 592. [Google Scholar] [CrossRef] [PubMed]
- Zifu, L.I.; Tsakiropoulos, P. Study of the effect of Ge addition on the microstructure of Nb-18Si in situ composites. Intermetallics 2010, 18, 1072–1078. [Google Scholar] [CrossRef]
- Bewlay, B.P.; Yang, Y.; Casey, R.L.; Jackson, M.R.; Chang, Y.A. Experimental study of the liquid-solid phase equilibria at the metal-rich region of the Nb-Cr-Si system. Intermetallics 2009, 17, 120–127. [Google Scholar] [CrossRef]
- Zelenitsas, K.; Tsakiropoulos, P. Study of the role of Al and Cr additions in the microstructure of Nb-Ti-Si in situ composites. Intermetallics 2005, 13, 1079–1095. [Google Scholar] [CrossRef]
- Zelenitsas, K.; Tsakiropoulos, P. Effect of Al, Cr and Ta additions on the oxidation behaviour of Nb-Ti-Si in situ composites at 800 °C. Mater. Sci. Eng. A 2006, 416, 269–280. [Google Scholar] [CrossRef]
- Geng, J.; Tsakiropoulos, P.; Shao, G. Oxidation of Nb-Si-Cr-Al in situ composites with Mo, Ti and Hf additions. Mater. Sci. Eng. A 2006, 441, 26–38. [Google Scholar] [CrossRef]
- Vellios, N.; Tsakiropoulos, P. The role of Fe and Ti additions in the microstructure of Nb-18Si-5Sn silicide-based alloys. Intermetallics 2007, 15, 1529–1537. [Google Scholar] [CrossRef]
- Tsakiropoulos, P. On the macrosegregation of silicon in niobium silicide-based alloys. Intermetallics 2014, 55, 95–101. [Google Scholar] [CrossRef]
- Han, X.J.; Wei, B. Microstructural characteristics of Ni-Sb eutectic alloys under substantial undercooling and containerless solidification conditions. Metall. Mater. Trans. A 2002, 33, 1221–1228. [Google Scholar] [CrossRef]
- Mullis, A.M.; Clopet, C.R.; Cochrane, R.F. Determination of the origin of anomalous eutectic structures from in situ observation of recalescence behaviour. Mater. Sci. Forum 2014, 790, 349–354. [Google Scholar] [CrossRef]
- Li, M.; Nagashio, K.; Kuribayashi, K. Re-examination of the solidification behaviour of undercooled Ni-Sn eutectic melt. Acta Mater. 2002, 50, 3239–3250. [Google Scholar] [CrossRef]
- Li, M.; Kuribayashi, K. Nucleation controlled microstructures and anomalous eutectic formation in undercooled Co-Sn and Ni-Si eutectic melts. Metall. Mater. Trans. A 2003, 34, 2999–3008. [Google Scholar] [CrossRef]
- Ying, Y.; Bewlay, B.P.; Chen, S.L.; Chang, Y.A. Application of phase diagram calculations to development of new ultra-high temperature structural materials. Trans. Nonferrous Met. Soc. China 2007, 17, 1396–1404. [Google Scholar] [CrossRef]
- Tiller, W.A.; Jackson, K.A.; Rutter, J.W.; Chalmers, B. The redistribution of solute atoms during the solidification of metals. Acta Metall. 1953, 1, 435–438. [Google Scholar] [CrossRef]
- Yao, X.; Dahle, A.K.; Davidson, C.J.; StJohn, D.H. Effect of solute on the growth rate and the constitutional undercooling ahead of the advancing interface during solidification of an alloy and the implications for nucleation. J. Mater. Res. 2006, 21, 2470–2479. [Google Scholar] [CrossRef]
- McCaughey, C.; Tsakiropoulos, P. Type of primary Nb5Si3 and precipitation of Nbss in αNb5Si3 in a Nb-8.3Ti-21.1Si-5.4Mo-4W-0.7Hf (at.%) near eutectic Nb-silicide-based alloys. Materials 2018, 11, 967. [Google Scholar] [CrossRef] [PubMed]
- Fedorov, N.F.; Mel’nikova, O.V.; Saltykova, V.A.; Pivovarova, A.P.; Dib, M.; Strakhov, V.I. The NbO5-TiO2 system. Russ. J. Inorg. Chem. 1989, 34, 741–744. [Google Scholar]
- Ibrahim, M.; Bright, N.F.H. The binary system Nb2O5-SiO2. J. Am. Ceram. Soc. 1962, 45, 221–222. [Google Scholar] [CrossRef]
- Gibbs, J.W. The Collected Works of J. Willard Gibbs, Volume I: Thermodynamics; Yale University Press: New Haven, CT, USA, 1948. [Google Scholar]
- Wynblatt, P.; Landa, A. Computer simulation of surface segregation in ternary alloy. Comput. Mater. Sci. 1999, 15, 250–263. [Google Scholar] [CrossRef]
- Williams, F.L.; Nason, D. Binary alloy surface compositions from bulk alloy thermodynamic data. Surf. Sci. 1970, 45, 377–385. [Google Scholar] [CrossRef]
- McLean, D. Grain Boundaries in Metals; Clarendon Press: Oxford, UK, 1957. [Google Scholar]
- Burton, J.J.; Machlin, E.S. Prediction of segregation to alloy surfaces from bulk phase diagrams. Phys. Rev. Lett. 1976, 37, 1433–1436. [Google Scholar] [CrossRef]
- Treglia, G.; Legrand, B.; Ducastelle, F. Segregation and ordering at surfaces of transition metal alloys: The tight-binding Ising model. Europhys. Lett. 1988, 7, 575–580. [Google Scholar] [CrossRef]
- Barnett, R.N.; Landman, U.; Cleveland, C.L. Multilayer lattice relaxation at metal surfaces: A total energy minimization. Phys. Rev. B 1983, 28, 6647–6658. [Google Scholar] [CrossRef]
- Mukherjee, S.; Moran-Lopez, J.L. Theory of surface segregation in transition metal alloys. Surf. Sci. Let. 1987, 188, L742–L748. [Google Scholar]
- Christensen, A.; Ruban, A.V.; Stoltze, P.; Jacobsen, K.W.; Skriver, H.L.; Nørskov, J.K.; Besenbacher, F. Phase diagrams for surface alloys. Phys. Rev. B 1997, 56, 5822–5834. [Google Scholar] [CrossRef]
- Ruban, A.V.; Skriver, H.L.; Nørskov, J.K. Surface segregation energies in transition metal alloys. Phys. Rev. B 1999, 59, 15990–16000. [Google Scholar] [CrossRef]
- Murr, L.E. Interfacial Phenomena in Metals and Alloys; Addison-Wesley: Boston, MA, USA, 1975. [Google Scholar]
- Miedema, A.R.; De Chatel, P.F.; De Boer, F.R. Cohesion in alloys—Fundamentals of a semi-empirical model. Phys. B+C 1980, 100, 1–28. [Google Scholar] [CrossRef]
- Opila, R.L. The role of grain boundaries in the surface segregation of tin in tin-lead alloys. J. Vac. Sci. Technol. A 1986, 4, 173–178. [Google Scholar] [CrossRef]


| Alloy | As-Cast | Heat-Treated | ||
|---|---|---|---|---|
| Composition | Phases | Composition | 1500 °C/Phases | |
| ZX3 | Nb-24.9Ti-20.8Si-4.5Cr-2.0Sn | αNb5Si3, βNb5Si3, Nbss, (Nbss + Nb5Si3)eutectic C14-NbCr2 Laves phase | Nb-25.7Ti-19.7Si-4.6Cr-2.1Sn | Nbss, αNb5Si3 |
| ZX5 | Nb-25.1Ti-19.1Si-4.9Al-1.8Sn | βNb5Si3, Nbss, (Nbss + Nb5Si3)eutectic | Nb-22.7Ti-20.1Si-4.3Al-1.6Sn | αNb5Si3, Nb3Sn, Nbss, C14-NbCr2 Laves phase |
| Composition | Phases | Composition | 1450 °C/Phases | |
| ZX7 | Nb-24.7Ti-15.8Si-5.0Cr-5.1Al-2.1Sn | βNb5Si3, Nbss, (Nbss + Nb5Si3)eutectic C14-NbCr2 Laves phase | Nb-26.4Ti-14.6Si-5.4Cr-4.6Al-2Sn | αNb5Si3, Nb3Sn, Nbss, C14-NbCr2 Laves phase |
| T (°C) | Alloy | ||
|---|---|---|---|
| ZX3 | ZX5 | ZX7 | |
| 800 | kl = 1.69 × 10⁻⁸ | kp = 5.16 × 10⁻¹¹ (t ≤ 50 h) kl = 1.80 × 10⁻⁸ (t > 50 h) | kp = 1.76 × 10⁻¹¹ (t ≤ 41.7 h) kl = 9.94 × 10⁻⁹ (t > 41.7 h) |
| 1200 | kp = 4.54 × 10⁻⁹ (t ≤ 16.7 h) kl = 1.42 × 10⁻⁷ (t > 16.7 h) | kp = 1.15 × 10⁻⁹ (t ≤ 21.7 h) kl = 6.70 × 10⁻⁸ (t > 21.7 h) | kl = 5.91 × 10⁻⁹ (t ≤ 36.7 h) kl = 1.42 × 10⁻⁷ (t > 36.7 h) |
| Alloy | Oxide Scale | Enrichment in Sn and Sn-Rich Phase(s) Formation | Oxygen Diffusion Zone | Bulk Microstructure | ||
|---|---|---|---|---|---|---|
| Thickness (µm) | Oxides * | Thickness (µm) | Phases * | Phases * | ||
| ZX3 | 15 | Nb-rich, Nb and Si-rich | Yes | 40 | Nb5Si3, oxidised Nbss | Nb5Si3, Nbss |
| ZX5 | 10–15 | Nb-rich, Nb and Si-rich | Yes | 50 | Nb5Si3, oxidised Nbss | Nb5Si3, Nbss |
| ZX7 | 10 | Nb-rich, Nb and Si-rich | Not observed | 40 | Nb5Si3, oxidised Nbss | Nb5Si3, Nbss |
| Alloy | Scale | Sn-Rich Zone | Bulk | ||
|---|---|---|---|---|---|
| Thickness (µm) | Oxides * | Thickness (µm) | Sn-Rich Intermetallics * | Phases * | |
| ZX3 | 450 | Nb-rich, Nb and Si-rich, Ti-rich | 25 | Nb5Si3, Nb3Sn, Nb5Sn2Si, NbSn2 | Nb5Si3, Nbss, Laves phase |
| ZX5 | 300 | Nb-rich, Nb and Si-rich, | 10 | Nb5Si3, Nb3Sn, Nb5Sn2Si | Nb5Si3, Nbss, A15-Nb3X, |
| ZX7 | 400 | Nb-rich, Nb and Si-rich, Ti-rich | 35 | Nb5Si3, NbSn2, Nb5Sn2Si | Nb5Si3, Nbss, A15-Nb3X, Laves phase |
| Alloy | ΔHm kJ/mol | Tm (K) | ΔHm/Tm J/mol K | ΔHmsd/ΔHmsp | Tmsd (K) | Tmsp (K) | Tmsd/Tmsd | (ΔHm/Tm) × (ΔHmsd/ΔHmsp)−1 | MACSi (at.%) |
|---|---|---|---|---|---|---|---|---|---|
| ZX3 | 28.97 | 2257 | 12.84 | 1.738 | 1896 | 361 | 5.25 | 7.39 | 3.6 |
| KZ4 | 28.20 | 2335 | 12.1 | 2.44 | 2060 | 275 | 7.5 | 4.96 | 1.9 |
| ZX5 | 28.1 | 2215 | 12.68 | 1.74 | 1837 | 377 | 4.87 | 7.29 | 5.5 |
| KZ7 | 27.7 | 2272 | 12.19 | 2.15 | 1948 | 324 | 6 | 5.67 | 2.3 |
| ZX7 | 29.45 | 2214 | 13.53 | 1.79 | 1889 | 325 | 5.82 | 7.56 | 3 |
| KZ5 | 27.50 | 2239 | 12.28 | 2.05 | 1909 | 330 | 5.78 | 5.99 | 1.3 |
| Alloy and Condition | Si + Sn (at.%) | Si + Sn + Al (at.%) | Si/Sn | ||||||||||
|---|---|---|---|---|---|---|---|---|---|---|---|---|---|
| Nbss | Ti-Rich Nbss | Nbss + Nb5Si3 Eutectic | Nb5Si3 | A15-Nb3X | Nbss | Ti-Rich Nbss | Nbss + Nb5Si3 Eutectic | Nb5Si3 | A15-Nb3X | Nbss | Ti-Rich Nbss | A15-Nb3X | |
| ZX3-AC | 6.5 | 6.1 | 17.5 | 36.7 | 0.9 | 1.1 | |||||||
| ZX5-AC | 5.2 | 5.2 | 14.7 | 31.7 | 11.1 | 11.1 | 19.8 | 35.4 | 1 | 0.9 | |||
| ZX7-AC | 5.1 | 6.2 | 14.6 | 31.1 | 11 | 12.3 | 19.8 | 35.4 | 0.8 | 1.3 | |||
| ZX3-HT | 4.1 | 37 | 0.2 | ||||||||||
| ZX5-HT | 2.6 | 34.5 | 10.4 | 9.1 | 36.8 | 18.8 | 0.3 | 0.9 | |||||
| ZX7-HT | 2.4 | 35.2 | 9.7 | 9.2 | 36.9 | 18.6 | 0.3 | 0.9 | |||||
| Theory | Surface Segregating Element | ||||
|---|---|---|---|---|---|
| A | Al | Cr | Si | Sn | Ti |
| B | Al | Sn | Ti | ||
| C | Cr | Si | Sn | ||
| D | Al | Cr | Si | Sn | Ti |
| E * | Cr | Ti? | |||
© 2018 by the authors. Licensee MDPI, Basel, Switzerland. This article is an open access article distributed under the terms and conditions of the Creative Commons Attribution (CC BY) license (http://creativecommons.org/licenses/by/4.0/).
Share and Cite
Xu, Z.; Utton, C.; Tsakiropoulos, P. A Study of the Effect of 2 at.% Sn on the Microstructure and Isothermal Oxidation at 800 and 1200 °C of Nb-24Ti-18Si-Based Alloys with Al and/or Cr Additions. Materials 2018, 11, 1826. https://doi.org/10.3390/ma11101826
Xu Z, Utton C, Tsakiropoulos P. A Study of the Effect of 2 at.% Sn on the Microstructure and Isothermal Oxidation at 800 and 1200 °C of Nb-24Ti-18Si-Based Alloys with Al and/or Cr Additions. Materials. 2018; 11(10):1826. https://doi.org/10.3390/ma11101826
Chicago/Turabian StyleXu, Zhen, Claire Utton, and Panos Tsakiropoulos. 2018. "A Study of the Effect of 2 at.% Sn on the Microstructure and Isothermal Oxidation at 800 and 1200 °C of Nb-24Ti-18Si-Based Alloys with Al and/or Cr Additions" Materials 11, no. 10: 1826. https://doi.org/10.3390/ma11101826
APA StyleXu, Z., Utton, C., & Tsakiropoulos, P. (2018). A Study of the Effect of 2 at.% Sn on the Microstructure and Isothermal Oxidation at 800 and 1200 °C of Nb-24Ti-18Si-Based Alloys with Al and/or Cr Additions. Materials, 11(10), 1826. https://doi.org/10.3390/ma11101826