Evaluation of the Rosemary Extract Effect on the Properties of Polylactic Acid-Based Materials

 ,
,  , ,
, , 
 and
and
Abstract
1. Introduction
2. Experimental
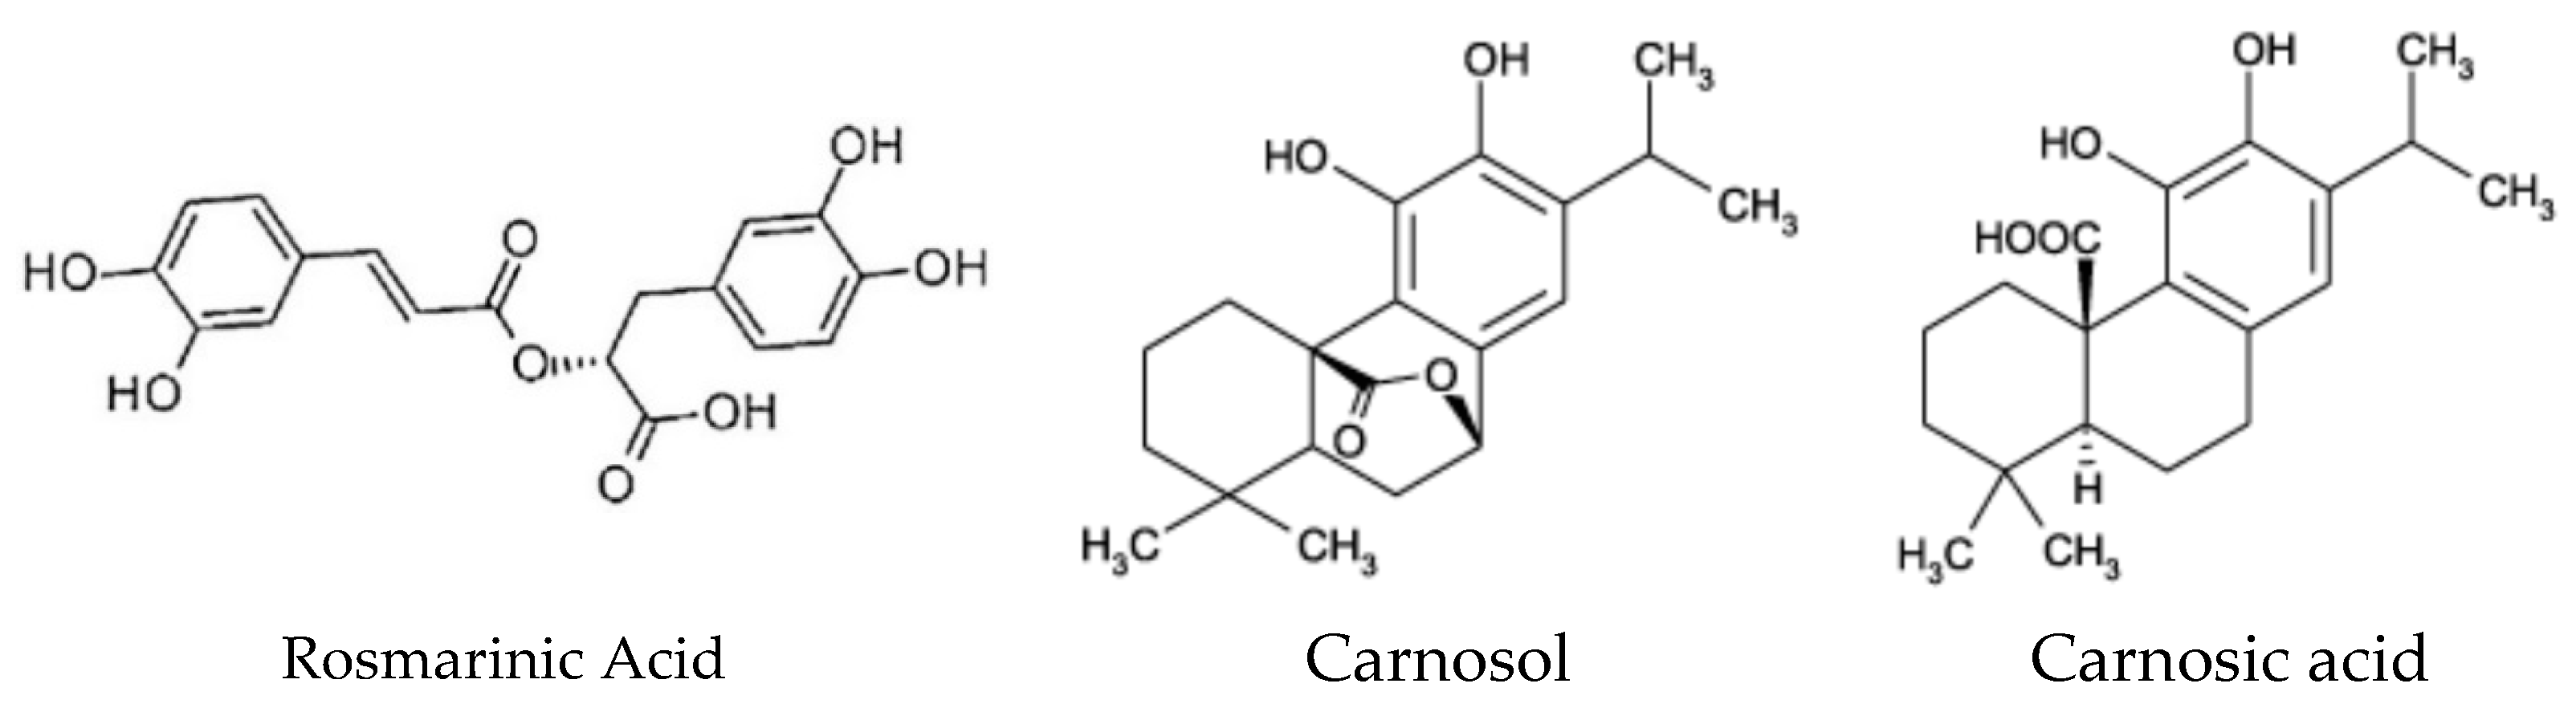
2.1. Materials
2.1.1. Determination of Total Phenolic Content
2.1.2. Determination of Total Flavonoids Content
2.2. PLA-Based Blends Processing
2.3. Investigation Methods
2.3.1. Processing Behavior
2.3.2. Scanning Electron Microscopy (SEM)
2.3.3. ATR–FTIR Spectroscopy
2.3.4. Stress-Strain Measurements
2.3.5. Dynamic Rheology
2.3.6. Differential Scanning Calorimetry (DSC)
2.3.7. Thermogravimetry–Infrared Spectroscopy/Mass Spectrometry (TG-FTIR/MS) Coupled Analysis (TG-FTIR/MS)
2.3.8. Chemiluminescence
2.3.9. Antioxidant Activity Evaluation
2.3.10. Antimicrobial Activity
2.3.11. Gas Permeability
2.3.12. Migration Study
2.3.13. Biocompatibility Evaluation
In Vitro Biocompatibility Evaluation—Contact Angle (CA) and Surface Free Energy (SFE).
In Vivo Biological Evaluation
3. Results and Discussion
3.1. Processing Behavior
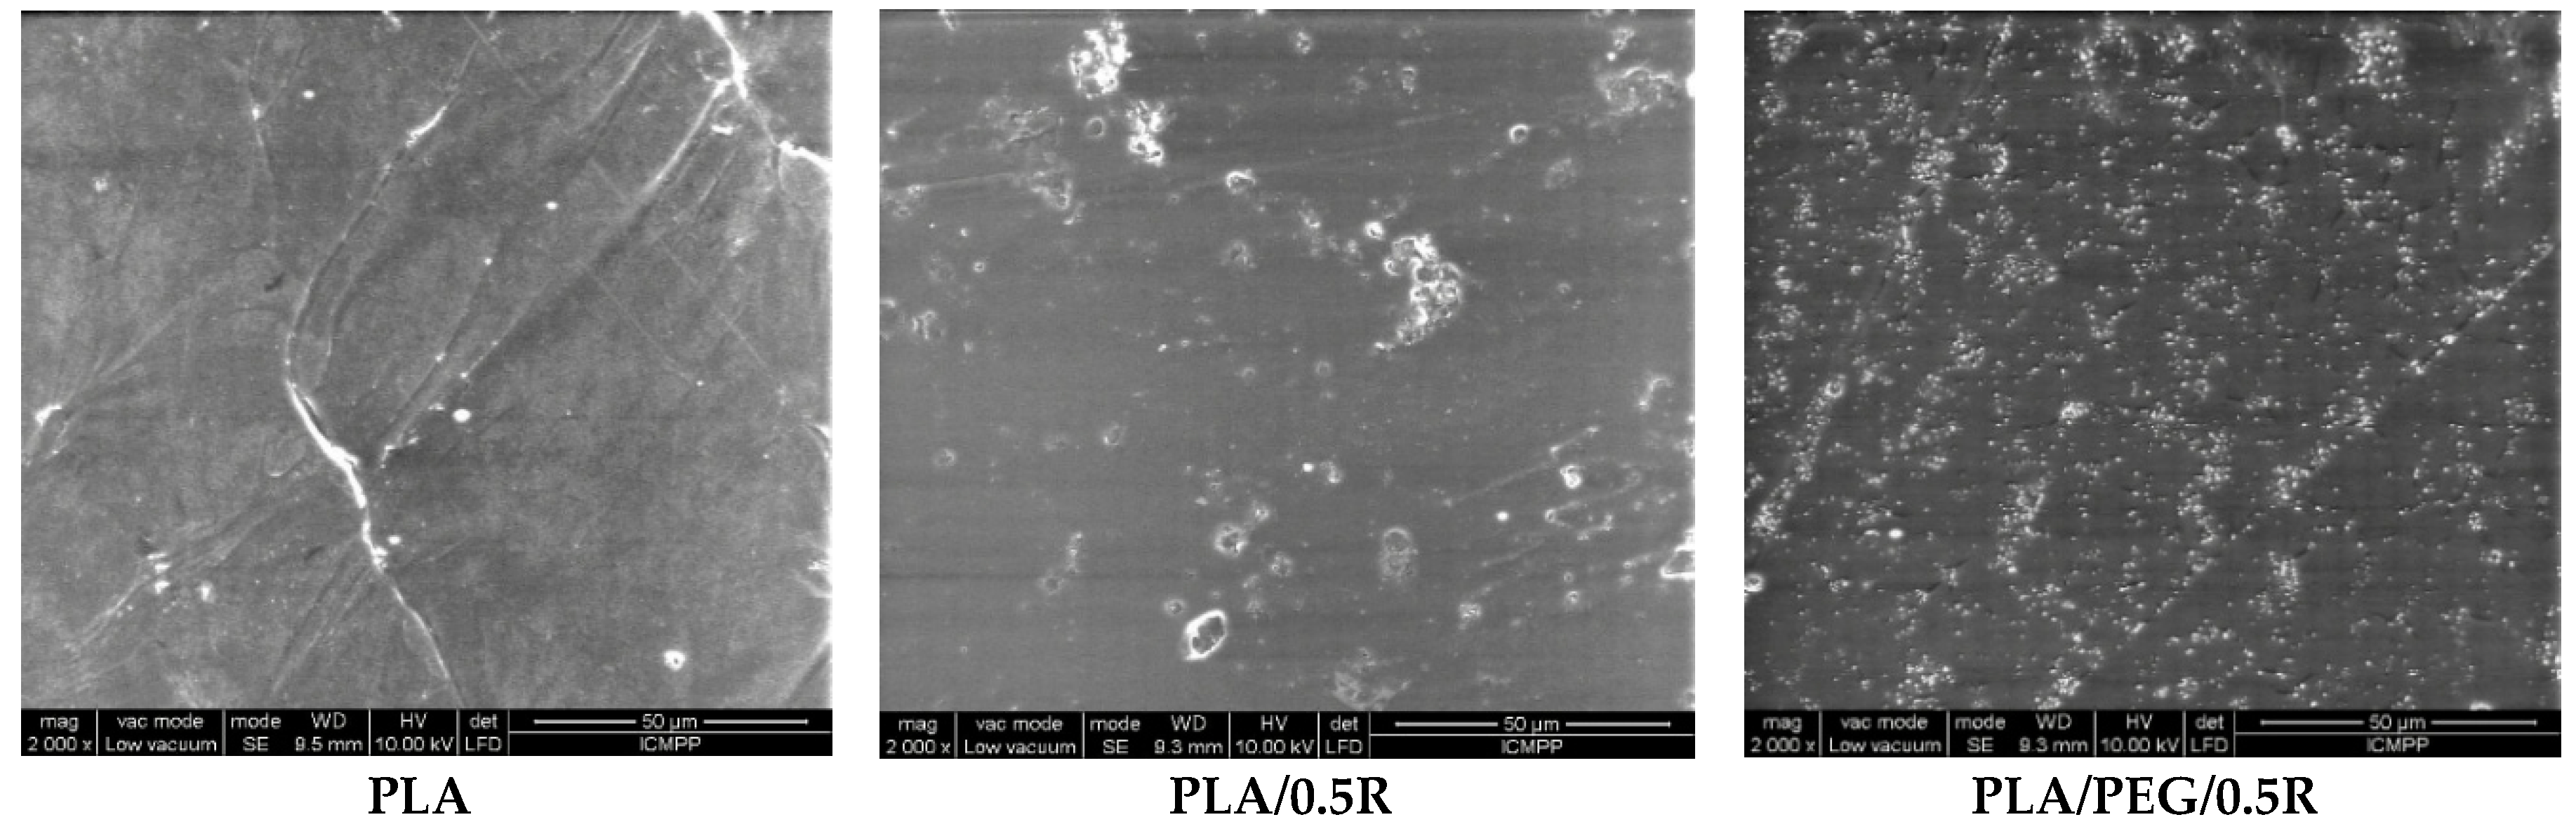
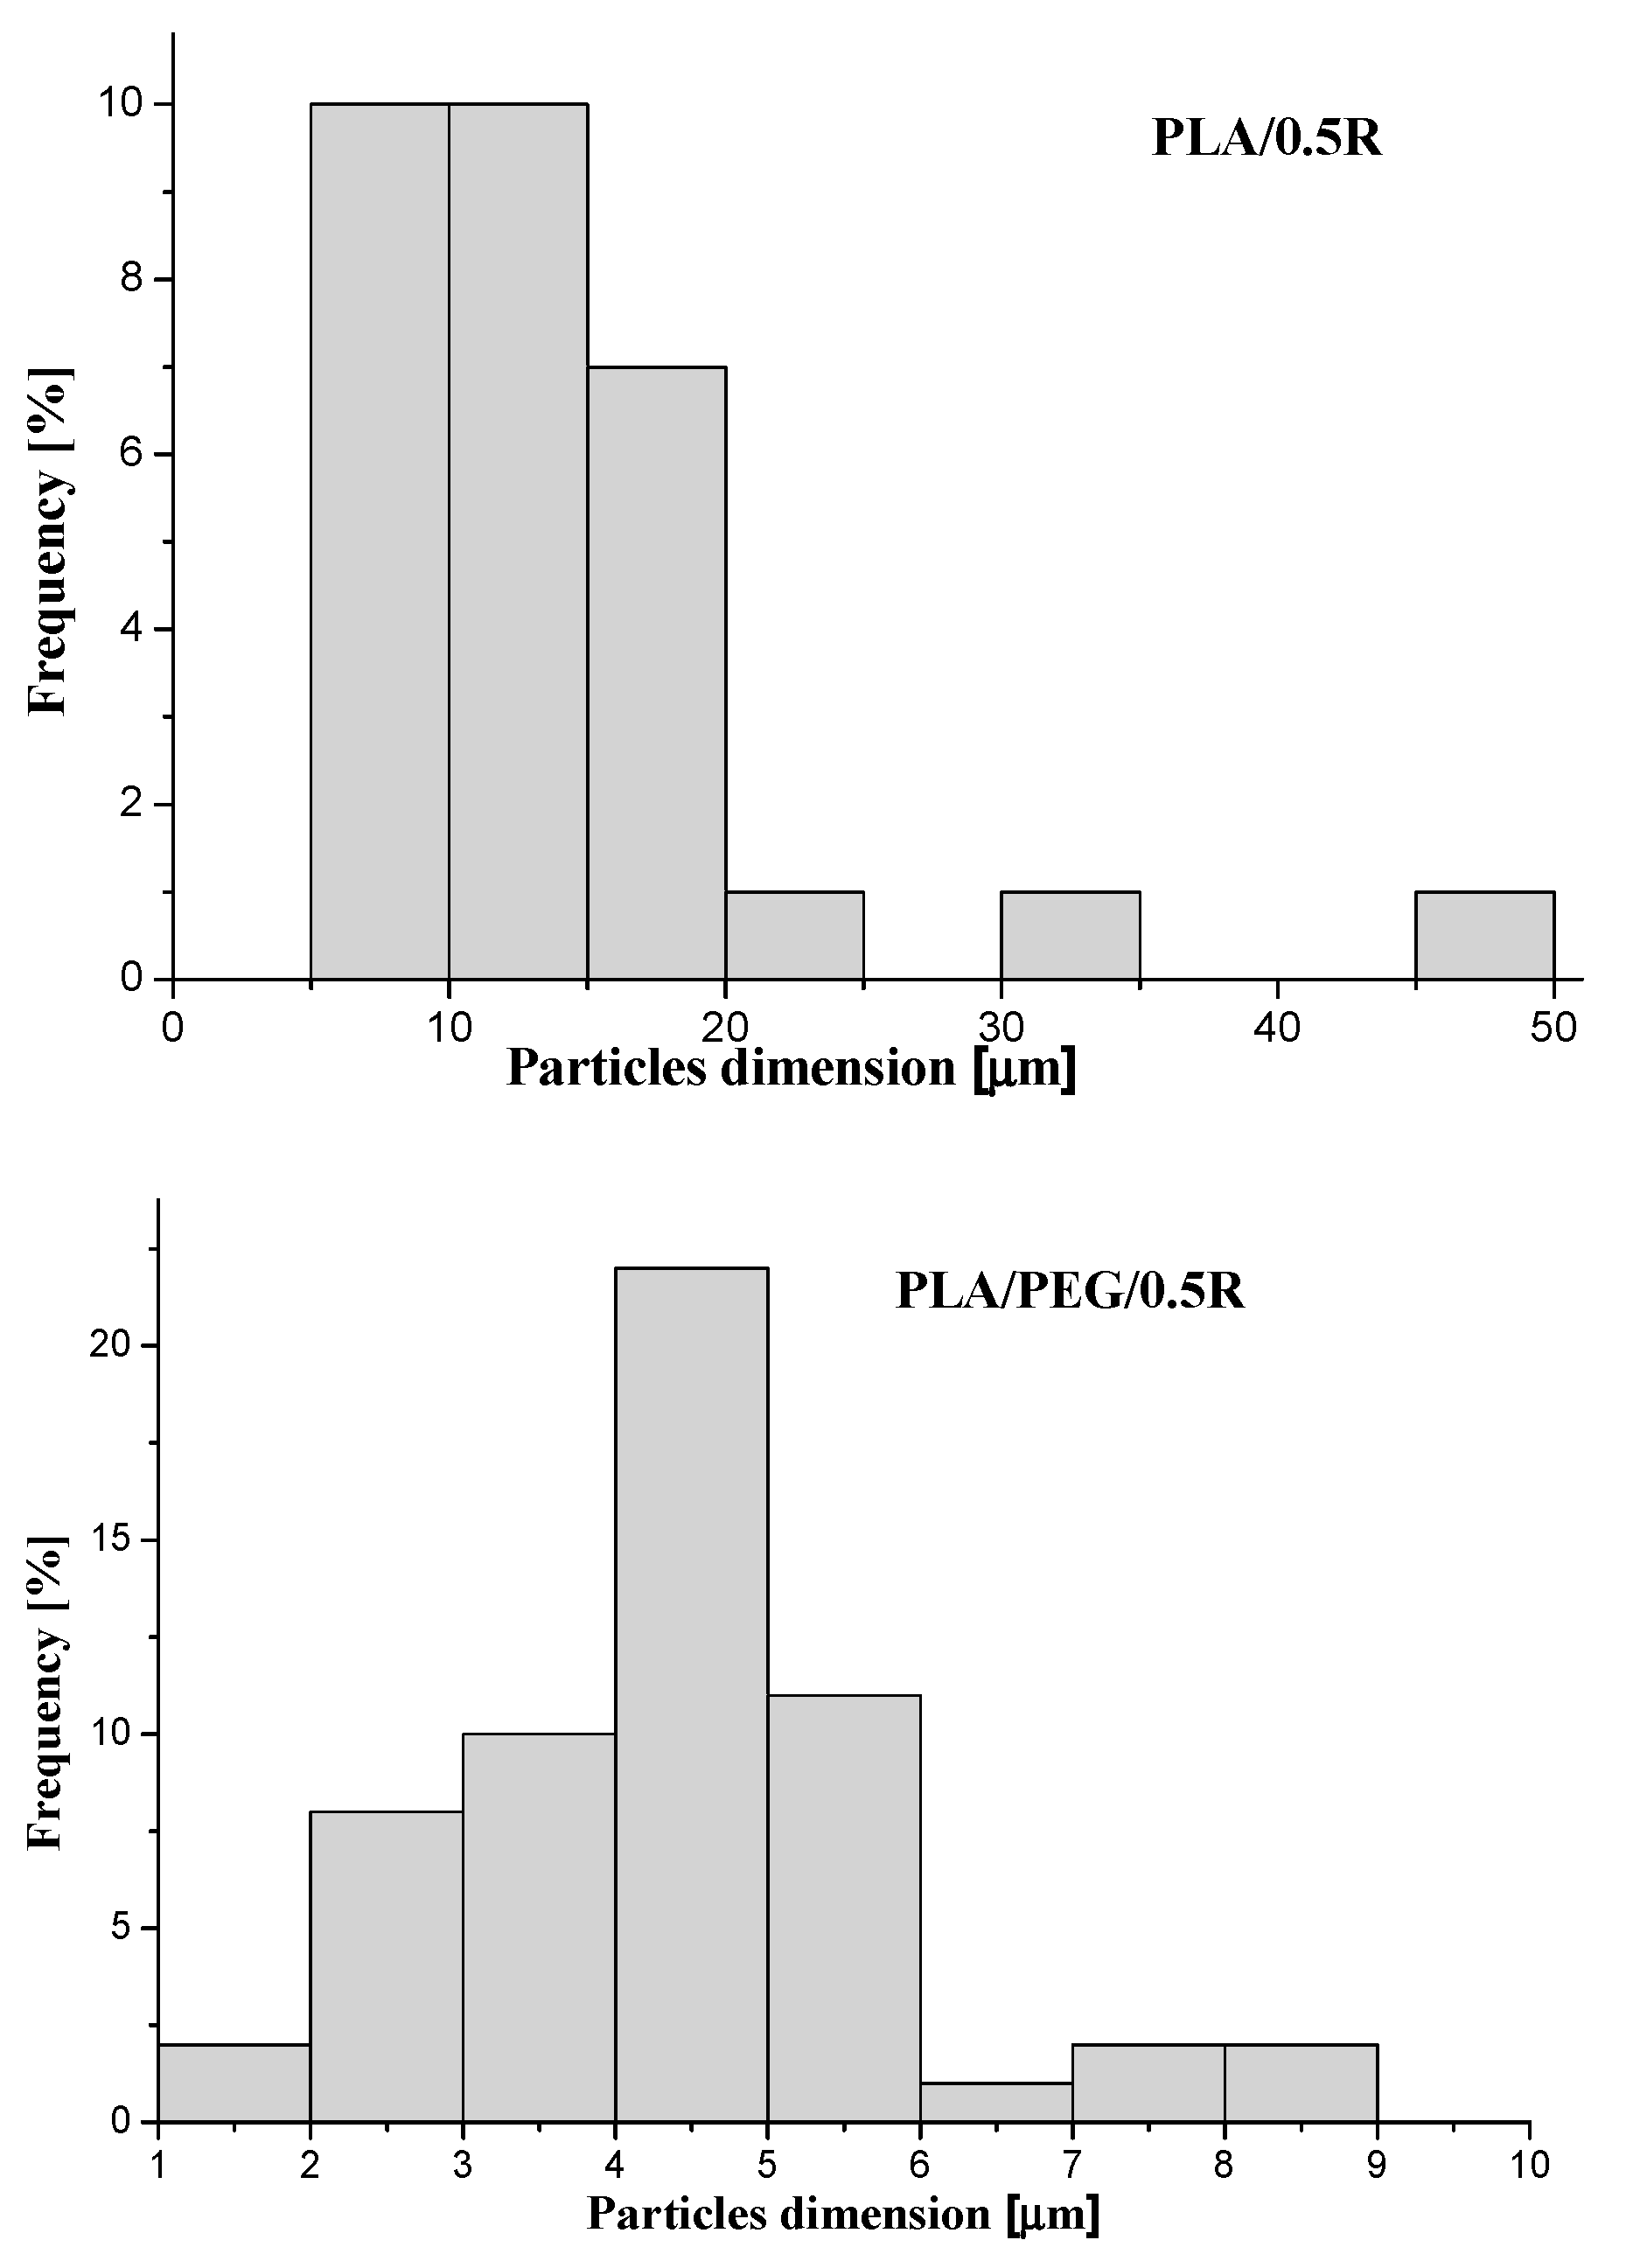
3.2. SEM Results
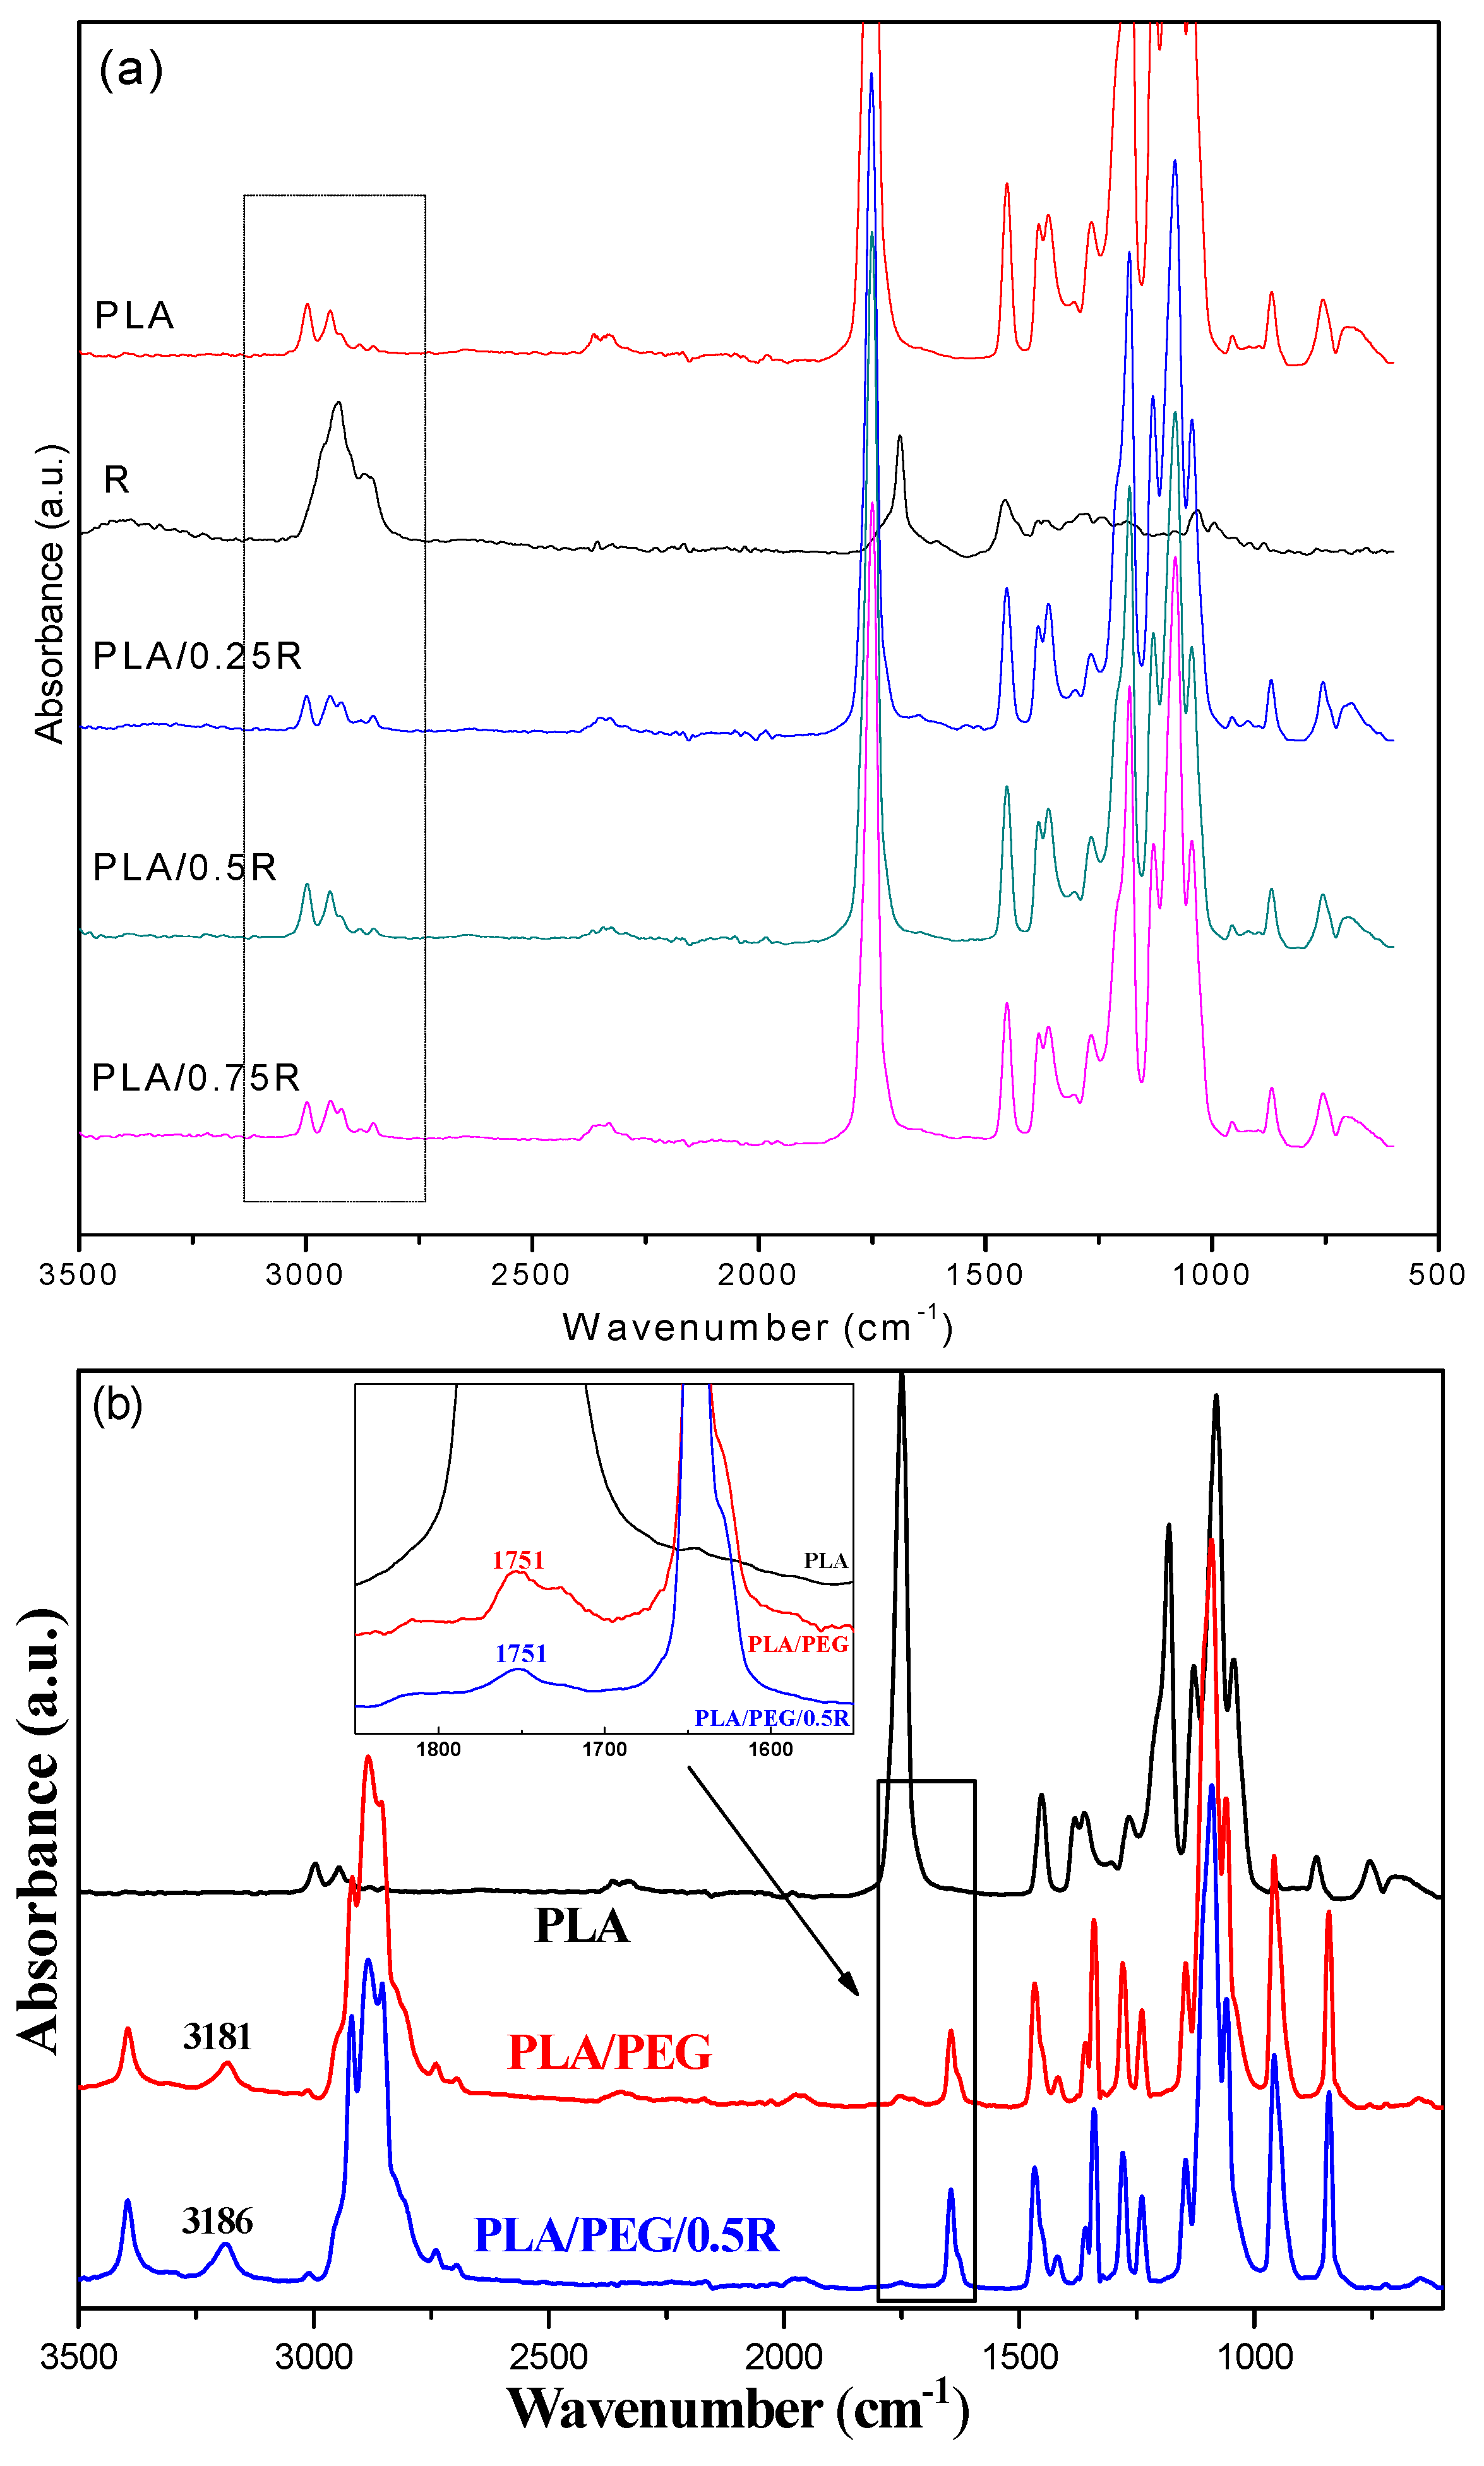
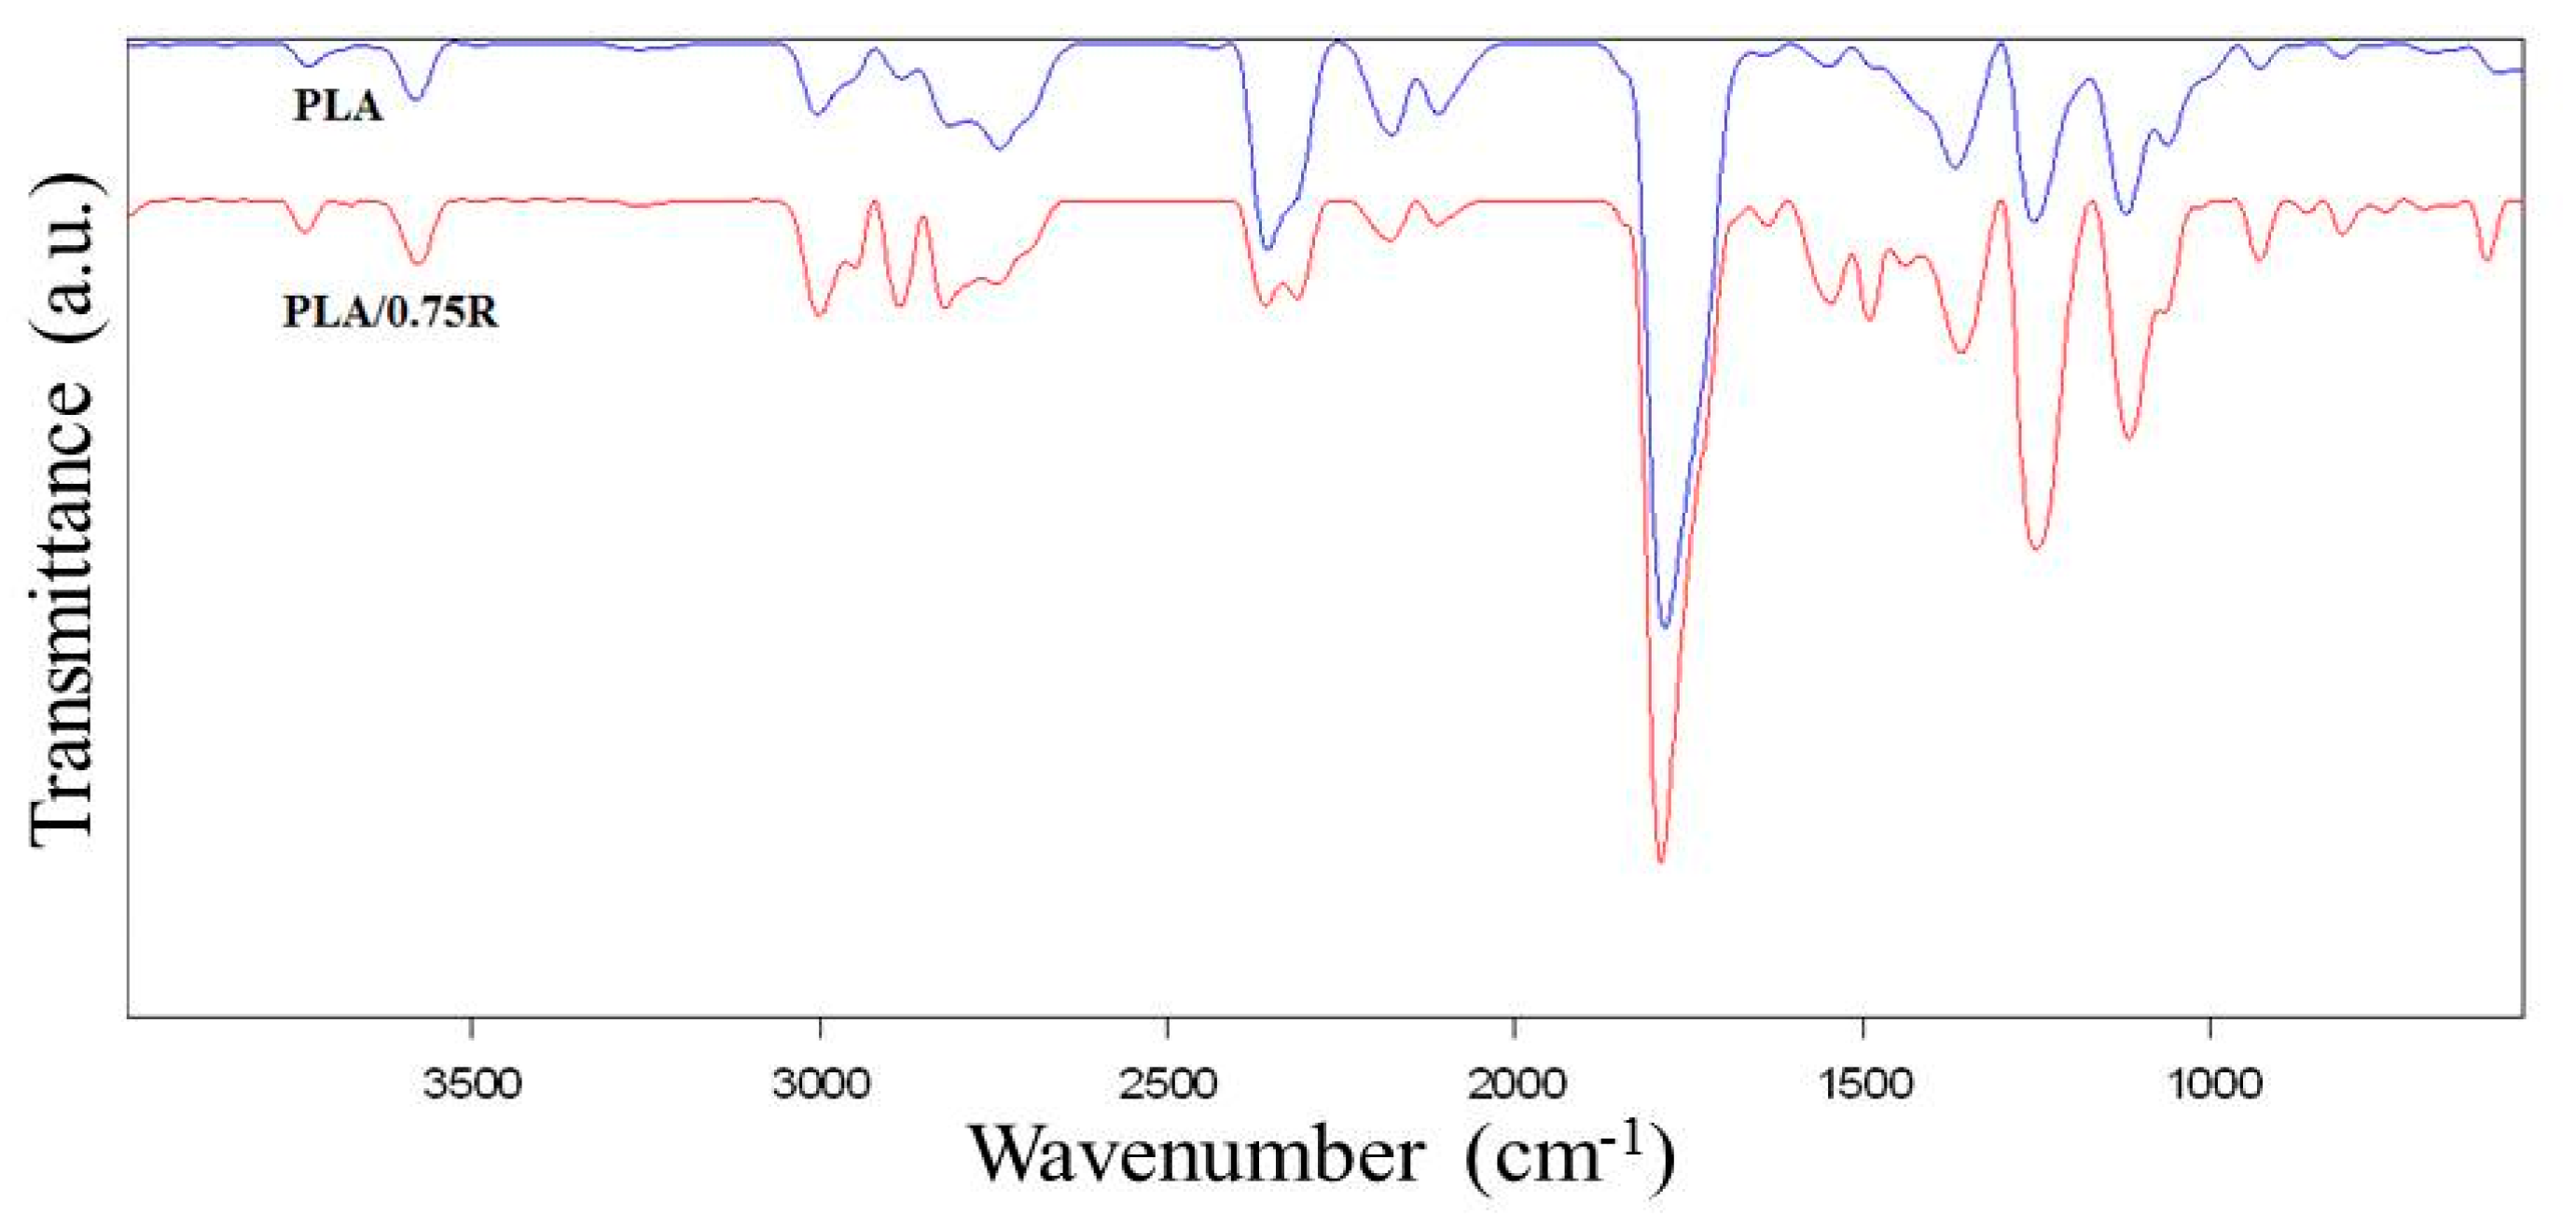
3.3. ATR-FTIR Data
3.4. Mechanical Properties
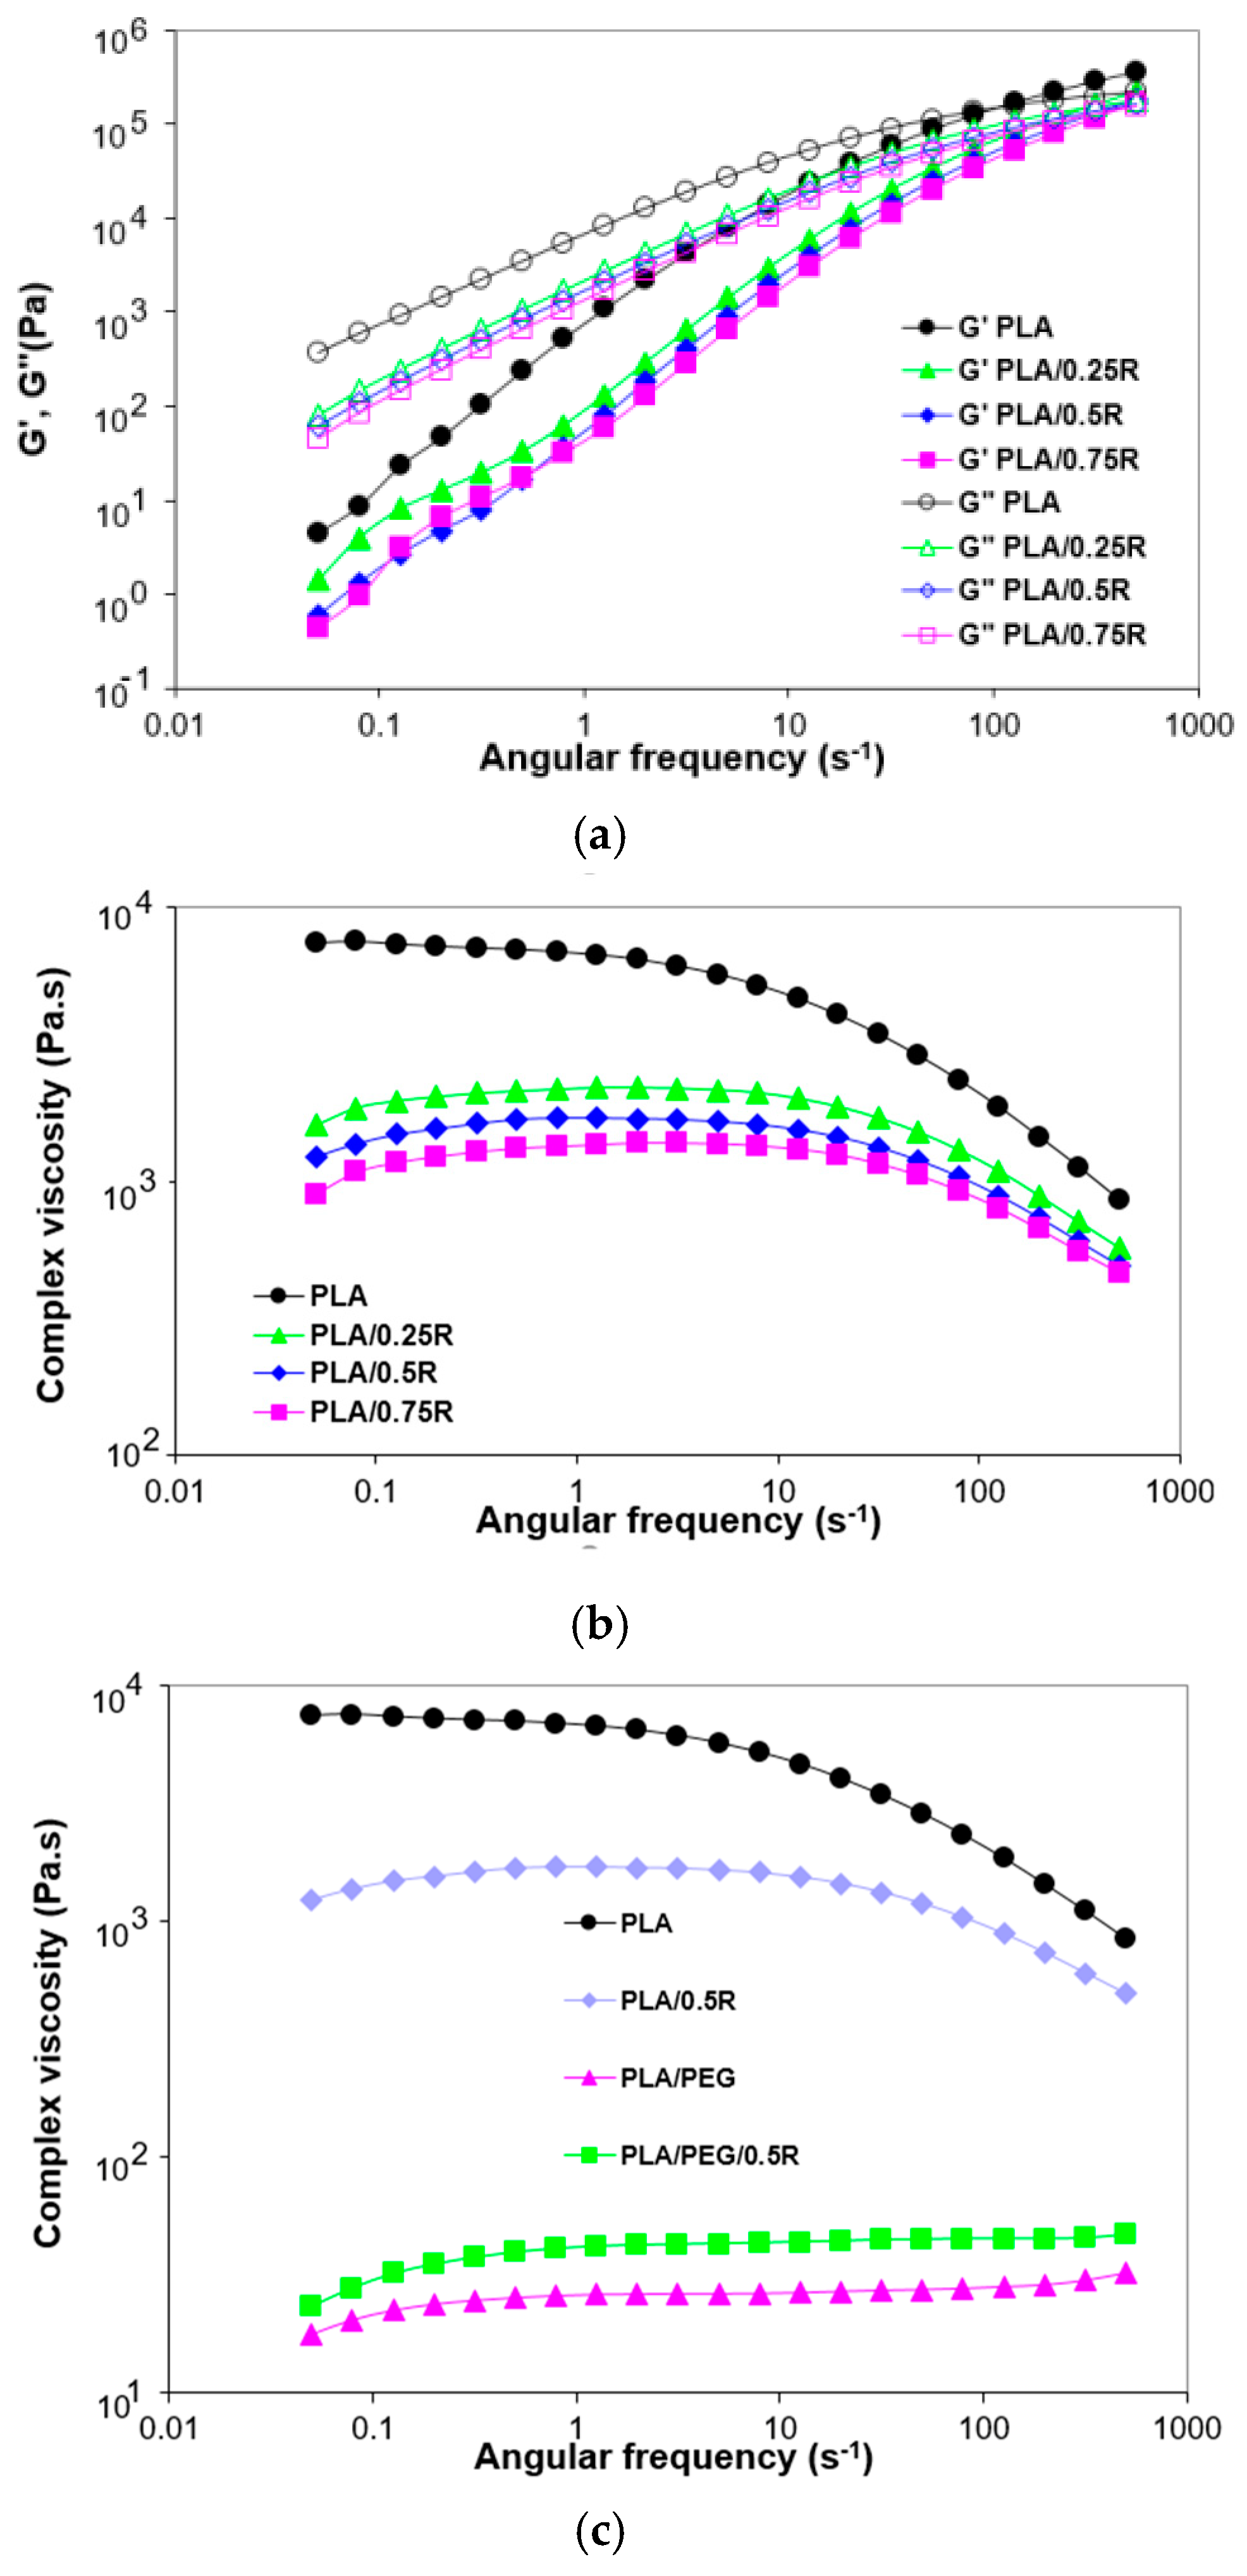
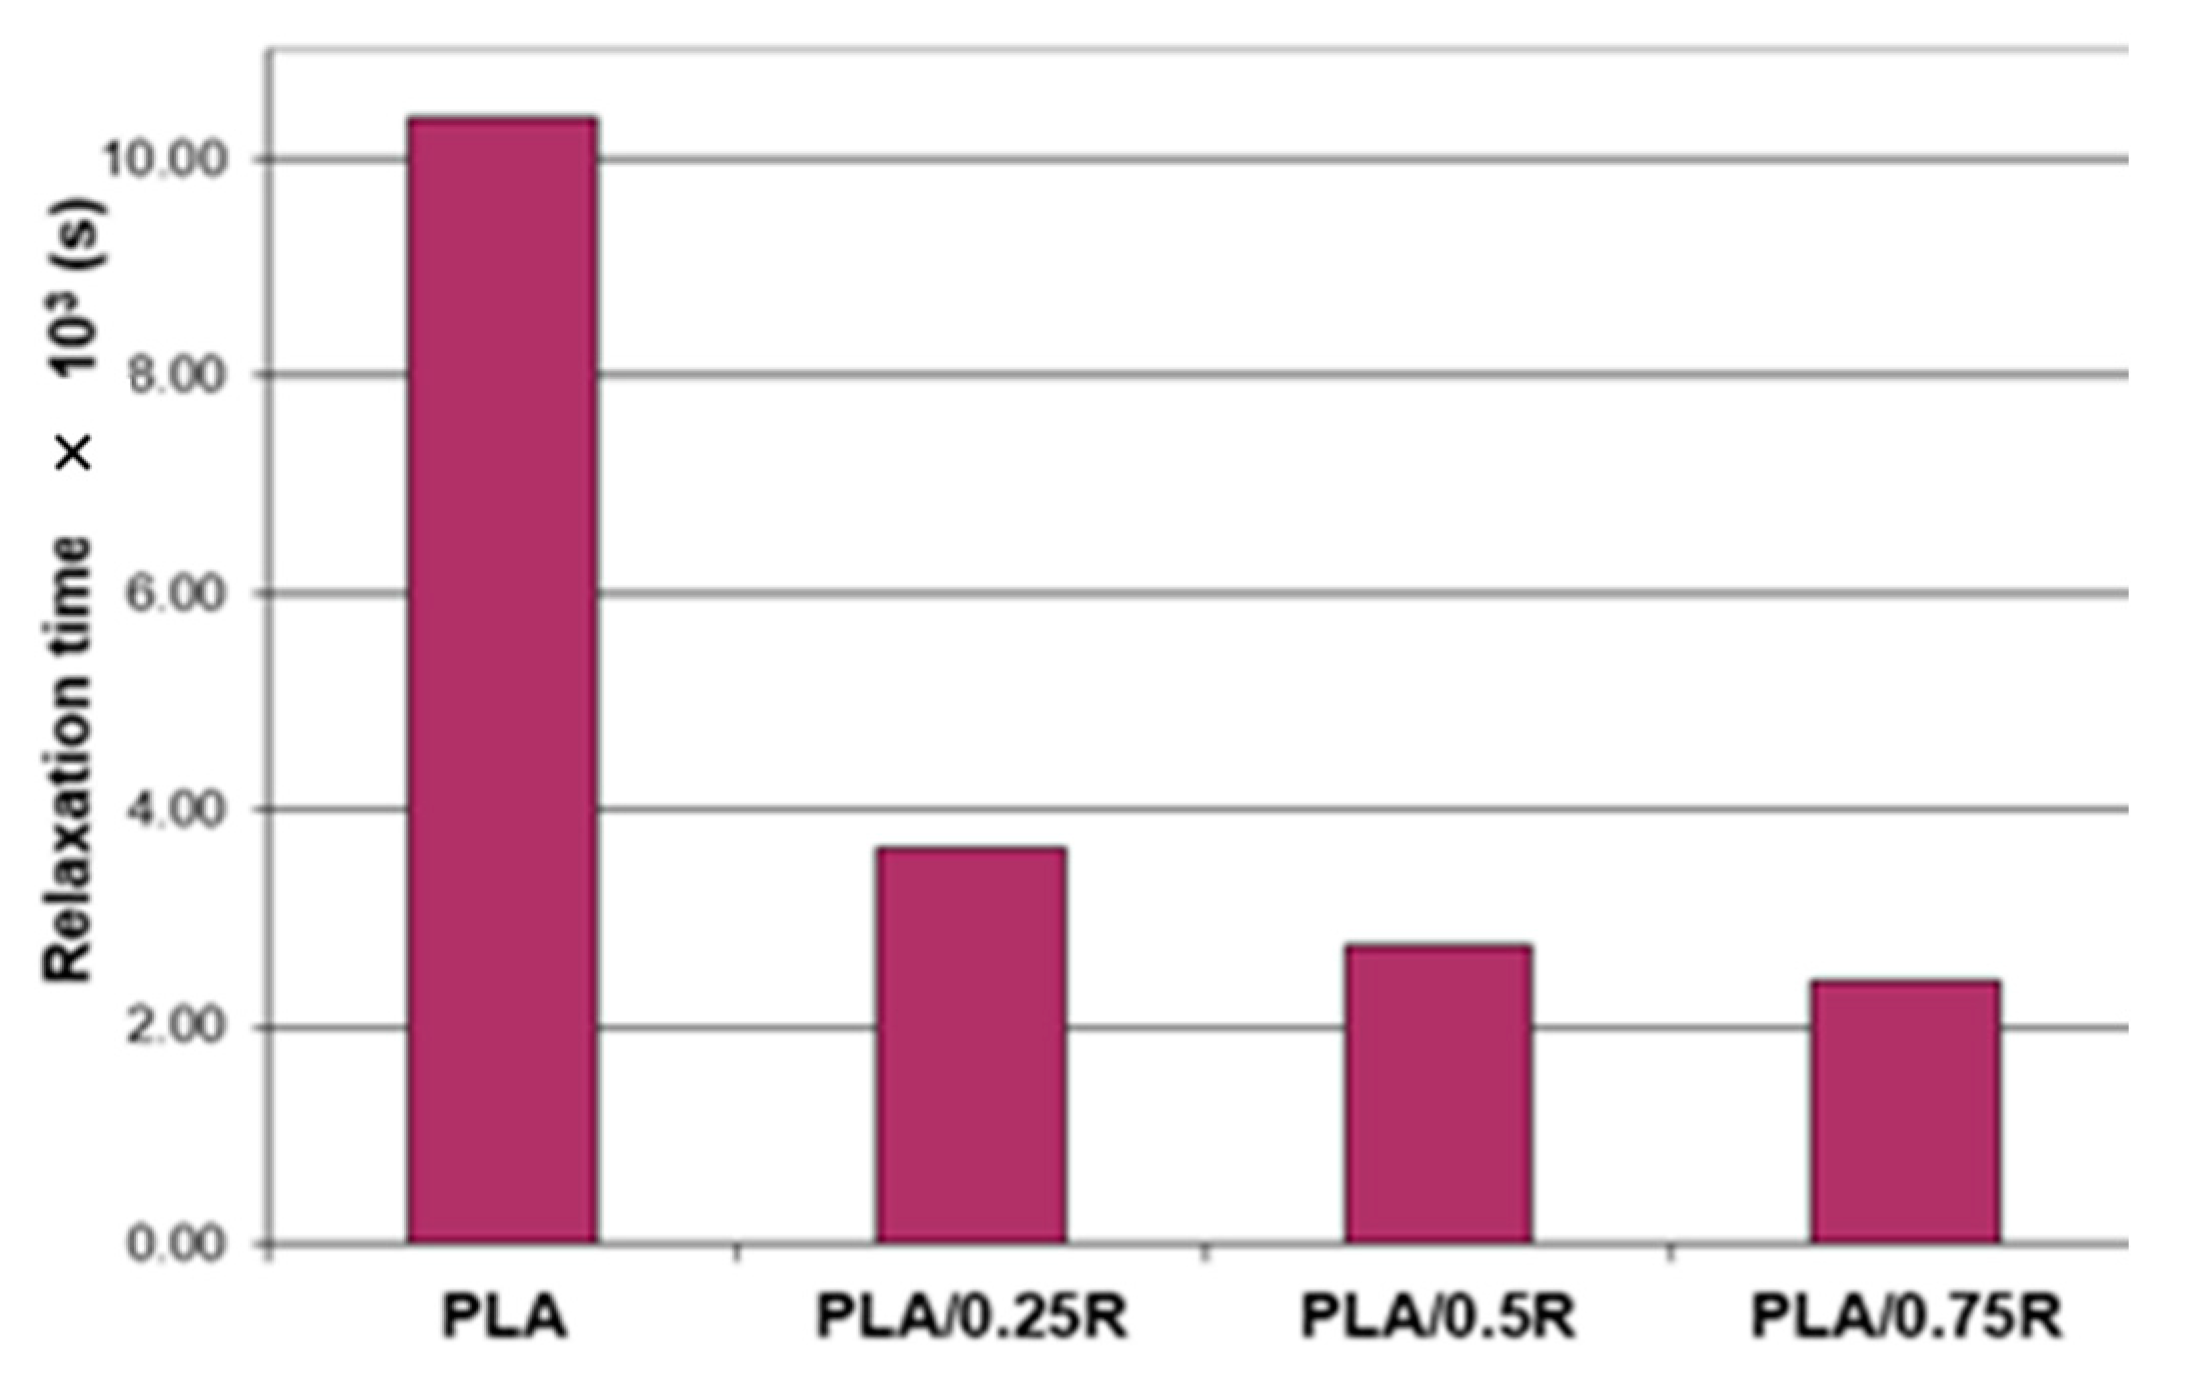
3.5. Rheological Behavior
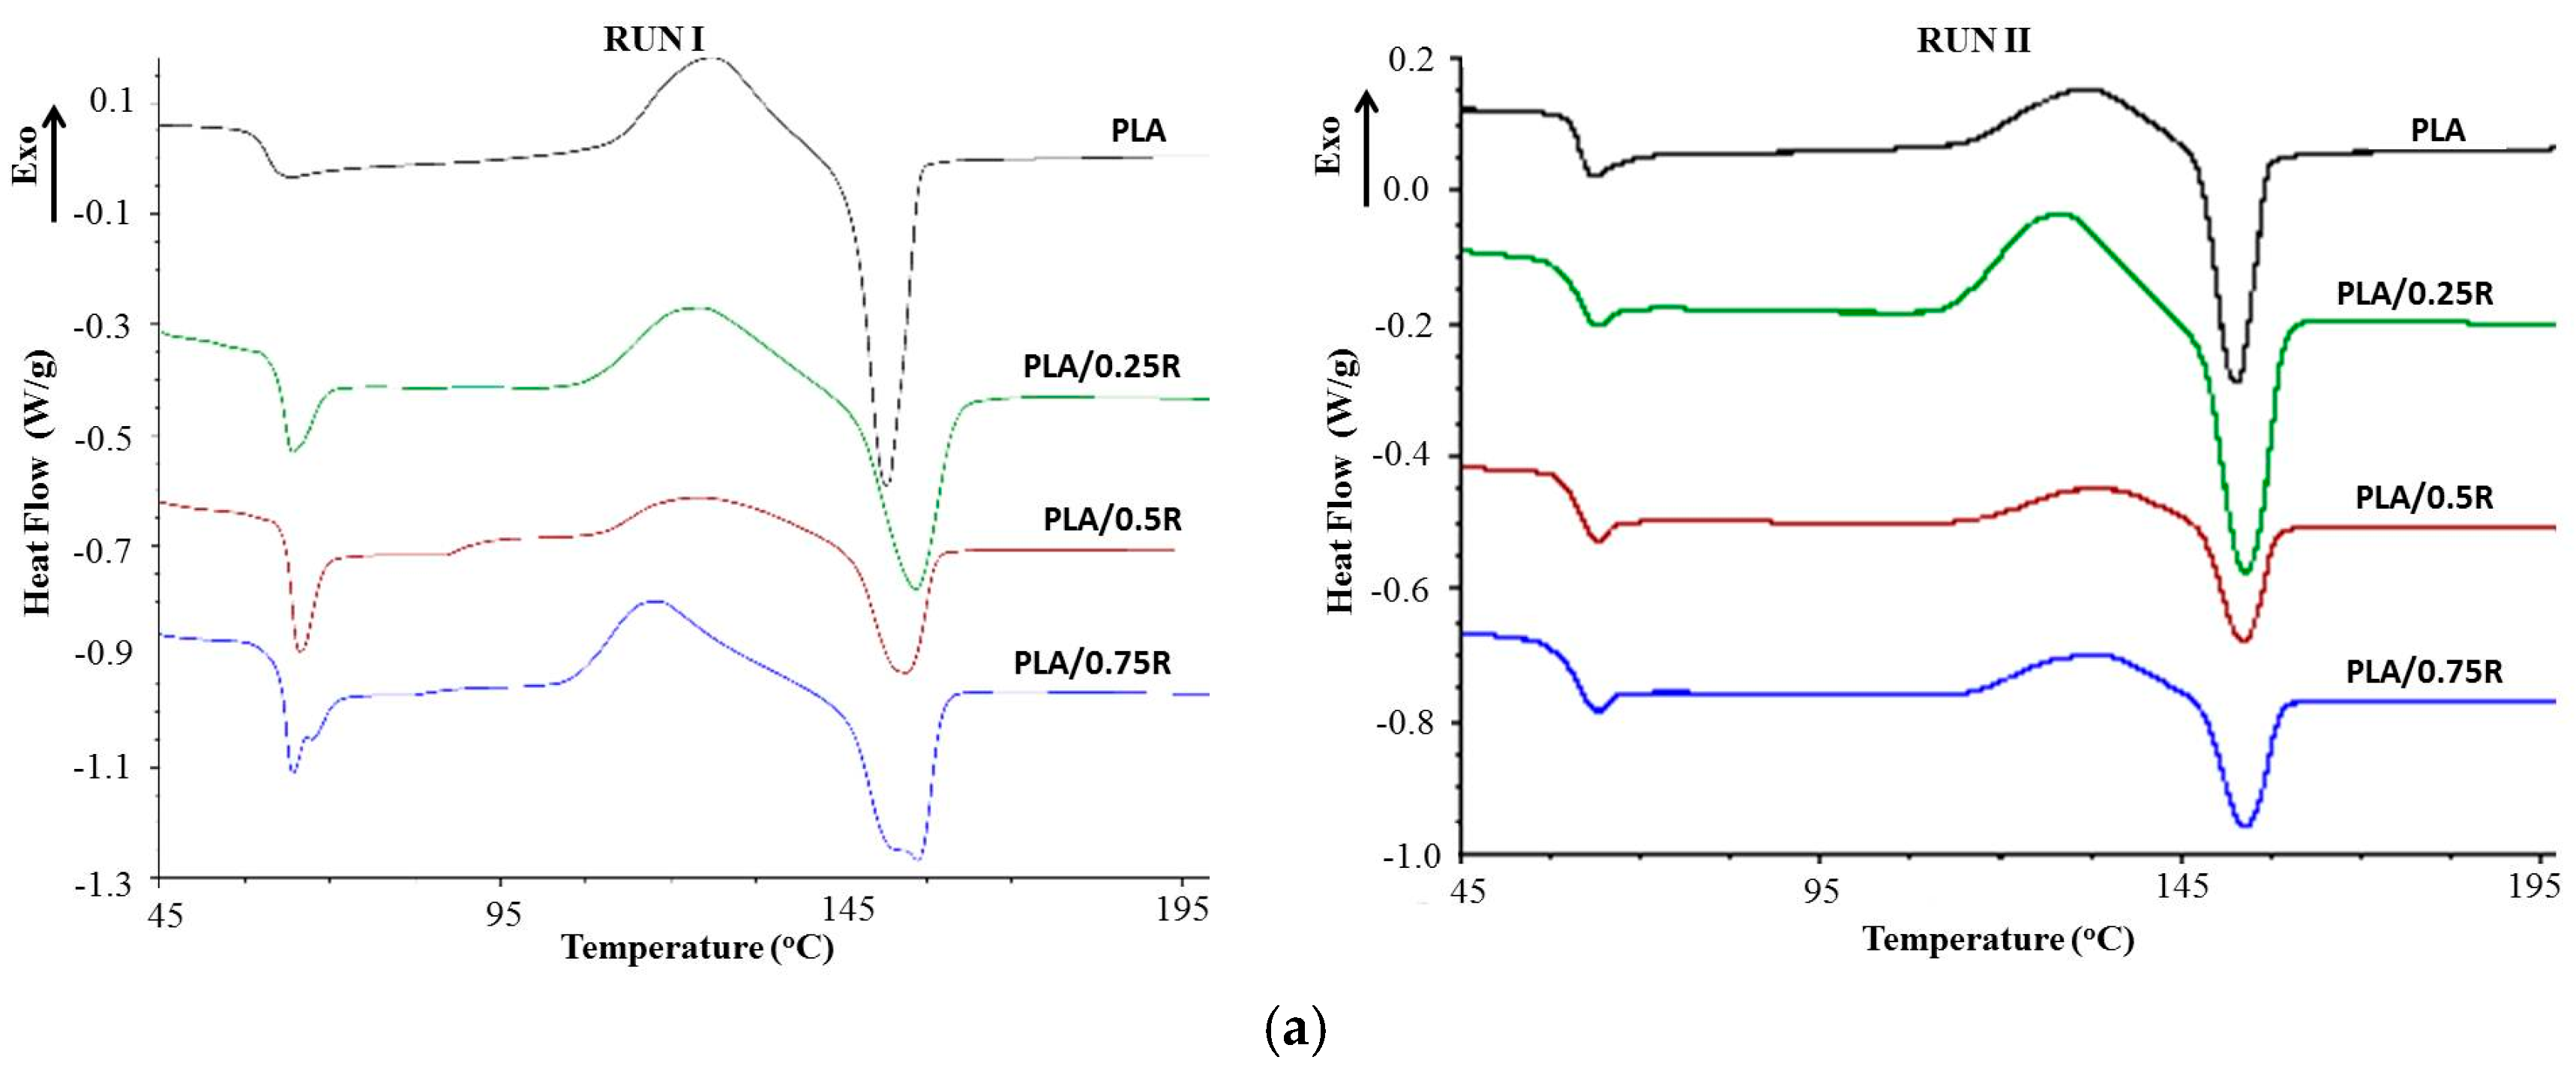
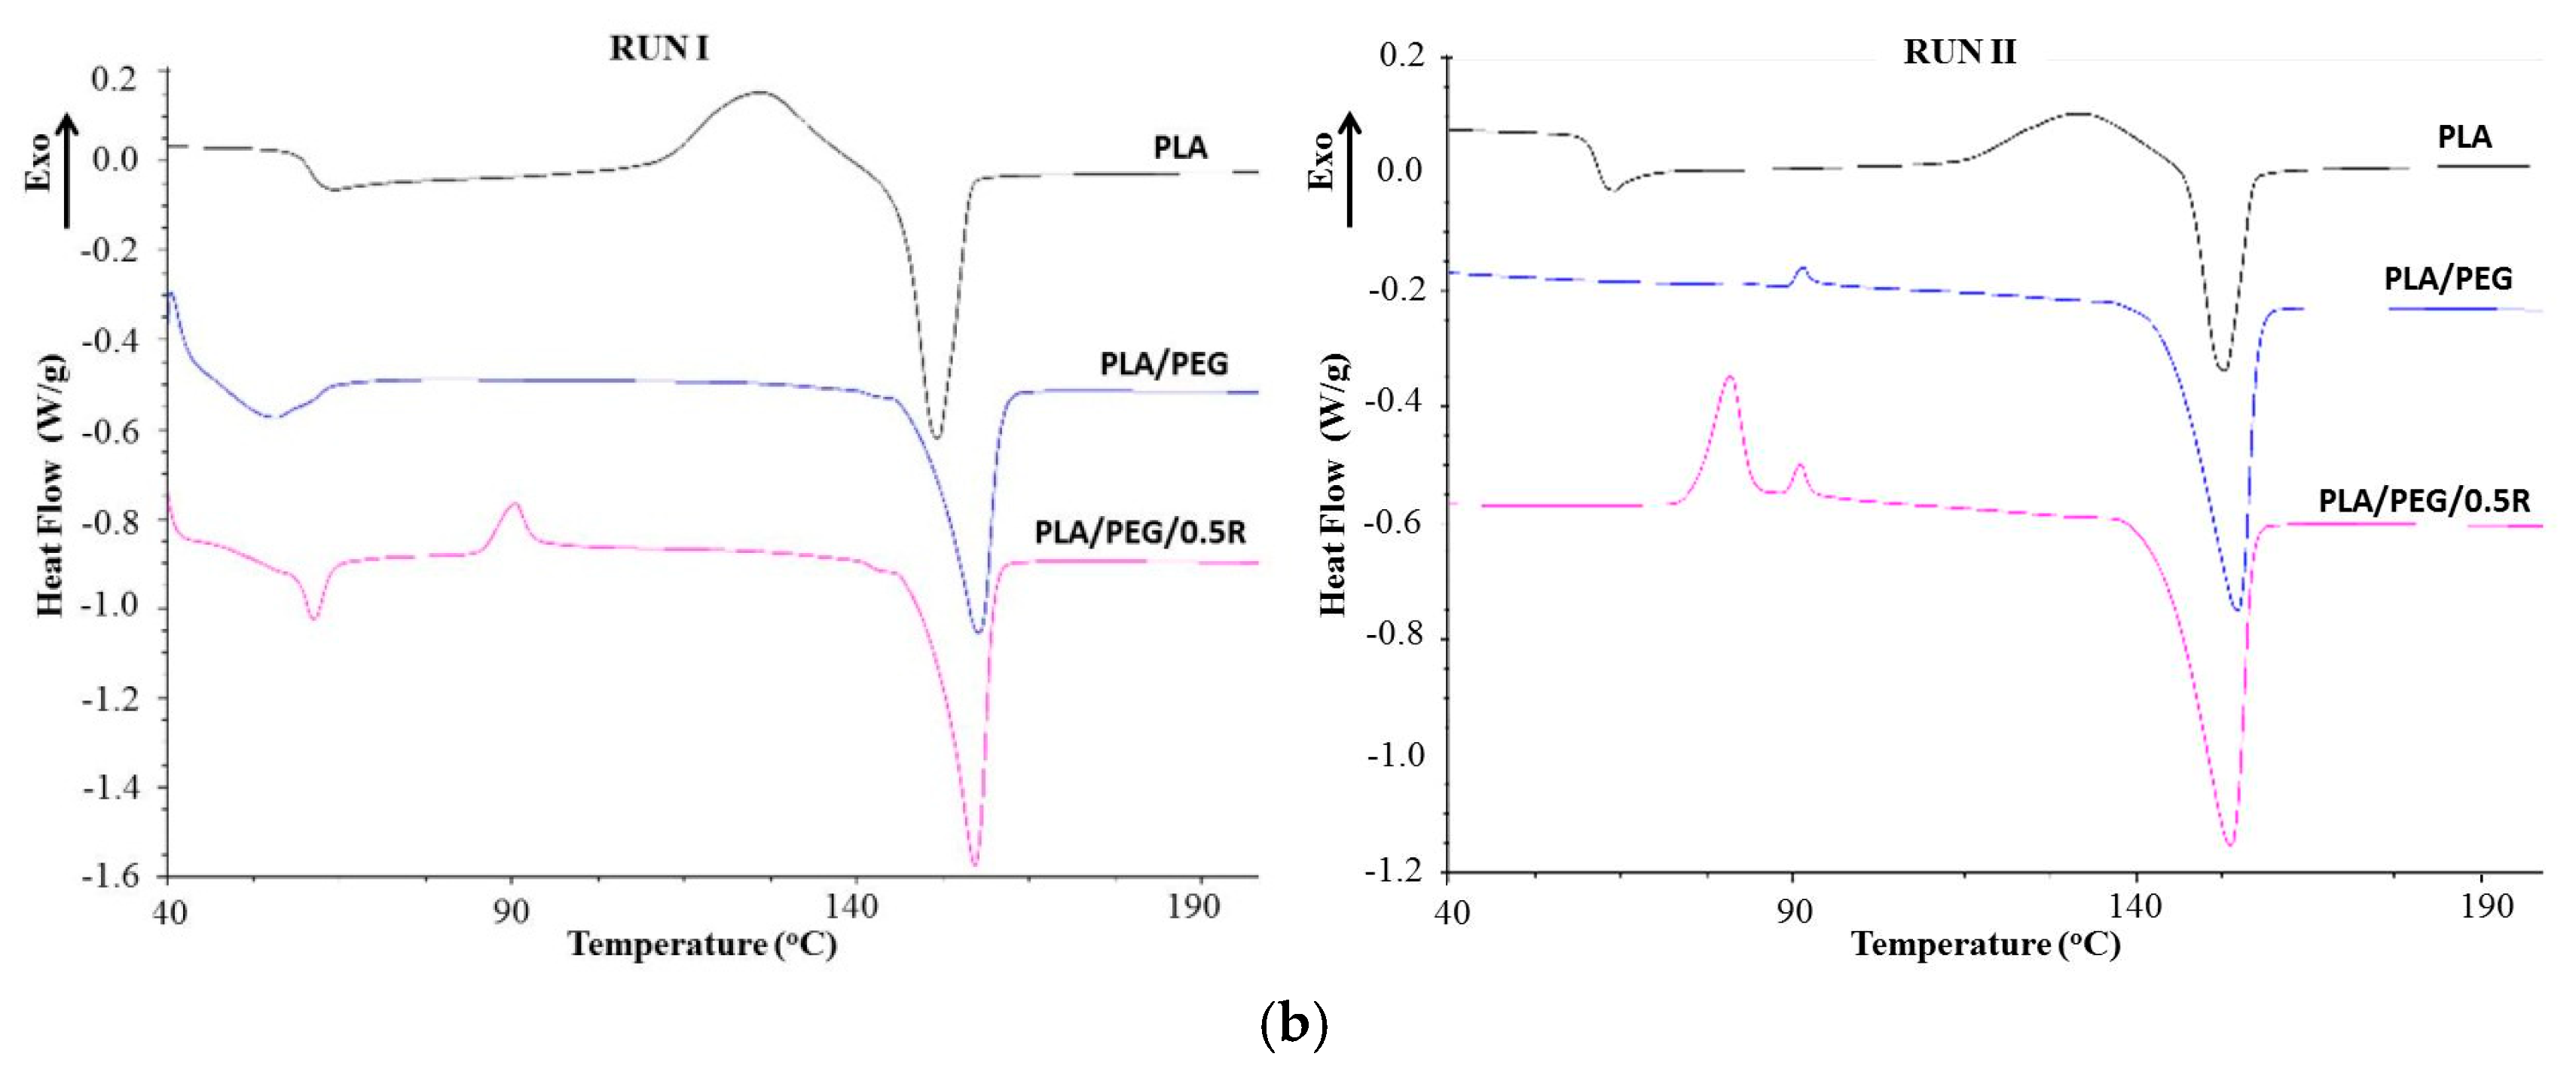
3.6. DSC Results
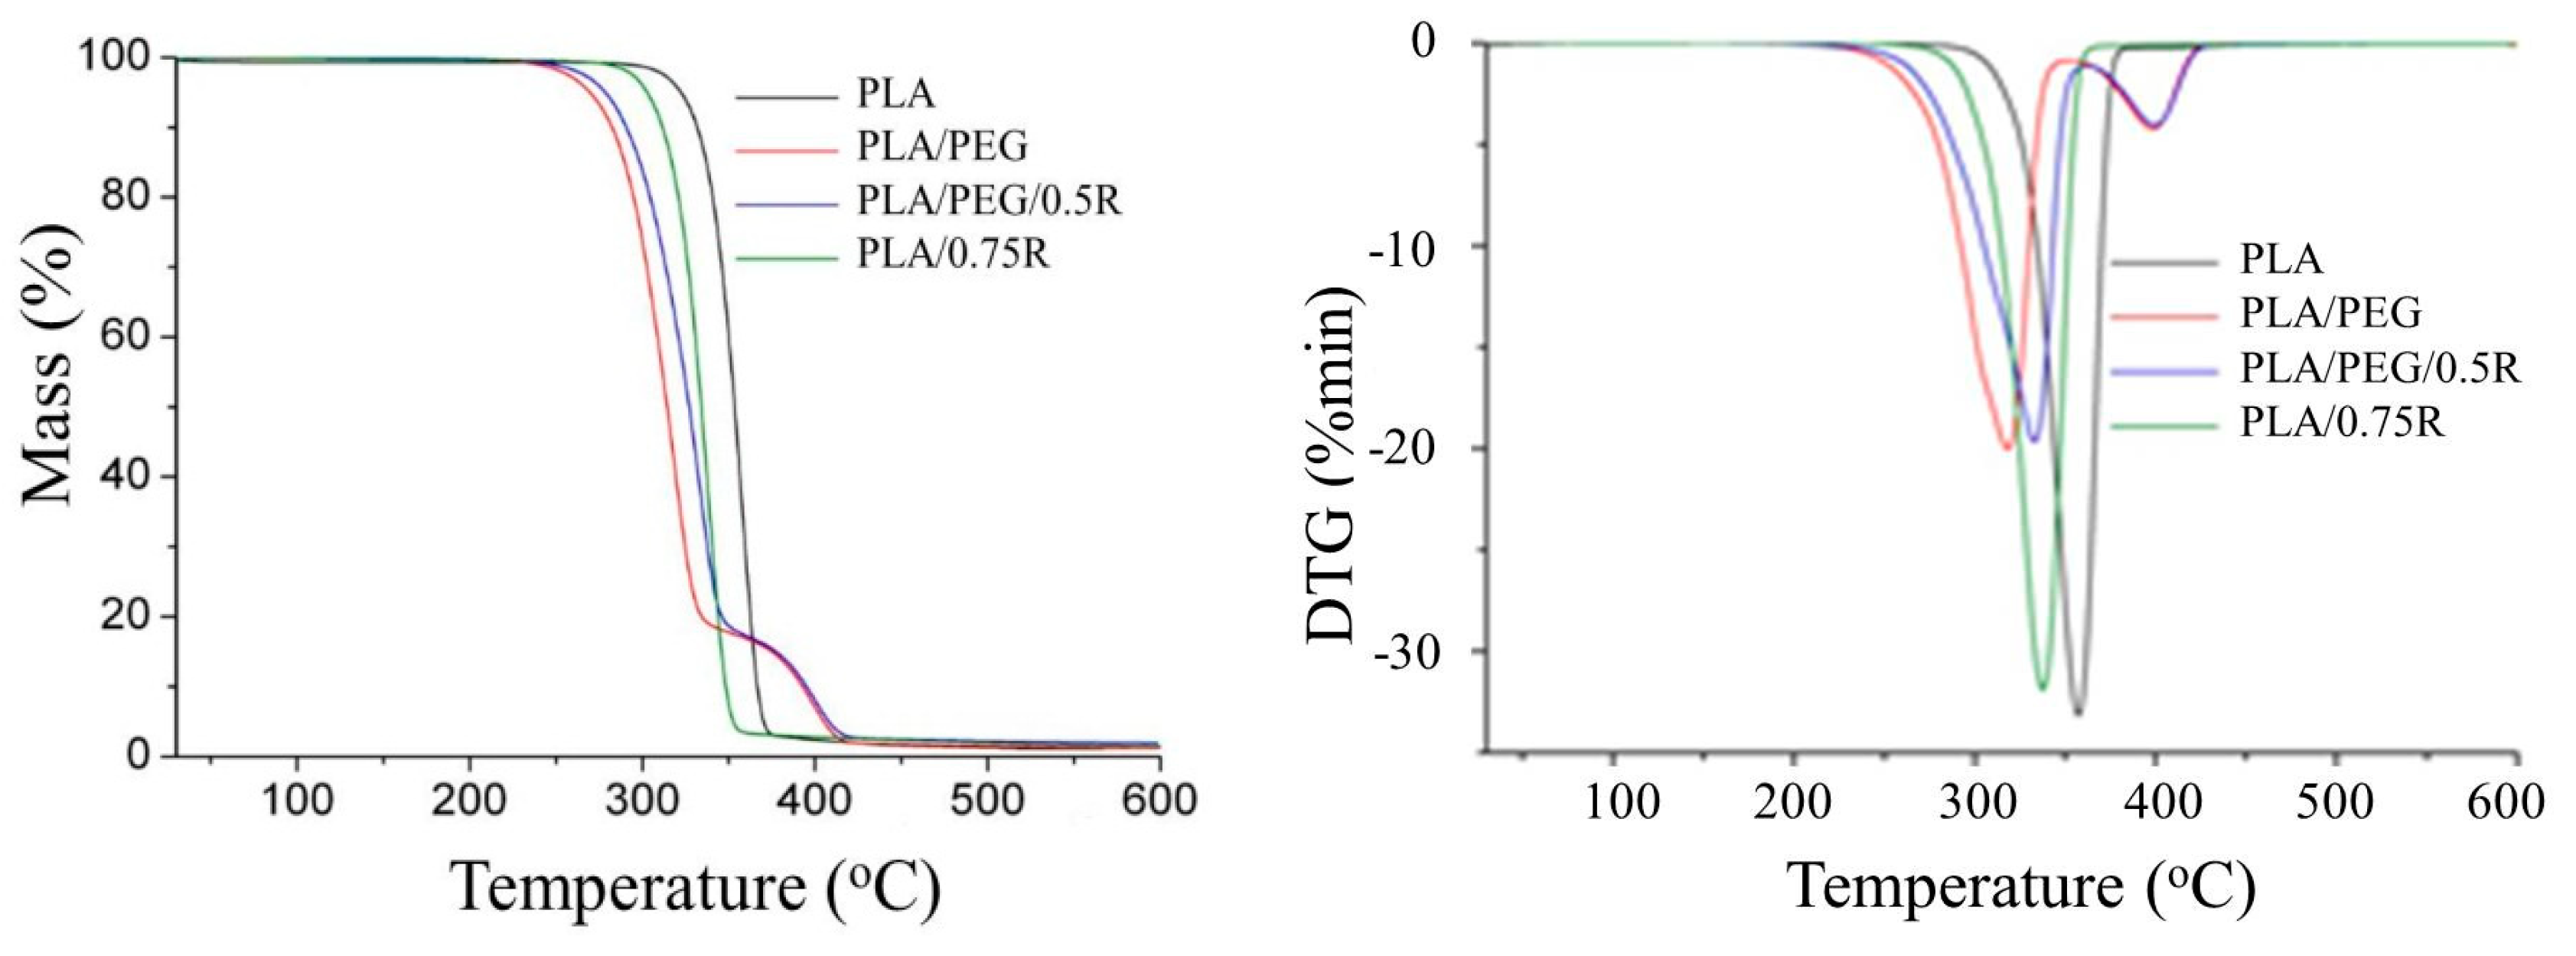
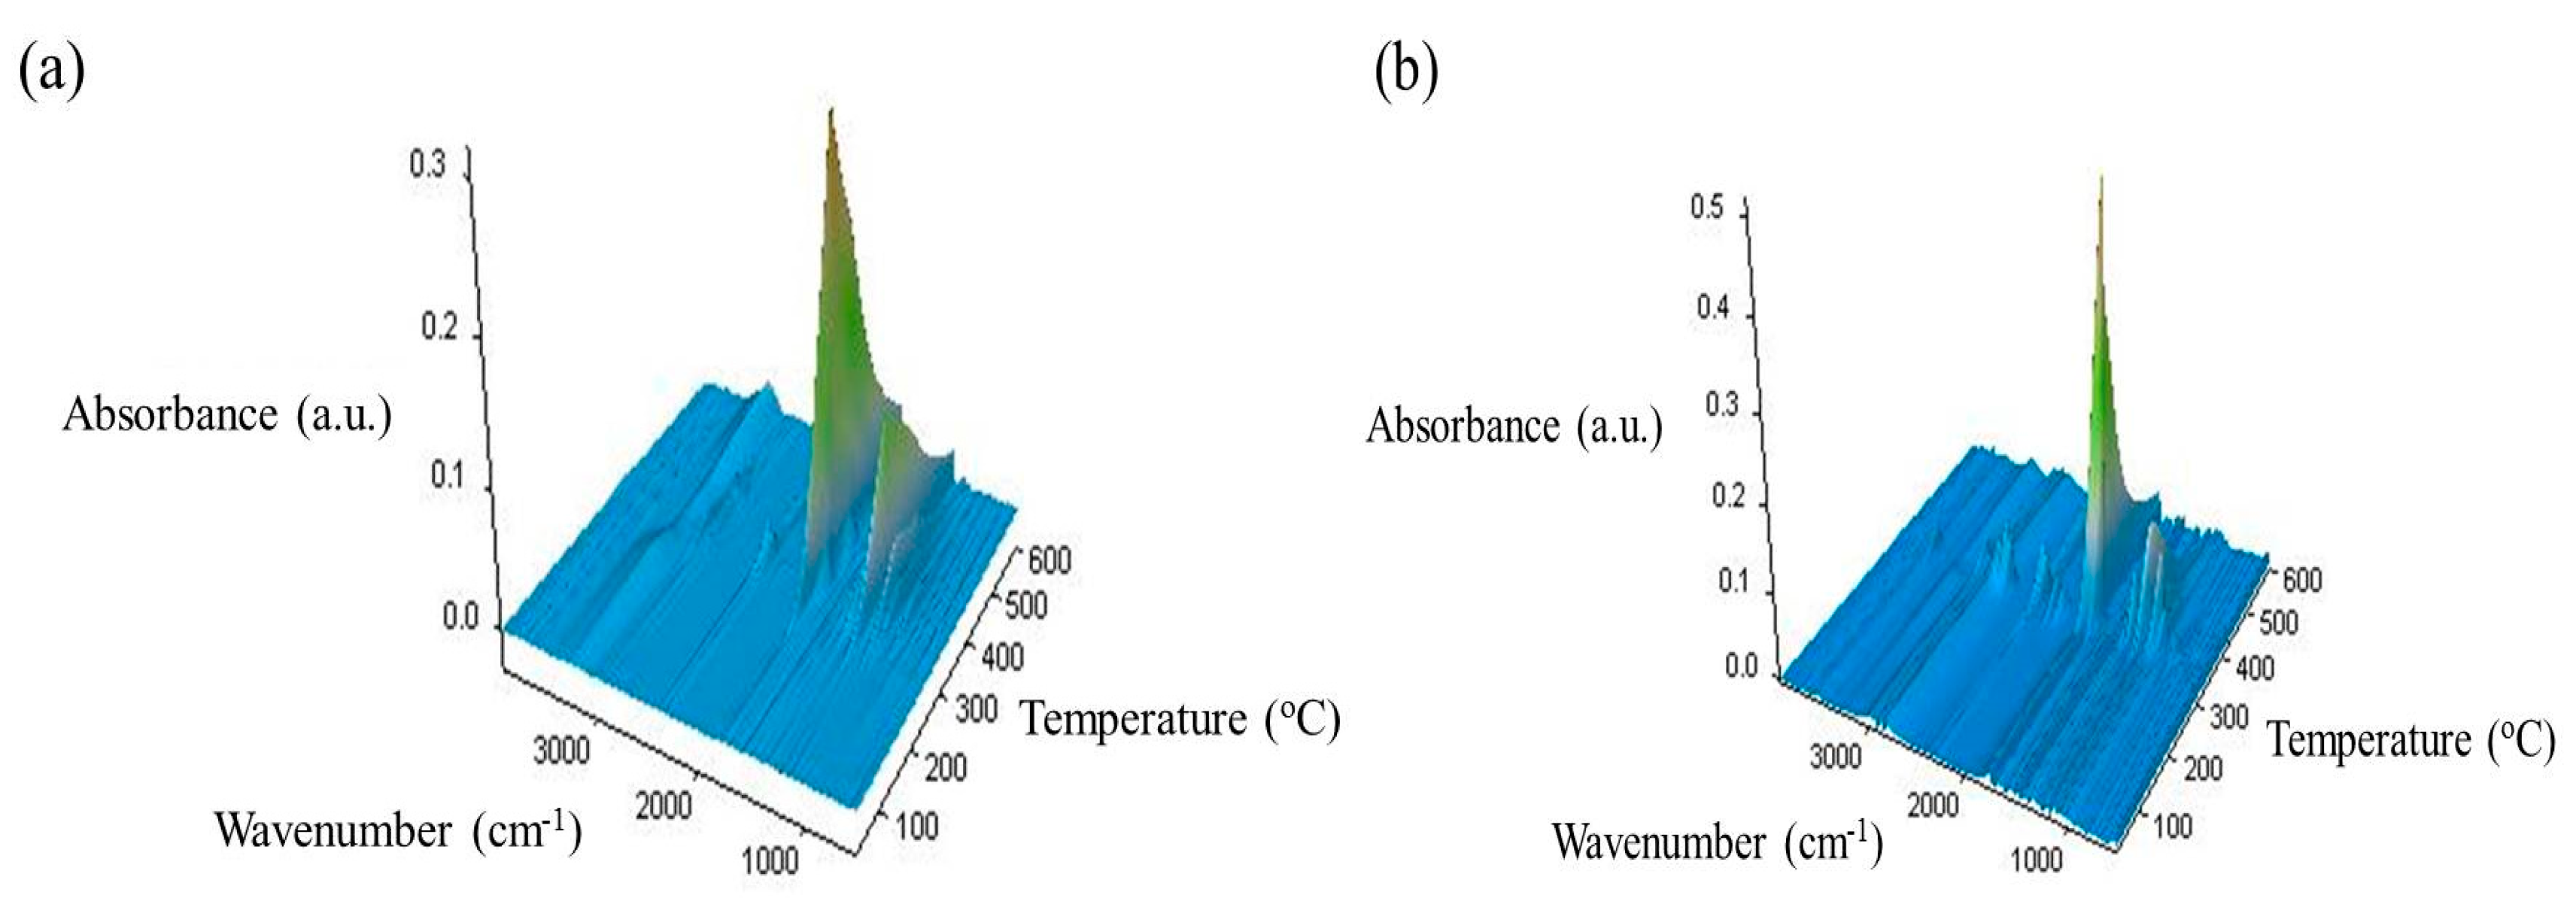
3.7. TG-FTIR/MS Data
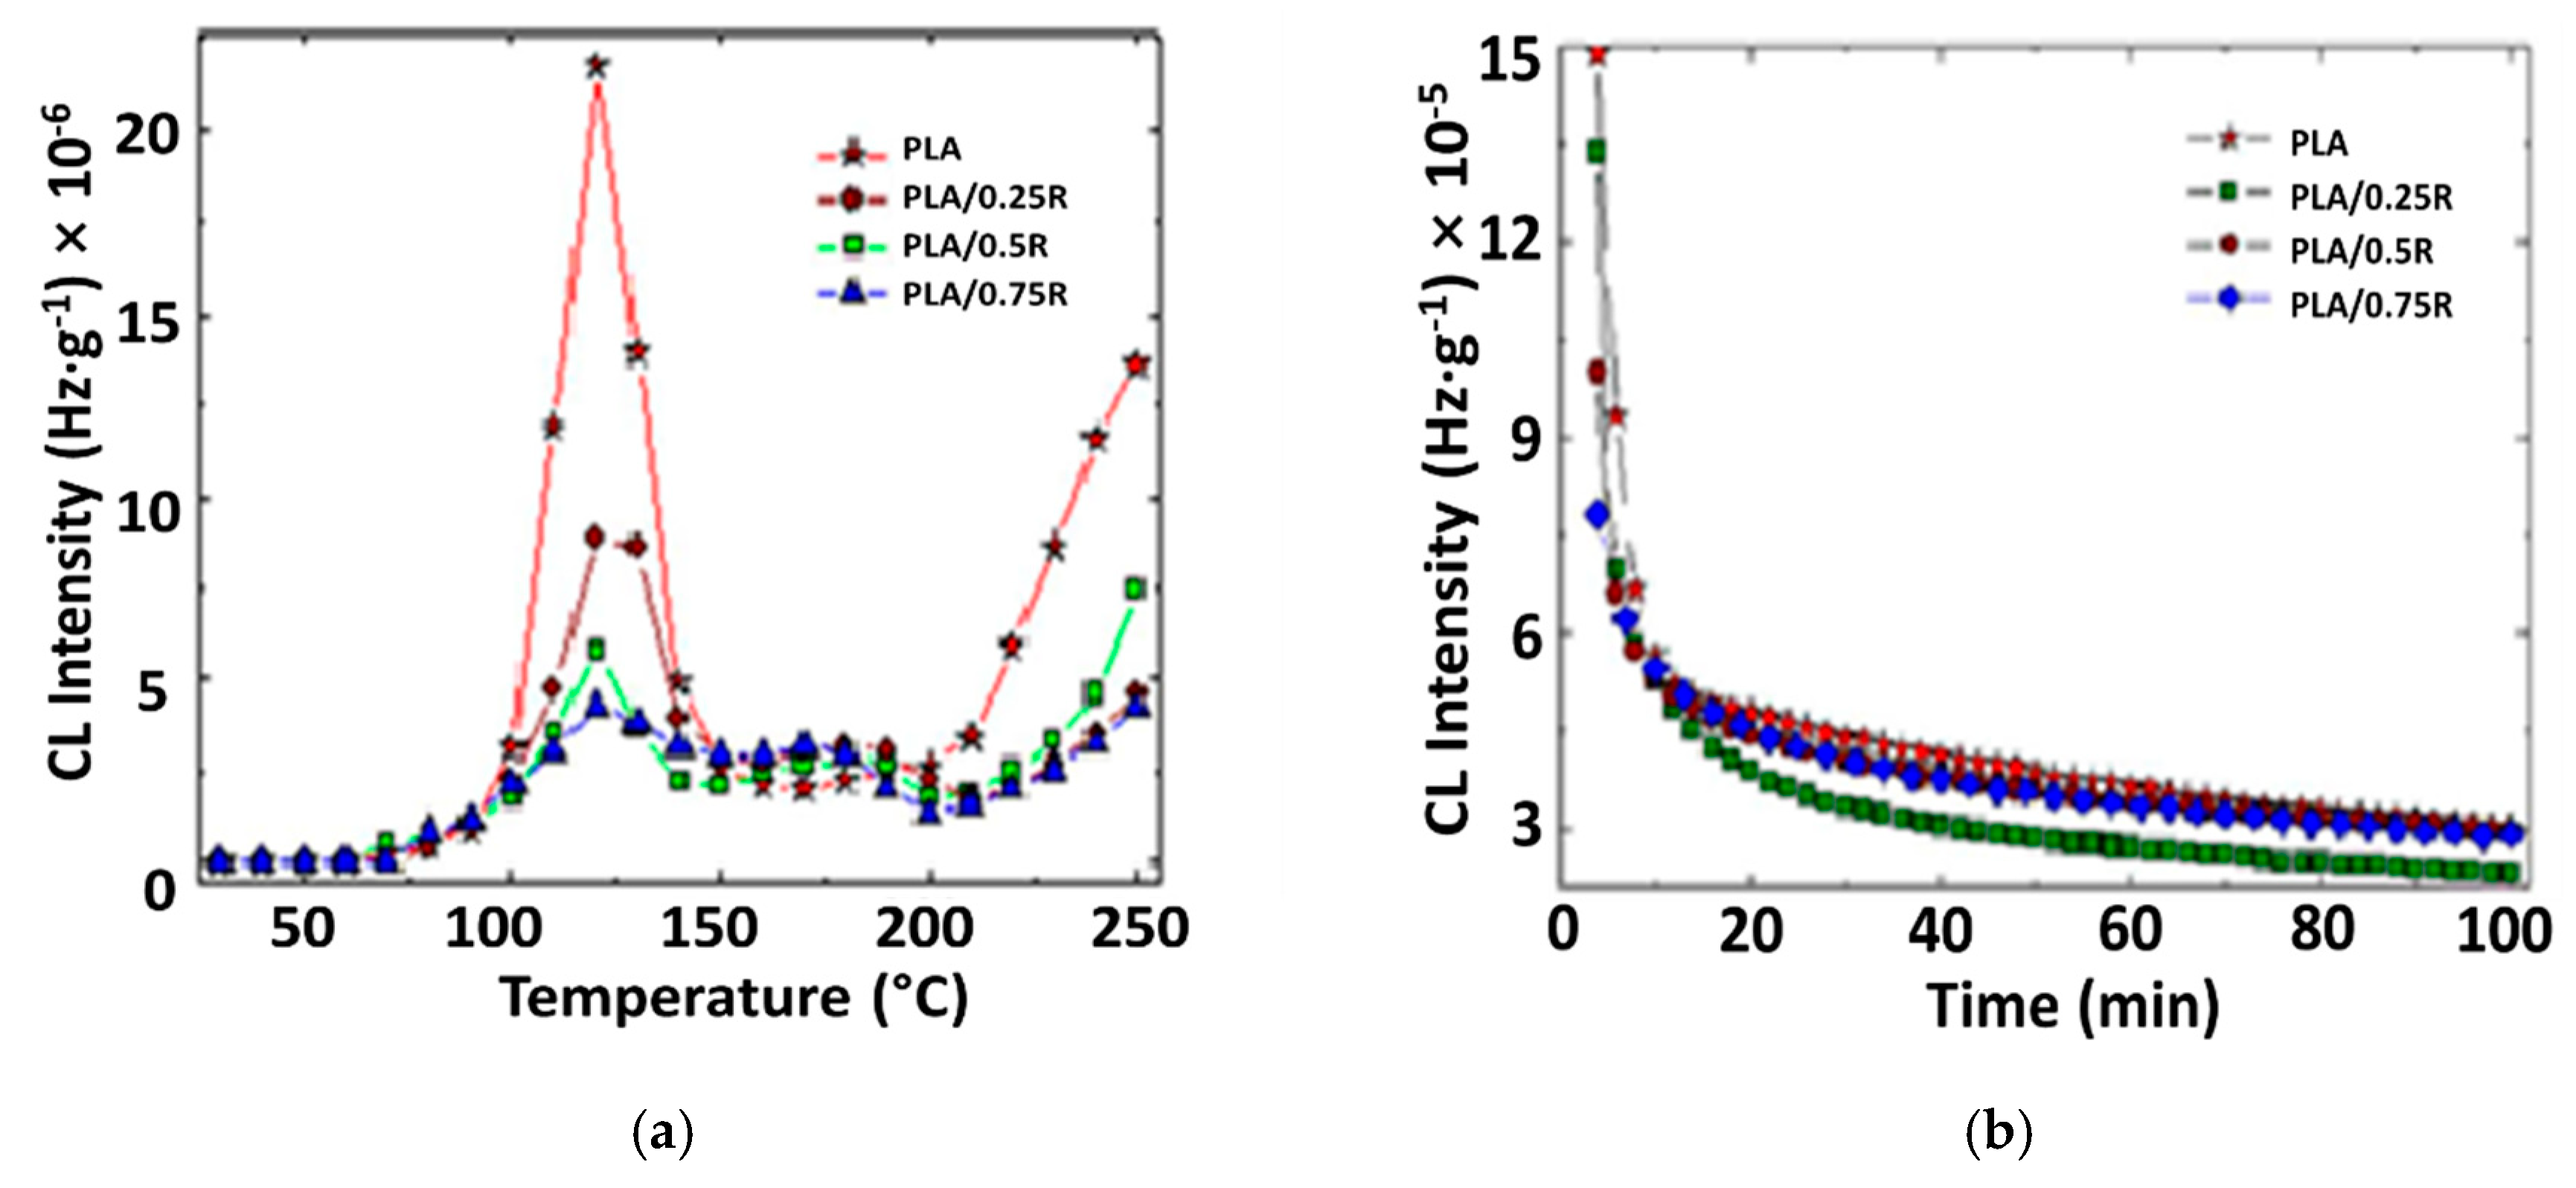
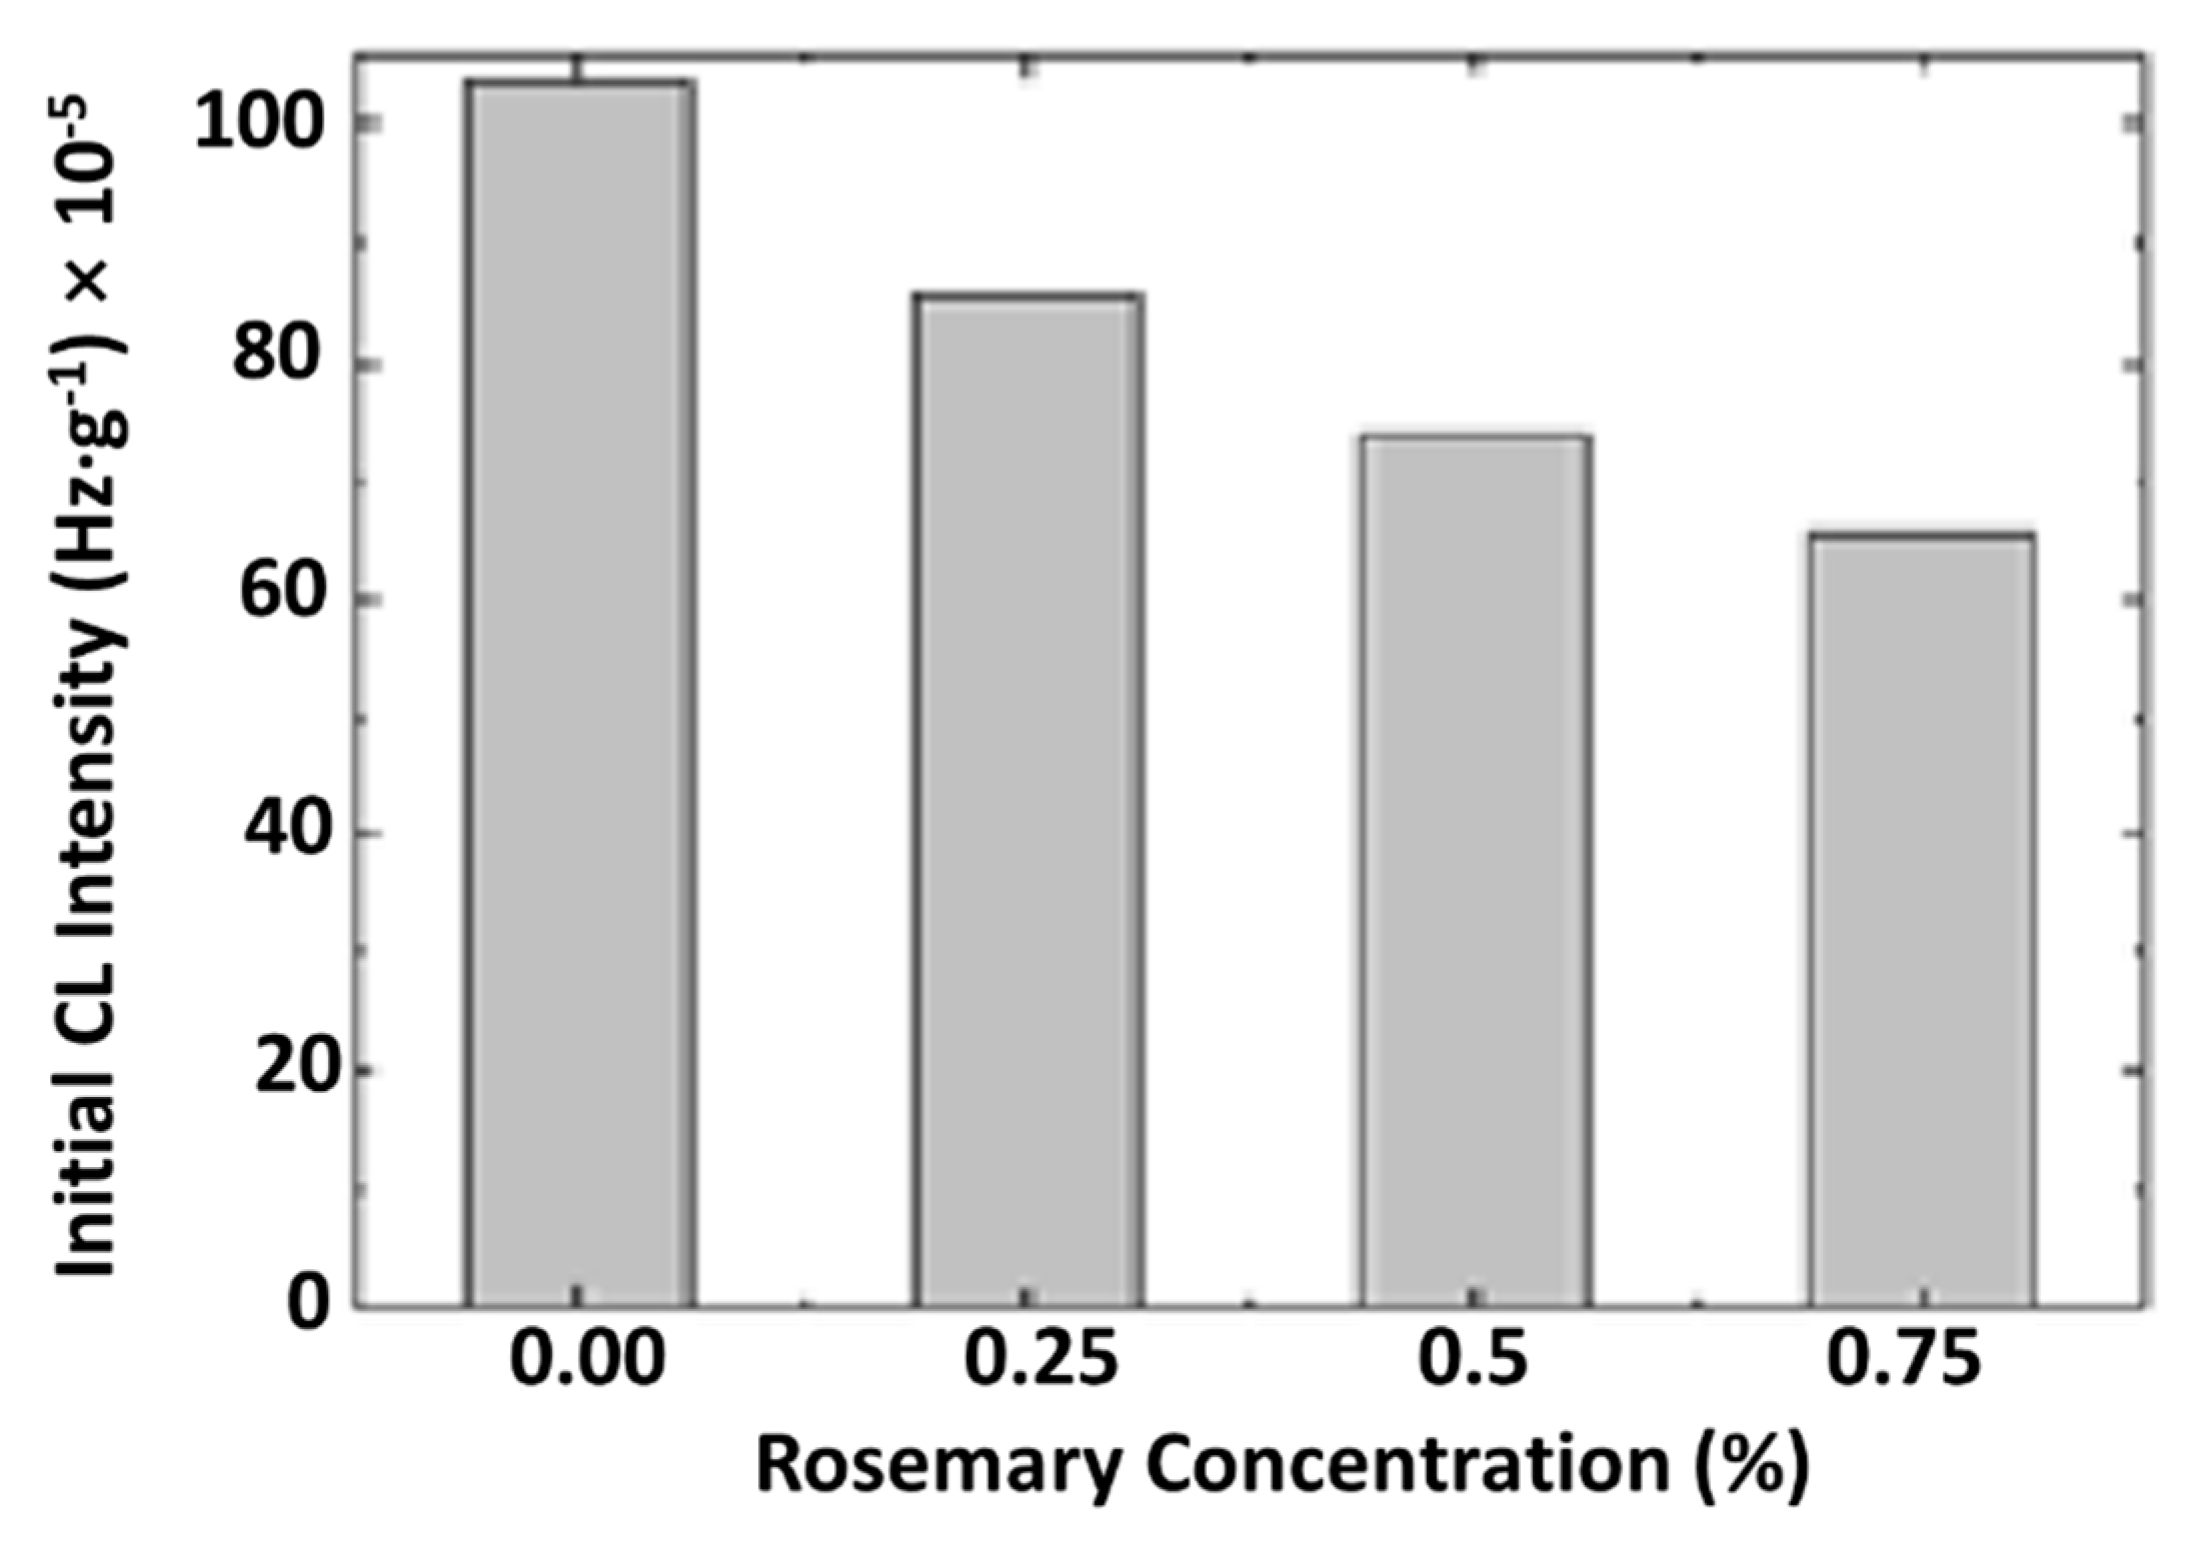
3.8. Chemiluminescence
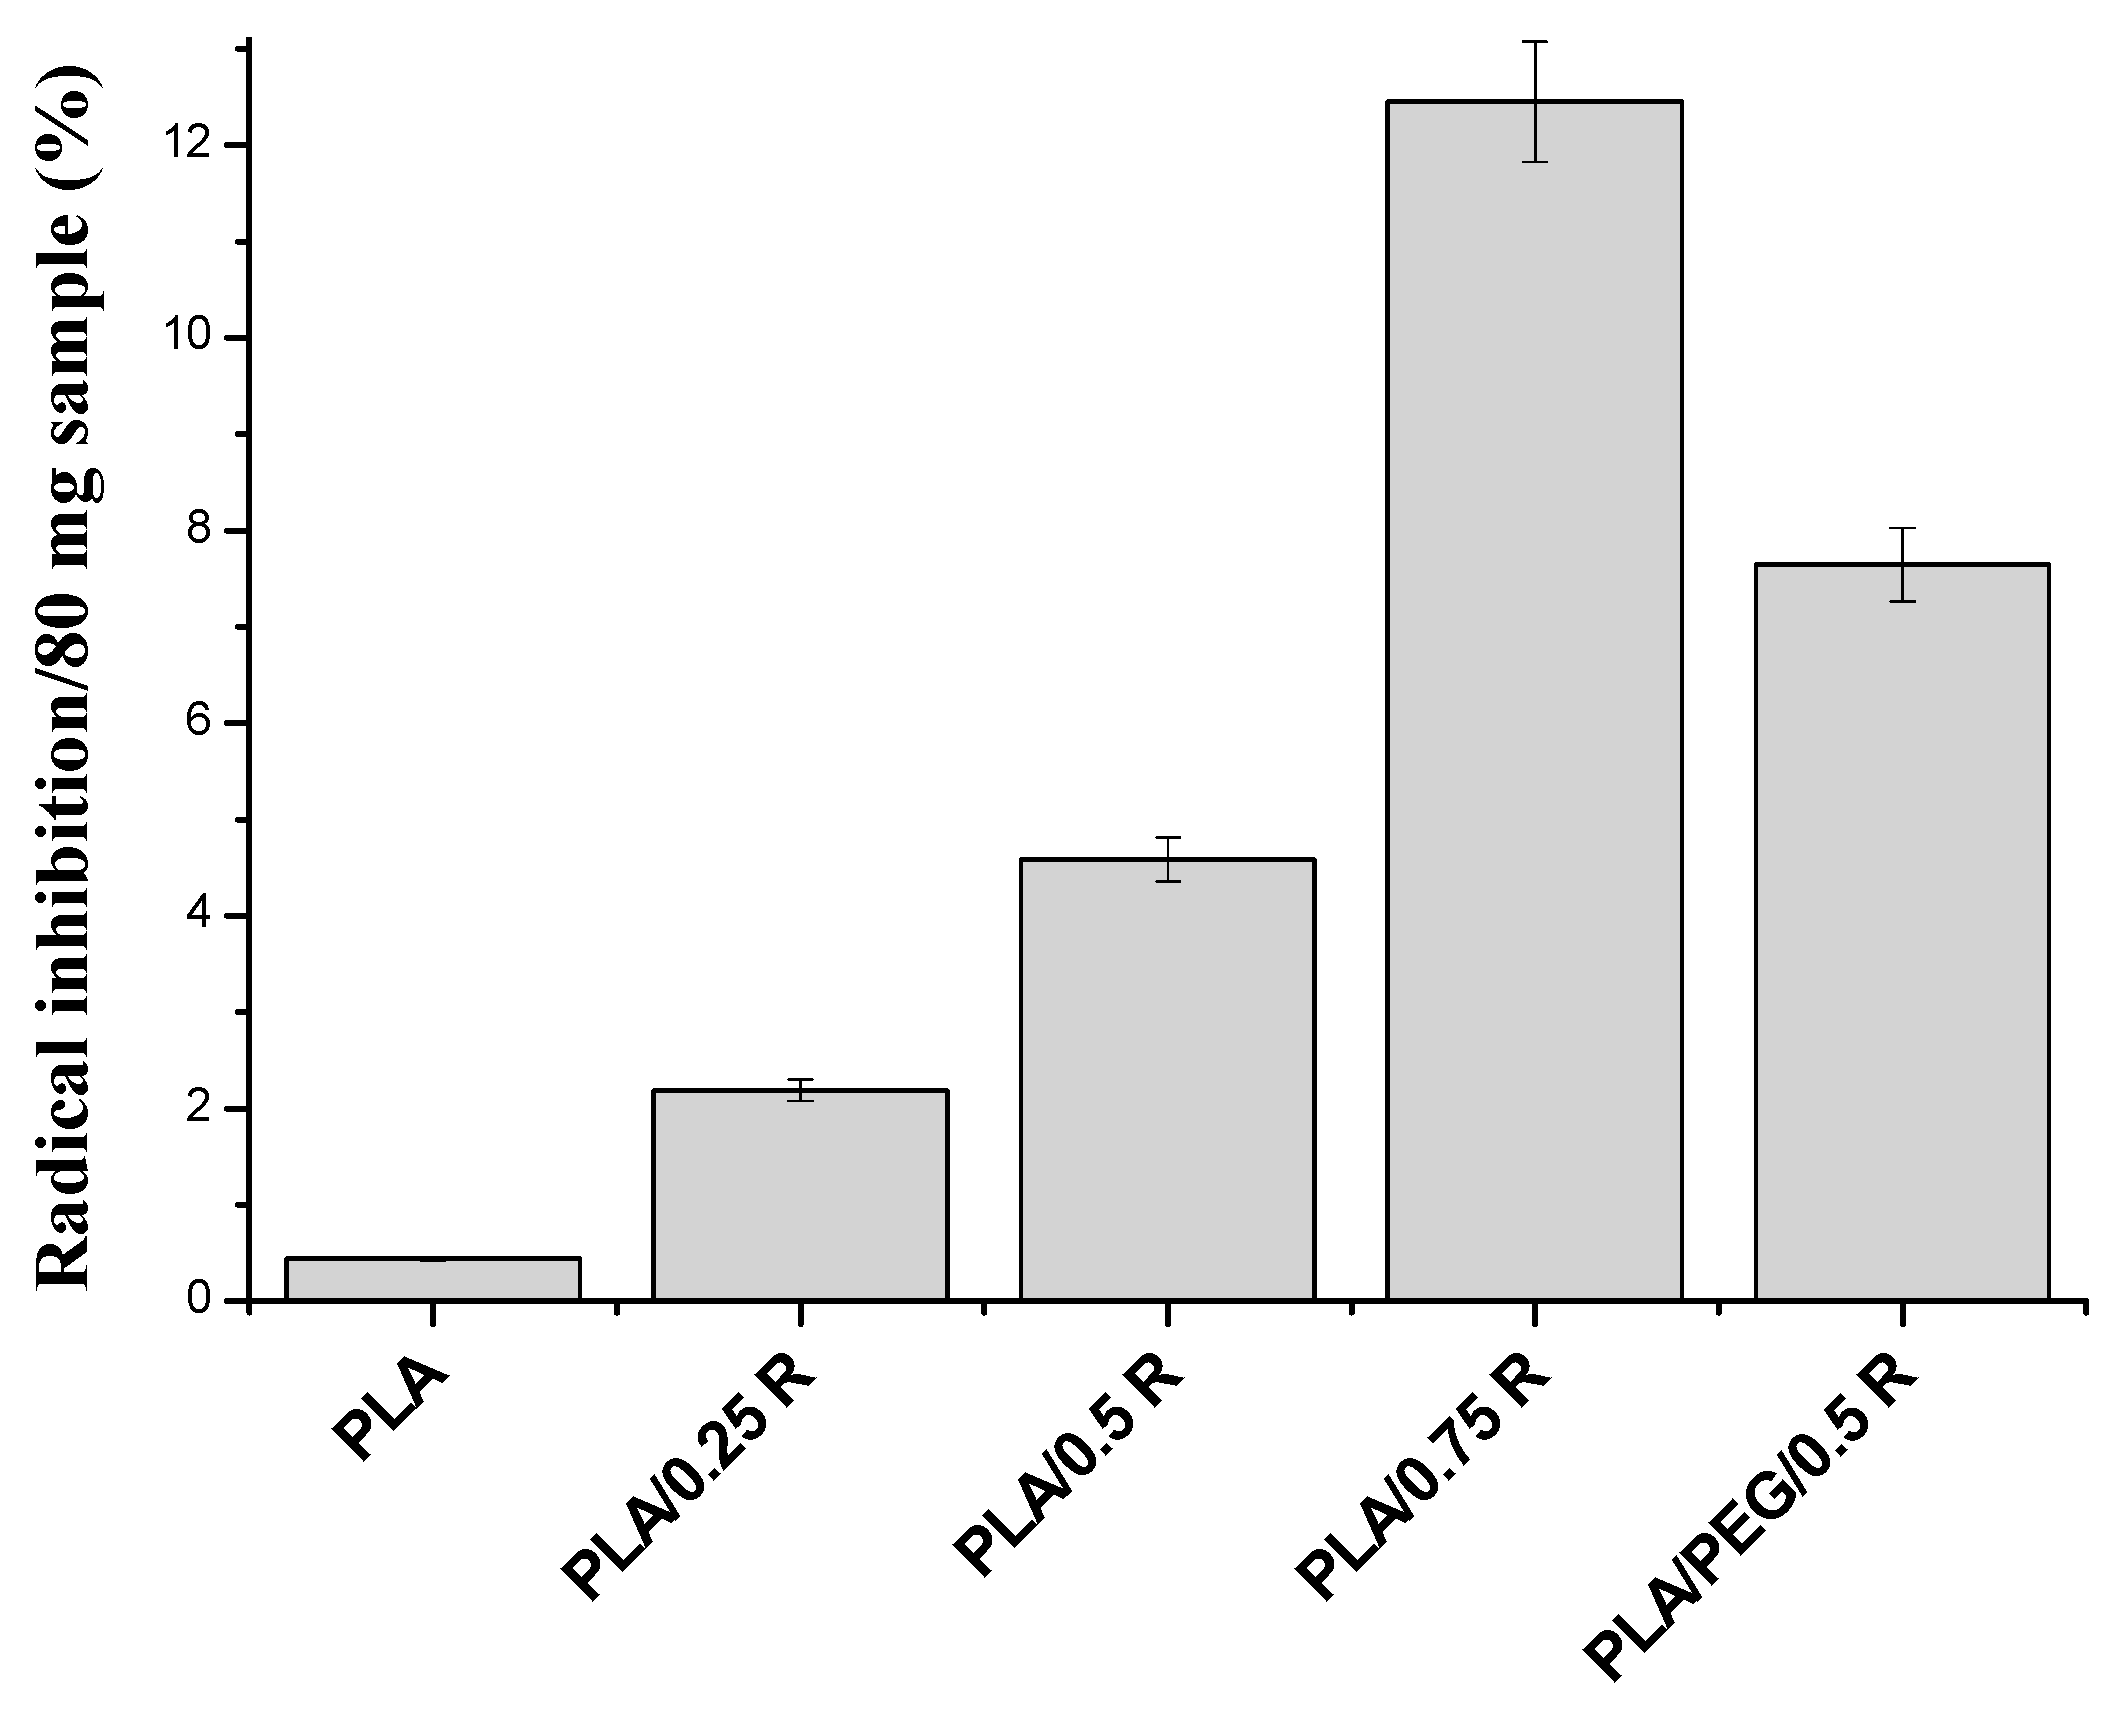
3.9. Antioxidant Activity Evaluation
3.10. Antibacterial Activity
3.11. Gas Permeability
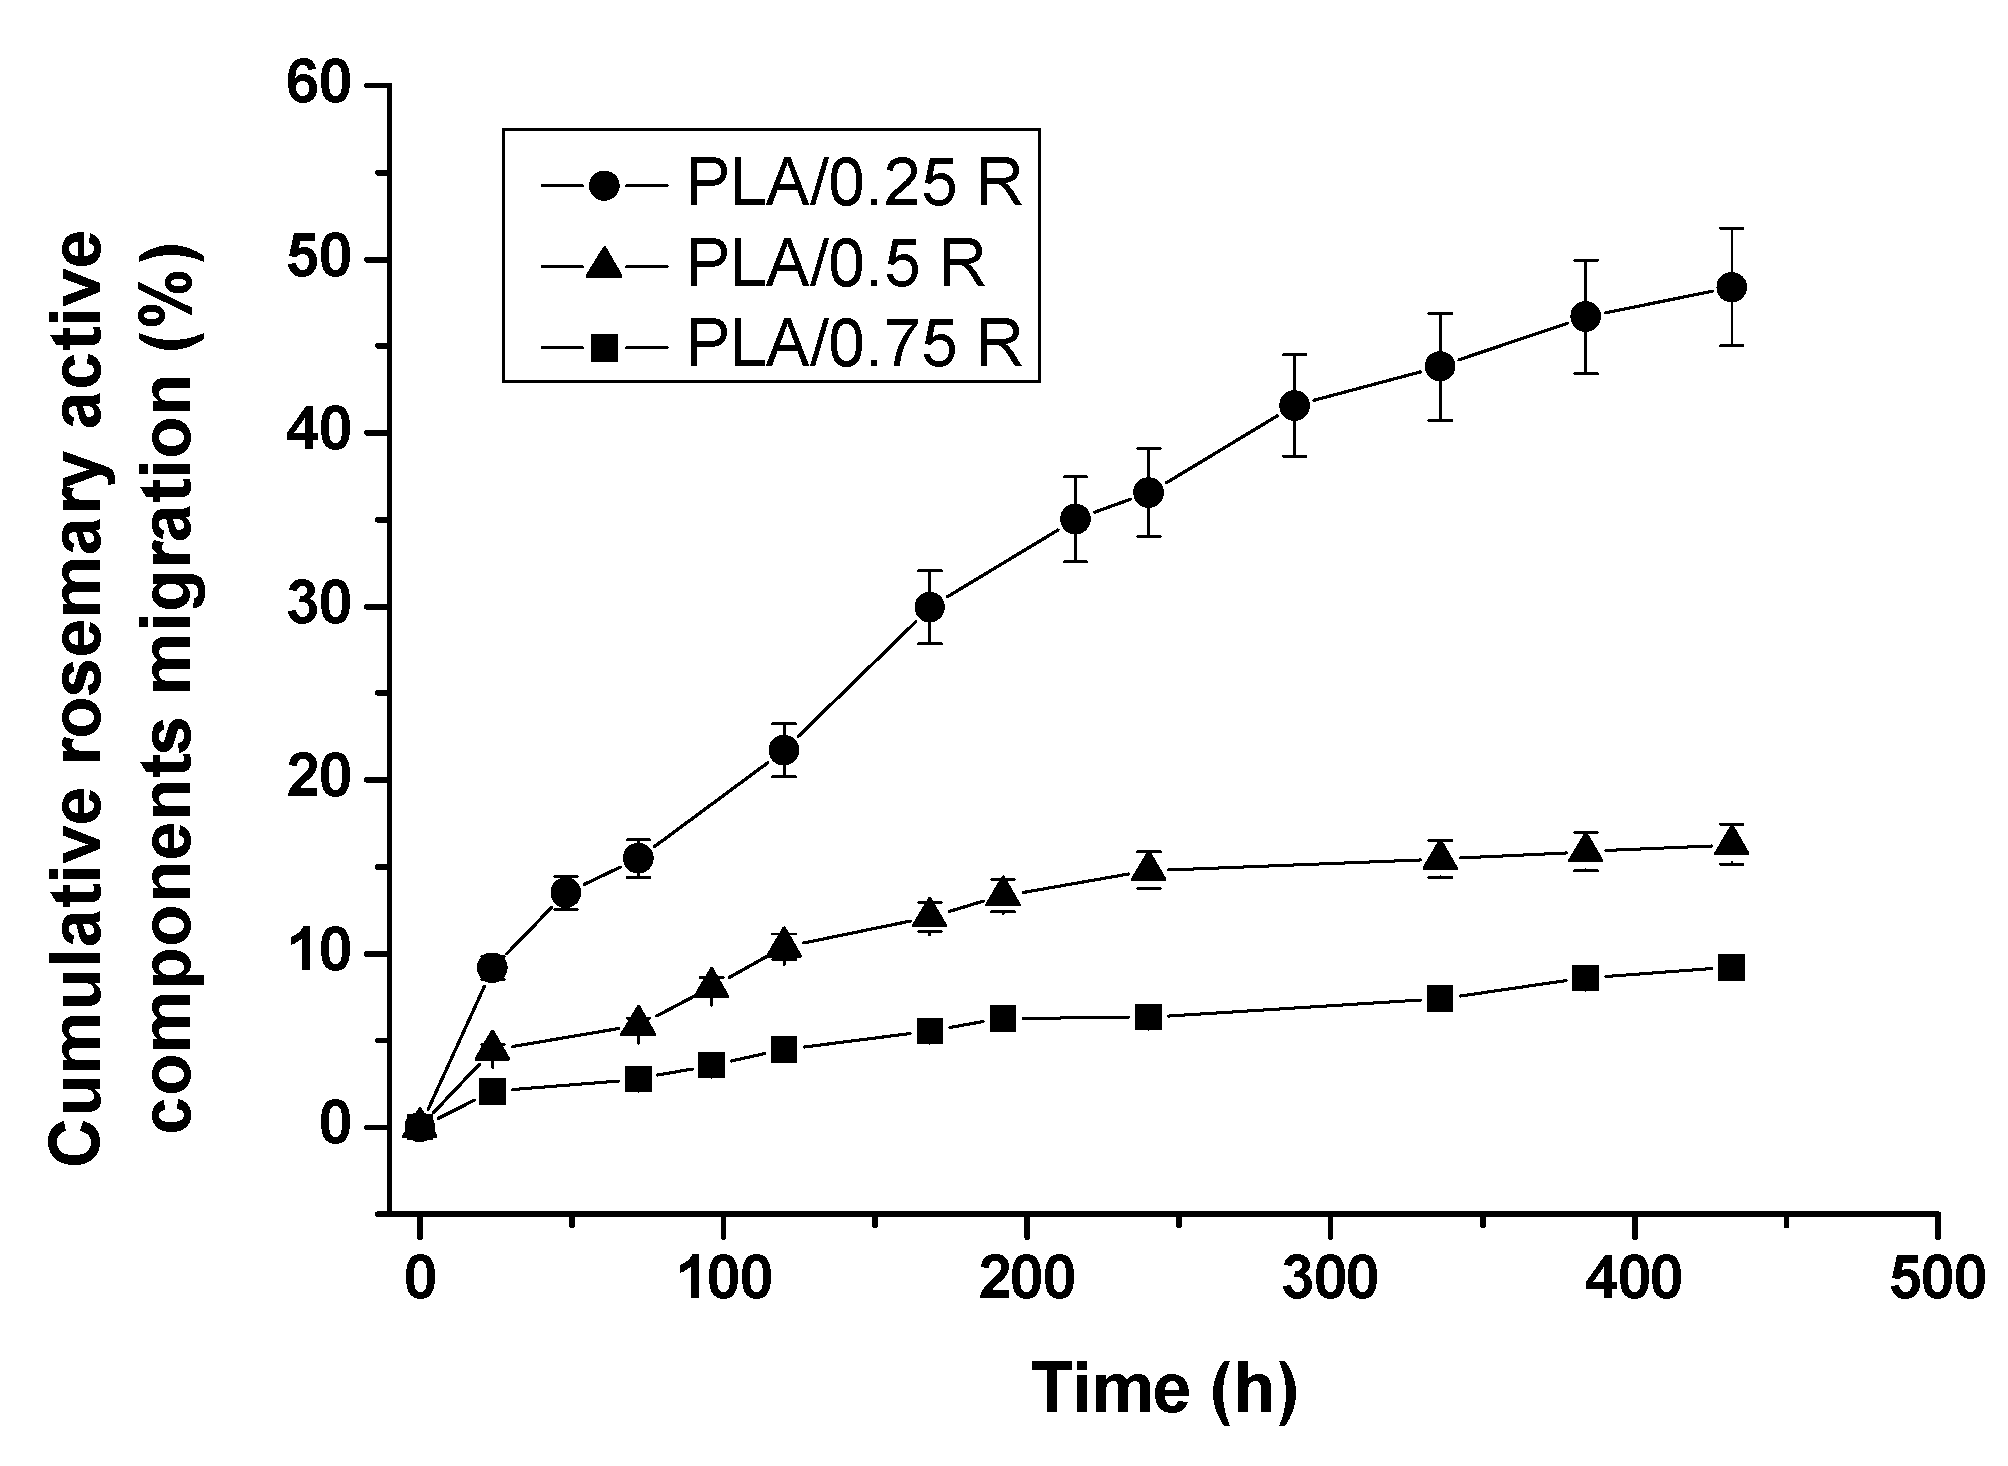
3.12. Overall Migration of Active Components from PLA/R Formulations into 50% Ethanol Solution as a Food Simulant Medium
3.13. Biocompatibility Evaluation
3.13.1. In Vitro Biocompatibility Evaluation Based on Surface Properties
3.13.2. In Vivo Biocompatibility Evaluation
4. Conclusions
Author Contributions
Funding
Conflicts of Interest
References
- Scaffaro, R.; Lopresti, F.; Marino, A.; Nostro, A. Antimicrobial additives for poly(lactic acid) materials and their applications: Current state and perspectives. Appl. Microbiol. Biotechnol. 2018, 102, 7739–7756. [Google Scholar] [CrossRef] [PubMed]
- Bitchagno, G.T.; Sama Fonkeng, L.; Kopa, T.K.; Tala, M.F.; Kamdem Wabo, H.; Tume, C.B.; Tane, P.; Kuiate, J.R. Antibacterial activity of ethanolic extract and compounds from fruits of Tectona grandis (Verbenaceae). BMC Complement. Altern. Med. 2015, 15, 1–6. [Google Scholar] [CrossRef] [PubMed]
- Alara, O.R.; Abdurahman, N.H.; Olalere, O.A. Ethanolic extraction of flavonoids, phenolics and antioxidants from vernonia amygdalina leaf using two-level factorial design. J. King Saud Univ. Sci. 2017, in press. [Google Scholar] [CrossRef]
- Madsen, H.L.; Andersen, L.; Christiansen, L.; Brockhoff, P.; Bertelsen, G. Antioxidative activity of summer savory (Satureja hortensis L.) and rosemary (Rosemarinus officinalis L.) in minced, cooked pork meat. Z. Lebensm. Unters. Forsch. 1996, 203, 333–338. [Google Scholar] [CrossRef]
- Erkan, N.; Ayranci, G.; Ayranci, E. Antioxidant activities of rosemary (Rosmarinus officinalis L.) extract, blackseed (Nigella sativa L.) essential oil, carnosic acid, rosmarinic acid and sesamol. Food Chem. 2008, 110, 76–82. [Google Scholar] [CrossRef] [PubMed]
- Borrás-Linares, I.; Stojanović, Z.; Quirantes-Piné, R.; Arráez-Román, D.; Švarc-Gajić, J.; Fernández-Gutiérrez, A.; Segura-Carretero, A. Rosmarinus Officinalis Leaves as a Natural Source of Bioactive Compounds. Int. J. Mol. Sci. 2014, 15, 20585–20606. [Google Scholar] [CrossRef] [PubMed]
- Bolumar, T.; LaPeña, D.; Skibsted, L.H.; Orlien, V. Rosemary and oxygen scavenger in active packaging for prevention of high-pressure induced lipid oxidation in pork patties. Food Packag. Shelf Life 2016, 7, 26–33. [Google Scholar] [CrossRef]
- Cuvelier, M.-E.; Richard, H.; Berset, C. Antioxidative activity and phenolic composition of pilot-plant and commercial extracts of sage and rosemary. J. Am. Oil Chem. Soc. 1996, 73, 645–652. [Google Scholar] [CrossRef]
- Aguilar, F. Scientific Opinion of the Panel on Food Additives, Flavourings, Processing aids and materials in contact with food on a request from the commission on the use of rosemary extracts as a food additive. EFSA J. 2008, 721, 1–29. Available online: http://www.efsa.europa.eu/sites/default/files/scientific_output/files/main_documents/721.pdf (accessed on 1 August 2018).
- Matejczyk, M.; Swisłocka, R.; Golonko, A.; Lewandowski, W.; Hawrylik, E. Cytotoxic, genotoxic and antimicrobial activity of caffeic and rosmarinic acids and their lithium, sodium and potassium salts as potential anticancer compounds. Adv. Med. Sci. 2018, 63, 14–21. [Google Scholar] [CrossRef] [PubMed]
- Lo, A.H.; Liang, Y.C.; Lin-Shiau, S.Y.; Ho, C.T.; Lin, J.K. Carnosol, an antioxidant in rosemary, suppresses inducible nitric oxide synthase through down-regulating nuclear factor-κB in mouse macrophages. Carcinogenesis 2002, 23, 983–991. [Google Scholar] [CrossRef] [PubMed]
- Rašković, A.; Milanović, I.; Pavlović, N.; Ćebović, T.; Vukmirović, S.; Mikov, M. Antioxidant activity of rosemary (Rosmarinus officinalis L.) essential oil and its hepatoprotective potential. BMC Complement. Altern. Med. 2014, 14, 225–237. [Google Scholar] [CrossRef] [PubMed]
- Mohapatra, A.K.; Mohanty, S.; Nayak, S.K. Effect of PEG on PLA/PEG blend and its nanocomposites: A study of thermo-mechanical and morphological characterization. Polym. Compos. 2013, 35, 283–293. [Google Scholar] [CrossRef]
- Arrieta, M.P.; Samper, M.D.; Aldas, M.; López, J. On the Use of PLA-PHB Blends for Sustainable Food Packaging Applications. Materials 2017, 10, 1008. [Google Scholar] [CrossRef] [PubMed]
- Hansen, M.C. Polymer additives and solubility parameters. Prog. Org. Coat. 2004, 51, 109–112. [Google Scholar] [CrossRef]
- Darie-Nita, R.N.; Vasile, C.; Irimia, A.; Lipsa, R.; Rapa, M. Evaluation of some eco-friendly plasticizers for PLA films processing. J. Appl. Polym. Sci. 2016, 133, 43223. [Google Scholar] [CrossRef]
- Pillin, I.; Montrelay, N.; Bourmaud, A.; Grohens, Y. Thermo-mechanical characterization of plasticized PLA: Is the miscibility the only significant factor. Polymer 2006, 47, 4676–4682. [Google Scholar] [CrossRef]
- Zahed, E.; Ansari, S.; Wu, B.M.; Bencharit, S.; Moshaverinia, A. Hydrogels in craniofacial tissue engineering. In Biomaterials for Oral and Dental Tissue Engineering; Tayebi, L., Moharamzadeh, K., Eds.; Woodhead Publishing Elsevier Ltd.: Amsterdam, The Netherlands, 2018; pp. 47–64. ISBN 978-0-08-100961-1. [Google Scholar]
- Hamad, K.; Kaseem, M.; Yang, H.W.; Deri, F.; Ko, Y.G. Properties and medical applications of polylactic acid: A review. Express Polym. Lett. 2015, 9, 435–455. [Google Scholar] [CrossRef]
- Pawar, R.P.; Tekale, S.U.; Shisodia, S.U.; Totre, J.T.; Domb, A.J. Biomedical Applications of Poly(Lactic Acid). Recent Pat. Regen. Med. 2014, 4, 40–51. [Google Scholar] [CrossRef]
- Davachi, S.M.; Kaffash, B. Polylactic Acid in Medicine. Polym. Plast. Technol. Eng. 2015, 54, 944–967. [Google Scholar] [CrossRef]
- Abd Alsaheb, R.A.; Aladdin, A.; Othman, N.Z.; Malek, R.A.; Leng, O.M.; Aziz, R.; El Enshasy, H.A. Recent applications of polylactic acid in pharmaceutical and medical industries. J. Chem. Pharm. Res. 2015, 7, 51–63. [Google Scholar]
- Commission, E. Commission regulation (EU) no. 10/2011 of 14 January 2011 on plastic materials and articles intended to come into contact with food. J. Eur. Commun. 2011, 45, 2–89. [Google Scholar]
- Kuorwel, K.K.; Cran, M.J.; Sonneveld, K.; Miltz, J.; Bigger, S.W. Migration of antimicrobial agents from starch-based films into a food simulant. LWT Food Sci. Technol. 2013, 50, 432–438. [Google Scholar] [CrossRef]
- Tawakkal, I.S.M.A.; Cran, M.J.; Bigger, S.W. Release of thymol from poly(lactic acid)-based antimicrobial films containing kenaf fibres as natural filler. LWT Food Sci. Technol. 2016, 66, 629–637. [Google Scholar] [CrossRef]
- Mascheroni, E.; Guillard, V.; Nalin, F.; Mora, L.; Piergiovanni, L. Diffusivity of propolis compounds in polylactic acid polymer for the development of antimicrobial packaging films. J. Food Eng. 2010, 98, 294–301. [Google Scholar] [CrossRef]
- Zaharescu, T.; Jipa, S.; Mariş, A.D.; Mariş, M.; Kappel, W.; Mantsch, A. Effect of rosemary extract on the radiation stability of UHMWPE. ePolymers 2009, 149, 1–9. [Google Scholar] [CrossRef]
- Scalbert, A.; Monties, B.; Janin, G. Tannins in wood-comparison of different estimation methods. Agric. Food Chem. 1989, 37, 1324–1329. [Google Scholar] [CrossRef]
- Zhishen, J.; Mengcheng, T.; Jianming, W. The determination of flavonoid contents in mulberry and their scavenging effect on superoxide radicals. Food Chem. 1999, 64, 555–559. [Google Scholar] [CrossRef]
- Kim, I.S.; Yang, M.R.; Lee, O.H.; Kang, S.H. Antioxidant activities of hot water extracts from various spices. Int. J. Mol. Sci. 2011, 12, 4120–4131. [Google Scholar] [CrossRef] [PubMed]
- Liu, H.; Hsieh, C.T.; Hu, D.S.G. Solute diffusion through degradable semicrystalline polyethylene glycol/poly(l-lactide) copolymers. Polym. Bull. 1994, 32, 463–470. [Google Scholar] [CrossRef]
- Commission, E. Commission directive 97/48/EC of 29 July 1997 amending for the second time council directive 82/711/EEC laying down the basic rules necessary for testing migration of the constituents of plastic materials and articles intended to come into contact with foodstuffs (97/48/EC). J. Eur. Commun. 1997, 222, 210–215. [Google Scholar]
- McClements, D.J.; Decker, E.A. Lipid Oxidation in Oil-in-Water Emulsions: Impact of Molecular Environment on Chemical Reactions in Heterogeneous Food Systems. J. Food Sci. 2000, 65, 1270–1282. [Google Scholar] [CrossRef]
- Mulinacci, N.; Innocenti, M.; Bellumori, M.; Giaccherini, C.; Martini, V.; Michelozzi, M. Storage method, drying processes and extraction procedures strongly affect the phenolic fraction of rosemary leaves: An HPLC/DAD/MS study. Talanta 2011, 85, 167–176. [Google Scholar] [CrossRef] [PubMed]
- Zhang, Y.; Smuts, J.P.; Dodbiba, E.; Rangarajan, R.; Lang, J.C.; Armstrong, D.W. Degradation study of carnosic acid, carnosol, rosmarinic acid, and rosemary extract (Rosmarinus officinalis L.) assessed using HPLC. J. Agric. Food Chem. 2012, 60, 9305–9314. [Google Scholar] [CrossRef] [PubMed]
- Peppas, N.A.; Sahlin, J.J. A simple equation for the description of solute release. III. Coupling of diffusion and relaxation. Int. J. Pharm. 1989, 57, 169–172. [Google Scholar] [CrossRef]
- Peppas, N.A. Analysis of Fickian and non-Fickian drug release from polymers. Pharm. Acta Helv. 1985, 60, 110–111. [Google Scholar] [PubMed]
- Pâslaru, E.; Fras Zemljic, L.; Bračič, M.; Vesel, A.; Petrinić, I.; Vasile, C. Stability of a chitosan layer deposited onto a polyethylene surface. J. Appl. Polym. Sci. 2013, 130, 2444–2457. [Google Scholar] [CrossRef]
- Stoleru, E.; Baican, M.C.; Coroaba, A.; Hitruc, G.E.; Lungu, M.; Vasile, C. Plasma-activated fibrinogen coatings onto poly(vinylidene fluoride) surface for improving biocompatibility with tissues. J. Bioact. Compat. Polym. 2016, 31, 91–108. [Google Scholar] [CrossRef]
- Pascu, M. Contact angle method. In Surface Properties of Polymers, 1st ed.; Vasile, C., Pascu, M.C., Eds.; Research Signpost: Kerala, India, 2007; pp. 179–201. [Google Scholar]
- Vasile, C.; Pascu, M.; Bumbu, G.G.; Cojocariu, A. Surface properties of polymers. In Surface Properties of Polymers, 1st ed.; Vasile, C., Pascu, M.C., Eds.; Research Signpost: Kerala, India, 2007; pp. 1–64. [Google Scholar]
- Yuan, Y.; Lee, T.R. Contact angle and wetting properties. In Surface Science Techniques; Bracco, G., Holst, B., Eds.; Springer Series in Surface Sciences; Springer: Berlin/Heidelberg, Germany, 2013; pp. 3–34. [Google Scholar]
- Stoleru, E.; Munteanu, B.S.; Darie-Niţă, R.N.; Pricope, G.M.; Lungu, M.; Irimia, A.; Râpă, M.; Lipşa, R.D.; Vasile, C. Complex poly(lactic acid)-based biomaterial for urinary catheters: II. Biocompatibility. Bioinspir. Biomim. Nanobiomater. 2016, 5, 152–166. [Google Scholar] [CrossRef]
- Van Oss, C.J.; Chaudhury, M.K.; Good, R.J. Interfacial Lifshitz-Van der Waals and polar interactions in macroscopic systems. Chem. Rev. 1988, 88, 927–941. [Google Scholar] [CrossRef]
- Pascu, M.C.; Popescu, M.C.; Vasile, C. Surface modifications of some nanocomposites containing starch. J. Phys. D Appl. Phys. 2008, 41, 175407. [Google Scholar] [CrossRef]
- Popescu, M.C.; Vasile, C.; Macocinschi, D.; Lungu, M.; Craciunescu, O. Biomaterials based on new polyurethane and hydrolyzed collagen, k-elastin, hyaluronic acid and chondroitin sulphate. Int. J. Biol. Macromol. 2010, 47, 646–653. [Google Scholar] [CrossRef] [PubMed]
- Onofrei, M.D.; Dobos, A.M.; Dunca, S.; Ioanid, E.G.; Ioan, S. Biocidal activity of cellulose materials for medical implants. J. Appl. Polym. Sci. 2015, 132, 41932. [Google Scholar] [CrossRef]
- Macocinschi, D.; Filip, D.; Butnaru, M.; Dimitriu, C.D. Surface characterization of biopolyurethanes based on cellulose derivatives. J. Mater. Sci. Mater. Med. 2009, 20, 775–783. [Google Scholar] [CrossRef] [PubMed]
- Vijayanand, K.; Deepak, K.; Pattanayak, D.K.; Rama Mohan, T.R.; Banerjee, R. Interpenetring blood-biomaterial interactions from surface free energy and work of adhesion. Trends Biomater. Artif. Organs. 2005, 182, 73–83. [Google Scholar]
- Albu, R.M.; Avram, E.; Stoica, I.; Ioanid, E.G.; Popovici, D.; Ioan, S. Surface properties and compatibility with blood of new quaternized polysulfones. J. Biomater. Nanobiotechnol. 2011, 2, 114–124. [Google Scholar] [CrossRef]
- Hodgson, E. A Textbook of Modern Toxicology, 3rd ed.; John Wiley & Sons: Hoboken, NJ, USA, 2004; ISBN 0-471-26508-X. [Google Scholar]
- Botham, P.A. Acute systemic toxicity-prospects for tiered testing strategies. Toxicol. In Vitro 2004, 18, 227–230. [Google Scholar] [CrossRef]
- Wolf, M.F.; Andwraon, J.M. Practical approach to blood compatibility assessments: General considerations and standards. In Biocompatibility and Performance of Medical Devices, 1st ed.; Boutrand, J.P., Ed.; Woodhead Publishing Ltd.: Cambridge, UK, 2012; pp. 159–200. ISBN 9780857090706. [Google Scholar]
- Lupuşoru, C.E. Imunofarmacologie, 1st ed.; ALFA: Iaşi, Romania, 2001; pp. 288–294. [Google Scholar]
- Peacman, M. Clinical & Experimental Immunology; Wiley Library, British Society of Immunology: Hoboken, NJ, USA, 2011. [Google Scholar]
- Zimmerman, M. Ethical guidelines for investigations of experimental pain in conscious animals. Pain 1983, 16, 109–110. [Google Scholar] [CrossRef]
- Protocole D’amendement à la Convention Européenne sur la Protection des Animaux Vertébrés Utilisés à des Fins Expérimentales ou à D’autres Fins Scientifiques. Available online: https://rm.coe.int/CoERMPublicCommonSearchServices/DisplayDCTMContent?documentId=090000168007f2e3 (accessed on 1 August 2018). (In French).
- Arrieta, M.P.; Samper, M.D.; López, J.; Jiménez, A. Combined effect of poly(hydroxybutyrate) and plasticizers on polylactic acid properties for film intended for food packaging. J. Polym. Environ. 2014, 22, 460–470. [Google Scholar] [CrossRef]
- Ionita, P.; Dinoiu, V.; Munteanu, C.; Turcu, I.M.; Tecuceanu, V.; Zaharescu, T.; Oprea, E.; Ilie, C.; Anghel, D.; Ionita, G. Antioxidant activity of rosemary extracts in solution and embedded in polymeric systems. Chem. Pap. 2015, 69, 872–880. [Google Scholar] [CrossRef]
- Beauchamp Spectroscopy Tables. Available online: http://www.cpp.edu/~psbeauchamp/pdf/spec_ir_nmr_spectra_tables.pdf (accessed on 1 August 2018).
- Ozkoc, G.; Kemalogu, S. Morphology, biodegradability, mechanical, and thermal properties of nanocomposite films based on PLA and plasticized PLA. J. Appl. Polym. Sci. 2009, 114, 2481–2487. [Google Scholar] [CrossRef]
- Li, D.; Jiang, Y.; Lv, S.; Liu, X.; Gu, J.; Chen, Q.; Zhang, Y. Preparation of plasticized poly (lactic acid) and its influence on the properties of composite materials. PLoS ONE 2018, 13, e0193520. [Google Scholar] [CrossRef] [PubMed]
- Zeid, A.M. Preparation and Evaluation of Polylactic Acid Antioxidant Packaging Films Containing Thyme, Rosemary and Oregano Essential Oils. Master’s Thesis, The American University in Cairo (AUC), Cairo, Egypt, May 2015. [Google Scholar]
- Petkova-Parlapanska, K.; Nancheva, V.; Diankov, S.; Hinkov, I.; Karsheva, M. Rheological properties of cosmetic compositions containing rosemary and grapefruit pulp and seeds extracts. J. Chem. Technol. Metall. 2014, 49, 487–493. [Google Scholar]
- Topala, C.M.; Tataru, L.D. ATR-FTIR Study of thyme and rosemary oils extracted by supercritical carbon dioxide. Rev. Chim. (Bucharest) 2016, 67, 842–846. [Google Scholar]
- Fan, Y.; Nishida, H.; Hoshihara, S.; Shirai, Y.; Endo, T. Effects of tin on poly(l-lactic acid) pyrolysis. Polym. Degrad. Stab. 2003, 81, 515. [Google Scholar] [CrossRef]
- Tsuge, S.; Ohtani, H.; Watanabe, C. Pyrolysis—GC/MS Data Book of Synthetic Polymers: Pyrograms, Thermograms and MS of Pyrolyzates; Elsevier: Amsterdam, The Netherlands, 2011; p. 252. [Google Scholar]
- Lin, H.; Han, L.; Dong, L. Thermal degradation behavior and gas phase flame retardant mechanism of polylactide/PCPP blend. J. Appl. Polym. Sci. 2014, 131, 40480. [Google Scholar] [CrossRef]
- Rychý, J.; Rychlá, L.; Stloukal, P.; Koutný, M.; Pekařová, S.; Verney, V.; Fiedlorová, A. UV initiated oxidation and chemiluminescence from aromatic-aliphatic copolyesters and polylactic acid. Polym. Degrad. Stab. 2013, 98, 2556–2563. [Google Scholar] [CrossRef]
- Nugroho, P.; Mitoshi, H.; Yoshii, F.; Kume, T. Degradation of poly(l-lactic acid). Polym. Degrad. Stab. 2001, 72, 337–343. [Google Scholar] [CrossRef]
- Babanalbandi, A.; Hill, D.J.T.; Whittaker, A.K. Volatile products and new polymer structures formed on 60Co γ-radiolysis of poly(lactic acid) and poly(glycolic acid). Polym. Degrad. Stab. 1997, 58, 203–214. [Google Scholar] [CrossRef]
- Pospisil, J. Chemical and photochemical behaviour of phenolic antioxidants in polymer stabilization: A state of the art report, part II. Polym. Degrad. Stab. 1993, 39, 103–115. [Google Scholar] [CrossRef]
- Vasile, C.; Sivertsvik, M.; Miteluţ, A.C.; Brebu, M.A.; Stoleru, E.; Rosnes, J.T.; Tănase, E.E.; Khan, W.; Pamfil, D.; Cornea, C.P.; et al. Comparative analysis of the composition and active property evaluation of certain essential oils to assess their potential applications in active food packaging. Materials 2017, 10, 45. [Google Scholar] [CrossRef] [PubMed]
- Setnescu, R.; Kaci, M.; Jipa, S.; Setnescu, T.; Zaharescu, T.; Hebal, G.; Benhamida, A.; Djedjelli, H. Chemiluminescence study on irradiated low-density polyethylene containing various photo-stabilisers. Polym. Degrad. Stab. 2004, 84, 475–481. [Google Scholar] [CrossRef]
- Łopusiewicz, Ł.; Jędra, F.; Mizielińska, M. New poly(lactic acid) active packaging composite films incorporated with fungal melanin. Polymers 2018, 10, 386. [Google Scholar] [CrossRef]
- Byun, Y.; Kim, Y.T.; Whiteside, S. Characterization of an antioxidant polylactic acid (PLA) film prepared with α-tocopherol, BHT and polyethylene glycol using film cast extruder. J. Food Eng. 2010, 100, 239–244. [Google Scholar] [CrossRef]
- Bacillus Cereus. Available online: https://www.foodsafety.gov/poisoning/causes/bacteriaviruses/bcereus/index.html (accessed on 1 August 2018).
- Bottone, E.J. Bacillus cereus, a volatile human pathogen. Clin. Microbiol. Rev. 2010, 23, 382–398. [Google Scholar] [CrossRef] [PubMed]
- Golshani, Z.; Sharifzadeh, A. Evaluation of Antibacterial Activity of Alcoholic Extract of Rosemary Leaves against Pathogenic Strains. Zahedan J. Res. Med. Sci. (ZJRMS) 2014, 16, 12–15. Available online: http://zjrms.ir/browse.php?a_code=A-10-2066-2&slc_lang=en&sid=1&sw=antibacterial+activity (accessed on 1 August 2018).
- Lehermeier, H.J.; Dorgan, J.R.; Way, J.D. Gas Permeation Properties of Poly(Lactic Acid). (R826733). J. Membr. Sci. 2001, 190, 243–251. [Google Scholar] [CrossRef]
- Yuniarto, K.; Welt, B.A.; Irawan, C. Morphological, thermal and oxygen barrier properties plasticized film polylactic acid. J. Appl. Packag. Res. 2017, 9, 6. [Google Scholar]
- Intermolecular Forces in Action: Surface Tension, Viscosity, and Capillary Action. Available online: https://chem.libretexts.org/Textbook_Maps/General_Chemistry_Textbook_Maps/Map%3A_A_Molecular_Approach_(Tro)/11%3A_Liquids%2C_Solids%2C_and_Intermolecular_Forces/11.04%3A_Intermolecular_Forces_in_Action%3A_Surface_Tension%2C_Viscosity%2C_and_Capillary_Action#title (accessed on 8 May 2018).
- Van der Valk, P.; van Pelt, A.W.J.; Busscher, H.; de Jong, H.P.; Wildevuur, C.R.; Arends, J. Interaction of fibroblasts and polymer surfaces: Relationship between surface free energy and fibroblast spreading. J. Biomed. Mater. Res. 1983, 17, 807–817. [Google Scholar] [CrossRef] [PubMed]
- Spijker, H.T.; Graaff, R.; Boonstra, P.W.; Busscher, H.J.; van Oeveren, W. On the influence of flow conditions and wettability on blood material interactions. Biomaterials 2003, 24, 4717–4727. [Google Scholar] [CrossRef]
- Courtney, J.M.; Lamba, N.M.; Sundaram, S.; Forbes, C.D. Biomaterials for blood-contacting applications. Biomaterials 1994, 15, 737–744. [Google Scholar] [CrossRef]
- Menzies, K.L.; Jones, L. The Impact of Contact Angle on the Biocompatibility of Biomaterials. Optom. Vis. Sci. 2010, 87, 387–399. [Google Scholar] [CrossRef] [PubMed]
- Nita, L.E.; Chiriac, A.P.; Stoleru, E.; Diaconu, A.; Tudorachi, N. Tailorable polyelectrolyte protein complex based on poly(aspartic acid) and bovine serum albumin. Des. Monomers Polym. 2016, 19, 596–606. [Google Scholar] [CrossRef]


| No. | Sample | PLA (wt %) | Powdered Rosemary Ethanolic Extract (R) (wt %) | PEG (wt %) |
|---|---|---|---|---|
| 1 | PLA | 100 | - | - |
| 2 | PLA/0.25R | 99.75 | 0.25 | - |
| 3 | PLA/0.5R | 99.5 | 0.5 | - |
| 4 | PLA/0.75R | 99.25 | 0.75 | - |
| 5 | PLA/PEG | 80 | - | 20 |
| 6 | PLA/PEG/0.5R | 79.5 | 0.5 | 20 |
| Liquid | |||||
|---|---|---|---|---|---|
| Water | 72.80 | 21.80 | 51.00 | 25.50 | 25.50 |
| Formamide | 58.00 | 39.00 | 19.00 | 2.28 | 39.6 |
| Methylene iodide | 50.80 | 50.80 | 0.00 | 0.72 | 0.00 |
| Red blood cells (rbc) [49] | 36.56 | 35.2 | 1.36 | 0.01 | 46.2 |
| Platelets (p) [49] | 118.24 | 99.14 | 19.1 | 12.26 | 7.44 |
| Sample | TQmax1 (Nm) | TQ1min (Nm) | TQmax2 (Nm) | TQ5min (Nm) | TQfinal (Nm) |
|---|---|---|---|---|---|
| PLA | 66.4 | 17.2 | - | 13.3 | 10.2 |
| PLA/0.25R | 73.8 | 15.7 | - | 11.2 | 10.2 |
| PLA/0.5R | 72.0 | 17 | - | 11.4 | 10.5 |
| PLA/0.75R | 74.6 | 17.6 | - | 11.1 | 10.1 |
| PLA/PEG | 12.9 | 0.9 | - | 7.3 | 6.5 |
| PLA/PEG/0.5R | 10.1 | 2.8 | - | 7.3 | 5.7 |
| Crossover Characteristic | PLA | PLA/0.25R | PLA/0.5R | PLA/0.75R |
|---|---|---|---|---|
| ω (s−1) | 96.37 | 273.3 | 363.3 | 411.4 |
| t (s) | 10.38 | 3.66 | 2.75 | 2.43 |
| G’ = G" (MPa) | 144.5 | 146.9 | 145.2 | 145.4 |
| Sample | Tg (°C) | Tcc (°C) | ∆Hcc (J/g) | Tm (°C) | ∆Hm (J/g) | Tcr (°C) | Xcr |
|---|---|---|---|---|---|---|---|
| Run I | |||||||
| PLA | 60.64 | 125.89 | 17.69 | 151.63 | 23.12 | 55.80 | 24.6 |
| PLA/0.25R | 62.95 | 124.56 | 18.23 | 155.96 | 19.66 | 55.96 | 21.1 |
| PLA/0.5R | 64.07 | 124.82 | 10.40 | 154.51 | 10.78 | 56.26 | 11.5 |
| PLA/0.75R | 64.82 | 118.28 | 16.54 | 156.35 | 19.05 | 55.86 | 20.33 |
| PLA/PEG | 49.30 | - | - | 157.74 | 23.95 | 70.03 | 25.56 |
| PLA/PEG/0.5R | 59.59 | 90.23 | 2.6 | 157.07 | 26.06 | 66.70 | 28.39 |
| Run II | |||||||
| PLA | 61.58 | 132.03 | 9.69 | 152.75 | 12.05 | - | 13.34 |
| PLA/0.25R | 60.96 | 128.95 | 17.14 | 154.01 | 16.4 | - | 17.50 |
| PLA/0.5R | 61.15 | 133.87 | 6.24 | 153.90 | 6.37 | - | 6.79 |
| PLA/0.75R | 60.40 | 133.48 | 7.18 | 154.04 | 7.9 | - | 8.43 |
| PLA/PEG | - | 91.37 | 0.36 | 154.66 | 25.32 | - | 27.02 |
| PLA/PEG/0.5R | - | 80.93 | 8.003 | 153.72 | 27.28 | - | 29.11 |
| Sample | Degradation Stage | Tonset (°C) | Tpeak (°C) | ΔW (%) | T10 (°C) | T20 (°C) |
|---|---|---|---|---|---|---|
| PLA | I residue | 339 | 358 | 98.72 1.28 | 332.5 | 341.5 |
| PLA/0.75R | I residue | 310 | 338 | 98.50 1.50 | 312.5 | 321.5 |
| PLA/PEG | I II residue | 280 373 | 322 402 | 82.51 16.31 1.18 | 285.5 | 298 |
| PLA/PEG/0.5R | I II residue | 285 365 | 336 403 | 83.03 15.04 1.93 | 294 | 207.5 |
| Sample | ATCC Bacillus cereus 14579 | ATCC Salmonella typhymurium 14028 | ATCC Escherichia coli 25922 | |||
|---|---|---|---|---|---|---|
| Inhibition %/24 h | Inhibition %/48 h | Inhibition %/24 h | Inhibition %/48 h | Inhibition %/24 h | Inhibition %/48 h | |
| PLA | 5 | 59 | 32 | 61 | 53 | 71 |
| PLA/0.25 R | 59 | 100 | 52 | 87 | 61 | 86 |
| PLA/0.5 R | 91 | 100 | 52 | 84 | 71 | 100 |
| PLA/0.75 R | 100 | 100 | 55 | 87 | 94 | 100 |
| PLA/PEG | 45 | 91 | 29 | 77 | 69 | 94 |
| PLA/PEG/0.5R | 86 | 100 | 48 | 100 | 76 | 100 |
| Sample | Thickness (mm) | CO2 (mL/m2/day) | O2 (mL/m2/day) |
|---|---|---|---|
| PLA | 0.151 | 873 | 1308 |
| PLA/0.25R | 0.120 | 588 | 487 |
| PLA/0.5R | 0.122 | 535 | 273 |
| PLA/0.75R | 0.130 | 412 | 201 |
| PLA/PEG | 0.128 | 524 | 455 |
| PLA/PEG/0.5R | 0.126 | 489 | 278 |
| Food freezing bag | 0.020 | 64,601 | 50,266 |
| Food packaging foil (LDPE/PP) | 0.009 | 128,374 | 35,629 |
| Sample | Korsmeyer-Peppas Model | Higuchi Model | ||||
|---|---|---|---|---|---|---|
| n | R2 | K × 10−3 (h)−n | R2 | kH × 10−3 (h)−n | R2 | |
| PLA/0.25R | 0.61 | 0.99 | 14.1 | 0.989 | 27.57 | 0.98 |
| PLA/0.5R | 0.42 | 0.98 | 12.82 | 0.988 | 8.28 | 0.98 |
| PLA/0.75R | 0.54 | 0.985 | 3.52 | 0.993 | 4.48 | 0.99 |
| Samples | Contact Angles Values (degrees) | ||
|---|---|---|---|
| Water | Formamide | Diiodomethane | |
| PLA | 84.7 | 70.9 | 65.0 |
| PLA/0.25R | 81.9 | 62.7 | 60.1 |
| PLA/0.5R | 78.8 | 59.0 | 56.7 |
| PLA/0.75R | 64.4 | 42.8 | 38.7 |
| PLA/PEG | 50.0 | 46.4 | 40.7 |
| PLA/PEG/0.5R | 63.7 | 71.0 | 51.0 |
| Samples | Ws/rbc | Ws/p | |||||
|---|---|---|---|---|---|---|---|
| PLA | 25.65 | 1.75 | 0.06 | 12.45 | 27.40 | −8.95 | −109.56 |
| PLA/0.25R | 28.46 | 3.31 | 0.62 | 7.22 | 32.69 | 1.43 | −107.13 |
| PLA/0.5R | 30.41 | 4.23 | 0.11 | 24.01 | 33.72 | −2.11 | −90.51 |
| PLA/0.75R | 40.17 | 5.41 | 0.33 | 22.22 | 45.58 | 10.83 | −74.12 |
| PLA/PEG | 39.17 | 1.92 | 0.03 | 34.91 | 41.09 | 4.54 | −69.58 |
| PLA/PEG/0.5R | 33.64 | 13.95 | 1.27 | 38.25 | 47.59 | 12.27 | −71.51 |
| Group | Leucocyte Formula | |||||
|---|---|---|---|---|---|---|
| % Values | ||||||
| PMN | Ly | E | M | B | ||
| Control | 24 h | 29.5 ± 0.83 | 66.3 ± 2.11 | 0.6 ± 0.08 | 3.4 ± 0.10 | 0.2 ± 0.10 |
| 7 days | 29.7 ± 0.47 | 65.9 ± 1.93 | 0.7 ± 0.10 | 3.5 ± 0.10 | 0.2 ± 0.05 | |
| R | 24 h | 29.5 ± 0.69 | 66.1 ± 1.75 | 0.8 ± 0.06 | 3.4 ± 0.06 | 0.2 ± 0.10 |
| 7 days | 29.6 ± 0.73 | 66.2 ± 1.89 | 0.6 ± 0.08 | 3.4 ± 0.10 | 0.2 ± 0.05 | |
| PLA | 24 h | 29.6 ± 0.89 | 66.1 ± 2.13 | 0.6 ± 0.05 | 3.5 ± 0.05 | 0.2 ± 0.05 |
| 7 days | 29.7 ± 1.13 | 65.9 ± 1.55 | 0.7 ± 0.05 | 3.5 ± 0.05 | 0.2 ± 0.04 | |
| PLA/0.25R | 24 h | 29.6 ± 0.21 | 66.0 ± 1.73 | 0.7 ± 0.12 | 3.5 ± 0.08 | 0.2 ± 0.04 |
| 7 days | 29.8 ± 1.13 | 65.7 ± 1.29 | 0.7 ± 0.05 | 3.6 ± 0.10 | 0.2 ± 0.05 | |
| PLA/0.5R | 24 h | 29.7 ± 0.29 | 65.9 ± 2.14 | 0.6 ± 0.10 | 3.6 ± 0.08 | 0.2 ± 0.10 |
| 7 days | 29.7 ± 1.17 | 65.7 ± 1.33 | 0.8 ± 0.06 | 3.6 ± 0.05 | 0.2 ± 0.05 | |
| PLA/0.75R | 24 h | 29.6 ± 0.98 | 65.8 ± 1.67 | 0.8 ± 0.12 | 3.6 ± 0.10 | 0.2 ± 0.10 |
| 7 days | 29.8 ± 0.73 | 65.8 ± 1.75 | 0.6 ± 0.05 | 3.6 ± 0.08 | 0.2 ± 0.05 | |
| PLA/PEG | 24 h | 29.8 ± 0.89 | 65.7 ± 1.39 | 0.7 ± 0.10 | 3.6 ± 0.05 | 0.2 ± 0.04 |
| 7 days | 29.9 ± 0.55 | 65.5 ± 1.63 | 0.7 ± 0.05 | 3.7 ± 0.12 | 0.2 ± 0.05 | |
| PLA/PEG/0.5R | 24 h | 29.8 ± 0.27 | 65.7 ± 1.98 | 0.6 ± 0.10 | 3.7 ± 0.10 | 0.2 ± 0.05 |
| 7 days | 29.9 ± 1.63 | 65.4 ± 1.47 | 0.8 ± 0.13 | 3.7 ± 0.05 | 0.2 ± 0.05 | |
| Group | AST (U/mL) | ALT (U/mL) | LDH (U/mL) | |
|---|---|---|---|---|
| Control | 24 h | 41.7 ± 2.72 | 95.3 ± 4.14 | 342.29 ± 44.55 |
| 7 days | 42.5 ± 3.07 | 96.5 ± 3.89 | 344.33 ± 41.37 | |
| PLA | 24 h | 42.3 ± 3.14 | 95.8 ± 4.46 | 342.17 ± 39.64 |
| 7 days | 42.9 ± 2.33 | 97.6 ± 3.55 | 345.25 ± 40.89 | |
| R | 24 h | 41.6 ± 1.89 | 96.2 ± 3.37 | 343.42 ± 42.14 |
| 7 days | 42.7 ± 2.64 | 98.7 ± 5.07 | 346.67 ± 38.33 | |
| PLA/0.25R | 24 h | 42.1 ± 3.14 | 97.5 ± 4.27 | 343.54 ± 43.46 |
| 7 days | 43.9 ± 3.46 | 97.9 ± 3.64 | 346.81 ± 41.37 | |
| PLA/0.5R | 24 h | 43.2 ± 3.33 | 97.6 ± 3.37 | 344.55 ± 39.89 |
| 7 days | 44.1 ± 3.27 | 98.8 ± 5.14 | 347.19 ± 44.14 | |
| PLA/0.75R | 24 h | 43.4 ± 2.37 | 98.3 ± 5.55 | 344.29 ± 43.72 |
| 7 days | 44.6 ± 2.55 | 98.7 ± 6.07 | 348.46 ± 45.07 | |
| PLA/PEG | 24 h | 43.7 ± 3.37 | 98.5 ± 5.46 | 345.72 ± 44.37 |
| 7 days | 44.8 ± 3.89 | 98.8 ± 4.33 | 349.15 ± 40.46 | |
| PLA/PEG/0.5R | 24 h | 43.5 ± 3.14 | 97.2 ± 3.89 | 345.45 ± 39.89 |
| 7 days | 44.6 ± 3.64 | 98.6 ± 5.72 | 347.83 ± 42.27 | |
| Group | Urea (mg/dL) | Creatinine (mg/dL) | |
|---|---|---|---|
| Control | 24 h | 37.2 ± 3.37 | <0.1 |
| 7 days | 37.9 ± 4.55 | <0.1 | |
| PLA | 24 h | 37.7 ± 3.89 | <0.2 |
| 7 days | 38.1 ± 3.64 | <0.2 | |
| R | 24 h | 37.9 ± 5.07 | <0.1 |
| 7 days | 38.5 ± 3.46 | <0.1 | |
| PLA/0.25R | 24 h | 38.6 ± 4.37 | <0.1 |
| 7 days | 38.9 ± 4.33 | <0.2 | |
| PLA/0.5R | 24 h | 38.8 ± 3.64 | <0.2 |
| 7 days | 39.3 ± 3.72 | <0.2 | |
| PLA/0.75R | 24 h | 39.1 ± 5.14 | <0.2 |
| 7 days | 39.4 ± 4.46 | <0.2 | |
| PLA/PEG | 24 h | 38.8 ± 3.55 | <0.2 |
| 7 days | 39.6 ± 3.27 | <0.2 | |
| PLA/PEG/0.5R | 24 h | 39.2 ± 4.64 | <0.2 |
| 7 days | 39.5 ± 3.37 | <0.2 | |
| Group | Complement | NBT Test | |
|---|---|---|---|
| Control | 24 h | 16.33 ± 1.55 | 53.73 ± 3.46 |
| 7 days | 16.48 ± 1.37 | 53.65 ± 3.55 | |
| PLA | 24 h | 16.41 ± 1.46 | 53.85 ± 4.14 |
| 7 days | 16.65 ± 1.14 | 53.49 ± 3.72 | |
| R | 24 h | 16.39 ± 1.55 | 52.63 ± 3.50 |
| 7 days | 16.47 ± 1.33 | 52.45 ± 3.14 | |
| PLA/0.25R | 24 h | 16.43 ± 1.64 | 52.77 ± 3.67 |
| 7 days | 16.85 ± 0.89 | 52.39 ± 3.25 | |
| PLA/0.5R | 24 h | 16.56 ± 1.72 | 53.68 ± 3.46 |
| 7 days | 16.89 ± 1.37 | 52.55 ± 3.83 | |
| PLA/0.75R | 24 h | 16.77 ± 1.64 | 53.73 ± 3.46 |
| 7 days | 17.11 ± 0.72 | 52.61 ± 3.37 | |
| PLA/PEG | 24 h | 17.07 ± 0.89 | 53.85 ± 4.05 |
| 7 days | 16.63 ± 1.55 | 53.37 ± 3.64 | |
| PLA/PEG/0.5R | 24 h | 17.03 ± 0.83 | 54.19 ± 4.17 |
| 7 days | 17.13 ± 1.46 | 53.49 ± 3.55 | |
© 2018 by the authors. Licensee MDPI, Basel, Switzerland. This article is an open access article distributed under the terms and conditions of the Creative Commons Attribution (CC BY) license (http://creativecommons.org/licenses/by/4.0/).
Share and Cite
Darie-Niţă, R.N.; Vasile, C.; Stoleru, E.; Pamfil, D.; Zaharescu, T.; Tarţău, L.; Tudorachi, N.; Brebu, M.A.; Pricope, G.M.; Dumitriu, R.P.; et al. Evaluation of the Rosemary Extract Effect on the Properties of Polylactic Acid-Based Materials. Materials 2018, 11, 1825. https://doi.org/10.3390/ma11101825
Darie-Niţă RN, Vasile C, Stoleru E, Pamfil D, Zaharescu T, Tarţău L, Tudorachi N, Brebu MA, Pricope GM, Dumitriu RP, et al. Evaluation of the Rosemary Extract Effect on the Properties of Polylactic Acid-Based Materials. Materials. 2018; 11(10):1825. https://doi.org/10.3390/ma11101825
Chicago/Turabian StyleDarie-Niţă, Raluca Nicoleta, Cornelia Vasile, Elena Stoleru, Daniela Pamfil, Traian Zaharescu, Liliana Tarţău, Niţă Tudorachi, Mihai Adrian Brebu, Gina Mihaela Pricope, Raluca Petronela Dumitriu, and et al. 2018. "Evaluation of the Rosemary Extract Effect on the Properties of Polylactic Acid-Based Materials" Materials 11, no. 10: 1825. https://doi.org/10.3390/ma11101825
APA StyleDarie-Niţă, R. N., Vasile, C., Stoleru, E., Pamfil, D., Zaharescu, T., Tarţău, L., Tudorachi, N., Brebu, M. A., Pricope, G. M., Dumitriu, R. P., & Leluk, K. (2018). Evaluation of the Rosemary Extract Effect on the Properties of Polylactic Acid-Based Materials. Materials, 11(10), 1825. https://doi.org/10.3390/ma11101825