A Study of Strain-Driven Nucleation and Extension of Deformed Grain: Phase Field Crystal and Continuum Modeling

Abstract
1. Introduction
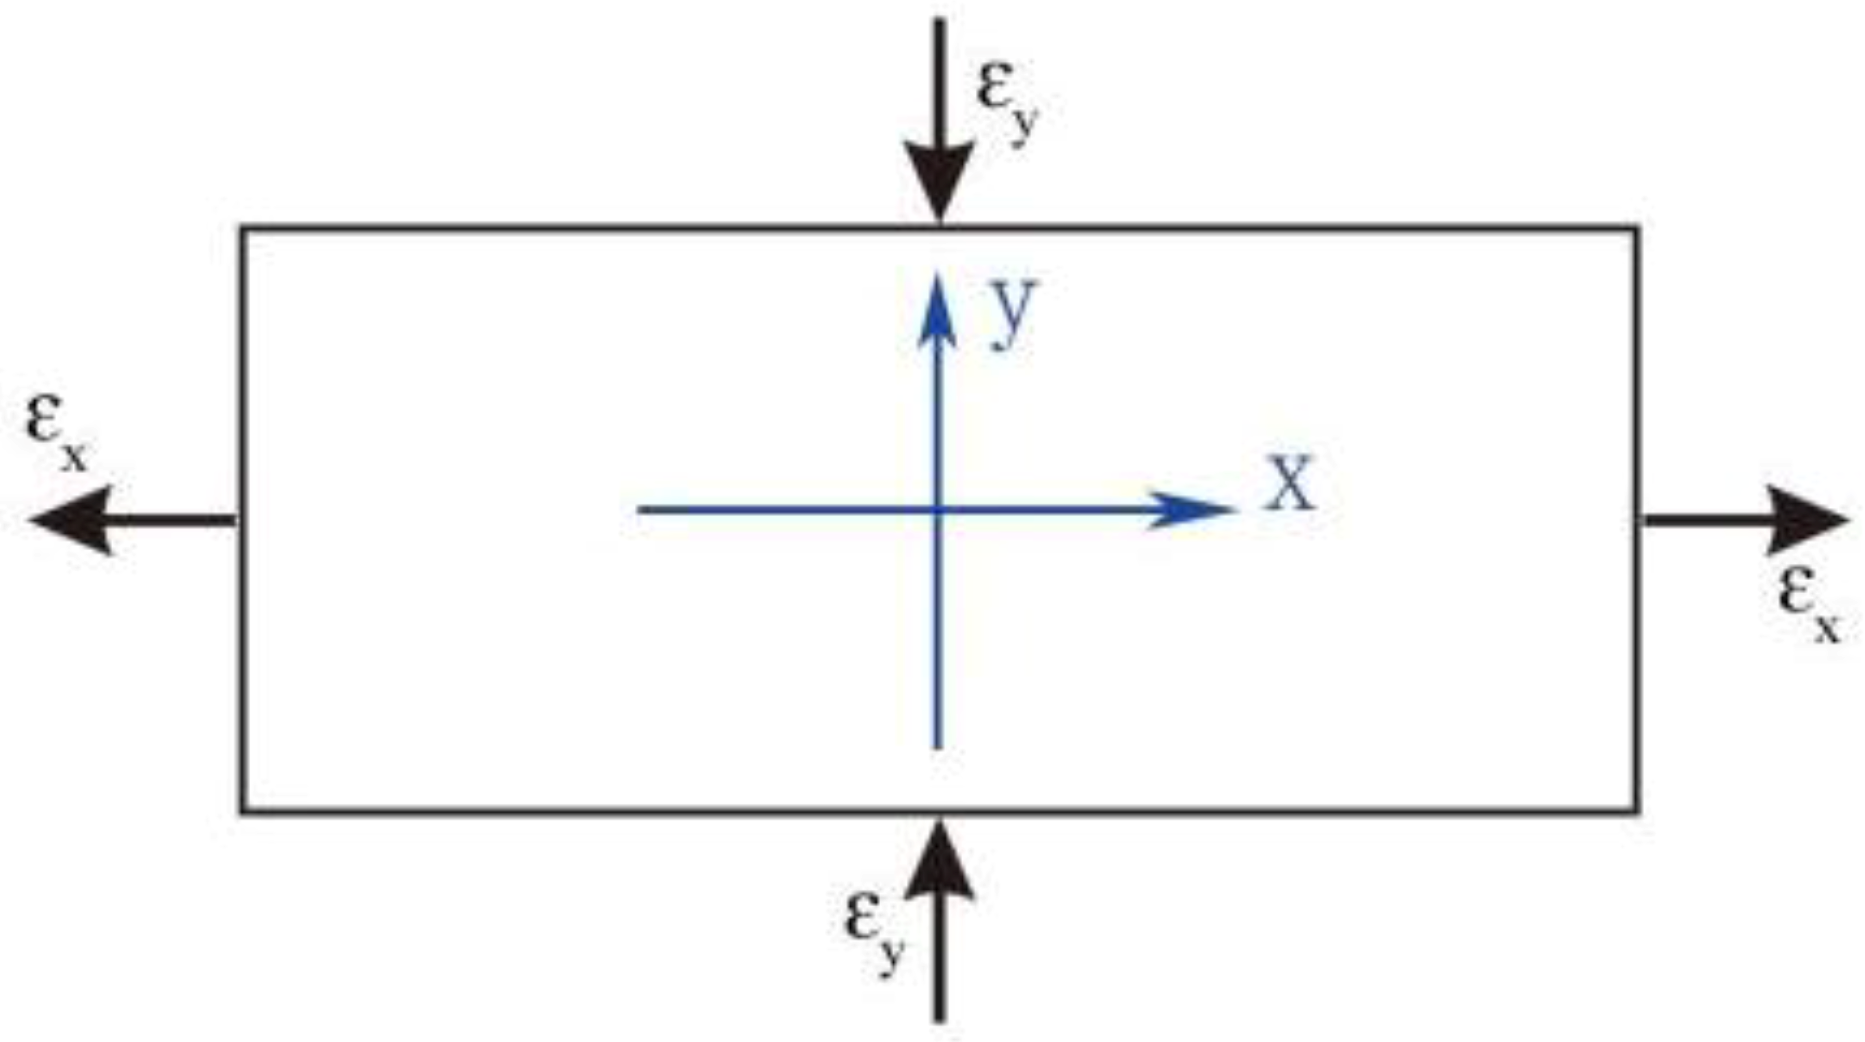
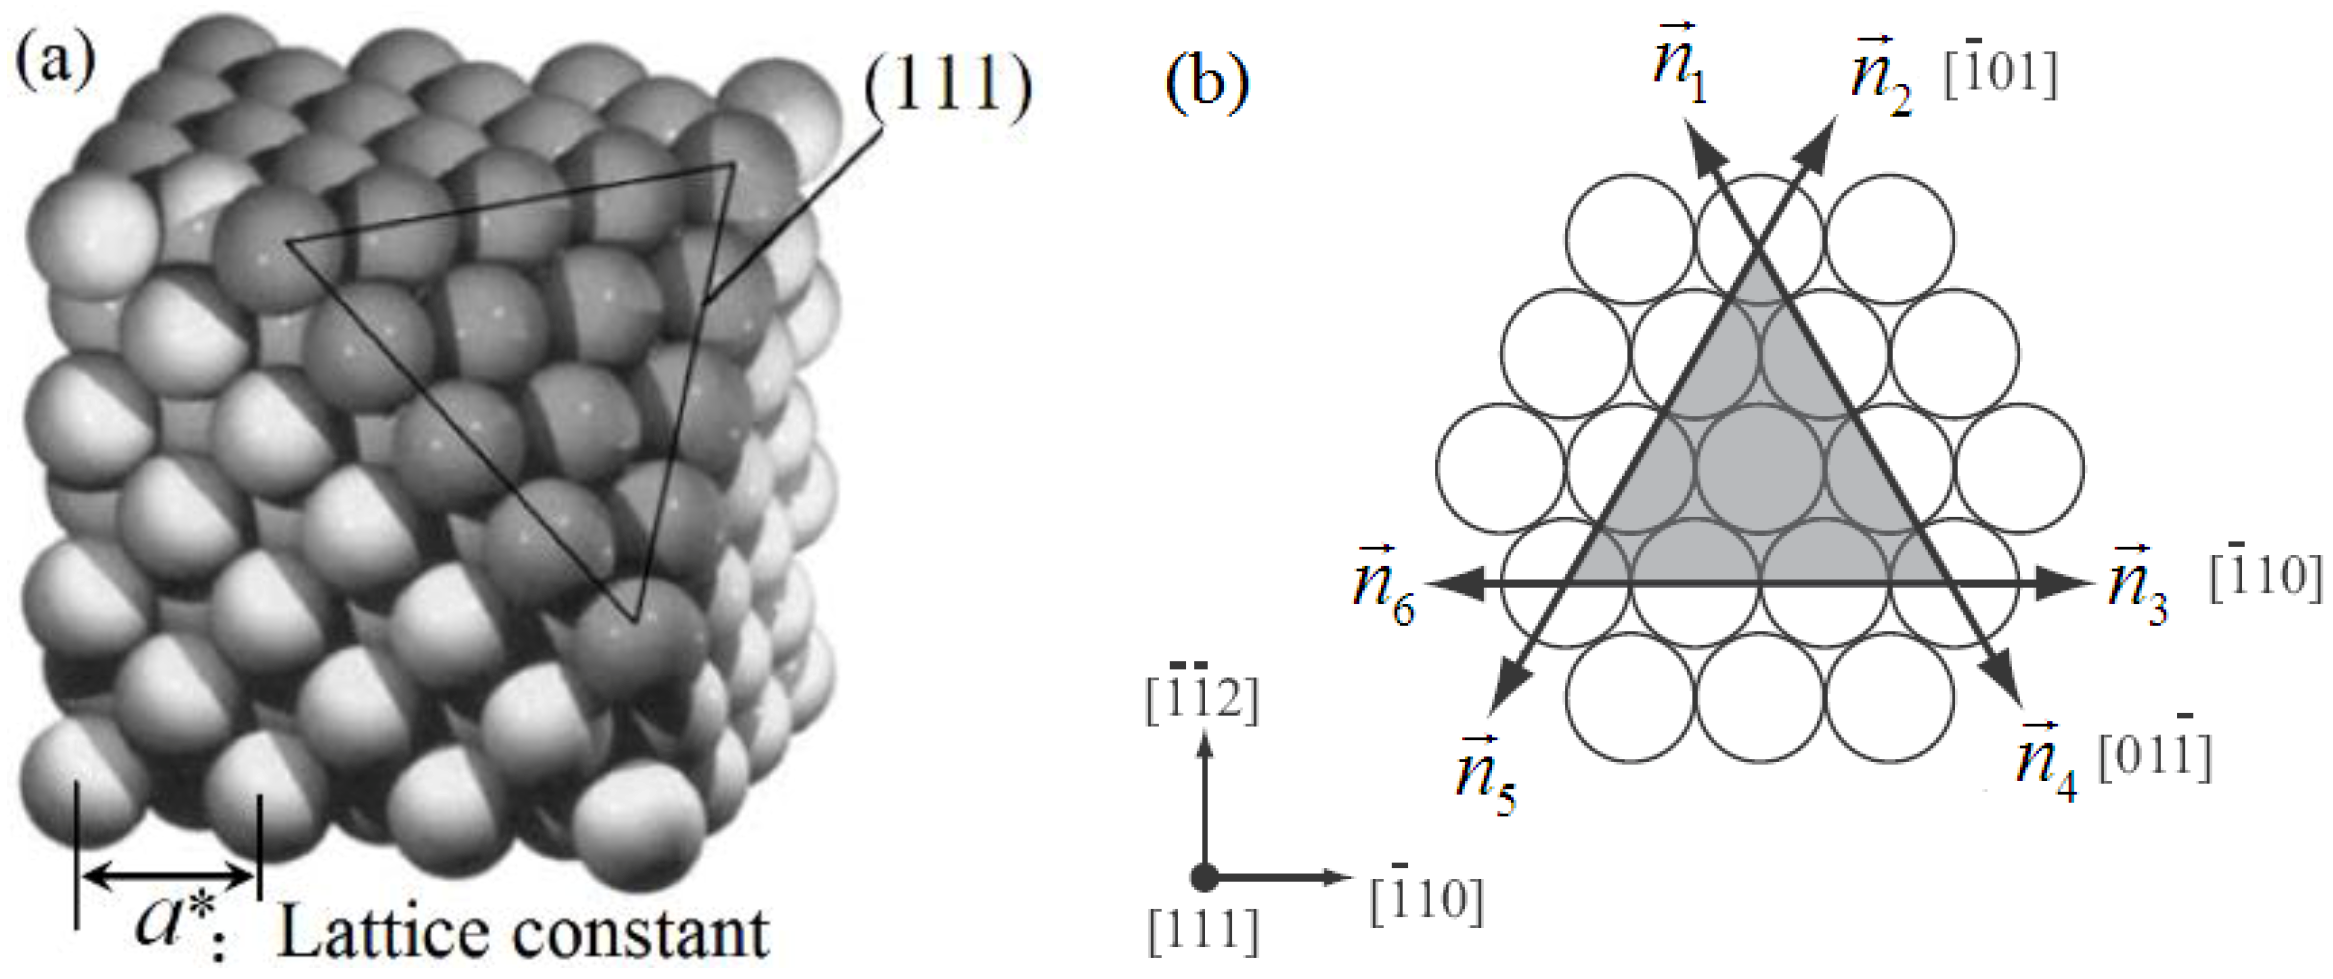
2. Model and Method
3. Simulation Result and Discussion
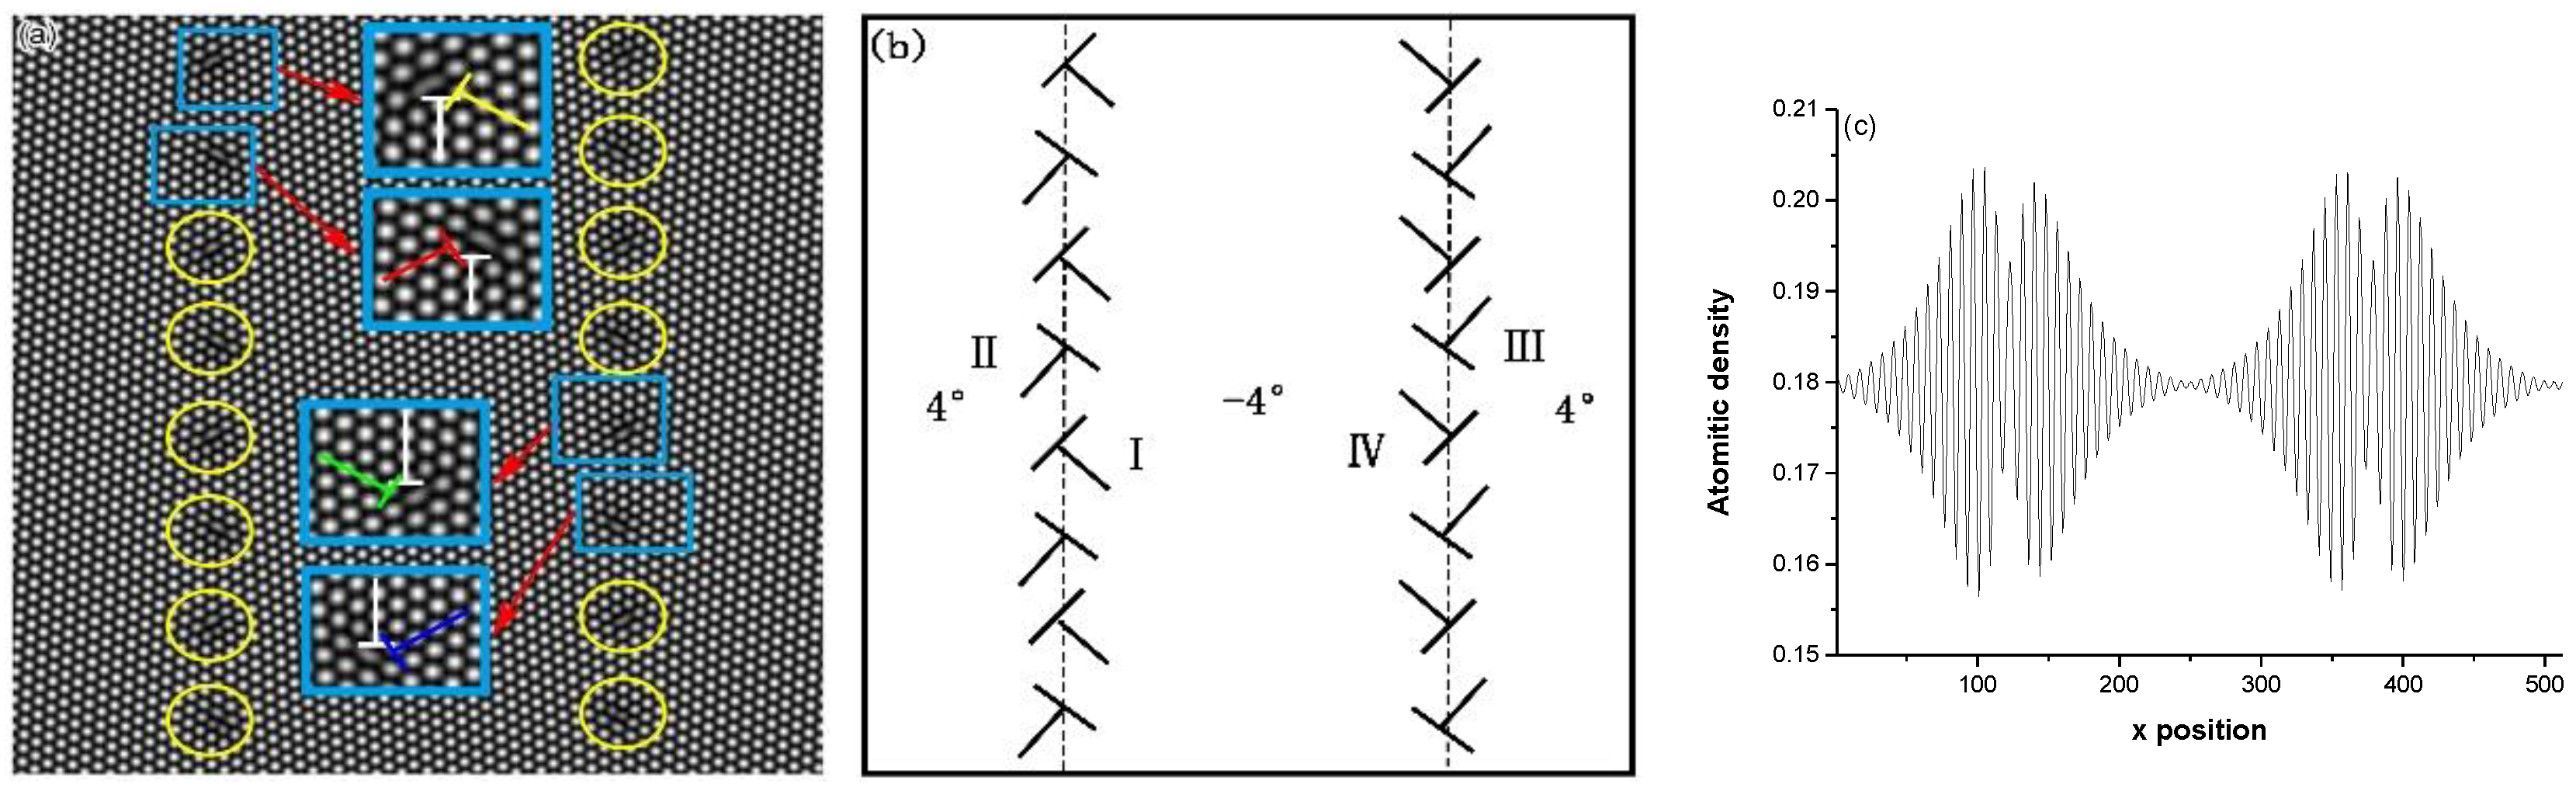
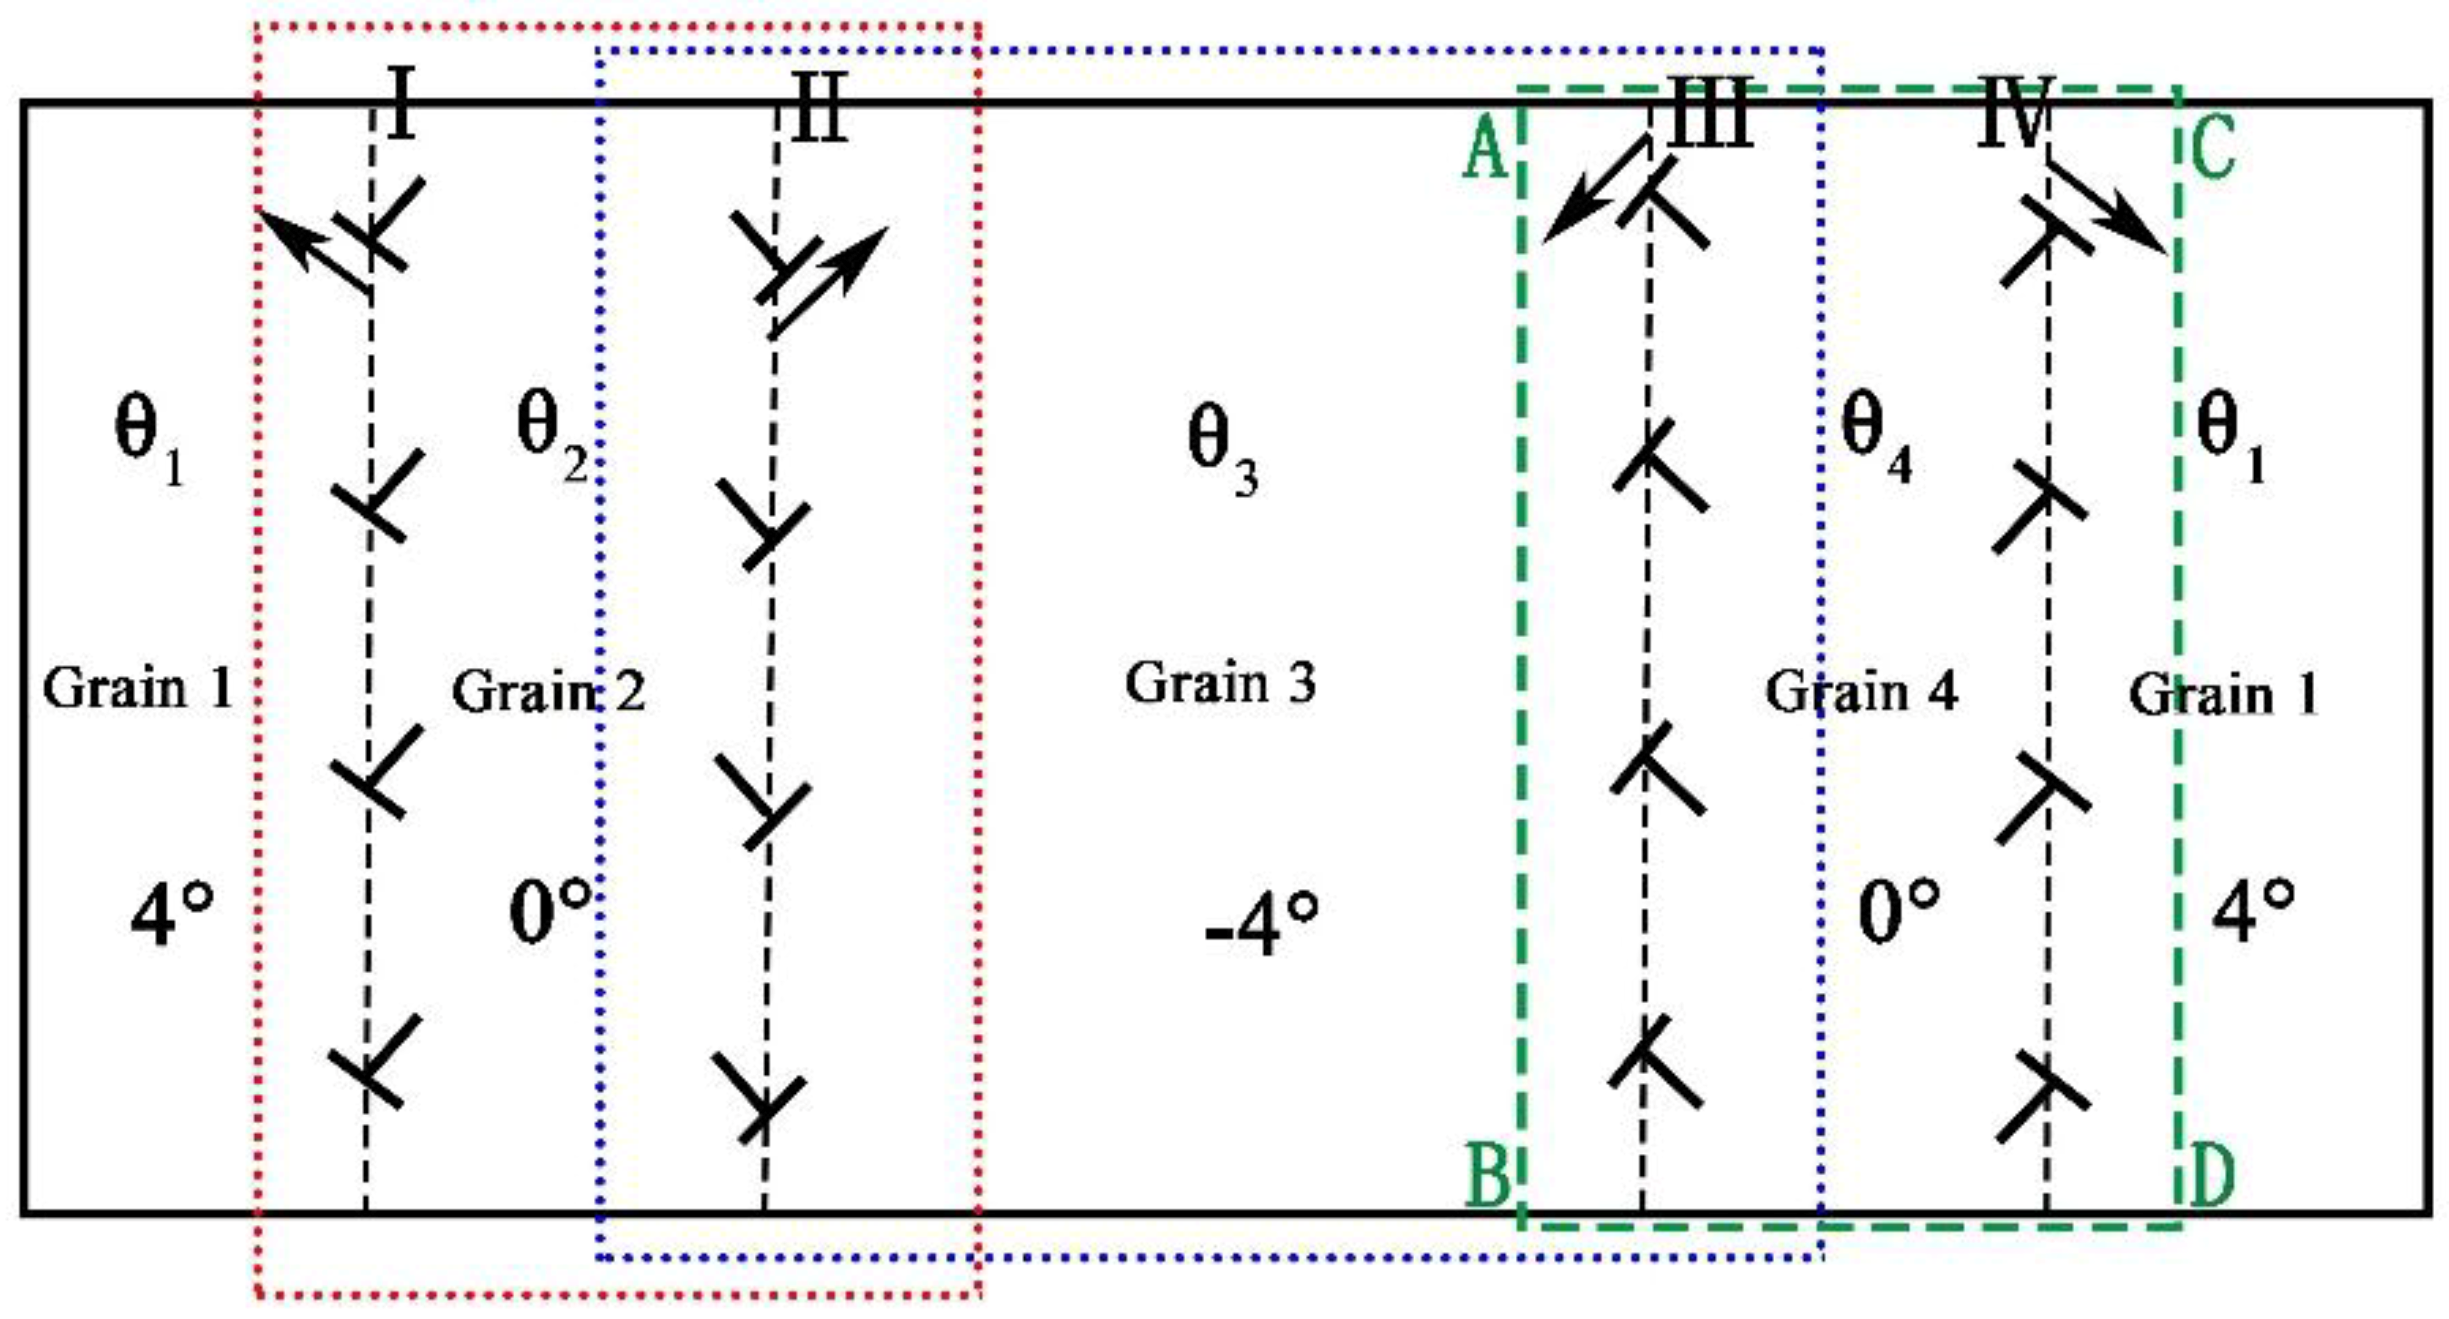
3.1. Deformaed Grain Nucleation
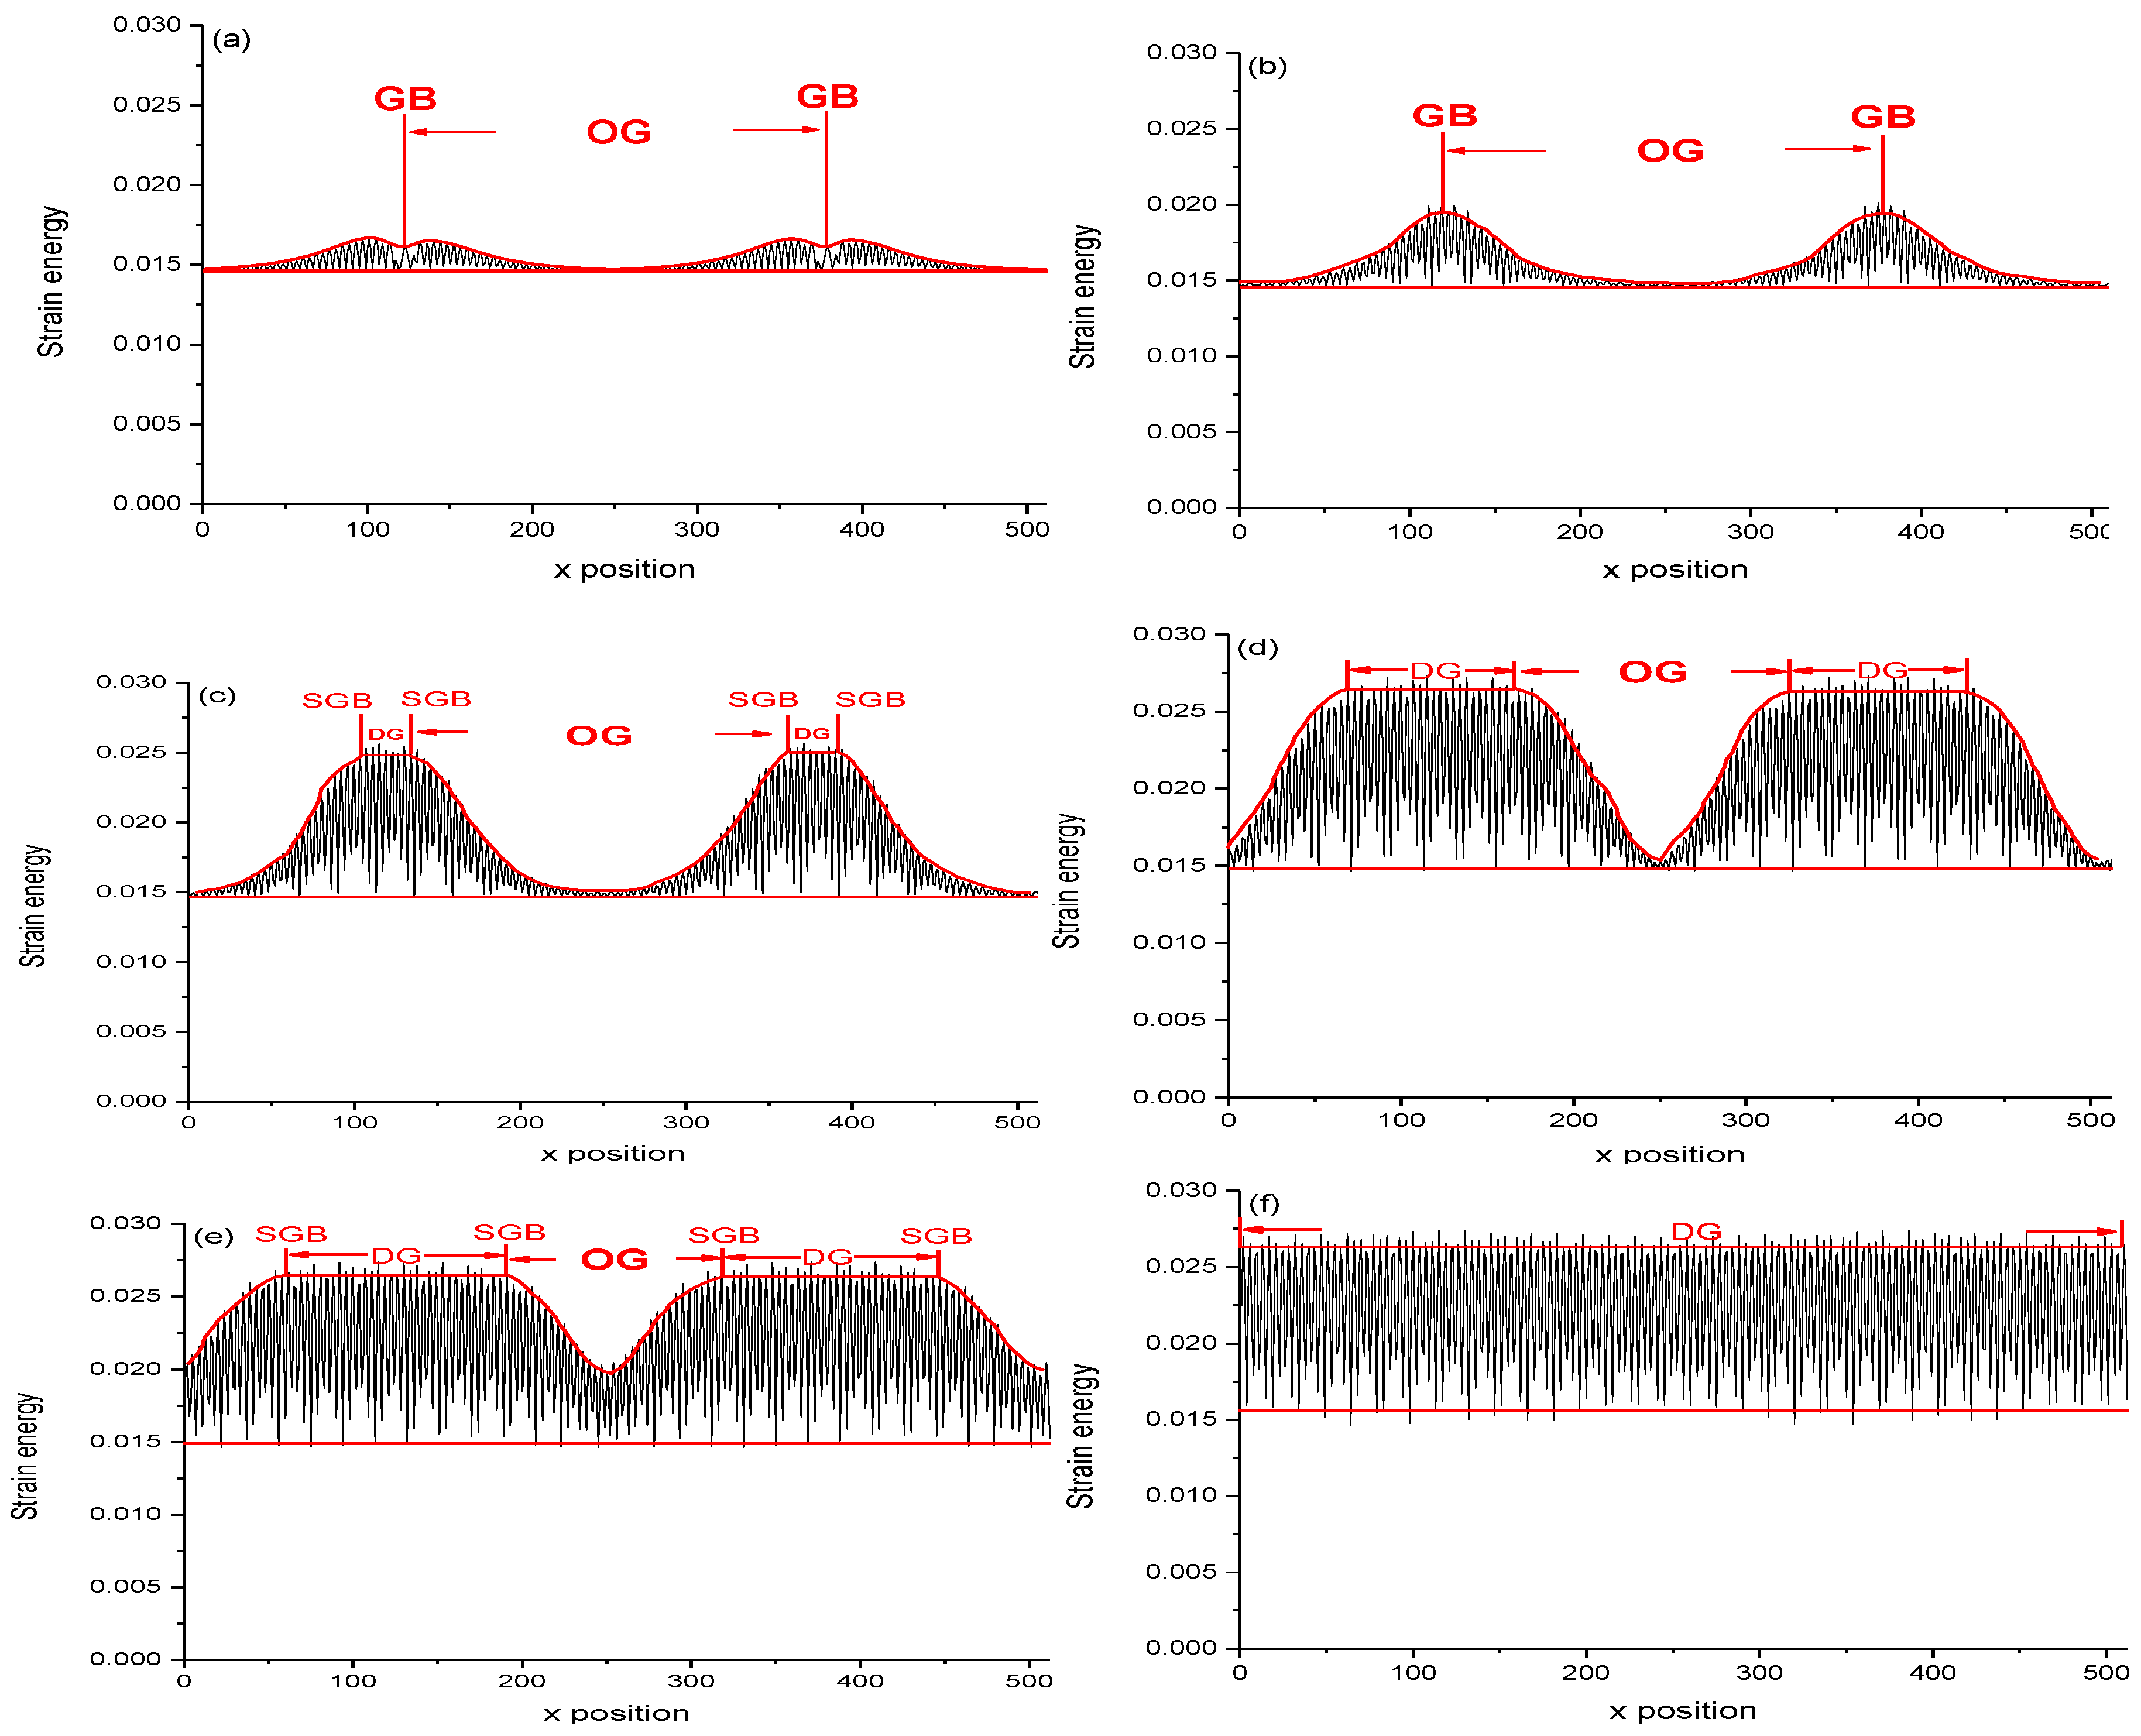
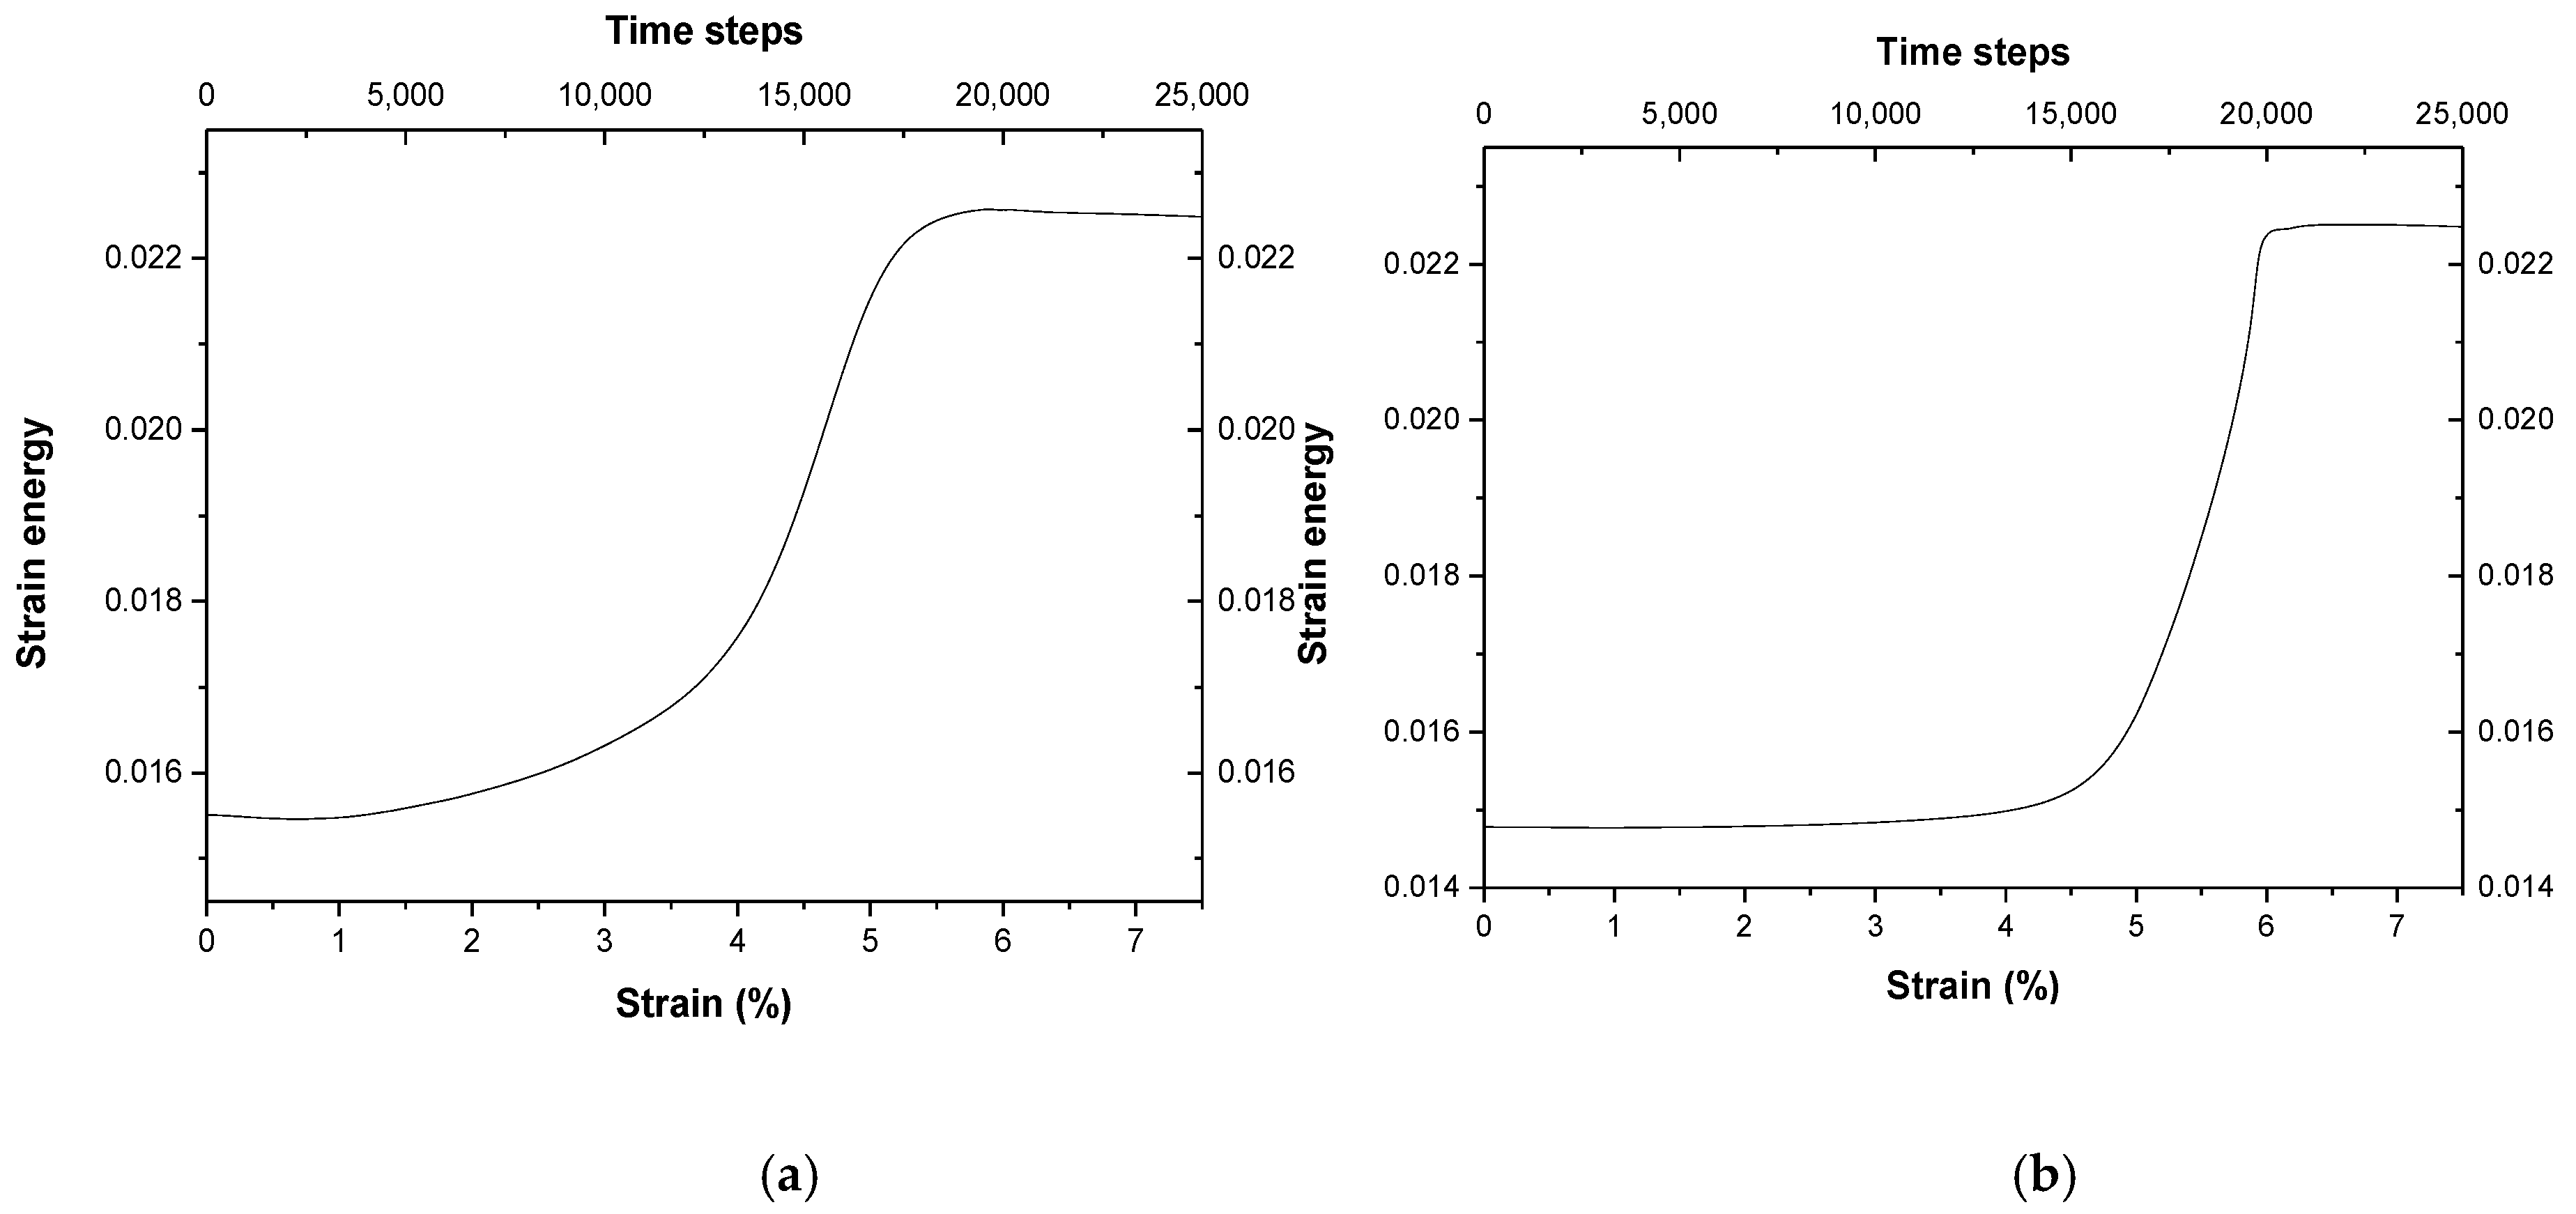
3.2. The Localized Strain Energy and Localized Plastic Flow
3.3. Extension of Localized Deformation Zone
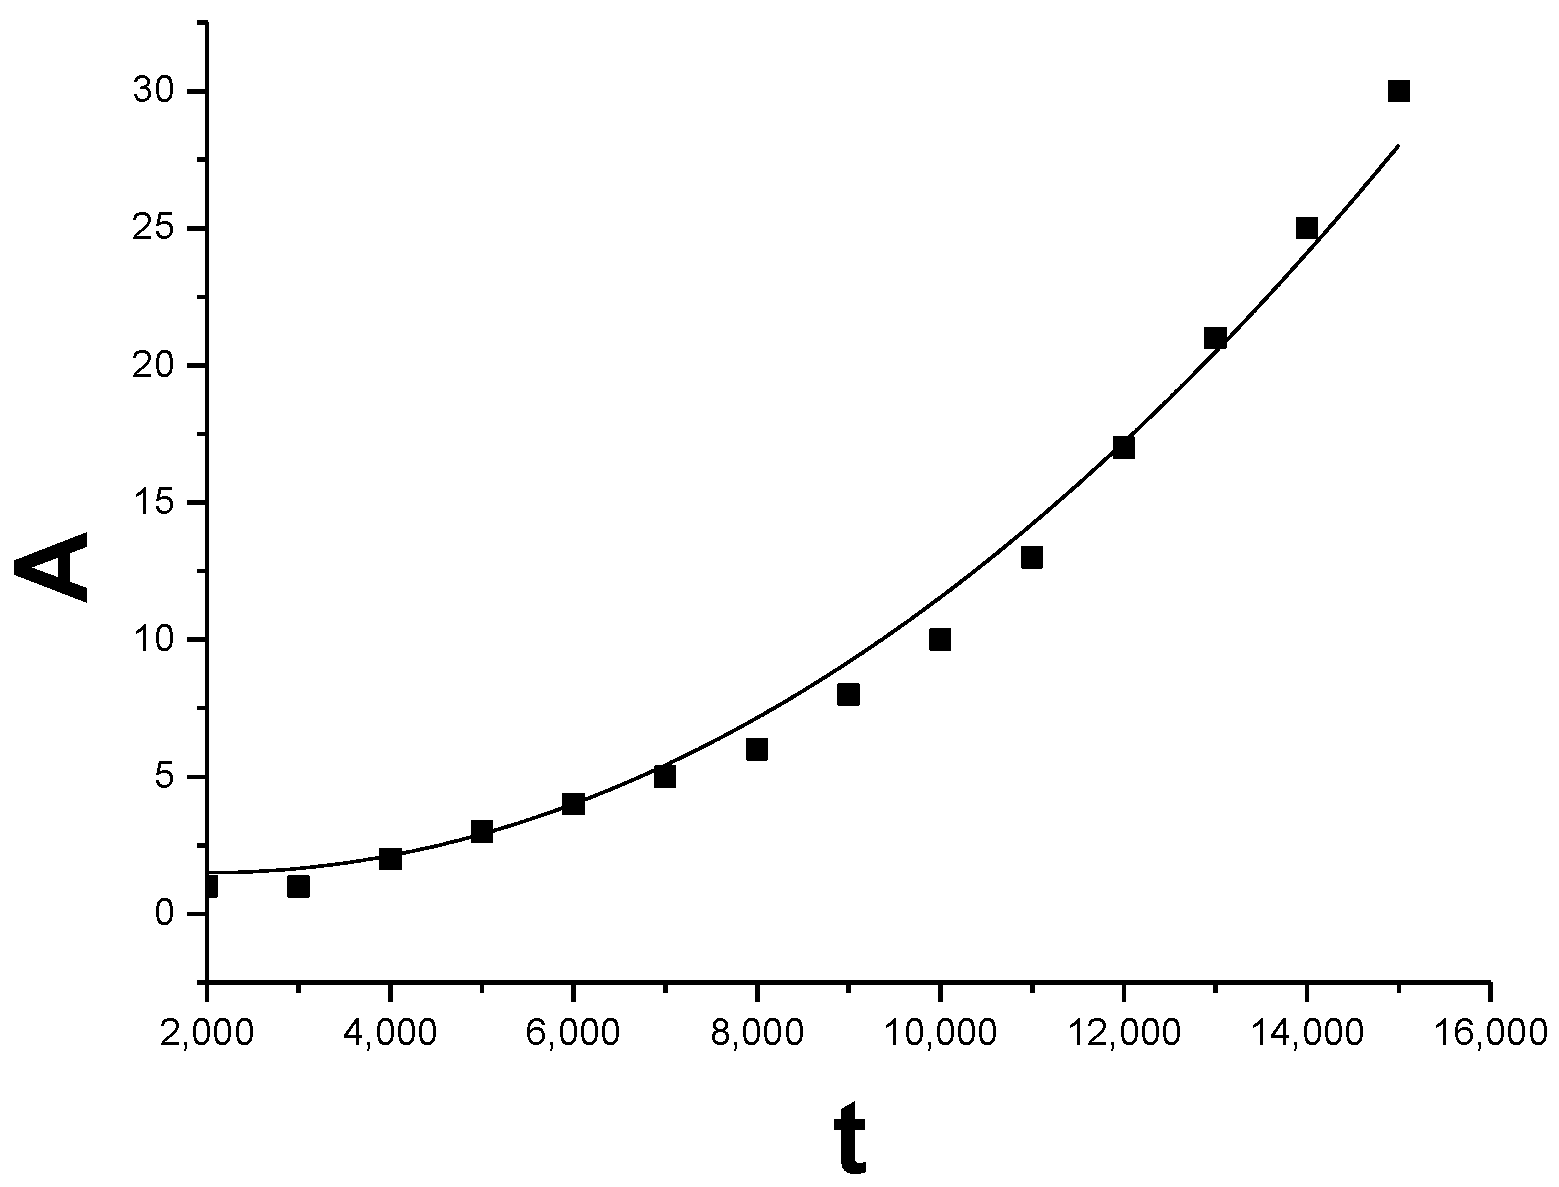
3.4. The Law of the Deformed Grain Growth
3.5. Dynamic of the DGG
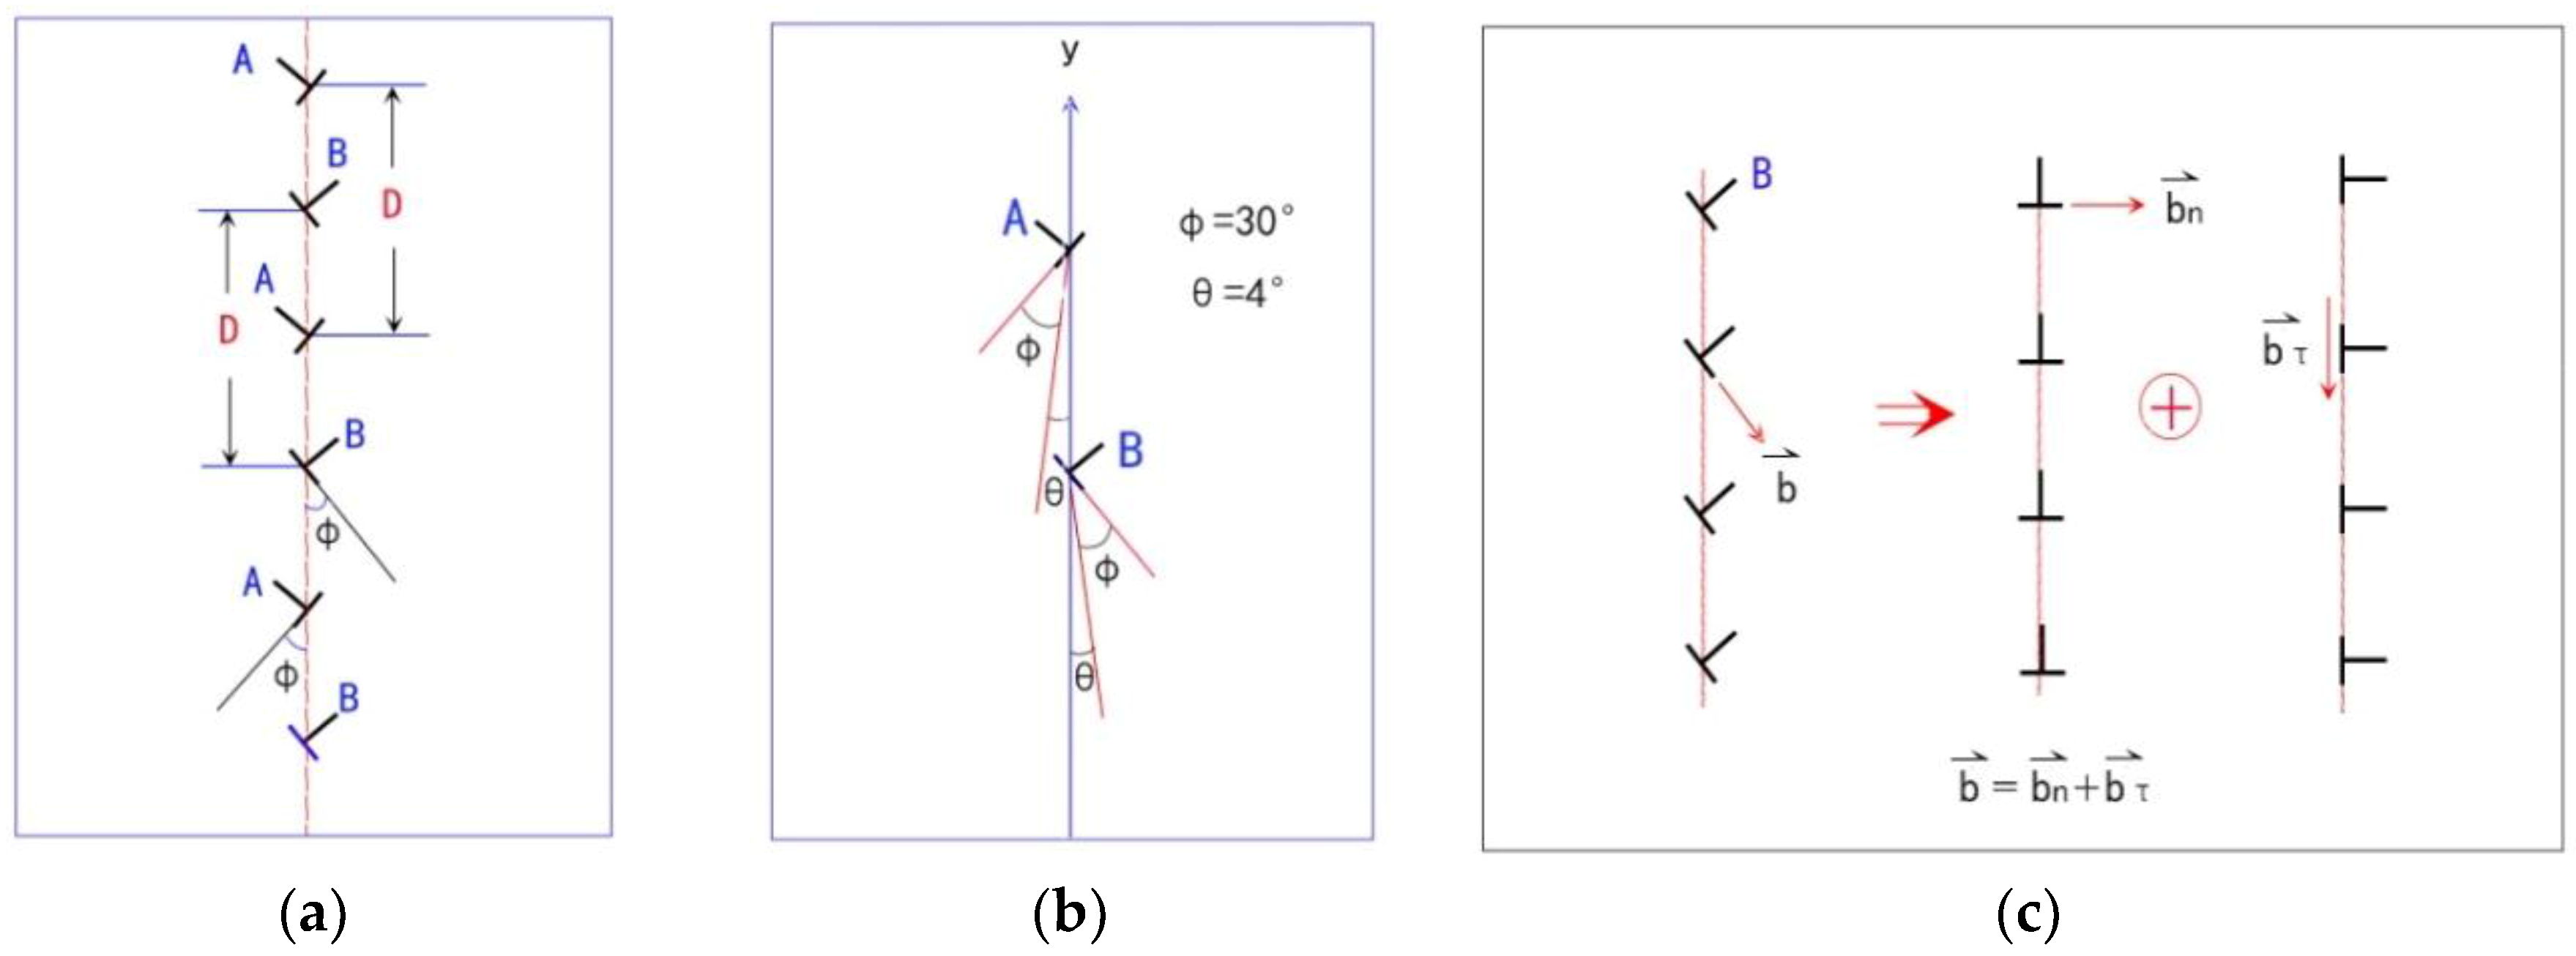
3.6. Dynamic of Dislocation of STGB under Deviatoric Deformation
4. Conclusions
Author Contributions
Funding
Conflicts of Interest
Abbreviations
| PFC: | Phase field crystal |
| DGG: | Deformed grain growth |
| GBD: | Grain boundary dislocation |
| GBS: | Grain boundary sliding |
| CDM: | Cooperative dislocation movement |
| DG: | Deformed grain |
| OG: | Original grain |
| STGB: | Symmetric tilt grain boundary |
| SGB: | Sub-grain boundary |
| LB: | Lűders band |
| SS: | Stress-strain |
| NC: | Nanocrystalline |
| EGBD: | Extrinsic grain boundary dislocation |
Appendix A. Dynamic Equation of Dislocation for STGB Migration and DGG
References
- Meyers, M.A.; Mishra, A.; Benson, D.J. Mechanical properties of nanocrystalline materials. Prog. Mater. Sci. 2006, 51, 427–556. [Google Scholar] [CrossRef]
- Trautt, Z.T.; Adland, A.; Karma, A.; Mishin, Y. Coupled motion of asymmetrical tilt grain boundaries: Molecular dynamics and phase field crystal simulations. Acta Mater. 2012, 60, 6528–6539. [Google Scholar] [CrossRef]
- Cahn, J.W.; Taylor, J.E. A unified approach to motion of grain boundaries, relative tangential translation along grain boundaries. Acta Mater. 2004, 52, 4887–4898. [Google Scholar] [CrossRef]
- Cahn, J.W.; Mishin, Y.; Suzuki, A. Duality of dislocation content of grain boundaries. Philos. Mag. 2006, 86, 3965–3976. [Google Scholar] [CrossRef]
- Cahn, J.W.; Mishin, Y.; Suzuki, A. Coupling grain boundary motion to shear deformation. Acta Mater. 2006, 54, 4953–4964. [Google Scholar] [CrossRef]
- Mishin, Y.; Asta, M.; Li, J. Coupling grain boundary motion to shear deformation. Acta Mater. 2010, 58, 1117–1126. [Google Scholar] [CrossRef]
- Chunmei, L.; Nanpu, C.; Zhiqian, C.; Zhangjing, X. Liangliang, H. Intermallic growth and interfacial properties of the grain refiners in Al alloys. Materials 2018, 11, 636. [Google Scholar]
- Gorkaya, T.; Molodov, D.; Gottstein, G. Concurrent grain boundary motion and grain rotation under an applied stress. Acta Mater. 2011, 59, 5674–5686. [Google Scholar] [CrossRef]
- Molodov, D.A.; Gorkaya, T.; Gottstein, G. Migration of grain boundaries under applied mechanical stress. Scr. Mater. 2011, 65, 990–993. [Google Scholar] [CrossRef]
- Gottstein, G.; Shvindlerman, L.S. On the retardation of grain boundary motion by small particles. Scr. Mater. 2010, 63, 1089–1091. [Google Scholar] [CrossRef]
- Rupert, T.J.; Gianola, D.S.; Gan, Y.; Hemker, K.J. Experimental observations of stress-driven grain boundary migration. Science 2009, 326, 1686–1690. [Google Scholar] [CrossRef] [PubMed]
- Jianjun, L.; Soh, A.K. Toughening of nanocrystalline materials through shear-coupled migration of grain boundaries. Scr. Mater. 2013, 69, 283–286. [Google Scholar]
- Bobylev, S.V.; Ovido, L.A. Stress-driven migration, convergence and splitting transformations of grain boundary in nanomaterials. Acta Mater. 2017, 124, 333–342. [Google Scholar] [CrossRef]
- Liu, P.; Mao, S.C.; Wang, L.H.; Han, X.D. Direct dynamic atomic mechanisms of strain-induced grain rotation in nanocrystalline. Scr. Mater. 2011, 64, 343–347. [Google Scholar] [CrossRef]
- Alsayed, A.M.; Islam, M.F.; Zhang, J.; Collings, P.J.; Yodh, A.G. Premelting at defects within bulk colloidal crystals. Science 2005, 309, 1207–1211. [Google Scholar] [CrossRef] [PubMed]
- Tallon, J.L. Premelting near crystal defects. Nature 1978, 276, 849–851. [Google Scholar] [CrossRef]
- Bartis, F.J. Thermodynamic Equations for Dysprosium-Aluminum Garnet near Its Néel Point. Nature 1977, 268, 427–430. [Google Scholar] [CrossRef]
- Oxtoby, D.W. New perspectives on freezing and melting. Nature 1990, 347, 725–728. [Google Scholar] [CrossRef]
- Pusey, P.N. Freezing and melting: Action at grain boundaries. Science 2005, 309, 1198–1201. [Google Scholar] [CrossRef] [PubMed]
- Yao, B.; Simkin, B.; Majumder, B.; Smith, C.; Bergh, M.; Cho, K.; Sohn, Y.H. Strain-induced grain growth of nanocrystalling Al in trimodal composites during forging. Mater. Sci. Eng. A 2012, 536, 103–109. [Google Scholar] [CrossRef]
- Mompiou, F.; Legros, M.; Caillard, D. Direct observation and quantification of grain boundary shear-migration coupling in polycrystalline Al. J. Mater. Sci. 2011, 46, 4308–4313. [Google Scholar] [CrossRef]
- Barmak, K.; Eggeling, E.; Kinderlehrer, D.; Sharp, R.; Ta’Asan, S.; Rollett, A.D.; Coffey, K.R. Grain growth and the puzzle of its stagnation: The curious tale of a tail and an ear. Prog. Mater. Sci. 2013, 58, 987–1055. [Google Scholar] [CrossRef]
- Zhang, Y.; Tucker, G.J.; Trelewicz, J.R. Stress-assisted grain growth in nanocrystalline matals: Grain boundary mediated mechanisms and stabilization. Acta Mater. 2017, 131, 39–47. [Google Scholar] [CrossRef]
- Qi, Y.; Krajewski, P.E. Molecular dynamics simulations of grain boundary sliding: The effect of stress and boundary misorientation. Acta Mater. 2007, 55, 1555–1563. [Google Scholar] [CrossRef]
- Williams, P.L.; Mishin, Y. Thermodynamics of grain boundary premelting in alloys. II. Atomistic simulation. Acta Mater. 2009, 57, 3786–3795. [Google Scholar] [CrossRef]
- Ghobadi, E.; Heuchel, M.; Kratz, K.; Lendlein, A. Simulating the shape-memory behavior of amorphous switching domains of poly by molecular dynamics. Macromol. Chem. Phys. 2013, 214, 1273–1283. [Google Scholar] [CrossRef]
- Keblinski, P.; Phillpot, S.R.; Wolf, D.; Gleiter, H. Amorphous structure of grain boundaries and grain junctions in nanocrystalline silicon by molecular-dynamics simulation. Acta Mater. 1997, 45, 987–996. [Google Scholar] [CrossRef]
- Wang, H.L.; Wang, X.X.; Liang, H.Y. Molecular dynamics simulation of strain effects on surface melting for metal Cu. Acta Phys. Sin. 2005, 54, 4836. [Google Scholar]
- Stefenovic, P.; Haataja, M.; Provatas, N. Phase field crystal study of deformation and plasticity in nanocrystalline materials. Phys. Rev. E 2009, 80, 046107. [Google Scholar] [CrossRef] [PubMed]
- Tonk, M.; Millet, P. Phase field simulation of the elastic deformation-driven grain growth in 2D copper polycrystals. Mater. Sci. Eng. A 2007, 528, 4086–4091. [Google Scholar] [CrossRef]
- Takaki, T.; Tomita, Y. Static recrystallization simulations starting from predicted deformation microstructure by coupling multi-phase-field method. Int. J. Mech. Sci. 2010, 52, 320–324. [Google Scholar] [CrossRef]
- Fan, D.; Chen, L.Q. Computer simulation of grain growth using a continuum field model. Acta Mater. 1997, 45, 611–622. [Google Scholar] [CrossRef]
- Elder, K.R.; Katakowski, M.; Haataja, M.; Grant, M. Modeling Elasticity in Crystal Growth. Phys. Rev. Lett. 2002, 88, 245701. [Google Scholar] [CrossRef] [PubMed]
- Elder, K.R.; Grant, M. Modeling elastic and plastic deformations in nonequilibrium processing using phase field crystals. Phys. Rev. E 2004, 70, 051605. [Google Scholar] [CrossRef] [PubMed]
- Yu, Y.M.; Backofen, R.; Voigt, A. Morphological instability of heteroepitaxial growth on vicinal substrates: A phase-field crystal study. J. Cryst. Growth 2011, 318, 18–26. [Google Scholar] [CrossRef]
- Elder, K.R.; Rossi, G.; Kanerva, P.; Sanches, F.; Ying, S.-C.; Granato, E.; Achim, C.V. Patterning of heteroepitaxial over layers from nano to micron scales. Phys. Rev. Lett. 2012, 108, 226102. [Google Scholar] [CrossRef] [PubMed]
- Gao, Y.J.; Huang, L.L.; Deng, Q.Q.; Lin, K.; Huang, C.G. Simulation of epitaxial growth on convex substrate using phase field crystal method. Front. Mater. Sci. 2014, 8, 185–187. [Google Scholar] [CrossRef]
- Mkhonta, S.K.; Elder, K.R.; Huang, Z.F. Exploring the Complex World of Two-Dimensional Ordering with Three Modes. Phys. Rev. Lett. 2013, 111, 035501. [Google Scholar] [CrossRef] [PubMed]
- Balakrishna, A.R.; Carter, W.C. Combining Phase-field-crystal method with a Cahn-Hilliard model for binary alloys. Phys. Rev. E 2018, 97, 043304. [Google Scholar] [CrossRef] [PubMed]
- Mellenthin, J.; Karma, A.; Plapp, M. Phase-field crystal study of grain-boundary premelting. Phys. Rev. B 2008, 78, 184110. [Google Scholar] [CrossRef]
- Gao, Y.J.; Luo, Z.R.; Huang, L.L.; Mao, H.; Huang, C.G.; Lin, K. Phase Field Crystal Study of Nano-crack Growth and Branch in Materials. Model. Simul. Mater. Sci. Eng. 2016, 24, 055010. [Google Scholar]
- Gao, Y.J.; Lu, Y.J.; Kong, L.Y.; Deng, Q.Q.; Huang, L.L. Phase field crystal model and its application for microstructure evolution of materials. Acta Metall. Sin. 2018, 54, 278–292. [Google Scholar]
- Greenwood, M.; Rottler, J.; Provatas, N. Phase-field-crystal methodology for modeling of structural transformations. Phys. Rev. E 2011, 83, 031601. [Google Scholar] [CrossRef] [PubMed]
- Wu, K.-A.; Voorhees, P. Phase-field-crystal modelling of nanocrystalline grain growth. Acta Mater. 2012, 60, 407–419. [Google Scholar] [CrossRef]
- Tang, S.; Wang, Z.J.; Guo, Y.L.; Wang, J.C.; Yu, Y.M.; Zhou, Y.H. Orientation selection process during the early stage of cubic dendrite growth: A phase-field-crystal model. Acta Mater. 2012, 60, 5501–5507. [Google Scholar] [CrossRef]
- Gao, Y.J.; Deng, Q.Q.; Quan, S.L.; Zhou, W.Q.; Huang, C.G. Phase-field-crystal simulation of dislocation movement at high temperature. Front. Mater. Sci. 2014, 8, 176–184. [Google Scholar] [CrossRef]
- Adland, A.; Karma, A.; Spatschek, R.; Buta, D.; Asta, M. Phase-field-crystal study of grain boundary premelting and shearing in bcc iron. Phys. Rev. B 2013, 87, 024110. [Google Scholar] [CrossRef]
- Hirouchi, T.; Takaki, T.; Tomita, Y. Development of numerical scheme for phase field crystal deformation simulation. Comput. Mater. Sci. 2009, 44, 1192–1197. [Google Scholar] [CrossRef]
- Toth, G.I.; Teyze, G. Heterogeneous Crystal Nucleation: The Effect of Lattice Mismatch. Phys. Rev. Lett. 2012, 108, 025502. [Google Scholar] [CrossRef] [PubMed]
- Berry, J.; Rottle, J.; Sinclair, C.; Drovatas, N. Atomistic study of diffusive-mediated plasticity and creep using phase crystal method. Phys. Rev. B 2015, 90, 134103. [Google Scholar] [CrossRef]
- Tarp, J.M.; Angheluta, L.; Mathiesen, J.; Goldenfeld, N. Intermittent dislocation density fluctuations in crystal plasticity from a phase field crystal model. Phys. Rev. Lett. 2014, 113, 265503. [Google Scholar] [CrossRef] [PubMed]
- Gao, Y.J.; Qin, H.L.; Deng, Q.Q.; Luo, Z.R.; Huang, C.G. Phase Field crystal Simulation of grain boundary annihilation under strain. Acta Phys. Sin. 2015, 64, 106105. [Google Scholar]
- Omori, T.; Kusame, T.; Kawata, S.; Ohnuma, I.; Stuton, Y.; Araki, Y.; Ishida, K.; Kainuma, R. Abnormal grain growth induced by cyclic heat treatment. Science 2013, 341, 1500–1502. [Google Scholar] [CrossRef] [PubMed]
- Rao, S.I.; Dimiduk, D.M.; Awady, J.A. Screw dislocation cross slips and screw dipole annihilation. Acta Mater. 2015, 101, 10–15. [Google Scholar] [CrossRef]
- Gao, Y.J.; Huang, L.L.; Zhou, W.Q.; Deng, Q.Q.; Luo, Z.R.; Huang, C.G. Phase field model for dislocation movement and rotation under strain. Sci. China Technol. 2015, 45, 306–321. [Google Scholar]
- Gao, Y.J.; Huang, L.L.; Deng, Q.Q.; Zhou, W.Z.; Luo, Z.R. Phase field crystal simulation of dislocation configuration evolution in dynamic recovery. Acta Mater. 2016, 117, 238–251. [Google Scholar] [CrossRef]
- Cheng, M.; Warren, J.A. An efficient algorithm for solving the phase field crystal model. J. Comput. Phys. 2008, 227, 6241–6248. [Google Scholar] [CrossRef]
- Gomez, H.; Nogueira, X. An unconditionally energy-stable method for the phase field crystal equation. Comput. Methods Appl. Eng. 2012, 249, 52–62. [Google Scholar] [CrossRef]
- Hirouchi, T.; Takaki, T.; Tomita, Y. Effects of temperature and grain size on phase field crystals deformation simulation. Int. J. Mech. Sci. 2010, 52, 309–319. [Google Scholar] [CrossRef]
- Schonfelder, B.; Wolf, D.; Phillpot, S.R.; Furtkamp, M. Molecular dynamic method for the simulation of grain boundary migration. Interface Sci. 1997, 5, 245–262. [Google Scholar] [CrossRef]
- Hirth, J.P.; Pond, R.C.; Lothe, J. Disconnections in tilt walls. Acta Mater. 2006, 54, 4237–4245. [Google Scholar] [CrossRef]
- Gao, Y.J.; Deng, Q.Q.; Huang, L.L.; Ye, L.; Wen, Z.C.; Luo, Z.R. Atomistic modeling for mechanism of crack cleavage extension on nano-scale. Comput. Mater. Sci. 2017, 130, 64–75. [Google Scholar] [CrossRef]
- Hirth, J.P.; Lothe, J. Theory of Dislocations; McGraw-Hill Inc. Press: New York, NY, USA, 1968; pp. 250–350, 678–680. [Google Scholar]
- Bobylov, S.V.; Norozov, N.E.; Ovidko, I.A. Cooperative GB sliding and migration process in nanocrystalline solids. Phys. Rev. Lett. 2010, 105, 055504. [Google Scholar] [CrossRef] [PubMed]
- Bobylev, S.V.; Gutkin, M.Y.; Ovidko, I.A. Decay of low-angle tilt boundary in deformed nanocrystalline materials. J. Phys. D Appl. Phys. 2003, 37, 269. [Google Scholar] [CrossRef]
- Semboshi, S.; Sato, M.; Kaneno, Y.; Iwase, A.; Takasugi, T. Grain Boundary Character Dependence on Nucleation of Discontinuous Precipitates in Cu-Ti Alloys. Materials 2017, 10, 415. [Google Scholar] [CrossRef] [PubMed]
- Rajagopalan, J.; Han, J.H.; Sail, M.A. Plastic deformation recovery in freestanding nanocrystalline Al and Au thin films. Science 2007, 315, 1831–1834. [Google Scholar] [CrossRef] [PubMed]
- Yan, B.; Liu, Y.; Wang, Z.; Liu, C.; Si, Y.; Li, H.; Yu, J. The Effect of Precipitate Evolution on Austenite Grain Growth in RAFM Steel. Materials 2017, 10, 1017. [Google Scholar] [CrossRef] [PubMed]
- Jia, D.; Ramesh, K.T.; Ma, E. Effects of nanocrystalline grain sizes on constitutive behavior and shear band in iron. Acta Mater. 2003, 51, 3495–3509. [Google Scholar] [CrossRef]
- Sergueeva, A.V.; Mara, N.A.; Mukherjee, A.K. Grain boundary sliding in nanomaterials at elevated temperatures. J. Mater. Sci. 2007, 42, 1433–1438. [Google Scholar] [CrossRef]
- Sun, Z.; Petegem, S.V.; Cerrellino, A.; Durest, K.; Blum, W.; Swygenhoven, H.V. Dynamic recovery in nanocrystalline Ni. Acta Mater. 2015, 91, 91–100. [Google Scholar] [CrossRef]
- Cao, A.J.; Cheng, Y.Q.; Ma, E. Structural processes that initiate shear localization in metallic glass. Acta Mater. 2009, 57, 5146–5155. [Google Scholar] [CrossRef]
- Tonk, M.; Millet, P.; Cai, W.; Wolf, D. The elastic strain energy driving force for grain boundary migration using phase field simulation. Scr. Mater. 2010, 63, 1049–1052. [Google Scholar] [CrossRef]
- Zhong, C.; Zhang, H.; Cao, Q.P.; Wang, X.D.; Zhang, D.X. Non-localized to localized plastic flow transition in metallic glasses. Scr. Mater. 2016, 114, 93–97. [Google Scholar] [CrossRef]
- Sundararajan, G.; Tirupataiah, Y. The localization of plastic flow under dynamic indentation conditions: Experimental results. Acta Mater. 2006, 54, 565–575. [Google Scholar] [CrossRef]
- Vinogradov, A.; Lasarev, A. Propagation of shear bands in metallic glasses and transition from serrated to non-serrated plastic flow at low temperature. Acta Mater. 2010, 58, 6736–6743. [Google Scholar] [CrossRef]
- Hähner, P. Theory of solitary plastic waves: Lűders band in polycrystals. Appl. Phys. A 1994, 58, 41–48. [Google Scholar] [CrossRef]
- Chen, P.Y.; Tsekems, G.; Dartzig, J.; Dahman, K.A.; Goldenfeld, N. Plasticity and dislocation dynamics in a phase field crystal metal. Phys. Rev. Lett. 2010, 105, 015502. [Google Scholar] [CrossRef] [PubMed]
- Zaiser, M. Spatio-temporal aspects of low-temperature thermo-mechamical instabilities. Appl. Phys. A 1993, 57, 143–151. [Google Scholar] [CrossRef]
- Horvath, G.; Chinh, N.; Gubicza, J.; Lendvai, J. Plastic instabilities and dislocation densities during plastic deformation in Al-Mg alloys. Mater. Sci. Eng. A 2007, 445, 186–192. [Google Scholar] [CrossRef]
- Estren, Y.; Kubin, L. Instabilities of plastic deformation for localization of plastic strain. Res. Mech. 1988, 23, 197–204. [Google Scholar]
- Toth, L.S.; Skrotzki, W.; Zhao, Y.; Pukenas, A.; Braun, C.; Birringer, R. Revealing Grain Boundary Sliding from Textures of a Deformed Nanocrystalline Pd–Au Alloy. Materials 2018, 11, 190. [Google Scholar] [CrossRef] [PubMed]
- Kill, C.E.; Helfen, L.; Miclels, D.; Natter, H.; Fitch, A.; Massor, O.; Birringer, R. Size-dependent grain-growth kinetic observed in nanocrystalline Fe. Phys. Rev. Lett. 2001, 86, 842. [Google Scholar]
- Backofen, R.; Bowmak, K.; Elder, K.; Voigt, A. Capturing the complex physics behind universal size distributions in thin metallic films. Acta Mater. 2014, 64, 72–77. [Google Scholar] [CrossRef]
- Bjerre, M.; Tarp, J.M.; Angheiuta, L.; Mathiegen, J. Rotation-induced grain growth and stagnation in phase-field crystal model. Phys. Rev. E 2013, 88, 020401. [Google Scholar] [CrossRef] [PubMed]
- Yamanka, A.; Mcreynolds, K.; Voorheers, P.W. PFC simulation of grain boundary motion, grain rotation and dislocation in BCC bicrystal. Acta Mater. 2017, 133, 160–171. [Google Scholar] [CrossRef]
- Luo, X.M.; Zhu, X.F.; Zhang, G.P. Nanotwin-assisted grain growth in nanocrystalline gold film under cyclic loading. Nat. Commun. 2014. [Google Scholar] [CrossRef] [PubMed]
- Mcreynods, K.; Wu, K.-A.; Voorhees, P. Grain growth and grain translation in crystals. Acta Mater. 2016, 120, 264–272. [Google Scholar] [CrossRef]
- Adland, A.; Xu, Y.; Karma, A. Unified theoretical framework for polycrystalline pattern evolution. Phys. Rev. Lett. 2013, 110, 265504. [Google Scholar] [CrossRef] [PubMed]
- Lin, Y.; Wen, H.; Li, Y.; Wen, B.; Liu, W.; Lavernia, E. An analytical model for stress-induced grain growth in the presence of second phase particals at grain boundary. Acta Mater. 2015, 82, 304–315. [Google Scholar] [CrossRef]
- Janssen, M.; Zuidema, J.; Wanhill, R. Fracture Mechanics; Taylor & Francis Group, Spon Press: London, UK, 2002; pp. 25–28. [Google Scholar]
- Groger, V.; Stelzhammer, J.; Trojanova, Z. Propagation of localized slip bands in low-temperature deformed of Cu-Be. Mater. Sci. Eng. A 2002, 324, 208–213. [Google Scholar] [CrossRef]
- Berry, J.; Grant, M.; Elder, K.R. Diffusive atomistic dynamic of edge dislocation in two dimensions. Phys. Rev. E 2006, 73, 31609. [Google Scholar] [CrossRef] [PubMed]
- Nazarov, A.A. Kinetic of grain boundary recovery in deformed polycrystals. Interface Sci. 2000, 8, 315–322. [Google Scholar] [CrossRef]
- Byum, T.S. On the stress dependence of partial dislocation seperation and deformation microstructure in steels. Acta Mater. 2003, 51, 3063–3071. [Google Scholar]
- Su, Y.; Xu, S. On the role of initial void geometry in plastic deformation of metallic thin film: A molecular dynamics study. Mater. Sci. Eng. A 2016, 678, 153–164. [Google Scholar] [CrossRef]


© 2018 by the authors. Licensee MDPI, Basel, Switzerland. This article is an open access article distributed under the terms and conditions of the Creative Commons Attribution (CC BY) license (http://creativecommons.org/licenses/by/4.0/).
Share and Cite
Kong, L.-y.; Gao, Y.-j.; Deng, Q.-q.; Luo, Z.-r.; Lu, Y.-j. A Study of Strain-Driven Nucleation and Extension of Deformed Grain: Phase Field Crystal and Continuum Modeling. Materials 2018, 11, 1805. https://doi.org/10.3390/ma11101805
Kong L-y, Gao Y-j, Deng Q-q, Luo Z-r, Lu Y-j. A Study of Strain-Driven Nucleation and Extension of Deformed Grain: Phase Field Crystal and Continuum Modeling. Materials. 2018; 11(10):1805. https://doi.org/10.3390/ma11101805
Chicago/Turabian StyleKong, Ling-yi, Ying-jun Gao, Qian-qian Deng, Zhi-rong Luo, and Yu-jiang Lu. 2018. "A Study of Strain-Driven Nucleation and Extension of Deformed Grain: Phase Field Crystal and Continuum Modeling" Materials 11, no. 10: 1805. https://doi.org/10.3390/ma11101805
APA StyleKong, L.-y., Gao, Y.-j., Deng, Q.-q., Luo, Z.-r., & Lu, Y.-j. (2018). A Study of Strain-Driven Nucleation and Extension of Deformed Grain: Phase Field Crystal and Continuum Modeling. Materials, 11(10), 1805. https://doi.org/10.3390/ma11101805