Article

The Degree of Temporal Synchronization of the Pulse Oscillations from a Gain-Switched Multimode Semiconductor Laser

Department of Physics and Electronics, Osaka Prefecture University, Sakai, Osaka 599-8531, Japan
*
Author to whom correspondence should be addressed.
Materials 2017, 10(8), 950; https://doi.org/10.3390/ma10080950
Submission received: 13 July 2017 / Revised: 9 August 2017 / Accepted: 12 August 2017 / Published: 15 August 2017
(This article belongs to the Special Issue Light Emitting Diodes and Laser Diodes: Materials and Devices)

Abstract

:
Langevin noise leads to inhibition of the temporal synchronization of the pulse oscillations from a gain-switched multimode semiconductor laser, resulting in the power reduction in optical beat detection. In this paper, the degree of the temporal synchronization of the pulse oscillations was examined by numerically estimating the output energy in THz time-domain spectroscopy (THz-TDS) using multimode semiconductor laser rate equations that include Langevin noise. The degree was estimated to be 95.5% from the ratio of the averaged THz-TDS output energy for the case where Langevin noise was included to that for when Langevin noise was excluded. Therefore, a gain-switched multimode semiconductor laser can be regarded as equivalent to optical pulses oscillating simultaneously in all modes in actual applications including optical beat detection.

Graphical Abstract

1. Introduction

Gain-switched semiconductor lasers have been used as compact picosecond optical sources in many applications, such as distance measurements [1,2,3], nonlinear microscope imaging [4,5], and optical communications [6,7]. In many cases, distributed feedback (DFB) lasers are used to meet the requirements of high pulse peak power and/or single-mode (narrow bandwidth) operation. However, the timing jitter in gain-switched multimode semiconductor lasers is much smaller than that in gain-switched single-mode semiconductor lasers, typically by a factor of 3–5 [8,9,10]. Therefore, Fabry–Perot (FP) lasers are also useful because low-jitter, wavelength-tunable, single-mode, gain-switched pulses can be obtained by the injection seeding technique [11,12,13,14].
Recently, we have reported that the suppression of the timing jitter in gain-switched FP lasers is caused by a decrease in the coherence time of the amplified spontaneous emission (ASE) based on the broad bandwidth of multimode oscillation. We have also shown that fluctuations in the ASE cause amplitude jitter, instead of timing jitter, in the pulse components of the respective modes [15]. The amplitude jitter disturbs fully simultaneous pulse oscillations among the multiple modes. Estimating the degree of temporal synchronization of the pulse oscillations from a gain-switched multimode semiconductor laser is an interesting subject of study. However, because the amplitude jitter is generally not important in the average detection, estimating the degree has not been given much importance in actual applications except for the field of optical communications.
The situation is different for the case of detecting optical beat signals. A typical example is THz time-domain spectroscopy (THz-TDS) with a multimode laser as an input light source [16,17,18,19]. In this case, the THz-TDS output strongly depends on the degree of temporal synchronization of the light components among the multiple modes. In this paper, we numerically estimate the degree of temporal synchronization of the pulse oscillations from a gain-switched multimode semiconductor laser by simulating the THz-TDS output.

2. Multimode Semiconductor Laser Rate Equations

We start by simulating a gain-switched multimode semiconductor laser using the multimode semiconductor laser rate equations, including Langevin noise [15,20,21]:
E ˙ n ( t ) = 1 + i α 2 [ g n ( N ) 1 τ p + β C 2 N ( t ) 2 S n ( t ) + 2 β C 2 N ( t ) 2 S n ( t ) Δ τ c ξ S n ( Δ τ c ) + i 2 n δ ω 1 + i α ] E n ( t ) ,
N ˙ ( t ) = I ( t ) e V N ( t ) T 1 ( N ) n [ g n ( N ) S n ( t ) + 2 S n ( t ) β C 2 N ( t ) 2 Δ τ c ξ S n ( Δ τ c ) 2 N ( t ) T 1 ( N ) Δ τ c ξ N n ( Δ τ c ) ] ,
where En(t), Sn(t), and N(t) are the complex optical electric field and photon density for the nth mode, and the carrier density, respectively. Sn(t) is equal to nr2ε0|En(t)|2/2ћωn. The modal gain gn(N) and the carrier density dependent carrier lifetime, T1(N), are given by
g n ( N ) = G 0 n ( N ( t ) N 0 n ) [ 1 + ε N n ( N ( t ) N 0 n ) ] ( 1 + ε S j S j ( t ) ) ,
1 T 1 ( N ) = C 1 + C 2 N ( t ) + C 3 N ( t ) 2 .
The injected current, I(t), for gain switching is represented as the sum of a dc-bias current and a sinusoidally modulated current, in the form:
I ( t ) = I d c I m w cos 2 π f mod t [ I ( t ) = 0   f o r   I ( t ) < 0 ] .
ξSn(≥Δτc) and ξNnτc) are the zero-mean and unit-variance Gaussian distributions, respectively, whose amplitudes are varied every Δτc as step functions [15]. ξ Sn , the differential gain coefficient, G0n, the carrier density at transparency, N0n, and the intrinsic gain saturation coefficient, εNn, for the nth-mode are represented by polynomial equations of mode number n in Equation (6). The condition n = 0 stands for the central mode, which is set to 375 THz (800 nm) by taking into account wavelength matching with a GaAs photoconductive antenna. A negative mode number indicates that the oscillation frequency for the mode of interest is lower than the central frequency, while a positive mode number indicates that it is higher. The coefficients aj, bj, and cj in Equation (6) take values suitable for expressing the gain of an 800-nm semiconductor laser, as listed in Table 1, and are obtained by numerical fitting in the same way as in previous studies [22,23]:
G 0 n = j = 0 14 a j n j , N 0 n = j = 0 14 b j n j , ε N n = j = 0 14 c j n j , ( 30 n 30 ) .
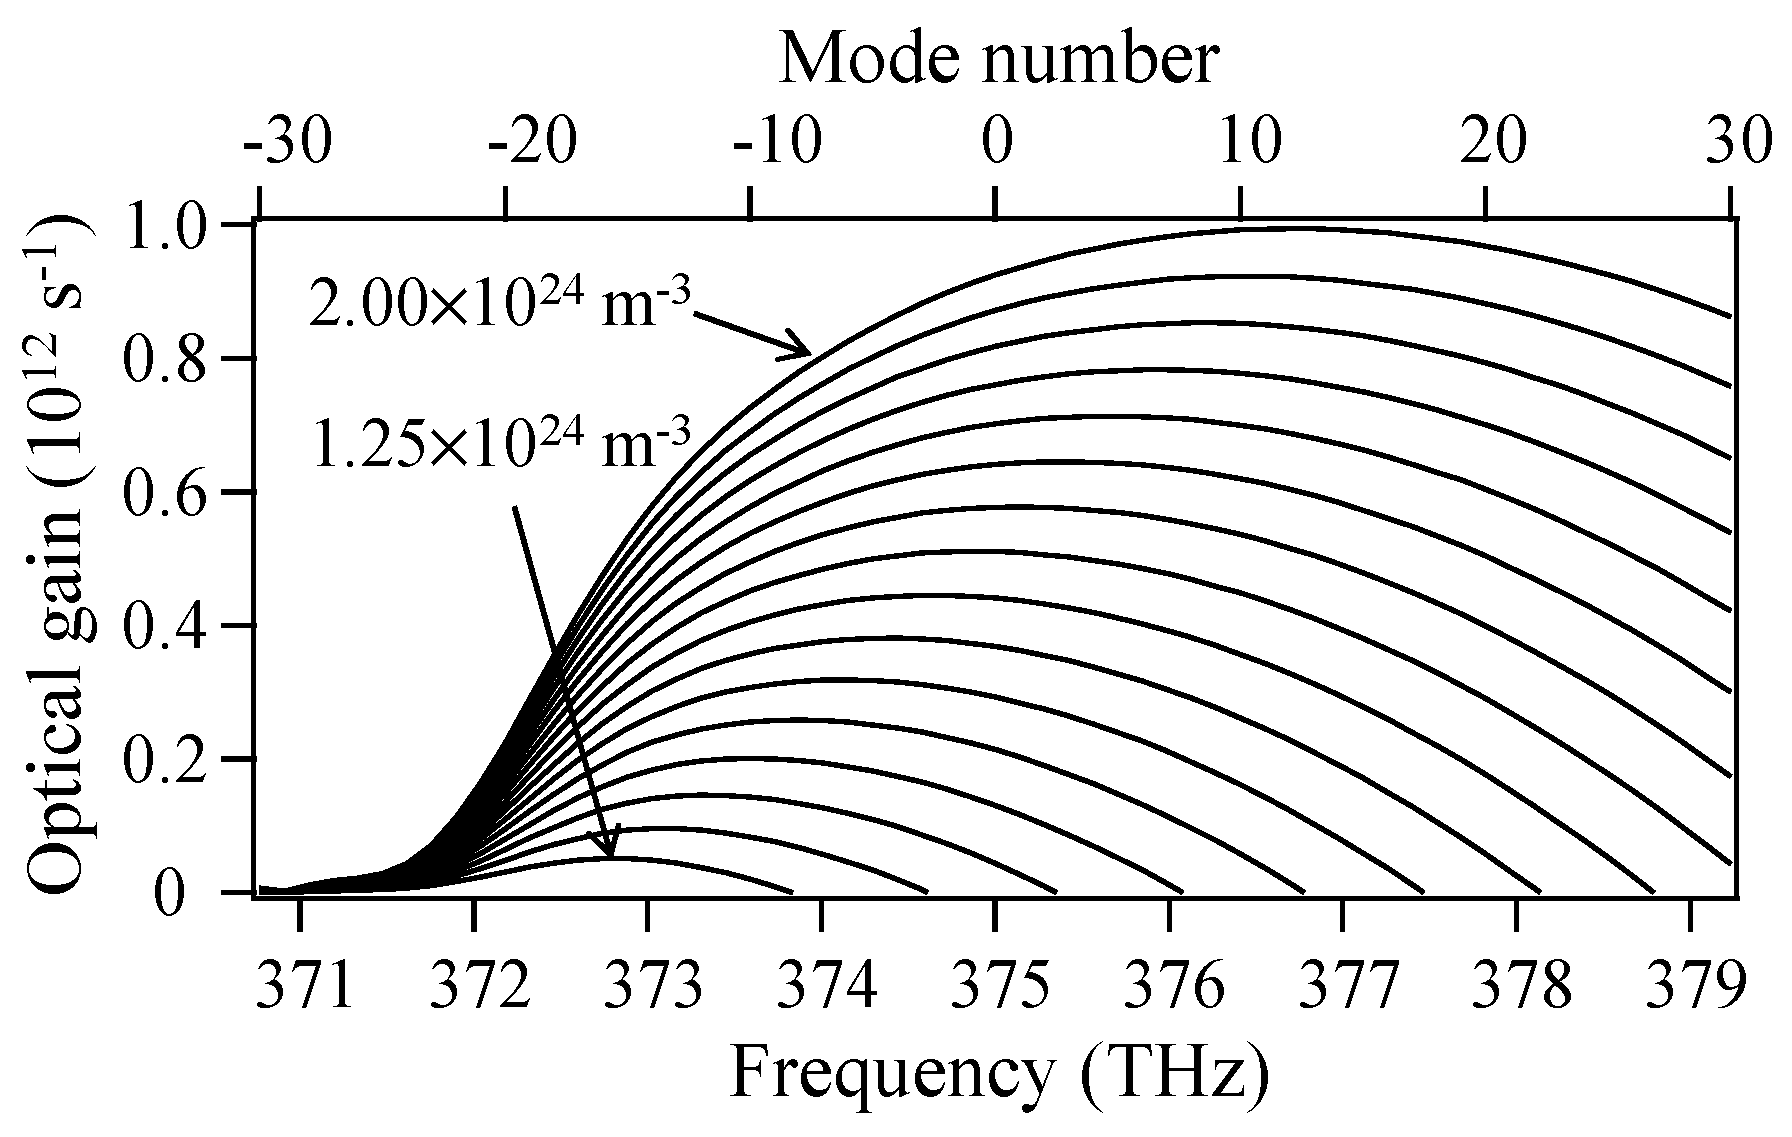
Figure 1 shows the 800-nm semiconductor laser gain spectra obtained by varying the mode number n in Equations (3) and (6) when Sj(t) = 0. The carrier density is set as a running parameter and is varied from 1.25 × 1024 m3 to 2.00 × 1024 m3 in 0.05 × 1024 m3 steps. The notation and values for the other parameters are listed in Table 2.

3. Gain-Switched Pulses from a Multimode Semiconductor Laser

The temporal evolution of the variables En(t) and N(t) was then numerically evaluated by the fourth-order Runge–Kutta method under the gain switching condition of Equation (5). Repeating the numerical integration produced a regular gain-switched pulse train within five cycles of the modulation period (1/fmod = 1 ns). The absolute values squared of the Fourier transform of the temporal data of the optical fields provided the power spectrum of the gain-switched pulse.
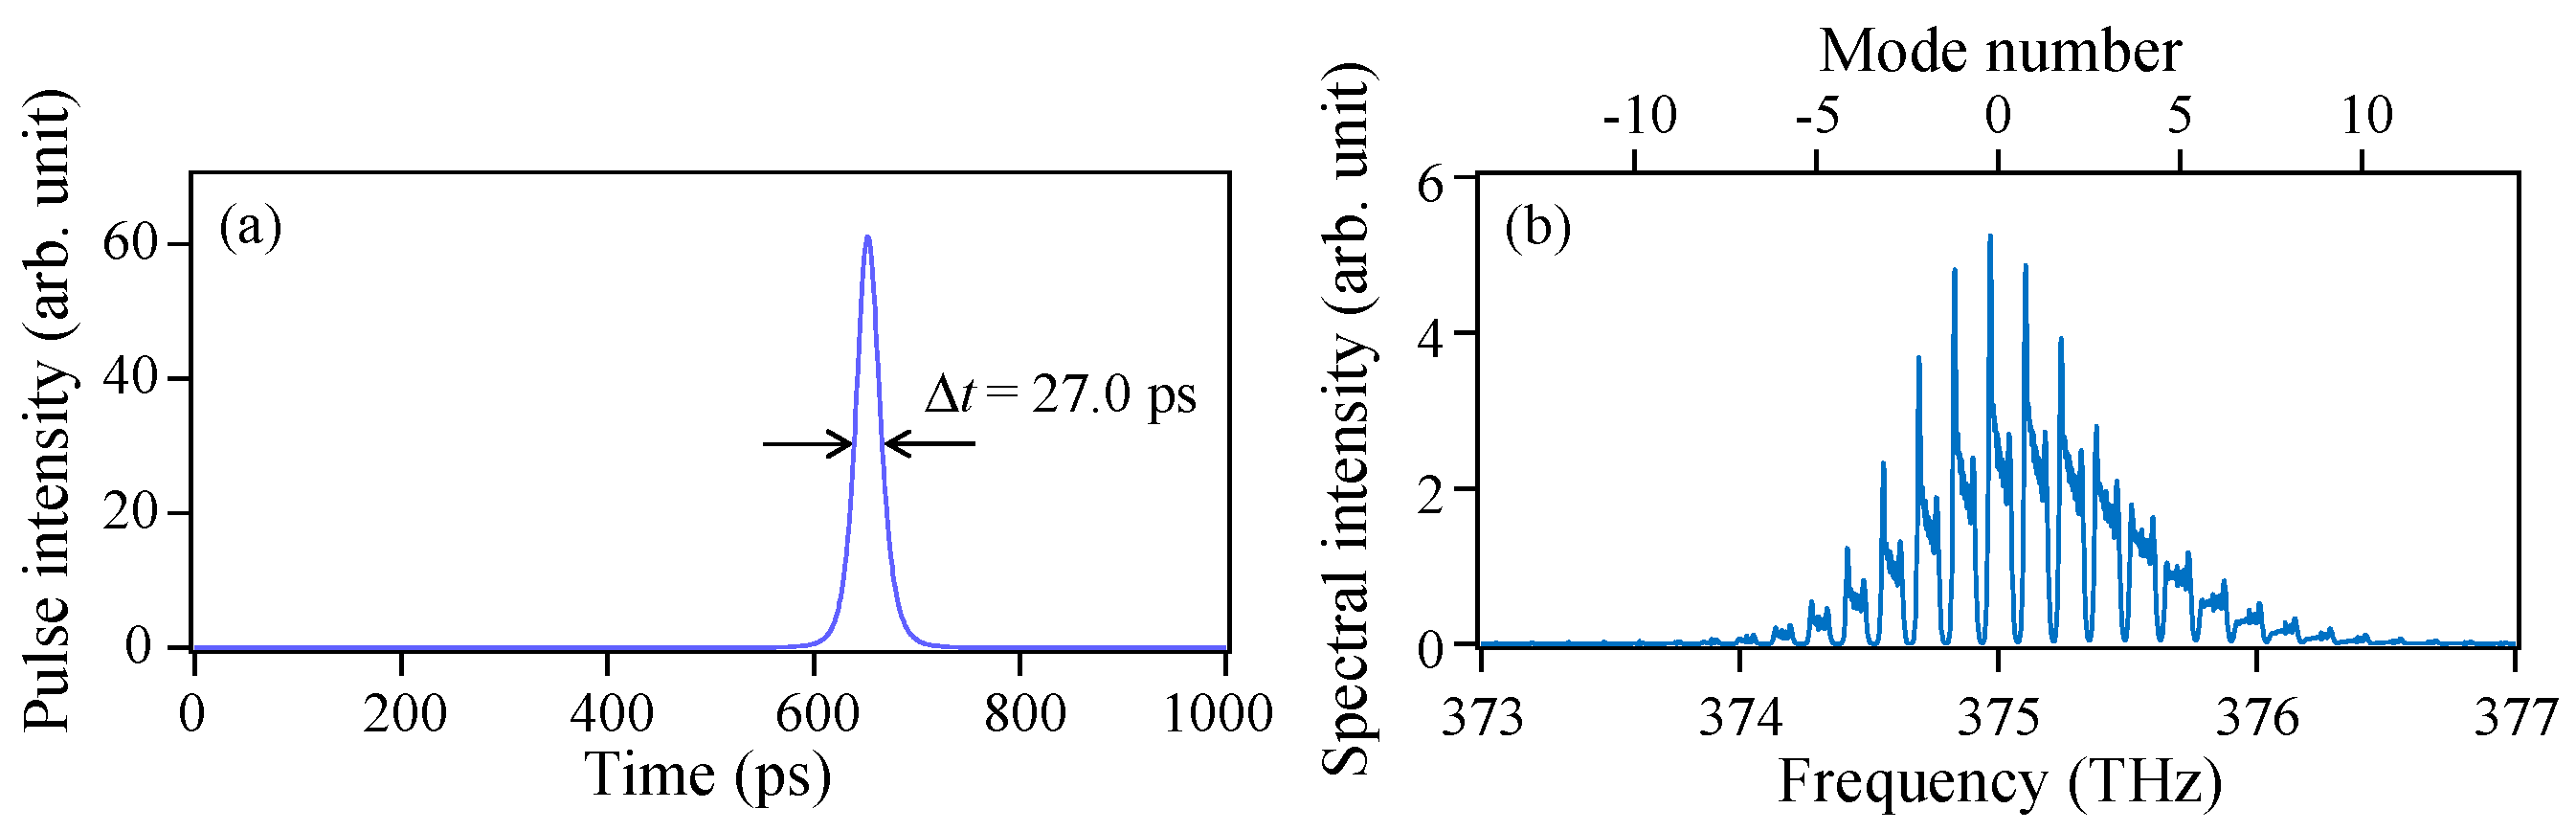
Figure 2 shows (a) a simulated averaged temporal waveform and (b) the corresponding power spectrum of the gain-switched pulse when the Langevin noise terms in Equations (1) and (2) are omitted (ξSn = ξNn = 0). In this ideal case, pulse oscillations occur simultaneously at about 20 modes. Although the spectral shape shown in Figure 2b is unchanged for arbitrary phase relations among multiple modes, the single-shot temporal waveform changes significantly. Therefore, to obtain the averaged temporal waveform shown in Figure 2a, the optical field components of the respective modes must be summed 1000 times under different phase conditions and then the waveform must be low-pass filtered. This coherent addition operation was found to be the same as the incoherent summation of the intensity profiles of the pulse components at the respective modes. Because the former method requires considerable care, we used the latter method to save time.
In contrast, in the presence of Langevin noise, the spectral shape changes significantly for every shot, as shown in Figure 3, meaning that the pulse components of about 20 modes oscillate asynchronously. The averaged temporal waveforms for the single-shot spectra obtained by the same method as for Figure 2a are somewhat different from one another due to a residual timing jitter. 
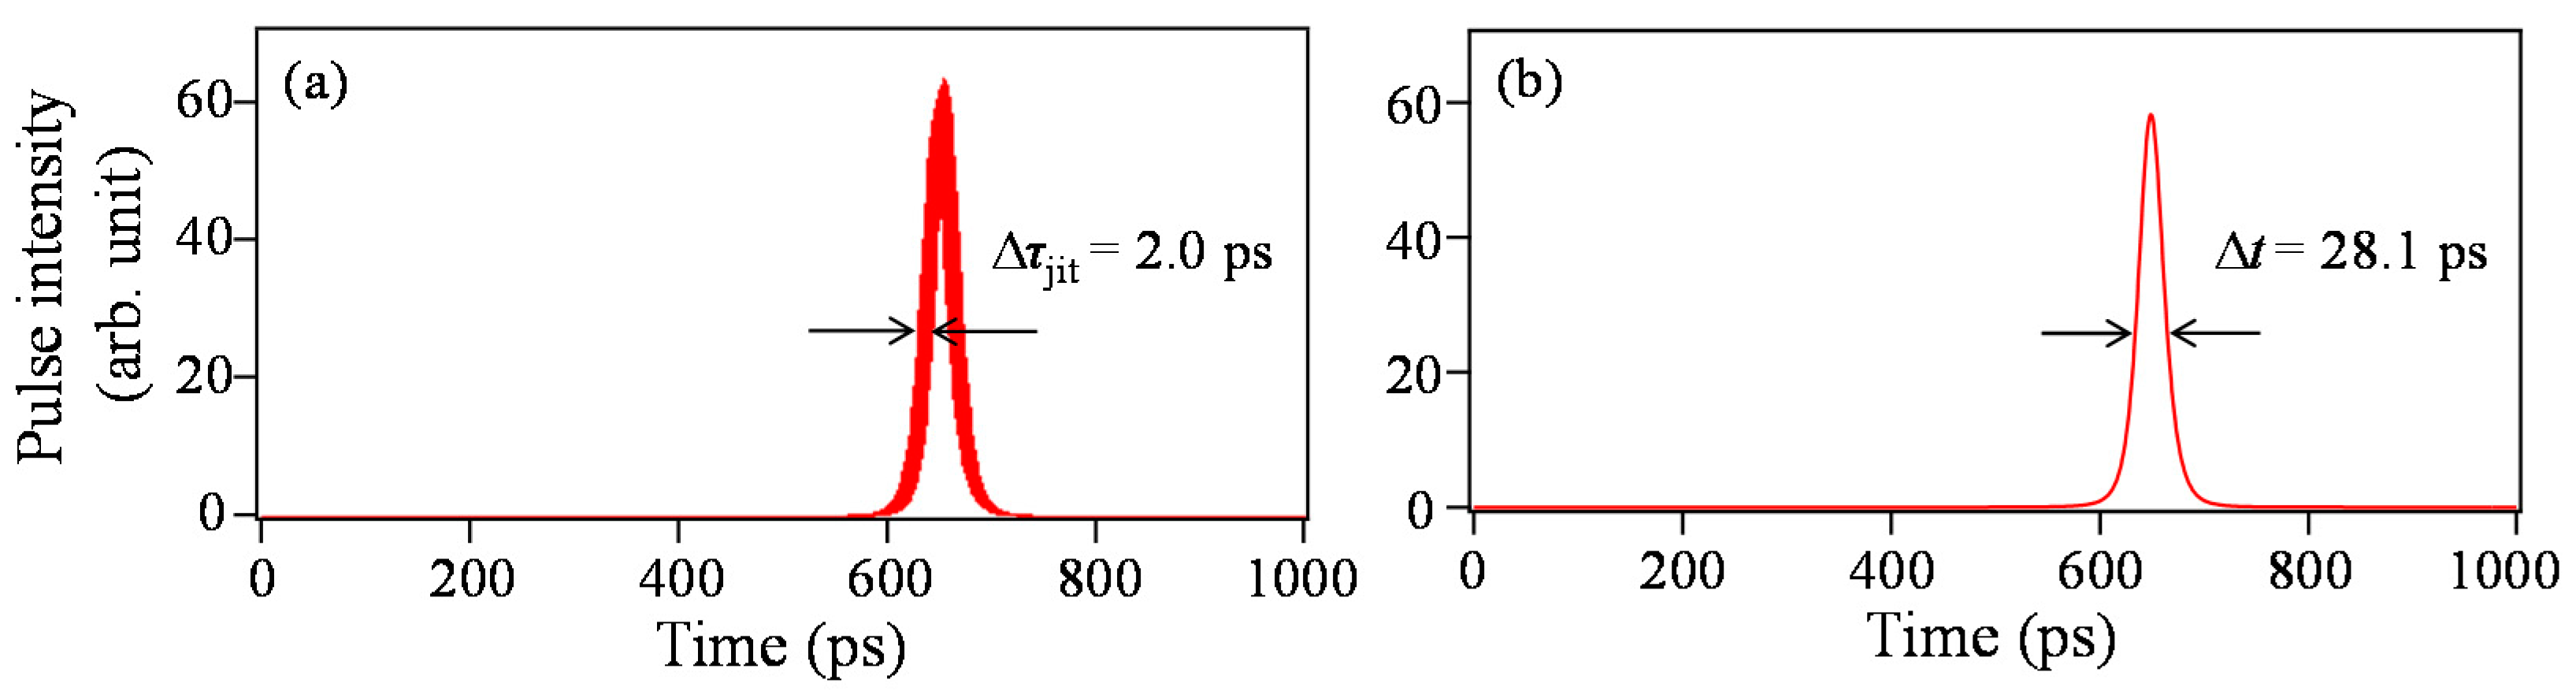
Figure 4a shows a superimposed pulse waveform consisting of 2000 traces of the averaged temporal waveforms. The residual timing jitter Δτjit in the Figure 4a is estimated to be 2.0 ps, defined as one standard deviation of the HWHM (half width at half maximum) of the optical pulses. Although a multimode oscillation effectively suppresses the generation of timing jitter, a relatively large timing jitter compared with the pulse width remains in Figure 4a because of the small number of oscillating modes. Then, 2000 averaged temporal waveforms are averaged again, as shown in Figure 4b. The waveforms in Figure 4a,b correspond to the raw and averaged pulse traces observed with a sampling oscilloscope, respectively. It is found from a comparison of Figure 2a and Figure 4b that the pulse width broadens to 28.1 ps from 27.0 ps due to the residual timing jitter caused by Langevin noise.
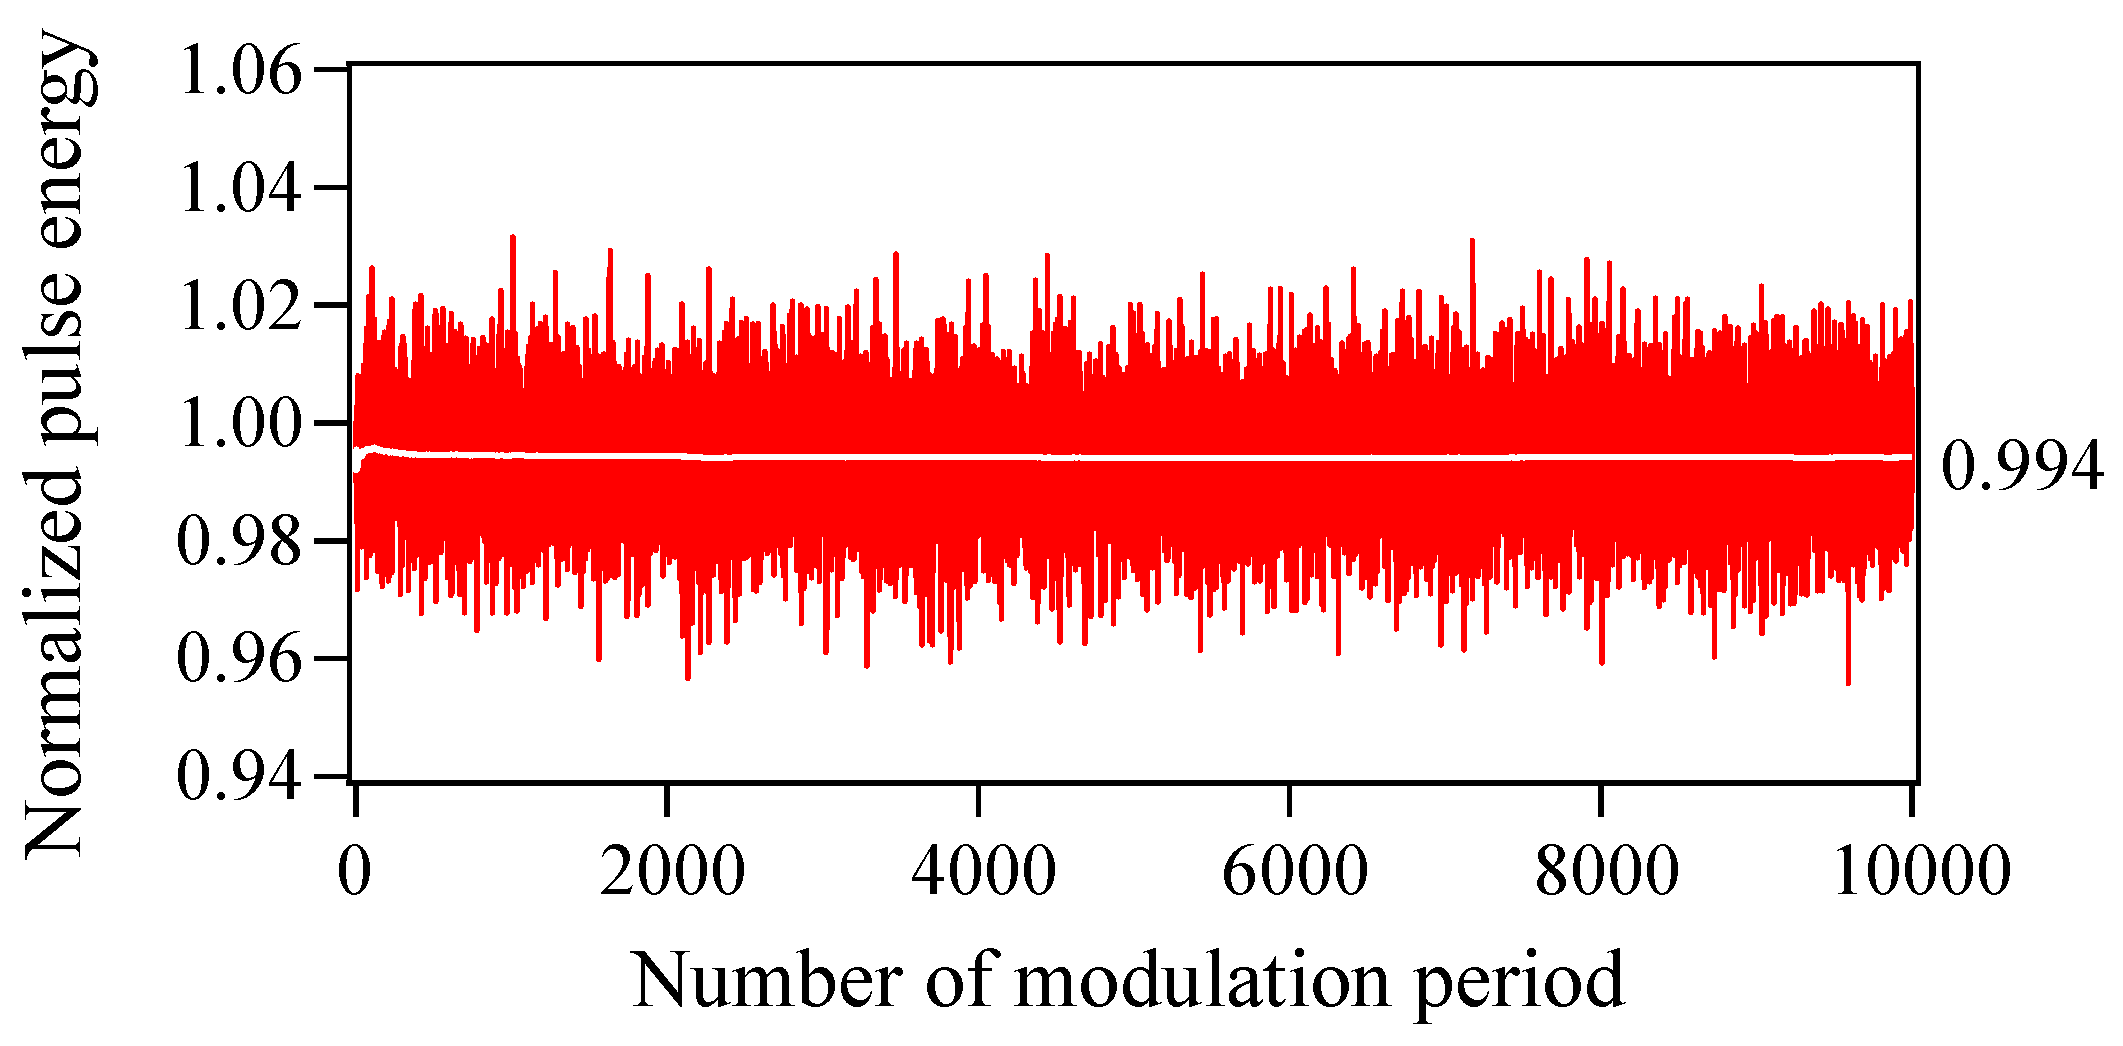
Figure 5 shows the temporal variation in the pulse energy from 0 to 10,000 times the modulation period (0–10 μs) in the presence of Langevin noise. The pulse energy ( n , ω | E ˜ n ( ω ) | 2 ) is normalized to that in the absence of Langevin noise. Although the single-shot pulse energy varies randomly from 0.96 to 1.03, the fluctuations due to Langevin noise are small and the averaged pulse energy converges on an approximately constant value of 0.994 within 2000 modulation periods (2 μs). 
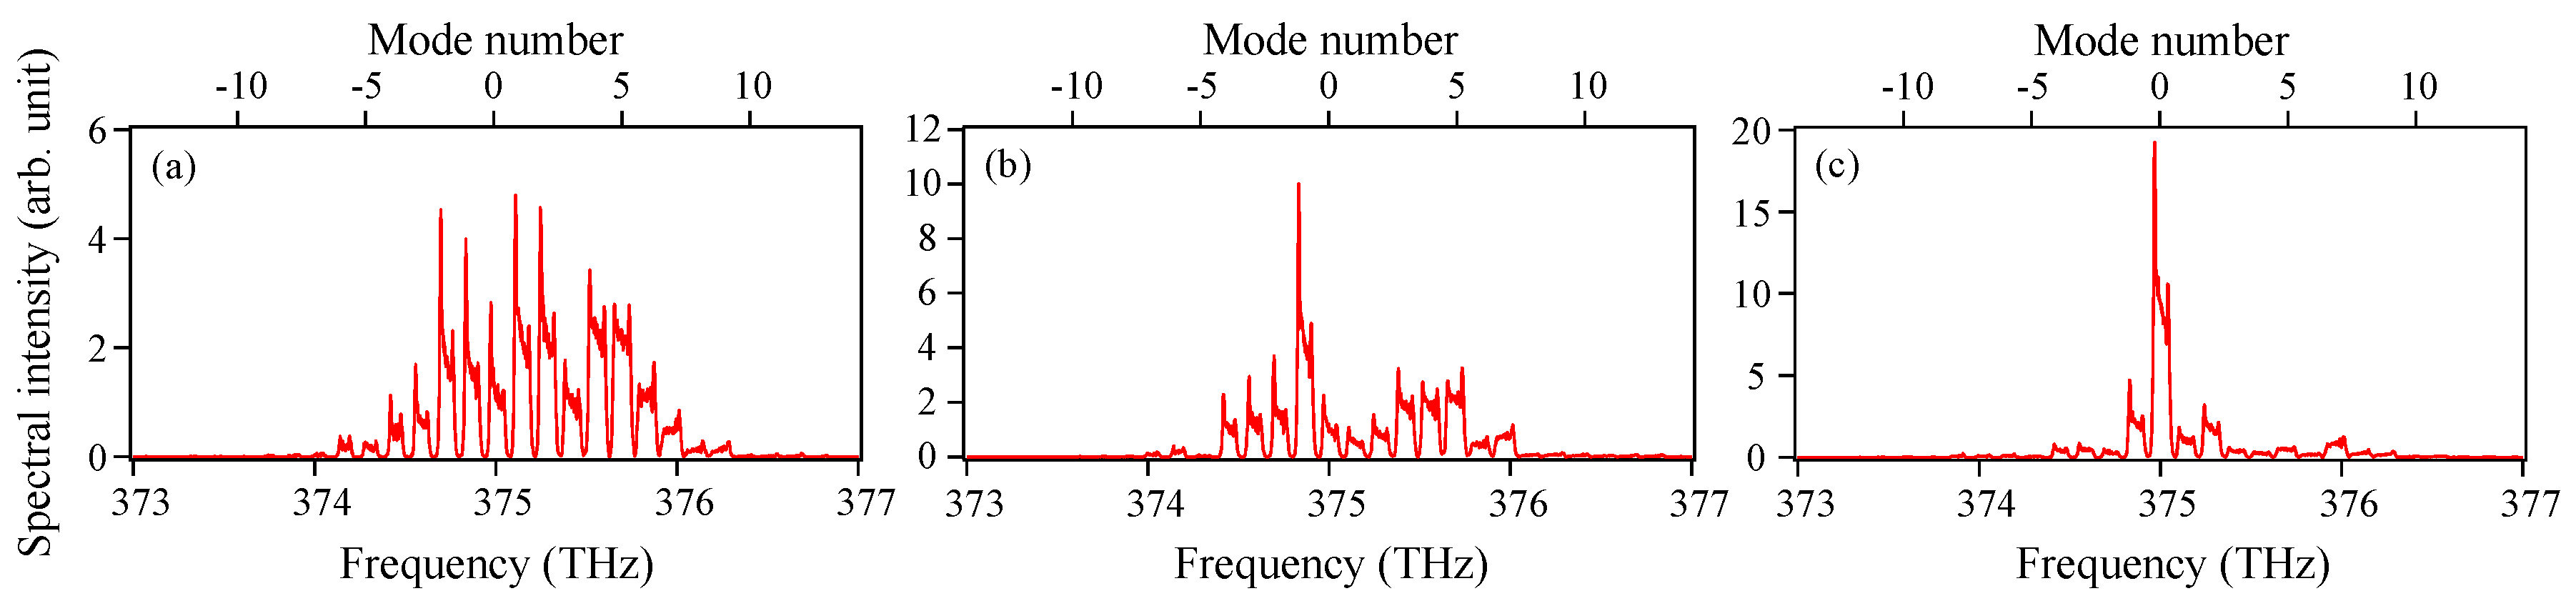
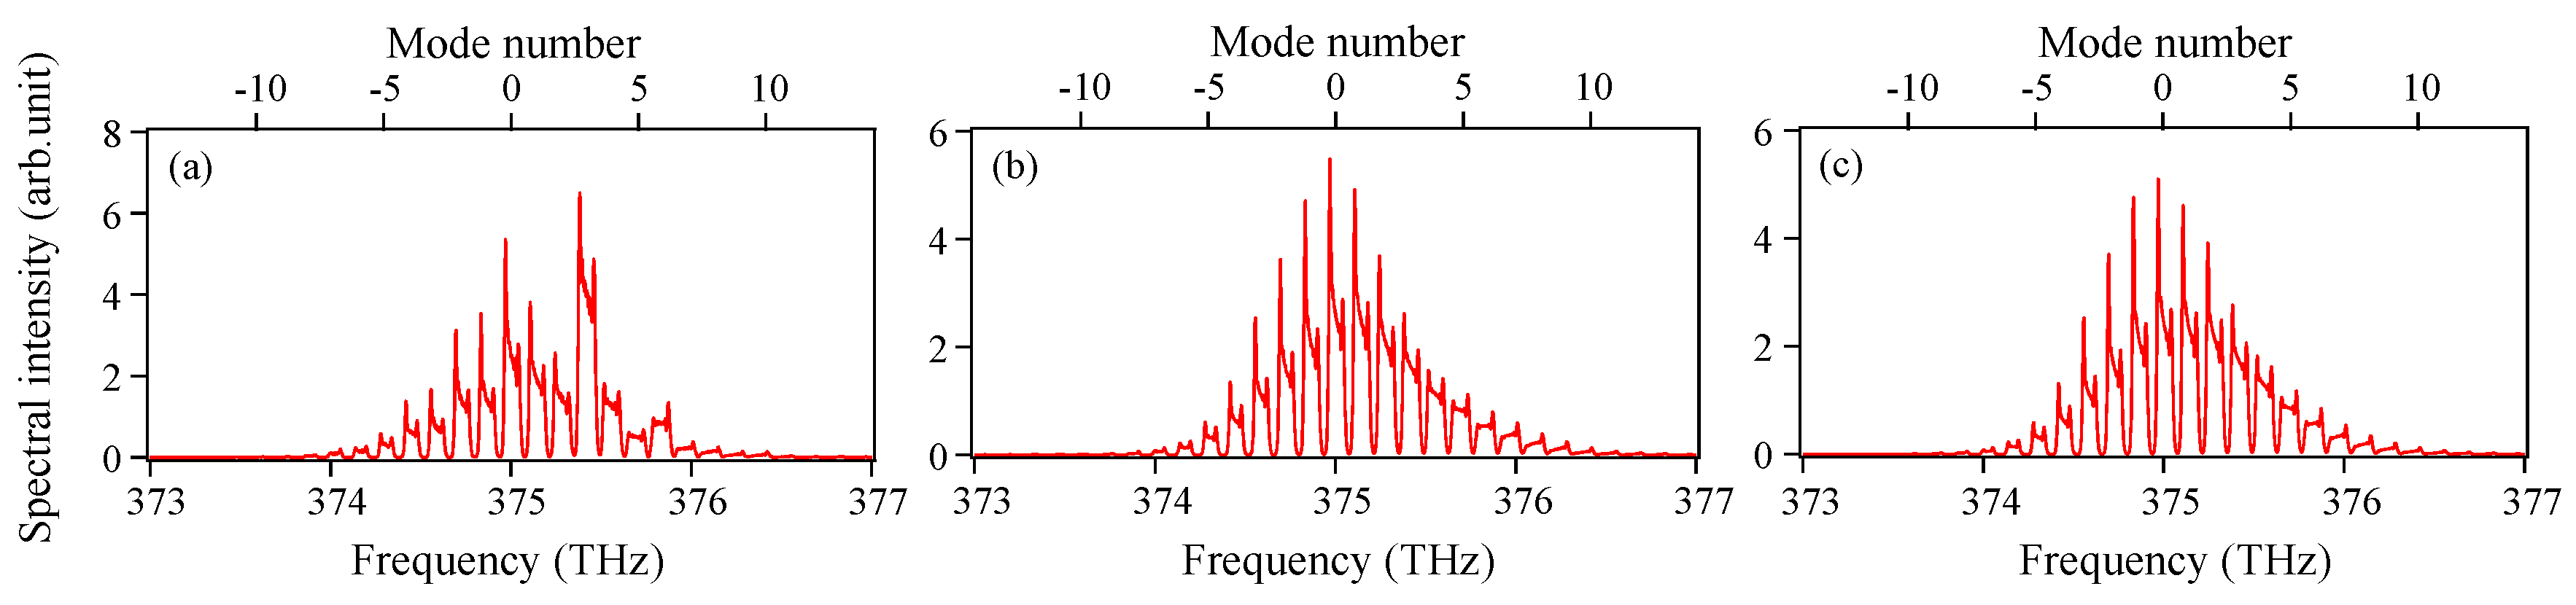
Figure 6 shows the averaged spectra when (a) 5, (b) 100, and (c) 2000 different single-shot spectra are summed. Corresponding to the result in Figure 5, the spectral shape of the averaged power spectrum in Figure 6c almost matches that in 
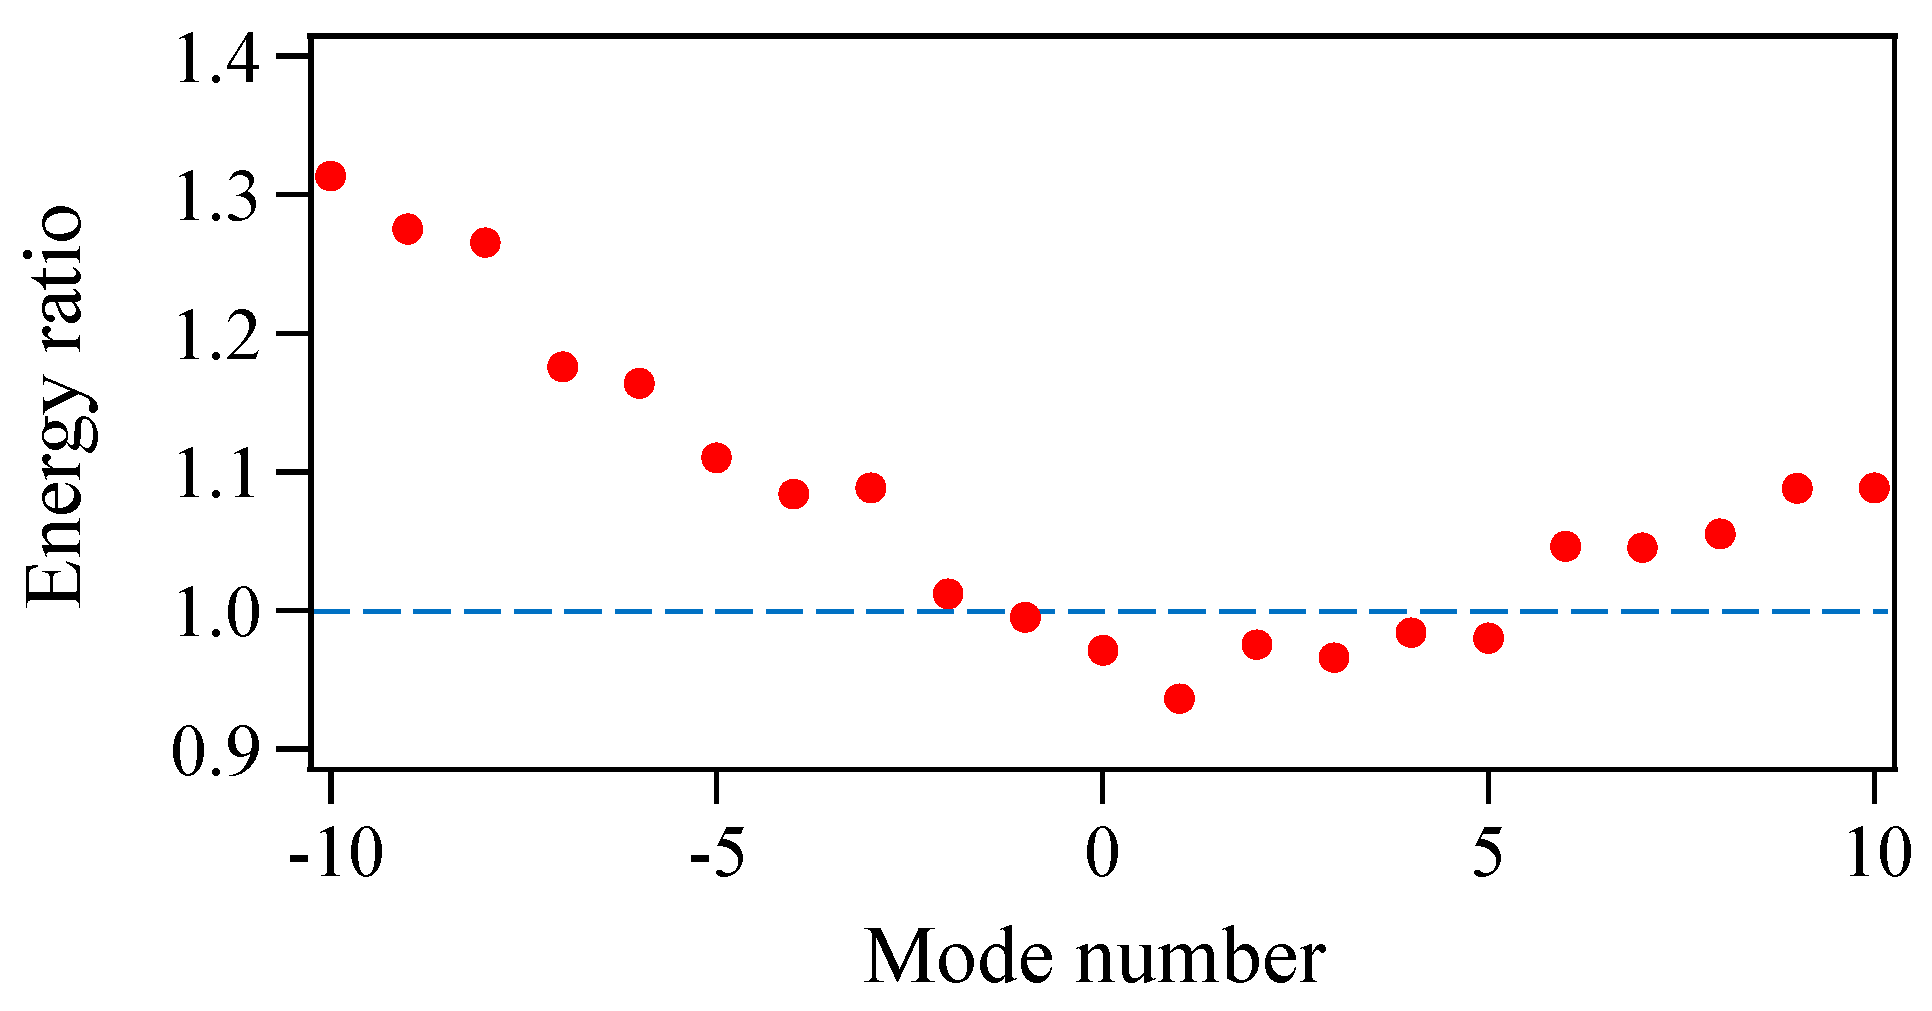
Figure 2b. To examine the effect of Langevin noise in detail, the ratio of the pulse energy at each mode in Figure 6c to that in Figure 2b is plotted in Figure 7. It is found that the ratio is less than 1.0 around the central mode (mode number from −1 to 5) and becomes larger for large values of the absolute mode number. This is because a simultaneous oscillation among multiple modes in the absence of Langevin noise accompanies a relative gain-narrowing compared with the case in the presence of Langevin noise.

4. Verification of Simultaneous Oscillation among Multiple Modes Using THz-TDS

As mentioned, a clear difference between the ideal (Langevin noise excluded) and actual (Langevin noise included) gain-switched multimode semiconductor lasers is whether or not the pulse oscillations at all oscillating modes are simultaneously generated. From the results of Figure 2b and Figure 6c, it is found that there is almost no difference between them when an average detection is carried out and the measurement time is longer than 2000 times the modulation period. However, as described in the Introduction, the situation may be different for the detection of optical beat signals even if the averaged detection process is included. 
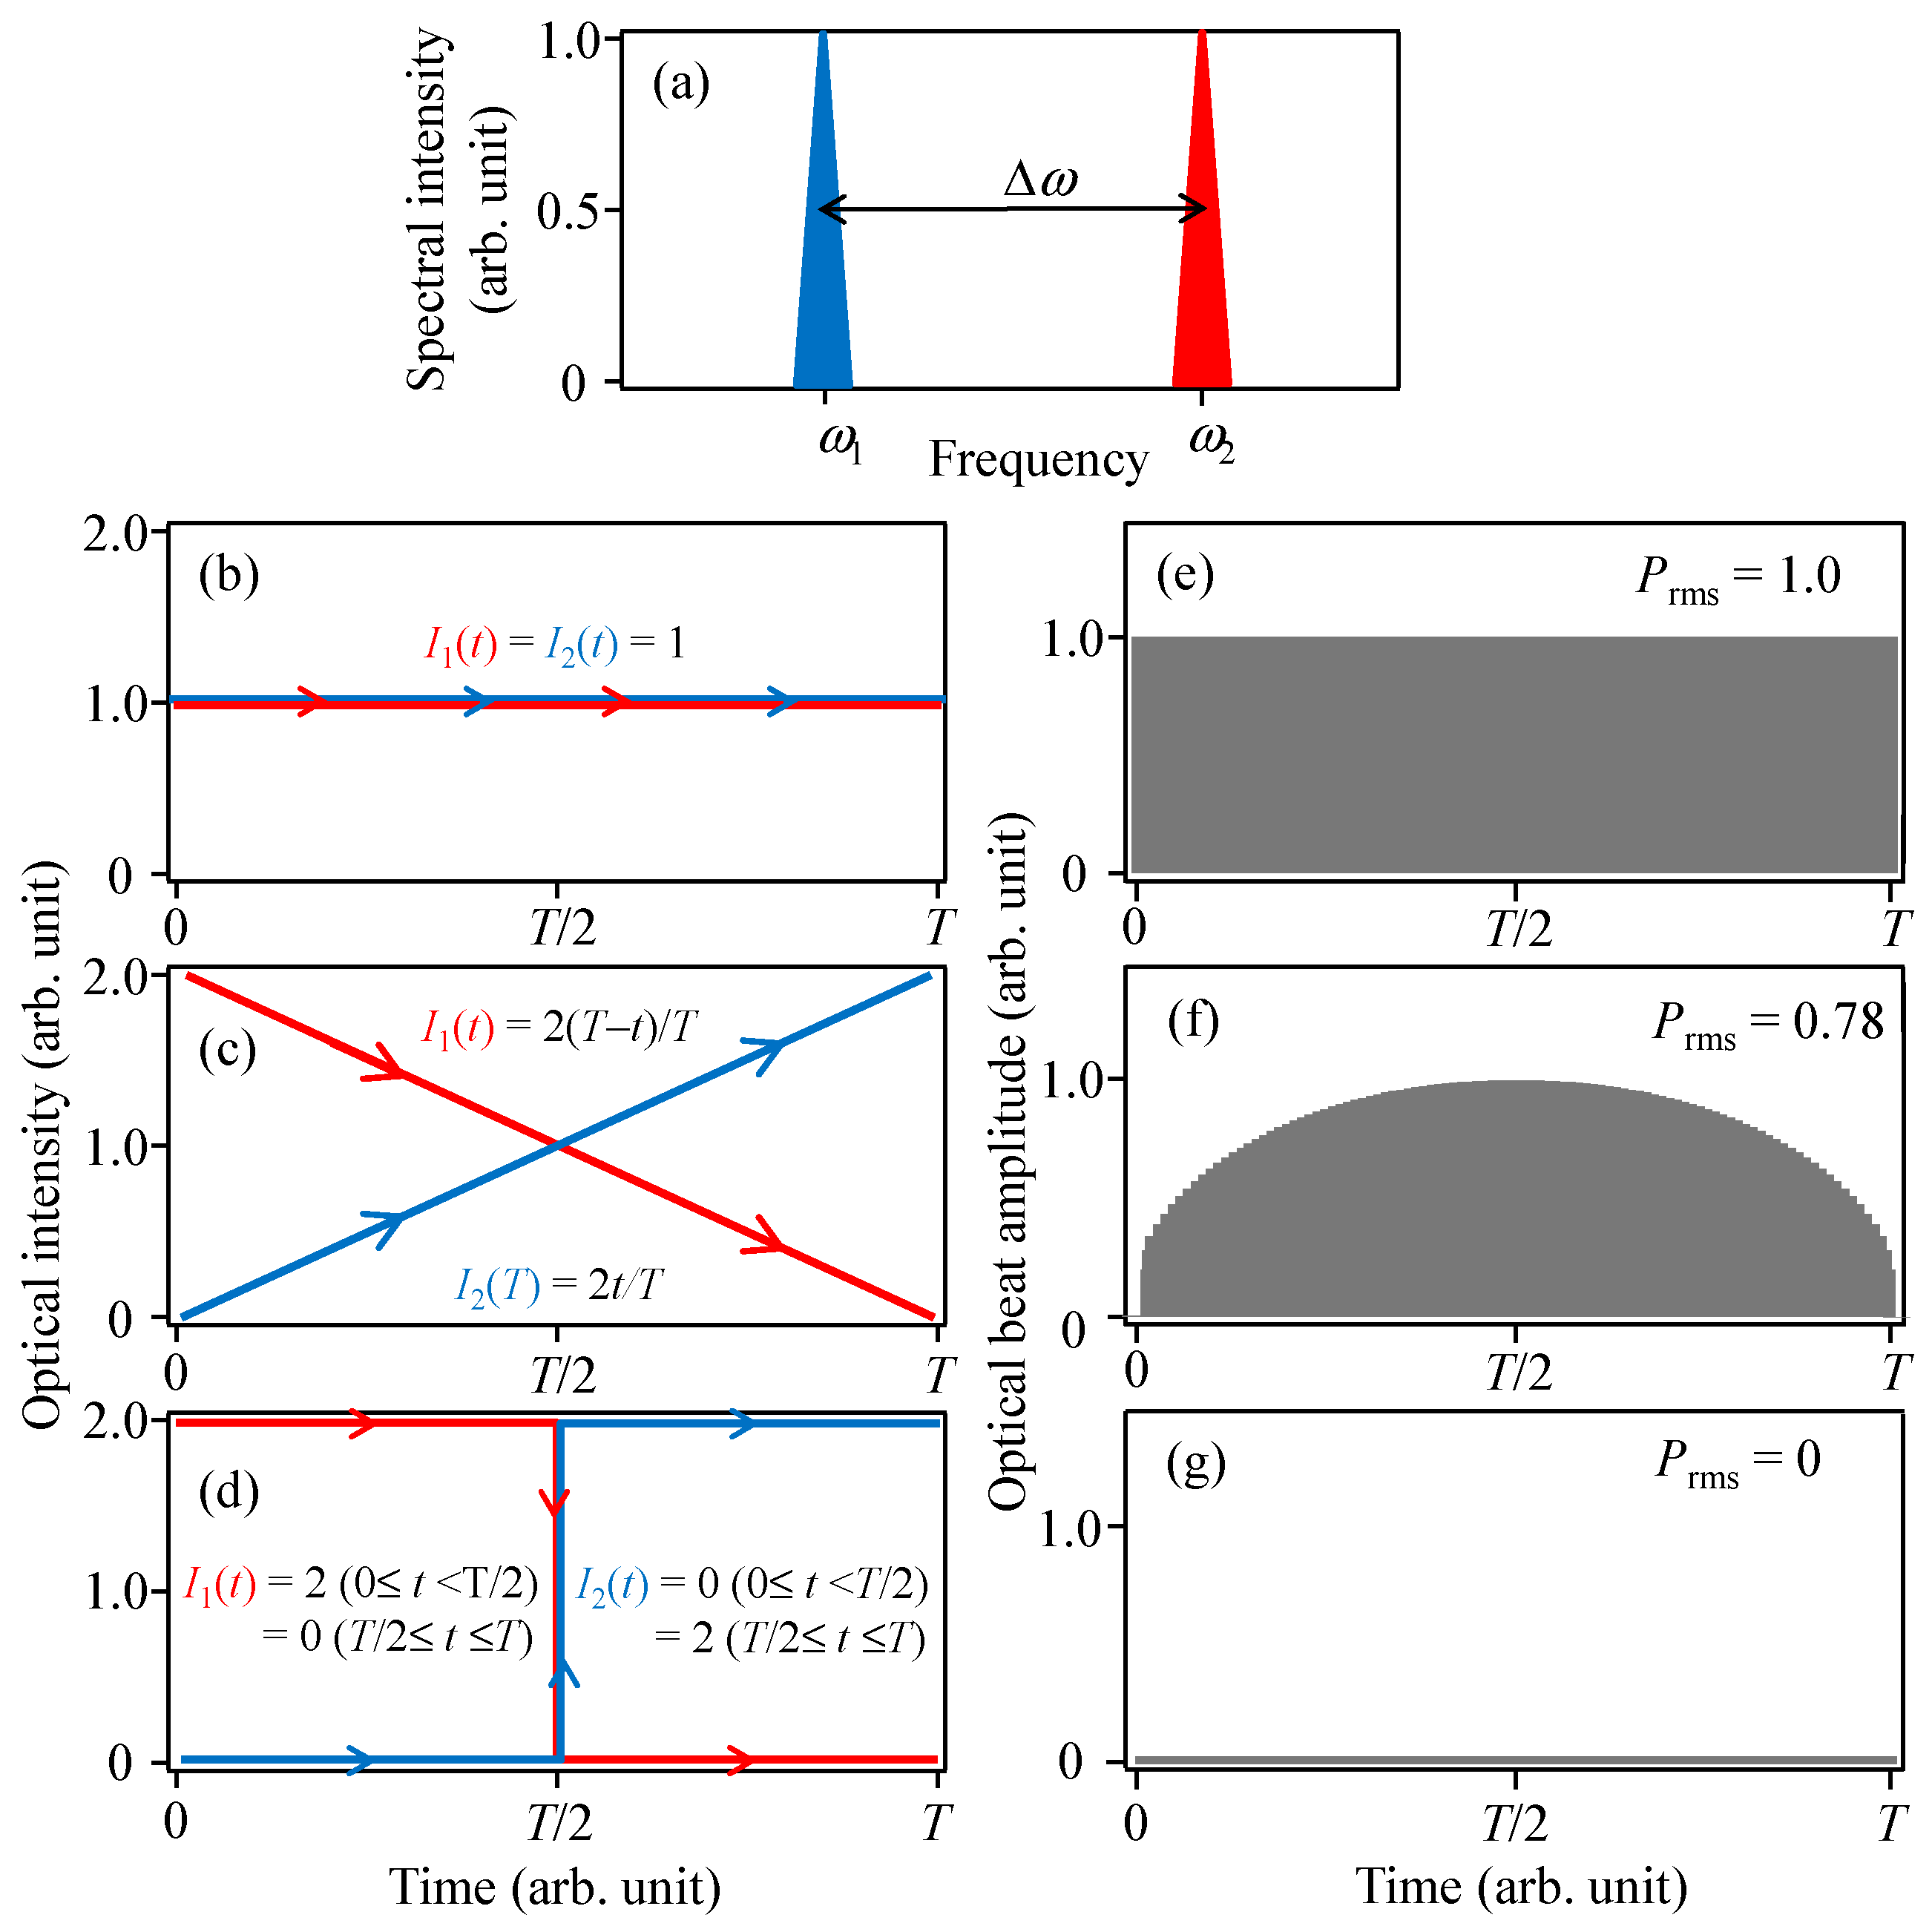
Figure 8 shows examples of optical beat outputs for different input temporal waveforms. Two-mode light having a difference angular frequency of Δω is assumed as input light in Figure 8a. Figure 8e–g shows the temporal variation of the amplitudes of the optical beat signals for three cases: when the two light intensities are both constant with time (fully simultaneous) (Figure 8b), when one is increased and the other is decreased linearly (partly simultaneous) (Figure 8c), and when one is increased and the other is decreased in a staircase pattern (non-simultaneous) (Figure 8d). The figures show that although the power spectra of the temporal waveforms are nearly the same, the power of the corresponding optical beat signal significantly differs depending on the degree of the synchronization of the temporal waveforms. The root-mean-square (rms) power, Prms, of the optical beat signal in Figure 8 is given in the following form:
P r m s = K 1 T 0 T ( I 1 I 2 cos Δ ω t ) 2 d t ,
where I1 and I2 are the intensities of the light components with oscillation angular frequencies ω1 and ω2, respectively, and K is a constant. When I1 and I2 are set to the values shown in Figure 8b–d, and K and T are set to 2 and 2ω (m: integer), Prms is calculated to be 1.0 (Figure 8e), 0.78 (Figure 8f), and 0 (Figure 8g), respectively. The maximum value of Prms (Prms_max) is given in the fully simultaneous condition, and Prms/Prms_max can be used as an index, ranging from 0 to 1, to estimate the degree of the temporal synchronization of the two-mode oscillation, and may also be used for multimode oscillation. The optical beat signal using a gain-switched multimode semiconductor laser is obtained in the THz region. Because a direct observation to measure Prms in the THz-region is difficult, a THz time-domain spectroscopy (THz-TDS) system is employed to detect THz-waves in actual experiments. We therefore examine the degree of temporal synchronization of the pulse oscillations by numerically estimating the THz-TDS outputs for gain-switched pulse inputs, instead of Prms.
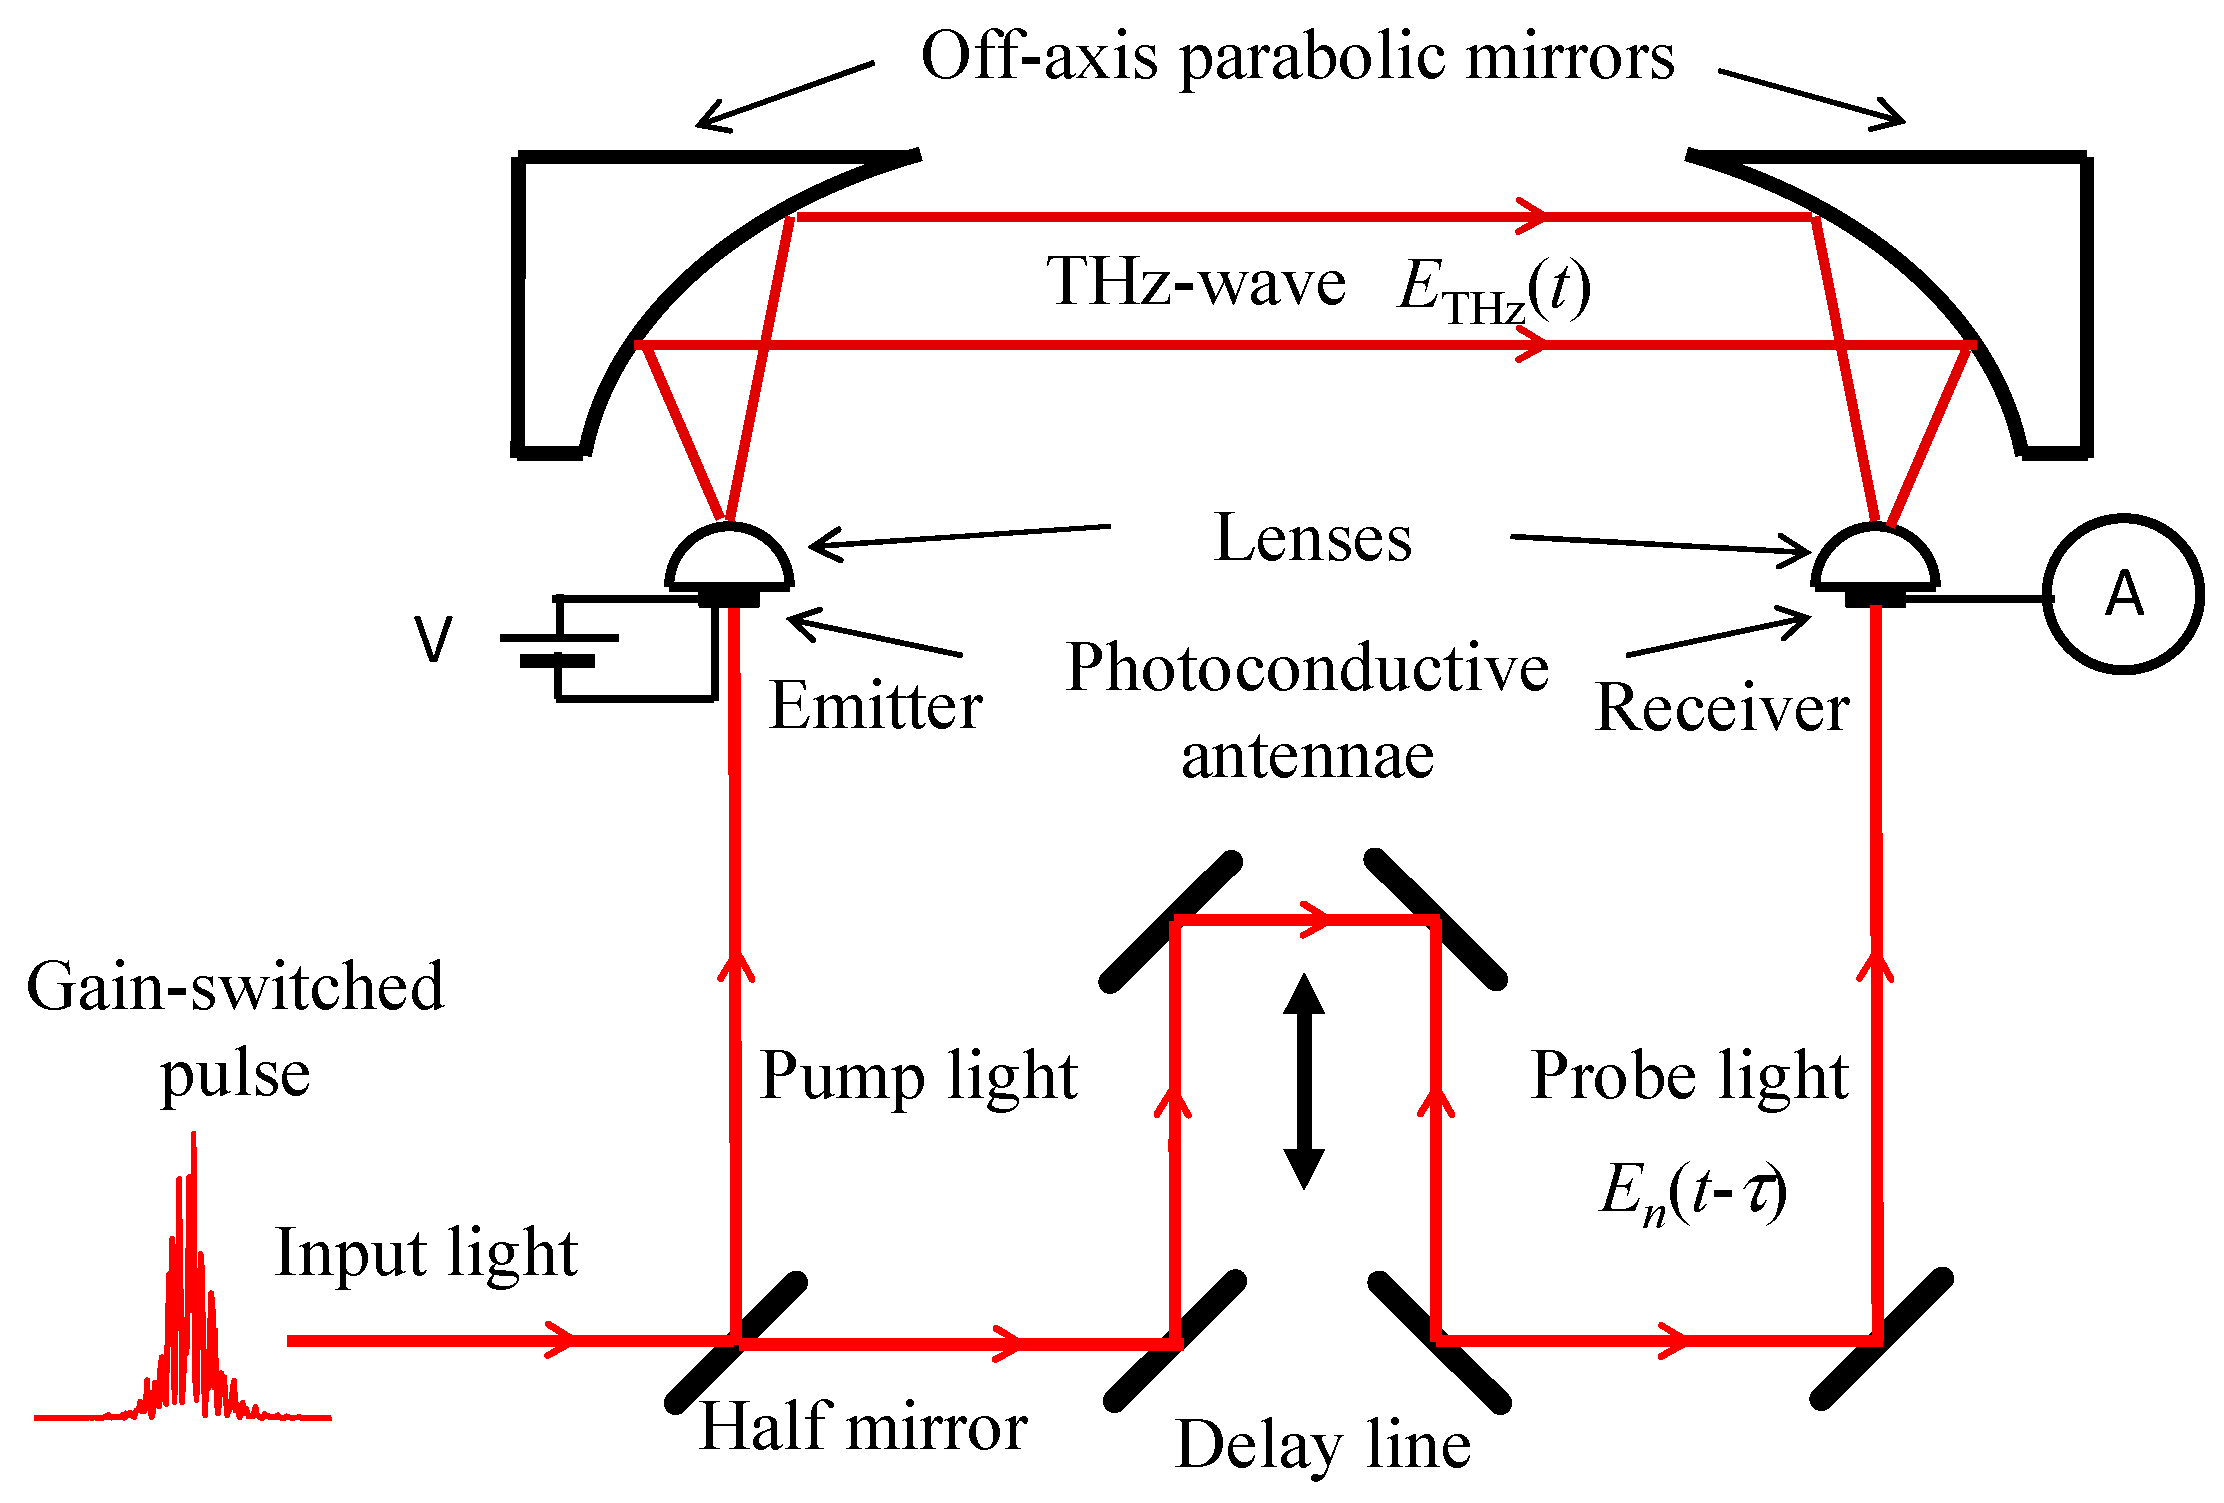
A typical THz-TDS system employed as a numerical model is shown in Figure 9. An input gain-switched pulse from a multimode semiconductor laser is divided equally into pump light and probe light through a half mirror. The pump light is focused on a gap between metallic electrodes of one photoconductive antenna to create photo-carriers, n(t), which is described in the form:
n ( t ) | n = 30 30 E n ( t ) exp ( i ϕ n ) | 2 ,
where φn is an arbitrary phase for the nth-mode. Then, photo-carriers are generated to induce a transient current, J(t), by applying a bias voltage to the gap. As a result, electromagnetic waves are emitted into free space with an amplitude proportional to the time differential of the transient current, dJ(t)/dt. The electromagnetic waves radiated from the system are regarded here as THz-waves by assuming an input light with a bandwidth of a few THz. When the antenna has a wideband characteristic because of the ultrafast relaxation time of the photo-carriers, the THz-wave, ETHz(t), can be represented as
E T H z ( t ) d J ( t ) d t d n ( t ) d t .
The THz-waves are collimated with an off-axis parabolic mirror and can then pass through a sample. Then, using another off-axis parabolic mirror, the transmitted THz-waves are focused onto another photoconductive antenna, of the same kind as the first one, which is also irradiated by the probe light to create photo-carriers, n(t), in the gap. The photo-carriers flow outside the photoconductive antenna as a transient current in proportion to the gap potential determined by the electric field of the irradiated THz-waves. When the delay time τ for the probe light is varied, a cross-correlation trace, Cm(τ), between the waveforms of the THz-wave and the photo-carriers is obtained. Cm(τ) can be represented by
C m ( τ ) = d n ( t ) d t n ( t τ m / f mod ) d t ,
where m is an integer. The delay time τ ranges from −1/2fmod to +1/2fmod. To obtain the THz-TDS output, the cross-correlation trace is Fourier-transformed as
C ˜ 0 ( ω ) = 1 / 2 f mod + 1 / 2 f mod C 0 ( τ ) exp ( i ω τ ) d τ = i ω | n ˜ ( ω ) | 2 .
Here, m is set to 0. In the autocorrelation configuration shown in Figure 9, the THz-TDS output is simply expressed as above, which is proportional to the power spectrum of the photo-carriers [16].
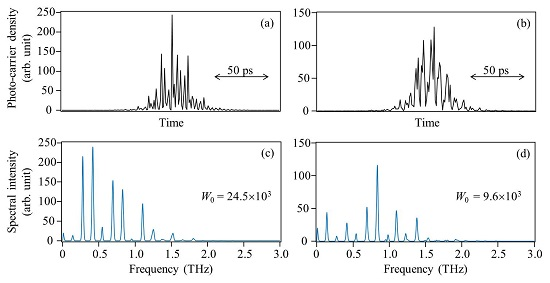
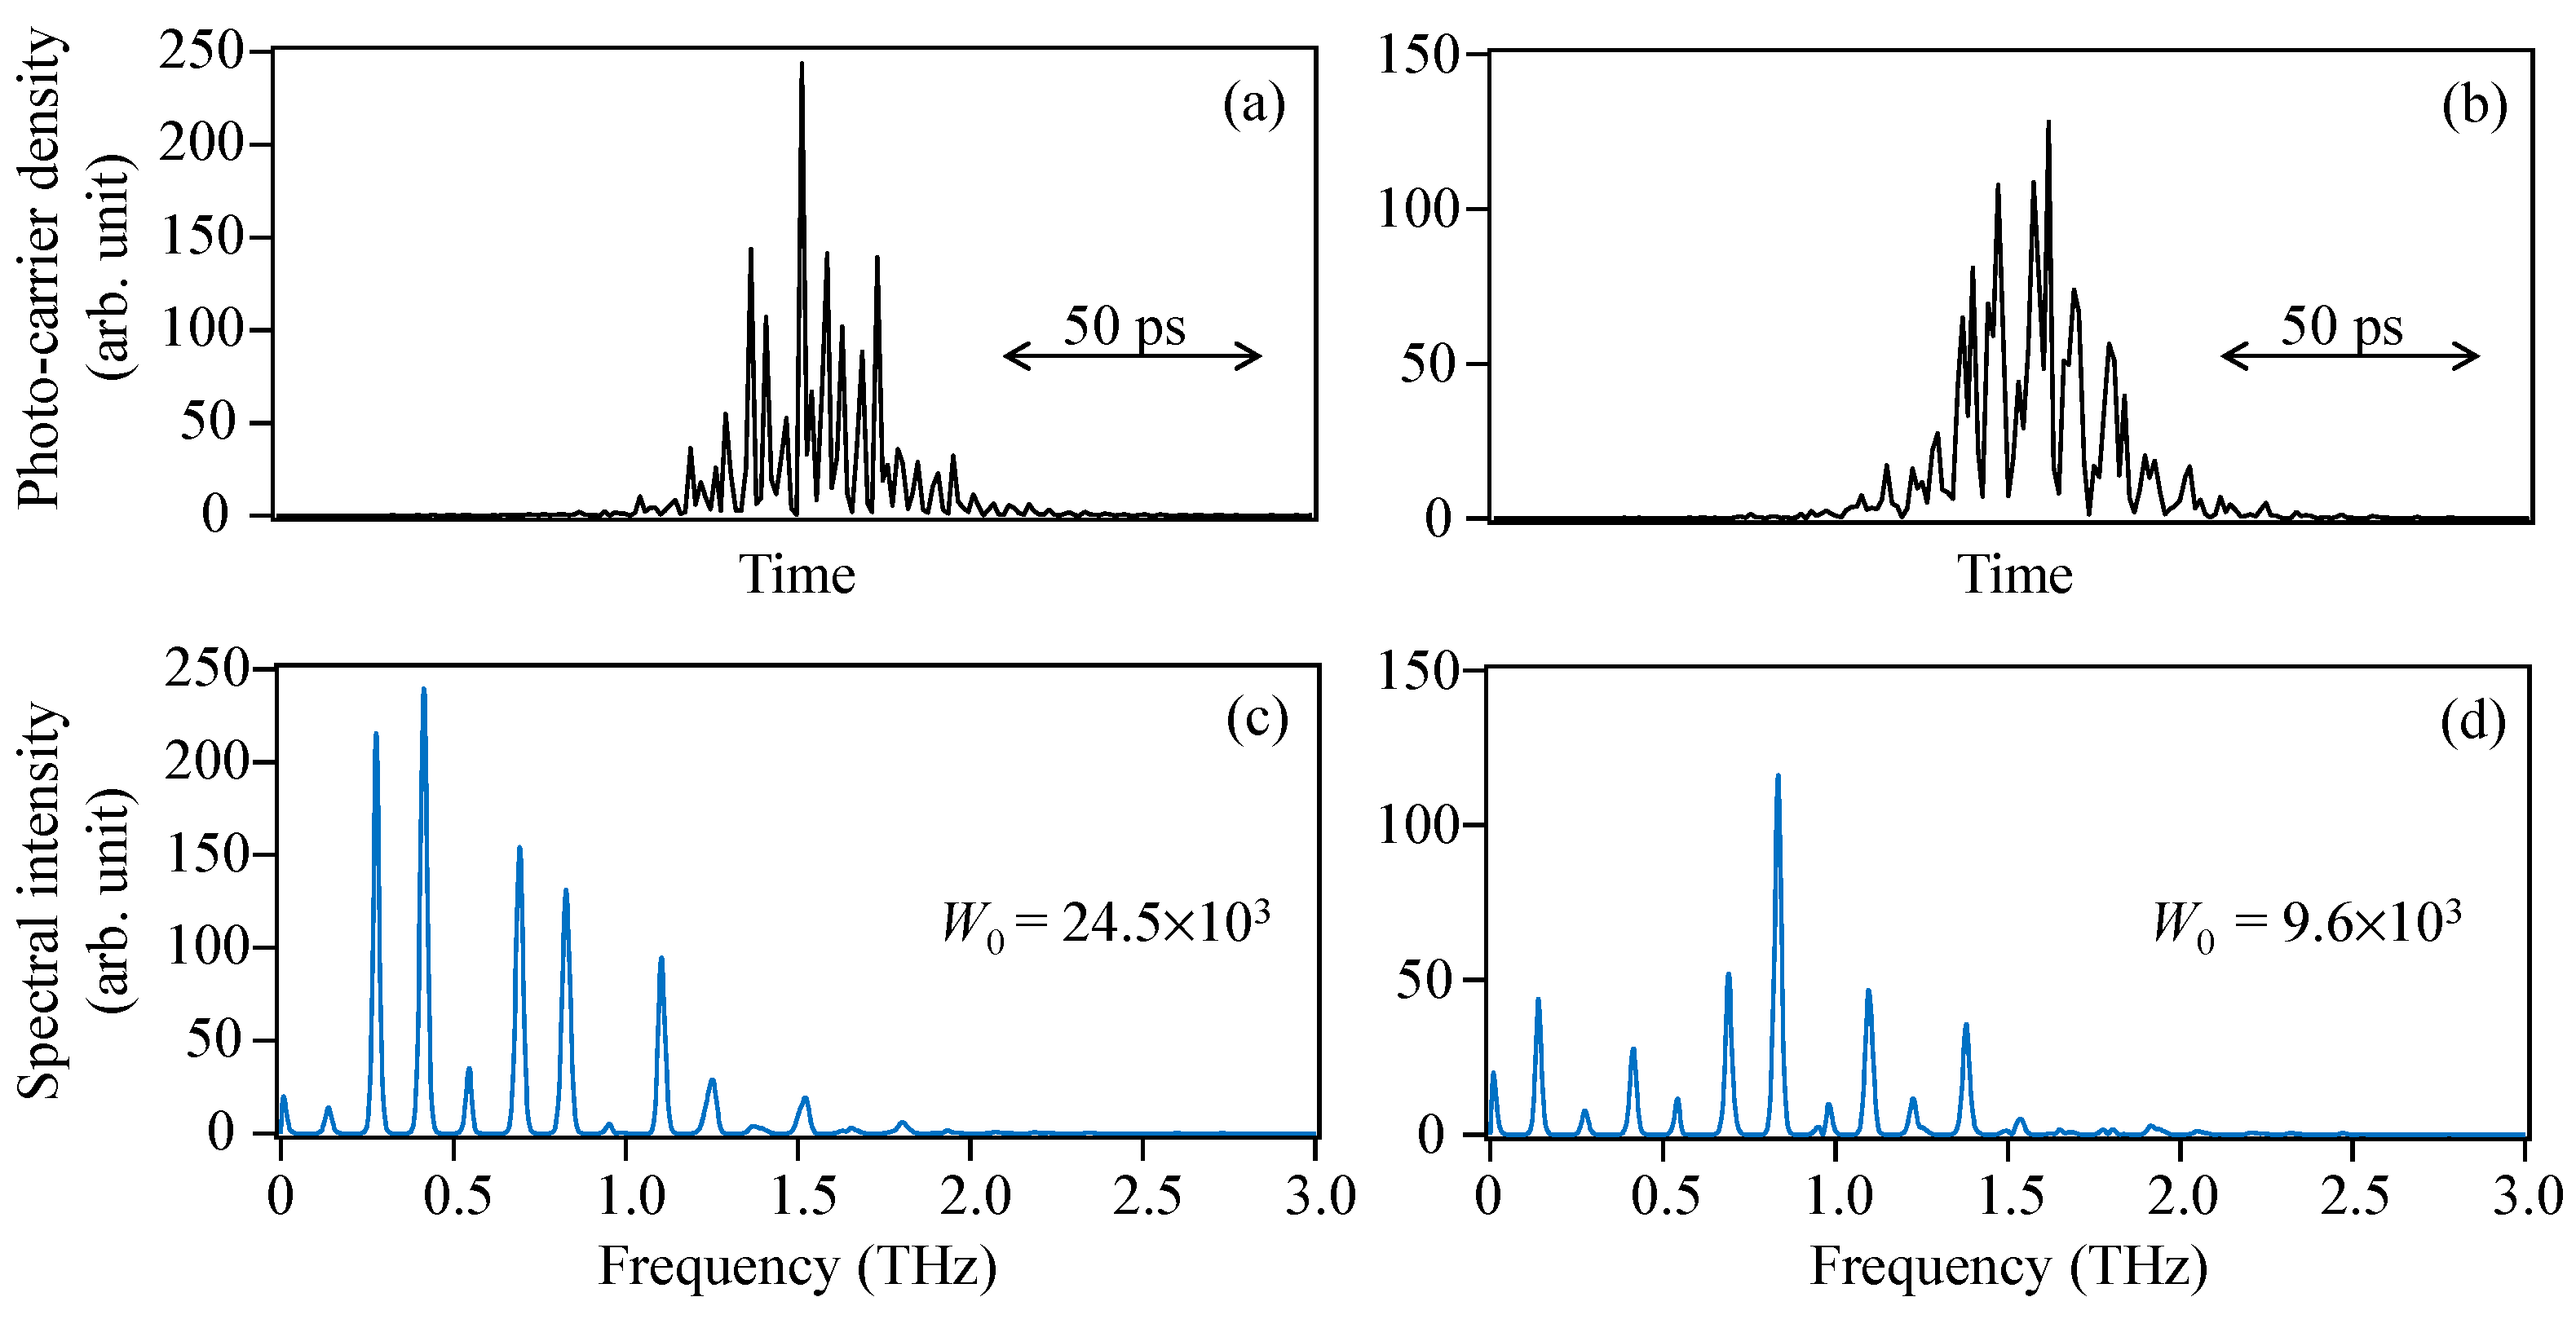
First, the THz-TDS output is calculated when Langevin noise is excluded, that is, fully-simultaneous pulse oscillations from a gain-switched multimode semiconductor laser are generated. Figure 10a,b shows examples of single-shot temporal waveforms of the photo-carriers, n(t), and Figure 10c,d shows the corresponding THz-TDS outputs, | C ˜ 0 ( ω ) | . The different phase conditions change the photo-carrier shape drastically even though the total numbers of photo-carriers is constant. The drastic shape change in the photo-carriers is enhanced by the temporal differentiation, and, consequently, the energy of the THz-TDS output, W0 (= ω | C ˜ 0 ( ω ) | ), varies greatly for every shot, as shown in Figure 10c,d. This is because the Fourier transform of the photo-carriers is not unitary (Parseval’s theorem does not hold for the photo-carriers). 
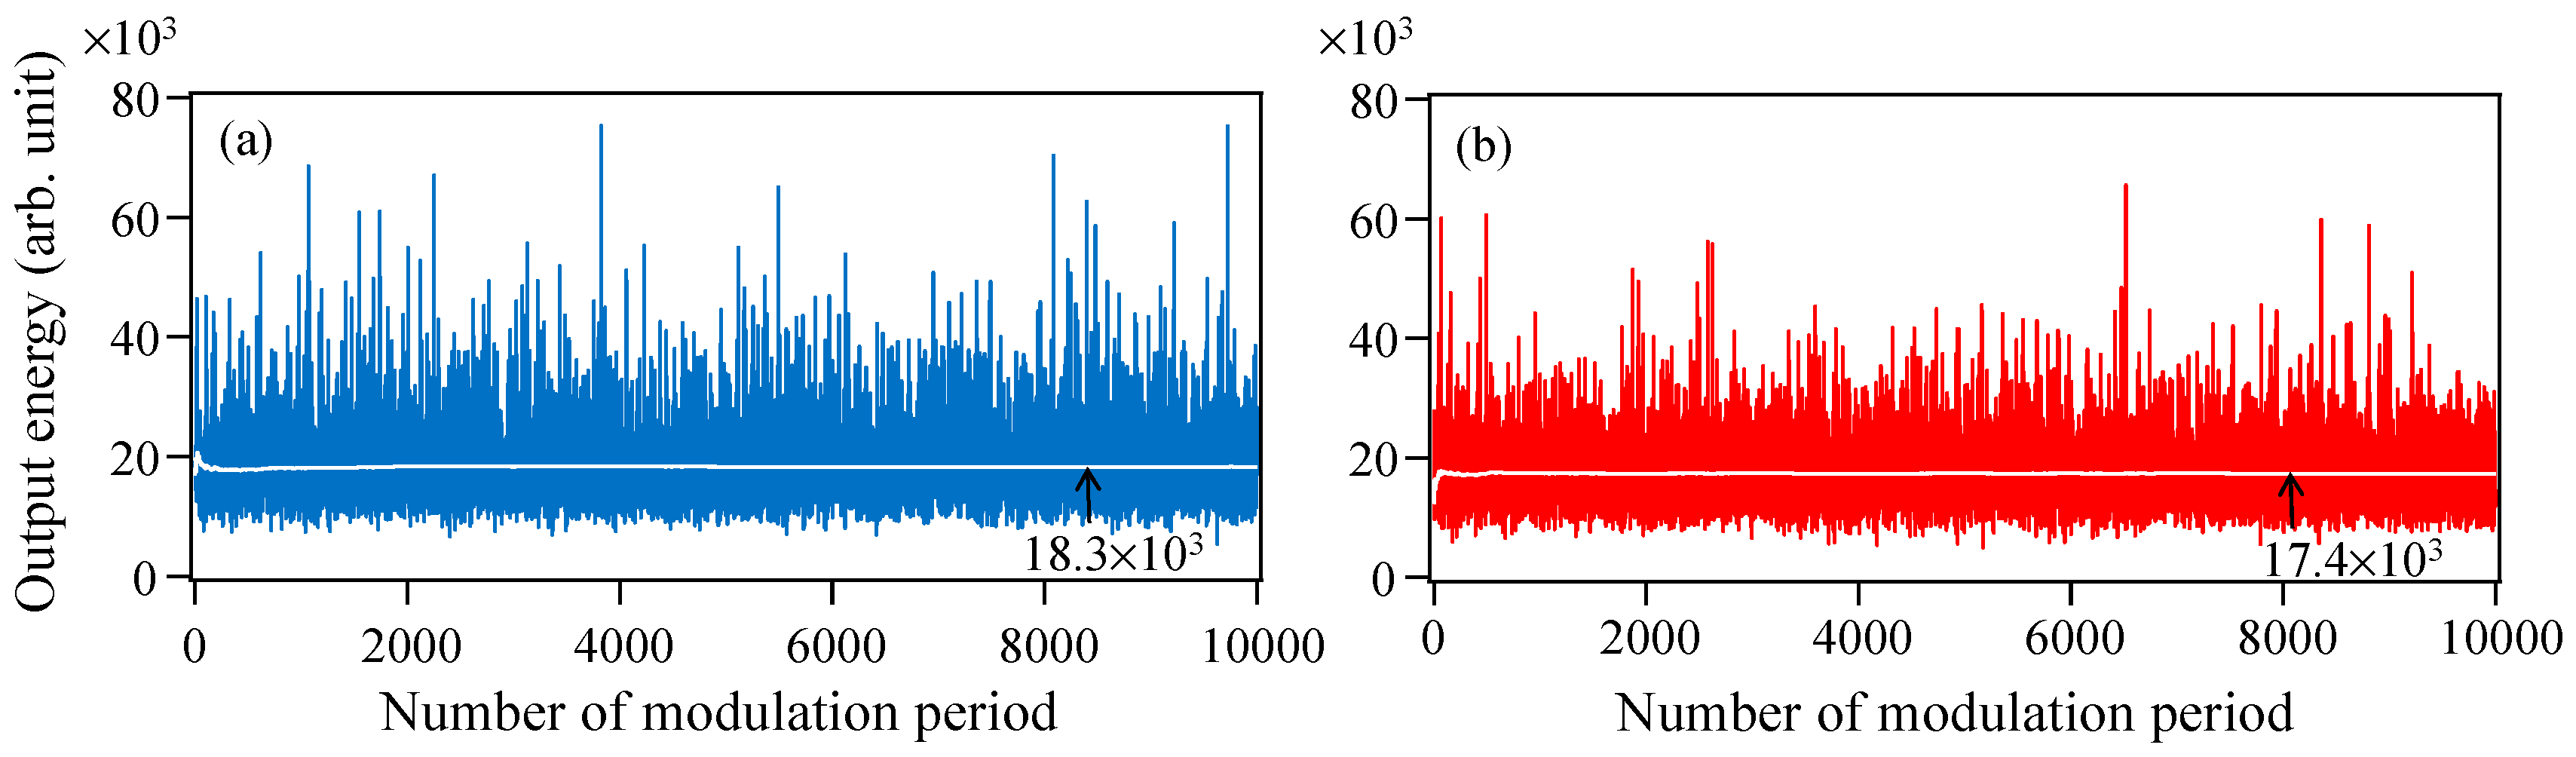
Figure 11a shows the temporal variation of W0 from 0 to 10,000 times the modulation period in the absence of Langevin noise. Although W0 is varied randomly and considerably from 5400 to 75,000 in arbitrary units, the averaged W0 nearly converges on a constant value of 18,331 within 2000 times the modulation period. In contrast, in the presence of Langevin noise, a temporal variation of the THz-TDS output, W0′, is calculated and shown in Figure 11b. The variation in W0′ ranges from 5000 to 65,000 in arbitrary units and is somewhat suppressed compared with the result in Figure 11a. The averaged W0′ also becomes nearly constant to 17,305 within 2000 times the modulation period. Although a high-speed scan (1 ns) of the delay line is needed to observe the single-shot of the THz-TDS output, the scan speed in actual experiments is usually much slower than 2000 times the modulation period (2 μs). Hence, the measured value of the THz-TDS output is proportional to the averaged W0′. The index of W0′/a2W0 corresponding to Prms/Prms_max is estimated to be 95.5% (17,305/(18,331 × 0.9942)} × 100), which is the estimated degree of temporal synchronization of the pulse oscillations from a gain-switched multimode semiconductor laser. The decrease in the photo-carrier density in two photoconductive antennae due to the decrease in the input pulse energy in the presence of Langevin noise seen in Figure 5 is taken into account by the coefficient a2 (a = 0.994) in the denominator.
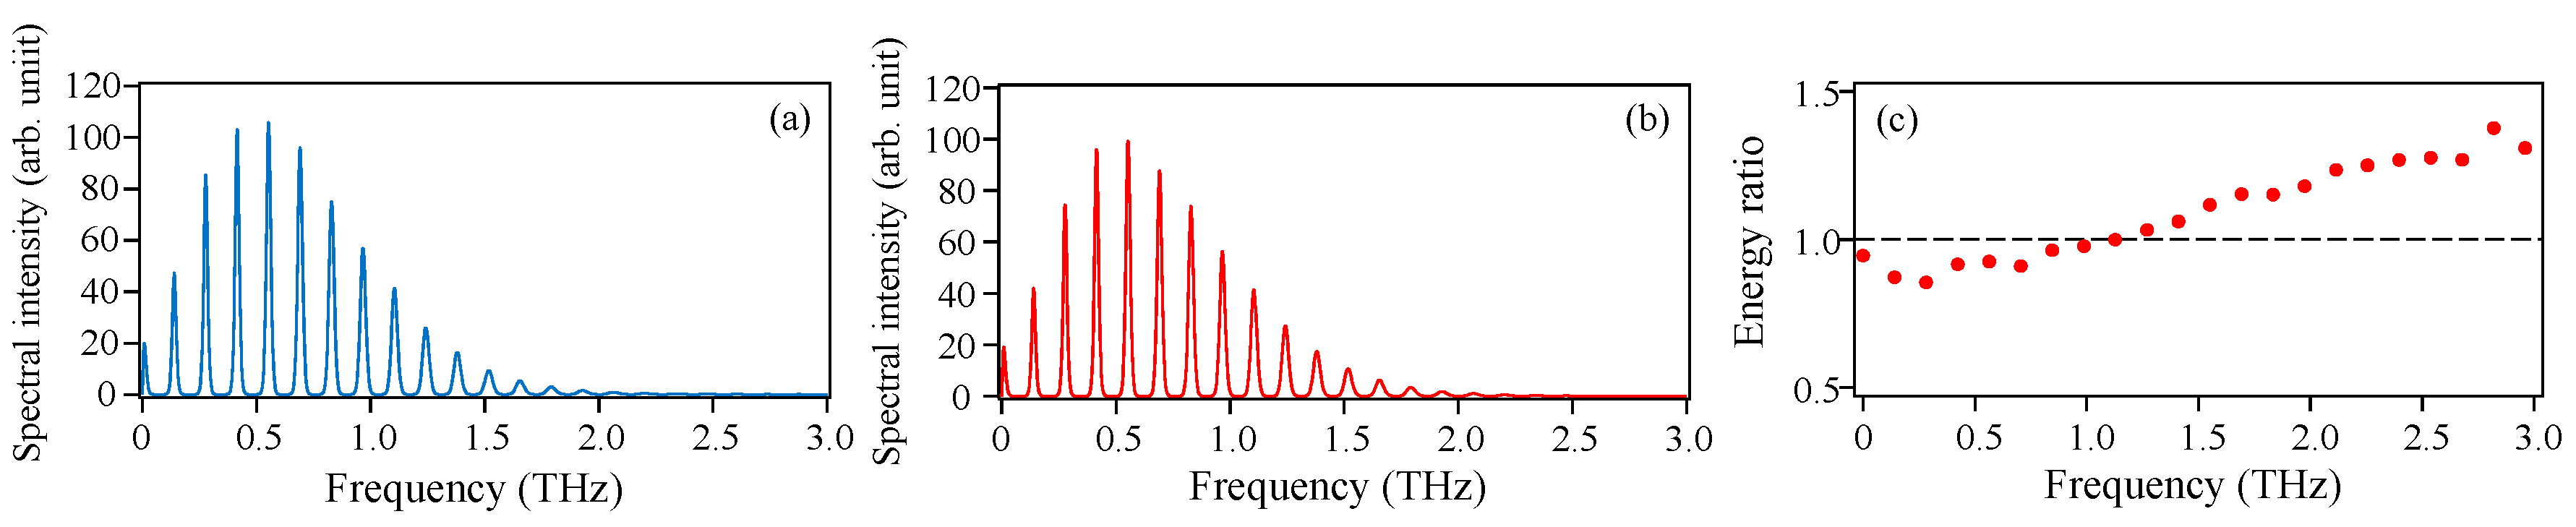
To check this, the spectral traces of the THz-TDS outputs averaged over 2000 single-shot spectra when Langevin noise is excluded and included are depicted in Figure 12a,b respectively. Corresponding to the results in Figure 11a,b, the spectral shapes of the THz-TDS outputs match each other well. To compare them in detail, the ratio of the energy at each line spectrum in Figure 12b to that in Figure 12a is plotted in Figure 12c. The ratio becomes large toward higher frequencies and is above 1.0 at frequencies higher than 1.2 THz, reflecting the result in Figure 7. Thus, Langevin noise contributes marginally to the improvement of the higher frequency properties of the THz-TDS system. As a result, because the decrease in the THz-TDS output caused by Langevin noise is fairly small (4.5%), an actual gain-switched multimode semiconductor laser is considered to also generate optical pulses simultaneously at all oscillating modes, even when the laser is used in the optical beat detection.
Next, we consider the case of m = 2 (cross-correlation configuration in Figure 9 in Equation (10). The complex THz-TDS output C ˜ 2 ( ω ) is then expressed as
C ˜ 2 ( ω ) = 3 / 2 f mod 5 / 2 f mod C 2 ( τ ) exp ( i ω τ ) d τ = i ω n ˜ ( ω ) n ˜ * ( ω ) ,
where n ˜ * ( ω ) is the Fourier transform of n(t − 2/fmod). 
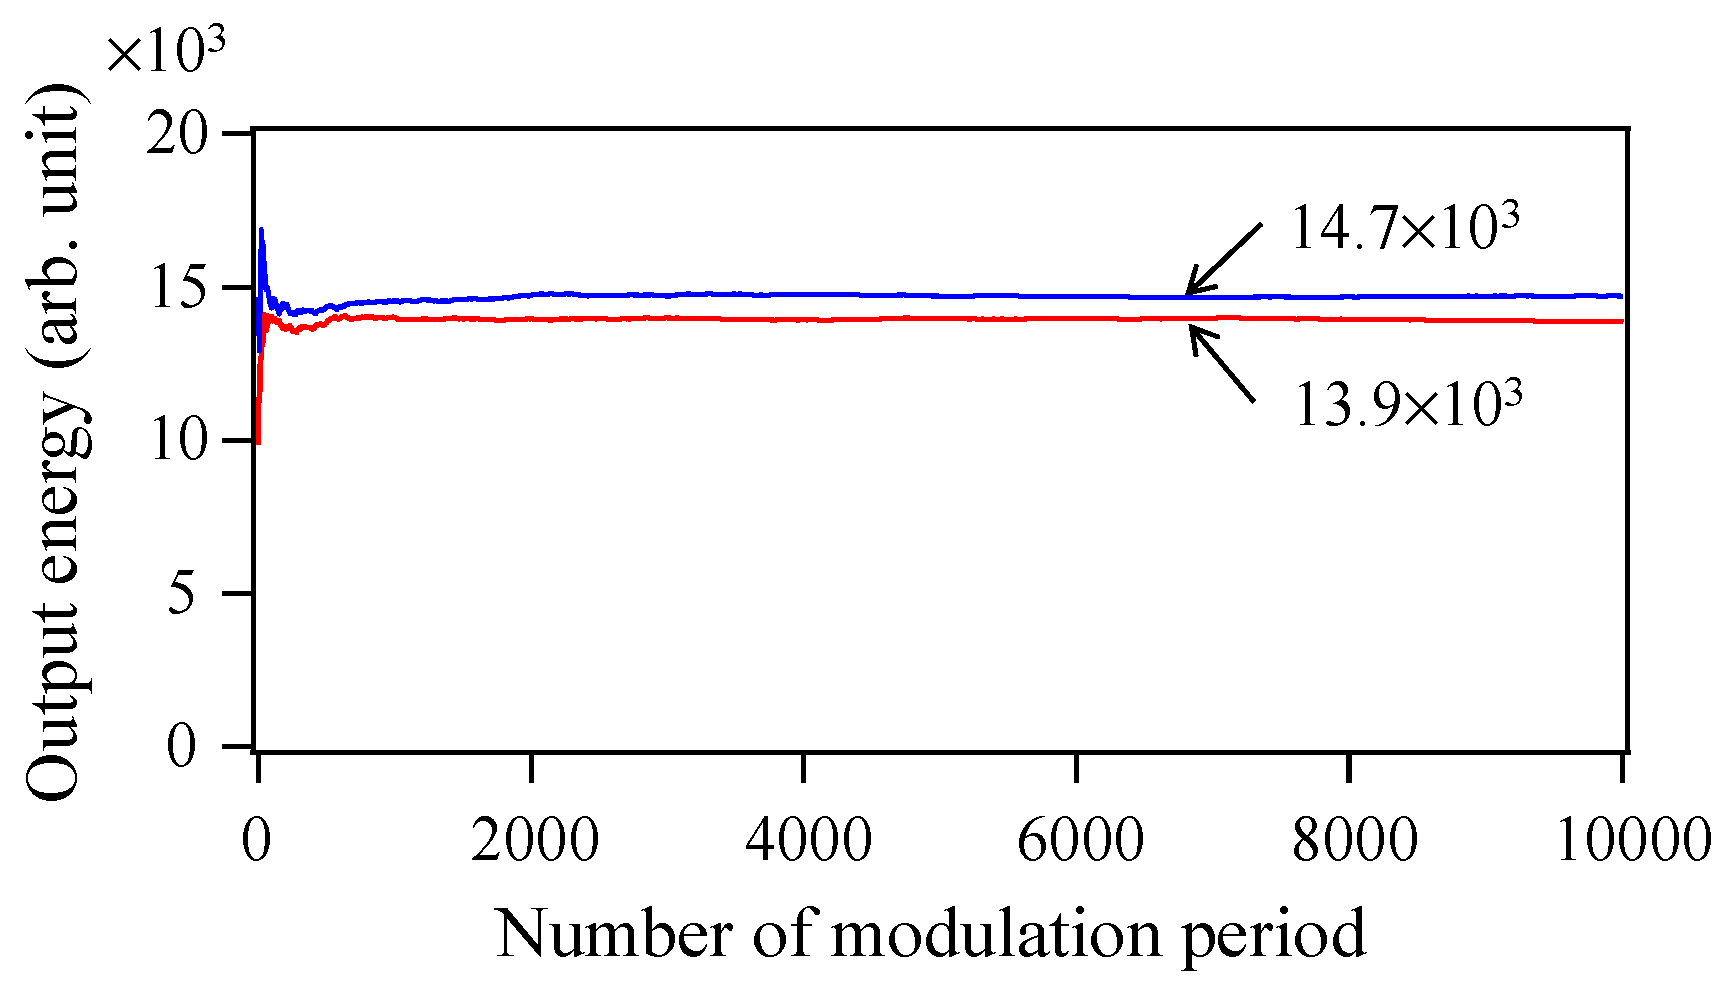
Figure 13 shows temporal variations of the averaged W2′ (= ω | C ˜ 2 ( ω ) | ) from 0 to 10,000 times the modulation period when Langevin noise is excluded (blue line) and included (red line), respectively. They nearly converge on the constant values of 14,718 and 13,883, respectively, within 2000 times the modulation period. In the case of excluded Langevin noise, the THz-TDS output decreases from 18,331 to 14,718 when m is changed from 0 to 2, which indicates a decrease in the coherence degree of the function n ˜ ( ω ) under random phase conditions. The coherence degree decreases to 80.3% [(14,718/18,331) × 100], indicating a decrease in the THz-TDS output of 19.7%. In contrast, when the Langevin noise is included, the decrease in the THz-TDS output is 23.3% ({1 − 13,883/(18,331 × 0.9942)} × 100), which consists of three contributions, coherence degradation, residual timing jitter, and temporal asynchronization. By eliminating the contribution of the residual timing jitter of 3.9% ((1 − 27.0/28.1) × 100) from the total decrease, the sum of the contributions of the coherence degradation and temporal asynchronization is obtained to be 19.4%, which is almost the same as the contribution of the coherence degradation for m = 0. This is reasonable due to the contributions of the coherence degradation and the temporal asynchronization to the decrease in the THz-TDS output balance. For the two cases where the pulse oscillations are fully or partly simultaneous, that is, the oscillating-mode number in a single-shot spectrum is large or small, respectively, the contribution of the coherence degradation is strong and weak, respectively, while the temporal asynchronization contributions are weak and strong, respectively. Thus, the degree of temporal synchronization is masked by the considerable coherence degradation and is found to not be read out from the index of Wm′/a2Wm, except for the case of m = 0.
Figure 14 shows the spectral traces of the THz-TDS outputs averaged over 2000 single-shot spectra when Langevin noise is (a) excluded and (b) included and m in Equation (10) is set to 2. Compared with the result in Figure 12, the spectral shapes of the traces are found to be almost the same, though the spectral intensities are lower. Figure 14c shows the ratio of the energy at each line spectrum in Figure 14, a (blue circles), b (red circles), to that in Figure 12a. Because the blue circles form a flat line, the contribution of the coherence degradation to the THz-TDS output is found to be frequency-independent. Although it may be possible to estimate the degree of pulse synchronization by taking into account the frequency dependences of the three contributions even for the cases of m ≠ 0, the method is impractical because of its complexity. The calculation results carried out for different pumping conditions or another wavelength (1550 nm) of the semiconductor laser were confirmed to show a similar tendency to the above obtained results.

5. Conclusions

Using multimode semiconductor laser rate equations that include Langevin noise, the degree of temporal synchronization of the pulse oscillations from a gain-switched multimode semiconductor laser was examined by numerically simulating the output energy of THz time-domain spectroscopy (THz-TDS). The degree was estimated to be 95.5% from the ratio of the averaged THz-TDS output energy in the partly simultaneous oscillating pulse input case (actual) to that in the fully-simultaneous oscillating pulse input case (ideal) under the autocorrelation configuration of the THz-TDS system. This means that the decrease in the THz-TDS output due to the temporal asynchronization of the input pulse oscillations among multi-modes was only 4.5%. Therefore, a gain-switched multimode semiconductor laser can be regarded to equivalently oscillate optical pulses simultaneously at all oscillating modes, in actual applications, even when the laser is used for optical beat detection. It is expected that the degrees of temporal synchronization of chaotic and random optical oscillations from multimode lasers can be examined in a similar way. To conduct related experimental examinations, calibration of the sensitivity of the photoconductive antennae will be necessary.

Acknowledgments

This research was partly supported by Japan Society for the Promotion of Science (JSPS) KAKENHI Grant Number 16K06389.

Author Contributions

All the authors contributed equally to the numerical studies, data acquisition, analysis, preparation, editing, discussion, review and revision of this manuscript.

Conflicts of Interest

The authors declare no conflict of interest.

References

  1. Nissinen, J.; Kostamovaara, J. A high repetition rate CMOS driver for high-energy sub-ns laser pulse generation in SPAD-based time-of-flight range finding. IEEE Sens. 2016, 16, 1628–1633. [Google Scholar] [CrossRef]
  2. Wada, K.; Matsukura, S.; Tanaka, A.; Matsuyama, T.; Horinaka, H. Precise measurement of single-mode fiber lengths using a gain-switched distributed feedback laser with delayed optical feedback. Opt. Express 2015, 23, 23013–23020. [Google Scholar] [CrossRef] [PubMed]
  3. Wada, K.; Hirata, K.; Yoshida, M.; Kawai, K.; Yoshioka, K.; Matsuyama, T.; Horinaka, H.; Cho, Y. A gain-switched laser diode as a low-coherence light source. Opt. Commun. 2003, 228, 49–54. [Google Scholar] [CrossRef]
  4. Tokunaga, K.; Fang, Y.-C.; Yokoyama, H.; Ozeki, Y. Generation of synchronized picosecond pulses by a 1.06-μm gain-switched laser diode for stimulated Raman scattering microscopy. Opt. Express 2016, 24, 9617–9628. [Google Scholar] [CrossRef] [PubMed]
  5. Kawakami, R.; Sawada, K.; Kusama, Y.; Fang, Y.-C.; Kanazawa, S.; Kozawa, Y.; Sato, S.; Yokoyama, H.; Nemoto, T. In vivo two-photon imaging of mouse hippocampal neurons in dentate gyrus using a light source based on a high-peak power gain-switched laser diode. Biomed. Opt. Express 2015, 6, 891–901. [Google Scholar] [CrossRef] [PubMed]
  6. Yuan, Z.L.; Lucamarini, M.; Dynes, J.F.; Fröhlich, B.; Ward, M.B.; Shields, A.J. Interference of short optical pulses from independent gain-switched laser diodes for quantum secure communications. Phys. Rev. Appl. 2014, 2, 064006. [Google Scholar] [CrossRef]
  7. Zhou, R.; Latkowski, S.; O’Carroll, J.; Phelan, R.; Barry, L.P.; Anandarajah, P. 40nm wavelength tunable gain-switched optical comb source. Opt. Express 2011, 19, B415–B420. [Google Scholar] [CrossRef] [PubMed]
  8. D’Ottavi, A.; Mecozzi, A.; Spano, P.; Piazzolla, S. Time jitter in multimode Fabry–Perot laser diodes. Appl. Phys. Lett. 1998, 53, 2362–2364. [Google Scholar] [CrossRef]
  9. Sano, E.; Shinagawa, M.; Takahashi, R. Theoretical analysis of timing jitter in gain-switched semiconductor lasers. Appl. Phys. Lett. 1989, 55, 522–524. [Google Scholar] [CrossRef]
  10. Weber, A.G.; Ronghan, W.; Böttcher, E.H.; Shell, M.; Bimberg, D. Measurement and simulation of the turn-on delay time jitter in gain-switched semiconductor lasers. IEEE J. Quantum Electron. 1992, 28, 441–446. [Google Scholar] [CrossRef]
  11. Schell, M.; Huhse, D.; Utz, W.; Kässner, J.; Bimberg, D.; Tarasov, I.S. Jitter and dynamics of self-seeded Fabry–Perot laser diodes. IEEE J. Quantum Electron. 1995, 1, 528–534. [Google Scholar] [CrossRef]
  12. Barry, L.P.; Thomsen, B.C.; Dudley, J.M.; Harvey, J.D. Characterization of 1.55-μm Pulses from a self-seeded gain-switched Fabry-Perot laser diode using frequency-resolved optical gating. IEEE Photonics Technol. Lett. 1998, 10, 935–937. [Google Scholar] [CrossRef] [Green Version]
  13. Daza, M.R.H.; Saloma, C.A. Jitter dynamics of a gain-switched semiconductor laser under self-feedback and external optical injection. IEEE J. Quantum Electron. 2001, 37, 254–264. [Google Scholar] [CrossRef]
  14. Liu, Y.S.; Zhang, J.-G. Design of low timing-jitter, stable picosecond optical-pulse source by using an uncooled gain-switched Fabry-Perot semiconductor laser with external continuous-wave light injection. Microw. Opt. Technol. Lett. 2011, 53, 2100–2105. [Google Scholar] [CrossRef]
  15. Wada, K.; Kitagawa, N.; Matsukura, S.; Matsuyama, T.; Horinaka, H. Timing and amplitude jitter in a gain-switched multimode semiconductor laser. Jpn. J. Appl. Phys. 2016, 55, 042702. [Google Scholar] [CrossRef]
  16. Morikawa, O.; Tonouchi, M.; Hangyo, M. A cross-correlation spectroscopy in subterahertz region using an incoherent light source. Appl. Phys. Lett. 2000, 76, 1519–1521. [Google Scholar] [CrossRef]
  17. Scheller, M.; Koch, M. Terahertz quasi time domain spectroscopy. Opt. Express 2009, 20, 17723–17733. [Google Scholar] [CrossRef] [PubMed]
  18. Takanaka, T.; Nishikawa, H.; Sameda, Y.; Yamamoto, K. Development of the terahertz inspection technology using multimode laser diode. IEEJ Trans. Fund. Mater. 2013, 133, 430–435. [Google Scholar] [CrossRef]
  19. Kuwashima, F.; Shirao, T.; Kishibata, T.; Akamine, Y.; Iwao, N.; Ooi, M.; Sakaue, N.; Sirasaki, T.; Gouda, S.; Tani, M.; et al. High efficient MLD-THz-TDS systems using laser chaos and super focusing with metal V-grooved waveguide. In Proceedings of the 41st International Conference on Infrared, Millimeter and Terahertz Waves (IRMMW-THz), Copenhagen, Denmark, 25–30 September 2016. [Google Scholar]
  20. Kallimani, K.I.; O’ Mahony, M.J. Relative intensity noise for laser diodes with arbitrary amounts of optical feedback. IEEE J. Quantum Electron. 1998, 34, 1438–1446. [Google Scholar] [CrossRef]
  21. Ohtsubo, J. Semiconductor Lasers and Theory. In Semiconductor Lasers—Stability, Instability and Chaos, 3rd ed.; Springer: Heidelberg, Germany, 2013; Chapter 3; pp. 13–27. ISBN 978-3-642-30146-9. [Google Scholar]
  22. Wada, K.; Matsuyama, T.; Horinaka, H. Simple gain form of 1.5 µm multimode laser diode incorporating band filling and intrinsic gain saturation effects. Jpn. J. Appl. Phys. 2015, 54, 032101. [Google Scholar] [CrossRef]
  23. Wada, K.; Yoshioka, H.; Zhu, J-X.; Matsuyama, T.; Horinaka, H. Simple form of multimode laser diode rate equations incorporating the band filling effect. Opt. Express 2011, 19, 3019–3036. [Google Scholar] [CrossRef] [PubMed]
Figure 1. Gain spectra of an 800-nm semiconductor laser calculated using Equations (3) and (6) when the carrier density is varied from 1.25 × 1024 m−3 to 2.00 × 1024 m−3 in 0.05 × 1024 m−3 steps.
Materials 10 00950 g001
Figure 2. Simulated (a) temporal waveform averaged over 1000 single-shot pulses and (b) the corresponding power spectrum of the gain-switched pulse when the Langevin noise terms in Equations (1) and (2) are omitted (ξSn = ξNn = 0).
Materials 10 00950 g002
Figure 3. Examples of power spectra of the single-shot gain-switched pulses with Langevin noise included. Langevin noise amplitudes are different for the respective cases of (ac).
Materials 10 00950 g003
Figure 4. (a) Superimposed temporal waveform of 2000 pulses and (b) the corresponding averaged waveform with Langevin noise included.
Materials 10 00950 g004
Figure 5. Temporal variation in the pulse energy from 0 to 10,000 times the modulation period with Langevin noise included. The pulse energy is normalized to that in the absence of Langevin noise. The averaged pulse energy is indicated by a white line.
Materials 10 00950 g005
Figure 6. Examples of averaged spectra when (a) 5; (b) 100; (c) 2000 different single-shot spectra are summed, with Langevin noise included.
Materials 10 00950 g006
Figure 7. Ratio of pulse energy at each mode in Figure 6c to that in Figure 2b.
Materials 10 00950 g007
Figure 8. (a) Two-mode light spectrum; (bd) examples of different input temporal waveforms and (eg) corresponding optical beat outputs.
Materials 10 00950 g008
Figure 9. Schematic diagram of THz-TDS (time-domain spectroscopy) system.
Materials 10 00950 g009
Figure 10. Examples of (a); (b) single-shot temporal waveforms of the photo-carriers n(t) and (c); (d) the corresponding THz-TDS outputs.
Materials 10 00950 g010
Figure 11. Temporal variations in the THz-TDS outputs from 0 to 10,000 times the modulation period when Langevin noise is (a) excluded and (b) included. The averaged THz-TDS outputs are indicated by white lines.
Materials 10 00950 g011
Figure 12. Spectral traces of the THz-TDS outputs averaged over 2000 single-shot spectra, when Langevin noise is (a) excluded and (b) included; (c) ratio of the energy at each line spectrum in (b) to that in (a).
Materials 10 00950 g012
Figure 13. Temporal variations of the averaged THz-TDS outputs from 0 to 10,000 times the modulation period when Langevin noise is excluded (blue line) and included (red line).
Materials 10 00950 g013
Figure 14. Spectral traces of the THz-TDS outputs averaged over 2000 single-shot spectra, when Langevin noise is (a) excluded and (b) included and m in Equation (10) is set to 2; (c) ratio of the energy at each line spectrum in (a) (blue circles) and (b) (red circles) to that in Figure 12a.
Materials 10 00950 g014
Table 1. Coefficients of parameters in Equation (6).
jaj (m3/s)bj (m−3)cj (m3)
01.83 × 10−121.33 × 10244.92 × 10−25
14.18 × 10−149.53 × 10²¹−1.51 × 10⁻²⁷
2−8.04 × 10−162.35 × 10¹⁹−4.03 × 10⁻²⁹
33.02 × 10⁻¹⁷−1.97 × 10181.56 × 10−31
41.60 × 10−181.76 × 10176.59 × 10−33
5−2.11 × 10−191.59 × 10161.69 × 10−34
6−1.15 × 10⁻²⁰−1.33 × 10¹⁵−2.88 × 10⁻³⁵
71.46 × 10⁻²¹−6.99 × 10¹³−7.03 × 10−37
89.22 × 10−245.40 × 10121.11 × 10−37
9−3.71 × 10−241.12 × 10¹¹−4.95 × 10−41
103.94 × 10⁻²⁶−9.49 × 10⁹−1.56 × 10−40
113.82 × 10⁻²⁷−7.78 × 1079.96 × 10−43
12−6.95 × 10−297.60 × 1069.67 × 10−44
13−1.40 × 10−3019,461−5.57 × 10−46
143.13 × 10⁻³²−2301−2.22 × 10−47
Table 2. Notation and values for parameters [22,23].
NotationParameterValueUnit
τpPhoton lifetime2.0ps
C1Nonradiative recombination rate2.0 × 108s−1
C2Radiative recombination coefficient2.0 × 10−16m3 s−1
C3Auger recombination coefficient0m6 s−1
αLinewidth enhancement factor5.0
βSpontaneous emission factor1.0 × 10−5
εSGain compression factor0.05 × 10−23m3
δω/2πLongitudinal mode spacing0.141THz
ΔτcCoherence time for amplified spontaneous emission7.8ps
eElementary electric charge1.60 × 10−19C
LLaser cavity length300μm
VLaser cavity volume180μm3
nrRefractive index of active layer3.6
ε0Dielectric constant for vacuum8.85 × 10−12F/m
h (=2πћ)Planck’s constant6.63 × 10−34Js
ωn/2πCentral frequency of nth mode375 + 0.141nTHz
Idcdc-bias current0.95 × Ith0
ImwAmplitude of modulated current1.90 × Ith0
Ith0Threshold current for central mode24mA
fmodModulation frequency1.0GHz

