Article

Solid-State Method Synthesis of SnO2-Decorated g-C3N4 Nanocomposites with Enhanced Gas-Sensing Property to Ethanol

1
Henan Key Laboratory of Coal Green Conversion, School of Chemistry and Chemical Engineering, Henan Polytechnic University, Jiaozuo 454000, China
2
State Key Laboratory Cultivation Base for Gas Geology and Gas Control (Henan Polytechnic University), Jiaozuo 454000, China
*
Authors to whom correspondence should be addressed.
Materials 2017, 10(6), 604; https://doi.org/10.3390/ma10060604
Submission received: 27 April 2017 / Revised: 19 May 2017 / Accepted: 26 May 2017 / Published: 31 May 2017
(This article belongs to the Special Issue Ultrathin Two-dimensional (2D) Nanomaterials)

Abstract

:
SnO2/graphitic carbon nitride (g-C3N4) composites were synthesized via a facile solid-state method by using SnCl4·5H2O and urea as the precursor. The structure and morphology of the as-synthesized composites were characterized by the techniques of X-ray diffraction (XRD), field-emission scanning electron microscopy (FESEM), transmission electron microscopy (TEM), energy dispersive spectrometer (EDS), thermogravimetry-differential thermal analysis (TG-DTA), X-ray photoelectron spectroscopy (XPS), and N2 sorption. The results indicated that the composites possessed a two-dimensional (2-D) structure, and the SnO2 nanoparticles were highly dispersed on the surface of the g-C3N4 nanosheets. The gas-sensing performance of the samples to ethanol was tested, and the SnO2/g-C3N4 nanocomposite-based sensor exhibited admirable properties. The response value (Ra/Rg) of the SnO2/g-C3N4 nanocomposite with 10 wt % 2-D g-C3N4 content-based sensor to 500 ppm of ethanol was 550 at 300 °C. However, the response value of pure SnO2 was only 320. The high surface area of SnO2/g-C3N4-10 (140 m2·g−1) and the interaction between 2-D g-C3N4 and SnO2 could strongly affect the gas-sensing property.

1. Introduction

With the development of social industrialization, the leakage and pollution of poisonous gas occur frequently in people’s daily life. It brings a serious threat to human health [1,2,3,4,5]. Hence, the development and research of gas sensors have become urgent work [6]. In the past several years, various metal oxide semiconductors (MOS) materials, such as SnO2 [7], ZnO [8], CuO [9], α-Fe2O3 [10], Co3O4 [11], MnO2 [12], WO3 [13], In2O3 [14], and NiO [15], were used to prepare gas sensors, which possess the outstanding advantages of low cost, controllable size, high-response value, and fast response and recovery time. For example, Yogendra Kumar Mishra et al. successfully prepared a novel ZnO tetrapod network structure, and the fabricated device structures exhibited excellent sensing behaviors toward H2 at 400 °C [16]. Hybrid 3-D networks of ZnO-T with Zn2SnO4 were synthesized using the FTS approach, and the ZnO-T with Zn2SnO4-based sensor showed the highest response value (S = 29.3) toward CO gas at 275 °C [17]. Aerographite/nanocrystalline ZnO hybrid network materials were prepared and exhibited strong visible light scattering behavior and broadband photo absorption [18]. As is typical of n-type metal oxide semiconductors, SnO2 is widely used as a candidate in the gas-sensing field for its wide band gap of 3.6 eV, good chemical stability, and physical properties. However, when taking into consideration their practical application in gas sensing, there are many defects exposed to us. For example, high working temperature, long response and recovery time, and poor stability and aggregation restrict their gas-sensing development. Therefore, many attempts have been made to improve their gas-sensing properties, such as enhancing the specific surface area and the electrical properties by using two-dimensional (2-D) materials [19,20,21,22,23].
Graphene, a representative of 2-D material, has been a focus of scientific research because of its unique property and structure with a unilaminar sp2-hybridized carbon atom configuration. In recent years, graphene and reduced graphene oxide (r-GO) have been widely used for gas-sensing investigation due to their large specific surface area and excellent conductivity [24,25,26,27,28,29,30]. Many researchers reported that metal oxide-decorated graphene nanocomposite-based sensors exhibited superior sensibility to different gases [31,32,33,34,35,36,37]. However, as we know, the preparation process of GO and r-GO is complicated and consumptive. Hence, it is necessary to explore a similar novel structure material with graphene.
Recently, graphitic carbon nitride (g-C3N4) with its graphite-layered structure, which is similar to graphene, has been studied for various applications, including photo degradation and photocatalysis, due to its large specific surface area and high chemical stability [38,39,40,41]. Until now, there are few reports about the application of gas sensors in the presence of g-C3N4. Zeng et al. successfully prepared a α-Fe2O3/g-C3N4 nanocomposite using a facile refluxing method for the cataluminescence sensing of H2S [42]. In our previous work, cocoon-like ZnO-decorated graphitic carbon nitride nanocomposites were synthesized, which showed an impressive response toward ethanol [43]. As far as we know, there is no related report about the application of SnO2/g-C3N4-based sensors in the gas-sensing field.
In our study, we synthesized SnO2/g-C3N4-nanocomposites with different mass ratios of SnO2 and g-C3N4 using a facile solid-state method. The gas-sensing properties, including selectivity, stability, and sensitivity of SnO2/g-C3N4 to ethanol, were investigated. As a result, the SnO2/g-C3N4 nanocomposite-based sensor exhibited a higher response value and better selectivity to ethanol than pure SnO2 nanoparticles.

2. Materials and Methods

2.1. Materials

Urea, Tin (IV) chloride pentahydrate (SnCl4·5H2O, 99.0%), sodium hydroxide (NaOH), and polyethylene glycol 400 (PEG-400) were purchased from Sinopharm Chemical Reagent Co., Ltd. (Beijing, China). All chemicals were used as received without further purification.

2.2. Preparation of g-C3N4

Graphitic carbon nitride (g-C3N4) was synthesized by pyrolysis of urea in a muffle furnace; 20 g urea was put into an alumina crucible with a cover, then heated to 250 °C within 110 min and kept at 250 °C for 1 h. The further treatment was performed at 350 and 550 °C for 2 h, respectively. The heating rate of the whole reaction was 2 °C·min−1. The yellow power (g-C3N4) was collected. The collected amount of the g-C3N4 was about 1 g.

2.3. Synthesis of the SnO2/g-C3N4 Nanocomposites

SnO2/g-C3N4 nanocomposites were synthesized using a facile solid-state reaction method. In a typical synthesis procedure, 10 wt % 2-D g-C3N4 in the composites (SnO2/g-C3N4-10) were prepared using the following method. 3.5 g of SnCl4·5H2O, 0.167 g of g-C3N4 and 3 mL of PEG-400 were mixed by grinding in an agate mortar. Then, 1.6 g NaOH was slowly added to the mixture, which was ground for another 30 min. An emission of water vapor and heat during the addition of NaOH was observed. The resulting product was separated by centrifuging and washed several times with distilled water and absolute ethanol. Then, the obtained product was dried at 60 °C for 12 h. Finally, the product was ground to powder. SnO2/g-C3N4 nanocomposites with 7 wt % and 13 wt % g-C3N4-decorated SnO2 were also prepared in accordance with this method and marked as SnO2/g-C3N4-7 and SnO2/g-C3N4-13, respectively. For comparison, the same method was used to synthesize pure SnO2 nanoparticles in the absence of g-C3N4.

2.4. Characterization

The crystal microstructure of the sample was identified by X-ray diffraction (XRD, Bruker-AXS D8, Bruker, Madison, WI, USA) using Cu Kα radiation with a wavelength of 0.154 nm. X-ray photoelectron spectroscopy (XPS) measurements were taken on a Perkin-Elmer PHI 5600 spectrophotometer (Perkin Elmer Limited, Waltham Mass, Waltham, MA, USA) with Mg Kα (1253.6 eV) radiation. Scanning electron microscope (SEM) images were observed by field-emission scanning electron microscopy (FESEM, Quanta™250 FEG) (FEI, Eindhoven, The Netherlands). Transmission electron microscopy (TEM) analysis was performed on a JEOL JEM-2100 microscope (JEOL, Tokyo, Japan) operating at 200 kV. Thermal gravity and differential thermal analysis (TG–DTA) was carried out on a TA-SDT Q600 (TA Instruments, New Castle, DE, USA) at a heating rate of 10 °C·min−1 under an air atmosphere. Nitrogen adsorption–desorption isotherms were obtained on a Quantachrome Autosorb-iQ sorption analyzer (Quantachrome, Boynton Beach, FL, USA). Before carrying out the measurement, the samples were degassed at 150 °C for more than 6 h. The specific surface areas (SBET) of the samples were calculated following the multi-point BET (Brunauer-Emmett-Teller) procedure. The pore size distributions were determined from the adsorption branch of the isotherms using the DFT method.

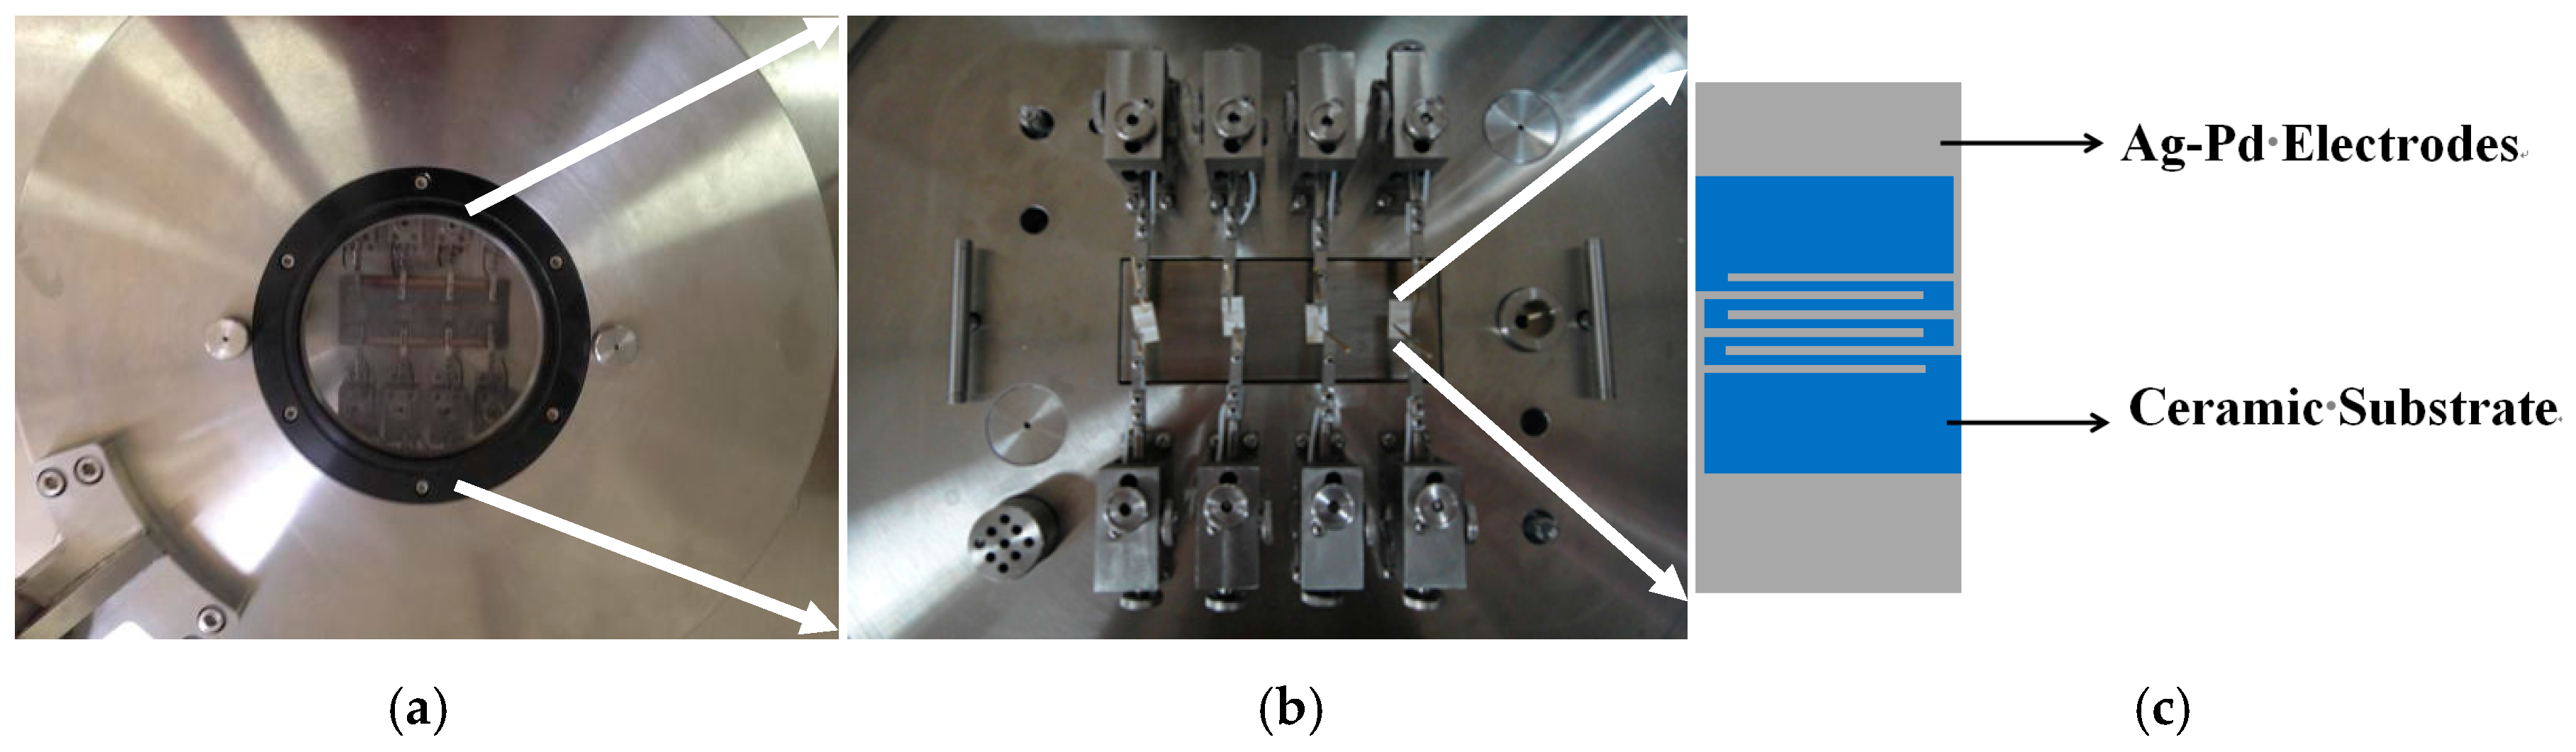
2.5. Sensor Fabrication and Measurements

The gas-sensing performance of the as-synthesized samples to ethanol was tested using the intelligent gas-sensing analysis system of CGS-4TPS (Beijing Elite Co., Ltd., Beijing, China). Figure 1 shows a brief device schematic diagram. In the process of the gas-sensing test, the relative humidity in the test chamber is 25%. The gas sensors were prepared in a usual way [44]. A small amount of the as-prepared samples were fully ground in an agate mortar with a few drops of ethanol, which served as the agglomerant to form starchiness. Afterwards, the pastes were equably spread on a ceramic substrate (13.4 mm × 7 mm) with interdigitated Ag-Pd electrodes to form the thin film. Before carrying out the test, the substrate was aged at 60 °C for 2 h and at 150 °C for 12 h to improve the stability and repeatability of the gas sensors. The response of the sensors was defined as the ratio of Ra/Rg, where Ra and Rg were the resistances of the sensor measured in air and in test gas, respectively.

3. Results and Discussion

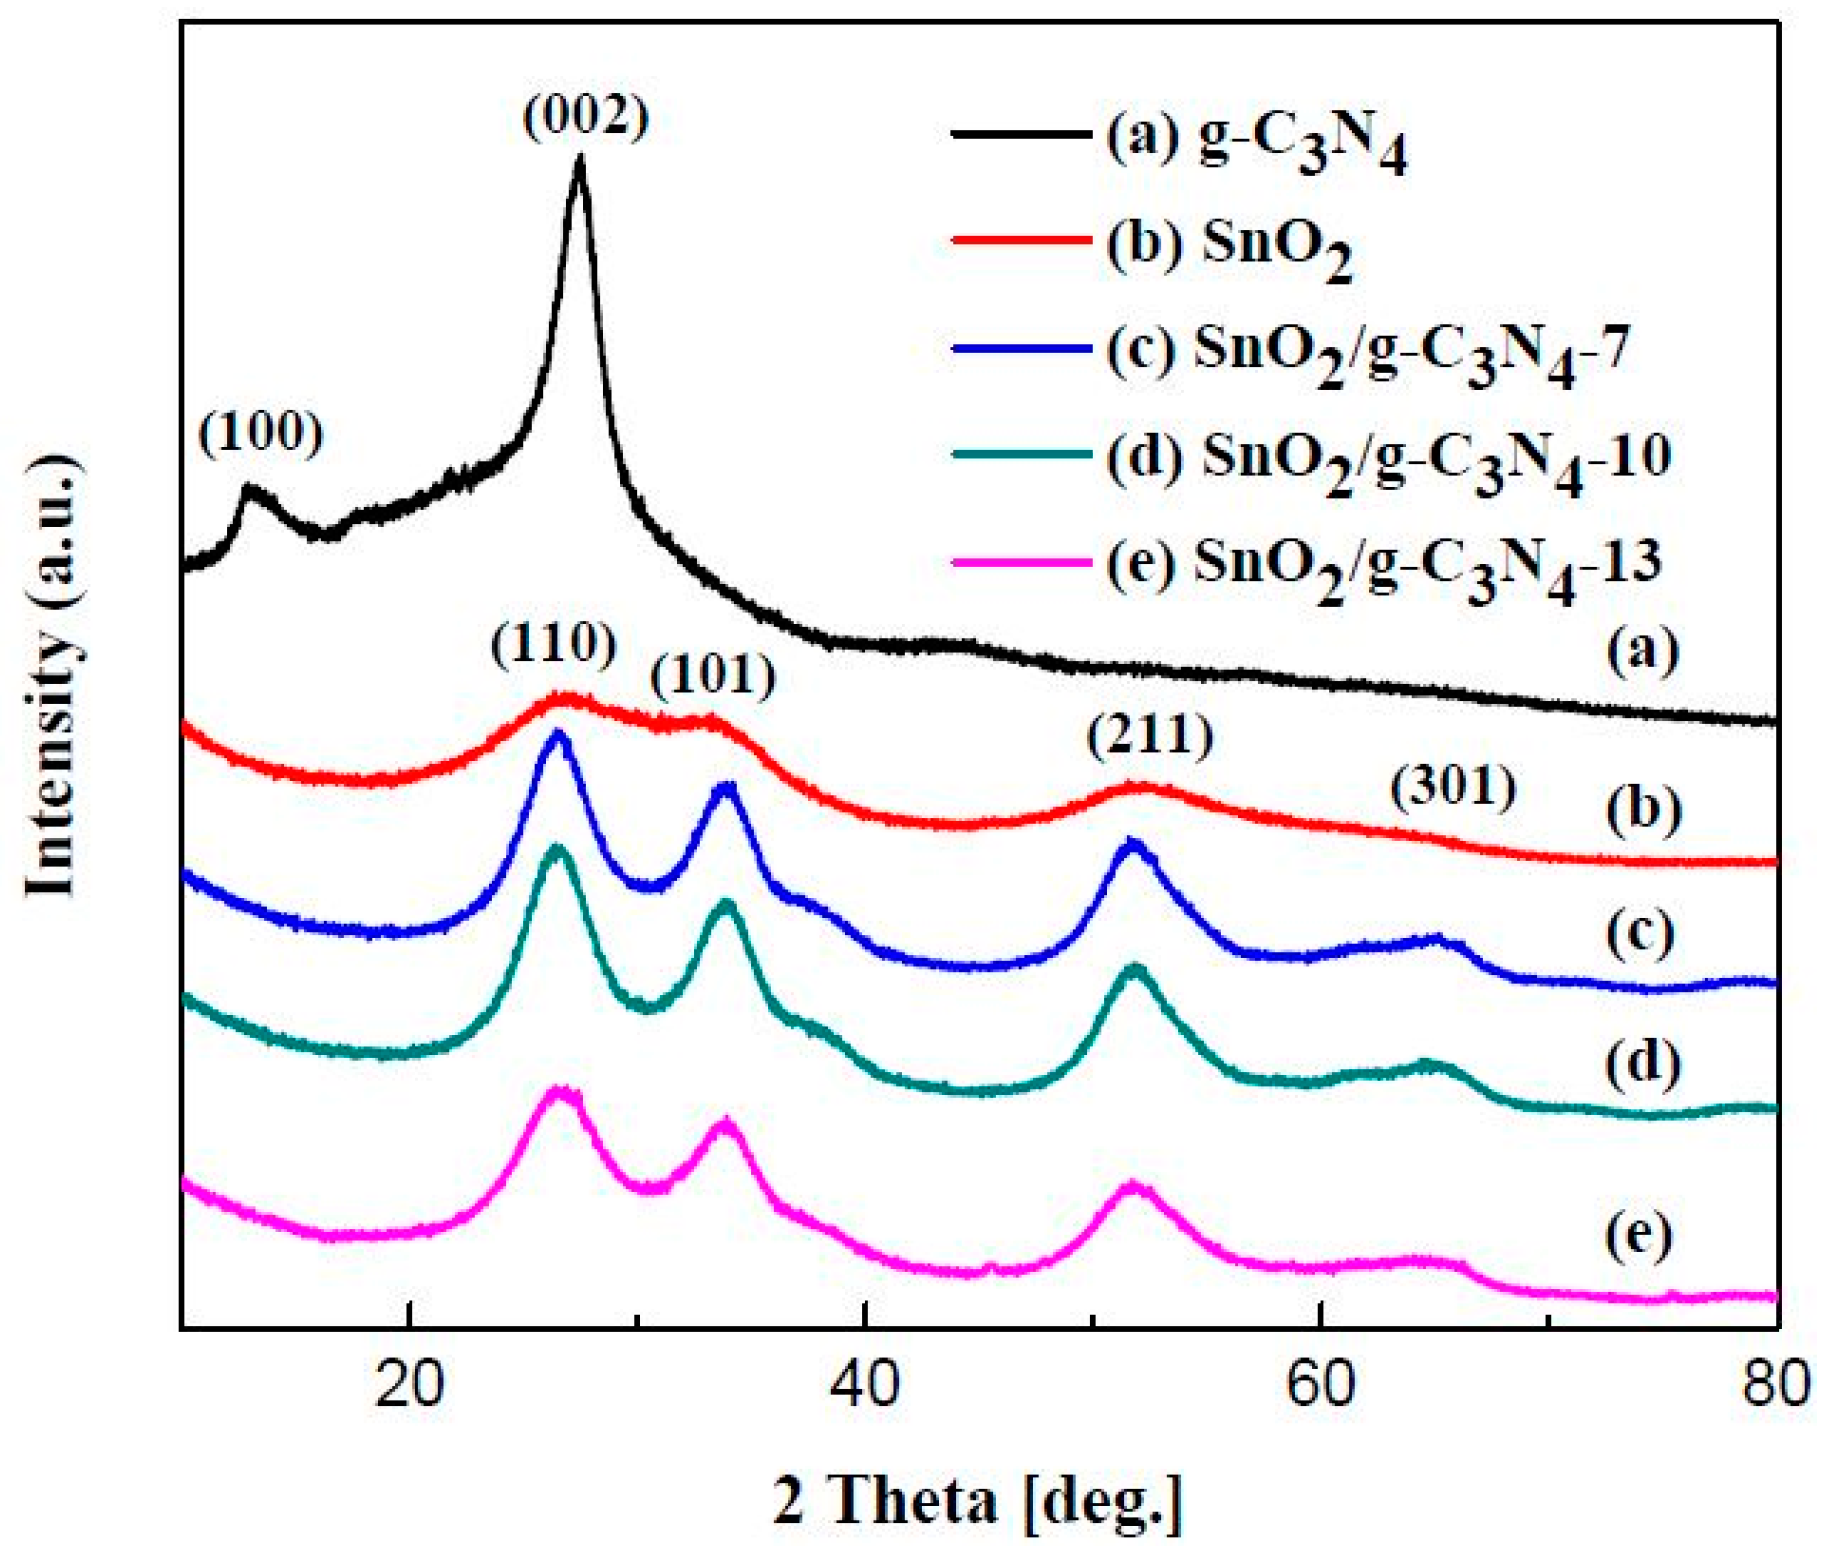
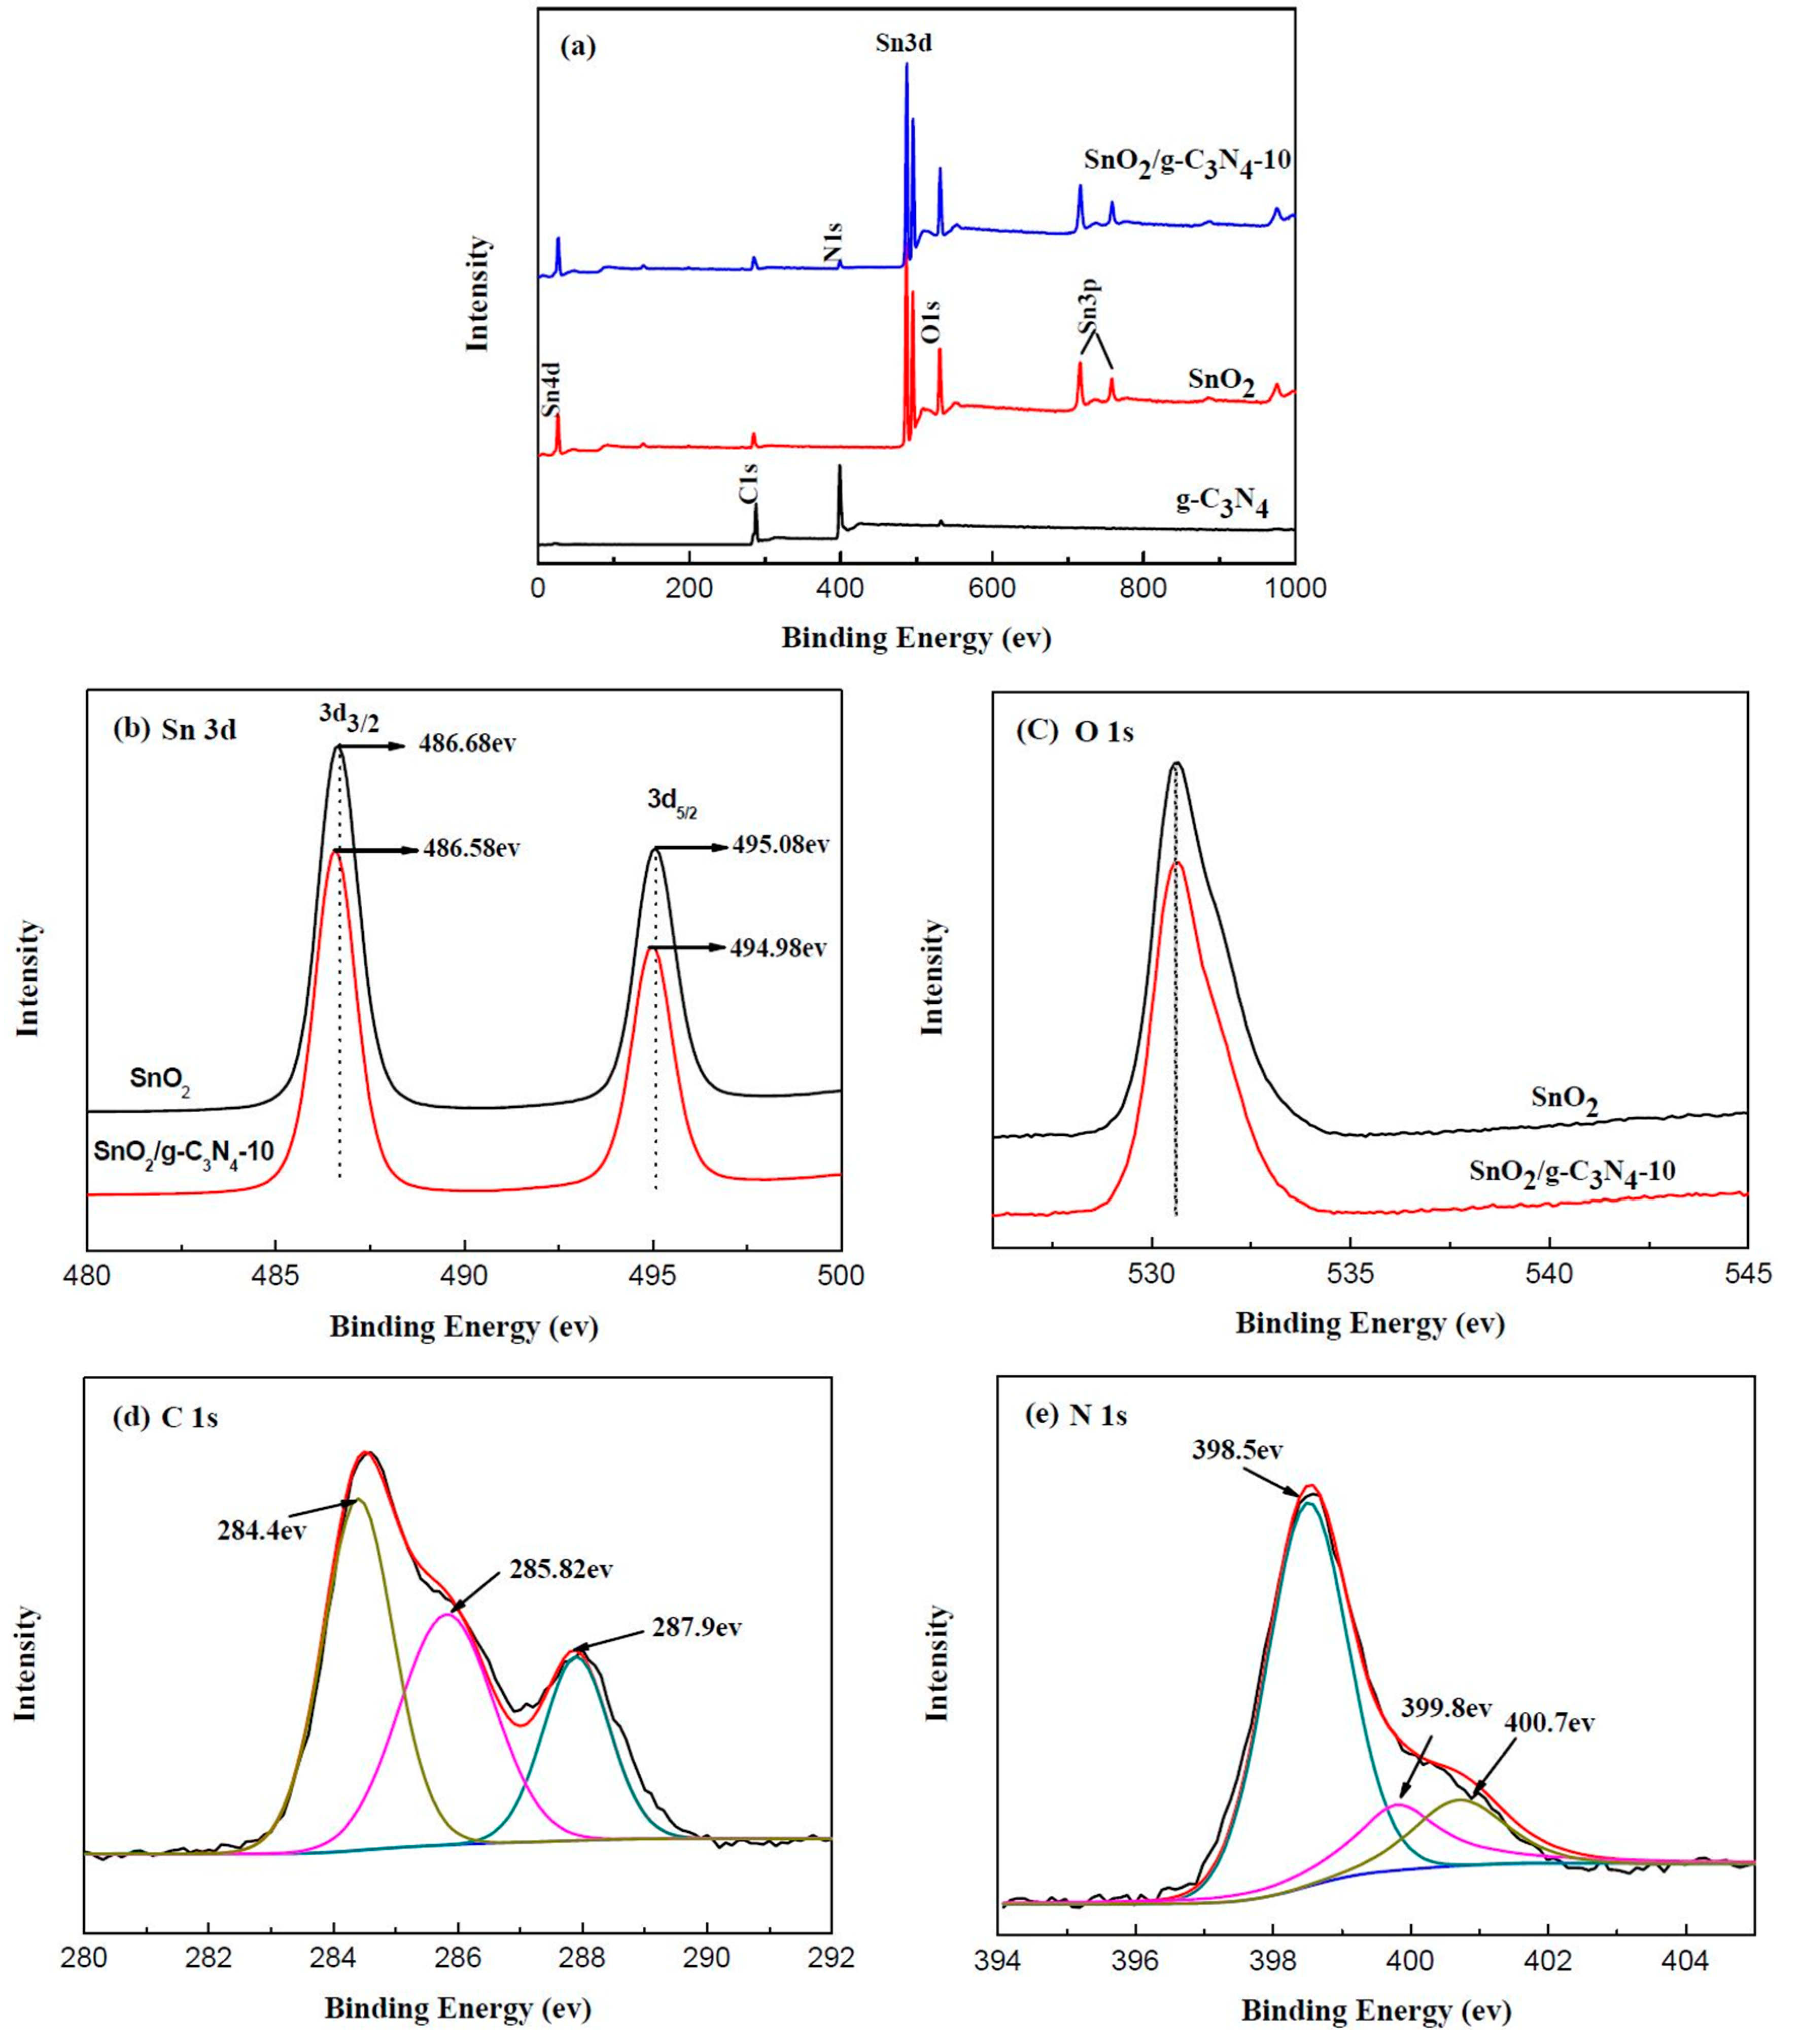
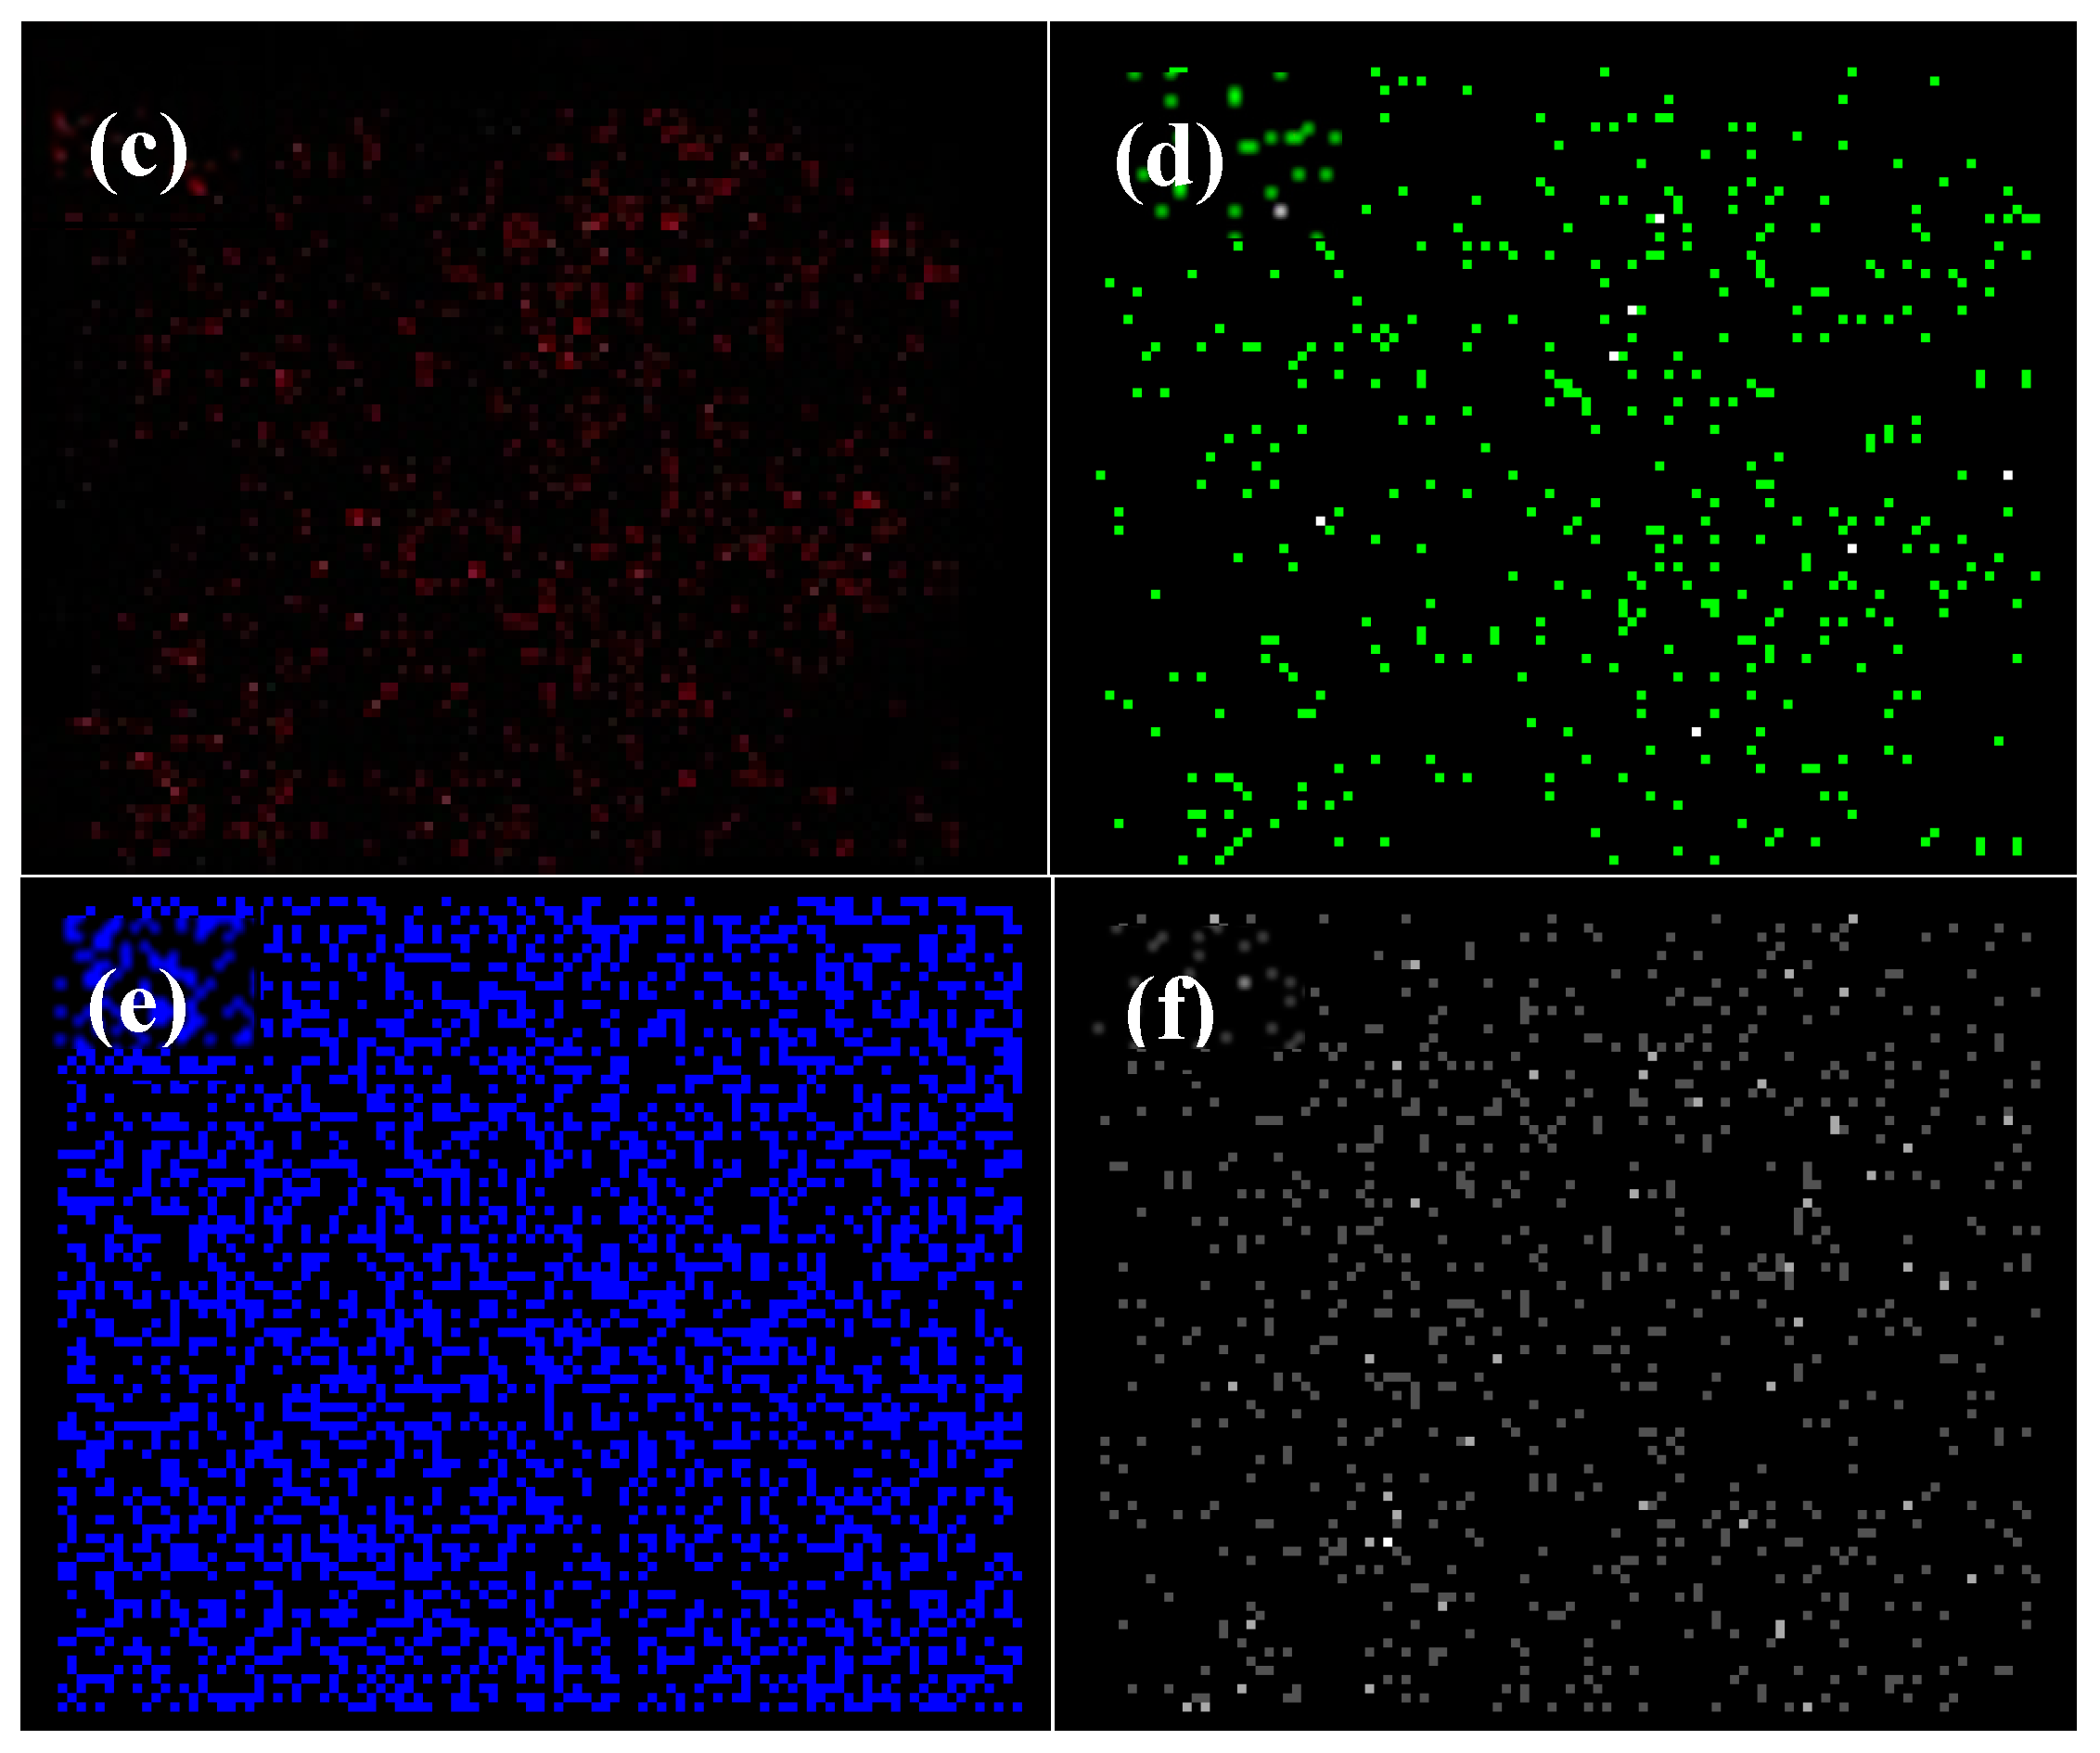
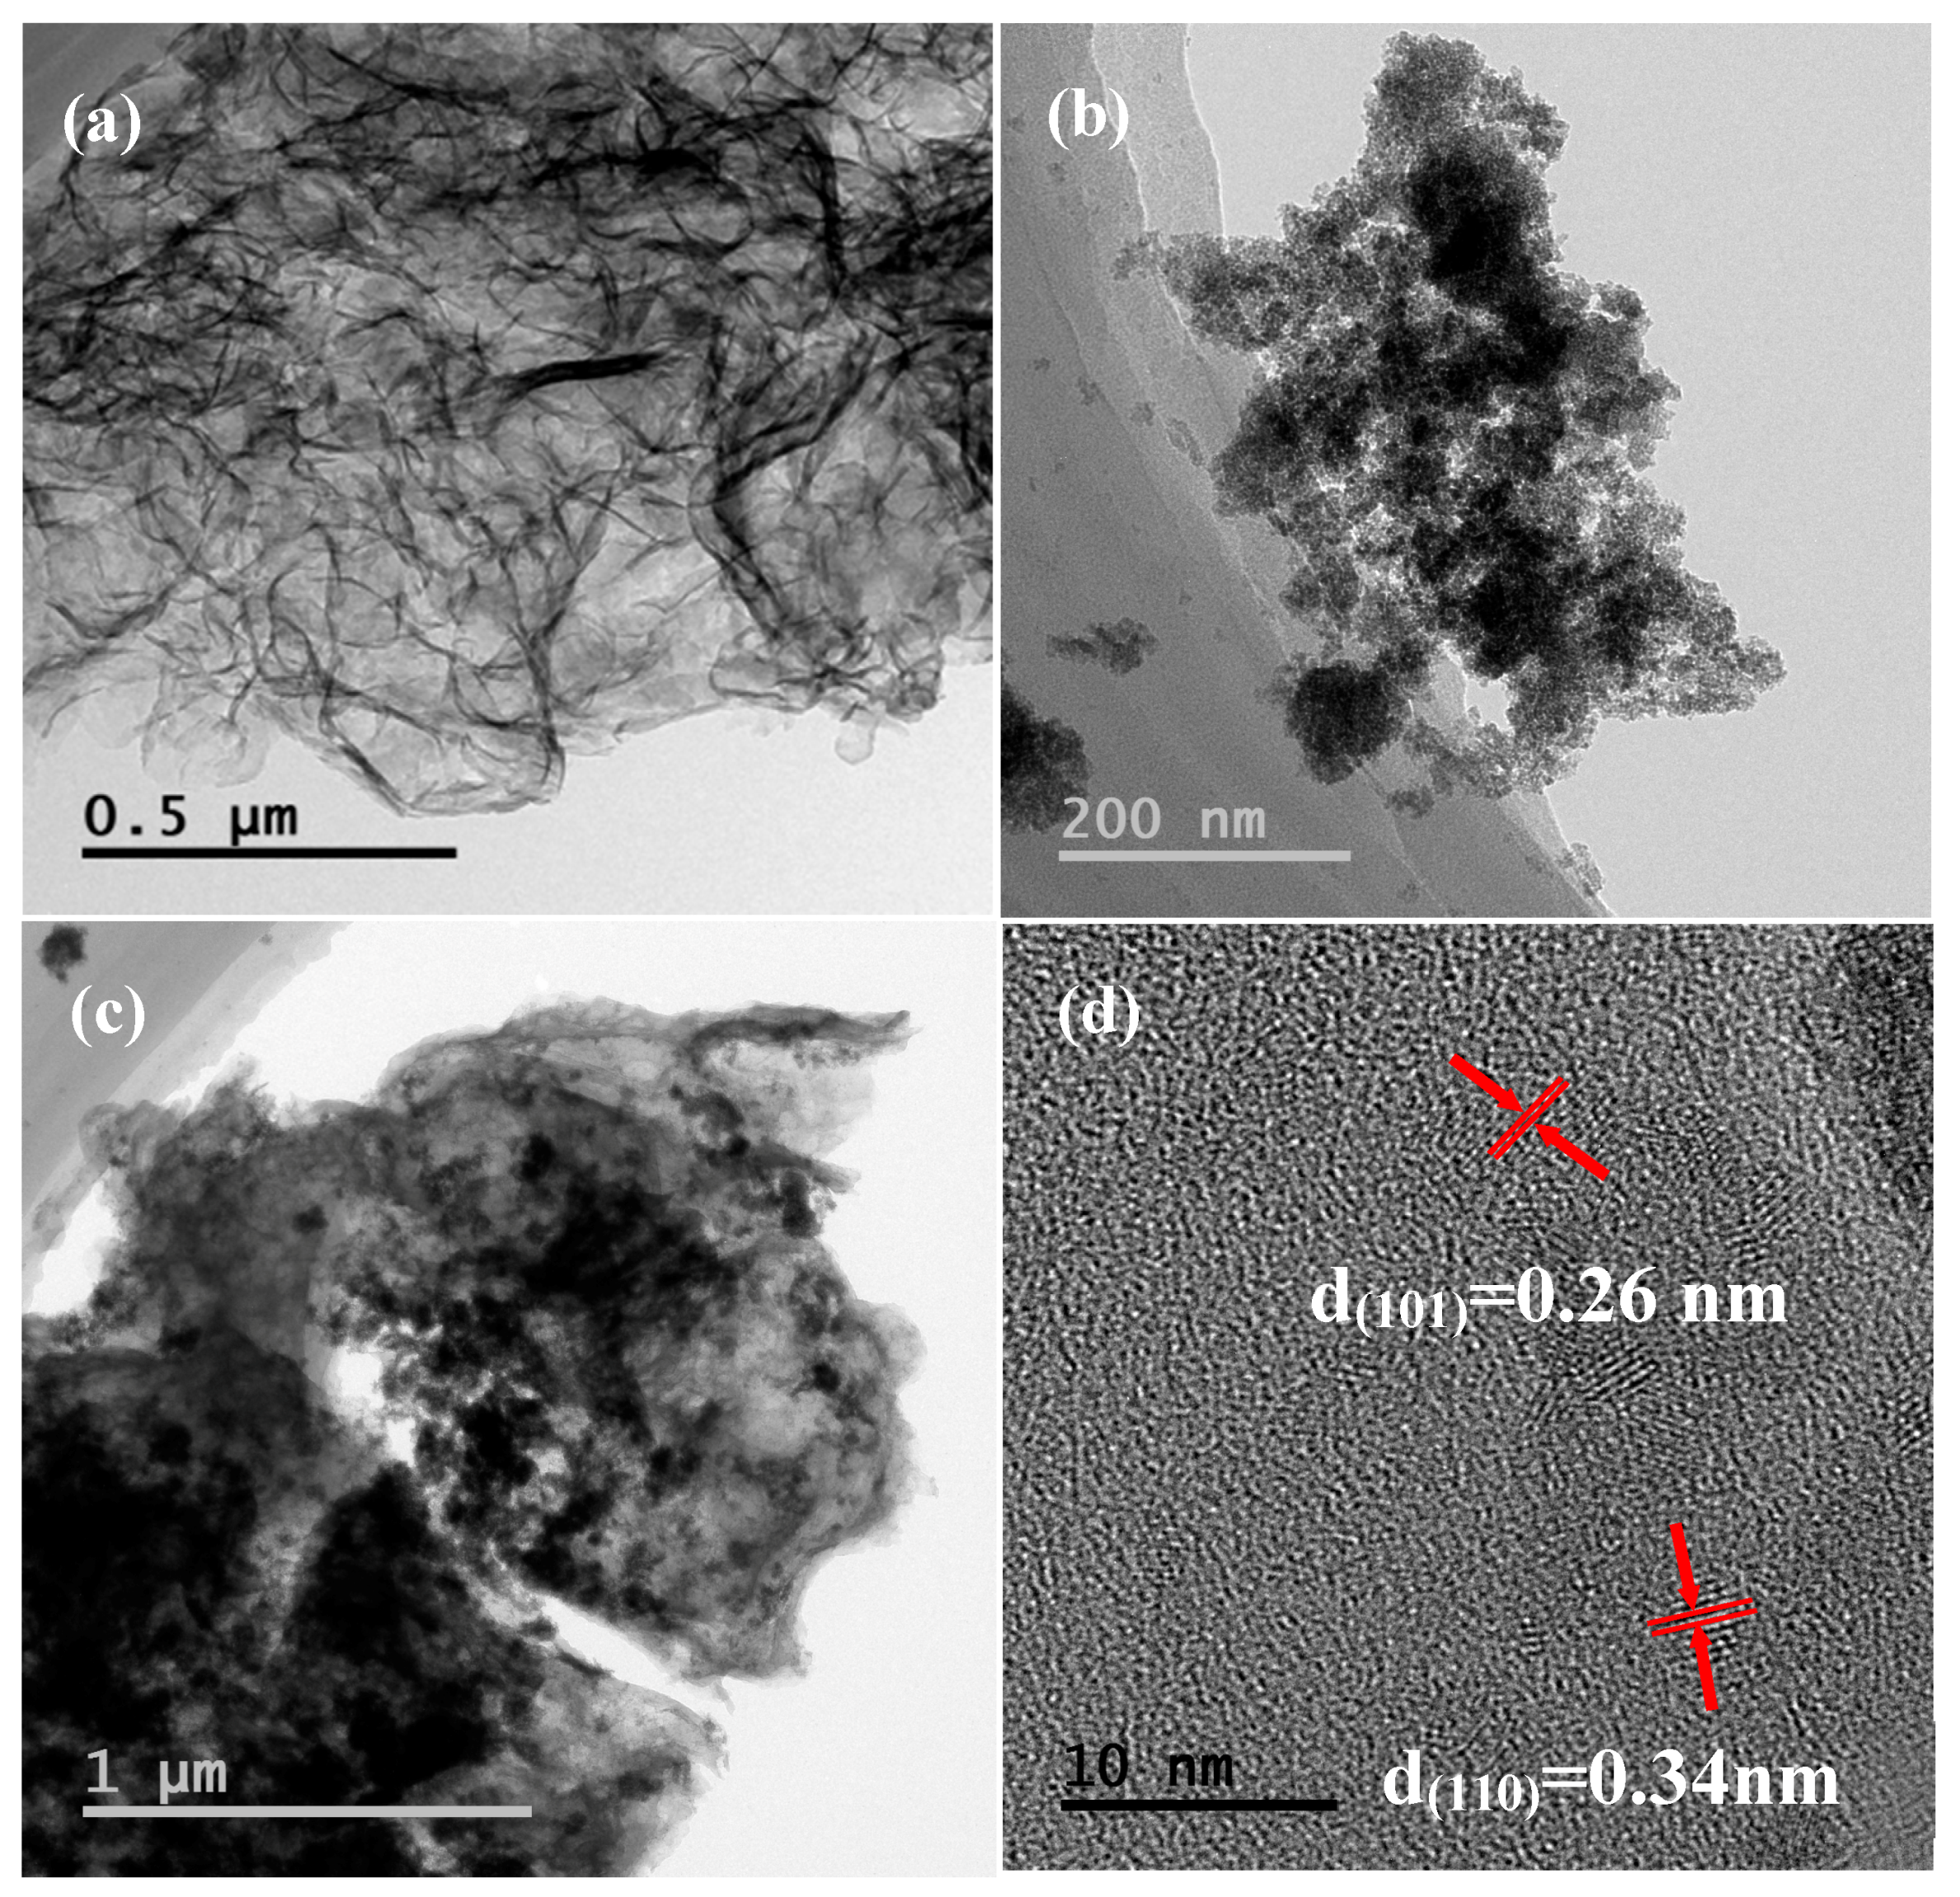
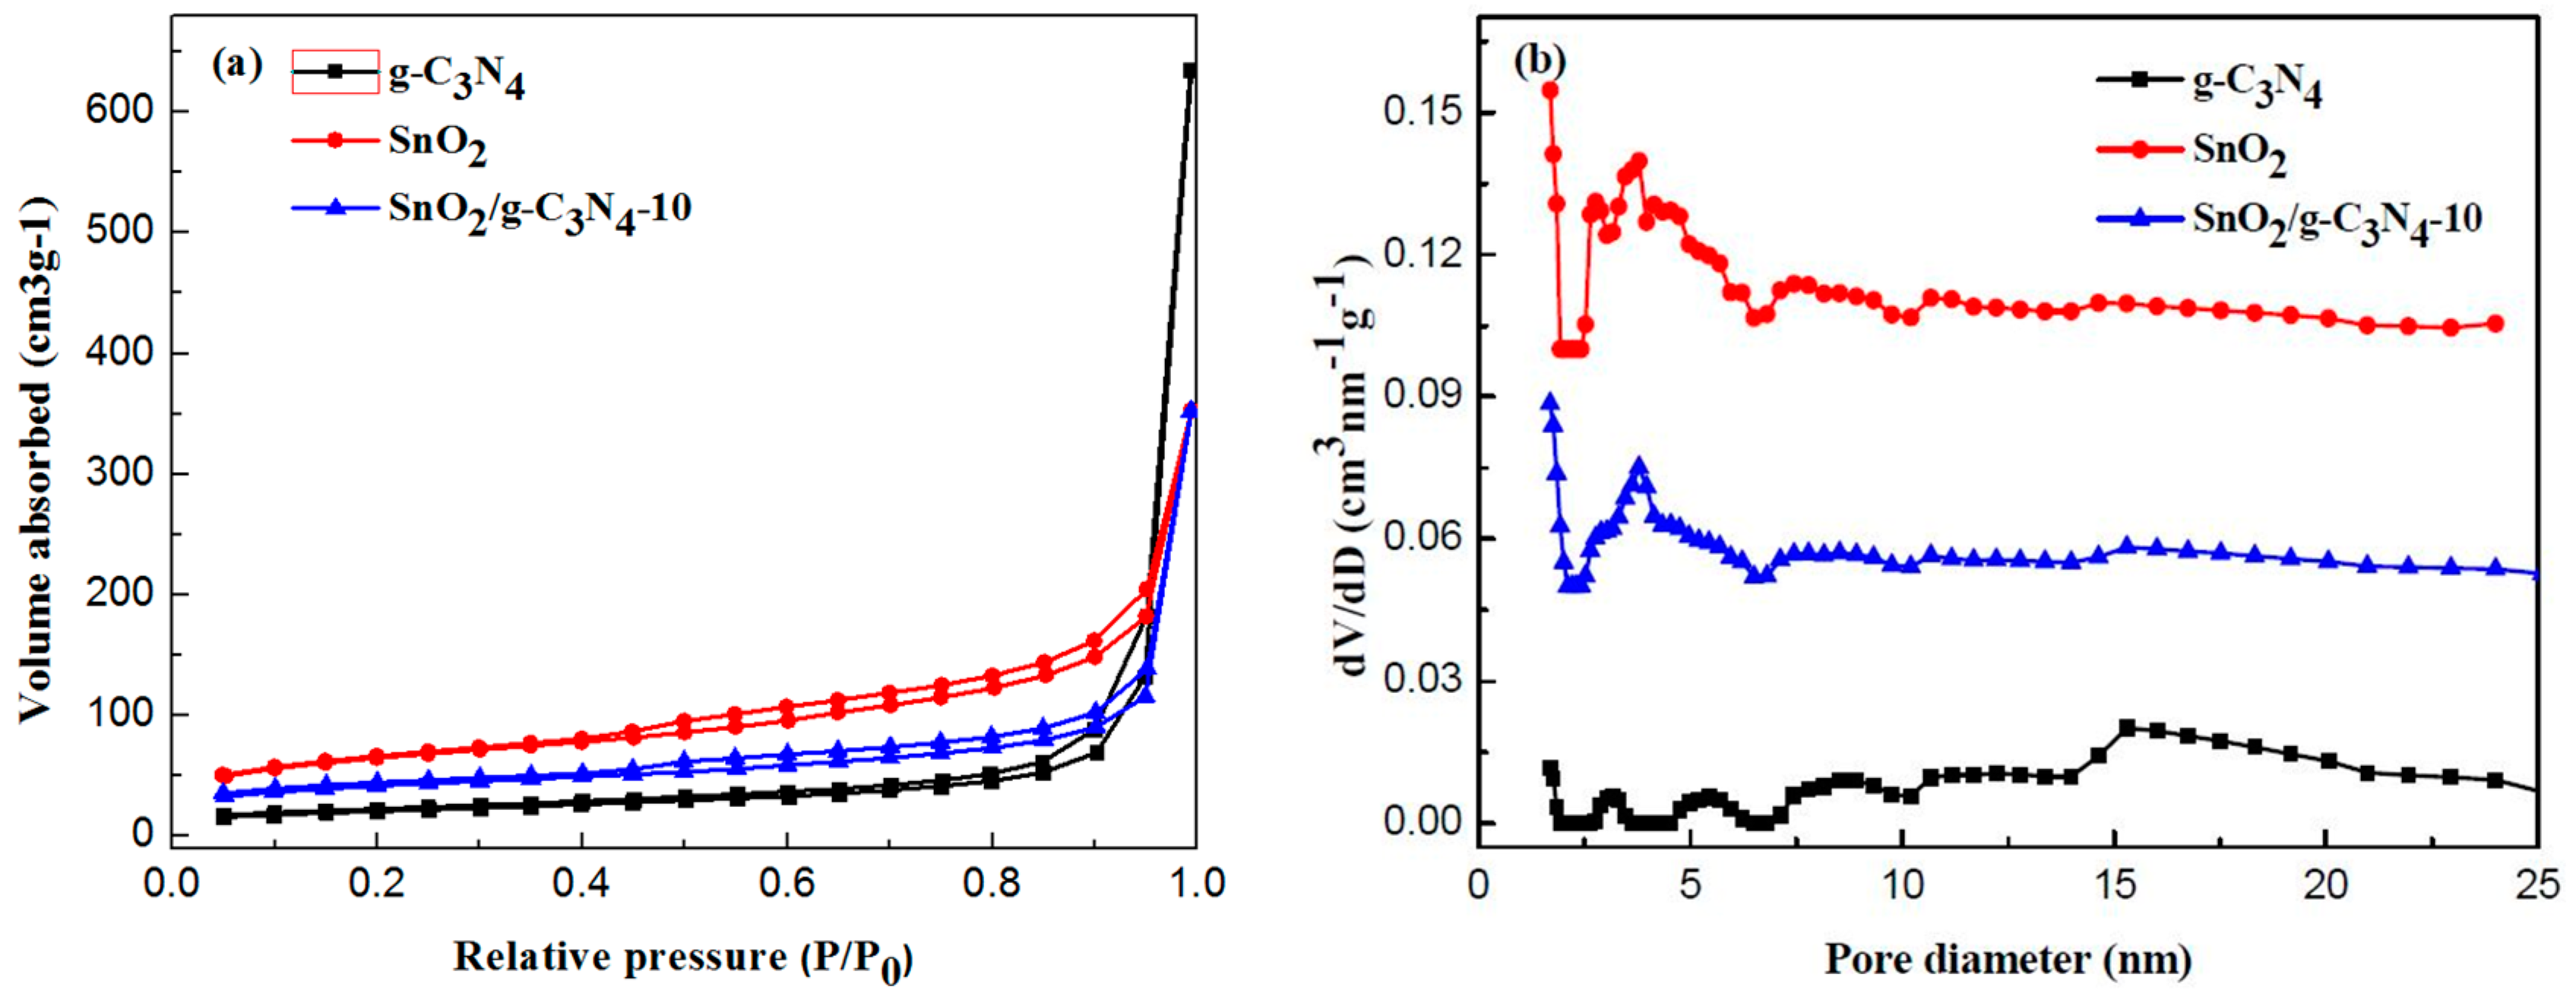
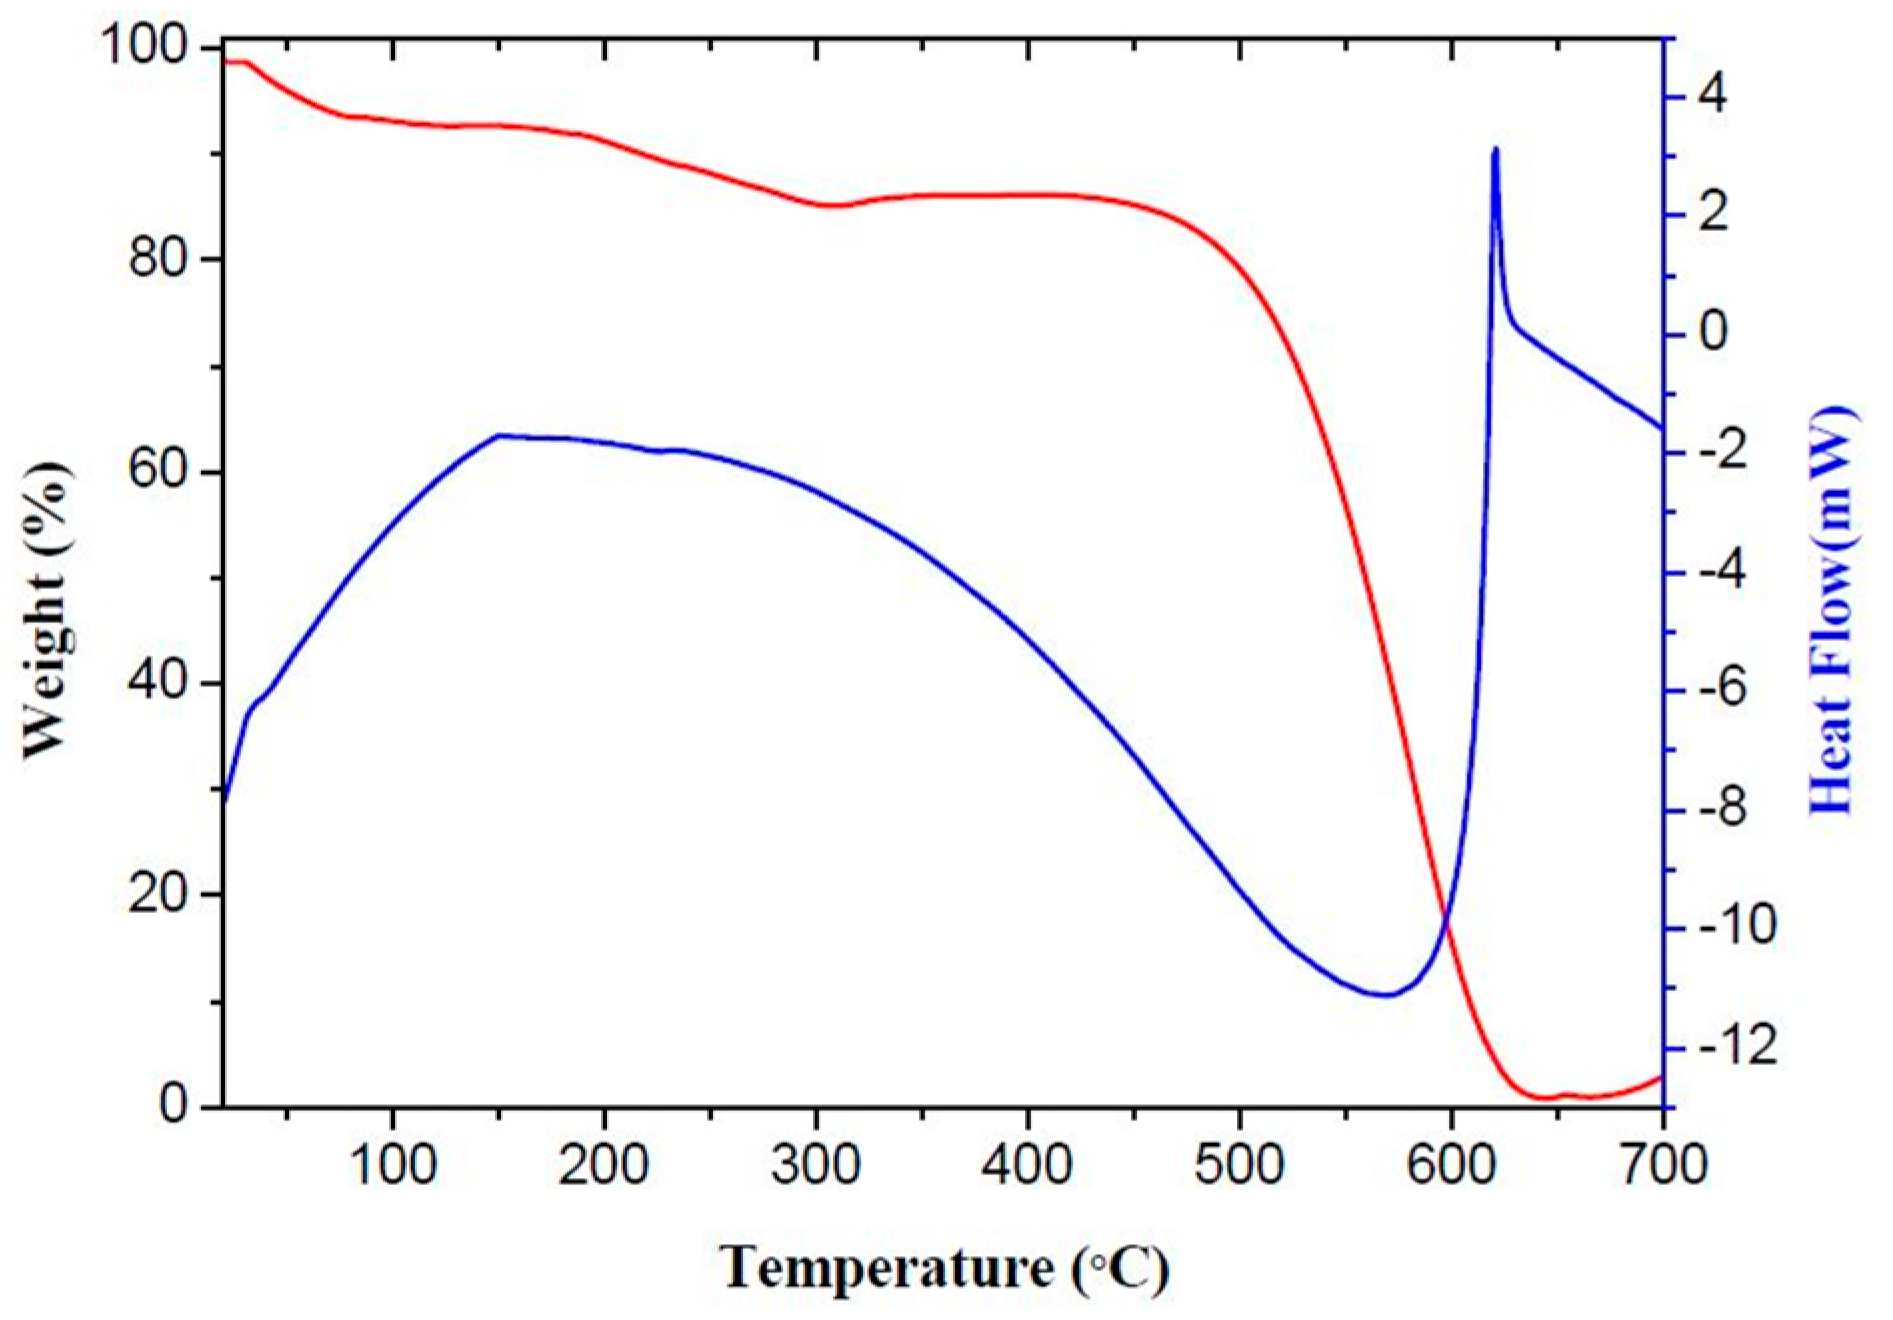
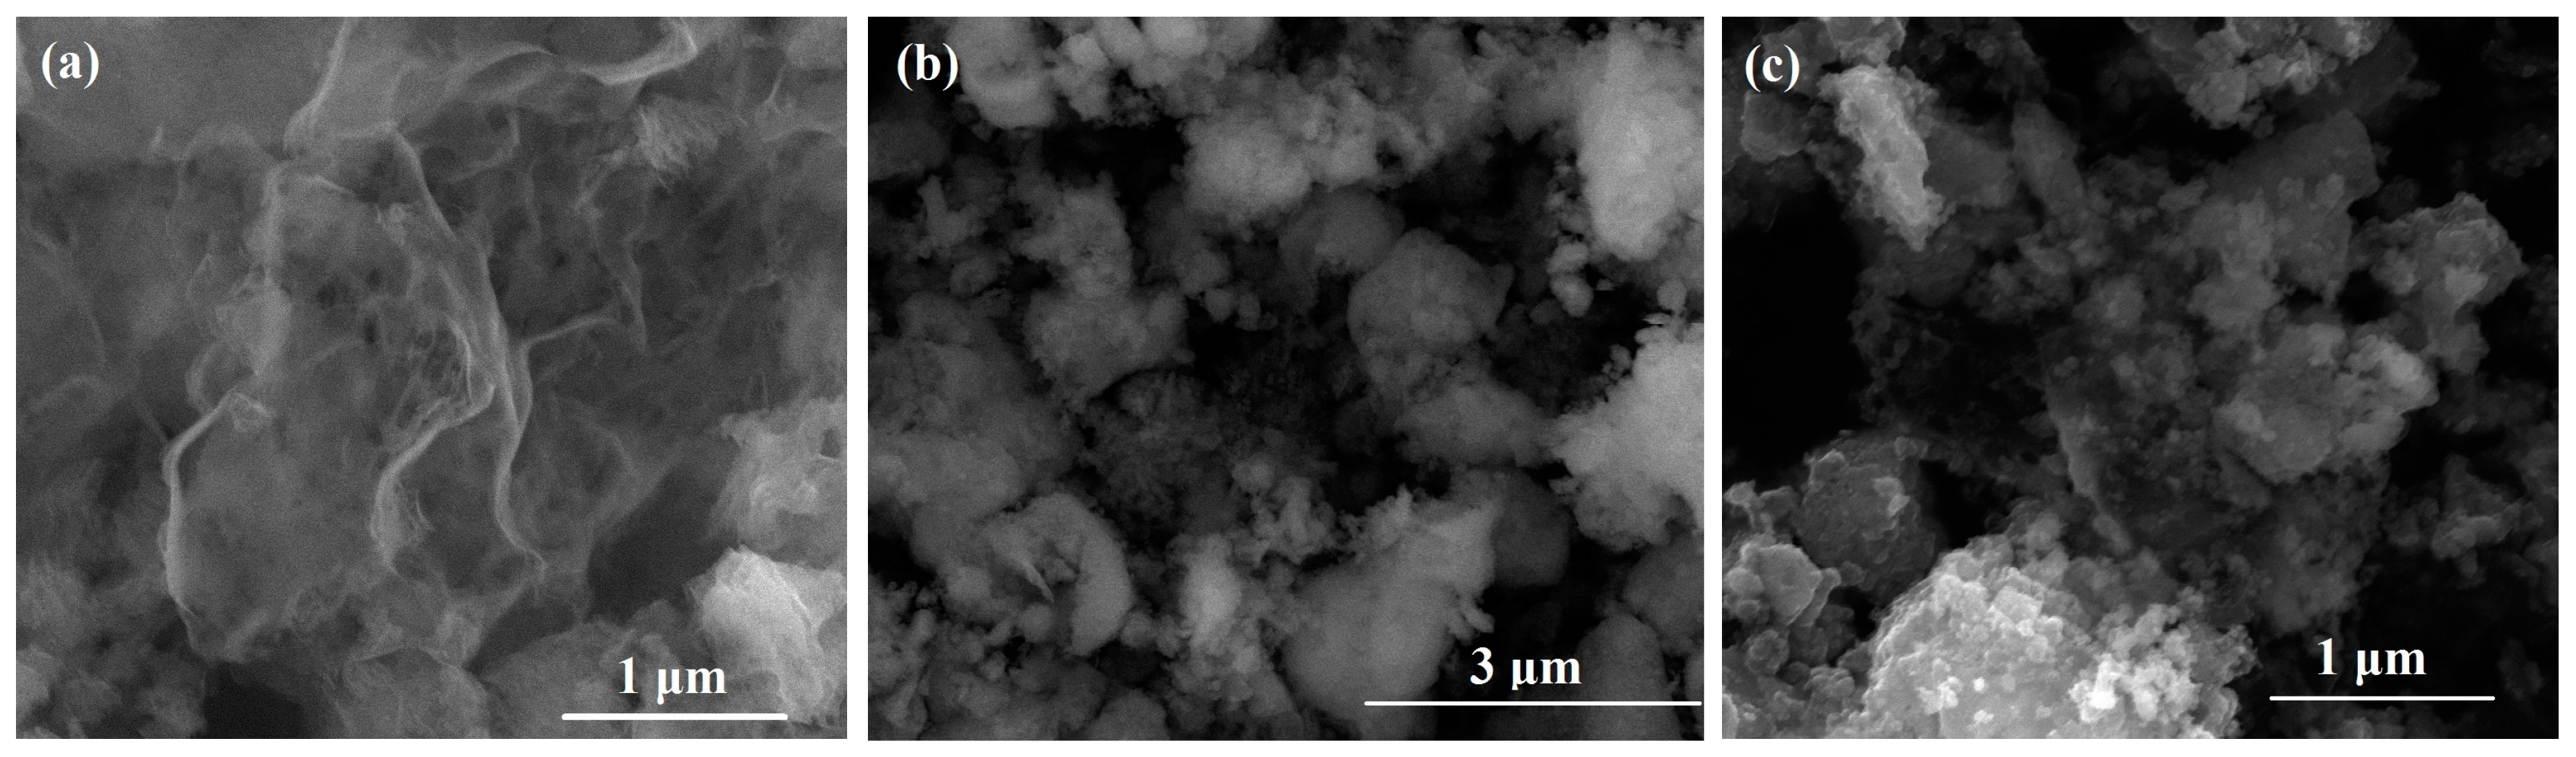
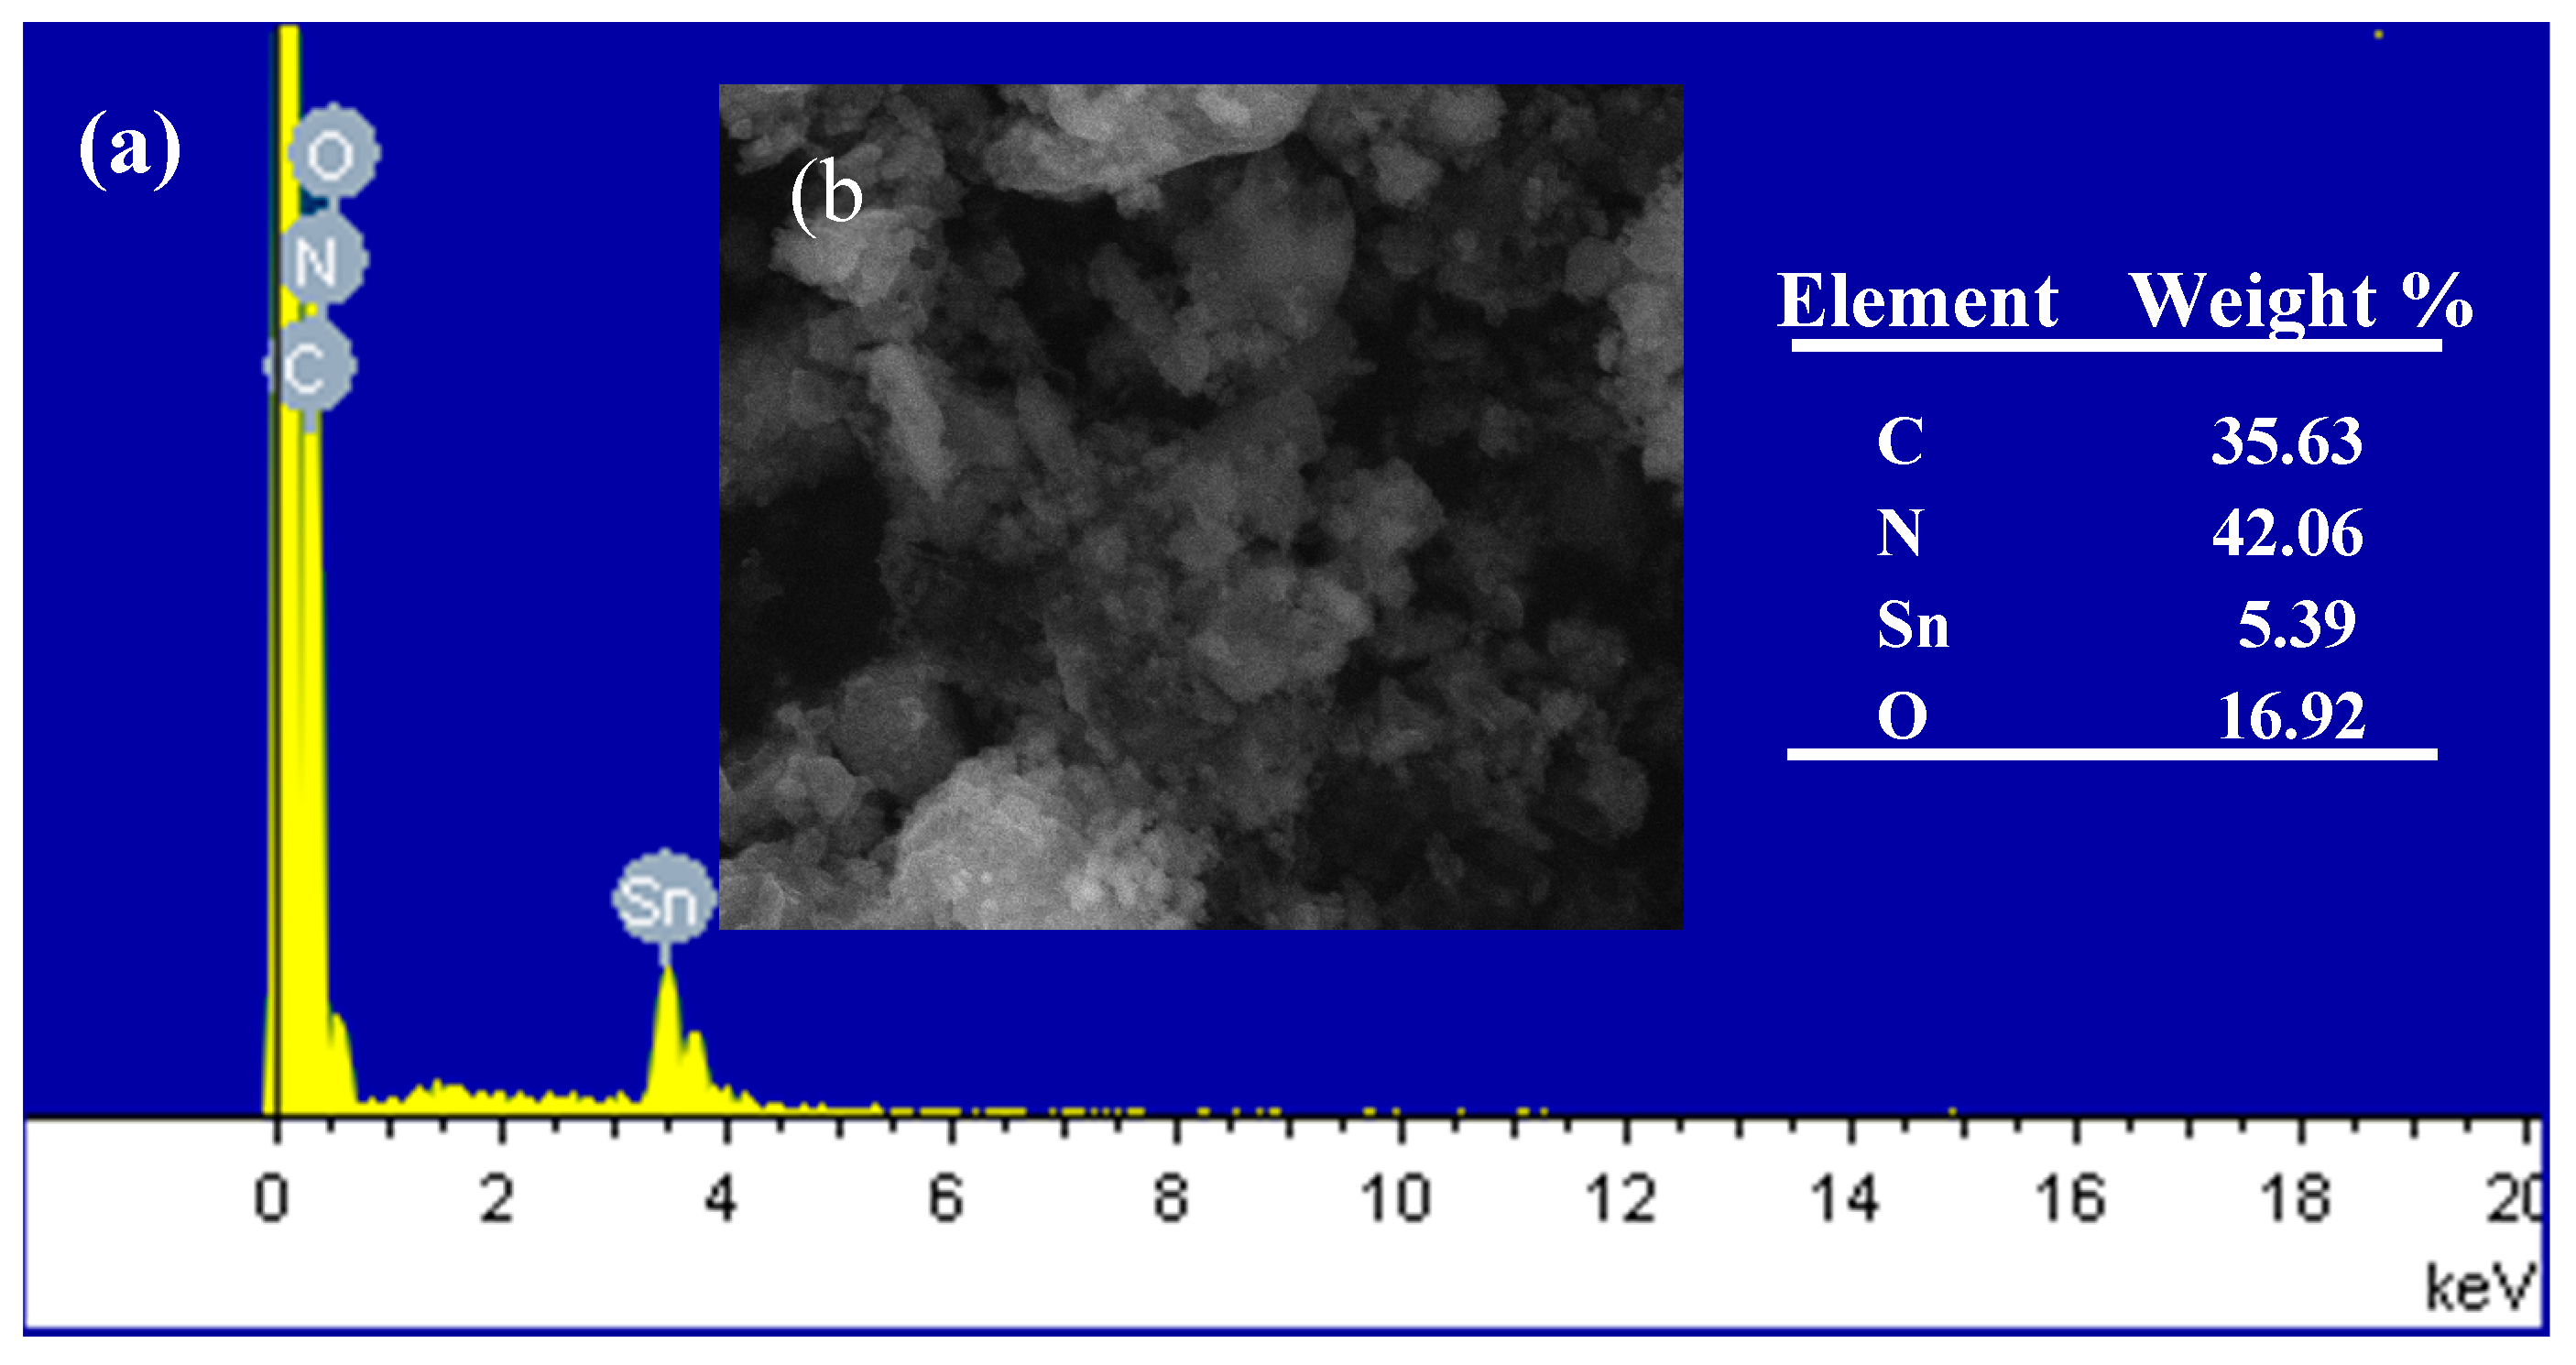
3.1. Sample Characterization

Figure 2 shows the XRD patterns of as-prepared g-C3N4, pure SnO2 nanoparticles, and SnO2/g-C3N4 nanocomposites. From Figure 2a, there are two obvious diffraction peaks around 13.1° and 27.5°, which were accorded to the (100) and (002) planes of g-C3N4. These two peaks are likely to be attributed to the structure of the tri-s-triazine unit with interplanar spacing and the conjugated aromatic system, respectively [39]. It can be concluded that g-C3N4 was synthesized successfully. As seen from the other curves, there are four distinct diffraction peaks around 26.61°, 33.9°, 51.7°, and 65.9°, which correspond to the (110), (101), (211), and (301) planes of the tetragonal rutile SnO2 (JCPDS Card No.41-1445), respectively. However, Figure 2c–e shows that there are no diffraction peaks of g-C3N4 observed in the curves. This is due to the relatively small content of g-C3N4 in the nanocomposites or the peak around 27.5° of g-C3N4 is covered by the peak around 26.61° of SnO2.
XPS analysis was carried out to confirm the surface chemical composition and the formation of heterojunction in the SnO2/g-C3N4 sample; the result is shown in Figure 3. Figure 3a displays the survey scan spectra of g-C3N4, SnO2, and SnO2/g-C3N4-10. It is observed that Sn, O, C, and N exist in the SnO2/g-C3N4 composite, and Sn, O, and C exist in SnO2. The spectra of g-C3N4 show only C and N elements. The C 1s peak from SnO2 is due to the adventitious carbon. As shown in Figure 3b, two signal peaks of Sn 3d in pure SnO2 at binding energies of 486.68 eV and 495.08 eV correspond to Sn 3d3/2 and Sn 3d5/2, respectively. However, the two signal peaks of Sn 3d in SnO2/g-C3N4-10 had a shade of shift, in which the peak position shifted to 486.58 eV of Sn 3d3/2 and 494.98 eV of Sn 3d5/2, respectively. This phenomenon can be attributed to the interactions between g-C3N4 and SnO2 and to the heterojunction of the interface region between g-C3N4 and SnO2. For the high-resolution XPS spectra shown in Figure 3c, there are few distinctions of O 1s between SnO2 and SnO2/g-C3N4-10. Figure 3d displays the high-resolution XPS spectra of C 1s. The three signal peaks for the C 1s binding energies exist at 284.4, 285.82, and 287.9 eV, respectively. As is well known, the signal at 284.4 eV corresponds to sp2 C–C bonds, while the signal at 285.82 eV is identical to the combination of C–N groups. And the signal at 287.9 eV comes from the sp2 C atoms from the aromatic rings N–C=N. As is seen in Figure 3e, there are three signals with binding energies at 398.5, 399.8, and 400.7 eV, respectively. The peak at 398.5 eV is ascribed to sp2-hybridized aromatic N bonded to C atoms, and the peak at 399.8 eV comes from the tertiary N bonded to C atoms in the form of N–(C)3. The peak at 400.7 eV is related to the N–H structure. From the above analysis, the interactions between Sn and g-C3N4 enhance the electrical conductivity of the nanocomposite, which could be of benefit for the gas-sensing performance.
TG-DTA analysis was carried out to reveal the weight change situation of g-C3N4. The temperature range was from room temperature to 700 °C, and the heating rate was 10°/min. As is shown in Figure 4, the first peak was between 100 °C and 300 °C, which is due to the desorption of moisture and solvent. The second peak was between 400 °C and 600 °C, which is due to the combustion of g-C3N4 in air. This result demonstrates that g-C3N4 was not decomposed at the optimum temperature of 300 °C in the process of testing for gas-sensing properties.
The SEM images of g-C3N4, SnO2, and SnO2/g-C3N4 composite are shown in Figure 5. Figure 5a displays the SEM image of g-C3N4. On the edge of the thin layers, many wrinkles can be clearly seen, which are representative of 2-D materials. Figure 5b shows many SnO2 nanoparticles agglomerated together with different size. As shown in Figure 5c, plenty of particles are highly decentralized on the g-C3N4 sheets. This could be beneficial to improving the gas-sensing properties.
Figure 6a displays the typical spectra of SnO2/g-C3N4-10 composite recorded from the surface area that was observed in Figure 6b, where the peaks of Sn, O, C, and N are simultaneously existent. The percentage composition of the four elements of C, N, Sn, and O is 35.63 wt %, 42.06 wt %, 5.39 wt %, and 16.92 wt %, respectively. The energy dispersive spectrometer (EDS) mapping of the four elements Sn, O, C, and N are shown in Figure 6c, Figure 6d, Figure 6e, and Figure 6f, respectively. The distributions of these four elements are clearly observed. According to Figure 6, the structural feature of the SnO2/g-C3N4-10 composite is that 2-D g-C3N4 and SnO2 particles are effectively combined. It can be concluded that the SnO2/g-C3N4 composites were synthesized successfully using the solid-state method, which is applicable to large-scale production.
Figure 7 shows the TEM and HRTEM images of g-C3N4, SnO2 and of the SnO2/g-C3N4 nanocomposite. As shown in Figure 7a, it can be seen that there are plenty of gauffers in the floccules. Figure 7b shows that the pure SnO2 samples consist of many nanoparticles. Meanwhile, as can be seen from Figure 7c, the SnO2 nanoparticles are highly dispersed on the surface of g-C3N4. From Figure 7d, the lattice fringes with interplanar spacings of 0.26 and 0.34 nm can be assigned to the (101) and (110) planes of the g-C3N4-supported SnO2 nanoparticles.
Figure 8 depicts the N2 adsorption–desorption isotherms and the corresponding pore size distribution of the as-prepared g-C3N4, SnO2, and SnO2/g-C3N4-10 samples. It can be seen from Figure 8a that the isotherms of the three samples show type IV, which is the typical characteristic of mesoporous material according to the IUPAC. The well-defined hysteresis loop of the SnO2/g-C3N4-10 sample belongs to the H3-type, indicating the presence of an aggregation of laminated structure with narrow slits formed by g-C3N4 and SnO2 nanoparticles. The corresponding pore size distributions of these three samples are shown in Figure 8b. It can be clearly seen that the pore diameters of SnO2 and SnO2/g-C3N4-10 are relatively small, and the majority concentrate upon about 2 nm according to the DFT method. The BET-calculated results show that the specific surface areas of g-C3N4, SnO2, and SnO2/g-C3N4-10 samples are 60.7 m2·g−1, 173.2 m2·g−1, and 140.0 m2·g−1, respectively. The high specific surface area could be in favor of enhancing gas-sensing properties.

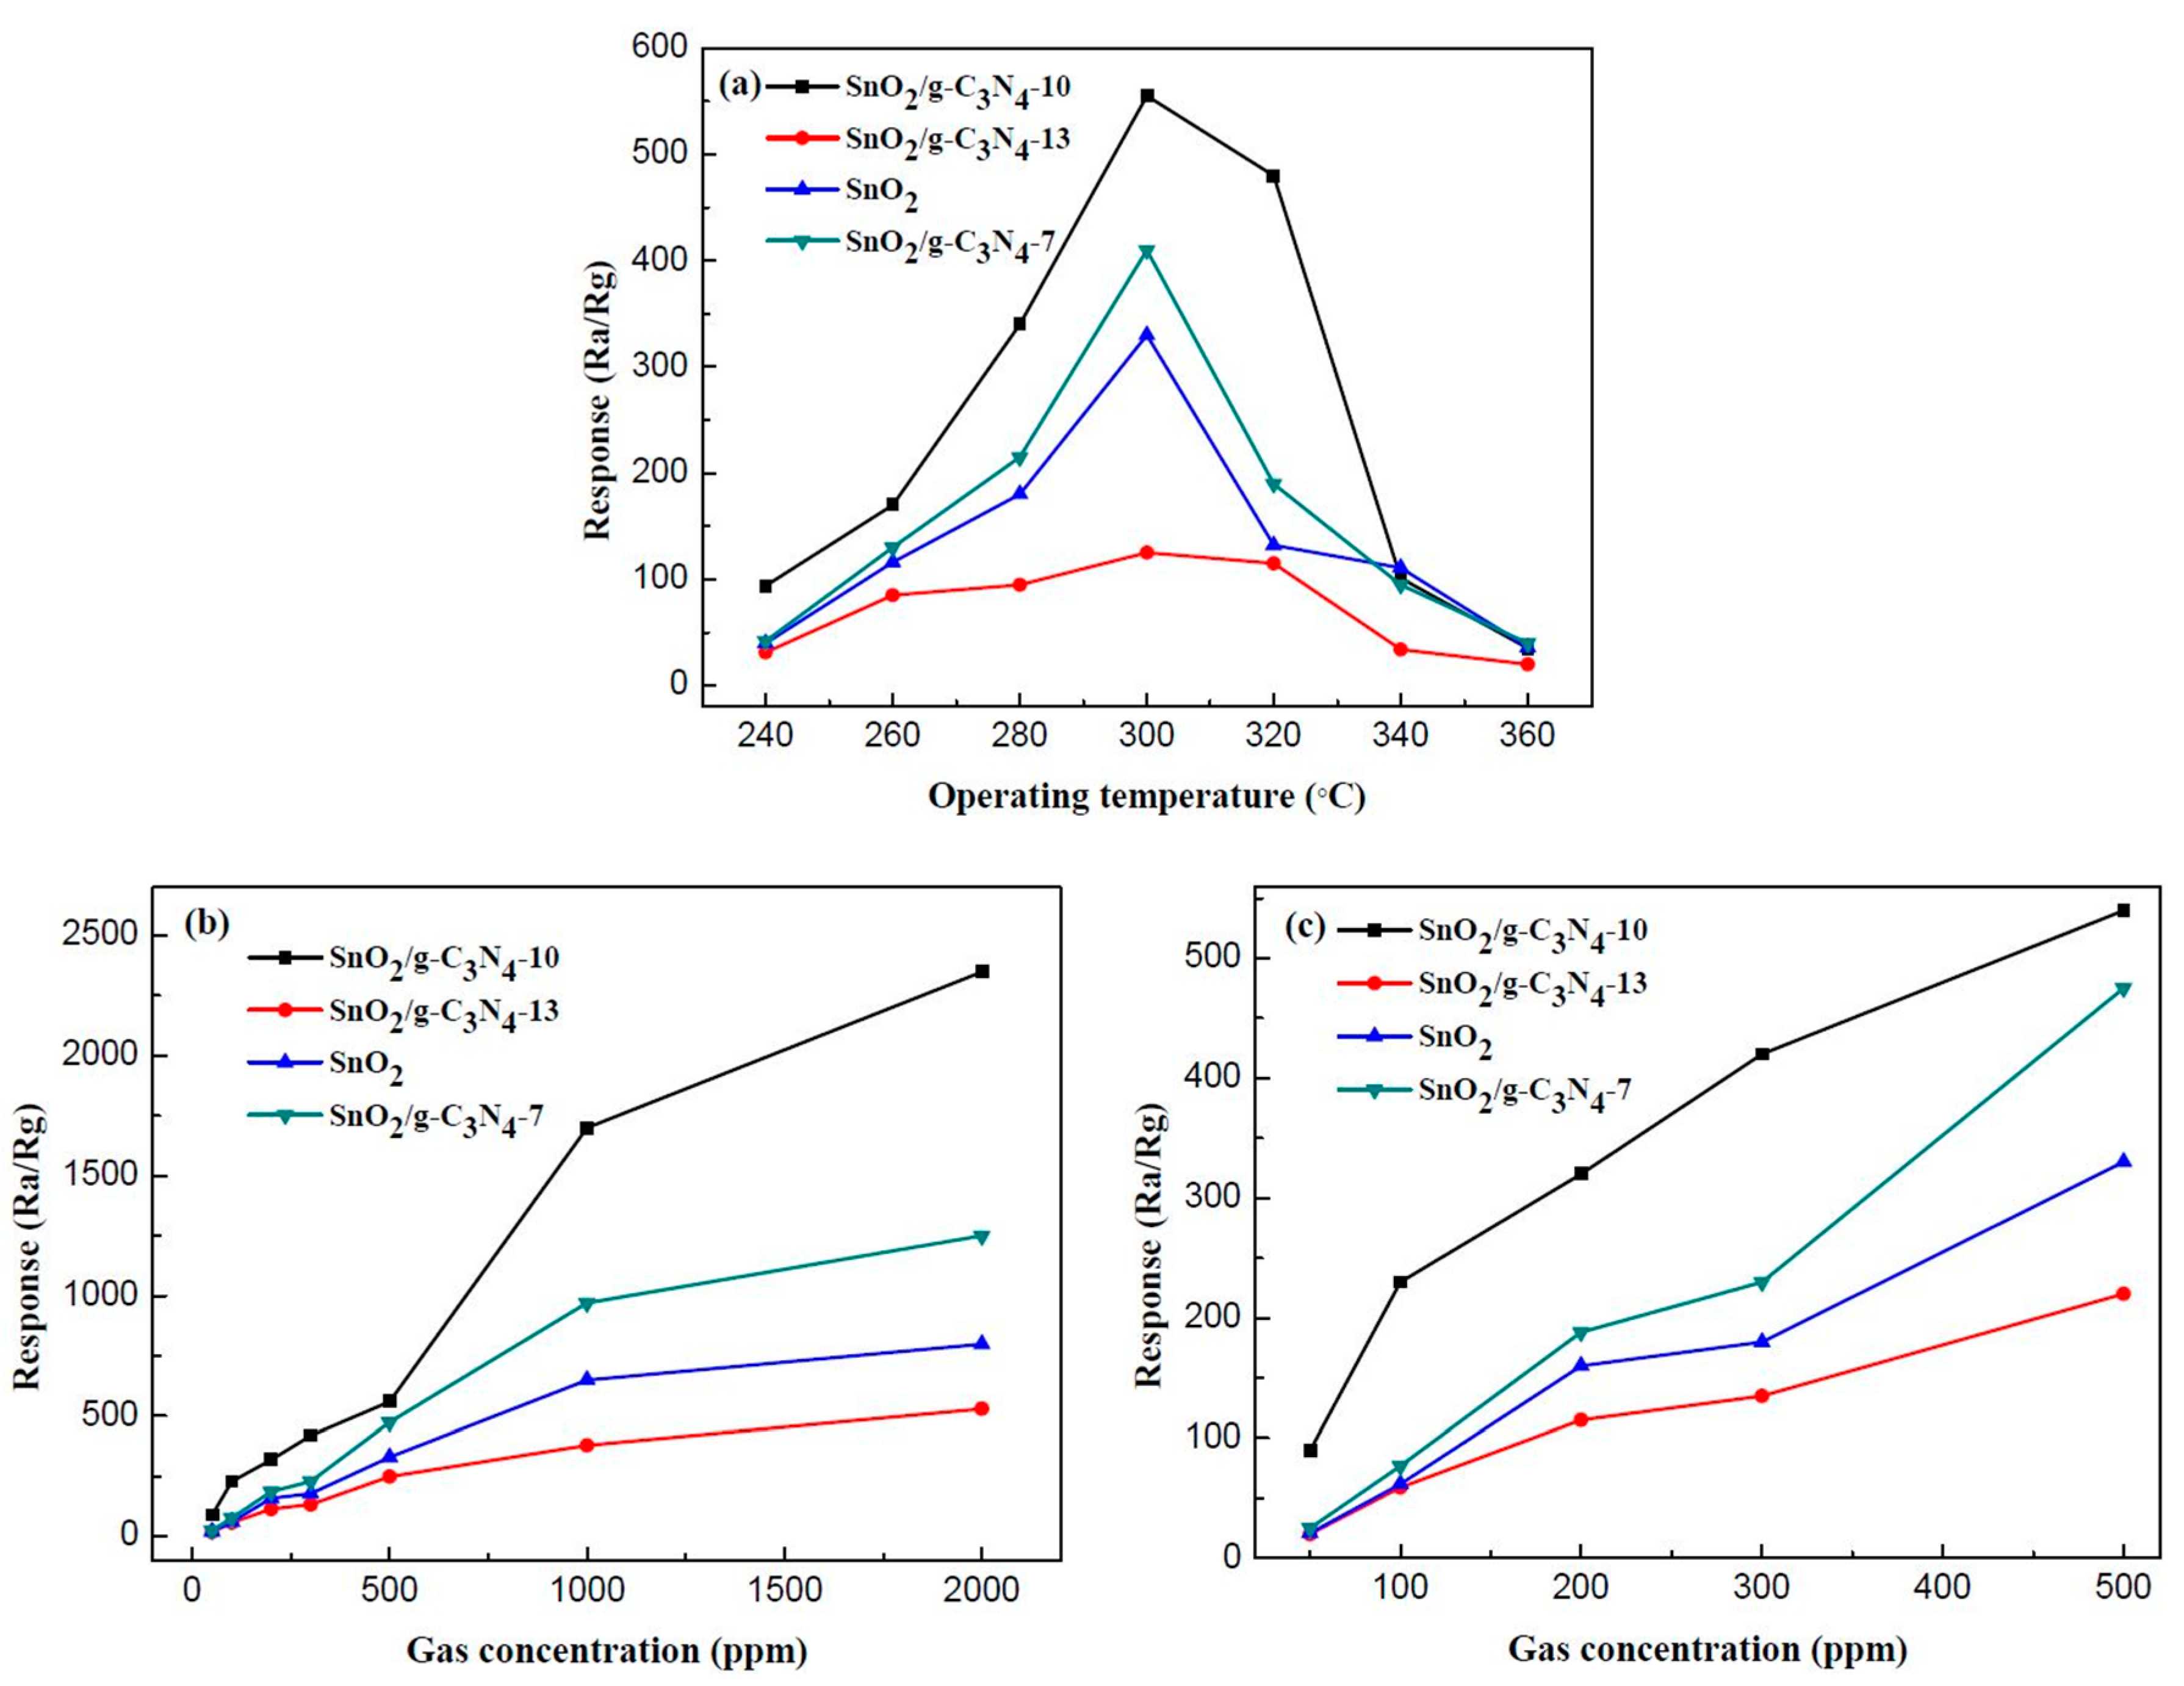
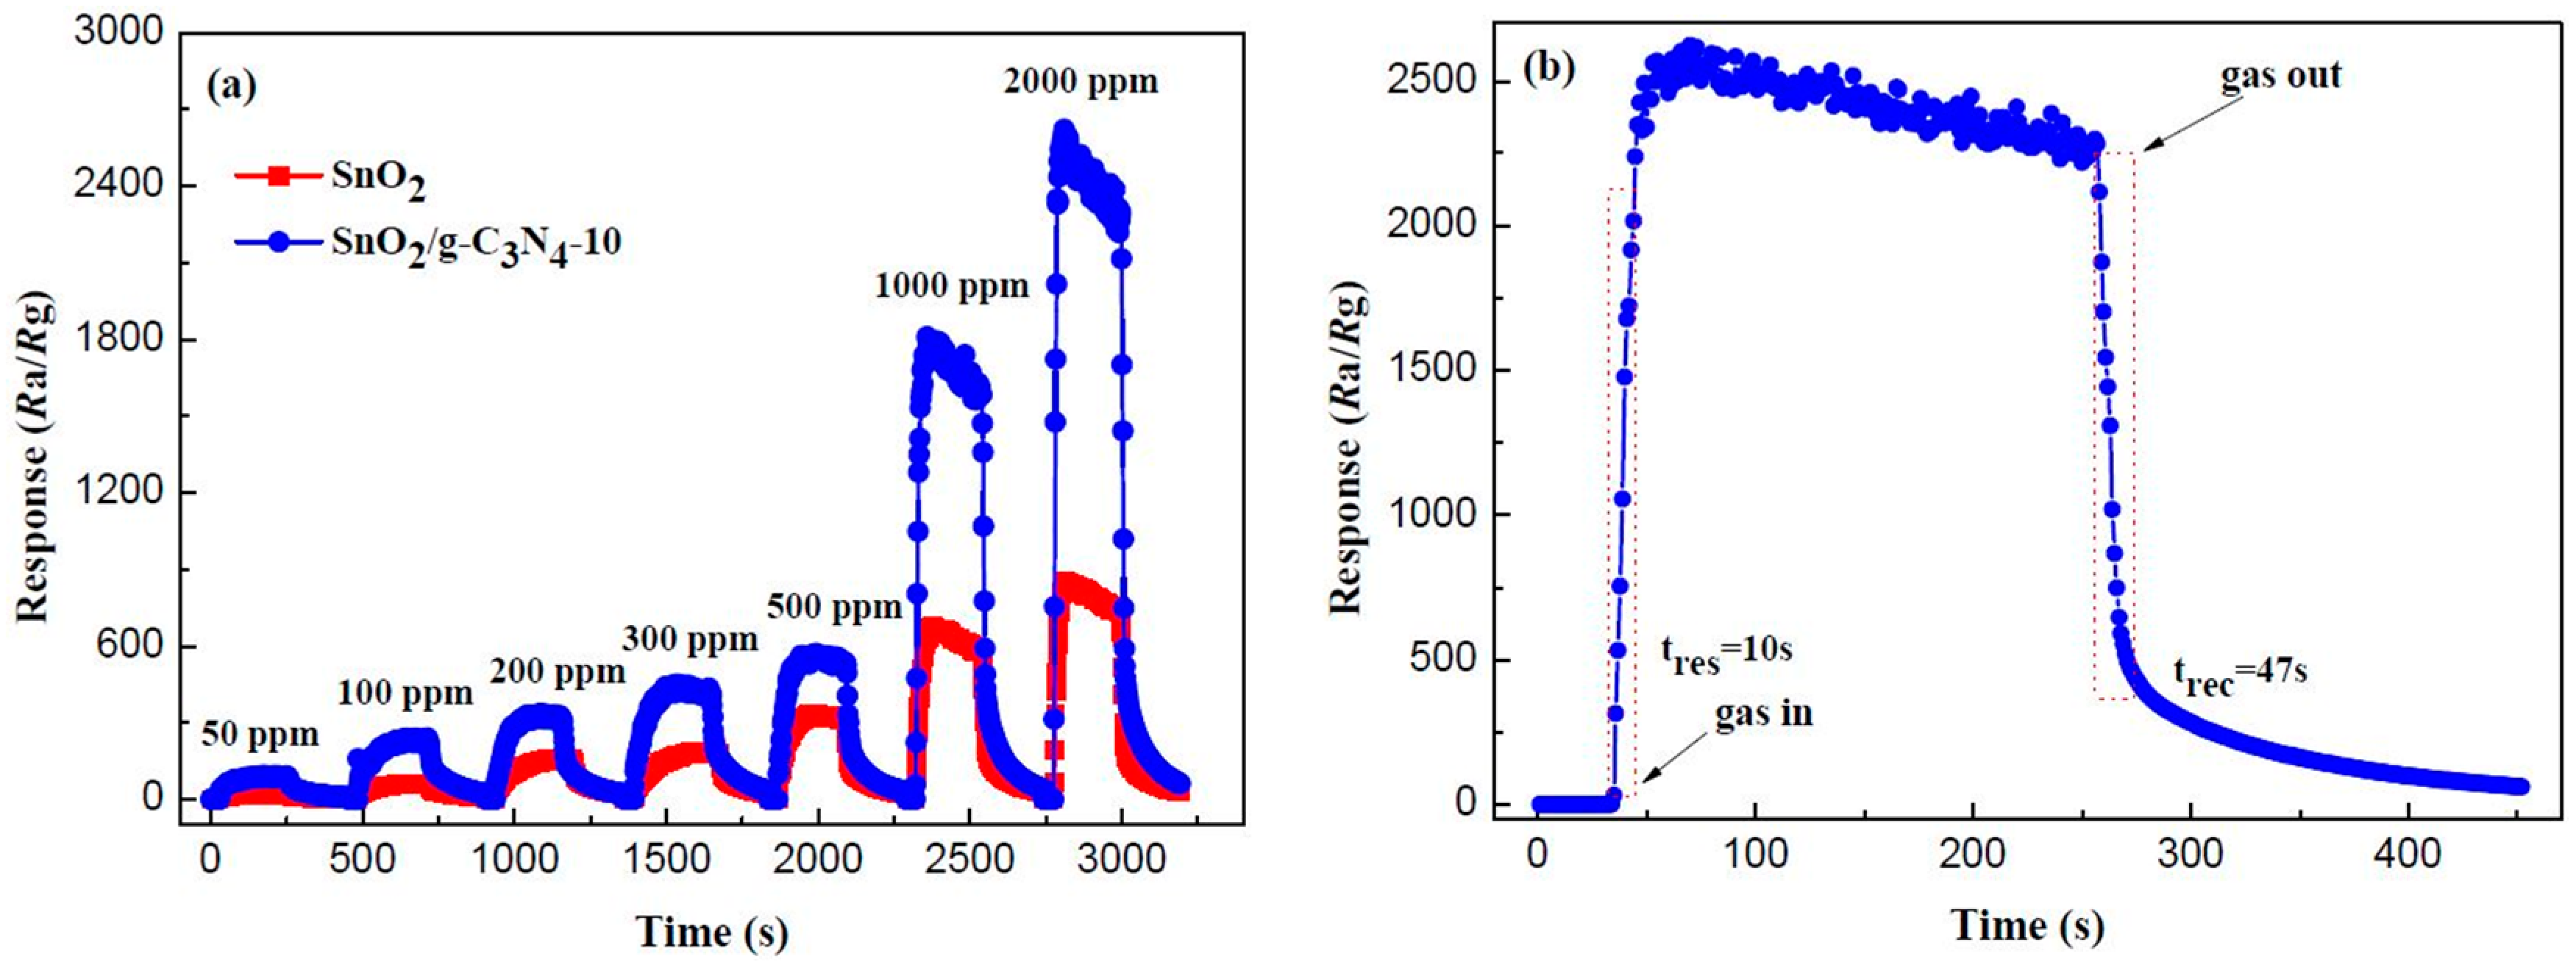
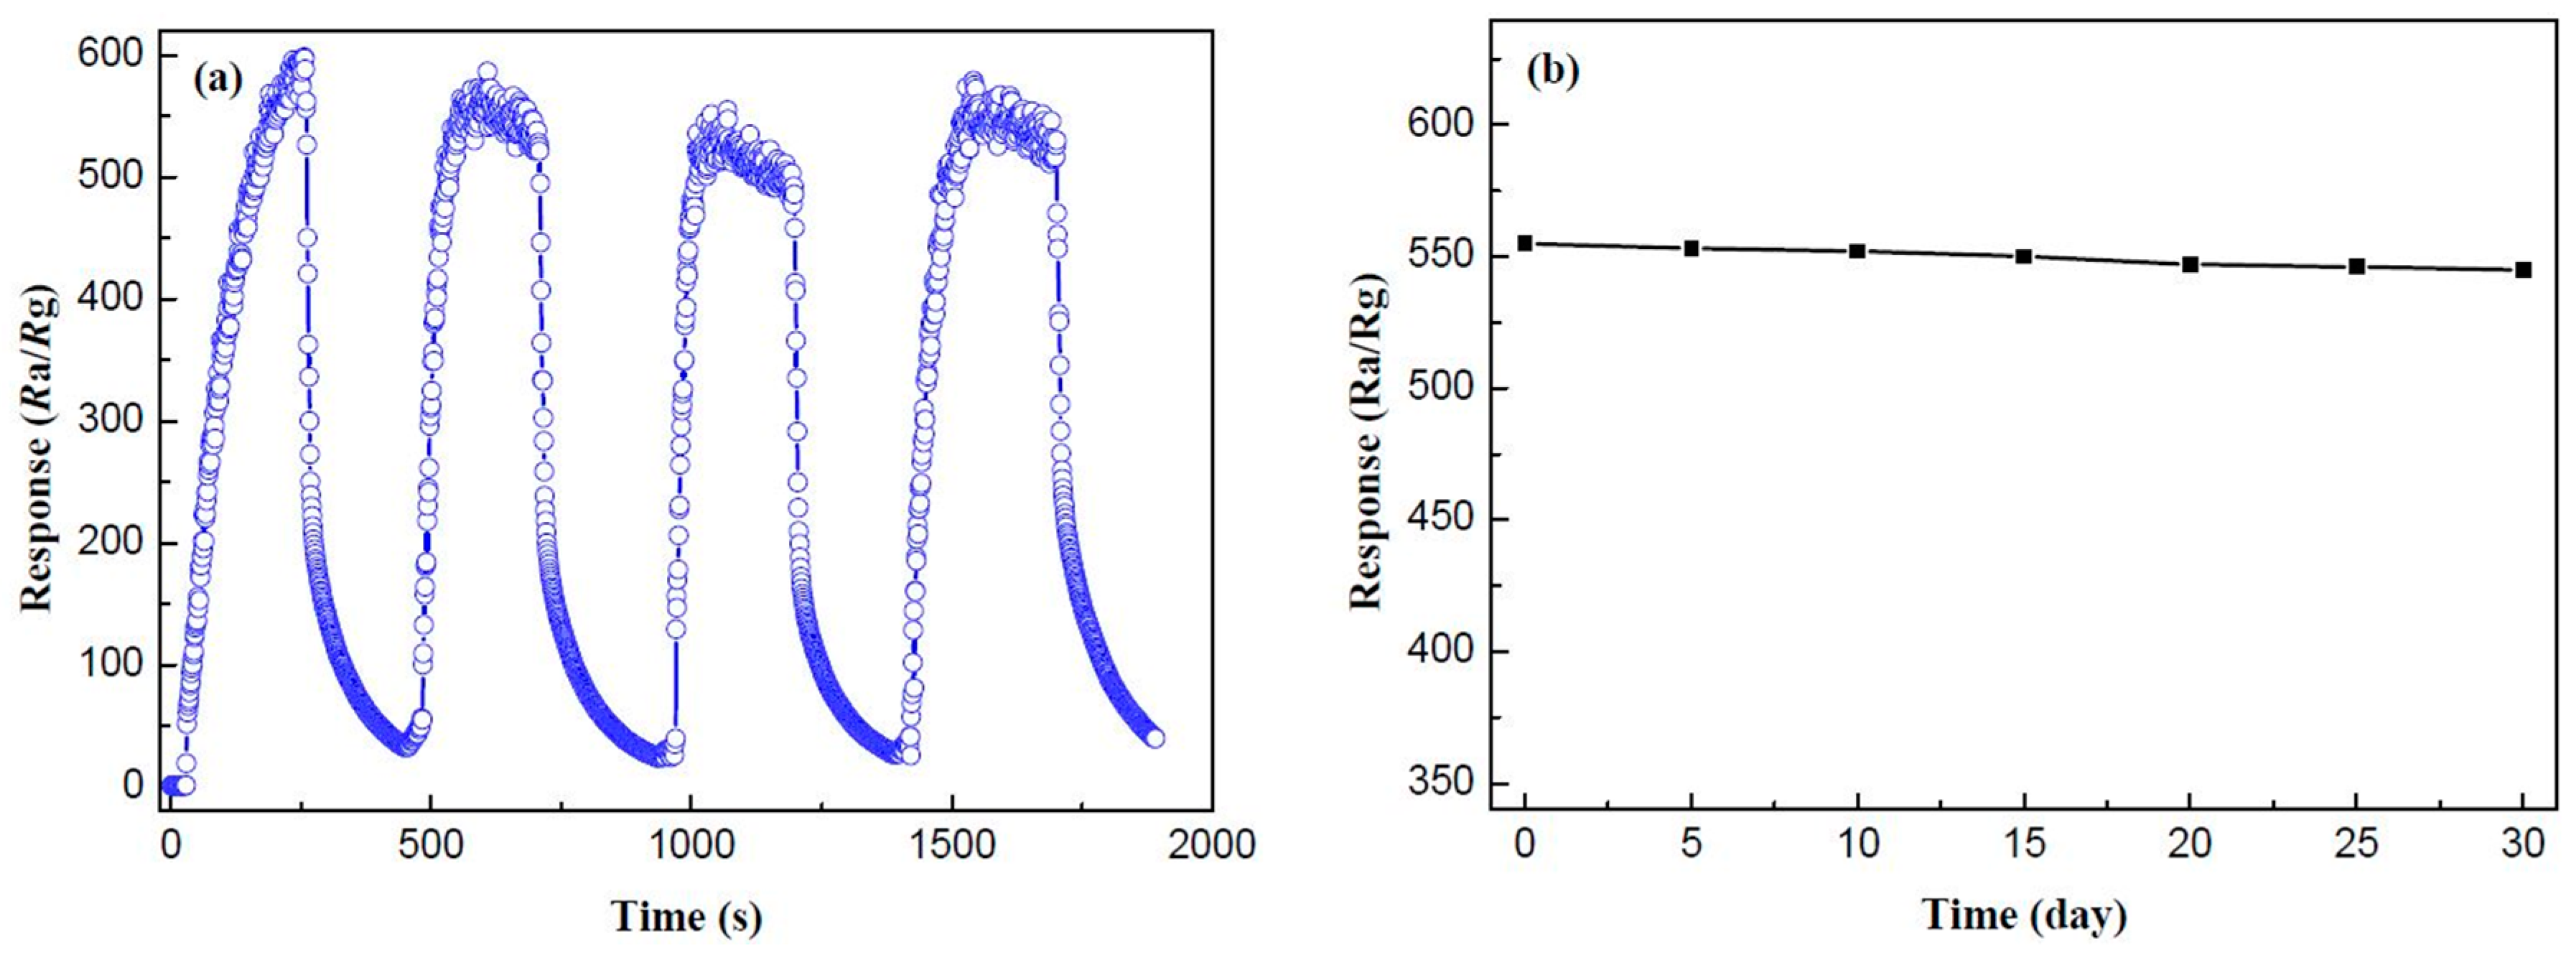
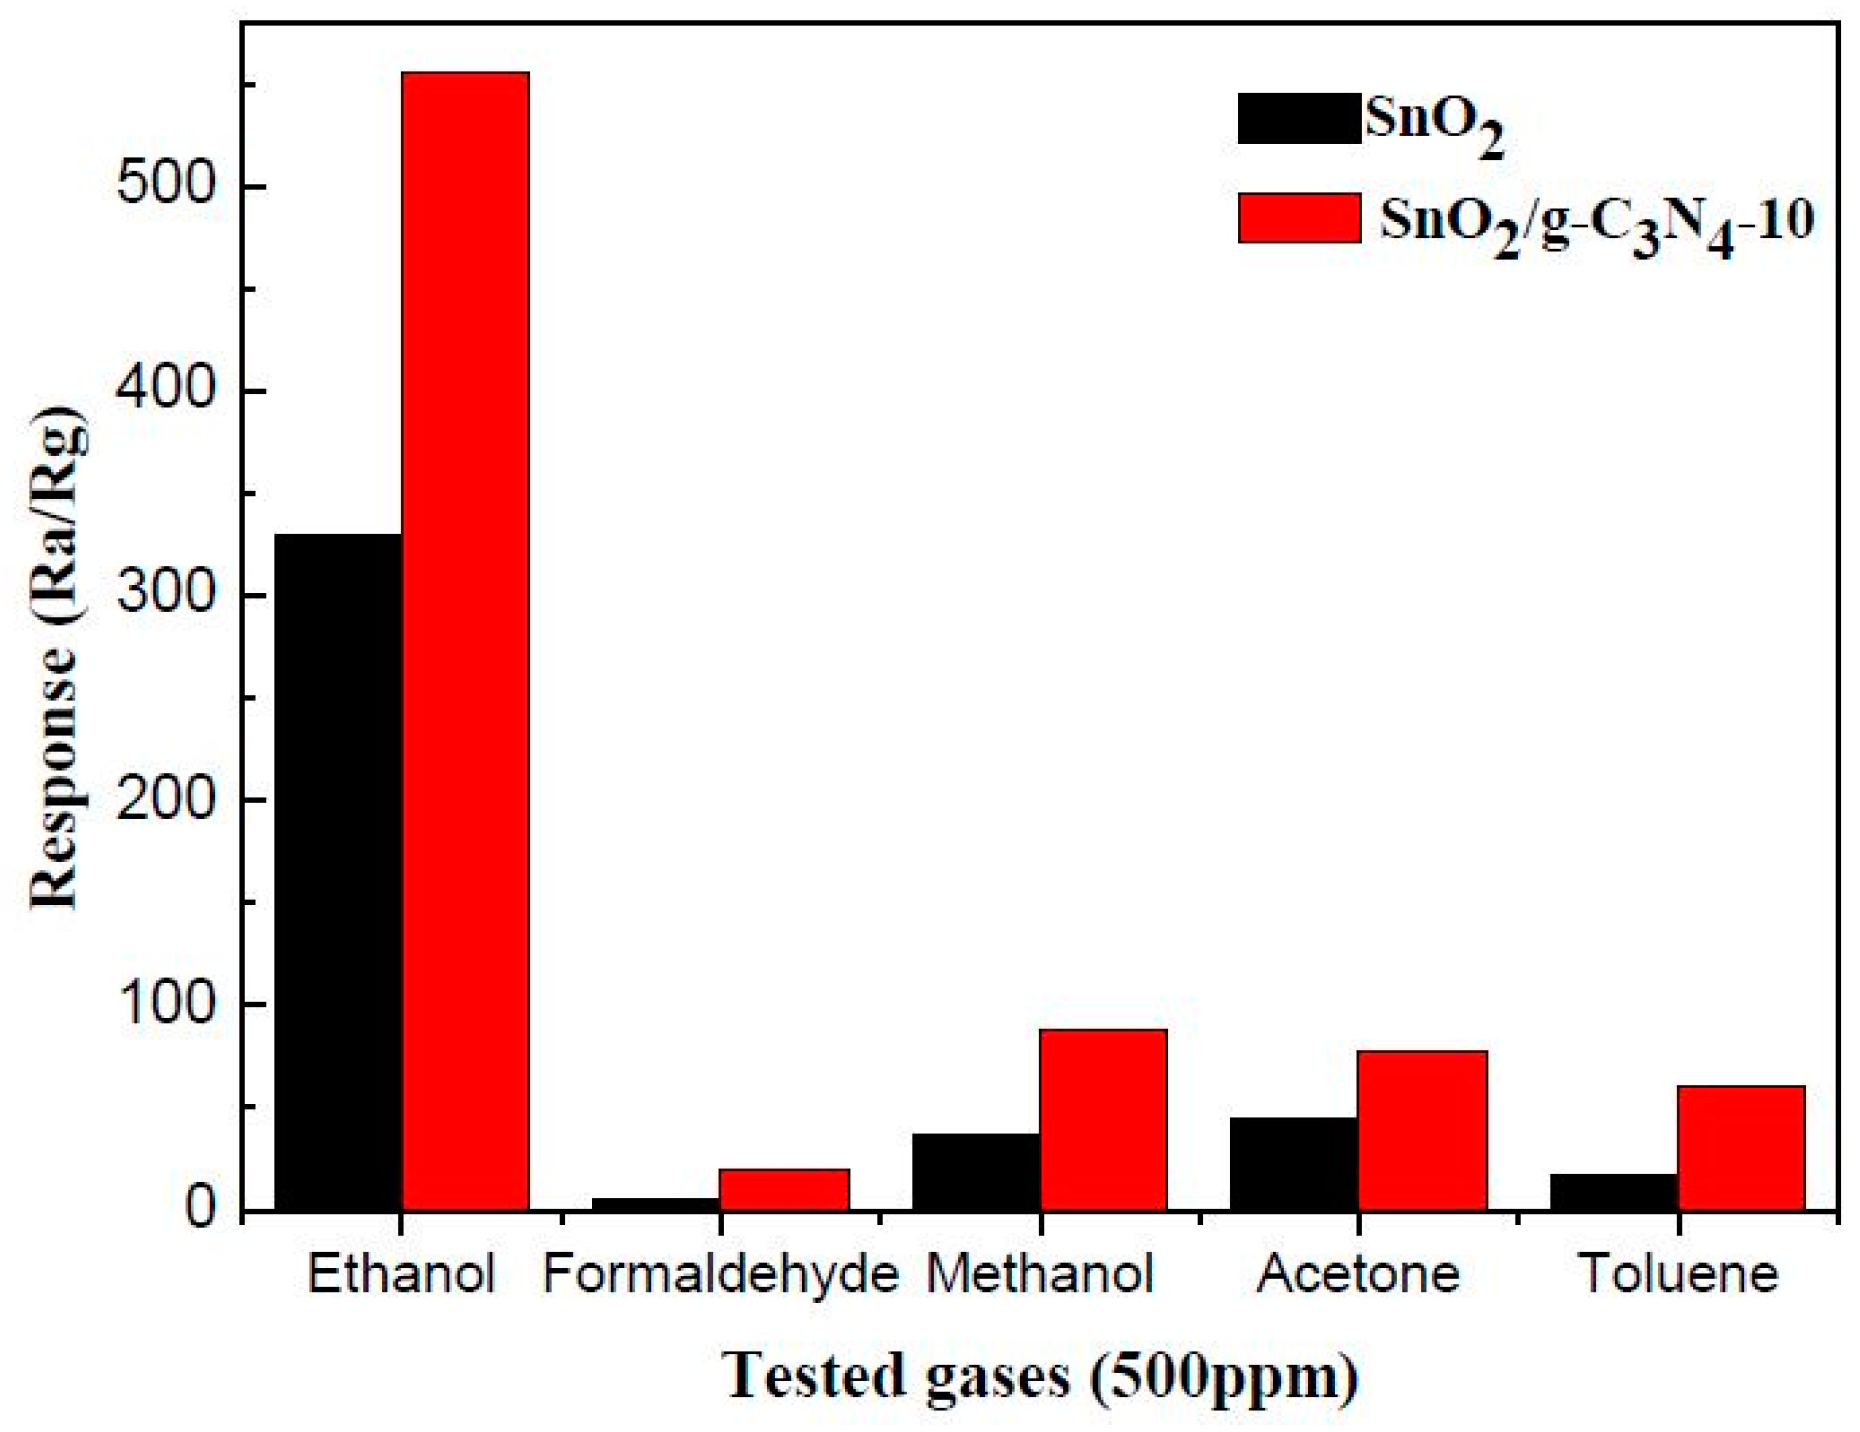
3.2. Gas-Sensing Property

The gas-sensing properties of the as-prepared samples to ethanol vapor were investigated, in detail. Figure 9a shows the response values of pure SnO2 and SnO2/g-C3N4-based sensors to 500 ppm of ethanol at different operating temperatures. It can be clearly observed that the response values increased with the increase of the operating temperature. However, the response values decrease when the temperature is above 300 °C. The maximum response of SnO2/g-C3N4-10 is Ra/Rg = 555 at 300 °C, which is much higher than that of the pure SnO2-based sensor. It reaches the maximum response when the mass percentage of g-C3N4 in the composites is 10%. From the curves, the response value of SnO2/g-C3N4-13 sample is lower than that of the pure SnO2-based sensor. The high content of g-C3N4 may lead to the connection of the g-C3N4 nanosheets, which could form the micro-electric bridges on the surface. The micro-electric bridges may result in the semiconductor’s resistance being reduced. Figure 9b,c display the response values of the four samples (SnO2, SnO2/g-C3N4-7, SnO2/g-C3N4-10, and SnO2/g-C3N4-13) at 300 °C to different concentrations of ethanol. As shown in the curves, the response values increased with increasing ethanol concentrations. The slope of the curves increased rapidly when the concentration range of ethanol was from 50 ppm to 500 ppm. However, it increased slowly with increasing concentrations in the range of 500–2000 ppm. It can be concluded that the adsorption to ethanol has approached saturation value when the concentration reaches 2000 ppm. To evaluate the gas-sensing performances of SnO2/g-C3N4 composite, the comparison between this work and other literature is summarized in Table 1. As can be observed, the SnO2/g-C3N4 composite exhibits superior performances compared with other SnO2-based sensors.
Figure 10a displays the real-time response curves of the pure SnO2 and SnO2/g-C3N4-10 to ethanol in the range of 50–2000 ppm at 300 °C. As shown in the curves, the response values of the both sensors increased with the increasing concentration of ethanol in the range of 50–2000 ppm. The response value of the SnO2/g-C3N4-10-based sensor is much higher than that of the pure SnO2-based sensor to the same concentration of ethanol. The response values of pure SnO2 and SnO2/g-C3N4-10 to 2000 ppm of ethanol are 800 and 2400, respectively. The response–recovery time curve of SnO2/g-C3N4-10 to 2000 ppm of ethanol is shown in Figure 10b. It can be clearly observed that the response increased and decreased promptly when the SnO2/g-C3N4-10-based sensor was exposed to and separated from ethanol, respectively. The response time and the recovery time are 10 s and 47 s, respectively. The relatively rapid response and recovery time could be due to the unique structure of the 2-D g-C3N4-supported SnO2 nanoparticles.
Repeatability and stability are both crucial influence factors of gas-sensing properties. Figure 11a reveals the repeatability of the SnO2/g-C3N4-10 sensor to 500 ppm of ethanol at 300 °C. As shown in the curves, the response values of the four response–recovery cycles are almost the same, namely 570, 565, 554, and 566, respectively. It can be concluded that the as-prepared SnO2/g-C3N4-10 sensor has an admirable repeatability for ethanol gas sensing. A durable response value was measured to explore the stability of the SnO2/g-C3N4-10 sensor. Figure 11b displays the test result for every five days, and the response values to 500 ppm of ethanol at 300 °C are maintained around 550. Hence, the conclusion may be drawn that the SnO2/g-C3N4-10-based sensor has an unexceptionable stability for ethanol gas sensing.
It is well known that selectivity is another key criteria for measuring the quality of gas sensors. Figure 12 shows the selectivity test results of the pure SnO2 and SnO2/g-C3N4-10 sensors to five different gases of 500 ppm, including methanol, ethanol, toluene, formaldehyde, and acetone. It can be seen that the SnO2/g-C3N4-10 sensor has a selectivity to ethanol superior to that of other gases compared to the pure SnO2 sensor at 300 °C. The higher response to ethanol may be because ethanol is more likely to lose electrons in the process of a redox reaction with the absorbed oxygen, and the hydroxyl group (–OH) is much easier to oxidize at the optimum operating temperature.
As is well known, SnO2 is a typical n-type metal oxide semiconductor, and there are several different types of gas-sensing mechanisms. Generally, the surface-controlled type can be used to explain the mechanism of the SnO2/g-C3N4 composite towards ethanol. The resistance changes when the sensor is exposed to different types of gases. When the sensor was exposed in air, oxygen molecules would adsorb on the surface of SnO2 and capture electrons from the conduction band of SnO2. Then, oxygen molecules were ionized to O2−, O, and O2, and the formation of depletion layers led to an increase in resistance of the composite sensor. However, when the sensor was exposed to the ethanol gas under high temperature, the ethanol molecules would react with oxygen ions absorbed on the surface of the sensor. As a result, the ethanol molecules were oxidized into acetaldehyde and eventually oxidized into carbon dioxide and water. The trapped electrons were released back to the depletion layer of the sensing film, resulting in a decrease in the resistance of the composite-based sensor, as is shown in Figure 13.
The SnO2/g-C3N4 composites exhibit better gas-sensing properties than pure SnO2 nanoparticles. In this nanocomposite, g-C3N4 served as a support and stuck to SnO2 nanoparticles. This support can prevent the aggregation of SnO2 nanoparticles. Consequently, this unique structure with large specific surface area is beneficial to the mass of oxygen molecules adsorbed on to the surface of SnO2 and to the adsorption and diffusion of ethanol molecules, leading to an enhanced reaction between ethanol gas molecules and oxygen anions. Beyond that, the improved gas-sensing performances may also be attributed to the heterojunction of the interface region between g-C3N4 and SnO2 and to the interactions between Sn and g-C3N4 verified in the XPS results. The electrical property at the heterojunction changes when ethanol gas molecules pass through the interface region between g-C3N4 and SnO2. Both SnO2 and g-C3N4 are n-type semiconductors. The band gaps are 3.71 eV and 2.7 eV, respectively. The conduction band level of g-C3N4 is more negative than that of SnO2. When SnO2 and g-C3N4 were combined, they formed a heterojunction structure. The electrons will inflow from the conduction band of g-C3N4 to the conduction band of SnO2, leading to a higher potential barrier. As a result, the electrons and holes are separated. Meanwhile, the heterojunction structure may suppress the recombination of the electron–hole pair and urge electrons to quickly transfer from the ethanol vapor to the surface of SnO2/g-C3N4. Therefore, this leads to a higher response because of the increased conductivity of the heterojunction structure [49].

4. Conclusions

In summary, we demonstrated an ethanol gas sensor based on a SnO2/g-C3N4 nanocomposite, which was synthesized by a facile solid-state method using a grinding treatment at room temperature. The SnO2 nanoparticles were highly distributed on the g-C3N4 sheets. The gas-sensing properties of the SnO2/g-C3N4 nanocomposite-based sensors exhibited enhanced gas-sensing properties compared to pure SnO2, including sensitivity and selectivity. The ameliorative sensitivity may be due to the large specific surface area and the interaction between 2-D g-C3N4 and SnO2 nanoparticles. As a result, the SnO2/g-C3N4 nanocomposite is a promising candidate for high-performance ethanol gas-sensing application.

Acknowledgments

This work was supported by grants from NSFC (Project No. 51404097, 51504083, U1404613), Natural Science Foundation of Henan Province of China (162300410113), Program for Science & Technology Innovation Talents in Universities of Henan Province (17HASTIT029), the Research Foundation for Youth Scholars of Higher Education of Henan Province (2016GGJS-040), Program for Innovative Research Team in University of Ministry of Education of China (IRT_16R22), the Fundamental Research Funds for the Universities of Henan Province (NSFRF1614, NSFRF1606), Program for Innovative Research Team (in Science and Technology) in the University of Henan Province (16IRTSTHN005) and Foundation for Distinguished Young Scientists of Henan Polytechnic University (J2016-2, J2017-3).

Author Contributions

Jianliang Cao, Cong Qin, Huoli Zhang and Zhanying Zhang performed the experiments and analyzed the data; Yan Wang and Guang Sun provided the concept of this research and managed the writing process as the corresponding author.

Conflicts of Interest

The authors declare no conflict of interest.

References

  1. Hou, C.; Li, J.; Huo, D.; Luo, X.; Dong, J.; Yang, M.; Shi, X. A portable embedded toxic gas detection device based on a cross-responsive sensor array. Sens. Actuators B Chem. 2012, 161, 244–250. [Google Scholar] [CrossRef]
  2. Bessac, B.F.; Jordt, S.E. Sensory detection and responses to toxic gases: Mechanisms, health effects, and countermeasures. Proc. Am. Thorac. Soc. 2010, 7, 269–277. [Google Scholar] [CrossRef] [PubMed]
  3. Lim, S.H.; Feng, L.; Kemling, J.W.; Musto, C.J.; Suslick, K.S. An optoelectronic nose for the detection of toxic gases. Nat. Chem. 2009, 1, 562–567. [Google Scholar] [CrossRef] [PubMed]
  4. Schedin, F.; Geim, A.K.; Morozov, S.V.; Hill, E.W.; Blake, P.; Katsnelson, M.I.; Novoselov, K.S. Detection of individual gas molecules adsorbed on graphene. Nat. Mater. 2007, 6, 652–655. [Google Scholar] [CrossRef] [PubMed]
  5. Ariyageadsakul, P.; Vchirawongkwin, V.; Kritayakornupong, C. Determination of toxic carbonyl species including acetone, formaldehyde, and phosgene by polyaniline emeraldine gas sensor using DFT calculation. Sens. Actuators B Chem. 2016, 232, 165–174. [Google Scholar] [CrossRef]
  6. Comini, E. Metal oxide nano-crystals for gas sensing. Anal. Chim. Acta 2006, 568, 28–40. [Google Scholar] [CrossRef] [PubMed]
  7. Sim, G.; Qi, F.; Zhang, S.; Li, Y.; Wang, Y.; Cao, J.; Bala, H.; Wang, X.; Jia, T.; Zhang, Z. Synthesis and enhanced gas sensing properties of flower-like SnO2 hierarchical structures decorated with discrete ZnO nanoparticles. J. Alloys Compd. 2014, 617, 192–199. [Google Scholar]
  8. Comini, E. Integration of metal oxide nanowires in flexible gas sensing devices. Sensors 2013, 13, 10659–10673. [Google Scholar] [CrossRef] [PubMed]
  9. Bhuvaneshwari, S.; Gopalakrishnan, N. Hydrothermally synthesized Copper Oxide (CuO) superstructures for ammonia sensing. J. Colloid Interface Sci. 2016, 480, 76–84. [Google Scholar] [CrossRef] [PubMed]
  10. Liang, S.; Zhu, J.; Wang, C.; Yu, S.; Bi, H.; Liu, X.; Wang, X. Fabrication of α-Fe2O3@graphene nanostructures for enhanced gas-sensing property to ethanol. Appl. Surf. Sci. 2014, 292, 278–284. [Google Scholar] [CrossRef]
  11. Deng, S.; Liu, X.; Chen, N.; Deng, D.; Xiao, X.; Wang, Y. A highly sensitive VOC gas sensor using p-type mesoporous Co3O4 nanosheets prepared by a facile chemical coprecipitation method. Sens. Actuators B Chem. 2016, 233, 615–623. [Google Scholar] [CrossRef]
  12. Yang, C.; Deng, W.; Liu, H.; Ge, S.; Yan, M. Turn-on fluorescence sensor for glutathione in aqueous solutions using carbon dots-MnO2 nanocomposites. Sens. Actuators B Chem. 2015, 216, 286–292. [Google Scholar] [CrossRef]
  13. An, X.; Yu, J.C.; Wang, Y.; Hu, Y.; Yu, X.; Zhang, G. WO3 nanorods/graphene nanocomposites for high-efficiency visible-light-driven photocatalysis and NO2 gas sensing. J. Mater. Chem. 2012, 22, 8525–8531. [Google Scholar] [CrossRef]
  14. Xue, P.; Yang, X.; Lai, X.; Xia, W.; Li, P.; Fang, J. Controlling synthesis and gas-sensing properties of ordered mesoporous In2O3-reduced graphene oxide (rGO) nanocomposite. Sci. Bull. 2015, 60, 1348–1354. [Google Scholar] [CrossRef]
  15. Lin, L.; Liu, T.; Yu, W.; Guo, Z.; Zeng, W. Synthesis of multifarious hierarchical flower-like NiO and their gas-sensing properties. Mater. Res. Bull. 2013, 48, 2730–2736. [Google Scholar] [CrossRef]
  16. Mishra, Y.K.; Modi, G.; Cretu, V.; Postica, V.; Lupan, O.; Reimer, T.; Paulowicz, T.; Hrkac, V.; Benecke, W.; Kienle, L.; et al. Direct growth of freestanding ZnO tetrapod networks for multifunctional applications in photocatalysis, UV photodetection, and gas sensing. ACS Appl. Mater. Interfaces 2015, 7, 14303–14316. [Google Scholar] [CrossRef] [PubMed]
  17. Postica, V.; Gröttrup, J.; Adelung, R.; Lupan, O.; Mishra, A.K.; Leeuw, N.H.; Ababii, N.; Carreira, J.F.C.; Rodrigues, J.; Sedrine, N.B.; et al. Multifunctional materials: A case study of the effects of metal doping on ZnO Tetrapods with Bismuth and Tin Oxides. Adv. Funct. Mater. 2016. [Google Scholar] [CrossRef]
  18. Tiginyanu, I.; Ghimpu, L.; Gröttrup, J.; Postolache, V.; Mecklenburg, M.; Stevens-Kalceff, M.A.; Ursaki, V.; Payami, N.; Feidenhansl, R.; Schulte, K.; et al. Strong light scattering and broadband (UV to IR) photoabsorption in stretchable 3D hybrid architectures based on Aerographite decorated by ZnO nanocrystallites. Sci. Rep. 2016. [Google Scholar] [CrossRef] [PubMed]
  19. Zhang, M.; Zhen, Y.; Sun, F.; Xu, C. Hydrothermally synthesized SnO2-graphene composites for H2 sensing at low operating temperature. Mater. Sci. Eng. B 2016, 209, 37–44. [Google Scholar] [CrossRef]
  20. Liu, S.; Wang, Z.; Zhang, Y.; Li, J.; Zhang, T. Sulfonated graphene anchored with tin oxide nanoparticles for detection of nitrogen dioxide at room temperature with enhanced sensing performances. Sens. Actuators B Chem. 2016, 228, 134–143. [Google Scholar] [CrossRef]
  21. Xiao, Y.; Yang, Q.; Wang, Z.; Zhang, R.; Gao, Y.; Sun, P.; Sun, Y.; Lu, G. Improvement of NO2 gas sensing performance based on discoid tin oxide modified by reduced graphene oxide. Sens. Actuators B Chem. 2016, 227, 419–426. [Google Scholar] [CrossRef]
  22. Zhang, D.; Chang, H.; Li, P.; Liu, R. Characterization of nickel oxide decorated-reduced graphene oxide nanocomposite and its sensing properties toward methane gas detection. J. Mater. Sci. Mater. Electron. 2016, 27, 3723–3730. [Google Scholar] [CrossRef]
  23. Guo, D.; Cai, P.; Sun, J.; He, W.; Wu, X.; Zhang, T.; Wang, X.; Zhang, X. Reduced-graphene-oxide/metal-oxide p-n heterojunction aerogels as efficient 3D sensing frameworks for phenol detection. Carbon 2016, 99, 571–578. [Google Scholar] [CrossRef]
  24. Latif, U.; Dickert, F.L. Graphene hybrid materials in gas sensing applications. Sensor 2015, 15, 30504–30524. [Google Scholar] [CrossRef] [PubMed]
  25. Yi, Y.; Zhu, G.; Sun, H.; Sun, J.; Wu, X. Nitrogen-doped hollow carbon spheres wrapped with graphene nanostructure for highly sensitive electrochemical sensing of parachlorophenol. Biosens. Bioelectron. 2016, 86, 62–67. [Google Scholar] [CrossRef] [PubMed]
  26. Ma, C.; Shao, X.; Cao, D. Nitrogen-doped graphene as an excellent candidate for selective gas sensing. Sci. China Chem. 2014, 57, 911–917. [Google Scholar] [CrossRef]
  27. Omidvar, A.; Mohajeri, A. Promotional effect of the electron donating functional groups on the gas sensing properties of graphene nanoflakes. RSC Adv. 2015, 5, 54535–54543. [Google Scholar] [CrossRef]
  28. Song, J.; Lin, Y.; Kan, K.; Wang, J.; Liu, S.; Li, L.; Shi, K. Enhanced NOx gas sensing performance based on indium-doped Co(OH)2 nanowire–graphene nanohybrids. NANO 2015, 10, 1550079. [Google Scholar] [CrossRef]
  29. Assar, M.; Karimzadeh, R. Enhancement of methane gas sensing characteristics of graphene oxide sensor by heat treatment and laser irradiation. J. Colloid Interface Sci. 2016, 483, 275–280. [Google Scholar] [CrossRef] [PubMed]
  30. Zhang, S.L.; Yue, H.; Liang, X.; Yang, W.C. Liquid-phase Co-exfoliated graphene/MoS2 nanocomposite for methanol gas sensing. J. Nanosci. Nanotechnol. 2015, 15, 8004–8009. [Google Scholar] [CrossRef] [PubMed]
  31. Srivastava, V.; Jain, K. At room temperature graphene/SnO2 is better than MWCNT/SnO2 as NO2 gas sensor. Mater. Lett. 2016, 169, 28–32. [Google Scholar] [CrossRef]
  32. Farid, M.M.; Goudini, L.; Piri, F.; Zamani, A.; Saadati, F. Molecular imprinting method for fabricating novel glucose sensor: Polyvinyl acetate electrode reinforced by MnO2/CuO loaded on graphene oxide nanoparticles. Food. Chem. 2016, 194, 61–67. [Google Scholar] [CrossRef] [PubMed]
  33. Song, Z.; Wei, Z.; Wang, B.; Luo, Z.; Xu, S.; Zhang, W.; Yu, H.; Li, M.; Huang, Z.; Zang, J.; et al. Sensitive room-temperature H2S gas sensors employing SnO2 quantum wire/reduced graphene oxide nanocomposites. Chem. Mater. 2016, 28, 1205–1212. [Google Scholar] [CrossRef]
  34. Mao, S.; Cui, S.; Lu, G.; Yu, K.; Wen, Z.; Chen, J. Tuning gas-sensing properties of reduced graphene oxide using tin oxide nanocrystals. J. Mater. Chem. 2012, 22, 11009–11013. [Google Scholar] [CrossRef]
  35. Zhang, H.; Feng, J.; Fei, T.; Liu, S.; Zhang, T. SnO2 nanoparticles-reduced graphene oxide nanocomposites for NO2 sensing at low operating temperature. Sens. Actuators B Chem. 2014, 190, 472–478. [Google Scholar] [CrossRef]
  36. Zhang, D.; Liu, A.; Chang, H.; Xia, B. Room-temperature high-performance acetone gas sensor based on hydrothermal synthesized SnO2-reduced graphene oxide hybrid composite. RSC Adv. 2015, 5, 3016–3022. [Google Scholar] [CrossRef]
  37. Zhang, D.; Liu, J.; Chang, H.; Liu, A.; Xia, B. Characterization of a hybrid composite of SnO2 nanocrystal-decorated reduced graphene oxide for ppm-level ethanol gas sensing application. RSC Adv. 2015, 5, 18666–18672. [Google Scholar] [CrossRef]
  38. She, X.; Xu, H.; Wang, H.; Xia, J.; Song, Y.; Yan, J.; Xu, Y.; Zhang, Q.; Du, D.; Li, H. Controllable synthesis of CeO2/g-C3N4 composites and their applications in the environment. Dalton Trans. 2015, 44, 7021–7031. [Google Scholar] [CrossRef] [PubMed]
  39. Dai, H.; Zhang, S.; Xu, G.; Peng, Y.; Gong, L.; Li, X.; Li, Y.; Lin, Y.; Chen, G. Highly photoactive heterojunction based on g-C3N4 nanosheets decorated with dendritic zinc (II) phthalocyanine through axial coordination and its ultrasensitive enzyme-free sensing of choline. RSC Adv. 2014, 4, 58226–58230. [Google Scholar] [CrossRef]
  40. Shao, L.; Jiang, D.; Xiao, P.; Zhu, L.; Meng, S.; Chen, M. Enhancement of g-C3N4 nanosheets photocatalysis by synergistic interaction of ZnS microsphere and R-GO inducing multistep charge transfer. Appl. Catal. B 2016, 198, 200–210. [Google Scholar] [CrossRef]
  41. Mamba, G.; Mishra, A.K. Graphitic carbon nitride (g-C3N4) nanocomposites: A new and exciting generation of visible light driven photocatalysts for environmental pollution remediation. Appl. Catal. B Environ. 2016, 198, 347–377. [Google Scholar] [CrossRef]
  42. Zeng, B.; Zhang, L.; Wan, X.; Song, H.; Lv, Y. Fabrication of α-Fe2O3/g-C3N4 composites for cataluminescence sensing of H2S. Sens. Actuators B Chem. 2015, 211, 370–376. [Google Scholar] [CrossRef]
  43. Cao, J.; Gong, Y.; Wang, Y.; Zhang, B.; Zhang, H.; Sun, G.; Bala, H.; Zhang, Z. Cocoon-like ZnO decorated graphitic carbon nitride nanocomposite: Hydrothermal synthesis and ethanol gas sensing application. Mater. Lett. 2017, 198, 76–80. [Google Scholar] [CrossRef]
  44. Sun, G.; Chen, H.; Li, Y.; Ma, G.; Zhang, S.; Jia, T.; Cao, J.; Wang, X.; Bala, H.; Zhang, Z. Synthesis and triethylamine sensing properties of mesoporous α-Fe2O microrods. Mater. Lett. 2016, 178, 213–216. [Google Scholar] [CrossRef]
  45. Zito, C.A.; Perfecto, T.M.; Volanti, D.P. Impact of reduced graphene oxide on the ethanol sensing performance of hollow SnO2 nanoparticles under humid atmosphere. Sens. Actuators B Chem. 2017, 244, 466–474. [Google Scholar] [CrossRef]
  46. Li, Z.; Yi, J. Enhanced ethanol sensing of Ni-doped SnO2 hollow spheres synthesized by a one-pot hydrothermal method. Sens. Actuators B Chem. 2017, 243, 96–103. [Google Scholar] [CrossRef]
  47. Choi, K.S.; Park, S.; Chang, S.P. Enhanced ethanol sensing properties based on SnO2 nanowires coated with Fe2O3 nanoparticles. Sens. Actuators B Chem. 2017, 238, 871–879. [Google Scholar] [CrossRef]
  48. Guo, J.; Zhang, J.; Gong, H.; Ju, D.; Cao, B. Au nanoparticle-functionalized 3D SnO2 microstructures for high performance gas sensor. Sens. Actuators B Chem. 2016, 226, 266–272. [Google Scholar] [CrossRef]
  49. Zang, Y.; Li, L.; Li, X.; Lin, R.; Li, G. Synergistic collaboration of g-C3N4/SnO2 composites for enhanced visible-light photocatalytic activity. Chem. Eng. J. 2014, 246, 277–286. [Google Scholar] [CrossRef]
Figure 1. The appearance diagram (a) and the internal structure diagram (b) of the CGS-4TPS gas-sensing test system, and the structure of the gas sensor substrate (c).
Materials 10 00604 g001
Figure 2. X-ray diffraction (XRD) patterns of the graphitic carbon nitride (g-C3N4), SnO2, and SnO2/g-C3N4 nanocomposites with different g-C3N4 contents.
Materials 10 00604 g002
Figure 3. X-ray photoelectron spectroscopy (XPS) survey of g-C3N4, SnO2, and SnO2/g-C3N4-10 samples: (a) the general scan spectrum; (b) Sn 3d spectrum; (c) O 1s spectrum; (d) C 1s spectrum; and (e) N 1s spectrum.
Materials 10 00604 g003
Figure 4. Thermogravimetry–differential thermal analysis (TG–DTA) profiles of g-C3N4.
Materials 10 00604 g004
Figure 5. Scanning electron microscope (SEM) images of (a) g-C3N4; (b) SnO2; and (c) SnO2/g-C3N4-10 samples.
Materials 10 00604 g005
Figure 6. Energy dispersive spectrometer (EDS) spectra (a) and SEM image (b) of the SnO2/g-C3N4-10 nanocomposite, and EDS mappings of the Sn (c), O (d), C (e), and N (f) element related to (b).
Materials 10 00604 g006aMaterials 10 00604 g006b
Figure 7. Transmission electron microscopy (TEM) images of (a) g-C3N4; (b) SnO2; and (c) SnO2/g-C3N4-10; and (d) HRTEM image of the SnO2/g-C3N4-10 composite.
Materials 10 00604 g007
Figure 8. (a) N2 adsorption–desorption isotherms and (b) the corresponding pore size distribution curves of the g-C3N4, SnO2, and SnO2/g-C3N4-10 samples. The dV/dD value was shifted by 0.05 and 0.1 units for the curves of data sets SnO2/g-C3N4-10 and SnO2, respectively.
Materials 10 00604 g008
Figure 9. (a) Response values of the sensors based on SnO2, SnO2/g-C3N4-7, SnO2/g-C3N4-10, and SnO2/g-C3N4-13 to 500 ppm of ethanol as a function of operating temperature; (b,c) the responses of sensors (SnO2, SnO2/g-C3N4-7, SnO2/g-C3N4-10, and SnO2/g-C3N4-13) operated at 300 °C versus different concentrations of ethanol.
Materials 10 00604 g009
Figure 10. (a) Real-time response curves of pure SnO2 and SnO2/g-C3N4-10 to ethanol in the range of 500–2000 ppm, and (b) response–recovery curve of SnO2/g-C3N4-10 to 2000 ppm of ethanol.
Materials 10 00604 g010
Figure 11. (a) Repeatability and (b) stability measurements of the SnO2/g-C3N4-10 sensors to 500 ppm of ethanol at 300 °C.
Materials 10 00604 g011
Figure 12. Responses of SnO2 and SnO2/g-C3N4-10-based sensors to 500 ppm of different reducing gases at 300 °C.
Materials 10 00604 g012
Figure 13. Schematic diagram of test gas reaction with the as-prepared nanocomposite.
Materials 10 00604 g013
Table 1. Comparison of the performance of various SnO2-based gas sensors toward ethanol.
Sensing MaterialsEthanol Concentration (ppm)Temperature (°C)Response (Ra/Rg)Reference
RGO-SnO210030070[45]
Ni-doped SnO210026030[46]
Fe2O3/SnO210030030[47]
Au/SnO215034030[48]
SnO2/g-C3N4-10100300230this work

