
Transport in Proton Exchange Membranes for Fuel Cell Applications—A Systematic Non-Equilibrium Approach


Abstract
:
1. Introduction
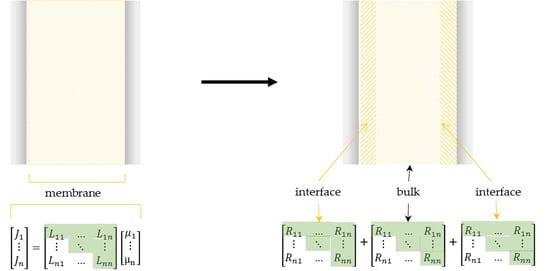
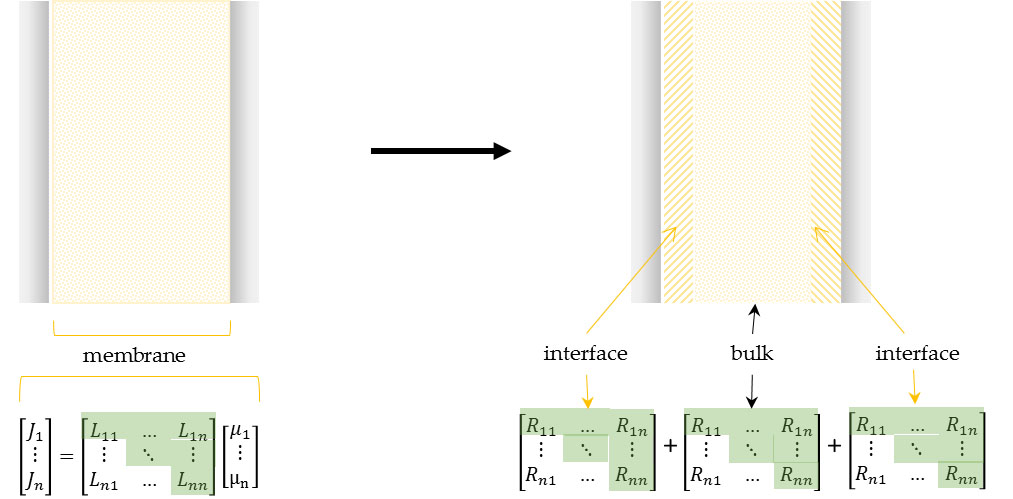
2. Transport Coefficient Matrix Method (TCM)
3. Membrane Properties: A Literature Survey
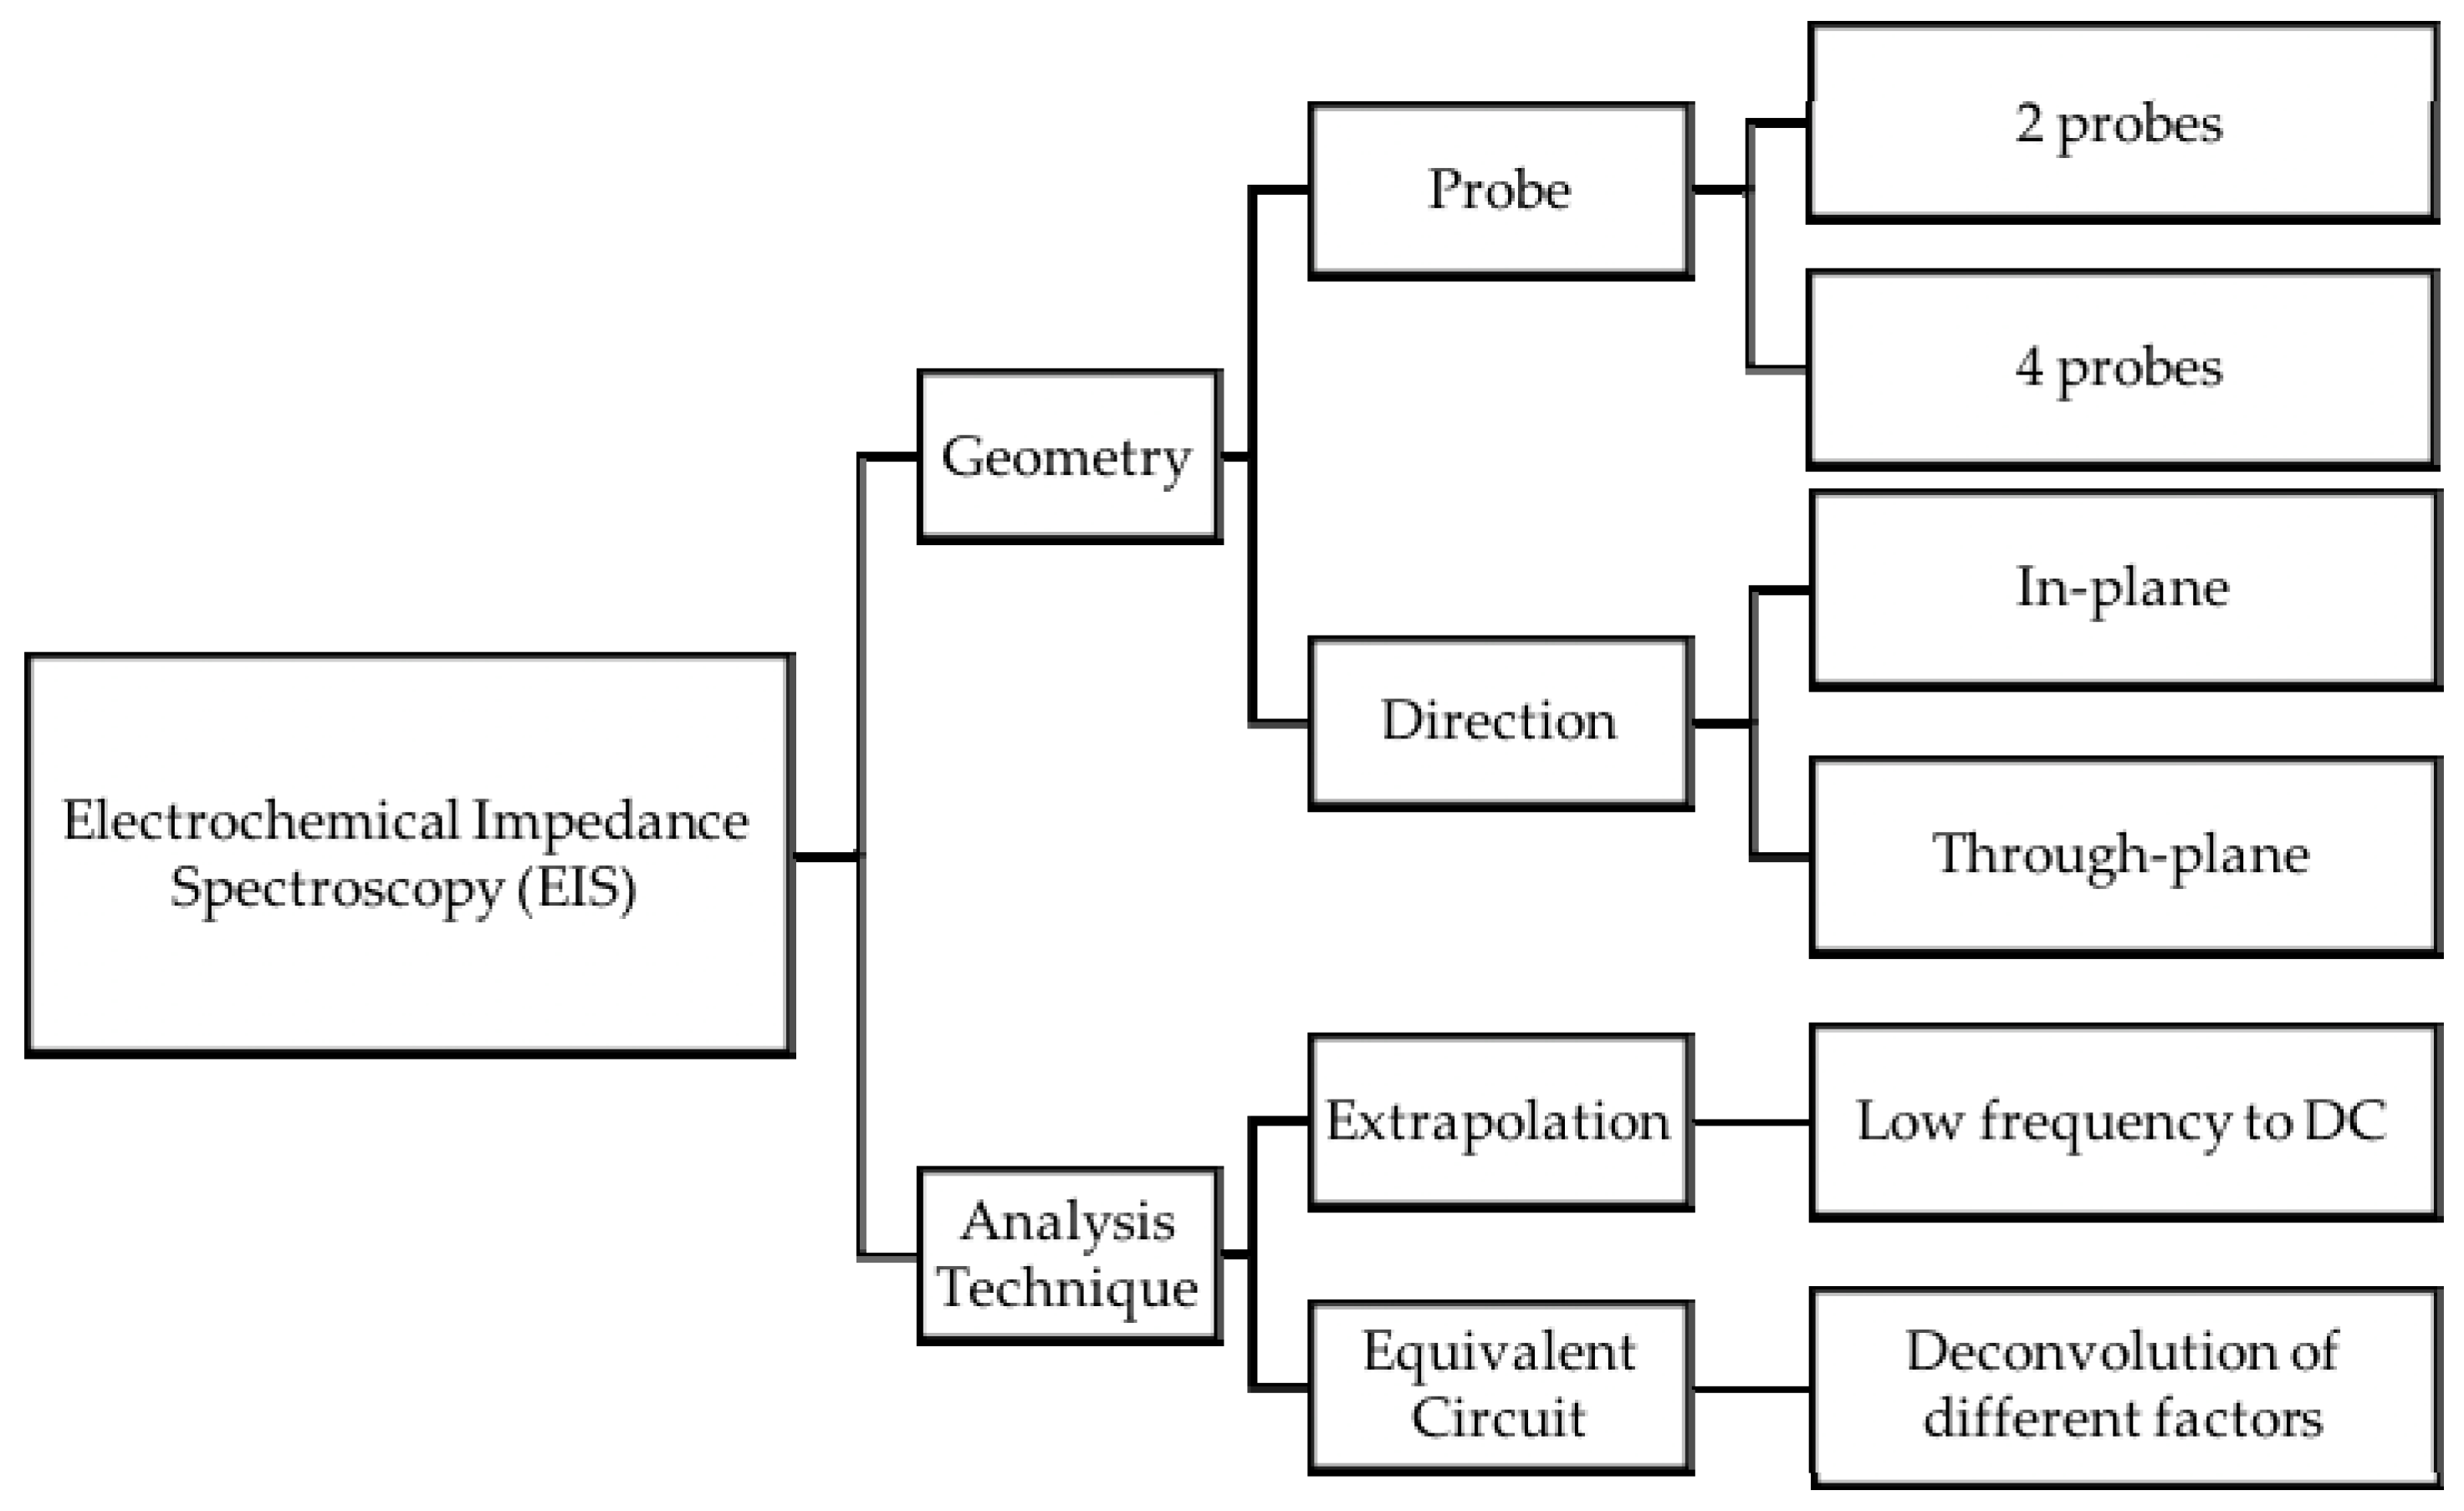
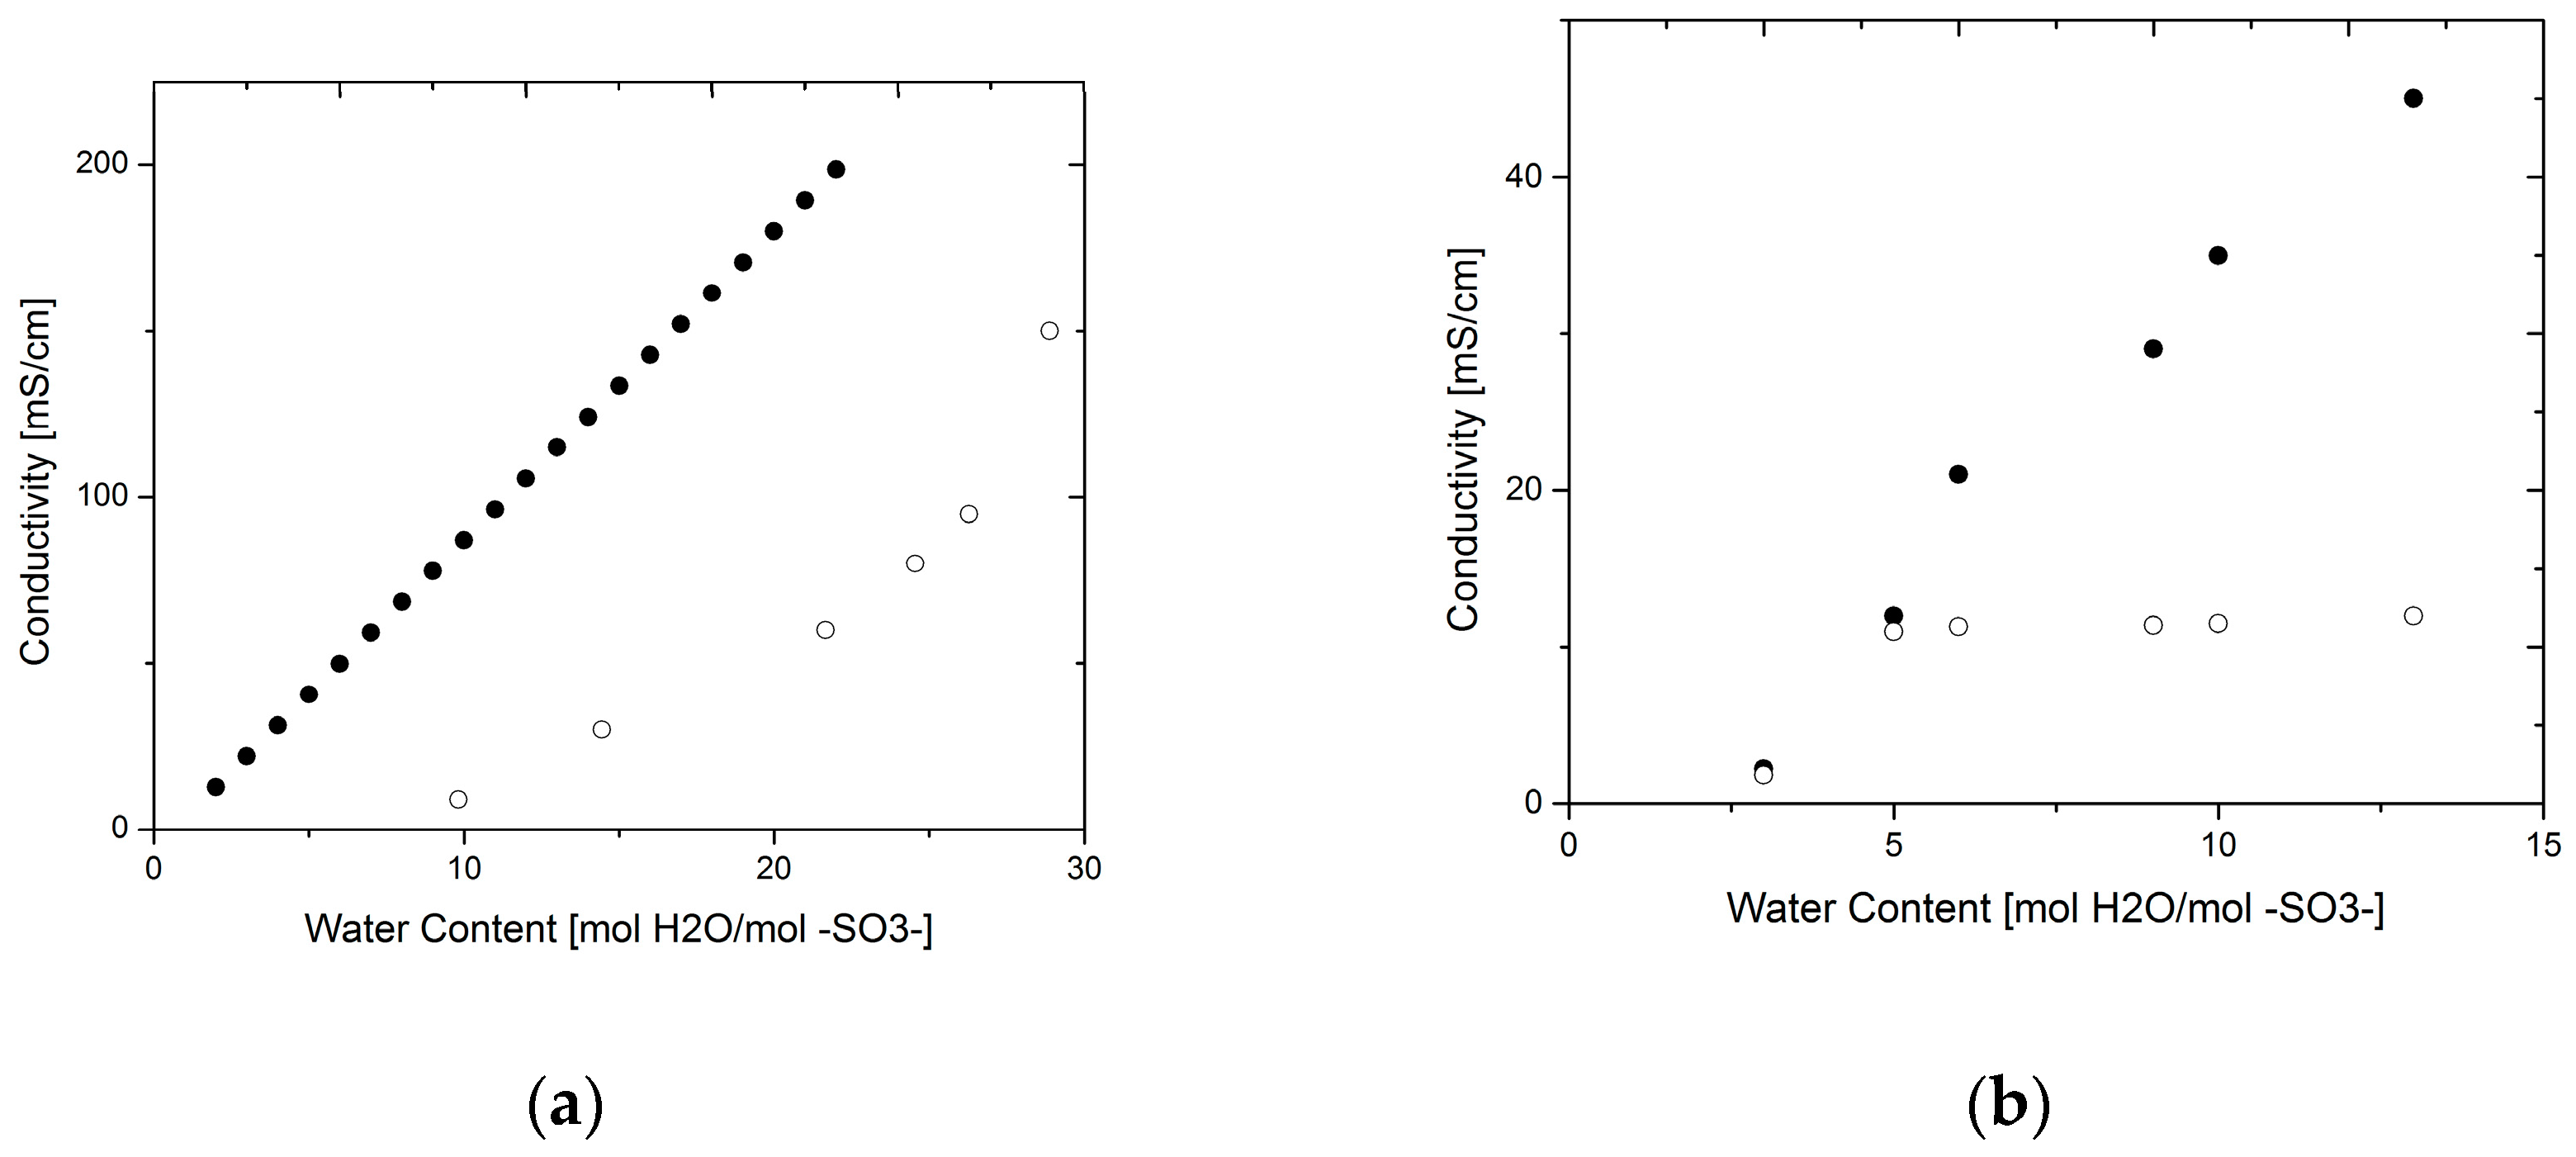
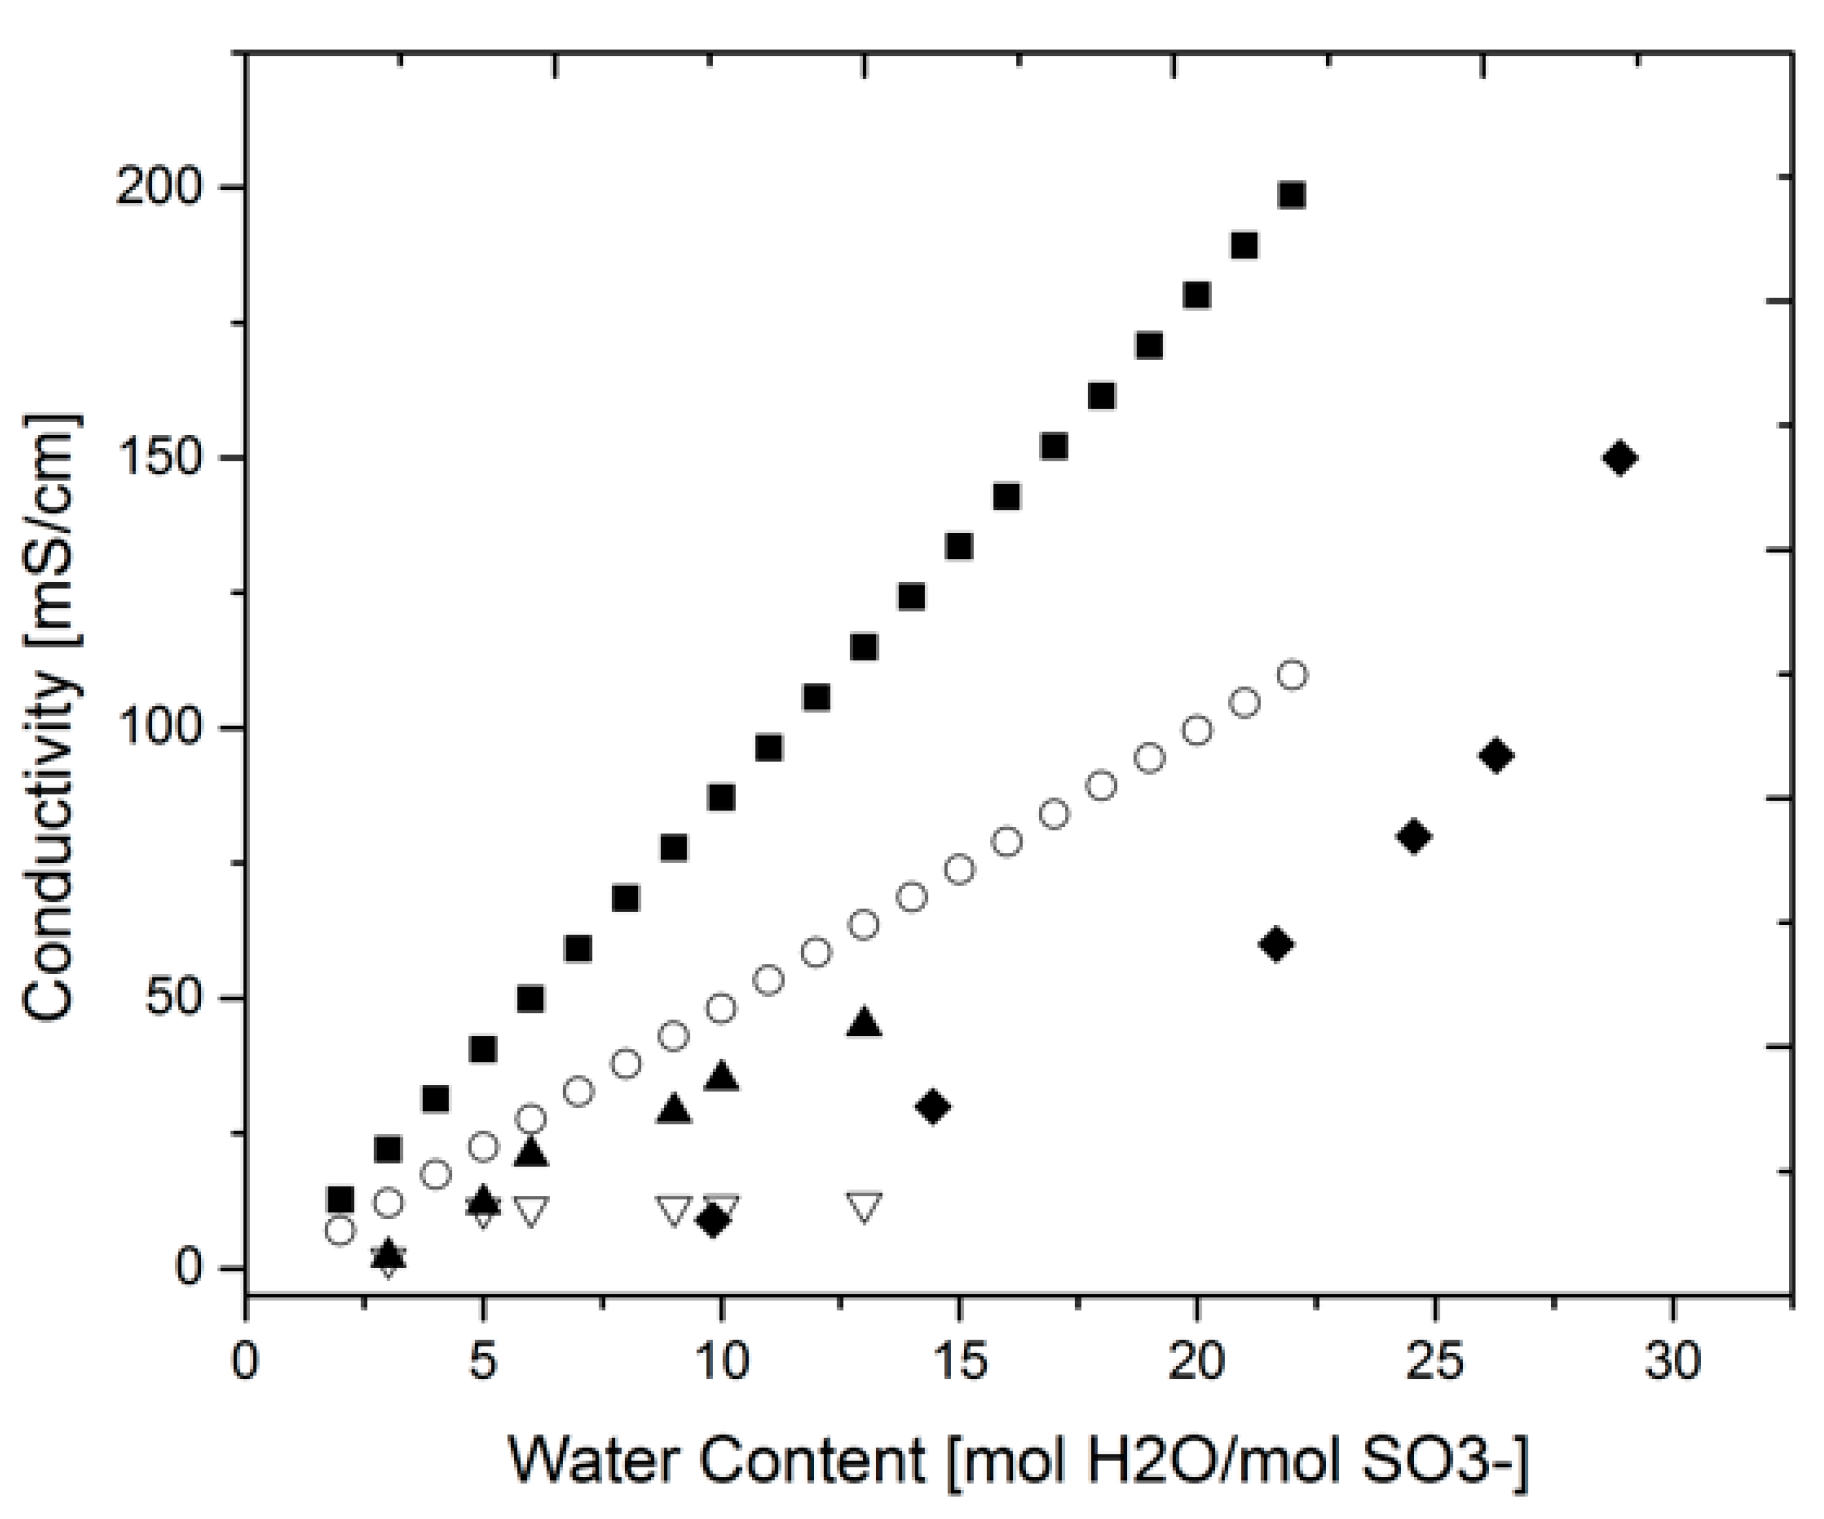
3.1. Proton Conductivity
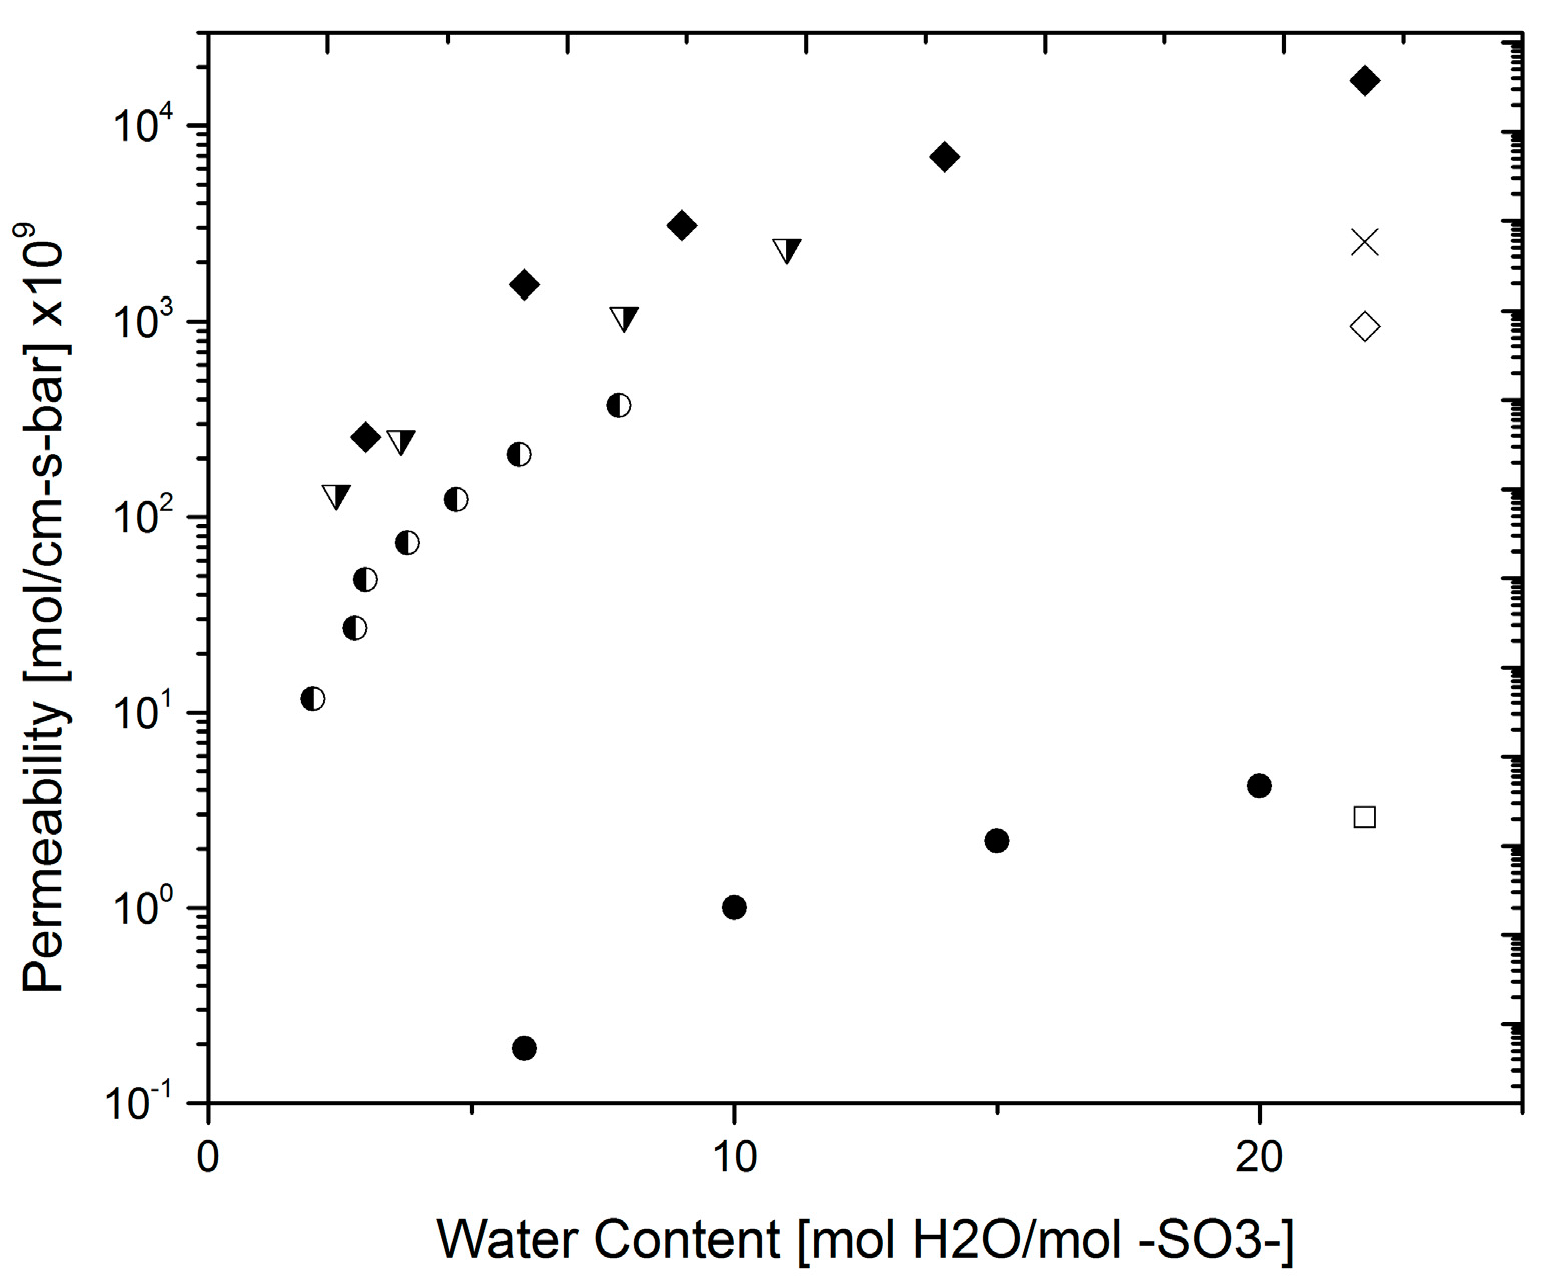
3.2. Water Permeability
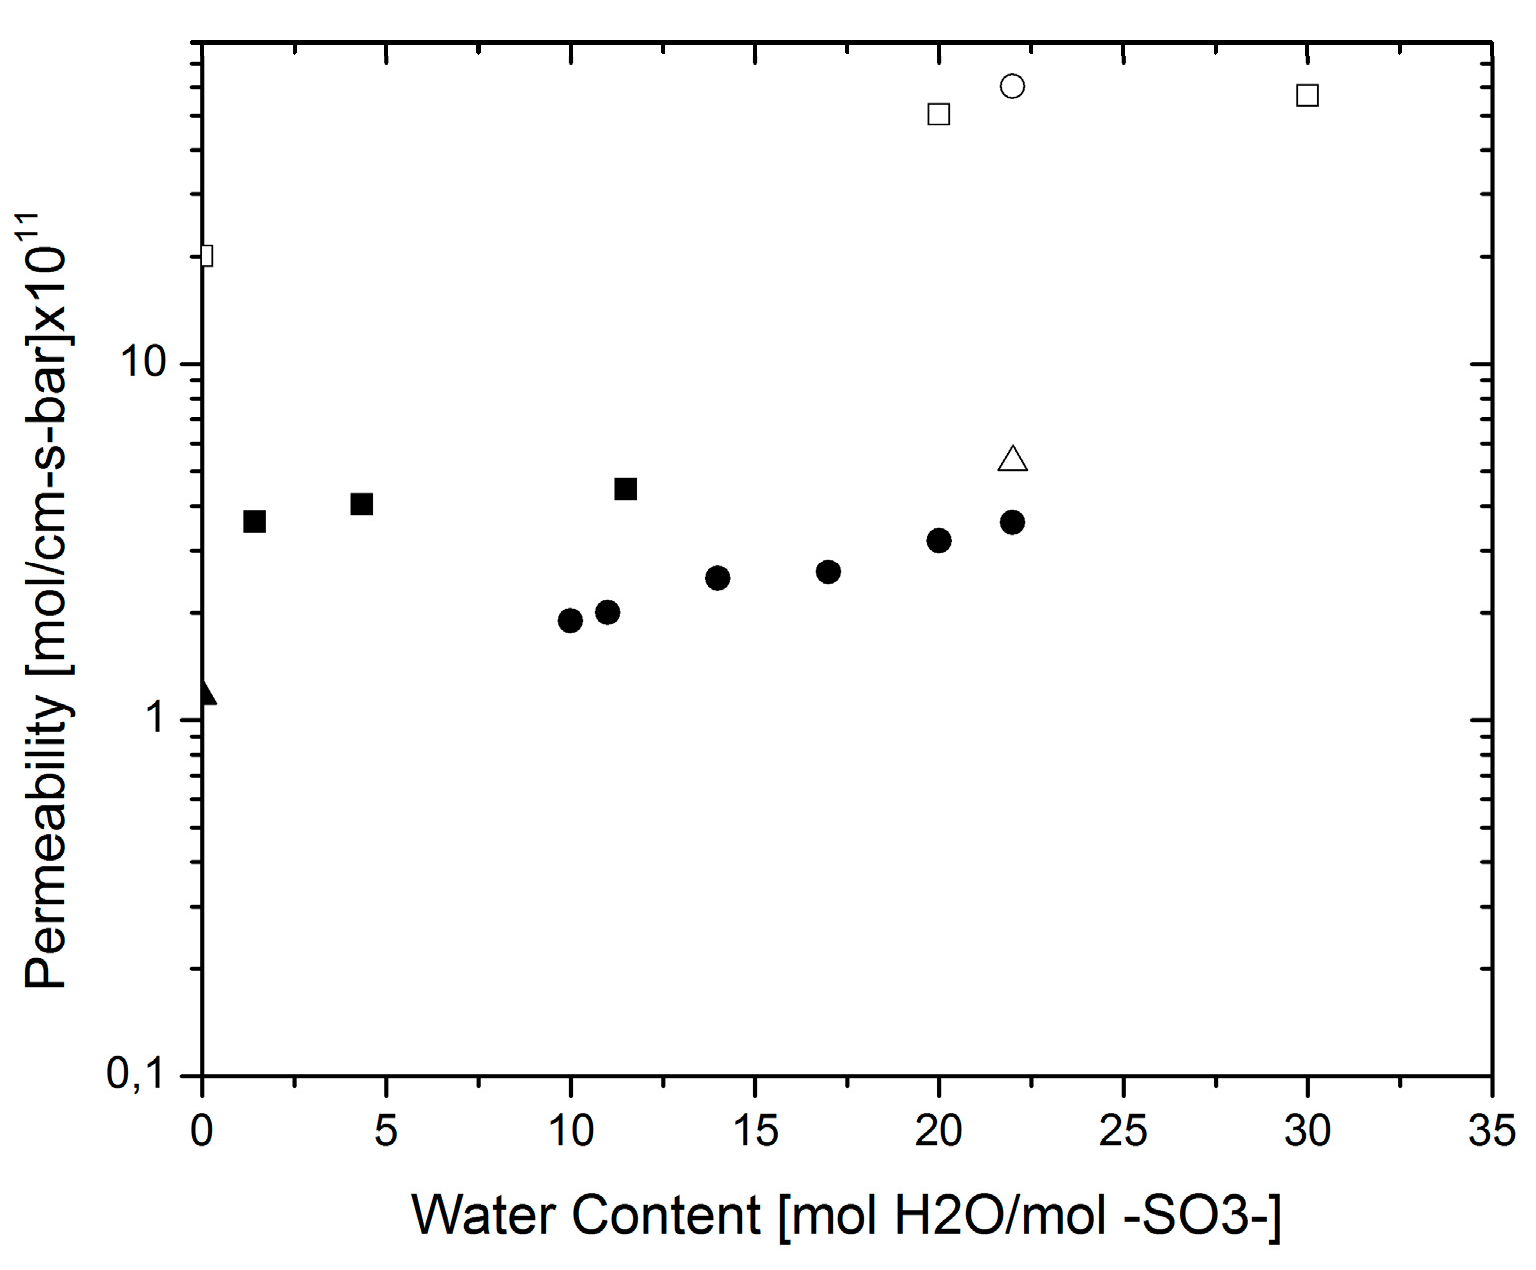
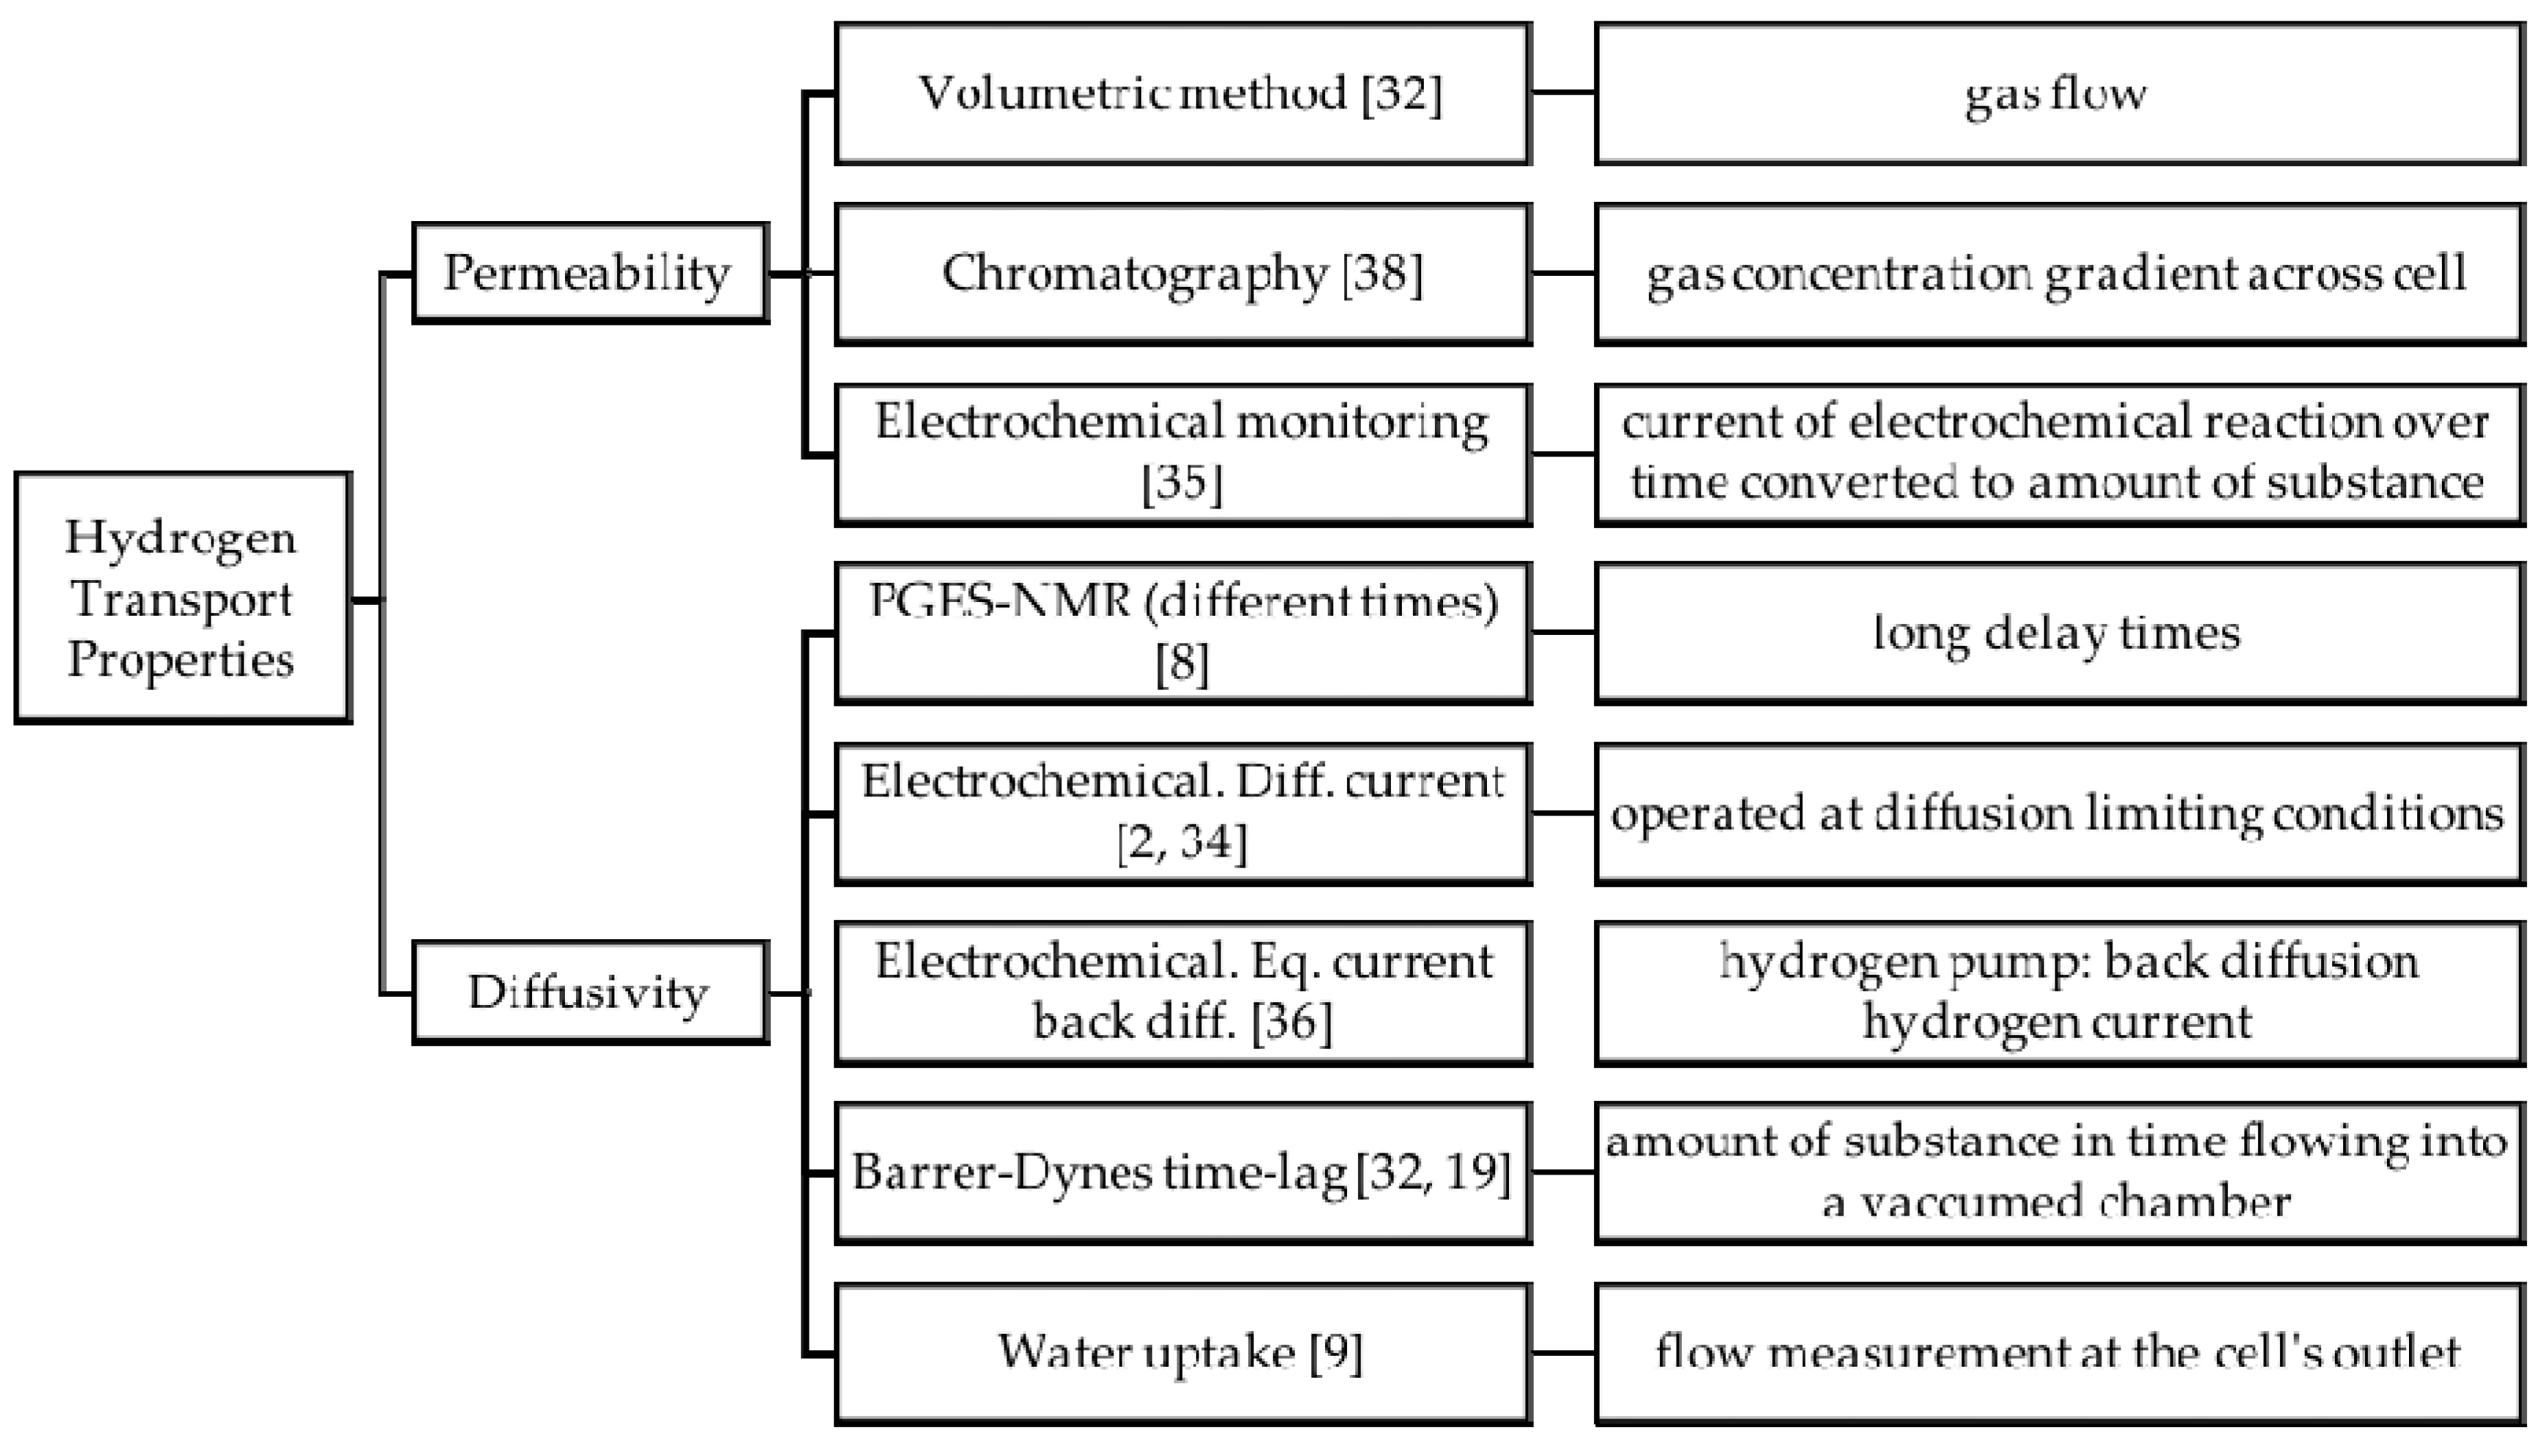
3.3. Hydrogen Permeability
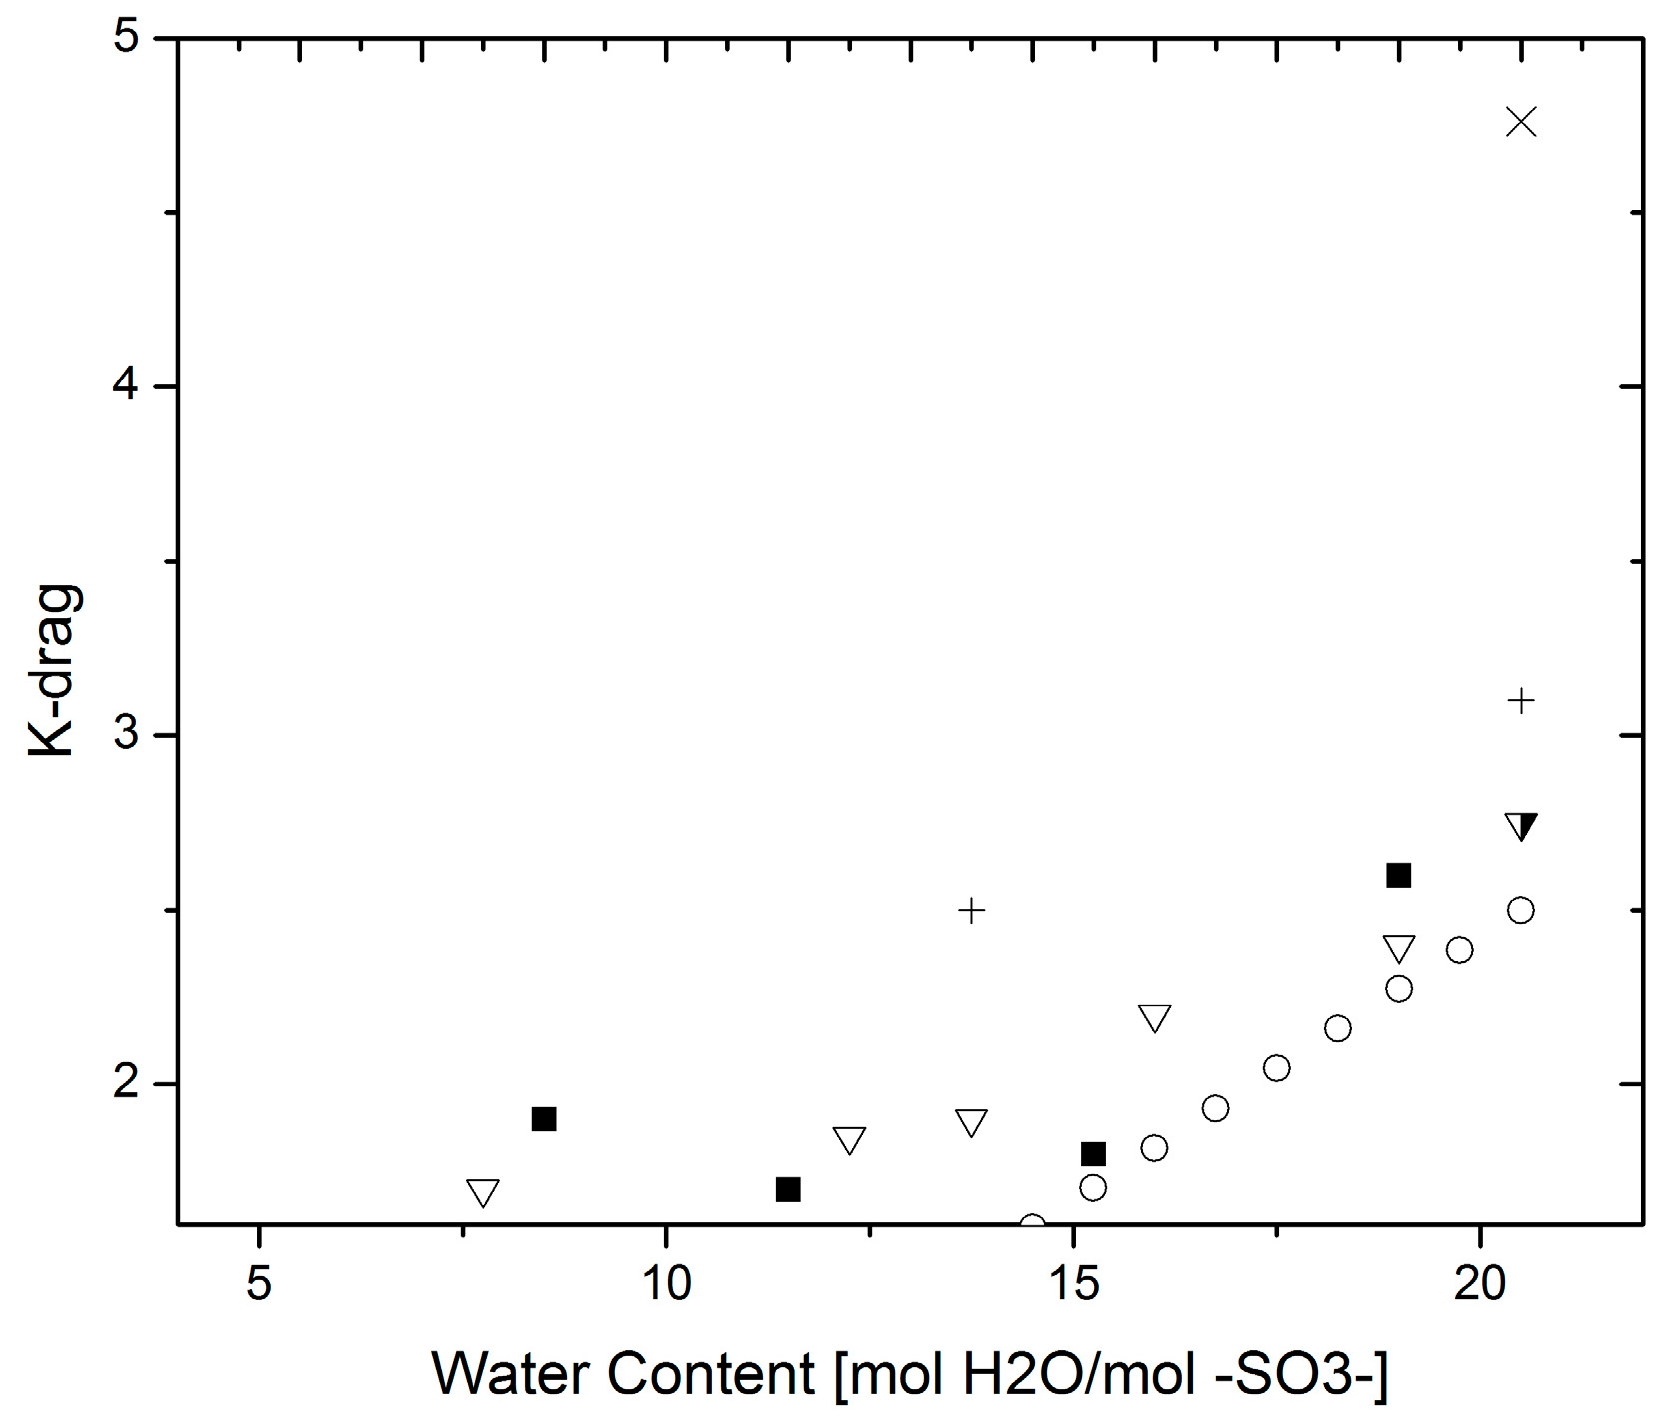
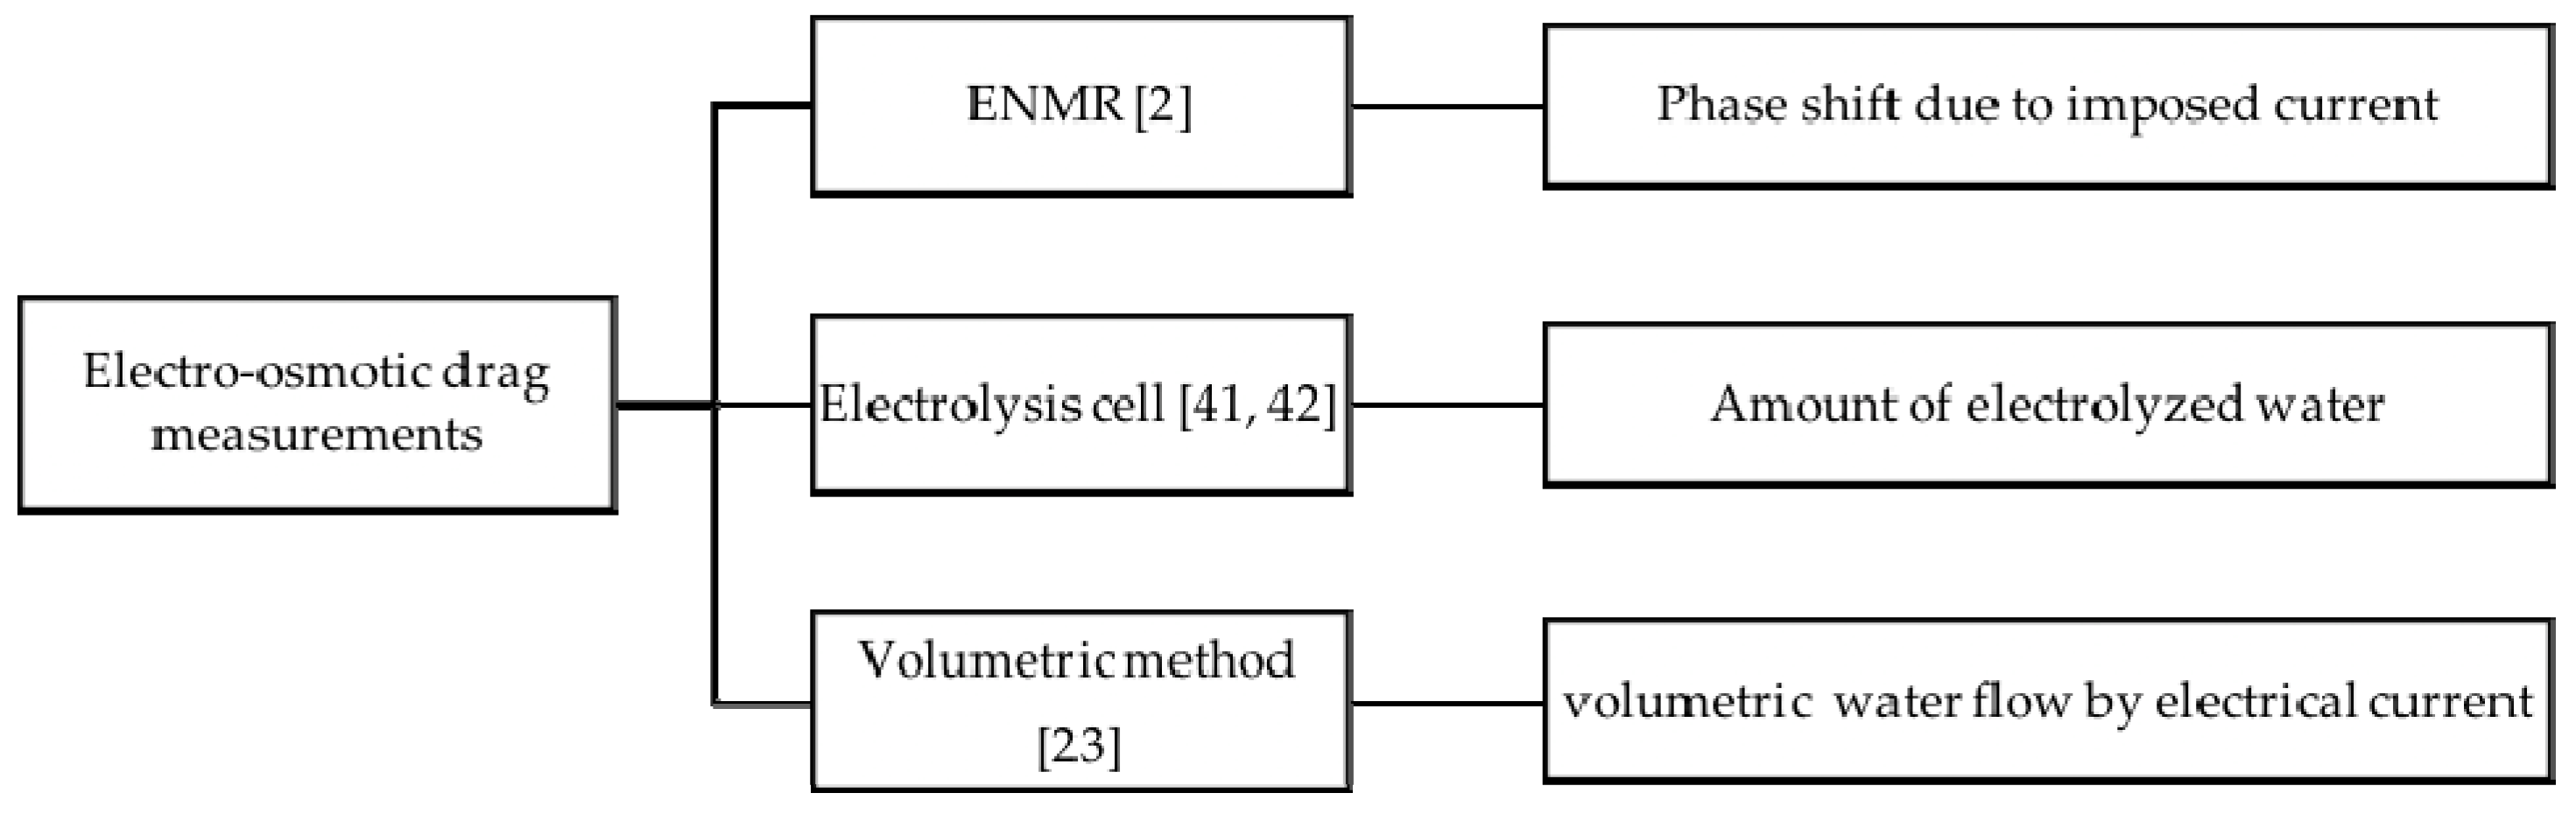
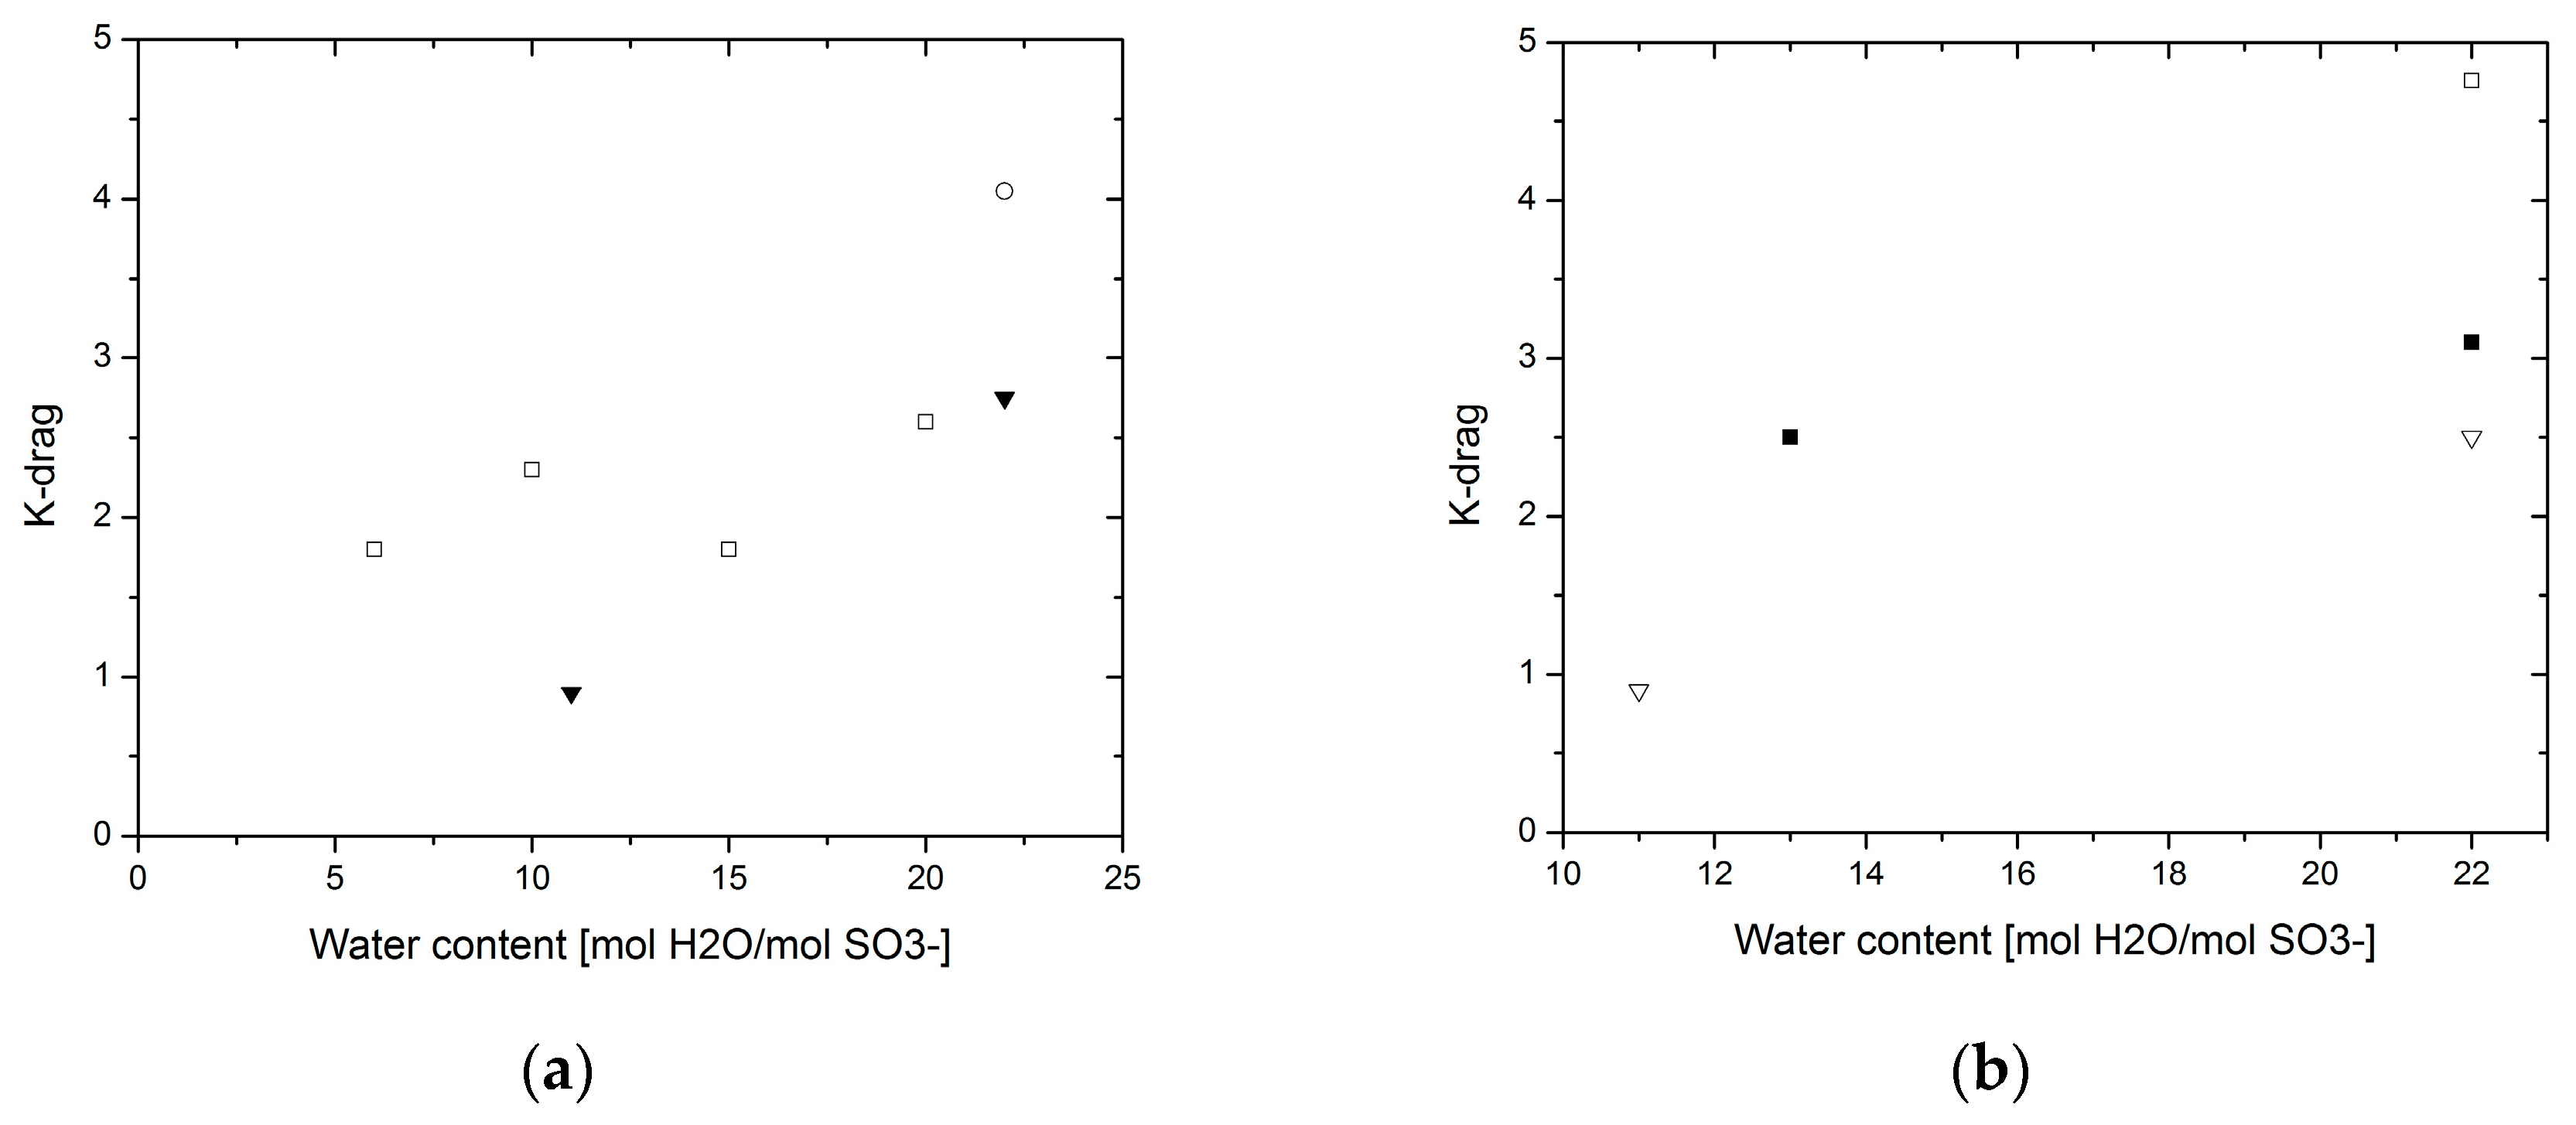
3.4. Electro-Osmotic Drag
4. Discussion
5. Conclusions
Acknowledgments
Author Contributions
Conflicts of Interest
References
- Rivin, D.; Kendrick, C.E.; Gibson, P.W.; Schneider, N.S. Solubility and transport behavior of water and alcohols in Nafion™. Polymer 2001, 42, 623–635. [Google Scholar] [CrossRef]
- Kreuer, K.D.; Paddison, S.J.; Spohr, E.; Schuster, M. Transport in proton conductors for fuel-cell applications: Simulations, elementary reactions, and phenomenology. Chem. Rev. 2004, 104, 4637–4678. [Google Scholar] [CrossRef] [PubMed]
- Kjelstrup, S.; Bedeaux, D. Non-Equilibrium Thermodynamics of Heterogeneous Systems; World Scientific: Singapore, 2008; Volume 16. [Google Scholar]
- Onsager, L. Reciprocal relations in irreversible processes. I. Phys. Rev. 1931, 37, 405. [Google Scholar] [CrossRef]
- Kjelstrup, S.; Bedeaux, D.; Johannessen, E.; Gross, J. Non-Equilibrium Thermodynamics for Engineers; World Scientific Publishing Co. Inc.: Singapore, 2010. [Google Scholar]
- Fuller, T.F.; Newman, J. Experimental determination of the transport number of water in Nafion 117 membrane. J. Electrochem. Soc. 1992, 139, 1332–1337. [Google Scholar] [CrossRef]
- Cooper, K. Progress toward accurate through-plane membrane resistance and conductivity measurement. ECS Trans. 2009, 25, 995–1007. [Google Scholar]
- Zhao, Q.; Majsztrik, P.; Benziger, J. Diffusion and interfacial transport of water in Nafion. J. Phys. Chem. B 2011, 115, 2717–2727. [Google Scholar] [CrossRef] [PubMed]
- Majsztrik, P.W.; Satterfield, M.B.; Bocarsly, A.B.; Benziger, J.B. Water sorption, desorption and transport in Nafion membranes. J. Membr. Sci. 2007, 301, 93–106. [Google Scholar] [CrossRef]
- Springer, T.E.; Wilson, M.S.; Gottesfeld, S. Modeling and experimental diagnostics in polymer electrolyte fuel cells. J. Electrochem. Soc. 1993, 140, 3513–3526. [Google Scholar] [CrossRef]
- Cahan, B.; Wainright, J. AC impedance investigations of proton conduction in Nafion™. J. Electrochem. Soc. 1993, 140, L185–L186. [Google Scholar] [CrossRef]
- Lee, C.H.; Park, H.B.; Lee, Y.M.; Lee, R.D. Importance of proton conductivity measurement in polymer electrolyte membrane for fuel cell application. Ind. Eng. Chem. Res. 2005, 44, 7617–7626. [Google Scholar] [CrossRef]
- Xie, Z.; Song, C.; Andreaus, B.; Navessin, T.; Shi, Z.; Zhang, J.; Holdcroft, S. Discrepancies in the measurement of ionic conductivity of PEMs using two-and four-probe AC impedance spectroscopy. J. Electrochem. Soc. 2006, 153, E173–E178. [Google Scholar] [CrossRef]
- Cheah, M.J.; Kevrekidis, I.G.; Benziger, J. Effect of interfacial water transport resistance on coupled proton and water transport across Nafion. J. Phys. Chem. B 2011, 115, 10239–10250. [Google Scholar] [CrossRef] [PubMed]
- De Groot, S.R.; Mazur, P. Non-Equilibrium Thermodynamics; Courier Corporation: North Chelmsford, MA, USA, 2013. [Google Scholar]
- Kondepudi, D.; Prigogine, I. Modern Thermodynamics: From Heat Engines to Dissipative Structures; John Wiley & Sons: Hoboken, NJ, USA, 2014. [Google Scholar]
- Newman, J.; Thomas-Alyea, K.E. Electrochemical Systems; John Wiley & Sons: Hoboken, NJ, USA, 2012. [Google Scholar]
- Ito, H.; Maeda, T.; Nakano, A.; Takenaka, H. Properties of Nafion membranes under PEM water electrolysis conditions. Int. J. Hydrogen Energy 2011, 36, 10527–10540. [Google Scholar] [CrossRef]
- Wu, X.; Wang, X.; He, G.; Benziger, J. Differences in water sorption and proton conductivity between Nafion and SPEEK. J. Polym. Sci. B Polym. Phys. 2011, 49, 1437–1445. [Google Scholar] [CrossRef]
- Kornyshev, A.; Kuznetsov, A.M.; Spohr, A.; Ulstrup, J. Kinetics of Proton Transport in Water; ACS Publications: Washington, DC, USA, 2003. [Google Scholar]
- Choe, Y.K.; Tsuchida, E.; Ikeshoji, T.; Yamakawa, S.; Hyodo, S.A. Nature of proton dynamics in a polymer electrolyte membrane, nafion: A first-principles molecular dynamics study. Phys. Chem. Chem. Phys. 2009, 11, 3892–3899. [Google Scholar] [CrossRef] [PubMed]
- Edmondson, C.; Fontanella, J. Free volume and percolation in S-SEBS and fluorocarbon proton conducting membranes. Solid State Ion. 2002, 152, 355–361. [Google Scholar] [CrossRef]
- Zawodzinski, T.; Derouin, C.; Radzinksi, S.; Sherman, R.; Smith, V.; Springer, T.; Gottesfeld, S. Water-uptake by and transport through Nafion membranes. J. Electrochem. Soc. 1994, 140, 1041–1047. [Google Scholar] [CrossRef]
- Zawodzinski, T.A.; Neeman, M.; Sillerud, L.O.; Gottesfeld, S. Determination of water diffusion coefficients in perfluorosulfonate ionomeric membranes. J. Phys. Chem. 1991, 95, 6040–6044. [Google Scholar] [CrossRef]
- Alberti, G.; Casciola, M.; Massinelli, L.; Bauer, B. Polymeric proton conducting membranes for medium temperature fuel cells (110–160 C). J. Membr. Sci. 2001, 185, 73–81. [Google Scholar] [CrossRef]
- Edmondson, C.; Stallworth, P.; Chapman, M.; Fontanella, J.; Wintersgill, M.; Chung, S.; Greenbaum, S. Complex impedance studies of proton-conducting membranes. Solid State Ion. 2000, 135, 419–423. [Google Scholar] [CrossRef]
- Fontanella, J.J.; Edmondson, C.A.; Wintersgill, M.C.; Wu, Y.; Greenbaum, S.G. High-pressure electrical conductivity and NMR studies in variable equivalent weight NAFION membranes. Macromolecules 1996, 29, 4944–4951. [Google Scholar] [CrossRef]
- Kopitzke, R.W.; Linkous, C.A.; Anderson, H.R.; Nelson, G.L. Conductivity and water uptake of aromatic-based proton exchange membrane electrolytes. J. Electrochem. Soc. 2000, 147, 1677–1681. [Google Scholar] [CrossRef]
- Navessin, T.; Eikerling, M.; Wang, Q.; Song, D.; Liu, Z.; Horsfall, J.; Lovell, K.V.; Holdcroft, S. Influence of membrane ion exchange capacity on the catalyst layer performance in an operating PEM fuel cell. J. Electrochem. Soc. 2005, 152, A796–A805. [Google Scholar] [CrossRef]
- Springer, T.E.; Zawodzinski, T.; Gottesfeld, S. Polymer electrolyte fuel cell model. J. Electrochem. Soc. 1991, 138, 2334–2342. [Google Scholar] [CrossRef]
- Ise, M. Polymer-Elektrolyt-Membranen: Untersuchungen Zur Mikrostruktur Und Zu Den Transporteigenschaften Für Protonen Und Wasser. In Fakultät Physik Der Universität Stuttgart; Universität Stuttgart: Stuttgart, Germany, 2000. [Google Scholar]
- Sakai, T.; Takenaka, H.; Torikai, E. Gas diffusion in the dried and hydrated Nafions. J. Electrochem. Soc. 1986, 133, 88–92. [Google Scholar] [CrossRef]
- Sakai, T.; Takenaka, H.; Wakabayashi, N.; Kawami, Y.; Torikai, E. Gas permeation properties of solid polymer electrolyte (SPE) membranes. J. Electrochem. Soc. 1985, 132, 1328–1332. [Google Scholar] [CrossRef]
- Jiang, J.; Kucernak, A. Investigations of fuel cell reactions at the composite microelectrode| solid polymer electrolyte interface. I. Hydrogen oxidation at the nanostructured Pt|Nafion® membrane interface. J. Electroanal. Chem. 2004, 567, 123–137. [Google Scholar]
- Schalenbach, M.; Hoefner, T.; Paciok, P.; Carmo, M.; Lueke, W.; Stolten, D. Gas Permeation through Nafion. Part 1: Measurements. J. Phys. Chem. C 2015, 119, 25145–25155. [Google Scholar]
- Ströbel, R.; Oszcipok, M.; Fasil, M.; Rohland, B.; Jörissen, L.; Garche, J. The compression of hydrogen in an electrochemical cell based on a PE fuel cell design. J. Power Sources 2002, 105, 208–215. [Google Scholar] [CrossRef]
- Felice, C.; Ye, S.; Qu, D. Nafion−montmorillonite nanocomposite membrane for the effective reduction of fuel crossover. Ind. Eng. Chem. Res. 2010, 49, 1514–1519. [Google Scholar] [CrossRef]
- Broka, K.; Ekdunge, P. Oxygen and hydrogen permeation properties and water uptake of Nafion® 117 membrane and recast film for PEM fuel cell. J. Appl. Electrochem. 1997, 27, 117–123. [Google Scholar] [CrossRef]
- Ye, X.; Wang, C.Y. Measurement of Water Transport Properties Through Membrane-Electrode Assemblies I. Membranes. J. Electrochem. Soc. 2007, 154, B676–B682. [Google Scholar] [CrossRef]
- Kreuer, K. On the development of proton conducting polymer membranes for hydrogen and methanol fuel cells. J. Membr. Sci. 2001, 185, 29–39. [Google Scholar] [CrossRef]
- Marangio, F.; Santarelli, M.; Pagani, M.; Quaglia, M.C. Direct High Pressure Hydrogen Production: A Laboratory Scale PEM Electrolyser Prototype. ECS Trans. 2009, 17, 555–567. [Google Scholar]
- Onda, K.; Murakami, T.; Hikosaka, T.; Kobayashi, M.; Ito, K. Performance analysis of polymer-electrolyte water electrolysis cell at a small-unit test cell and performance prediction of large stacked cell. J. Electrochem. Soc. 2002, 149, A1069–A1078. [Google Scholar] [CrossRef]
- Ise, M.; Kreuer, K.; Maier, J. Electroosmotic drag in polymer electrolyte membranes: An electrophoretic NMR study. Solid State Ion. 1999, 125, 213–223. [Google Scholar] [CrossRef]
- Siroma, Z.; Ioroi, T.; Fujiwara, N.; Yasuda, K. Proton conductivity along interface in thin cast film of Nafion®. Electrochem. Commun. 2002, 4, 143–145. [Google Scholar] [CrossRef]
- Eastman, S.A.; Kim, S.; Page, K.A.; Rowe, B.W.; Kang, S.; Soles, C.L.; Yager, K.G. Effect of confinement on structure, water solubility, and water transport in Nafion thin films. Macromolecules 2012, 45, 7920–7930. [Google Scholar] [CrossRef]
- Zhang, X.Y.; Ding, Y.H. Thickness-dependent structural and transport behaviors in the platinum–Nafion interface: A molecular dynamics investigation. RSC Adv. 2014, 4, 44214–44222. [Google Scholar] [CrossRef]


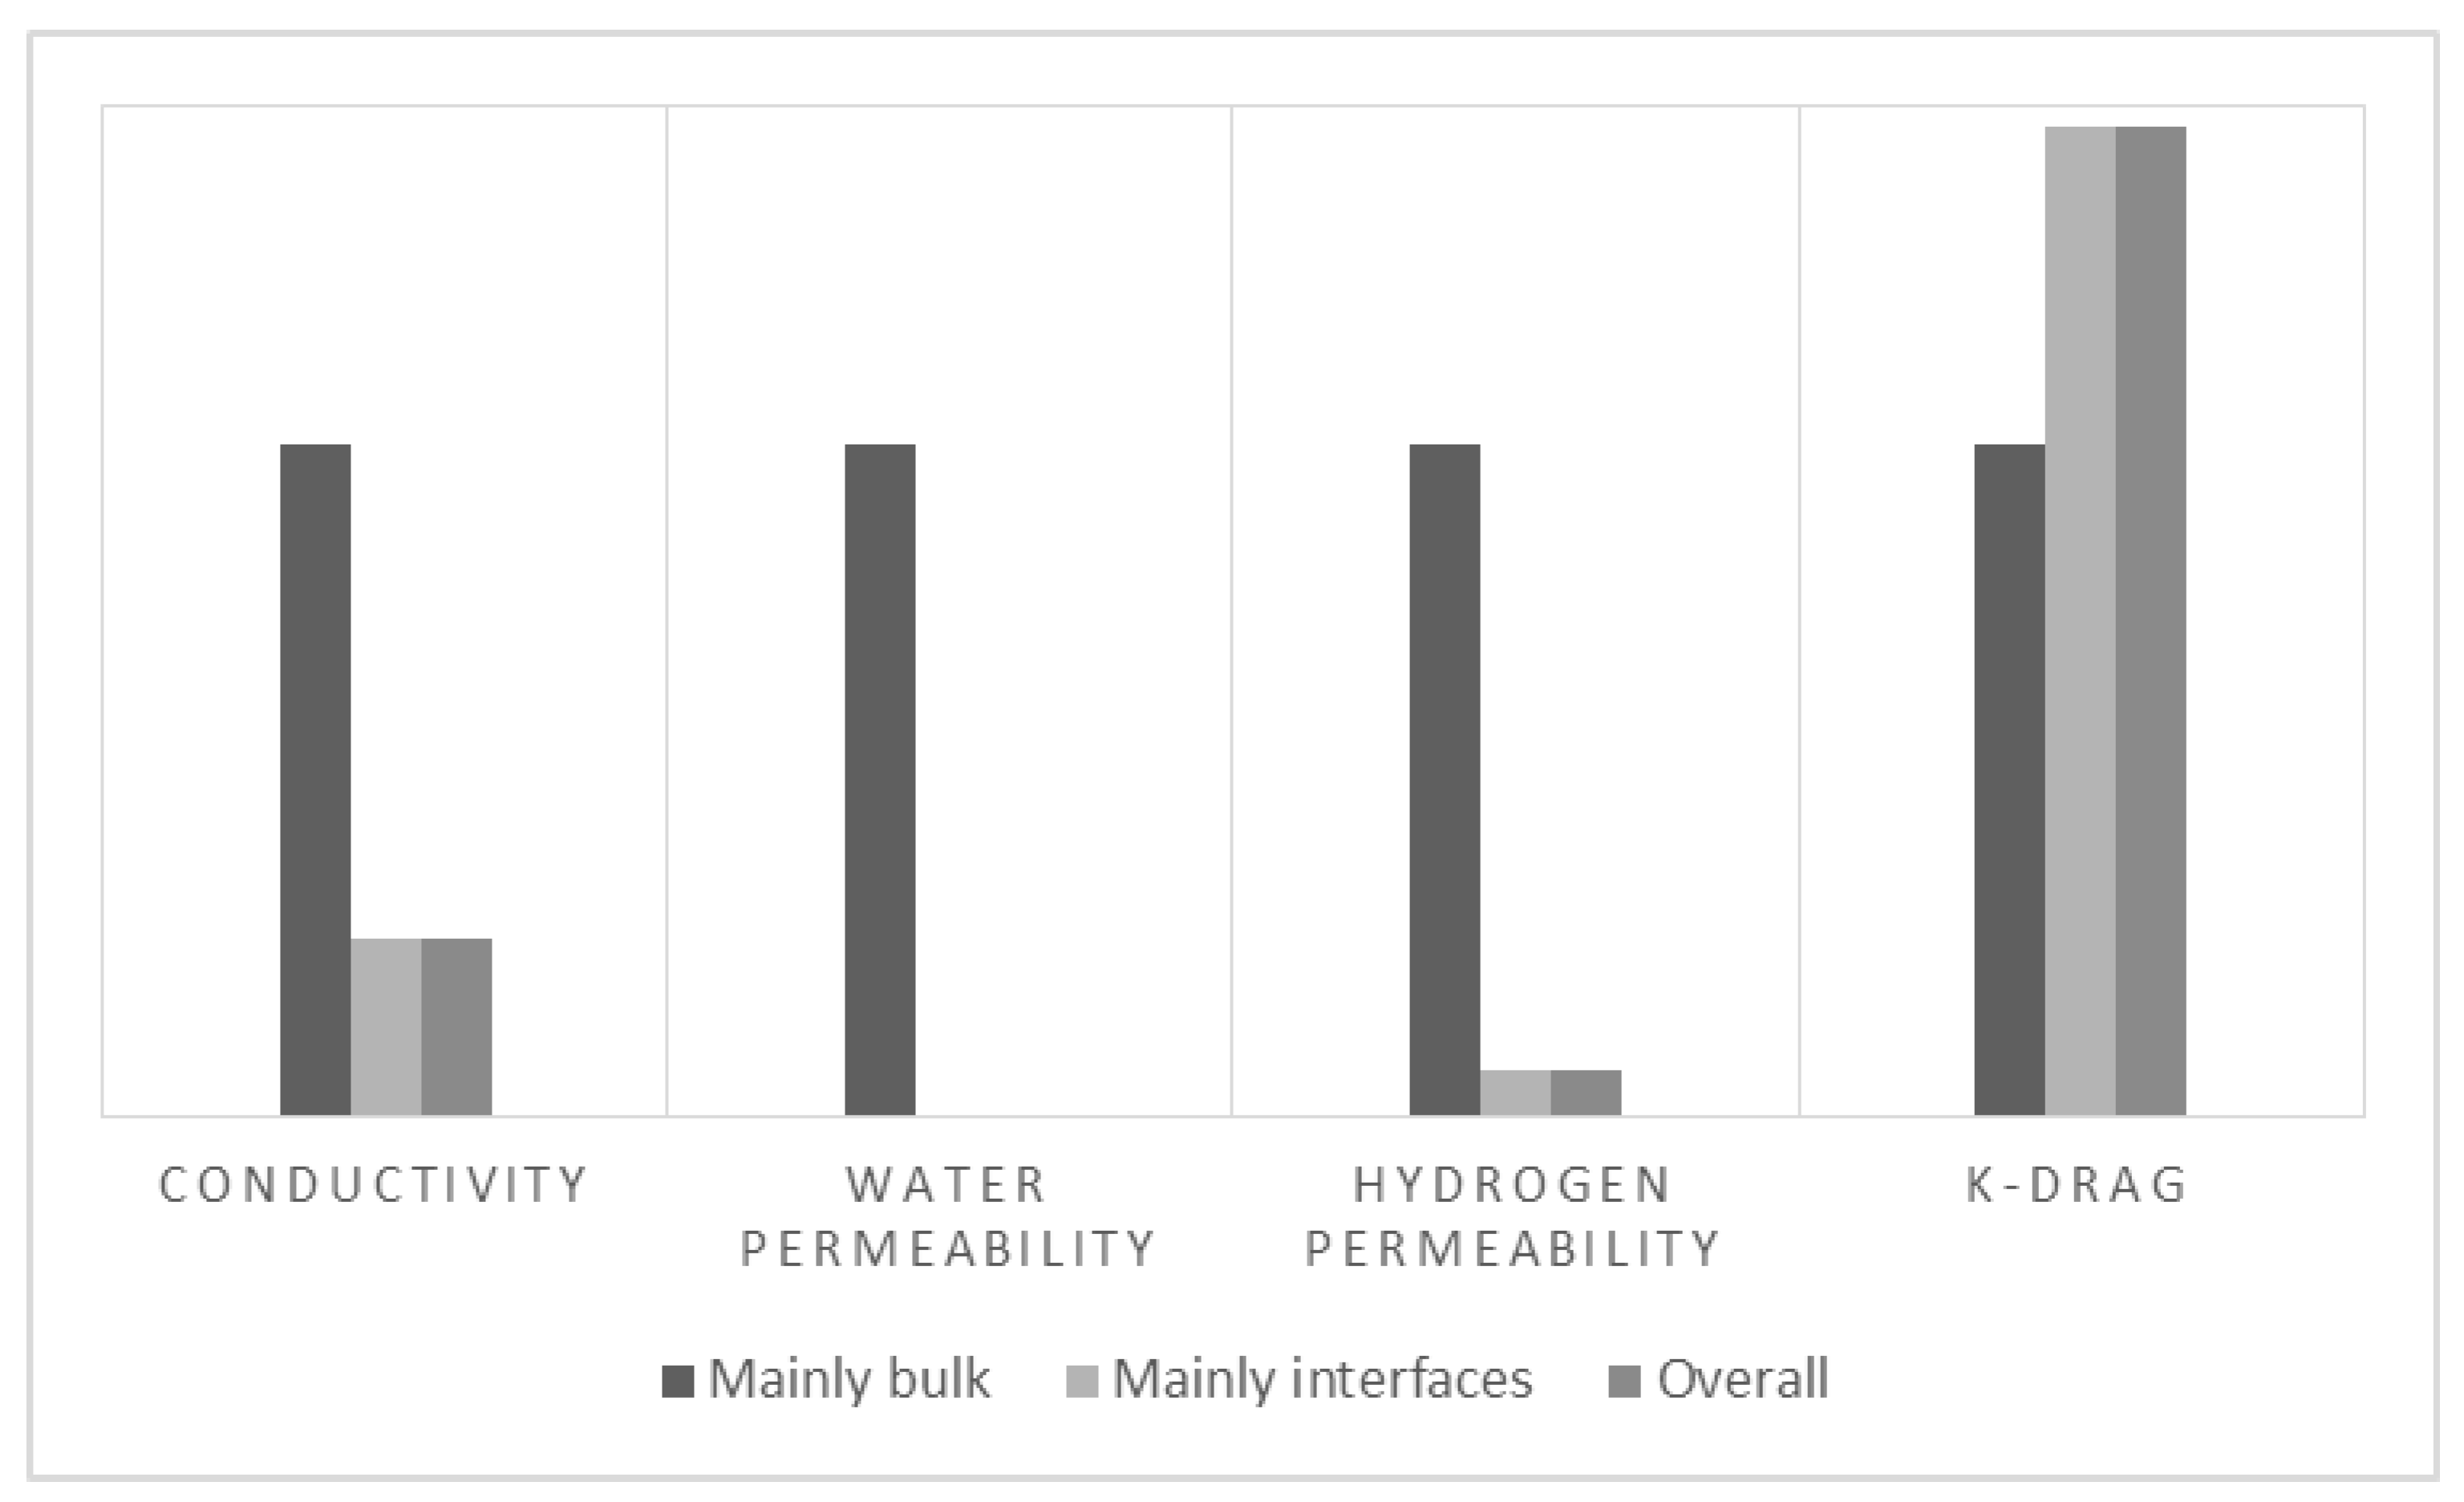
| Transport Coefficient | Bulk | Interface | Overall |
|---|---|---|---|
| Conductivity (mS/m) | 45 | 0.88 × 10⁻³ | 12 |
| Water permeability (mol/cm-s-bar) × 109 | 948 | 2.3 × 10⁻⁴ | 4.2 |
| Hydrogen permeability (mol/cm-s-bar) × 1011 | 50 | 2 × 10⁻⁴ | 3.6 |
| Electro-osmotic drag (molecule H2O/charge carrier) | 2.75 | 4.6 × 10⁻⁴ | 4.05 |
| Transport Coefficient | Deviation from Bulk |
|---|---|
| Conductivity (mS/m) | −73.3% |
| Water permeability (mol/cm-s-bar) × 109 | −99.5% |
| Hydrogen permeability (mol/cm-s-bar) × 1011 | −92.8% |
| Electro-osmotic drag (molecule H2O/charge carrier) | +47.2% |
| Transport Coefficient | Conditions | RMSE (unit) | % Error |
|---|---|---|---|
| Conductivity (mS/cm) | 2- vs. 4-probe | 9.3 | 35% |
| In- vs. Through-plane | 41.2 | 33% | |
| Water permeability (mol/cm-s-bar) × 109 | - | 3897 | 906% |
| Hydrogen permeability (mol/cm-s-bar) × 1011 | - | 0.9 | 28% |
| Electro-osmotic drag (molecule H2O/charge carrier) | T = 30 °C | 0.6 | 28% |
| T = 80 °C | 0.4 | 30% |
© 2017 by the authors. Licensee MDPI, Basel, Switzerland. This article is an open access article distributed under the terms and conditions of the Creative Commons Attribution (CC BY) license (http://creativecommons.org/licenses/by/4.0/).
Share and Cite
Rangel-Cárdenas, A.L.; Koper, G.J.M. Transport in Proton Exchange Membranes for Fuel Cell Applications—A Systematic Non-Equilibrium Approach. Materials 2017, 10, 576. https://doi.org/10.3390/ma10060576
Rangel-Cárdenas AL, Koper GJM. Transport in Proton Exchange Membranes for Fuel Cell Applications—A Systematic Non-Equilibrium Approach. Materials. 2017; 10(6):576. https://doi.org/10.3390/ma10060576
Chicago/Turabian StyleRangel-Cárdenas, Angie L., and Ger J. M Koper. 2017. "Transport in Proton Exchange Membranes for Fuel Cell Applications—A Systematic Non-Equilibrium Approach" Materials 10, no. 6: 576. https://doi.org/10.3390/ma10060576
APA StyleRangel-Cárdenas, A. L., & Koper, G. J. M. (2017). Transport in Proton Exchange Membranes for Fuel Cell Applications—A Systematic Non-Equilibrium Approach. Materials, 10(6), 576. https://doi.org/10.3390/ma10060576