Abstract
Force Sensing Resistors (FSRs) are manufactured by sandwiching a Conductive Polymer Composite (CPC) between metal electrodes. The piezoresistive property of FSRs has been exploited to perform stress and strain measurements, but the rheological property of polymers has undermined the repeatability of measurements causing creep in the electrical resistance of FSRs. With the aim of understanding the creep phenomenon, the drift response of thirty two specimens of FSRs was studied using a statistical approach. Similarly, a theoretical model for the creep response was developed by combining the Burger’s rheological model with the equations for the quantum tunneling conduction through thin insulating films. The proposed model and the experimental observations showed that the sourcing voltage has a strong influence on the creep response; this observation—and the corresponding model—is an important contribution that has not been previously accounted. The phenomenon of sensitivity degradation was also studied. It was found that sensitivity degradation is a voltage-related phenomenon that can be avoided by choosing an appropriate sourcing voltage in the driving circuit. The models and experimental observations from this study are key aspects to enhance the repeatability of measurements and the accuracy of FSRs.
1. Introduction
A Conductive Polymer Composites (CPC) is manufactured by randomly dispersing conductive particles along an insulating polymer matrix. The CPCs benefit from the insulating behavior of polymer materials to exhibit an electrical resistance dependent on both: particle concentration and mechanical stress [1]; this semiconductive response has been exploited in the manufacturing of tactile and pressure sensors to be integrated in multiple applications as later described in this article.
When manufacturing CPCs, materials such as: rubber, elastomer, and Polydimethylsiloxane (PDMS) are the preferably chosen solutions for the insulating phase [2,3,4]. Conductive particles are typically obtained from metals such as Nickel or Cooper [5,6], but more recently, carbon black or carbon nanotubes have been also employed as the conductive phase in CPCs [7,8]. Particle sizes for the conductive filler are typically between the range of tens of nanometers up to a few micrometers. The resulting composite exhibits a piezoresistive property, which has been successfully exploited to manufacture custom-dimension, low-profile and light force/pressure sensors to be integrated in applications with space constraints, such as: tactile sensing in robotic manipulation [9,10,11], gait analysis [12,13] and biomedical studies [14,15]. More recently, pressure sensors manufactured from CPCs have been integrated into Human Machine Interfaces (HMI) to enable three-dimensional inputs; i.e., two spatial dimensions plus pressure information [16,17]. Although the integration of CPCs is promising, the force sensors manufactured from CPCs still exhibit low repeatability and low accuracy when compared to load cells; this condition has limited the extensive usage of such devices in the aforementioned disciplines.
When a CPC is sandwiched between metal electrodes, a force/pressure sensor is obtained [18]. In literature, multiple designations have been given to this type of force sensors, e.g., Force Sensing Resistor (FSR) [19], piezoresistive sensor [10] and tactile sensor [20]. In this article the abbreviated designation of FSR is employed. When particle concentration in the CPC is below the percolation threshold, the composite resistance decreases with incremental applied stresses. Under such circumstances, the predominant conduction mechanism is quantum tunneling [4]. Several authors have developed CPC with different materials and nominal ranges operating on the basis of quantum tunneling [18,21,22]. There also commercial brands of FSRs with customizable dimension and nominal ranges that operate on the same principle; this is the case of the FlexiForce A201 sensors [23], manufactured by Tekscan, Inc. (Boston, MA, USA), the family of Interlink FSR 402 sensors [24] manufactured by Interlink Electronics, Inc. (Westlake Village, CA, USA) and the family of QTC® SP200 sensors [25] manufactured by Peratech Holdco Limited (Brompton-on-Swale, North Yorkshire, UK).
Conversely, when particle concentration is above the percolation threshold, the composite resistance grows with incremental applied stresses; this conduction mechanism is known as percolation. Some representative studies have been conducted on this field by Knite et al. [26] and Cattin and Hubert [27]. Similarly, on the research conducted by Wang et al. [1], the transition between quantum tunnelling and percolation is clearly observable as multiple CPCs have been assembled with different filler concentrations. Nonetheless, it must be remarked that both phenomena actually occur simultaneously (quantum tunneling and percolation), but depending on particle concentration, one conduction mechanism dominates over the other [4].
Several authors have developed theoretical models for the resistance variation of CPCs. Representative studies for modelling the quantum tunneling conduction have been conducted by Zhang et al. [21], Wang et al. [1] and Kalantari et al. [22]. Conversely, Roldughin et al. [28] have thoroughly studied the percolation mechanism. All the aforementioned models for quantum tunneling conduction are based on the theoretical derivation from Simmons [29]. Specifically, the models from Zhang et al. [21], Wang et al. [1] and Kalantari et al. [22] are based on the Equation (25) from the Simmons model [29]. It must be highlighted that the Equation (25) at [29] imposes a voltage-independent behavior for the tunneling resistance. However this assumption is valid only when the voltage across the CPC is in the millivolt range.
Authors’ previous work addressed a different approach for modelling the tunneling conduction of CPCs [30]. Specifically, the authors experimentally demonstrated that the electrical resistance is voltage dependent, which complements previous statements from Zhang et al. [21], Wang et al. [1] and Kalantari et al. [22]. It must be highlighted that the voltage-dependent behavior of the tunneling resistance has been also predicted by Simmons [29]. The authors also demonstrated that the effective area for tunneling conduction is modified by the applied stress [30]. In brief, the following set of parameters was considered in the authors’ proposed model: sourcing voltage, effective area for tunneling conduction, contact resistance, resistance of the conductive particles, average inter-particle separation and applied stress. Conversely to previous studies, the proposed model is capable of predicting sensor current under static loading at any operating voltage, and as later described in this article, the voltage-dependent behavior of the tunneling resistance is a key aspect for the appropriate modelling of the creep response.
The main scope of this article is to expand the authors proposed model [30] in order to include the rheological behavior of the insulating polymer matrix. When a CPC is subjected to constant stress for an extended period of time, the rheological characteristic of the CPC produces a creep response in the electrical resistance of the specimen; this is a well-studied phenomenon that has been addressed by multiple authors [18,21,22], but the contribution from this study is to demonstrate that the creep response in the electrical resistance is also influenced by the sourcing voltage across the specimen. Moreover, it is experimentally demonstrated that for large input voltages, sensitivity (gain) degradation occurs; this phenomenon has been reported by several authors [3,14,18,31,32], but the origin of such behavior has remained undisclosed up to now. The study of the creep response is important because it strongly influences the overall accuracy of the force/pressure readings. In fact, it is currently accepted as a major drawback the relative low accuracy and low repeatability of the force/pressure sensors manufactured from CPCs [19]; this condition has limited the extensive usage of such devices in many research fields such as: robotics and development of HMI [15].
The rest of this paper is organized as follows: Section 2 reviews the authors’ proposed model for the quantum tunneling conduction of CPCs. A comparison with previous models is also presented. Section 3 combines the authors’ proposed model with the Burgers rheological model. It is also addressed the theoretical influence of the sourcing voltage over the creep response. Experimental results and comparison with previous models are presented on Section 4. The phenomenon of sensitivity degradation is also presented in this Section. Finally, conclusions are stated on Section 5. The experimental tests embraced the application of static and dynamic (cyclic) force profiles over sixteen specimens of FlexiForce A201-1 [23] and Interlink FSR 402 sensors [24]. A large amount of sensors was considered in order to yield representative results supported by statistical analysis.
2. A Review on the Authors’ Proposed Model for the Quantum Tunneling Conduction of Force Sensing Resistors (FSRs)
Before presenting the authors’ proposed model, it is mandatory to review the elements—and corresponding symbols—that influence the tunnelling conduction through thin insulating films. In this Section, a description of the authors’ proposed model is presented, but a detailed derivation of the model can be found at [30]. Figure 1 depicts a schematic representation of a CPC sandwiched between two metal electrodes. Quantum tunnelling bridges are represented by dashed lines between consecutive particles. As previously stated, when a CPC is sandwiched between metal electrodes a force/pressure sensor is obtained [18]. In specialized literature, multiple designations are given to such devices, e.g., Force Sensing Resistor (FSR) [33], tactile sensor [20] and piezoresistive sensor [10]. When dealing with multiple sensors simultaneously, the designation of tactile sensor array is also employed [33,34]. For simplification purposes, the abbreviated designation of FSR is henceforth used in this article.
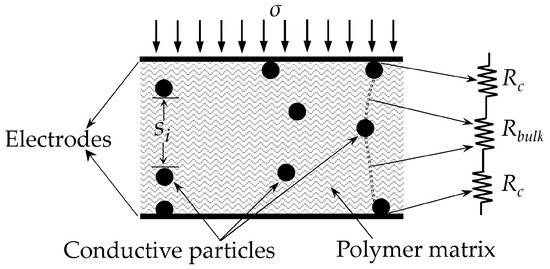
Figure 1.
Sketch of a Conductive Polymer Composite (CPC) sandwiched between two metal electrodes to form a Force Sensing Resistor (FSR). The electrical model of the FSR comprises a series connection between the bulk (tunneling) resistance (Rbulk) and the contact resistance (Rc).
The FSR from Figure 1 is subjected to an external stress (σ), and consequently, the inter-particle separation of the i-th tunneling bridge is reduced (si). Similarly, the inter-particle separation of all tunneling bridges are also diminished as a consequence of the applied stress, σ. However, the diagram from Figure 1 only shows some tunnelling bridges for simplification purposes.
A distinction is necessary between CPCs, FSRs and their corresponding symbols. According to the authors’ proposed model [30], the total resistance across the FSR (RFSR) can be decomposed from Figure 1 as next:
where Rbulk is the net resistance of the CPC originated from the quantum tunneling phenomenon and Rc is the contact resistance between the metal electrodes and the conductive particles. The series connection between Rbulk and 2·Rc creates a FSR as shown in Figure 1. The elements from Figure 1 are individually described ahead and the authors’ model is addressed on Section 2.4.
2.1. Resistance of the CPC (Rbulk)
Considering that the resistance of a CPC is originated from the quantum tunneling phenomenon, it is also referred in literature as the tunneling resistance, Rbulk. It must be highlighted that the model from Equation (1) represents the net contribution from all the quantum tunneling bridges. Given L as the average number of particles forming a conductive path, and given S as the total number of conductive paths, Zhang et al. [21] formulated the following equation for Rbulk:
where Rm is the tunneling resistance between two adjacent particles and Rpar is the resistance of a single conductive nanoparticle. According to Zhang et al. [21], Equation (2) can be further simplified because Rpar is negligible when comparted to Rm. Hence, Zhang et al. [21] further simplified the Equation (2) as next:
The authors agree with Zhang et al. [21] in the formulation of Equation (2), but a different opinion is held in regard to the simplification made at Equation (3), because at the nano- and microscopic levels the resistance of conductive particles is quantized, and thus, the classical definition of resistivity does not hold; this phenomenon is known in literature as quantum point contacts [35,36]. In practice, this implies that Rpar can not be straightforward assumed as negligible when compared to Rm. Further detail on this topic has been addressed by the authors at [30]. The authors’ proposed model in Section 2.2 and Section 2.4 includes the contribution from the particle resistance.
The schematic of Figure 1 can be simplified to a single tunnelling barrier as in the circuit representation of Figure 2a,b. Likewise, by recalling Equation (1), the voltage across the Force Sensing Resistor (VFSR) can be decomposed as in:
where VRc is the voltage drop across the contact resistance and Vbulk is the voltage drop across the tunneling barrier, i.e., Vbulk is the voltage drop across the tunneling resistance, Rbulk. In its simplest form, the tunneling barrier is rectangular with height Va and width s, see Figure 2c. The barrier width, s, can be also understood as the average inter-particle separation.

Figure 2.
Elements and electrical model of a FSR connected to an external sourcing, VFSR. (a) Series connection of a rectangular potential barrier with the contact resistance (Rc), (b) Simplified sketch for the series connection between the contact resistance, Rc, and the bulk (tunneling) resistance, Rbulk. (c) Representation of a rectangular potential barrier with height Va and width s. The particle shown is an electron with energy E.
The incident particle is an electron with energy, E. By definition, the electron energy can be decomposed in kinetic and potential energy; the former term can be found from the Fermi-Dirac probability distribution, whereas the latter is user-selectable as the voltage across the sensor is set by the final application circuit. The ratio between Vbulk and the current (I) is by definition the resistance of the CPC, Rbulk. The solution for this problem was found by Simmons on the basis of the WKB approximation for the Schrödinger equation [29].
In order to calculate the tunnelling resistance, Rbulk, the following parameters must be considered: height of the rectangular potential barrier (Va), voltage across the CPC, Vbulk, and average inter-particle separation, s. Based upon theoretical work from Simmons [29], it is only possible to state Rbulk in a close form when Vbulk is in the millivolt range; this region shows a linear (ohmic) response for the tunneling barrier. For larger values of Vbulk, the tunneling barrier exhibits a non-linear current-voltage relationship (I-Vbulk). Considering that the transition between the linear and non-linear regions is ambiguous, the authors coined the definition of the millivolt threshold (Vth) [30]. A method to experimentally determine the exact value of Vth has been also presented by the authors at [30]. The expressions relating Rbulk to Va, Vth, s and σ are later presented in Section 2.4 because it is mandatory to introduce first the concept of contact resistance, Rc.
2.2. Contact Resistance (Rc)
The contact resistance can be found on the plastic and elastic interactions occurring between the conductive particles and the sensor electrodes at a microscopic level [22,30,37]. A detailed study on the contact resistance has been developed by Mikrajuddin et al. [38] and Shi et al. [39]. The contact resistance is determined by three parameters: particle diameter, type of interaction occurring between the interfaces (plastic or elastic interaction) and by the normal stress applied along the interacting surfaces. The pressure dependence on the contact resistance is stated in terms of power laws [38] with fixed coefficients that vary depending on the type of interaction. For large applied stresses, σ, the contact resistance decreases in the form of Rc ∝ σ−1/3 or Rc ∝ σ−1 for elastic and plastic interactions, respectively. However, in previous authors’ work [30] such coefficients (−1/3 and −1) were not experimentally measured because additional phenomena were occurring at a microscopic level.
Figure 3 depicts the roughness of surfaces at a microscopic level under null, small and large stress conditions. A similar sketch has been presented by Kalantari et al. [22]. At the null loading and small loading stages, see Figure 3a,b, only a few contact paths are formed between the top metal electrode and the conductive particles. Under this scenario, the Mikrajuddin et al. model [38] for the contact resistance can be certainly employed because Rc ∝ σ−1/3 or Rc ∝ σ−1 depending on the interaction type (plastic or elastic). However, with the application of a sufficiently large stress, see Figure 3c, new contact paths are formed, and thus, the fixed coefficients (−1/3 or −1) fail to provide a valid representation of the contact resistance.

Figure 3.
Representation of the interactions occurring at a microscopic level between the metal electrodes and the conductive particles under different conditions of stress. (a) At rest state (σ = 0), only a few contact paths are formed, (b) When subjected to a small stress, the number of contact paths does not grow, and the contact resistance is reduced following the Mikrajuddin et al. [38] and Shi et al. [39] models, (c) For a large applied stress, new contact paths are formed and therefore, the contact resistance is faster reduced than predicted by Mikrajuddin et al. [38] and Shi et al. [39].
In brief, when dealing with FSRs under conditions of incremental stresses, three phenomena occur simultaneously: first, the contact resistance of the already existing paths is reduced following power laws with fixed coefficients (−1/3 or −1), second, new contact paths are formed further contributing to reduce the contact resistance, and third, the average inter-particle separation is diminished thus reducing the tunneling resistance, Rbulk. The second phenomenon increases the effective area for tunneling conduction, A. Similarly, the net effect from the first and second phenomena is that the power law for modeling the contact resistance can not be formulated using the fixed coefficients reported by Mikrajuddin et al. [38]. In previous work, the authors experimentally determined the best suited coefficients for the power law describing the contact resistance; this was obtained for the FlexiForce A201-1 and Interlink FSR 402 sensors [30]. Finally, the following general form can be stated for the contact resistance:
where α and were determined for each sensor on an empirical basis. The term Rpar is the net resistance of the conductive particles, see Figure 1. In practice, the encapsulating material is tightly bonded around the sensor edges thus preloading the CPC with an offset stress, σ0. The practical consequence of this condition is that even at rest state (when σ = 0), a finite value of the contact resistance is measured. An exhaustive formulation for Equation (5) should include the offset contribution in the fraction denominator, (σ + σ0)α, but usually the magnitude of σ0 is negligible when compared to the external applied stress.
Although Rpar does not make part of the contact resistance, the method proposed by the authors simultaneously estimates , α and Rpar. It must be clarified that previous authors’ work [30] employed the letter k instead of α for the power law of Equation (5). However, since this study embraces the rheological model of the polymer composite (combination of spring and dampers), the letter k was kept for the elasticity constant of springs. In previous authors’ work [30], the experimental measurements of the contact resistance, Rc, were done as follows:
By applying large input voltages to the sensors, the contribution from the bulk resistance, Rbulk, can be assumed as negligible when compared to Rc. This is supported by the theoretical predictions from Simmons [29] and by experimental data [30]. Hence, the following approximation can be done for large values of VFSR: RFSR ≈ Rc. If the resistance data are fitted to the Mikrajuddin et al. model [38], a good fit is not obtained. Only by setting free the parameter α in Equation (5), a high coefficient of determination was obtained in the data fitting. Similarly, the inclusion of Rpar in the model was also necessary for the sake of the quantum point contacts.
2.3. Effective Area for Tunneling Conduction (A) and Stress−Strain (σ−ε) Relationship
Figure 3 depicts the interactions occurring at a microscopic level between the metal electrodes and the conductive particles. For incremental values of stress, the number of contact paths grows; this implies that the effective area for tunneling conduction must be stress-dependent. In authors’ previous work [30], it was proposed and tested the following model for the effective area, A:
where A0 is the effective for tunneling conduction at rest state. The parameters A1 and A2 were estimated from a data fitting process for the FlexiForce A201-1 and Interlink FSR 402 sensors [30]. The proposal of a stress-dependent area, A(σ), is consistent with the authors’ formulation for the contact resistance as in Equation (5). In other words, experimental data for the contact resistance could not be fitted to the Mikrajuddin et al. models [38] because more contact paths are created with incremental stresses, and correspondingly, the effective area for tunneling conduction also grows as in Equation (6) and Figure 3. Nonetheless, some studies hold a different opinion in regard to this fact. Kalantari et al. [22] and Zhang et al. [21] claimed that the effective area for tunneling conduction is stress-independent. Conversely, Wang et al. [1] and Knite et al. [26] proposed models for the tunnelling conduction with a multiplier factor that accounts for the creation/destruction of conductive paths with stress. On this topic, it must be recalled that under percolation regime, it is expected the destruction of conductive paths with incremental stresses [1,26].
A distinction must be introduced at this point. It is clear from Equation (6) that the effective area for tunneling conduction grows with incremental values of stress. However, the sensor physical area (AFSR) remains unaffected. This imposes a distinction between A(σ) and AFSR. When mechanical stress is computed from the applied force (F), the quotient F/AFSR must be calculated. However, when dealing with electrical phenomena, the usage of A(σ) is mandatory.
Finally, given the compressive modulus of a material (M), the following expression relates the applied stress, σ, with strain (ε):
Equation (7) is useful for describing the mechanical interactions occurring in the CPC, see Figure 1 and Figure 2c, where s0 and s are the average inter-particle separation at rest state and under loading condition, respectively. Equation (7) can be also stated in terms of the applied force, F, as next:
2.4. Authors Proposed Model for the Quantum Tunneling Conduction of Force Sensing Resistors (FSRs) under Conditions of Static Loading
Following the same procedure from previous authors’ work [30], it is possible to obtain a general model for the quantum tunneling conduction of CPCs and FSRs; this can be done by combining Equations (4)–(7) with the piecewise model provided by Simmons [29]. The usage of Equation (1) is limited only to the linear (ohmic) region of CPCs and FSRs. By combining the Ohm’s law with Equations (1) and (4), the piecewise intervals can be stated in terms of Vbulk, where Vbulk = VFSR − 2·I·Rc, and VFSR is the voltage across the FSR as in Figure 2. Finally, the authors’ proposed model for the current conduction of FSRs is next presented using piecewise equations.
If VFSR − 2·I·Rc < Vth, Equations (1), (6), (7) and (25) from Simmons [29] are combined to obtain:
where h is the Planck constant and m, e are the electron mass and charge, respectively. The height of the potential barrier, Va, has the same meaning from Figure 2c. For simplification purposes, the expression for the contact resistance, Rc, has not been explicitly stated in Equation (9), but it can be found on Equation (5). The same consideration is held for upcoming Equations (10) and (11).
If Vth < VFSR − 2·I·Rc < Va/e, Equations (4), (6), (7) and (27) from Simmons [29] are combined so that Vbulk is stated in terms of VFSR and Rc.
If VFSR − 2·I·Rc > Va/e, Equations (4), (6), (7) and (30) from Simmons [29] are combined so that Vbulk is stated in terms of VFSR and Rc.
Equations (9)–(11) model the current voltage relationship, I–VFSR, of FSRs under conditions of static loading, where static loading implies that the applied stress does not change with time and that the drift response in sensor output is neglected. Dependence upon the sourcing voltage is evident from Equations (10) and (11). In practice, this produces a non-linear I–VFSR relationship when Vbulk is greater than Vth. This has been experimentally measured by the authors; reader may refer to Figures 11 and 12 at [30]. Only when Vbulk < Vth, the FSRs exhibits a linear I–VFSR relationship. In practice, this occurs when VFSR is below 73 mV and 140 mV for the FlexiForce A201-1 and Interlink FSR 402 sensors, respectively [30].
2.5. A Review on Previous Models for the Creep Behavior of Conductive Polymer Composites (CPCs)
When a polymer sample is loaded to constant stress for an extended period of time, a creep behavior is expected in the physical dimensions of the specimen; this is caused by the rheological properties of the polymer. The mechanical creep produces a drift in the electrical resistance of the specimen; this is mainly caused by the creep in the inter-particle separation, s. Henceforth in this article, the designations of creep and drift are indistinctly employed when discussing about such phenomenon.
Several authors have modeled the creep response of FSRs manufactured from CPCs [40,41,42,43], but to authors’ criteria the models from Zhang et al. [21] and Kalantari et al. [22] are the most representative ones; the former study is a mandatory reference in the field of polymer composites with over 130 citations according to the Web of Science (as in September 2017), the latter study is also representative because it embraced multiple parameters: contact resistance, particle dimension and the creep behavior of a Zener rheological element.
The studies from Zhang et al. [21], and Kalantari et al. [22] hold a different opinion in regard to the voltage-dependent behavior of thin insulating films. The aforesaid authors have modeled the tunneling conduction by relying solely on Equation (25) from Simmons [29], and therefore, they have proposed theoretical models similar to Equation (9). To authors’ criteria, this consideration is valid but the condition imposed by Simmons [29] must be fulfilled first, i.e., the voltage across the insulating barrier must be in the millivolt range, or in terms of the authors’ nomenclature Vbulk < Vth, see Equation (9). However, Zhang et al. [21] and Kalantari et al. [22] performed experimental measurements over FSRs using digital multimeters and amplifiers with VFSR = 5 V. Such experimental setups do not meet the Simmons’ requirement stated in Equation (25) at [29]. Conversely, the models and procedures from this article do take into account the sourcing voltage as a parameter, see Equations (9)–(11).
The time-dependent models from Zhang et al. [21] and Kalantari et al. [22] are presented next; the original notation from such authors has been kept in this article. Likewise, it must be highlighted that Zhang et al. [21] solely embraced in their study the tunneling resistance and neglected the contribution from the contact resistance. Hence, for the sake of understanding the model from Zhang et al. [21], Equation (1) is simplified to RFSR = Rbulk = R(t), where R(t) is the time-dependent resistance of the polymer composite as proposed by Zhang et al. [21]:
where R0 is the composite resistance immediately upon the application of stress, i.e., R0 = R(t = 0), D is the particle diameter and θ is the filler volume fraction. Zhang et al. [21] employed the Nutting equation to describe the creep response of CPCs when subjected to constant stress for extended periods of time. The Nutting equation relates the original strain () with the time-dependent strain, ε(t) as next:
Zhang et al. [21] reported that the parameters ψ and n from the Nutting model were experimentally determined using a data fitting tool.
On the other hand, the time-dependent model from Kalantari et al. [29] embraces both resistance contributions: the contact resistance and the bulk resistance. Hence, according to Kalantari et al. [22], the total resistance across the polymer composite, Rtotal(t), can be stated as a sum following the same formulation from Equation (1):
where ρ1, ρ2 are the electrical resistivity of the polymer composite and the metal electrodes, respectively, H is the Meyer hardness of the softer element, and E0, E1, μ1 are the parameters of a Zener element as shown on Figure 4. Considering that the Kalantari et al. model [22] is based upon previous work from Zhang et al. [21], the former also required that experimental measurements of the electrical resistance were performed, see the R0 symbol in Equation (14). The symbols D, θ have the same meaning in both Equations (12) and (14). The usage of force, F, rather than stress, σ, has been preferred by Kalantari et al. [22]. The relationship between both magnitudes of stress and strain was previously given on Equations (7) and (8).
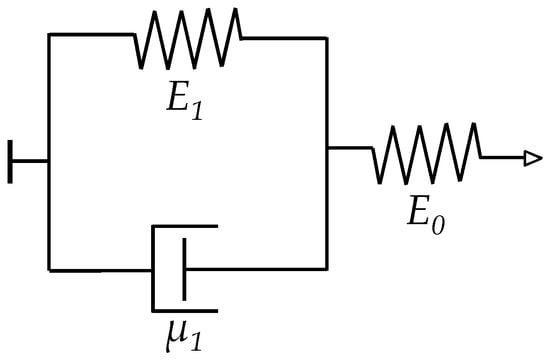
Figure 4.
Rheological model for a Zener element [44] comprising two springs (E0, E1) and a dashpot (μ1).
3. Modeling and Simulation of the Creep Response of FSRs
When Equations (9)–(11) are combined with a rheological model [44], a voltage-dependent behavior is expected for the drift response of FSRs, i.e., different creep rates are expected depending on the value of VFSR. Conversely, previous creep models proposed by Zhang et al. [21] and Kalantari et al. [22] predict a voltage-independent behavior for the creep response of FSRs, see Equations (12) and (14).
In order to combine Equations (9)–(11) with the best suited rheological model, the stress–strain (σ–ε) relationship from Equation (7) must be replaced by a time-dependent expression; this implies the formulation of a time-dependent inter-particle separation, s. However, by recalling authors’ statements from Section 2.1, Section 2.2 and Section 2.3, the effective area for tunneling conduction, A, is also influenced by the applied stress, σ, and consequently, the creep response of the effective area should embrace time-dependency as well, i.e., Equation (6) needs to be modified so that time-dependency is explicitly stated. This is not surprising because as time goes by, the polymer creeps and more contact paths could be created amid a constant applied stress; see Figure 3.
For such reasons, the resulting creep model should include explicit time-dependency in both: the inter-particle separation, s, and the effective area for tunneling conduction, A. Moreover, the formulation of the contact resistance should be also modified since alterations on the effective area also impact over the contact resistance, see Figure 3. On this topic, it must be remarked that neither Mikrajuddin et al. [38] nor Shi et al. [39] stated time-dependency in their models for the constriction (contact) resistance, but given the rheological behavior of polymers, the contact resistance could also creep due to the increment (or probably decrement) in the number of contact paths over time.
In brief, a comprehensive model for the creep response of FSRs should include time dependency on the following parameters: inter-particle separation, s, effective area for tunneling conduction, A, and contact resistance, Rc. Finally, the creep response of s, A and Rc must be embraced in the tunneling conduction model of Equations (9)–(11). However, it is foreseeable that the resulting creep model turns out to be too complex in order to be usable in practice; this is so because it is difficult to simultaneously study the creep response of these three magnitudes: s, A and Rc.
With the aim of proposing a valid yet simple enough model, it is assumed as an initial approximation that the effective area remains unchanged over time; this consideration implies that Rc is also time-invariant. Only the creep response in the inter-particle separation is henceforth embraced. Later in Section 4.3, a discussion is presented about the possible creep behavior of the effective area.
3.1. Derivation of a Model for the Creep Behavior in the Inter-Particle Separation of FSRs
Some authors have employed the Zener element from Figure 4 to model the creep behavior of FSRs [22]. Some others have chosen the Burgers model [42,43] instead. In this study, the more general Burgers model is employed. When required, some elements from the Burgers model are discarded to yield the simpler Zener model. Figure 5 shows a sketch of a Burgers element with corresponding symbols k1, k2, b1 and b2.
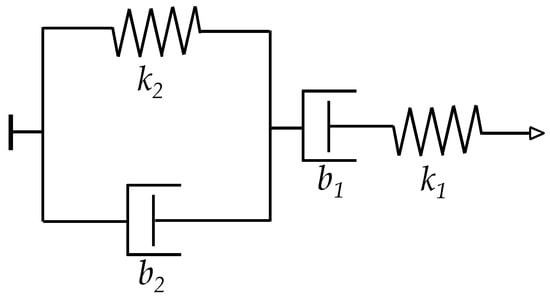
Figure 5.
Generalized Burgers model [44] comprising two springs (k1, k2) and two dashpots (b1, b2).
The σ–ε relationship for a Burgers element is given by the following equation:
Given the input stress:
where U(t) is the Heaviside function and B is the amplitude of the applied stress. The solution for the Burgers model can be stated as [44]:
Hence, an expression for the time-dependent inter-particle separation, s(t), can be found by combining Equations (7) and (17) as next:
Finally, if A and Rc are assumed as time-invariant, the creep model can be assembled by replacing Equation (18) into the corresponding expressions from Simmons [29]. The following procedure is quite similar to what previously described on Section 2.4.
If VFSR − 2·I·Rc < Vth, Equations (1), (6), (18) and (25) from Simmons [29] are combined to obtain:
If Vth < VFSR − 2·I·Rc < Va/e, Equations (4), (6), (18) and (27) from Simmons [29] are combined to obtain:
If VFSR − 2·I·Rc > Va/e, Equations (4), (6), (18) and (30) from Simmons [29] are combined to obtain:
Following with previous considerations from Section 2.4, Vbulk was stated in Equations (19)–(21) using the definition Vbulk = VFSR − 2·I·Rc, where Rc is given by Equation (5), and s(t) is given by Equation (18).
3.2. Influence of the Sourcing Voltage, VFSR, in the Creep Behavior of FSRs: Simulation and Analysis
The creep response of FSRs can be studied in detail by simulating the stress input from Equation (16) over the Equations (19)–(21). The procedure is next summarized: given the sensor’s parameters: A0, A1, A2, Va, s0, Rpar, α, and given the stress-strain relationship with parameters k1, k2, b1, b2. It is possible to calculate how the inter-particle separation, s(t), creeps over time using Equation (18). And then, the s(t) data can be employed to simulate how sensor current creeps, I(t). This last step involves the usage of Equations (19)–(21). By definition, the parameters from the Burgers model (k1, k2, b1, b2) are voltage-independent; and therefore, ε(t) and s(t) are voltage-independent as well. Nonetheless, when VFSR is changed, different creep behaviors are expected in sensor current as predicted by Equations (19)–(21).
Previous authors’ work has found sensor parameters for the FlexiForce A201-1 [23] and Interlink FSR 402 [24] sensors [30]. Table 1 presents such parameters which were also employed in the simulation of this Section. Nonetheless, previous authors’ work comprised the application of static forces [30]. In practice, this implied that experimental data were gathered immediately after the application of stress and right after, a new stress was applied followed by a new measurement. Under this scenario, the compressive modulus, M, from Equation (7) can be matched to k1 in the Burgers model of Figure 5. Hence, the substitution k1 = M was made for simulation purposes. Unfortunately, the values of k2, b1, b2 were not so easy to determine because direct measurements of strain creep, ε(t), could not be performed, i.e., only creep of current, I(t), is measurable. For this reason; k2, b1, b2 could not be rigorously determined, but some conditions can be stated to keep the creep response within reasonable values reported by previous studies [14,34,45]. Such conditions are next discussed.

Table 1.
Sensor parameters for the FlexiForce A201-1 [23] and Interlink FSR 402 [24] sensors as reported by previous authors’ work [30].
Note from Equation (18), that the quotient b2/k2 defines the time constant for the creep response. According to experimental results reported by Otto et al. [34], the time constant for the FlexiForce sensors is around 500 s, and therefore, the quotient b2/k2 was set to 500 in the simulation. The creep slope is uniquely defined by the parameter b1, but as previously stated, an absolute value for b1 could not be determined because only indirect measurements of current creep, I(t), were available.
The simulation code has been included in this article as supplementary material. The user can select any value for k1, k2, b1, b2, and similarly, the sensor’s parameters (A0, A1, A2, Va, s0, Rpar, α, ) are customizable as well. It must be stated that the simulation target is not to find the optimal values of k1, k2, b1, b2 that resemble the most the experimental data, but instead, to study how the sourcing voltage, VFSR, influences the creep of current, I(t).
Although, many authors have thoroughly studied the creep response of CPC [14,45], the authors have chosen Otto et al. [34] as the source to determine the parameters k2, b1 and b2; this was done because Otto et al. reported creep curves consistent with the Burgers model from Equations (17) and (18). Conversely, previous studies from and Dabling et al. [32], Komi et al. [45] and Lebosse et al. [46] reported creep curves which do not agree with the Burgers model. The authors’ decision on choosing the experimental data from Otto et al. [34] should not be taken as a simplification, because as later demonstrated in Section 4.2, the simulation results actually predict—up to some extent—the simpler creep curves reported by other studies [32,45,46].
The creep of strain, ε(t), has been simulated and plotted on Figure 6 for different values of k2, b1 and b2 when loaded to a constant stress of σ = 200 KPa. The values of k1 were taken from Table 1 for each sensor model. It must be remarked that ε(t) is a dimension-less parameter, see Equation (7).
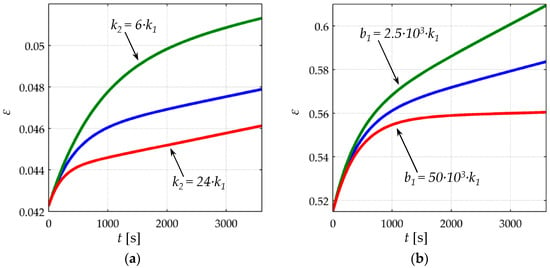
Figure 6.
Simulated data for the creep of strain ε(t) for the (a) FlexiForce A201-1 [23] and (b) Interlink FSR 402 [24] sensors when loaded to σ = 200 KPa. Blue lines: simulations obtained on the basis of the Burgers model with parameters k2 = 12·k1, b1 = 5 × 10³·k1 and b2 = 72 × 103·k1, where the compressive modulus of each sensor (k1) was taken from Table 1. Green and red lines: creep of strain is plotted for modified values of k2 and b1, where the rest of parameters have remained unchanged.
From Figure 6, it can be noticed that smaller values of k2, b1 yield larger strain creep, ε(t). The dashpot constant b2 influences the time constant of the creep response, but b2 does not modify the magnitude of the creep itself. For the sake of reducing the number of figures and to simplify the analysis, the following set of values was chosen for the rheological parameters of the Burgers model; k2 = 10·k1, b2 = 5000·k1, and b1 = 70 × 103·k1, where the spring and dashpot constants are in SI units. The condition b2/k2 = 500 is maintained as to be consistent with the results reported by Otto et al. [34]. The rest of parameters (k1, A0, A1, A2, Va, s0, Rpar, α, ) were chosen to be those from the FlexiForce A201-1 sensor as in Table 1. The aforesaid values of k2, b1, and b2 were used for all the simulation from Section 3 and Section 4. Nonetheless, it must be remarked that similar results can be obtained for any set of parameters; this can be verified by running the simulation code available as supplementary material.
Figure 7 shows simulated data for the drift of sensor current when loaded to different stresses (σ = 50 KPa, 100 KPa, 150 KPa, 200 KPa) at the following input voltages; VFSR = 30 mV, 220 mV, 0.4 V and 2 V. The data from Figure 7 are normalized as follows:
where drift(t) is the normalized current drift in percentage, I(t) is the sensor current estimated on the basis of Equations (19)–(21), and I(0) is the sensor current immediately upon the application of stress, i.e., I(0) is obtained by substituting t = 0 in Equations (19)–(21).
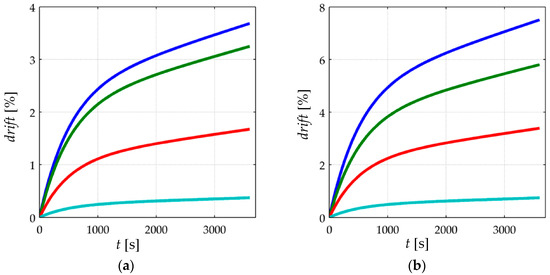
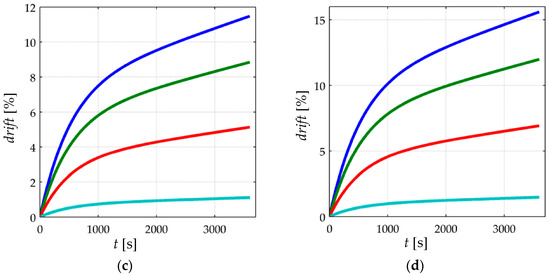
Figure 7.
Simulation of the normalized current drift, drift(t), for the FlexiForce A201-1 sensor when loaded to (a) σ = 50 KPa, (b) σ = 100 KPa, (c) σ = 150 KPa and (d) σ = 200 KPa at different input voltages, VFSR = 30 mV (blue), 0.22 V (green), 0.4 V (red) and 2 V (cyan). The rheological parameters for the simulation were set to: k2 = 10·k1, b2 = 5000·k1, and b1 = 70 × 103·k1. The electrical parameters are available on Table 1.
Two different observations can be identified from the simulation of Figure 7; the creep reduction for incremental input voltages, VFSR, and the creep increment for large applied stresses. Each observation is next addressed.
3.2.1. Creep of Current for Incremental Values of the Input Voltage, VFSR
For a given stress, the creep of sensor current increases for lower values of VFSR. Conversely, for larger values of VFSR, a lower creep of current is expected. This is in contradiction to what the manufacturers of FSRs have reported in their product datasheets. By looking at the drift characteristic of the FlexiForce [23], Interlink [24] and Peratech [25] sensors, the manufacturers report a voltage-independent drift for all sensor models. Nonetheless, the experimental results from Section 4 support the simulation results.
With the aim of understanding the influence of VFSR over sensor creep, some facts must be recalled. First, the contact resistance, Rc, and the bulk resistance, Rbulk, are connected in series so that the total resistance, RFSR, is the sum of both contributions as stated in Equation (1). Second, neither Mikrajuddin et al. [38] nor Shi et al. [39] stated time-dependency in their models for the contact resistance, and therefore, the bulk resistance is the only source of creep in Equations (19)–(21). And last, according to the authors’ model for tunneling conduction [30], see Section 2.4, the bulk resistance decreases for incremental values of VFSR, whereas Rc is voltage independent.
In the limit case when VFSR ≈ 0, Rbulk dominates over Rc, and thus, the latter can be neglected. Conversely for large values of VFSR, Rbulk is comparable—or even smaller—than Rc. The non-linear and voltage-dependent behavior of RFSR has been plotted on Figure 8 for a better comprehension at two different stresses. The plot of Figure 8 does not take into account the creep of RFSR and only shows how Rbulk and RFSR are modified by VFSR.
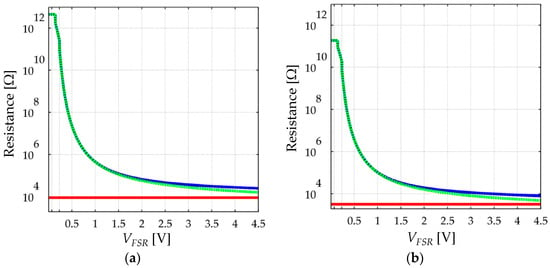
Figure 8.
Simulation plots of the total resistance, RFSR (blue), bulk resistance, Rbulk (green-dashed), and contact resistance, Rc (red), at two different stresses. (a) σ = 50 KPa and (b) σ = 300 KPa. Simulation done on the basis of Equations (9)–(11) using the parameters from Table 1 for the FlexiForce A201-1 sensor.
When dealing with sensor creep, the smaller Rbulk is, the less creep is observed in sensor current; this occurs because the only source of creep is Rbulk itself, and consequently, the creep in Rbulk is negligible when compared to the time- and voltage- independent Rc; this condition is observable only when VFSR is large enough so that Rbulk and Rc are similar, see Figure 8. Conversely, for low values of VFSR, Rbulk dominates over Rc, and therefore, the assumption RFSR ≈ Rbulk can be made with negligible error. Under such circumstances, a larger creep in sensor current is expected because the creep in Rbulk is not biased by Rc. This analysis is supported by experimental observations from Section 4.
3.2.2. Creep of Current for Incremental Applied Stresses
The simulation from Figure 7 predicts that for a constant applied voltage and incremental stresses, a larger drift of current is expected. In other words, Equations (19)–(21) predict that drift(t) grows for incremental values of stress at constant VFSR. Unfortunately, the experimental observations from Section 4 do not support the simulation predictions. Some possible reasons for this inconsistency are given later on Section 4.
4. Experimental Results and Discussion
Before presenting the experimental results, some relevant considerations are addressed. First, particle distribution along the CPC is random; this influences the overall response of each specimen in terms of: sensitivity, creep, and sensitivity degradation. Sensor sensitivity is measured in units of Amperes per Pascal. However, it is common to find sensitivity units of Ohms per Pascal or Volts per Pascal [3,14,18]. A FSR with a large sensitivity exhibits a surge in sensor current when subjected to stress.
For the sake of providing representative results, a total of sixteen specimen of each sensor model were embraced. Hence, experimental results are presented using a statistical approach. The time response of individual sensors is also considered.
Second, some experimental phenomena are in concordance with the authors’ proposed model from Section 3, whereas some others not; this implies that the model may require further refinement in later studies. The model limitations are clearly stated on each mismatch between simulation and experimental data.
And last, a tailored test bench was assembled to handle up to sixteen sensors simultaneously. The test bench has been thoroughly described in previous authors’ works [30,47], and therefore, only a brief description is here presented.
4.1. Test Bench for Gathering Sensor Data
The tailored test bench consists in a temperature chamber with an on-top linear motor and a load cell, see Figure 9a. When analyzing the creep response of FSRs, the specimens were arranged in a sandwich-like configuration. However, during dynamic (cyclic) loading, a single sensor was embraced in the mechanical set-up; this was done to reduce the mechanical compliance of the system that may cause reading inaccuracies. The sensors were bonded to sensor holders to avoid undesired displacement during testing as shown on Figure 9b.
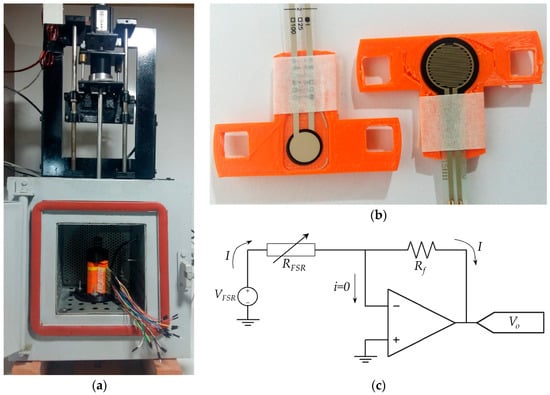
Figure 9.
Test bench for gathering sensor data. (a) Overview of the mechanical set-up showing the load cell, the linear motor for the application of dynamic forces and the temperature chamber with the sixteen sensors in sandwich configuration. (b) Sensor holders for the FlexiForce A201-1 and Interlink FSR 402 sensors. (c) Amplifier in inverting configuration to drive each FSR with a constant voltage.
The electrical set-up is based on a time-multiplexed amplifier in inverting configuration that ensures a fixed voltage, VFSR, across each FSR, see Figure 9c. Time-multiplexing was available from the integrated circuit ADG444 which has been omitted from Figure 9c for simplification purposes. Time-multiplexing was necessary to drive the sixteen sensors using a single amplifier. Simpler circuits such as voltage dividers or Wheatstone bridges do not ensure a constant VFSR across the sensor, and consequently they have been discarded. The importance of controlling VFSR is evident from the non-linear behavior of sensor resistance, see Figure 8. Nonetheless, several authors have employed voltage dividers [22,48] or digital multimeters to readout sensor’s resistance [1,21,49,50]. To authors’ criteria, the usage of such circuits jeopardizes the repeatability of results because by simply changing the multimeter range, a different resistance is measured. A more thorough discussion about this topic is presented on Section 4.5. Finally, sensor variables (current and resistance) can be estimated on the basis of the following equations that relate VFSR with the amplifier output, Vo, and the feedback resistor, Rf.
By replacing I(t) = VFSR/RFSR in Equation (23), it is possible to estimate sensor resistance at a given input voltage:
4.2. Creep Response of FSRs at Different Voltages
The creep test consisted in the application of a constant stress at different voltages whilst registering the drift characteristic of each specimen. The creep test was repeated three times for the application of the following forces; F = 1.96 N, 4.9 N and 9.8 N. The input voltages for the A201-1 sensors were VFSR = 0.1 V, 0.2 V, 0.5 V, 0.75 V, 1 V, 2 V, 3 V, 4.5 V, 6 V, 7.5 V and 9 V. Similarly, the input voltages for the FSR 402 sensors were VFSR = 0.1 V, 0.2 V, 0.5 V, 0.75 V, 1 V, 2 V, 3 V, 4 V, 5 V, 6 V and 7 V. Lower input voltages were applied to the FSR 402 sensors because they exhibited larger capability of current handling (larger sensitivity) that saturated the amplifier output of Figure 9c. Another reason to lower VFSR was to avoid joule heating in the FSR 402 sensors. It must be highlighted that each sensor model has a different physical area, AFSR, and thus, the resulting stresses are different. The A201-1 and FSR 402 sensors have physical dimensions equal to 41.85 mm2 and 183.85 mm2, respectively.
With the aim of synthetizing the information from the thirty two specimens, current drift from Equation (22) was computed only at t = 3600 s; this yields the drift in sensor current after one hour of operation, drift(t = 3600 s). This procedure was repeated at the aforementioned forces for the thirty two specimens. Figure 10 and Figure 11 show box plots of drift(t = 3600 s) for the A201-1 and FSR 402 sensors, respectively. Figure 12 shows the drift response of two specimens in a time-fashion for multiple VFSR.
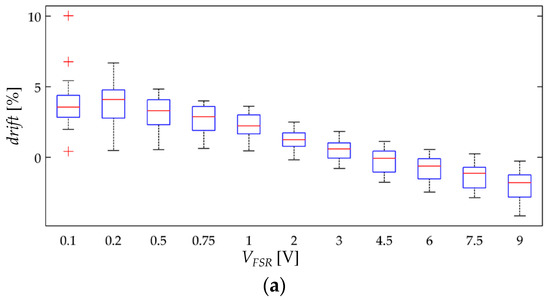
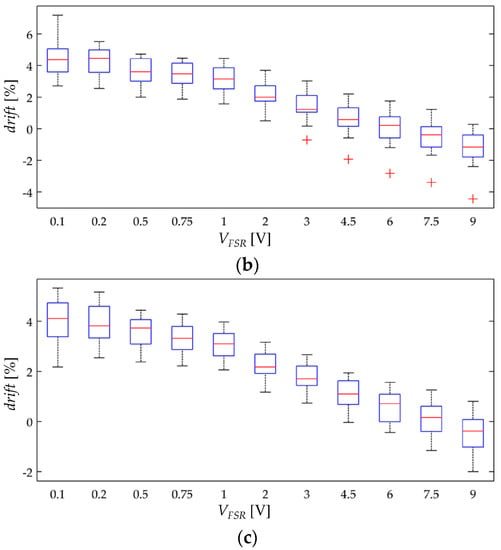
Figure 10.
Box plots for the drift of sensor current after one hour of operation, drift(t = 3600 s), when operating at multiple voltages, VFSR. Drift data calculated from Equations (22) and (23) for sixteen FlexiForce A201-1 sensors at (a) σ = 42.1 KPa, (b) σ = 105.4 KPa and (c) σ = 210.8 KPa.
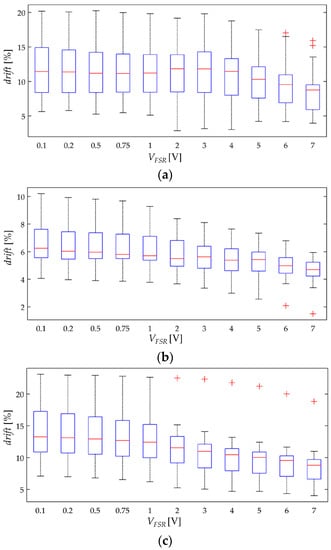
Figure 11.
Box plots for the drift of sensor current after one hour of operation, drift(t = 3600 s), when operating at multiple voltages, VFSR. Drift data calculated from Equations (22) and (23) for sixteen Interlink FSR 402 sensors at (a) σ = 13.1 KPa, (b) σ = 32.8 KPa and (c) σ = 65.6 KPa.
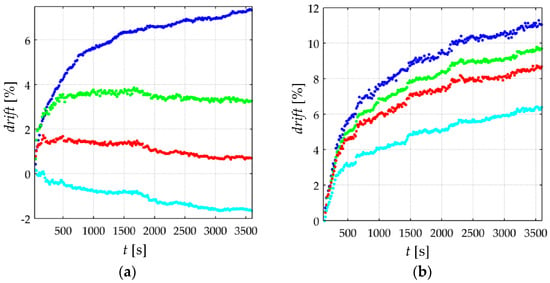
Figure 12.
Time plots for the drift of sensor current calculated from Equation (22) at different voltages. Data taken for the (a) FlexiForce A201-1 sensor at σ = 210.8 KPa for VFSR = 1 V (blue), 2 V (green), 6 V (red) and 9 V (cyan) and (b) Interlink FSR 402 sensor at σ = 65.6 KPa for VFSR = 0.2 V (blue), 2 V (green), 3 V (red) and 7 V (cyan).
The experimental results from Figure 11 are in concordance with the simulation results from Figure 7, i.e., the larger VFSR the lower the current creep in the sensor. The same conclusion can be stated by looking at the time plot from Figure 12b. In brief, Equations (19)–(21) predict the creep response of the Interlink FSR 402 sensors when operating at different voltages for extended periods of time at constant stress.
On the other hand, the experimental results from Figure 10 and Figure 12a are partially in concordance with the model from Section 3. For voltages below 3 V, the same conclusion from above can be stated, i.e., the FlexiForce A201-1 sensor exhibit less drift for incremental values of VFSR. However, for input voltages over 3 V, a negative drift is observed after one hour of operation. It must be remarked that the simulation from Figure 7 never predicts a negative drift; this is so because strain is a monotonic increasing function, see Equation (17) and Figure 6.
Nonetheless, it must be remarked that the negative drift from Figure 10 and Figure 12a has been reported by previous studies, e.g., readers may refer to: Figure 5b in Komi et al. [45], and Figure 3 in Dabling et al. [32]. Conversely, some other authors have reported positive drift for the A201-1 sensors, e.g., readers may refer to Figure 4 in Otto et al. [34] and Figure 2 in Hollinger and Wanderley [51]. This inconsistency in the drift characteristic has gone unnoticed up to now, but when looking at Figure 10 and Figure 12a, it can be stated that negative drift occurs only when the sourcing voltage is greater than 3 V; this observation is in contradiction to what the manufacturer of the A201-1 sensor has stated in the device datasheet [23,52]. And more important, by looking at the different drift curves from Figure 12a, it is theoretically possible to estimate the best suited voltage that minimizes sensor creep. In other words, there should be a VFSR so that drift(t = 3600 s) = 0%. Such an investigation is out of the scope from this study, but it defines future authors’ work.
Similarly, note that the green curve from Figure 12a is typical of a Zener rheological element. The drift response of a Zener element can be obtained from the Burgers model by taking in Equation (18). When VFSR is large enough, the contribution from b1 is negligible and only the creep contribution from k1, b2 and k2 is important thus yielding a Zener-like creep behavior. Such a response has been predicted in the cyan curves from Figure 7. The Zener-like creep curve from Figure 12a has been previously reported by Lebosse et al. [46], readers may refer to Figure 5 at [46].
Unfortunately, the negative drift can not be predicted by the model from Section 3; this logically implies that additional phenomena is occurring at a microscopic level that is not accounted by Equations (19)–(21). The authors can only provide some hypothesizes and observations in regard to the underlying basis for the negative drift, e.g., by looking at the multiple box plots from Figure 10, it can be stated that negative drift is a stress-independent phenomenon. Although additional observations may be required, it is interesting to note that none Interlink FSR 402 sensor exhibited negative drift. Both sensors are manufactured from similar materials [53,54,55,56], but the most remarkable difference between them is the electrode configuration. Wang et al. [57] have comparatively studied how the electrode configuration influences the creep response of CPCs. In brief, the FSRs employing ‘Nonalignment Electrodes Element (NAEE)’ exhibited considerably less drift than the FSRs employing the ‘Traditional Sandwich Element (TSE)’. Unfortunately, a voltage sweep has not been performed by Wang et al. [57], so it is not possible to carry out a comparative analysis from Wang’s et al. observations. The FSR 402 sensor employs the NAEE configuration, whereas the A201-1 sensor uses the TSE. Finally, it is later demonstrated on Section 4.4 that negative drift and sensitivity degradation are closely related phenomena that occur on similar circumstances.
4.3. Creep Response of FSRs at Different Stresses
The simulation results from Figure 7 predict that for incremental stresses, σ, a larger drift is expected. Nonetheless, the experimental results are in contradiction with the simulation. Figure 13 and Figure 14 show box plots for drift(t = 3600 s) but represented so that the x-axis matches for the input stress, and the y-axis matches for drift(t = 3600 s) at a given input voltage. By doing this, it is possible to study how the applied stress influences the creep response. It is evident from Figure 13 and Figure 14 that a clear trend cannot be identified, which is contradiction with the simulation.

Figure 13.
Box plots for the drift of sensor current after one hour of operation, drift(t = 3600 s), when operating at different stresses, σ. Drift data calculated from Equations (22) and (23) for sixteen FlexiForce A201-1 sensors at (a) VFSR = 0.5 V, (b) VFSR = 1 V and (c) VFSR = 4.5 V.

Figure 14.
Box plots for the drift of sensor current after one hour of operation, drift(t = 3600 s), when operating at different stresses, σ. Drift data calculated from Equations (22) and (23) for sixteen Interlink FSR 402 sensors at (a) VFSR = 1 V, (b) VFSR = 4 V and (c) VFSR = 7 V.
Following with the methodology from Section 4.2, the authors can only hypothesize for the underlying basis of the model mismatch. However in this case, it is easier to aim a possible cause. When the creep model was derived in Section 3, it was stated three possible sources for the creep response: creep in the inter-particle separation, creep in the effective area for tunneling conduction, and creep in the contact resistance. The simulation from Figure 7 only took into account the creep contribution from the inter-particle separation, hence, it is logical to hypothesize that by including in the creep model the contribution from A and Rc, it is possible to provide a more accurate representation of the drift phenomenon. Unfortunately, to authors’ knowledge, little information has been published on this topic, so it is quite challenging to propose and test a valid model for the creep behavior of A and Rc.
The experimental observations from Figure 13 and Figure 14 suggest that the creep in the effective area is negative. A negative drift implies that the effective area for tunneling conduction is reduced as time goes by; such a behavior is required in order to compensate for the positive drift predicted by the simulations from Figure 7. Although negative drift may seem unlikely at a glance, it must be remembered that CPCs are not homogeneous, and therefore, some regions of the CPC may creep faster than others causing a net negative drift in the effective area for tunneling conduction.
4.4. Sensitivity Degradation. A Phenomenological Approach towards Its Understanding
When a FSR is subjected to dynamic (cyclic) loading, the non-linear phenomenon of sensitivity degradation is sometimes observed. The designation of sometimes is important because some authors have reported it [3,14,18,32], whereas some others not [12,34,51]. Sensitivity degradation has been also reported in strain sensors [31], and to authors’ criteria, it is currently a major drawback for the extensive usage of CPCs in force-sensing and strain-sensing applications. Sensitivity degradation implies that after a given number of loading-unloading cycles, the sensor sensitivity is degraded, and therefore, stress and/or strain can no longer be accurately measured. Sensitivity degradation is not exclusive of FlexiForce and Interlink sensors [14,32], but also, it has been reported by several authors who have developed custom-made force and strain sensors [3,18,31].
If Equations (19)–(21) are tested to a sine input stress of the form σ(t)= C + D·sin(2πft), the simulation plot from Figure 15 is obtained, where C, D and f are positive constants that meet C > D to ensure a positive stress. Note that creep in sensor current is observable, but no loss of sensitivity is predicted. Conversely, sensor current grows over time following a similar pattern to the simulation plot of Figure 7. In brief, the creep model from Section 3 is unable to predict the non-linear phenomenon of sensitivity degradation.
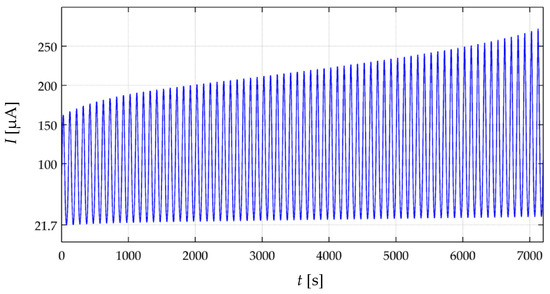
Figure 15.
Simulation plot of sensor current, I(t), when loaded to σ(t) = 200 KPa + 100 KPa·sin(2π10−2t) for two hours at VFSR = 6 V.
When testing the A201-1 and FSR 402 sensors to cyclic loading, sensitivity degradation occurred only at the input voltages that yielded a drift response not in concordance with the creep model of Section 3. For instance, if a given input voltage causes a drift behavior similar to the cyan curve from Figure 12a, then, such VFSR also causes sensitivity degradation in the device. This statement is yielded by experimentally testing the A201-1 sensors at the voltages specified at the beginning of this section. No sensitivity degradation was observed in any of the sixteen FSR 402 sensors. Figure 16 shows experimental data collected from an A201-1 sensor under dynamic loading at different voltages. The data from Figure 16a was collected at VFSR = 2 V, and consequently, sensitivity degradation was not observed. Conversely, when VFSR was set to 6 V in Figure 16b, sensitivity degradation became apparent after a few loading-unloading cycles.
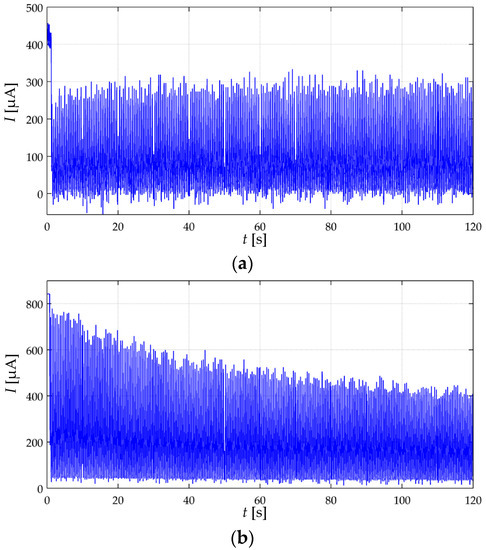
Figure 16.
Experimental data taken for the A201-1 sensor when loaded to σ(t) = 115 KPa + 95 KPa·sin(4 πt) at (a) VFSR = 2 V and (b) VFSR = 6 V.
Just as the negative drift reported in Figure 10, the underlying basis for the sensitivity degradation remains undisclosed. However, the authors have found that by keeping VFSR under 2 V, sensitivity degradation is avoided. The imposition of 2 V is stated following a safe margin criteria. By recalling the random distribution of the conductive particles along the polymer matrix, some A201-1 sensors exhibited sensitivity degradation starting at 3 V, whereas other specimens exhibited it at VFSR greater than 4.5 V. For this reason, the authors recommend that VFSR is held below 2 V in order to avoid it. Finally, it must be clarified that sensitivity degradation is not a phenomenon related with Joule heating. Temperature was monitored during all tests, and the power dissipated was kept below 100 mW for all sensors.
4.5. Importance of the Driving Circuit towards Obtaining Repeatable Measurements
The undesired phenomenon of sensitivity degradation has been thoroughly studied by Lebosse et al. [14,46]. In their studies, sensitivity degradation was modeled and compensated using exponentials which is a time- and resource-consuming task. In this article, it was demonstrated that sensitivity degradation can be avoided by simply setting VFSR below 2 V. Moreover, the accuracy and repeatability of the F-scan in-shoe Analysis System [58] has been a matter of discussing in several studies. Some authors have claimed that the F-scan system provides accurate plantar force profiles [13], whereas other studies have claimed the opposite [59,60]. Although the experimental set-up is not detailed in the F-scan datasheet [58], it is interesting to study if the repeatability of the F-scan System can be enhanced by setting VFSR below 2 V. The F-scan in-shoe Analysis System is also manufactured by Tekscan, Inc. (Boston, MA, USA) using the same technology available in the FlexiForce A201-1 sensor. Based upon reports from F-scan users provided by El Kati et al. [59], the F-scan system exhibited decrease in pressure insole output; this shows that the sensitivity of the Tekscan F-scan pressure insoles degrades rapidly during running, which indicates a limited durability and reliability. The experimental observations from El Kati et al. [59] are strong evidence of sensitivity degradation as previously described on Section 4.4.
Figure 17 shows sketches of FSRs driven by voltage dividers using unbuffered and buffered outputs. Under such scenario, the voltage drop across the sensor changes accordingly to the applied stress. If VS is chosen to be 5 V (as in many applications involving microcontrollers), the applied stress may produce a VFSR that causes sensitivity degradation in the device, i.e., if the applied stress is sufficiently large, VFSR may swing from a few millivolts up to 5 V. This set-up unavoidably yields sensitivity degradation in the device thus affecting the repeatability of results. A similar analysis is yielded if a multimeter is employed to readout sensor resistance. For such reasons, the authors discourage the usage of multimeters and voltage dividers to measure the resistance of FSRs, and instead, the authors encourage the usage of amplifiers in inverting configuration with VFSR held below 2 V.
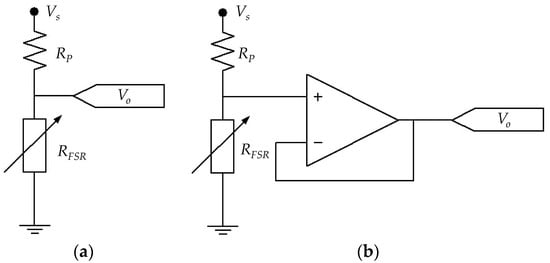
Figure 17.
Voltage dividers for driving FSRs using (a) an unbuffered output and (b) a buffered output.
An alternative method to obtain repeatable measurements is to employ a source meter unit, such as the Keithley 2635A, or a digital electrometer, such as the Keithley 6517A or the Keithley 6487. Source meter units and electrometers apply a fixed test voltage to the unknown resistance and measure the resulting current, so if VFSR is chosen accordingly, it is possible to avoid sensitivity degradation. It must be highlighted that even if sensitivity degradation is not observed, different resistance readings are yielded by simply changing the test voltage or the test current; this has been simulated and plotted on Figure 8. Therefore, when performing measurements over FSRs and CPCs, it is important to specify VFSR in order to ensure the repeatability of results in future studies. The usage of the Keithley 2635A and Keithley 6517A instruments has been reported by Canavese et al. [3,10] and by Cattin and Hubert [27], respectively. Similarly, Liu and Schubert have employed the Keithley 6487 picoammeter to measure sensors’ resistance [61].
5. Conclusions
A theoretical model has been derived and tested for the creep response of Conductive Polymer Composites (CPCs) and Force Sensing Resistors (FSRs). The creep model embraces multiple parameters regarding mechanical and electrical properties. However, the most important contribution of the proposed model is the ability to predict a voltage-dependent behavior for the creep response. The experimental measurements performed on thirty two FSRs demonstrated the validity of the proposed model to predict a lower creep in sensor current for incremental values of the sourcing voltage. Conversely, for small applied voltages, a larger creep in sensor current is expected. The voltage-dependent creep response is attributable to the non-linear (and voltage-dependent) behavior of the tunneling resistance, which exists along the multiple tunneling paths of CPCs. The proposed model was obtained through the combination of the Burger’s rheological model with the equations for the quantum tunneling conduction through thin insulating films. The parameters embraced by the model are listed next: (mechanical) spring and damper constants from the Burger’s rheological model, average inter-particle separation in the CPC, contact resistance, applied stress and effective area for tunneling conduction; (electrical) height of the rectangular potential barrier, electrical resistance of the conductive particles and applied voltage across the sensor.
Unfortunately, the proposed model was unable to predict some experimental observations. Specifically, the model predicts an increasing creep in sensor current for large applied stresses, but the experimental observations showed that the creep in sensor current is rather constant, thus independent of the applied stress. The authors hypothesize that the model mismatch is caused by the creep response in the effective area for tunneling conduction, such a phenomenon has not been accounted by the authors in this study, but it is currently a focus for future works.
The undesired phenomenon of sensitivity degradation has been also studied using a phenomenological approach. The underlying basis for sensitivity degradation could not be found, and similarly, the proposed model was unable to predict it. However, it was found that sensitivity degradation is a voltage-related phenomenon occurring only in the FlexiForce A201-1 sensor when the voltage across the device is over 3 V.
In order to enhance the accuracy and repeatability of measurements, the authors hypothesize that there should be an optimum sourcing voltage that minimize creep while avoiding sensitivity degradation in FSRs. Future authors’ work is also focused on this topic.
Supplementary Materials
The following are available online at www.mdpi.com/1996-1944/10/11/1334/s1, A script for Matlab R2014a has been included as supplementary material. The script simulates how the sourcing voltage influences the creep response of Force Sensing Resistors. Figure 7 was obtained from this script.
Acknowledgments
This work was supported by Colciencias through Francisco Jose de Caldas Fund (FP44842-335-2015) and by grant PI/UAN-2017-612GIBIO.
Author Contributions
Jorge O. Bareño and Arnaldo Matute performed the experiments and analyzed the data. Leonel Paredes-Madrid wrote the paper. Carlos A. Parra Vargas and Elkin I. Gutiérrez Velásquez provided general recommendations for the appropriate performing of the experimental tests.
Conflicts of Interest
The authors declare no conflict of interest.
References
- Wang, L.; Ding, T.; Wang, P. Influence of carbon black concentration on piezoresistivity for carbon-black-filled silicone rubber composite. Carbon 2009, 47, 3151–3157. [Google Scholar] [CrossRef]
- Mei, H.; Zhang, C.; Wang, R.; Feng, J.; Zhang, T. Impedance characteristics of surface pressure-sensitive carbon black/silicone rubber composites. Sens. Actuators A Phys. 2015, 233, 118–124. [Google Scholar] [CrossRef]
- Canavese, G.; Lombardi, M.; Stassi, S.; Pirri, C. Comprehensive Characterization of Large Piezoresistive Variation of Ni-PDMS Composites. In Mechanical and Aerospace Engineering, ICMAE2011. Appl. Mech. Mater. Trans. Tech. Publ. 2012, 110, 1336–1344. [Google Scholar] [CrossRef]
- Stassi, S.; Cauda, V.; Canavese, G.; Pirri, C. Flexible Tactile Sensing Based on Piezoresistive Composites: A Review. Sensors 2014, 14, 5296–5332. [Google Scholar] [CrossRef] [PubMed]
- Bloor, D.; Donnelly, K.; Hands, P.; Laughlin, P.; Lussey, D. A metal-polymer composite with unusual properties. J. Phys. D Appl. Phys. 2005, 38, 2851. [Google Scholar] [CrossRef]
- Stassi, S.; Canavese, G.; Cosiansi, F.; Gazia, R.; Fallauto, C.; Corbellini, S.; Pirola, M.; Cocuzza, M. Smart piezoresistive tunnelling composite for flexible robotic sensing skin. Smart Mater. Struct. 2013, 22, 125039. [Google Scholar] [CrossRef]
- Wang, L.; Han, Y. Application of carbon nanotube filled silicone rubber composite in stress measurement during ramped loading with low compression speed. Sens. Actuators A Phys. 2013, 201, 214–221. [Google Scholar] [CrossRef]
- Wang, L.; Li, J. A piezoresistive flounder element based on conductive polymer composite. Sens. Actuators A Phys. 2014, 216, 214–222. [Google Scholar] [CrossRef]
- Yousef, H.; Boukallel, M.; Althoefer, K. Tactile sensing for dexterous in-hand manipulation in robotics. A review. Sens. Actuators A Phys. 2011, 167, 171–187. [Google Scholar] [CrossRef]
- Canavese, G.; Stassi, S.; Fallauto, C.; Corbellini, S.; Cauda, V.; Camarchia, V.; Pirola, M.; Pirri, C.F. Piezoresistive flexible composite for robotic tactile applications. Sens. Actuators A Phys. 2014, 208, 1–9. [Google Scholar] [CrossRef]
- Silva, P.; Pinto, P.; Postolache, O.; Dias, J. Tactile Sensors for Robotic Applications. Measurement 2013, 46, 1257–1271. [Google Scholar] [CrossRef]
- Faraz, M.; Salcic, Z.; Wang, K. Analysis and selection of the Force Sensitive Resistors for gait characterization. In Proceedings of the 6th International Conference on Automation, Robotics and Applications (ICARA 2015), Queenstown, New Zealand, 17–19 February 2015; pp. 370–375. [Google Scholar]
- Verdejo, R.; Mills, N. Heel-shoe interactions and the durability of EVA foam running-shoe midsoles. J. Biomech. 2004, 37, 1379–1386. [Google Scholar] [CrossRef] [PubMed]
- Lebosse, C.; Renaud, P.; Bayle, B.; de Mathelin, M. Modeling and Evaluation of Low-Cost Force Sensors. IEEE Trans. Robot. 2011, 27, 815–822. [Google Scholar] [CrossRef]
- Tiwana, M.; Redmond, S.; Lovell, N. A review of tactile sensing technologies with applications in biomedical engineering. Sens. Actuators A Phys. 2012, 179, 17–31. [Google Scholar] [CrossRef]
- Dempsey, S.; Szablewski, M.; Atkinson, D. Tactile sensing in human-computer interfaces: The inclusion of pressure sensitivity as a third dimension of user input. Sens. Actuators A Phys. 2015, 232, 229–250. [Google Scholar] [CrossRef]
- Bernstein, J.; Cieplinski, A.; Degner, B.; Kerr, D.; Kessler, P.; Puskarich, P.; Coelho, M.H.; Pance, A. Touch Pad with Force Sensors and Actuator Feedback. US Patent 8,633,916, 21 January 2014. [Google Scholar]
- Ding, S.; Han, B.; Dong, X.; Yu, X.; Ni, Y.; Zheng, Q.; Ou, J.P. Pressure-sensitive behaviors, mechanisms and model of field assisted quantum tunneling composites. Polymer 2017, 113, 105–118. [Google Scholar] [CrossRef]
- Dahiya, R.; Metta, G.; Valle, M.; Sandini, G. Tactile Sensing From Humans to Humanoids. IEEE Trans. Robot. 2010, 26, 1–20. [Google Scholar] [CrossRef]
- Castellanos-Ramos, J.; Navas-Gonzalez, R.; Macicior, H.; Sikora, T.; Ochoteco, E.; Vidal-Verdu, F. Tactile sensors based on Conductive Polymers. Microsyst. Technol. 2010, 16, 765–776. [Google Scholar] [CrossRef]
- Zhang, X.; Pan, Y.; Zheng, Q.; Yi, X. Time dependence of piezoresistance for the conductor-filled polymer composites. J. Polym. Sci. Part B Polym. Phys. 2000, 38, 2739–2749. [Google Scholar] [CrossRef]
- Kalantari, M.; Dargahi, J.; Kovecses, J.; Mardasi, M.; Nouri, S. A New Approach for Modeling Piezoresistive Force Sensors Based on Semiconductive Polymer Composites. IEEE/ASME Trans. Mechatron. 2012, 17, 572–581. [Google Scholar] [CrossRef]
- Tekscan Inc. FlexiForce, Standard Force & Load Sensors Model A201. Datasheet. Available online: https://www.tekscan.com/sites/default/files/resources/FLX-A201-A.pdf (accessed on 16 June 2017).
- Interlink Electronics. FSR400 Series Datasheet. Available online: http://www.interlinkelectronics.com/datasheets/Datasheet_FSR.pdf (accessed on 16 June 2017).
- Peratech Inc. QTC SP200 Series Datasheet. Single Point Sensors. Available online: https://www.peratech.com/assets/uploads/datasheets/Peratech-QTC-DataSheet-SP200-Series-Nov15.pdf (accessed on 16 June 2017).
- Knite, M.; Teteris, V.; Kiploka, A.; Kaupuzs, J. Polyisoprene-carbon black nanocomposites as tensile strain and pressure sensor materials. Sens. Actuators A Phys. 2004, 110, 142–149. [Google Scholar] [CrossRef]
- Cattin, C.; Hubert, P. Piezoresistance in Polymer Nanocomposites with High Aspect Ratio Particles. ACS Appl. Mater. Interfaces 2014, 6, 1804–1811. [Google Scholar] [CrossRef] [PubMed]
- Roldughin, V.; Vysotskii, V. Percolation properties of metal-filled polymer films, structure and mechanisms of conductivity. Prog. Org. Coat. 2000, 39, 81–100. [Google Scholar] [CrossRef]
- Simmons, J. Electrical tunnel effect between dissimilar electrodes separated by a thin insulating Film. J. Appl. Phys. 1963, 34, 2581–2590. [Google Scholar] [CrossRef]
- Paredes-Madrid, L.; Palacio, C.; Matute, A.; Parra Vargas, C. Underlying Physics of Conductive Polymer Composites and Force Sensing Resistors (FSRs) under Static Loading Conditions. Sensors 2017, 17. [Google Scholar] [CrossRef] [PubMed]
- Lin, L.; Liu, S.; Zhang, Q.; Li, X.; Ji, M.; Deng, H.; Fu, Q. Towards Tunable Sensitivity of Electrical Property to Strain for Conductive Polymer Composites Based on Thermoplastic Elastomer. ACS Appl. Mater. Interfaces 2013, 5, 5815–5824. [Google Scholar] [CrossRef] [PubMed]
- Dabling, J.; Filatov, A.; Wheeler, J. Static and cyclic performance evaluation of sensors for human interface pressure measurement. Conf. Proc. IEEE Eng. Med. Biol. Soc. 2012, 2012, 162–165. [Google Scholar] [PubMed]
- Van den Heever, D.; Schreve, K.; Scheffer, C. Tactile Sensing Using Force Sensing Resistors and a Super-Resolution Algorithm. IEEE Sens. J. 2009, 9, 29–35. [Google Scholar] [CrossRef]
- Otto, J.; Brown, T.; Callaghan, J. Static and Dynamic Response of a multiplexed-array Piezoresistive Contact Sensor. Exp. Mech. 1999, 39, 317–323. [Google Scholar] [CrossRef]
- Van Wees, B.; Van Houten, H.; Beenakker, C.; Williamson, J.; Kouwenhoven, L.; Van der Marel, D.; Foxon, C.T. Quantized conductance of point contacts in a two-dimensional electron gas. Phys. Rev. Lett. 1988, 60, 848–850. [Google Scholar] [CrossRef] [PubMed]
- Wharam, D.; Thornton, T.; Newbury, R.; Pepper, M.; Ahmed, H.; Frost, J.; Hasko, D.G.; Peacock, D.C.; Ritchie, D.A.; Jones, G.A.C. One-dimensional transport and the quantisation of the ballistic resistance. J. Phys. C Solid State Phys. 1988, 21, 209–214. [Google Scholar] [CrossRef]
- Ruschau, G.; Yoshikawa, S.; Newnham, R. Resistivities of conductive composites. J. Appl. Phys. 1992, 72, 953–959. [Google Scholar] [CrossRef]
- Mikrajuddin, A.; Shi, F.; Kim, H.; Okuyama, K. Size-dependent electrical constriction resistance for contacts of arbitrary size: From Sharvin to Holm limits. Mater. Sci. Semicond. Proc. 1999, 2, 321–327. [Google Scholar] [CrossRef]
- Shi, F.; Abdullah, M.; Chungpaiboonpatana, S.; Okuyama, K.; Davidson, C.; Adams, J. Electrical conduction of anisotropic conductive adhesives: Effect of size distribution of conducting filler particles. Mater. Sci. Semicond. Proc. 1999, 2, 263–269. [Google Scholar] [CrossRef]
- Wang, L.; Ma, F.; Shi, Q.; Liu, H.; Wang, X. Study on compressive resistance creep and recovery of flexible pressure sensitive material based on carbon black filled silicone rubber composite. Sens. Actuators A Phys. 2011, 165, 207–215. [Google Scholar] [CrossRef]
- Zheng, Q.; Zhou, J.; Song, Y. Time-dependent uniaxial piezoresistive behavior of high-density polyethylene/short carbon fiber conductive composites. J. Mater. Res. 2004, 19, 2625–2634. [Google Scholar] [CrossRef]
- De la Vega, A.; Sumfleth, J.; Wittich, H.; Schulte, K. Time and temperature dependent piezoresistance of carbon nanofiller/polymer composites under dynamic load. J. Mater. Sci. 2012, 47, 2648–2657. [Google Scholar] [CrossRef]
- Vidhate, S.; Chung, J.; Vaidyanathan, V.; D’Souza, N. Resistive-conductive transitions in the time-dependent piezoresponse of PVDF-MWCNT nanocomposites. Polym. J. 2010, 42, 567–574. [Google Scholar] [CrossRef]
- Mainardi, F.; Spada, G. Creep, relaxation and viscosity properties for basic fractional models in rheology. Eur. Phys. J. Spec. Top. 2011, 193, 133–160. [Google Scholar] [CrossRef]
- Komi, E.; Roberts, J.; Rothberg, S. Evaluation of thin, flexible sensors for time-resolved grip force measurement. Proc. Inst. Mech. Eng. Part C J. Mech. Eng. Sci. 2007, 221, 1687–1699. [Google Scholar] [CrossRef]
- Lebosse, C.; Bayle, B.; De Mathelin, M.; Renaud, P. Nonlinear modeling of low cost force sensors. In Proceedings of the 2008 IEEE International Conference on Robotics and Automation, Pasadena, CA, USA, 19–23 May 2008; pp. 3437–3442. [Google Scholar]
- Paredes-Madrid, L.; Matute, A.; Peña, A. Framework for a Calibration-Less Operation of Force Sensing Resistors at Different Temperatures. IEEE Sens. J. 2017, 17, 4133–4142. [Google Scholar] [CrossRef]
- Firouzeh, A.; Amon-Junior, A.; Paik, J. Soft piezoresistive sensor model and characterization with varying design parameters. Sens. Actuators A Phys. 2015, 233, 158–168. [Google Scholar] [CrossRef]
- Wang, L. A Method to Improve Sensitivity of Piezoresistive Sensor Based on Conductive Polymer Composite. IEEE/ASME Trans. Mechatron. 2015, 20, 3242–3248. [Google Scholar] [CrossRef]
- Lantada, A.; Lafont, P.; Muñoz, J.; Muñoz-Guijosa, J.; Echavarri, J. Quantum tunnelling composites: Characterisation and modelling to promote their applications as sensors. Sens. Actuators A Phys. 2010, 164, 46–57. [Google Scholar] [CrossRef]
- Hollinger, A.; Wanderley, M. Evaluation of Commercial Force-Sensing Resistors. In Proceedings of the International Conference on New Interfaces for Musical Expression, Paris, France, 4–8 June 2006. [Google Scholar]
- Tekscan Inc. FlexiForce, Sensors User Manual. Available online: http://www.tekscan.com/pdf/FLX-FlexiForce-Sensors-Manual.pdf (accessed on 16 June 2017).
- Krivopal, B. Pressure Sensitive Ink Means, and Method of Use. U.S. Patent 5,989,700, 23 November 1999. [Google Scholar]
- Oreper, B.; Brenneman, J. Pressure Sensor. U.S. Patent 6,272,936, 14 August 2001. [Google Scholar]
- Yaniger, S. Stannous Oxide Force Transducer and Composition. U.S. Patent 5,296,837, 22 March 1994. [Google Scholar]
- Yaniger, S. Conductive Particulate Force Transducer. U.S. Patent 5,302,936, 12 April 1994. [Google Scholar]
- Wang, L.; Han, Y.; Wu, C.; Huang, Y. A solution to reduce the time dependence of the output resistance of a viscoelastic and piezoresistive element. Smart Mater. Struct. 2013, 22, 075021. [Google Scholar] [CrossRef]
- Tekscan Inc. F-Scan In-Shoe Analysis System Datasheet. Available online: https://www.tekscan.com/sites/default/files/resources/MDL-F-Scan-Datasheet.pdf (accessed on 16 June 2017).
- Kati, R.; Forrester, S.; Fleming, P. Evaluation of pressure insoles during running. Procedia Eng. 2010, 2, 3053–3058. [Google Scholar] [CrossRef]
- Woodburn, J.; Helliwell, P. Observations on the F-Scan in-shoe pressure measuring system. Clin. Biomech. 1996, 11, 301–304. [Google Scholar] [CrossRef]
- Liu, X.; Schubert, D. Influence of the pressure-dependent contact area between electrode and composite surface on the electrical conductivity. Compos. Struct. 2016, 136, 414–418. [Google Scholar] [CrossRef]
© 2017 by the authors. Licensee MDPI, Basel, Switzerland. This article is an open access article distributed under the terms and conditions of the Creative Commons Attribution (CC BY) license (http://creativecommons.org/licenses/by/4.0/).