On the Piezoelectric Detection of Guided Ultrasonic Waves
Abstract
:1. Introduction
2. Experimental Procedures
3. Results and Discussion
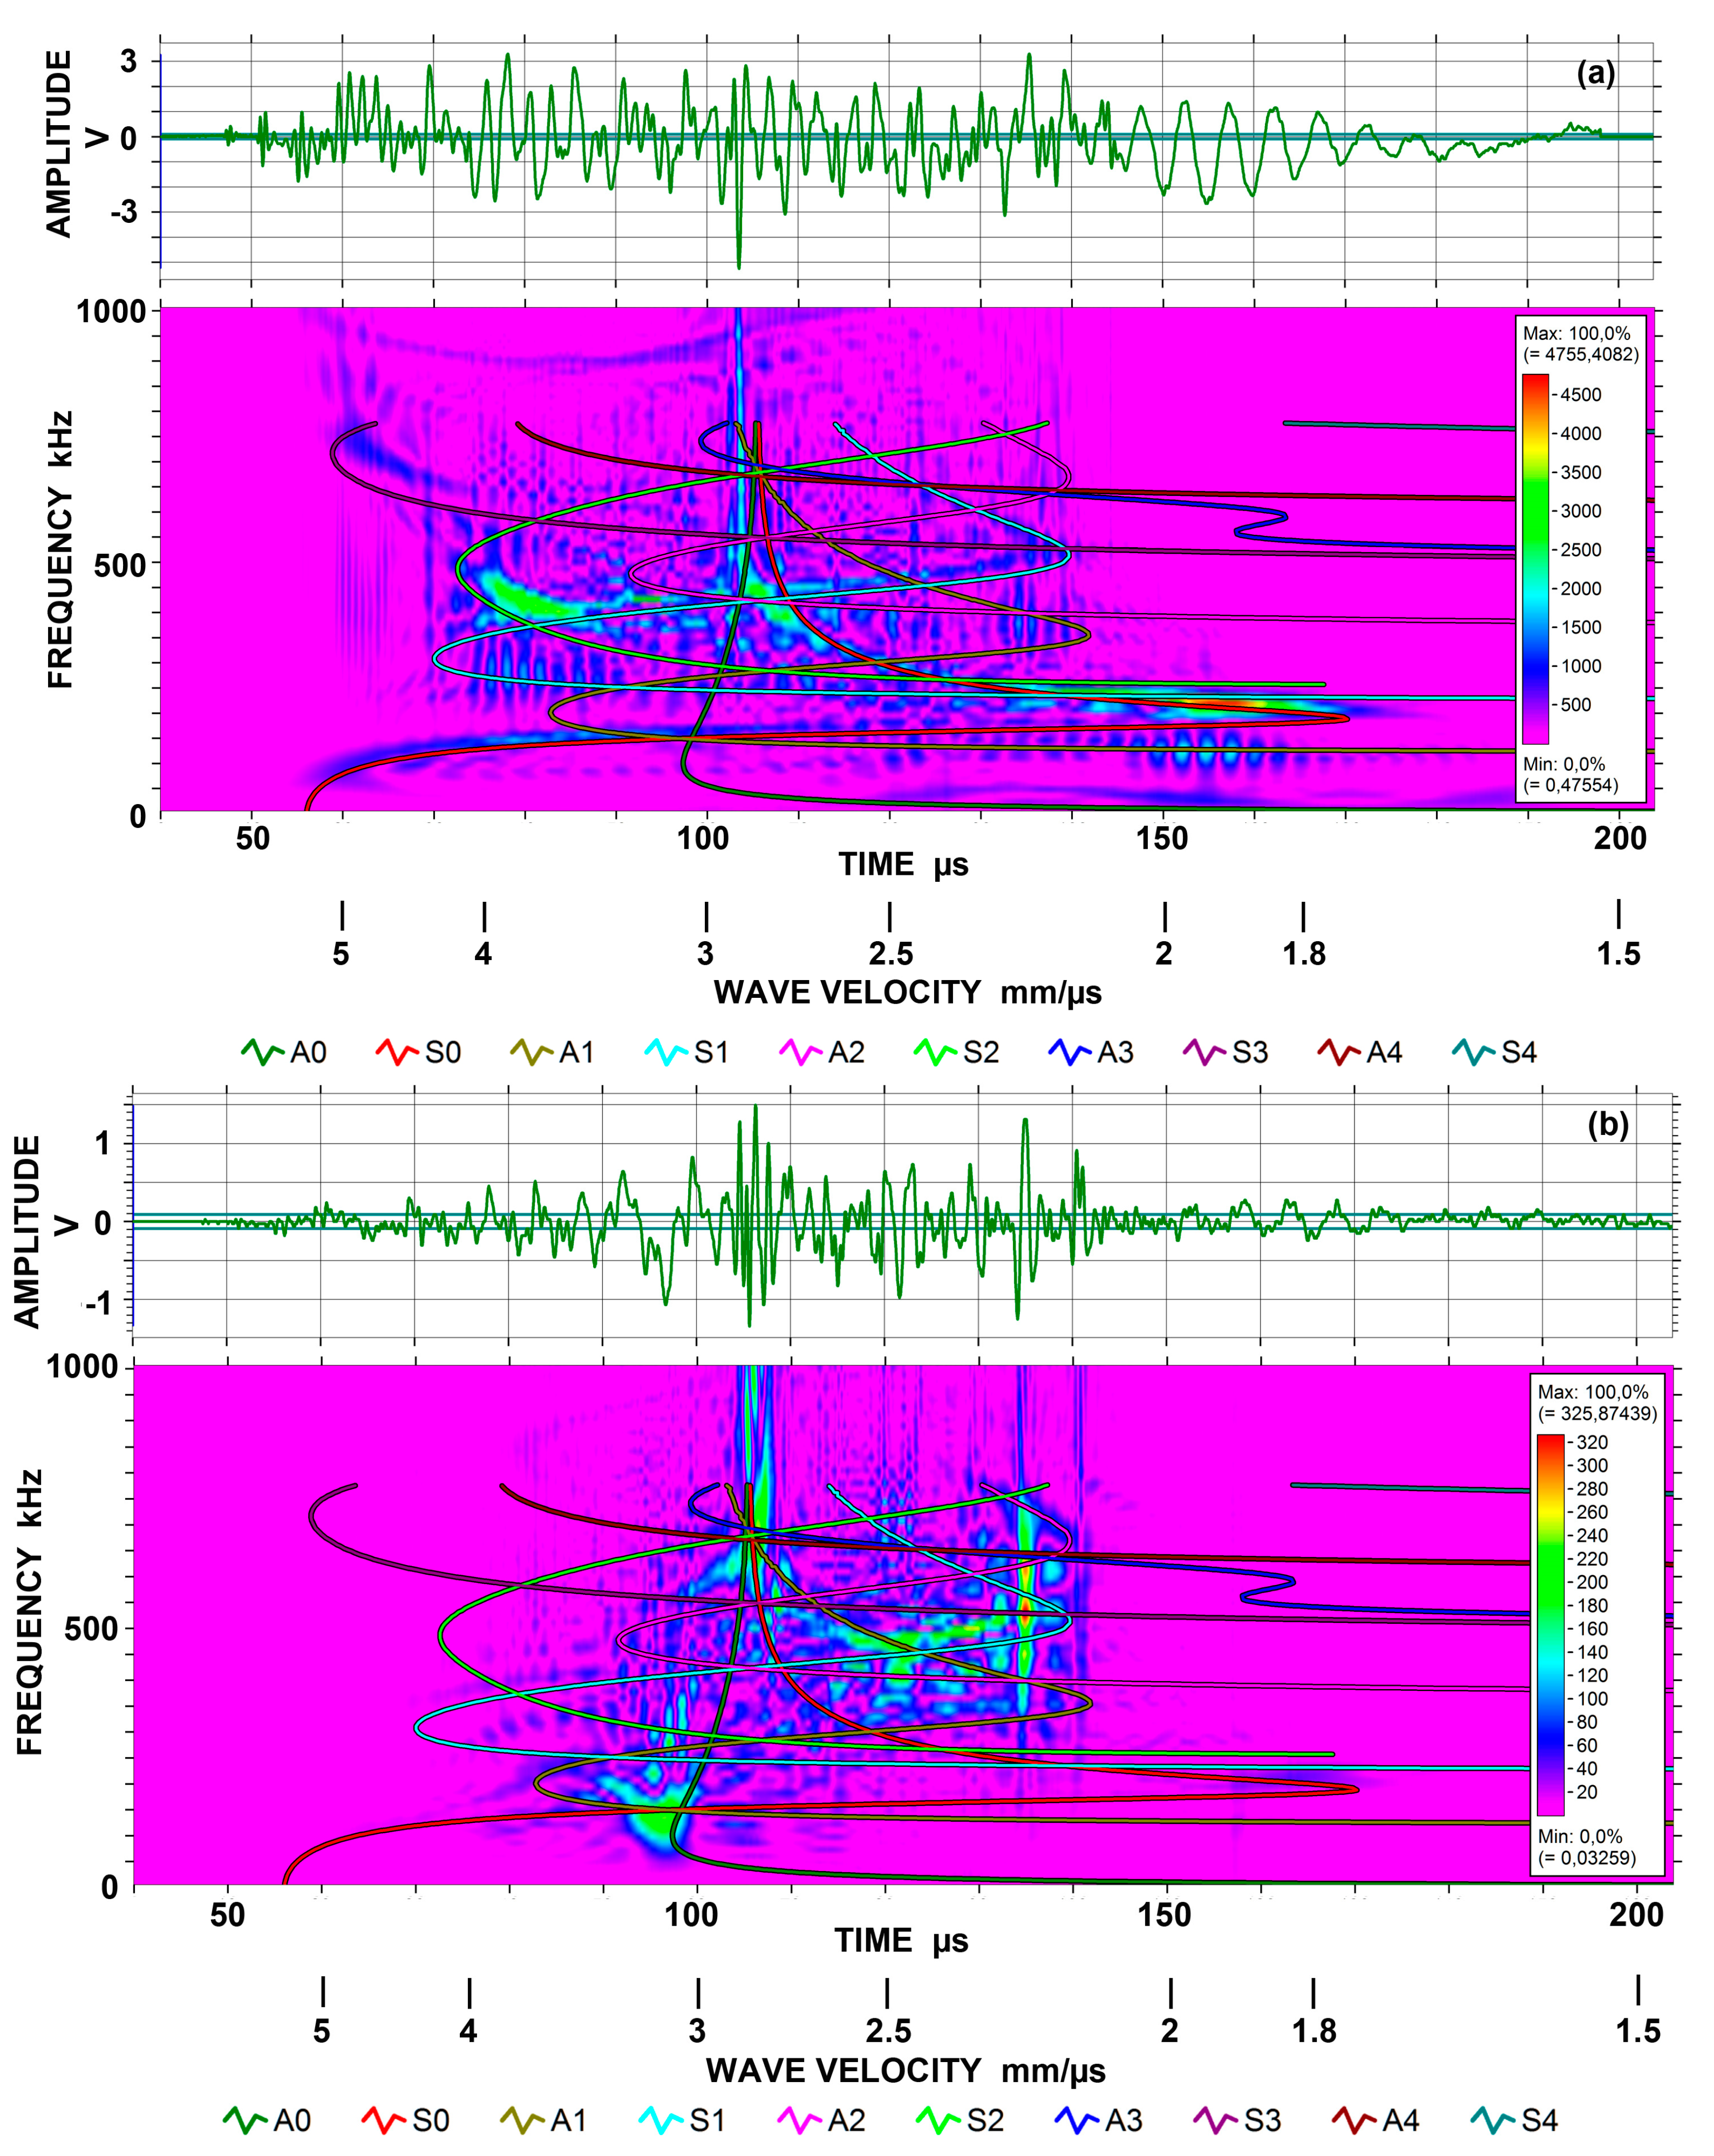
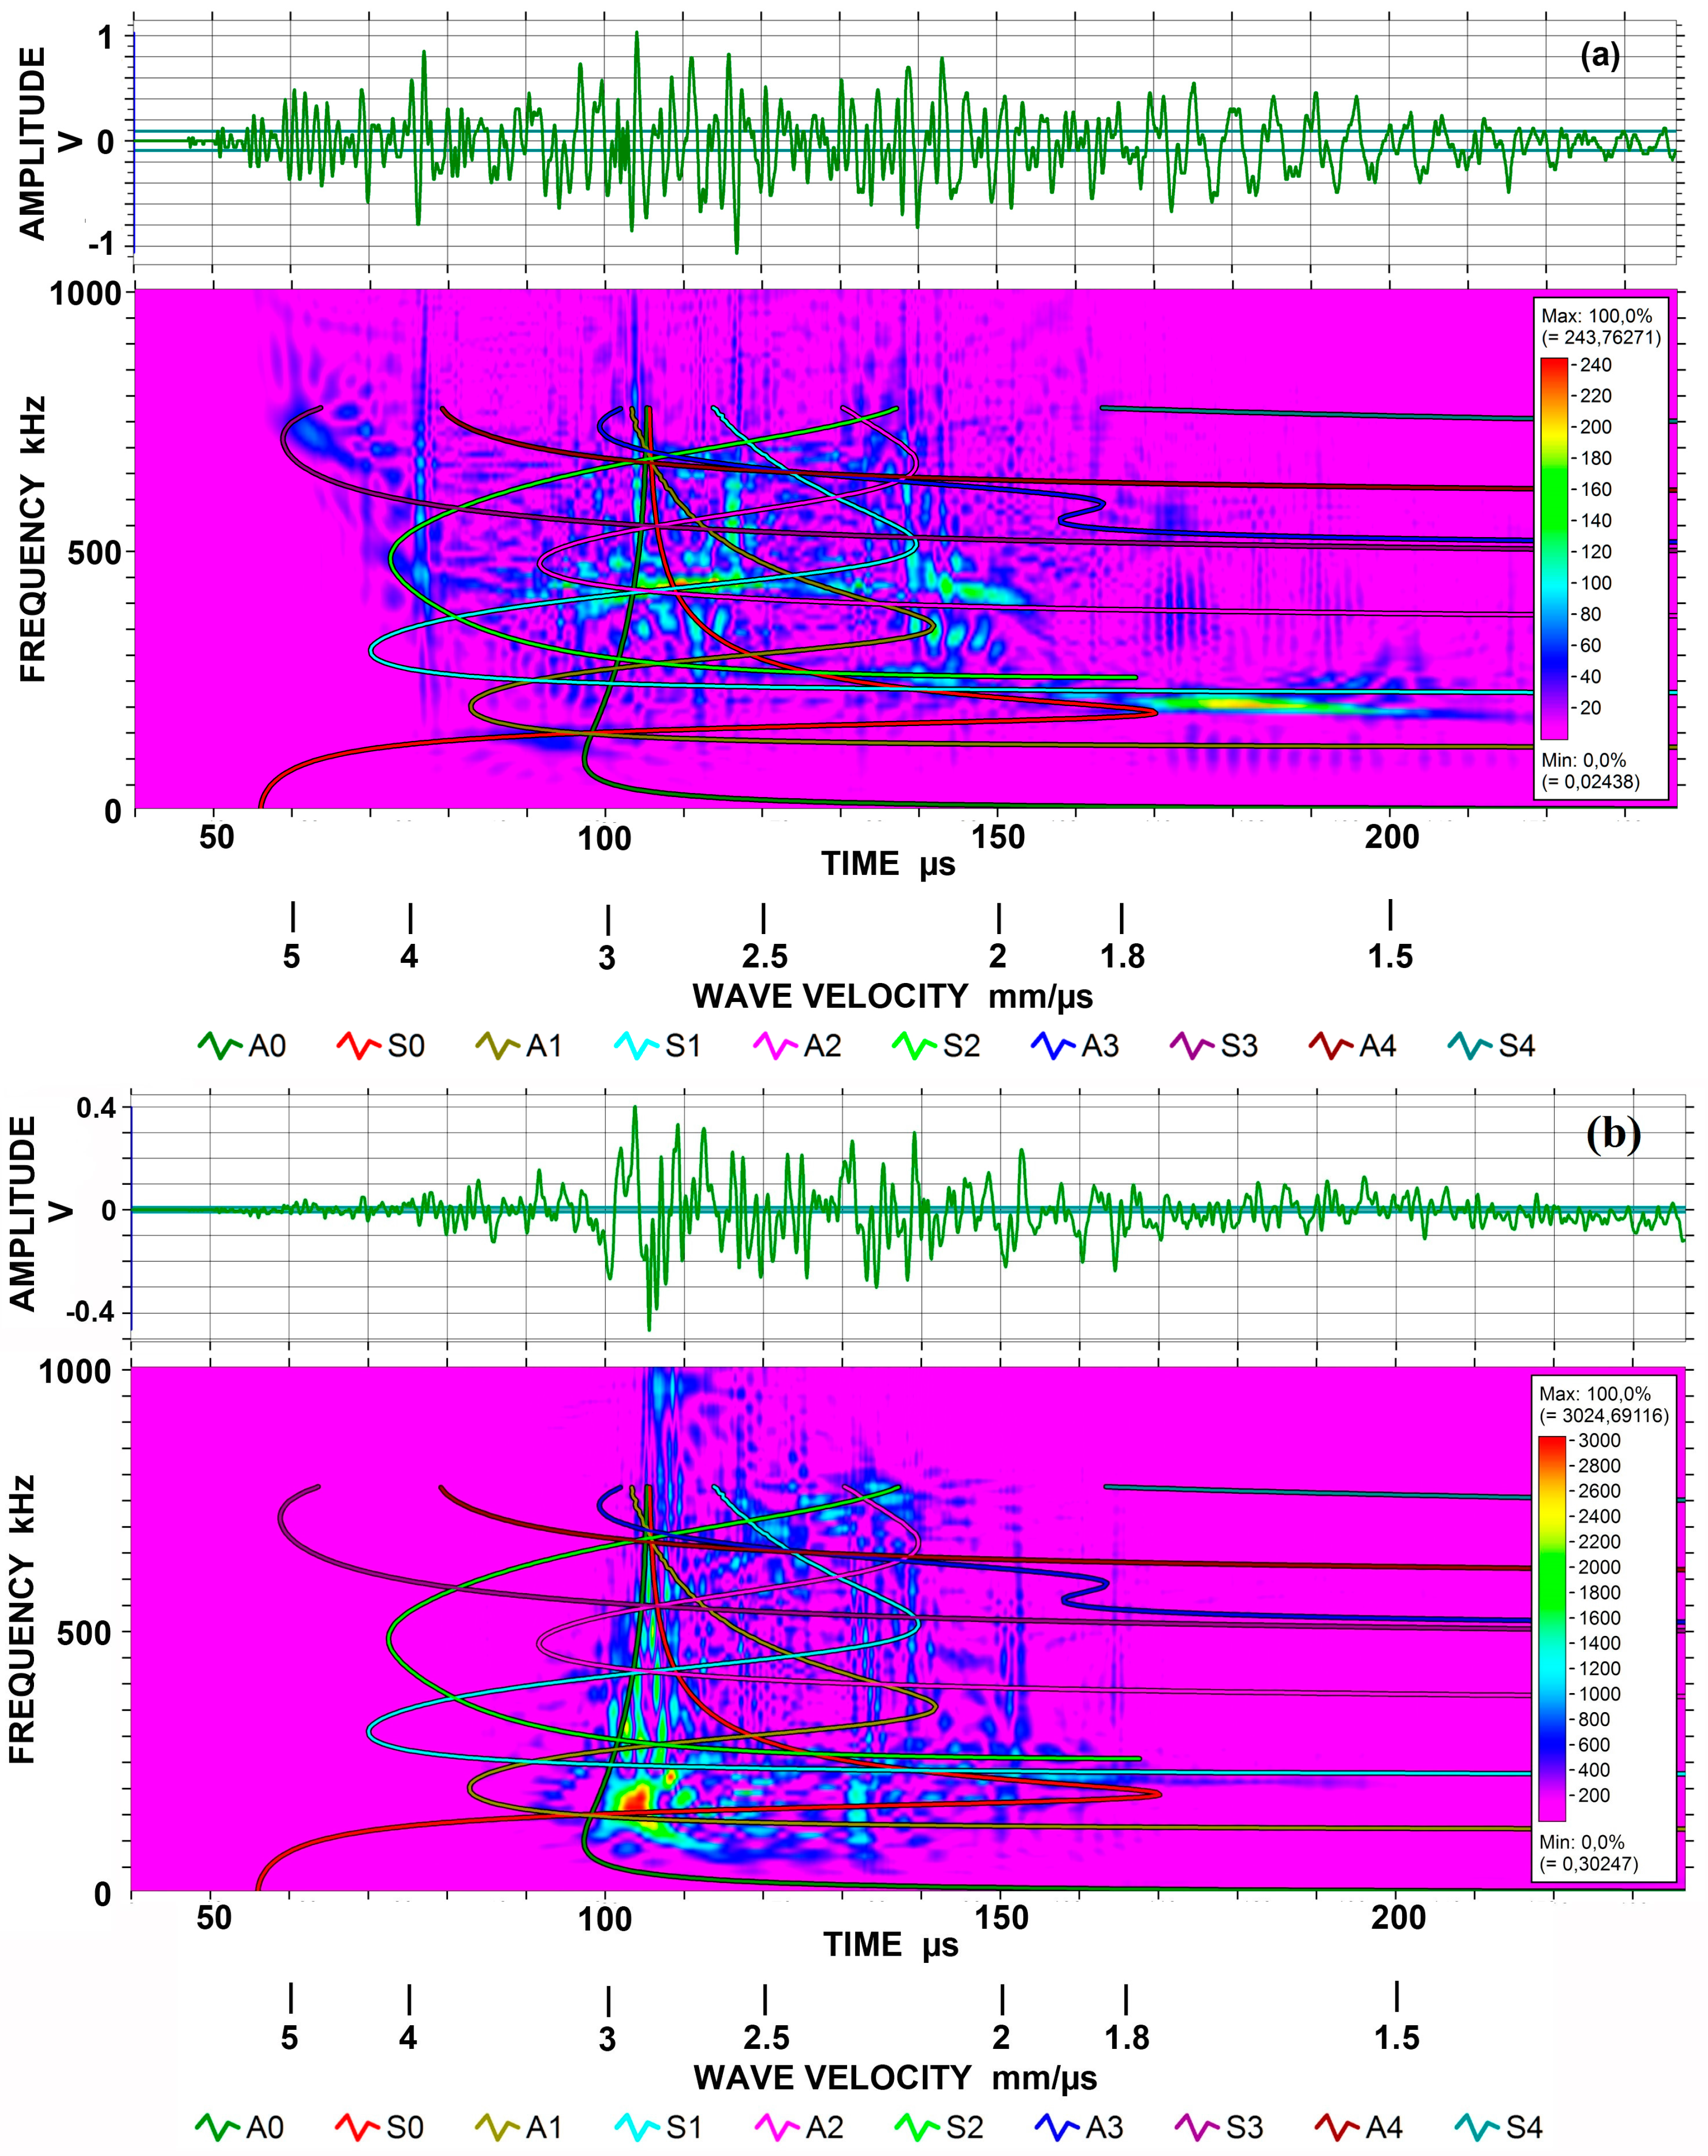
3.1. Normal Displacement
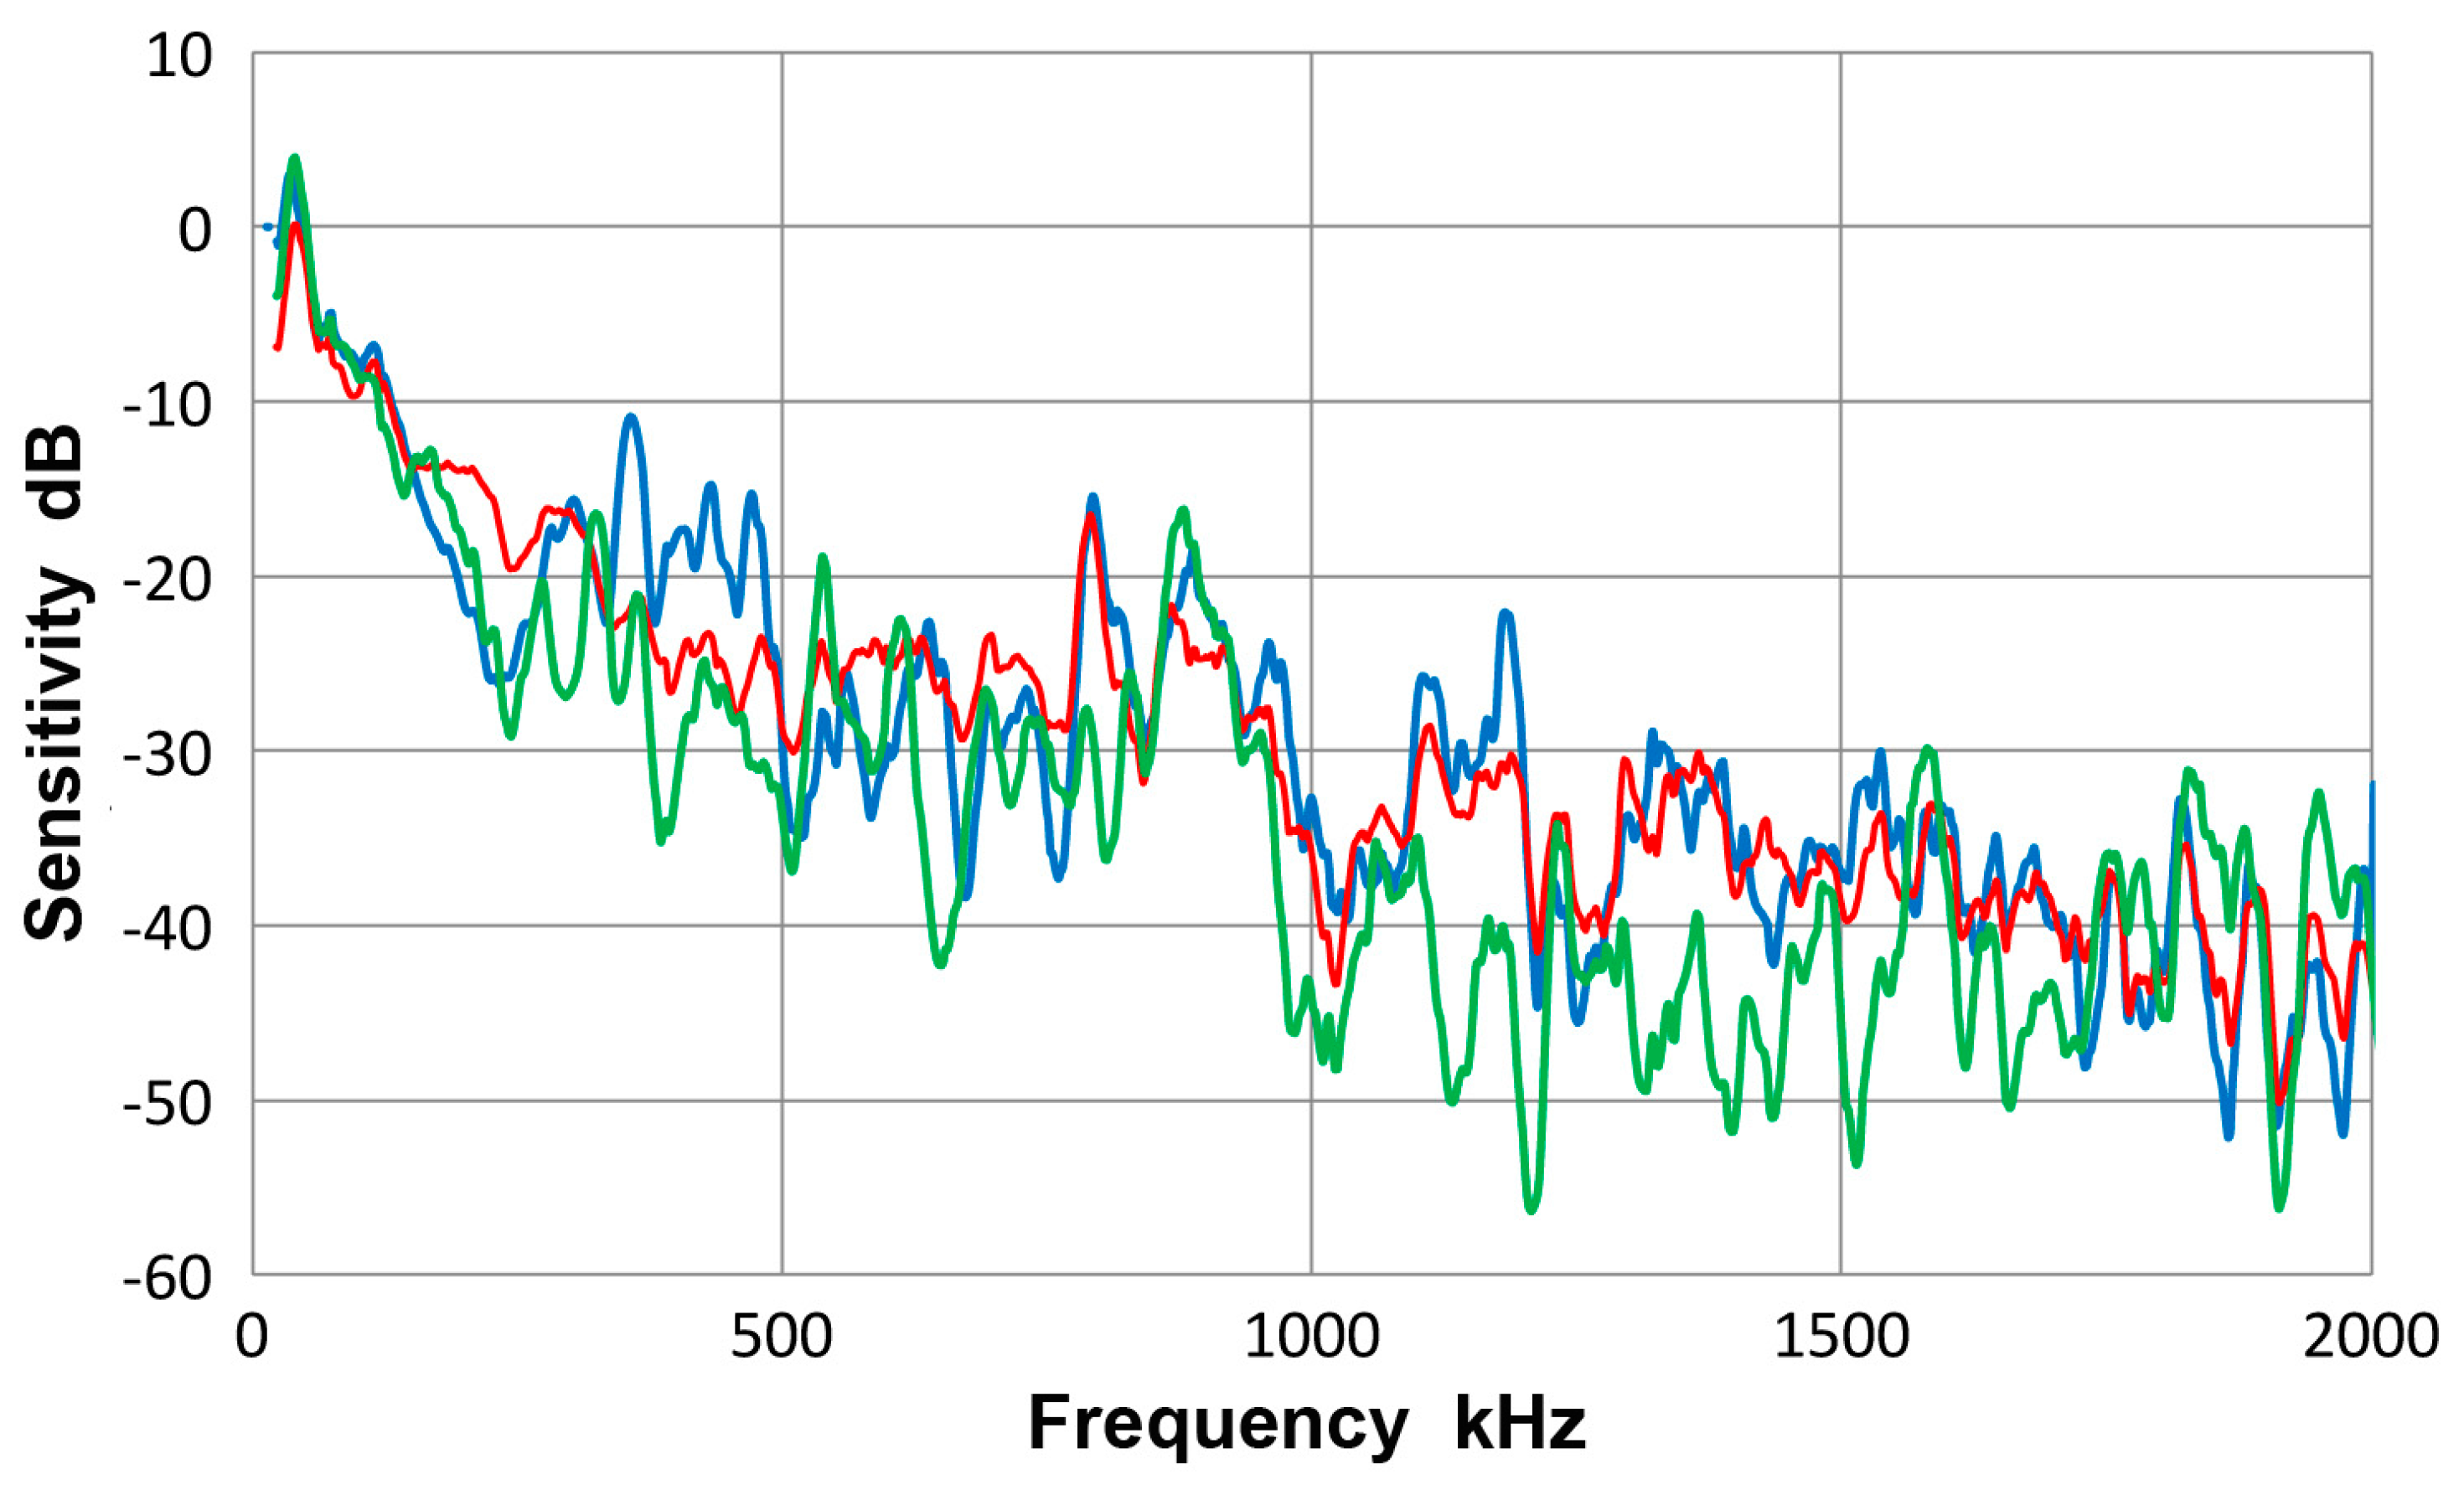
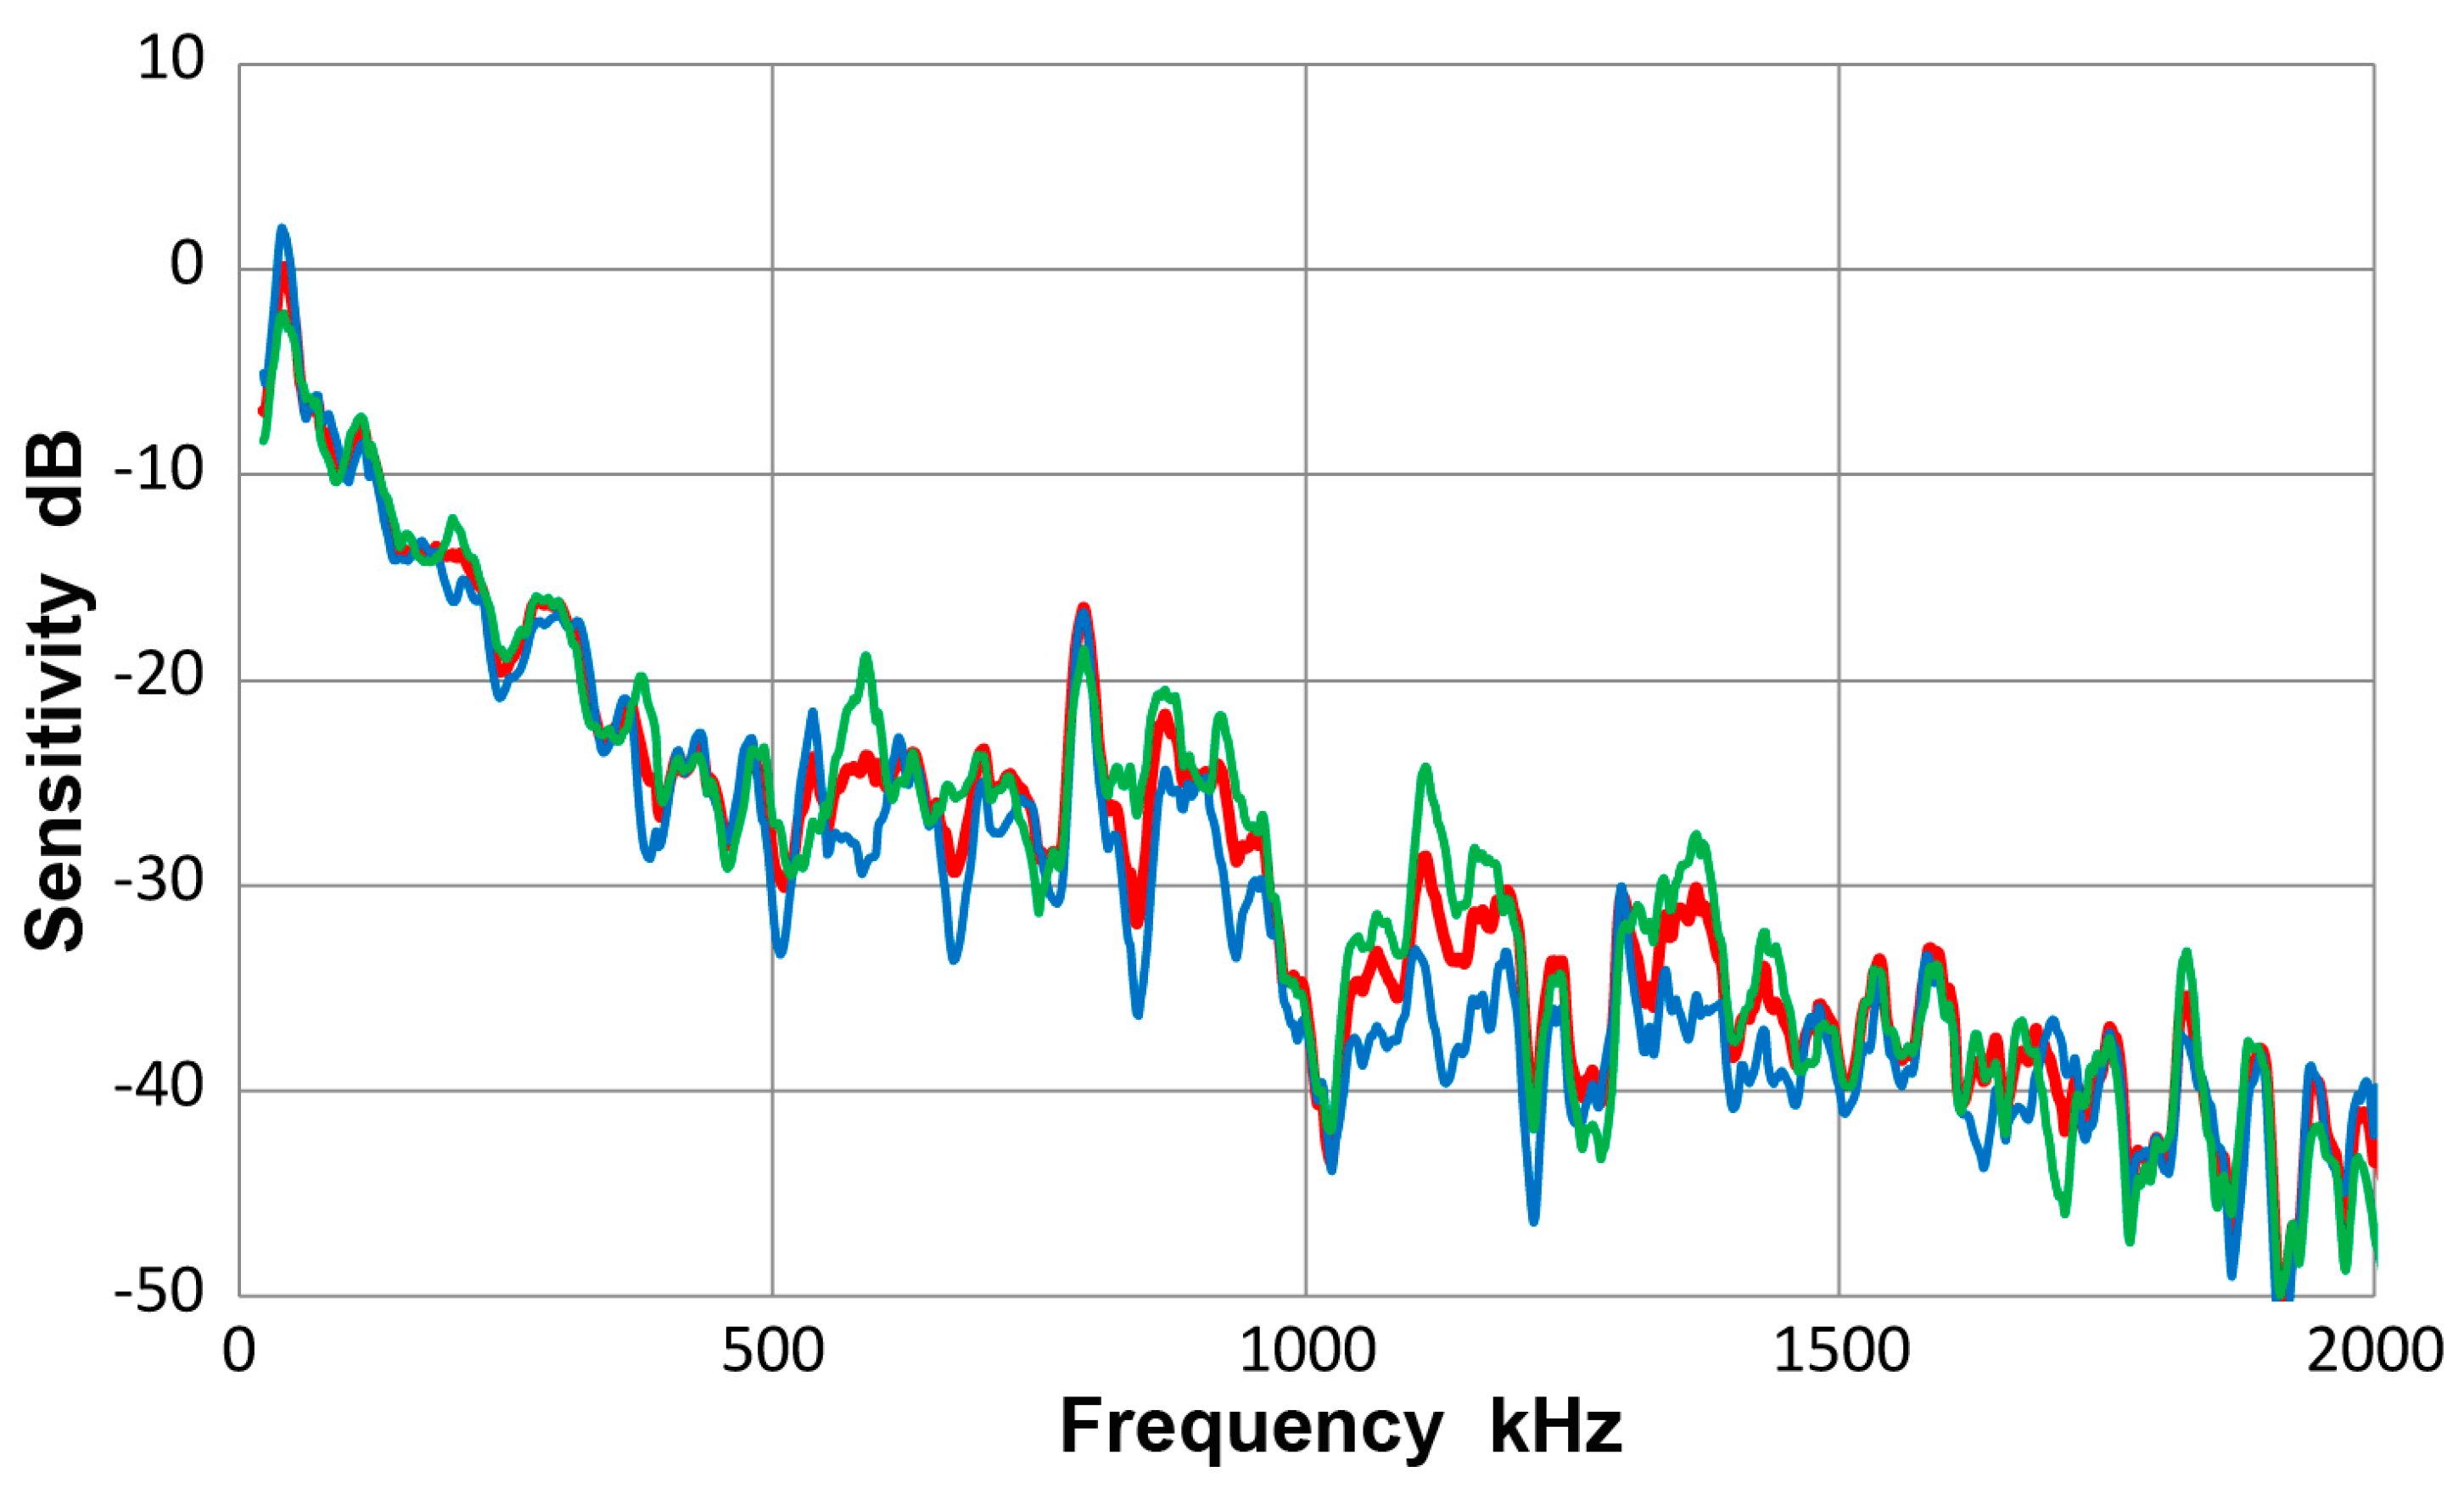
3.2. Receiving Sensitivity to Guided Waves
3.3. Olympus V103 Transducer
3.4. PAC Pico Sensor
3.5. PAC WD Sensor
3.6. DECI SH225 Sensor
3.7. PAC R6a Sensor
3.8. PAC R15 Sensor
3.9. PAC F30a Sensor
3.10. Olympus V101 Transducer
3.11. Summary of Guided Wave Sensitivity
- (a)
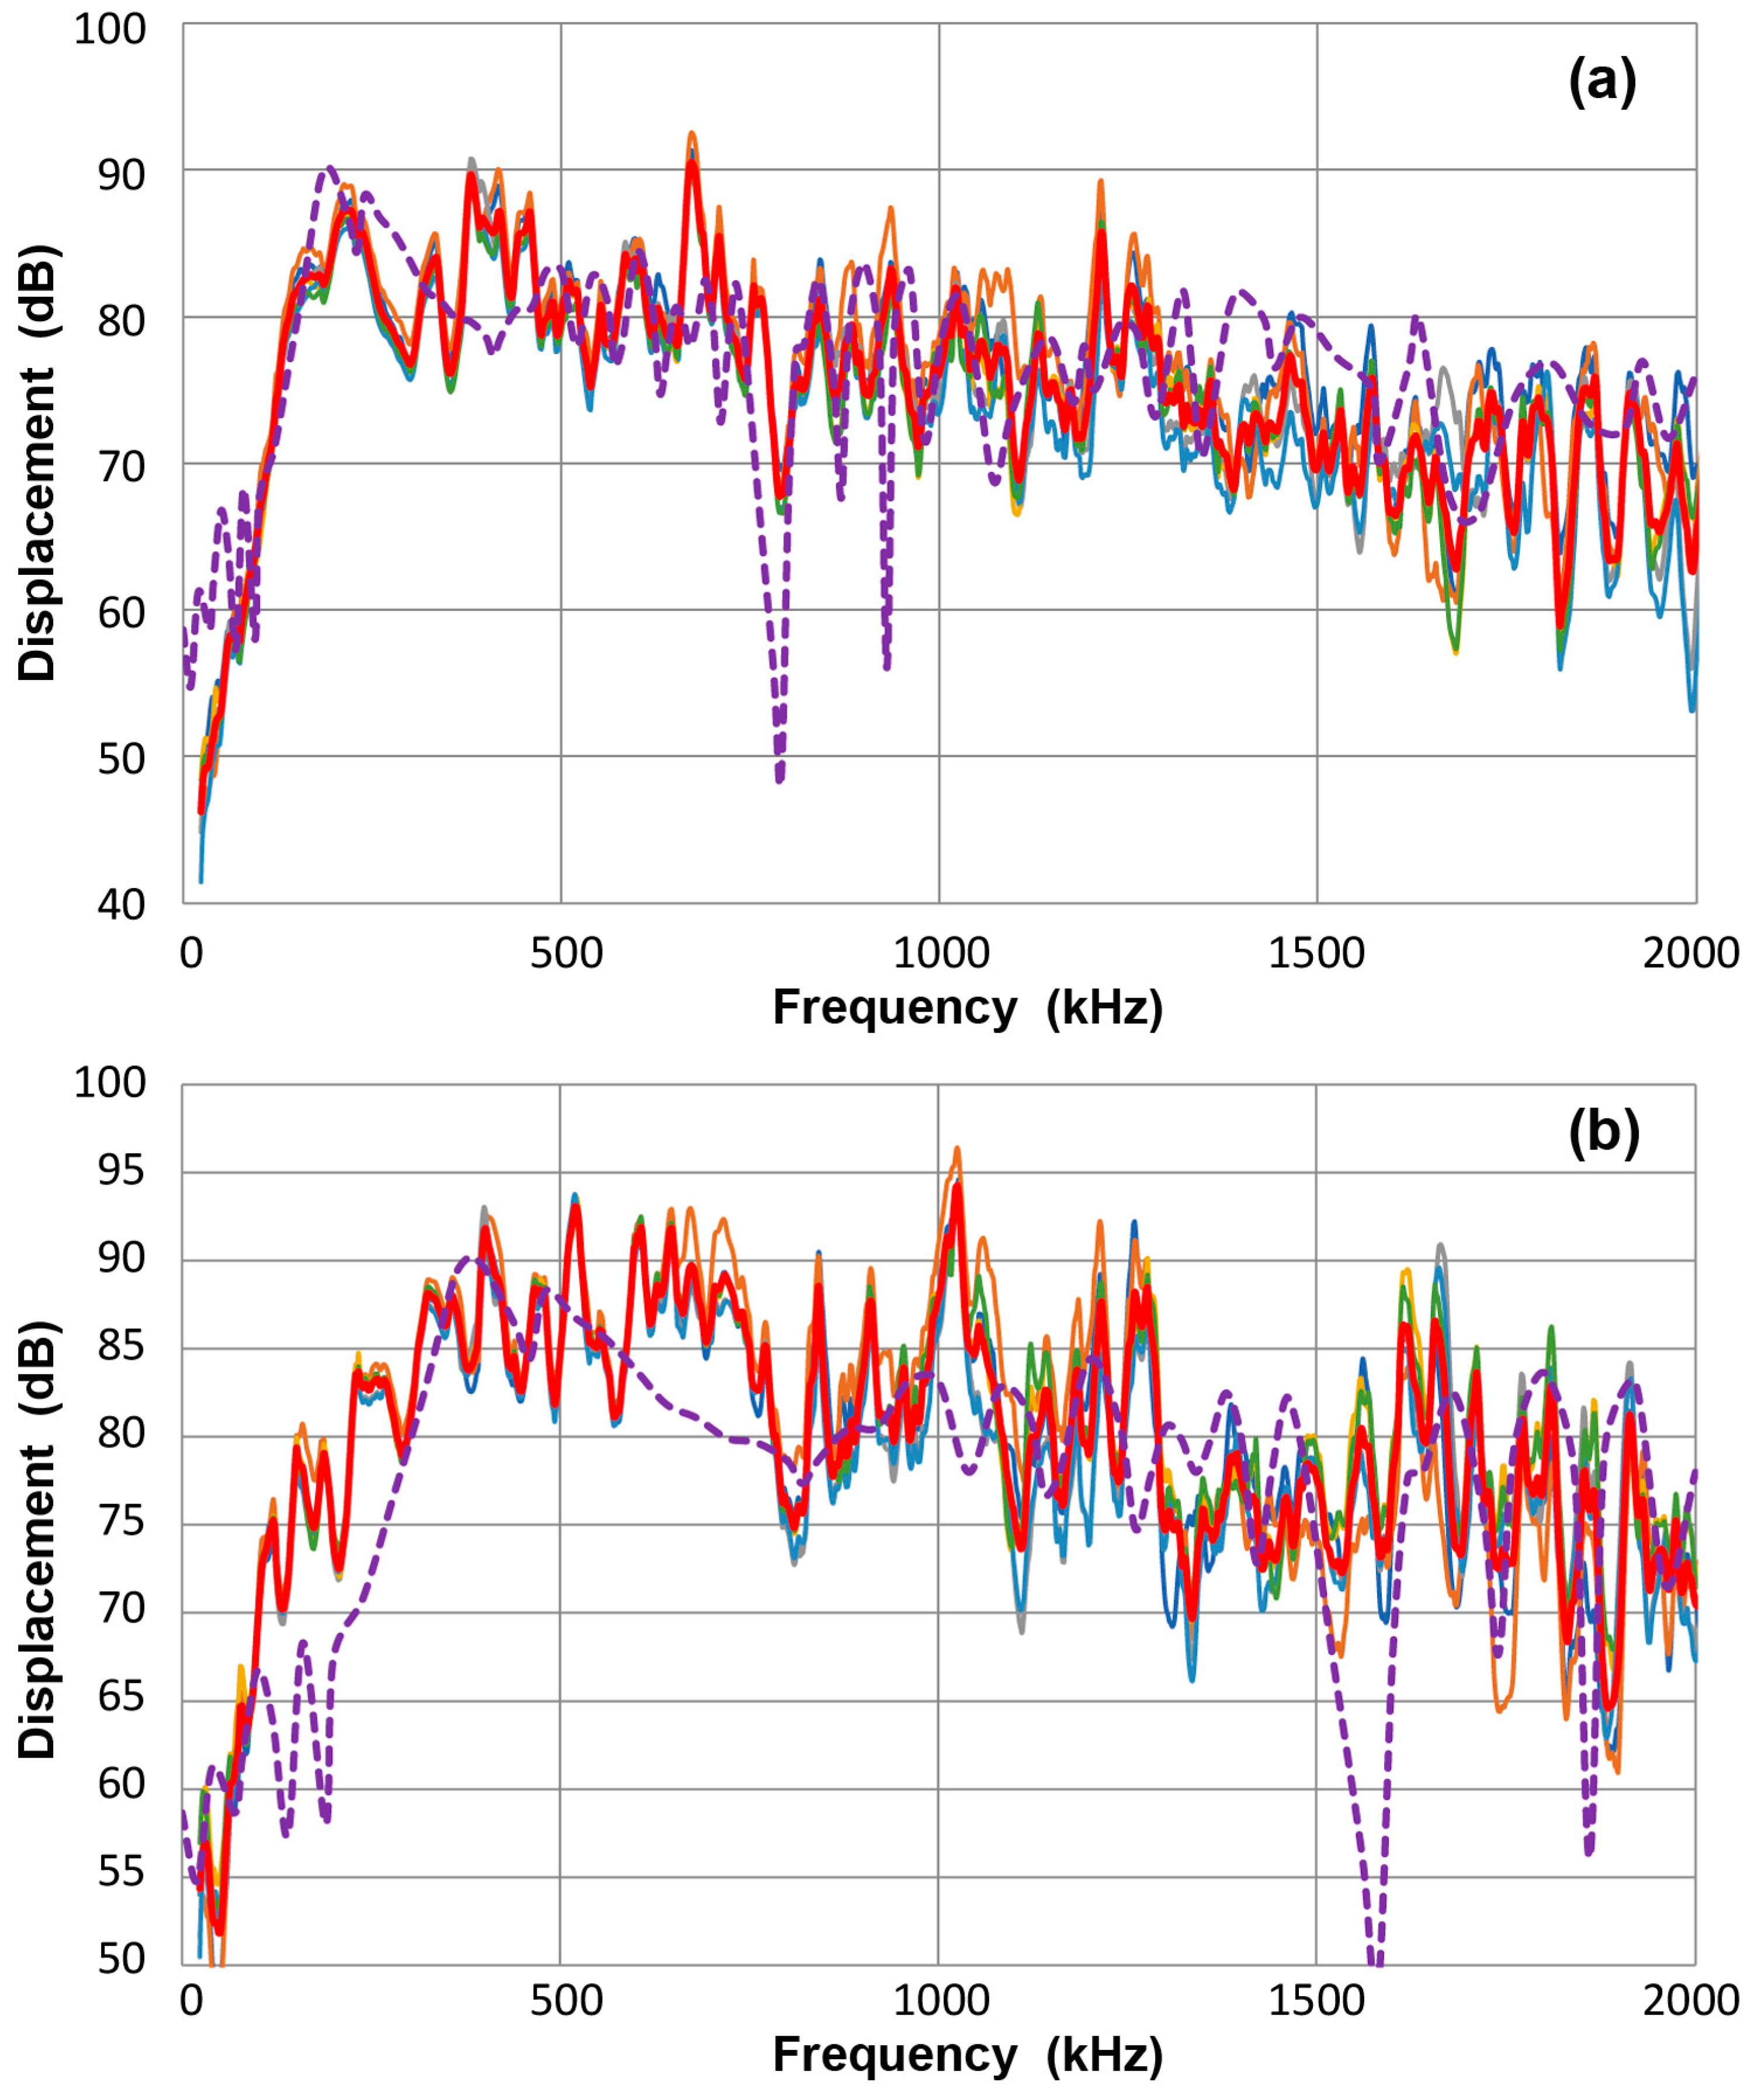
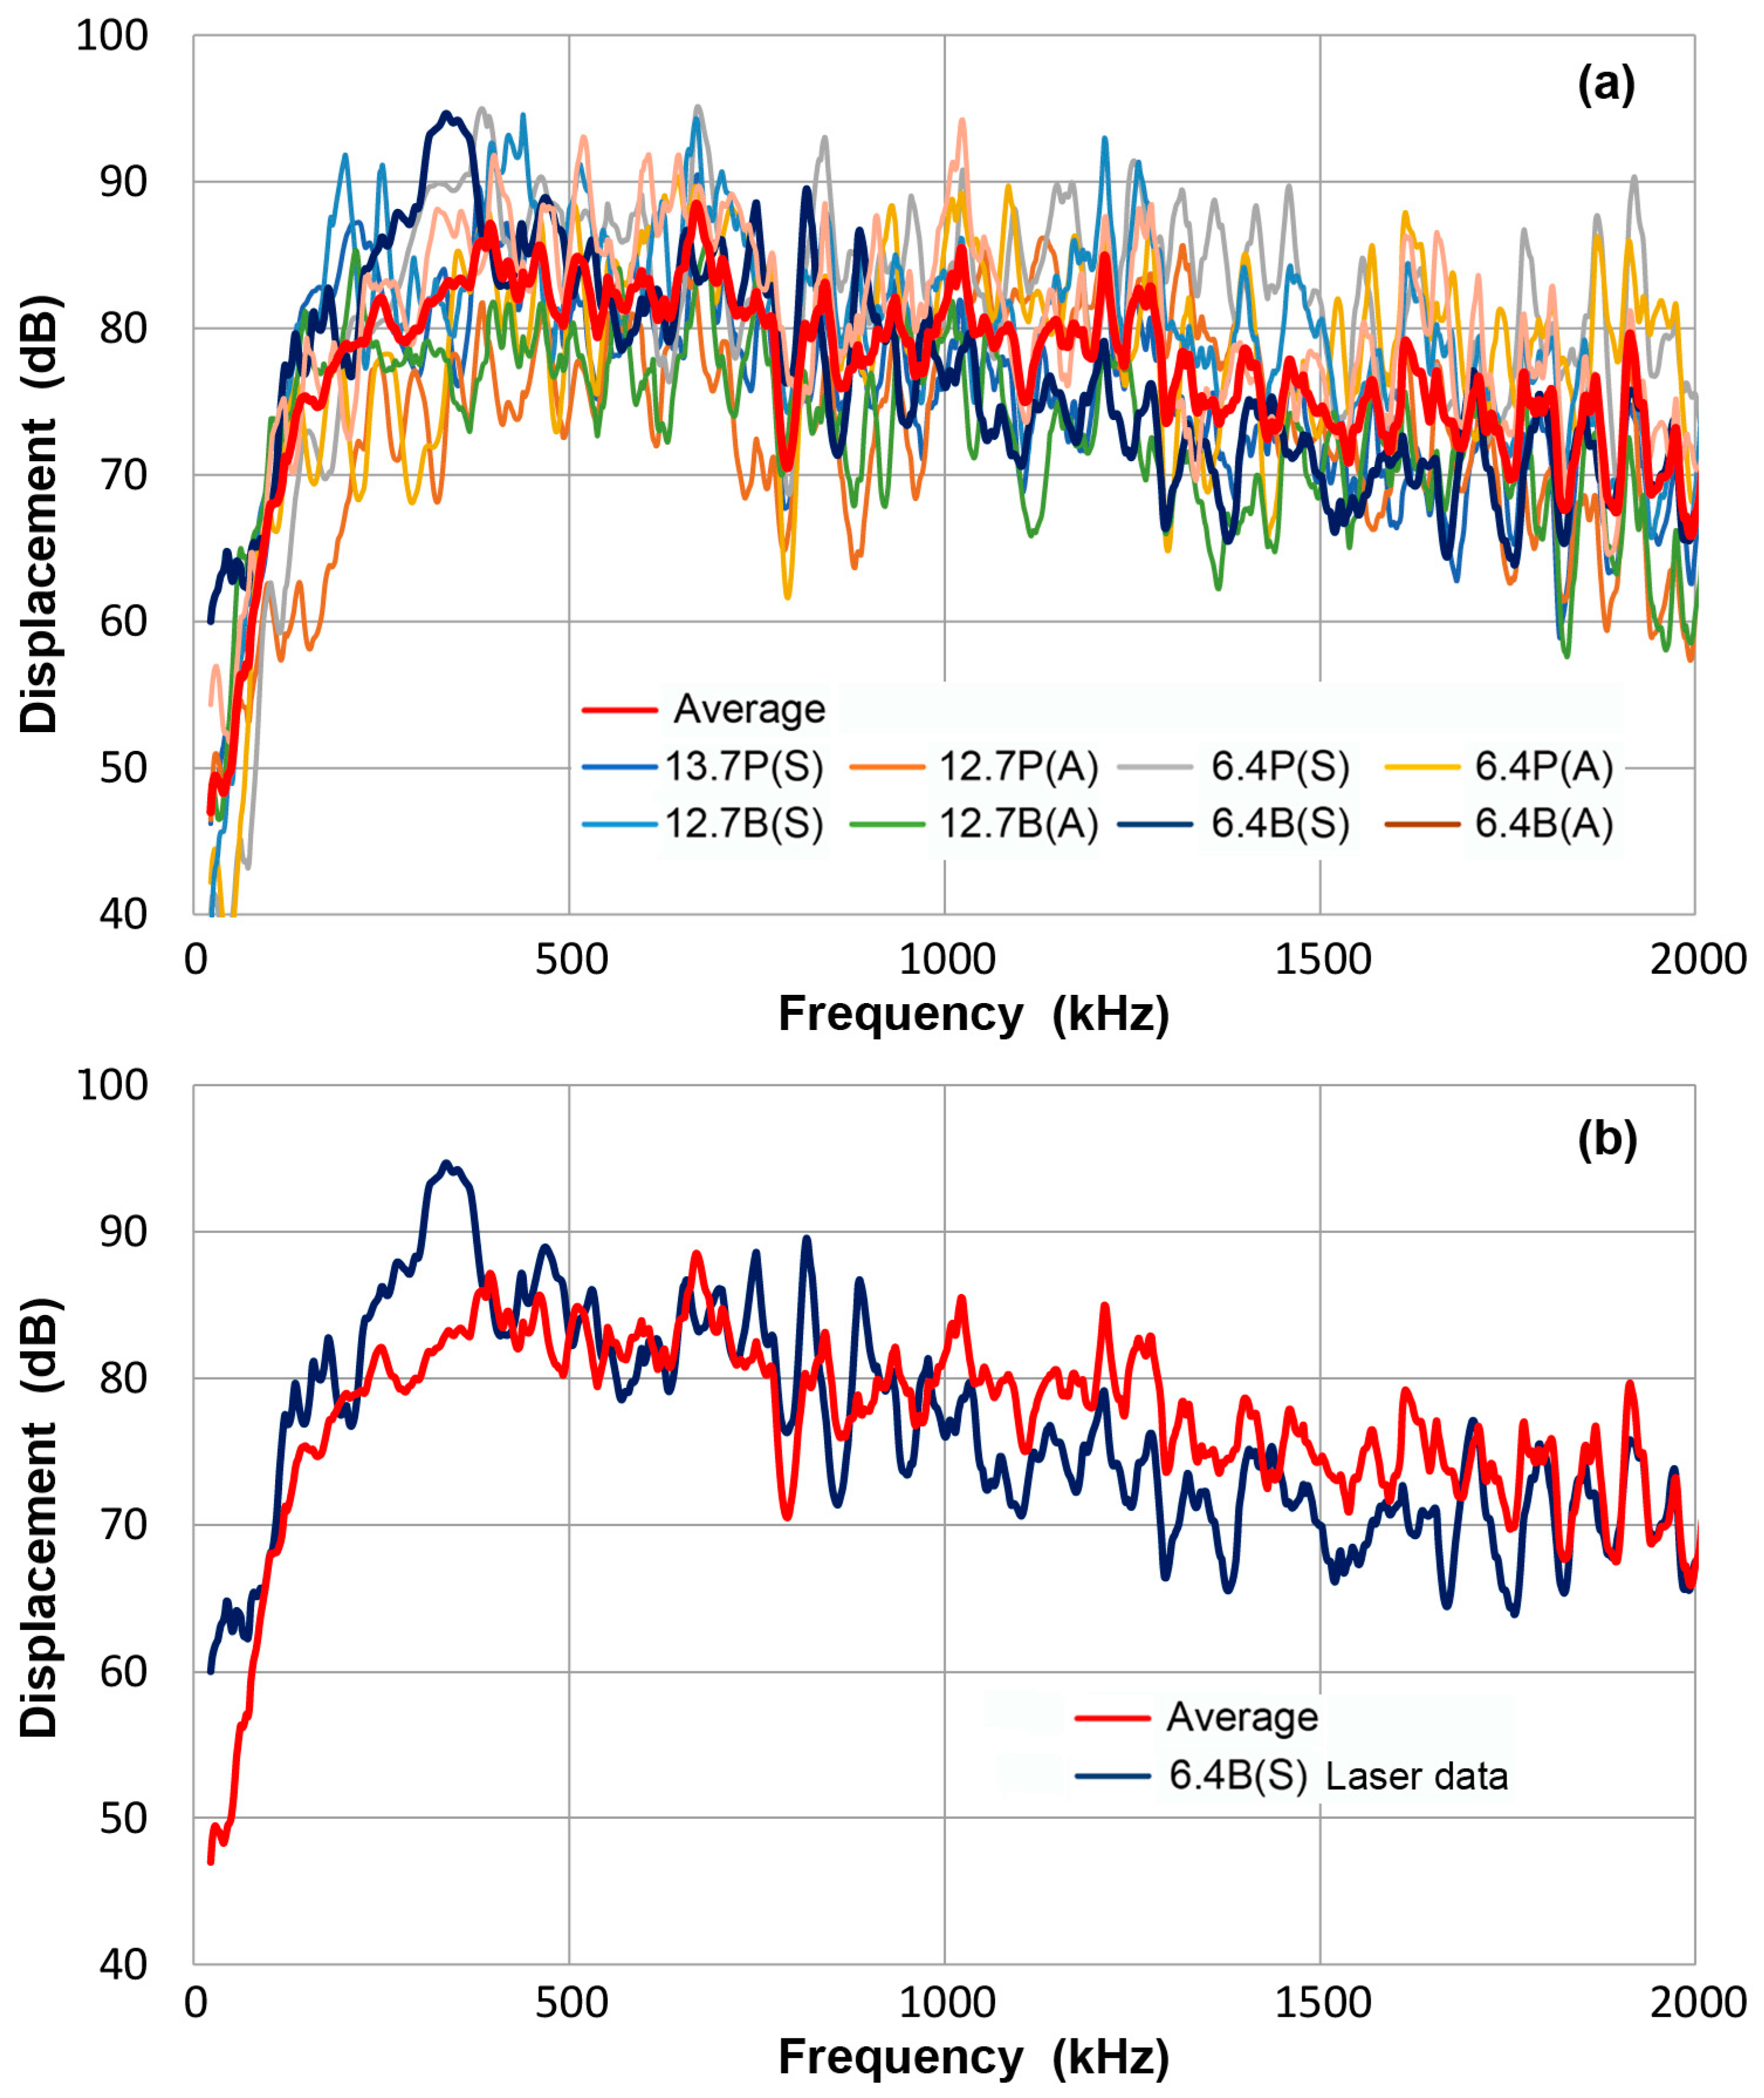
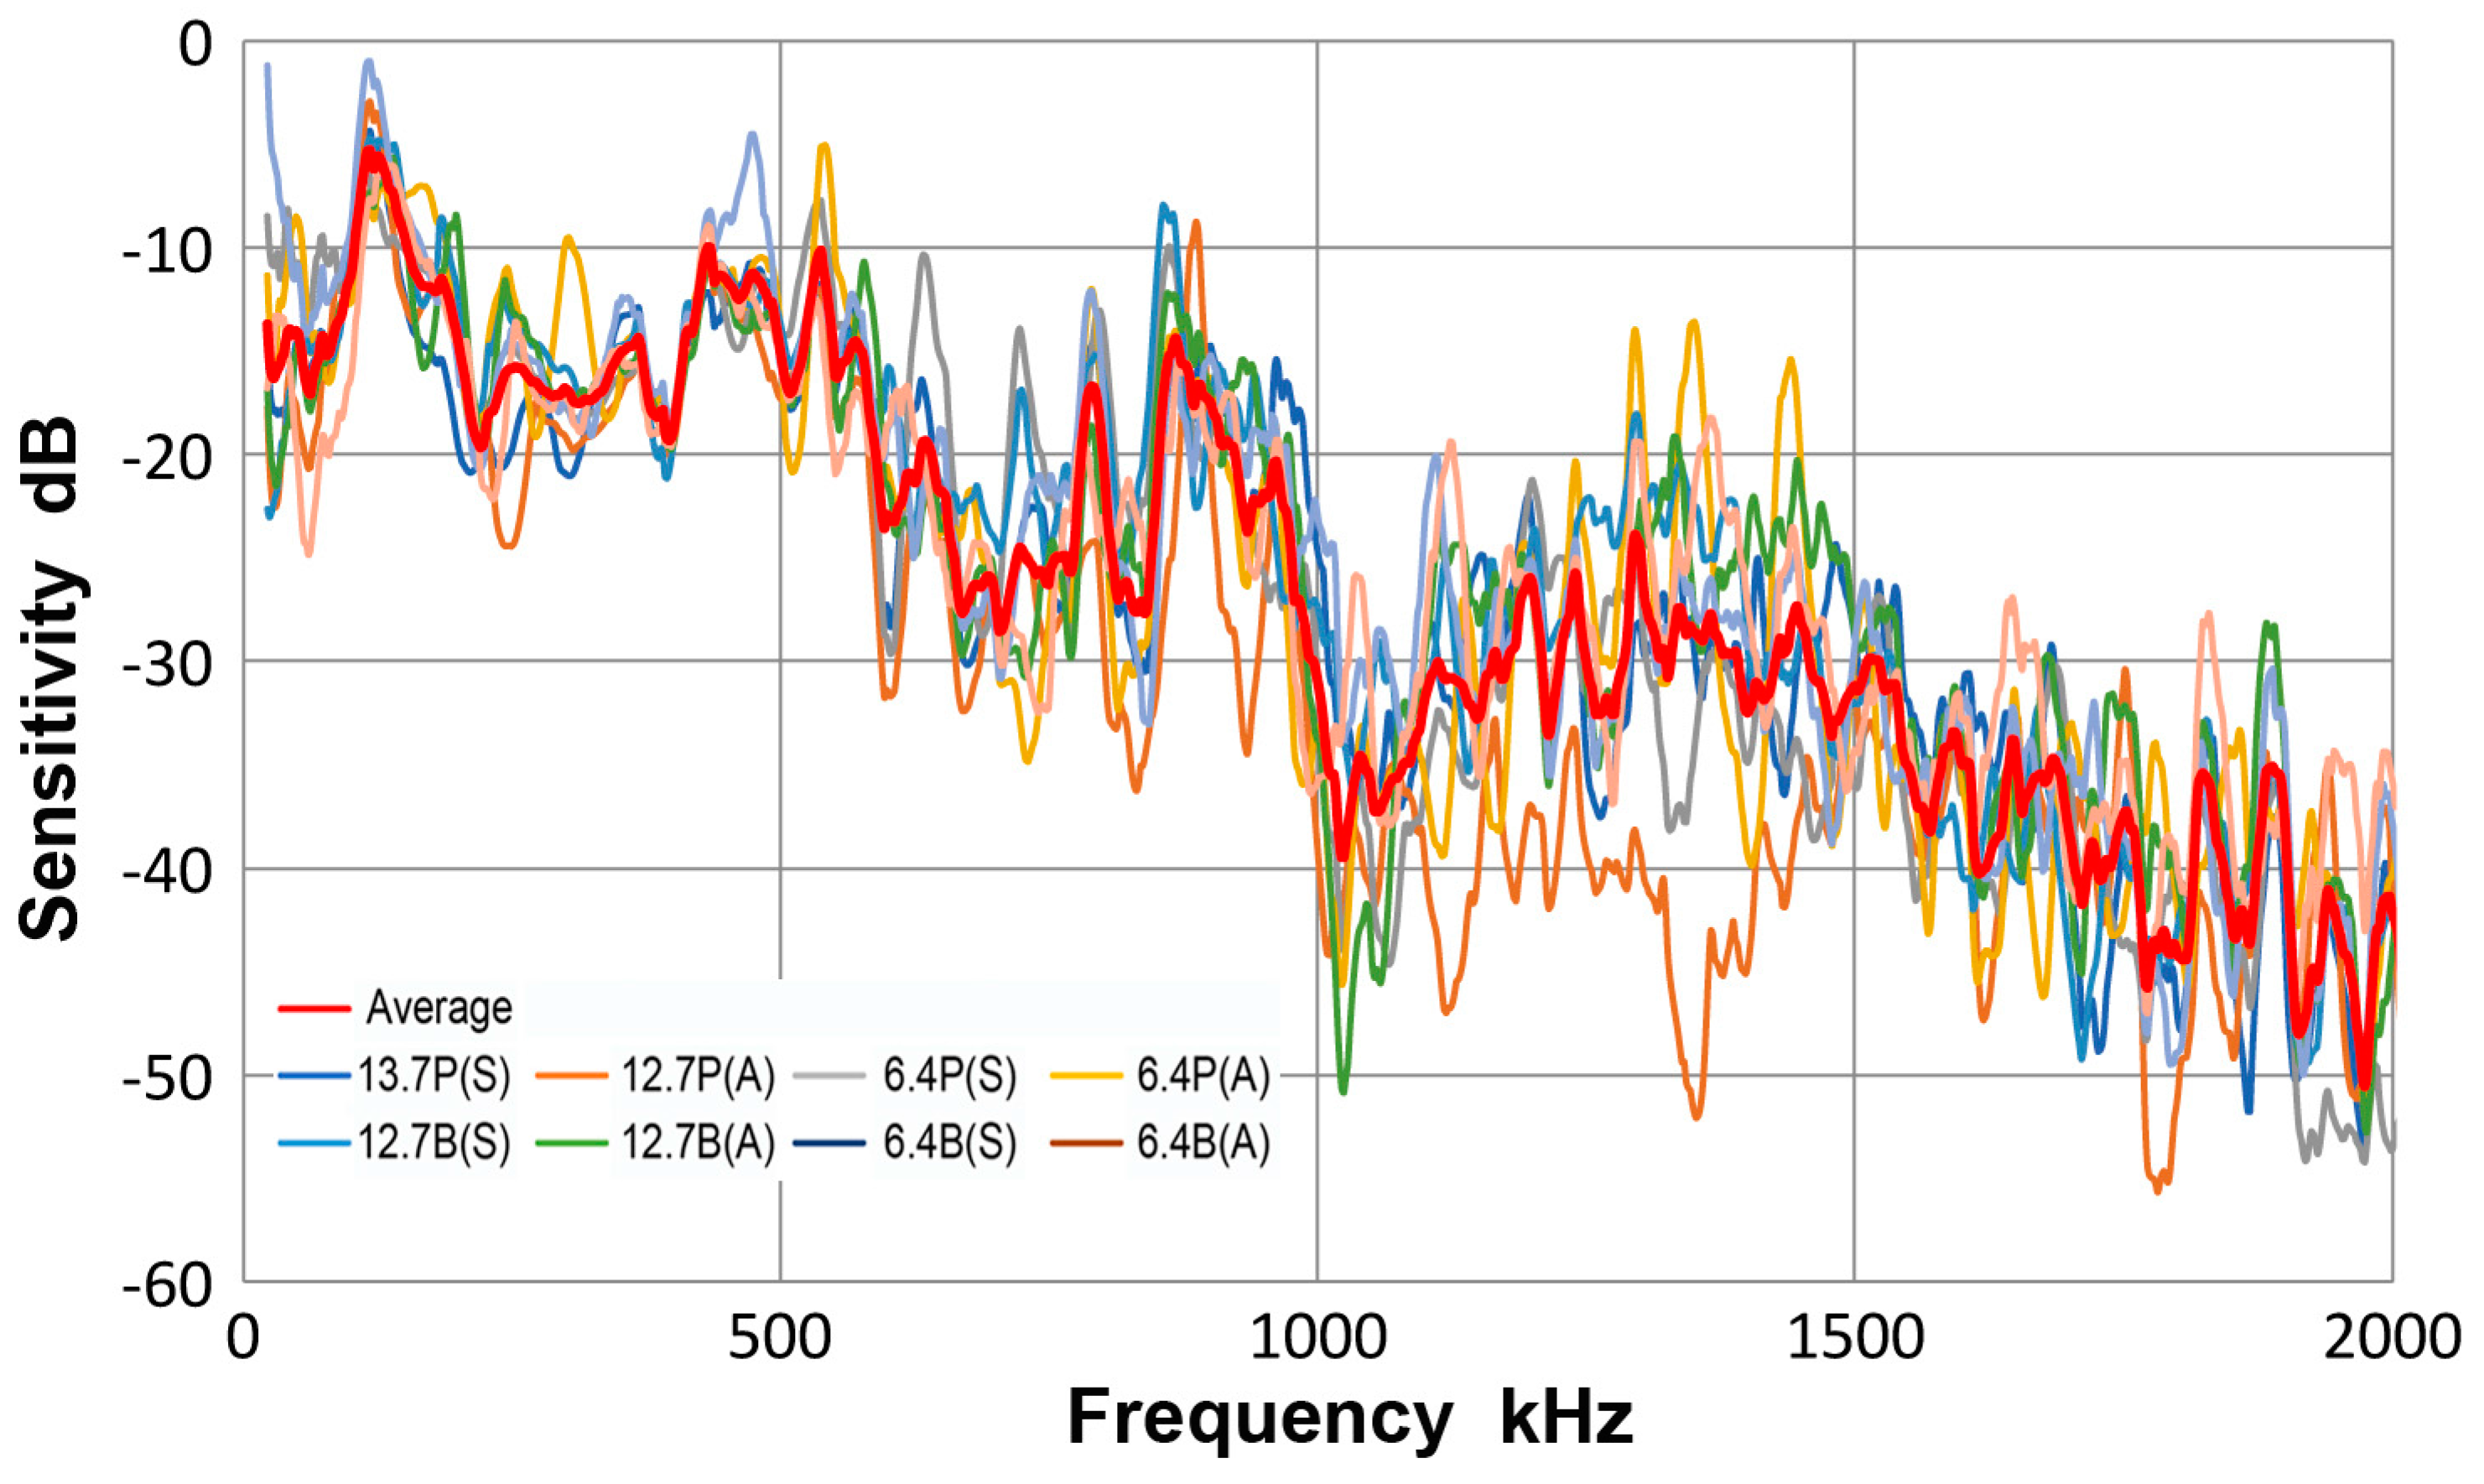
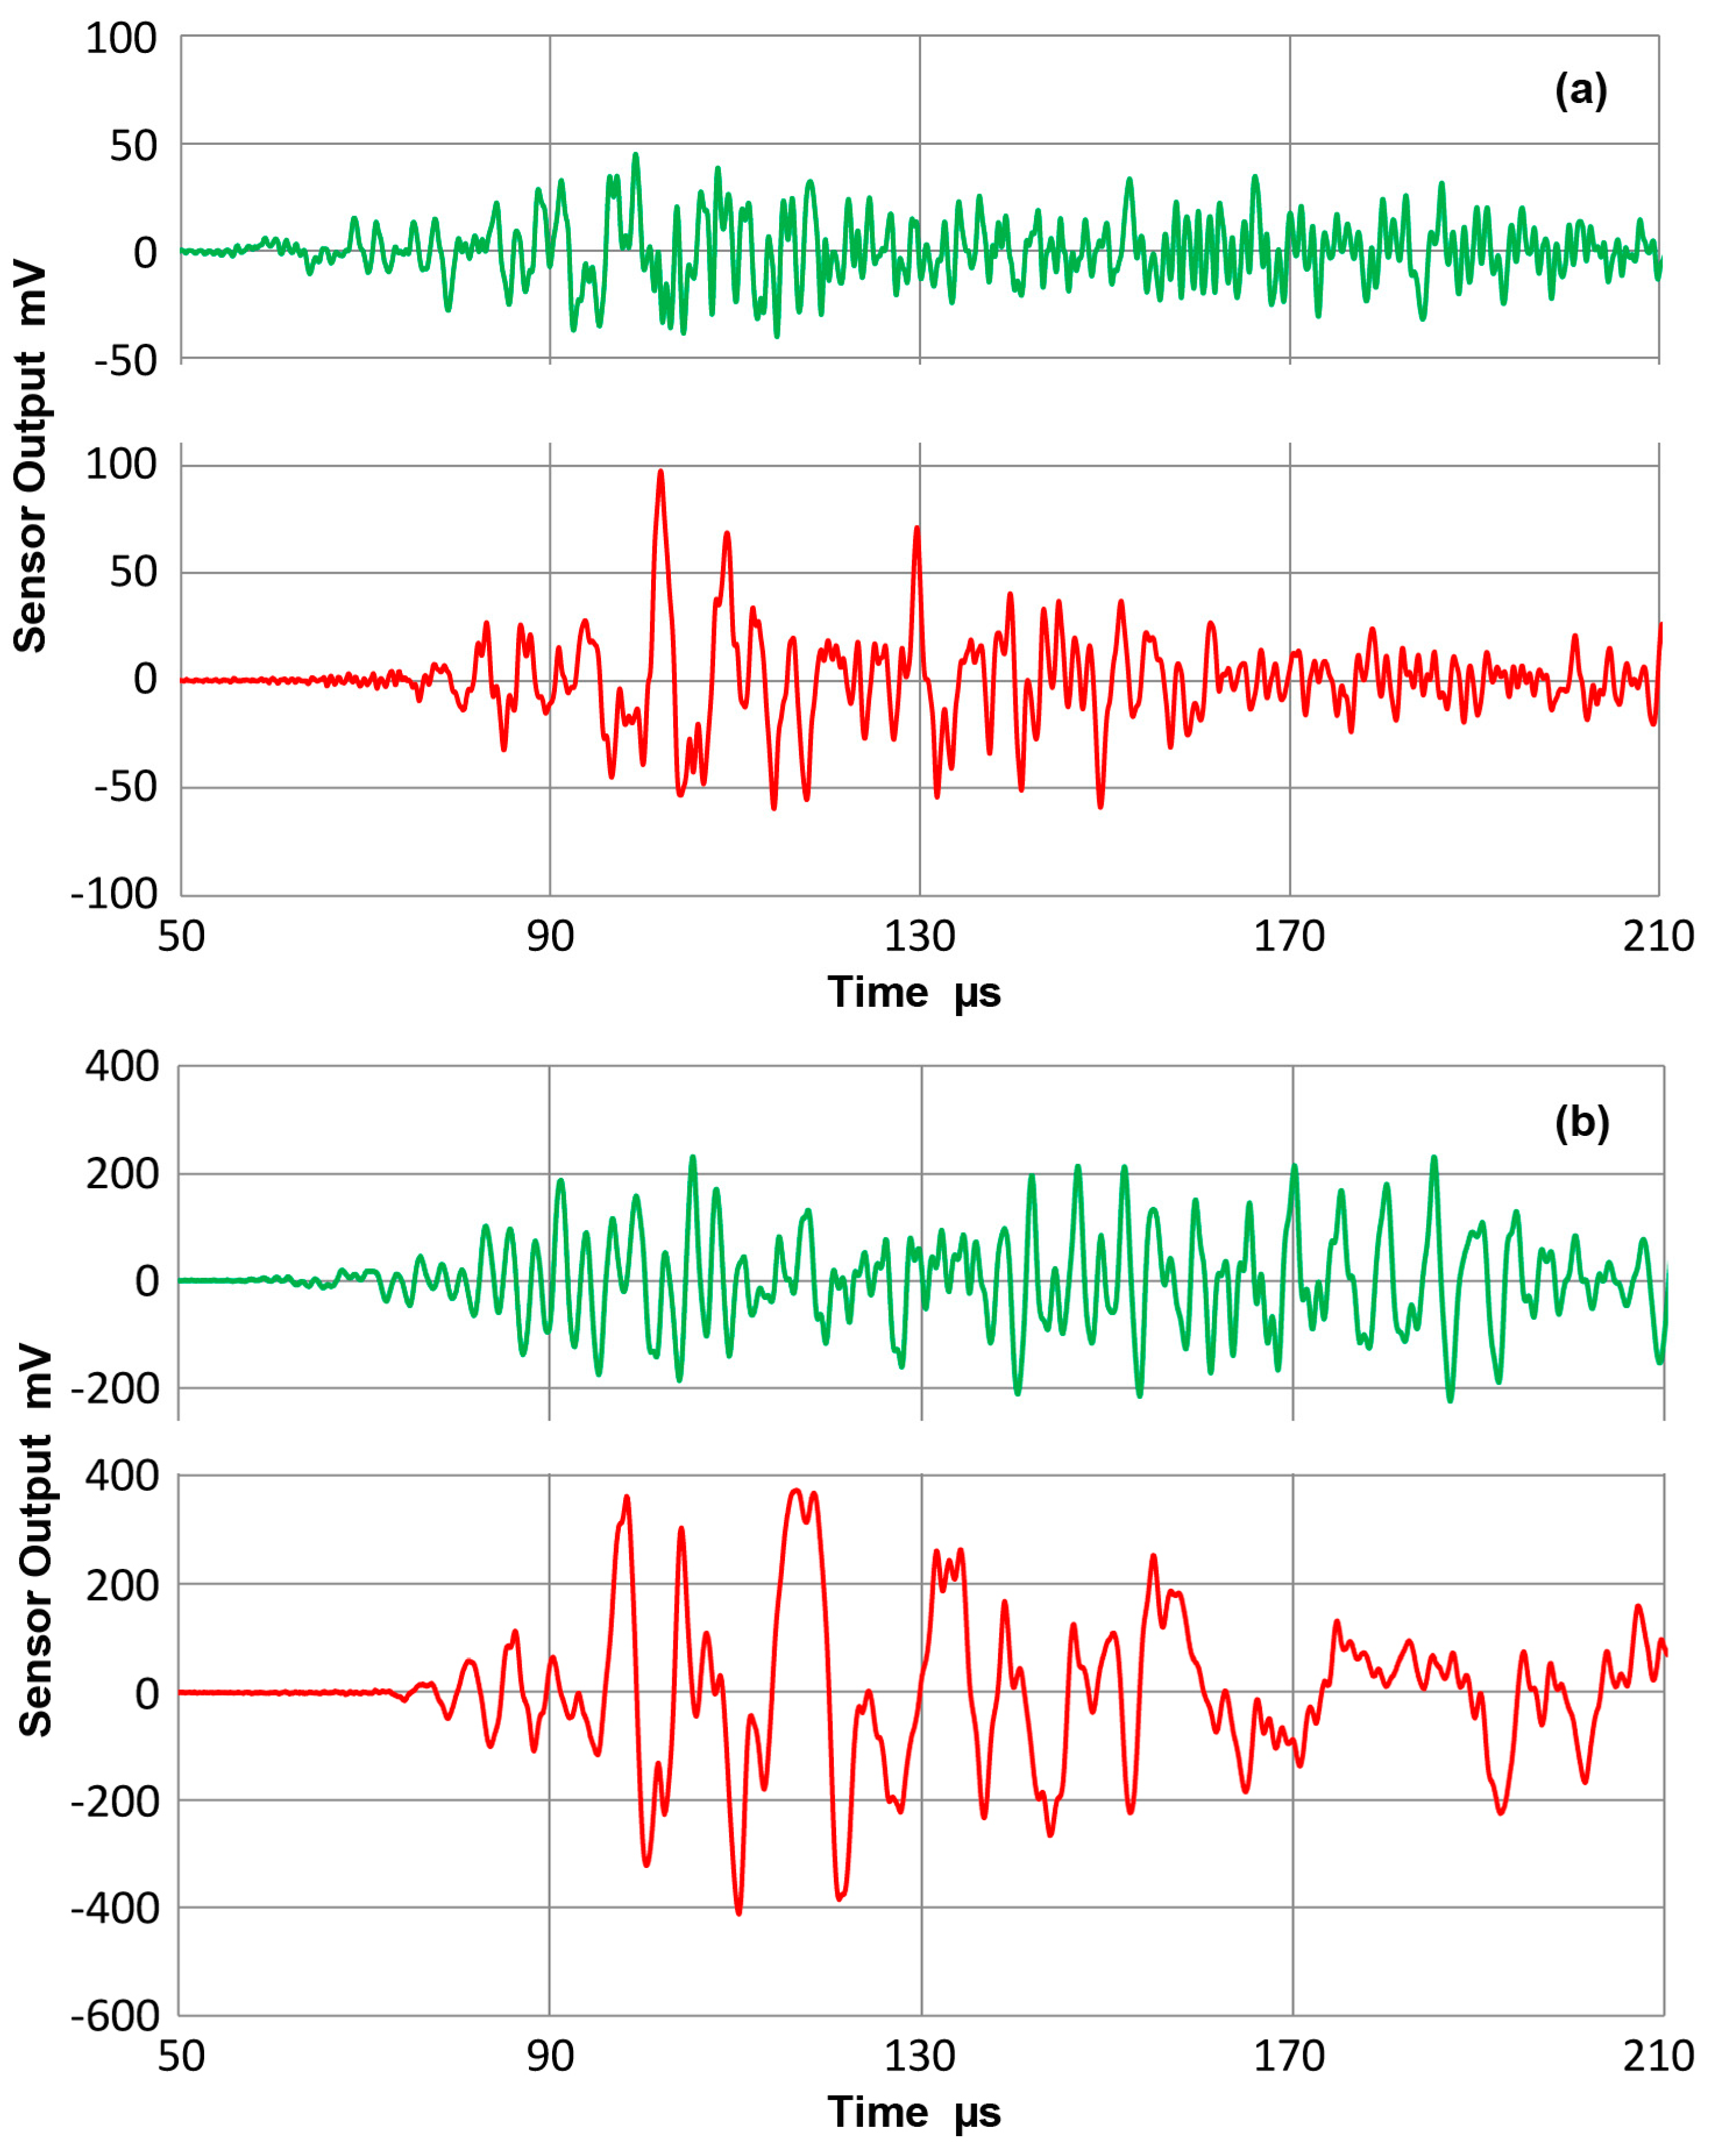
- On the basis of the bar-wave receiving sensitivities of point-contact KRN sensors, guided-wave receiving sensitivities of 12 ultrasonic transducers and AE sensors were determined. For each transducer or sensor, a unique sensitivity emerged after averaging eight different experimental spectra. Eight test conditions were formed from two geometries of propagation media, plate and bar, their thickness, 12.7 and 6.4 mm and the mode of guided wave excitation, symmetric and asymmetric.
- (b)
- The guided-wave receiving sensitivities thus determined were slightly different from the bar-wave sensitivities reported previously for the same transducers and sensors, which relied on a single test condition (bar wave, 6.4 mm thickness, symmetric excitation). At least four different conditions are needed to cancel out various effects of test conditions that arise from different wave mode excitation and propagation and from aperture null effect dependent on wave velocity and sensing element size.
- (c)
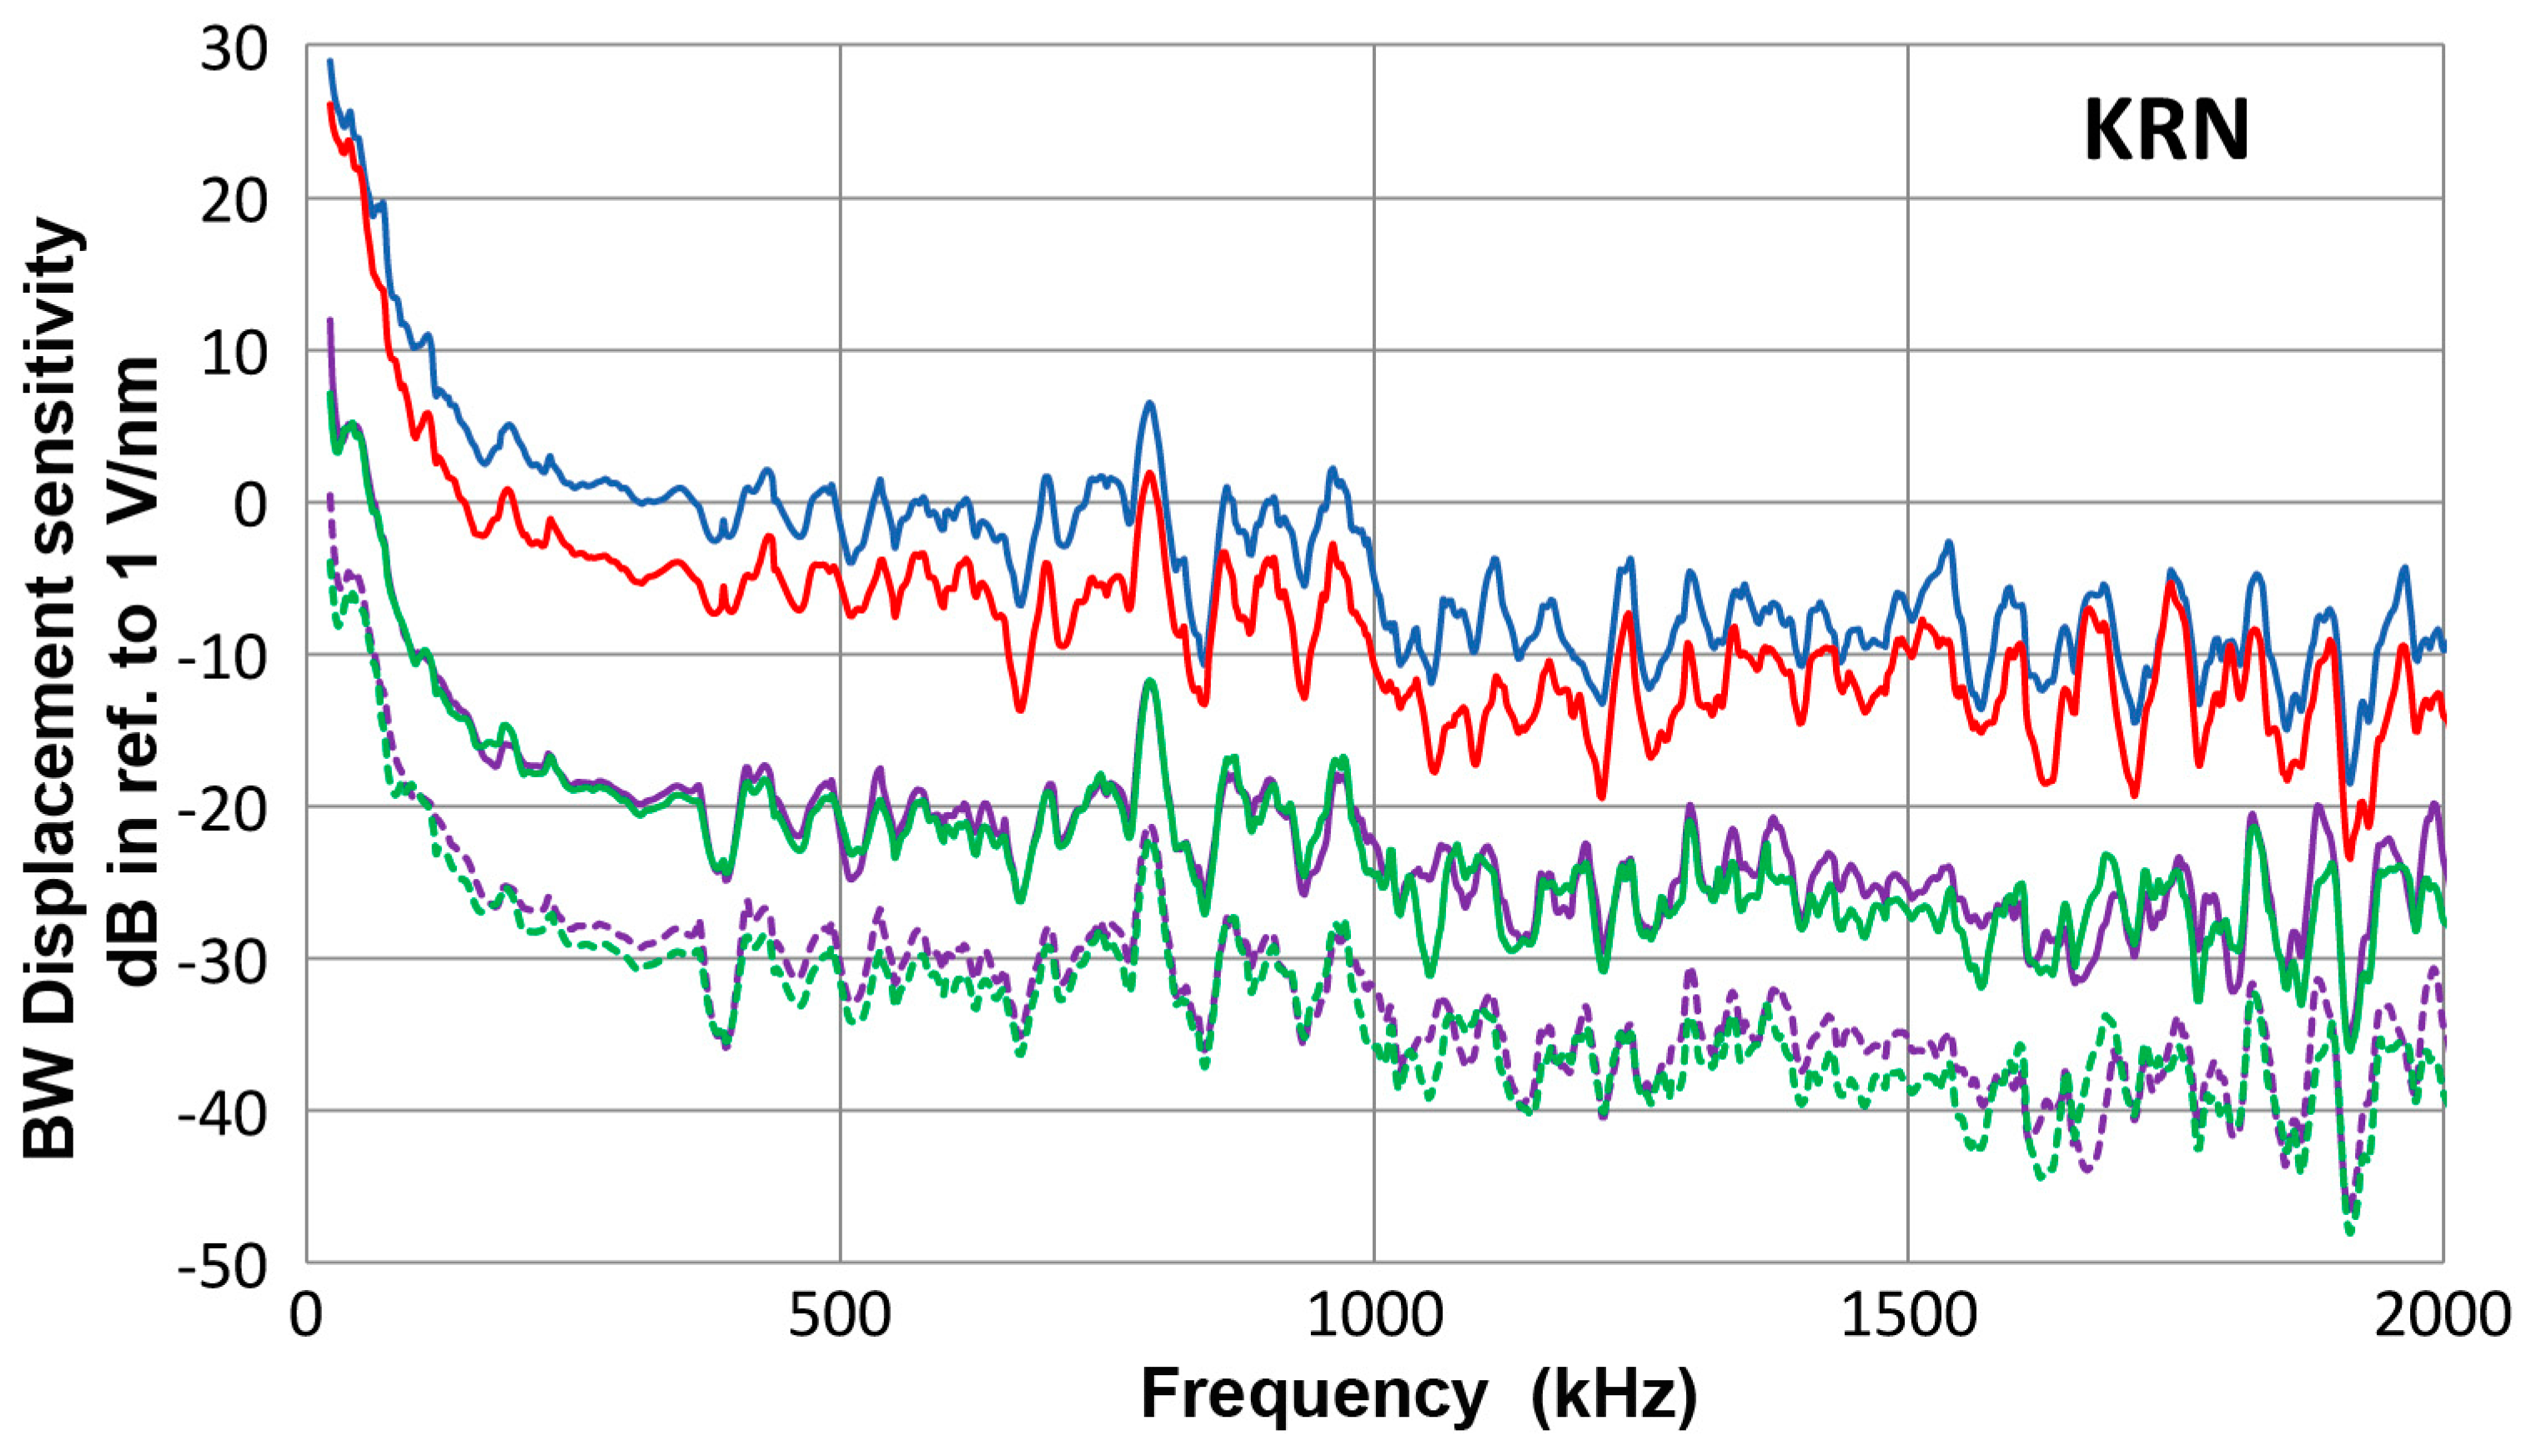
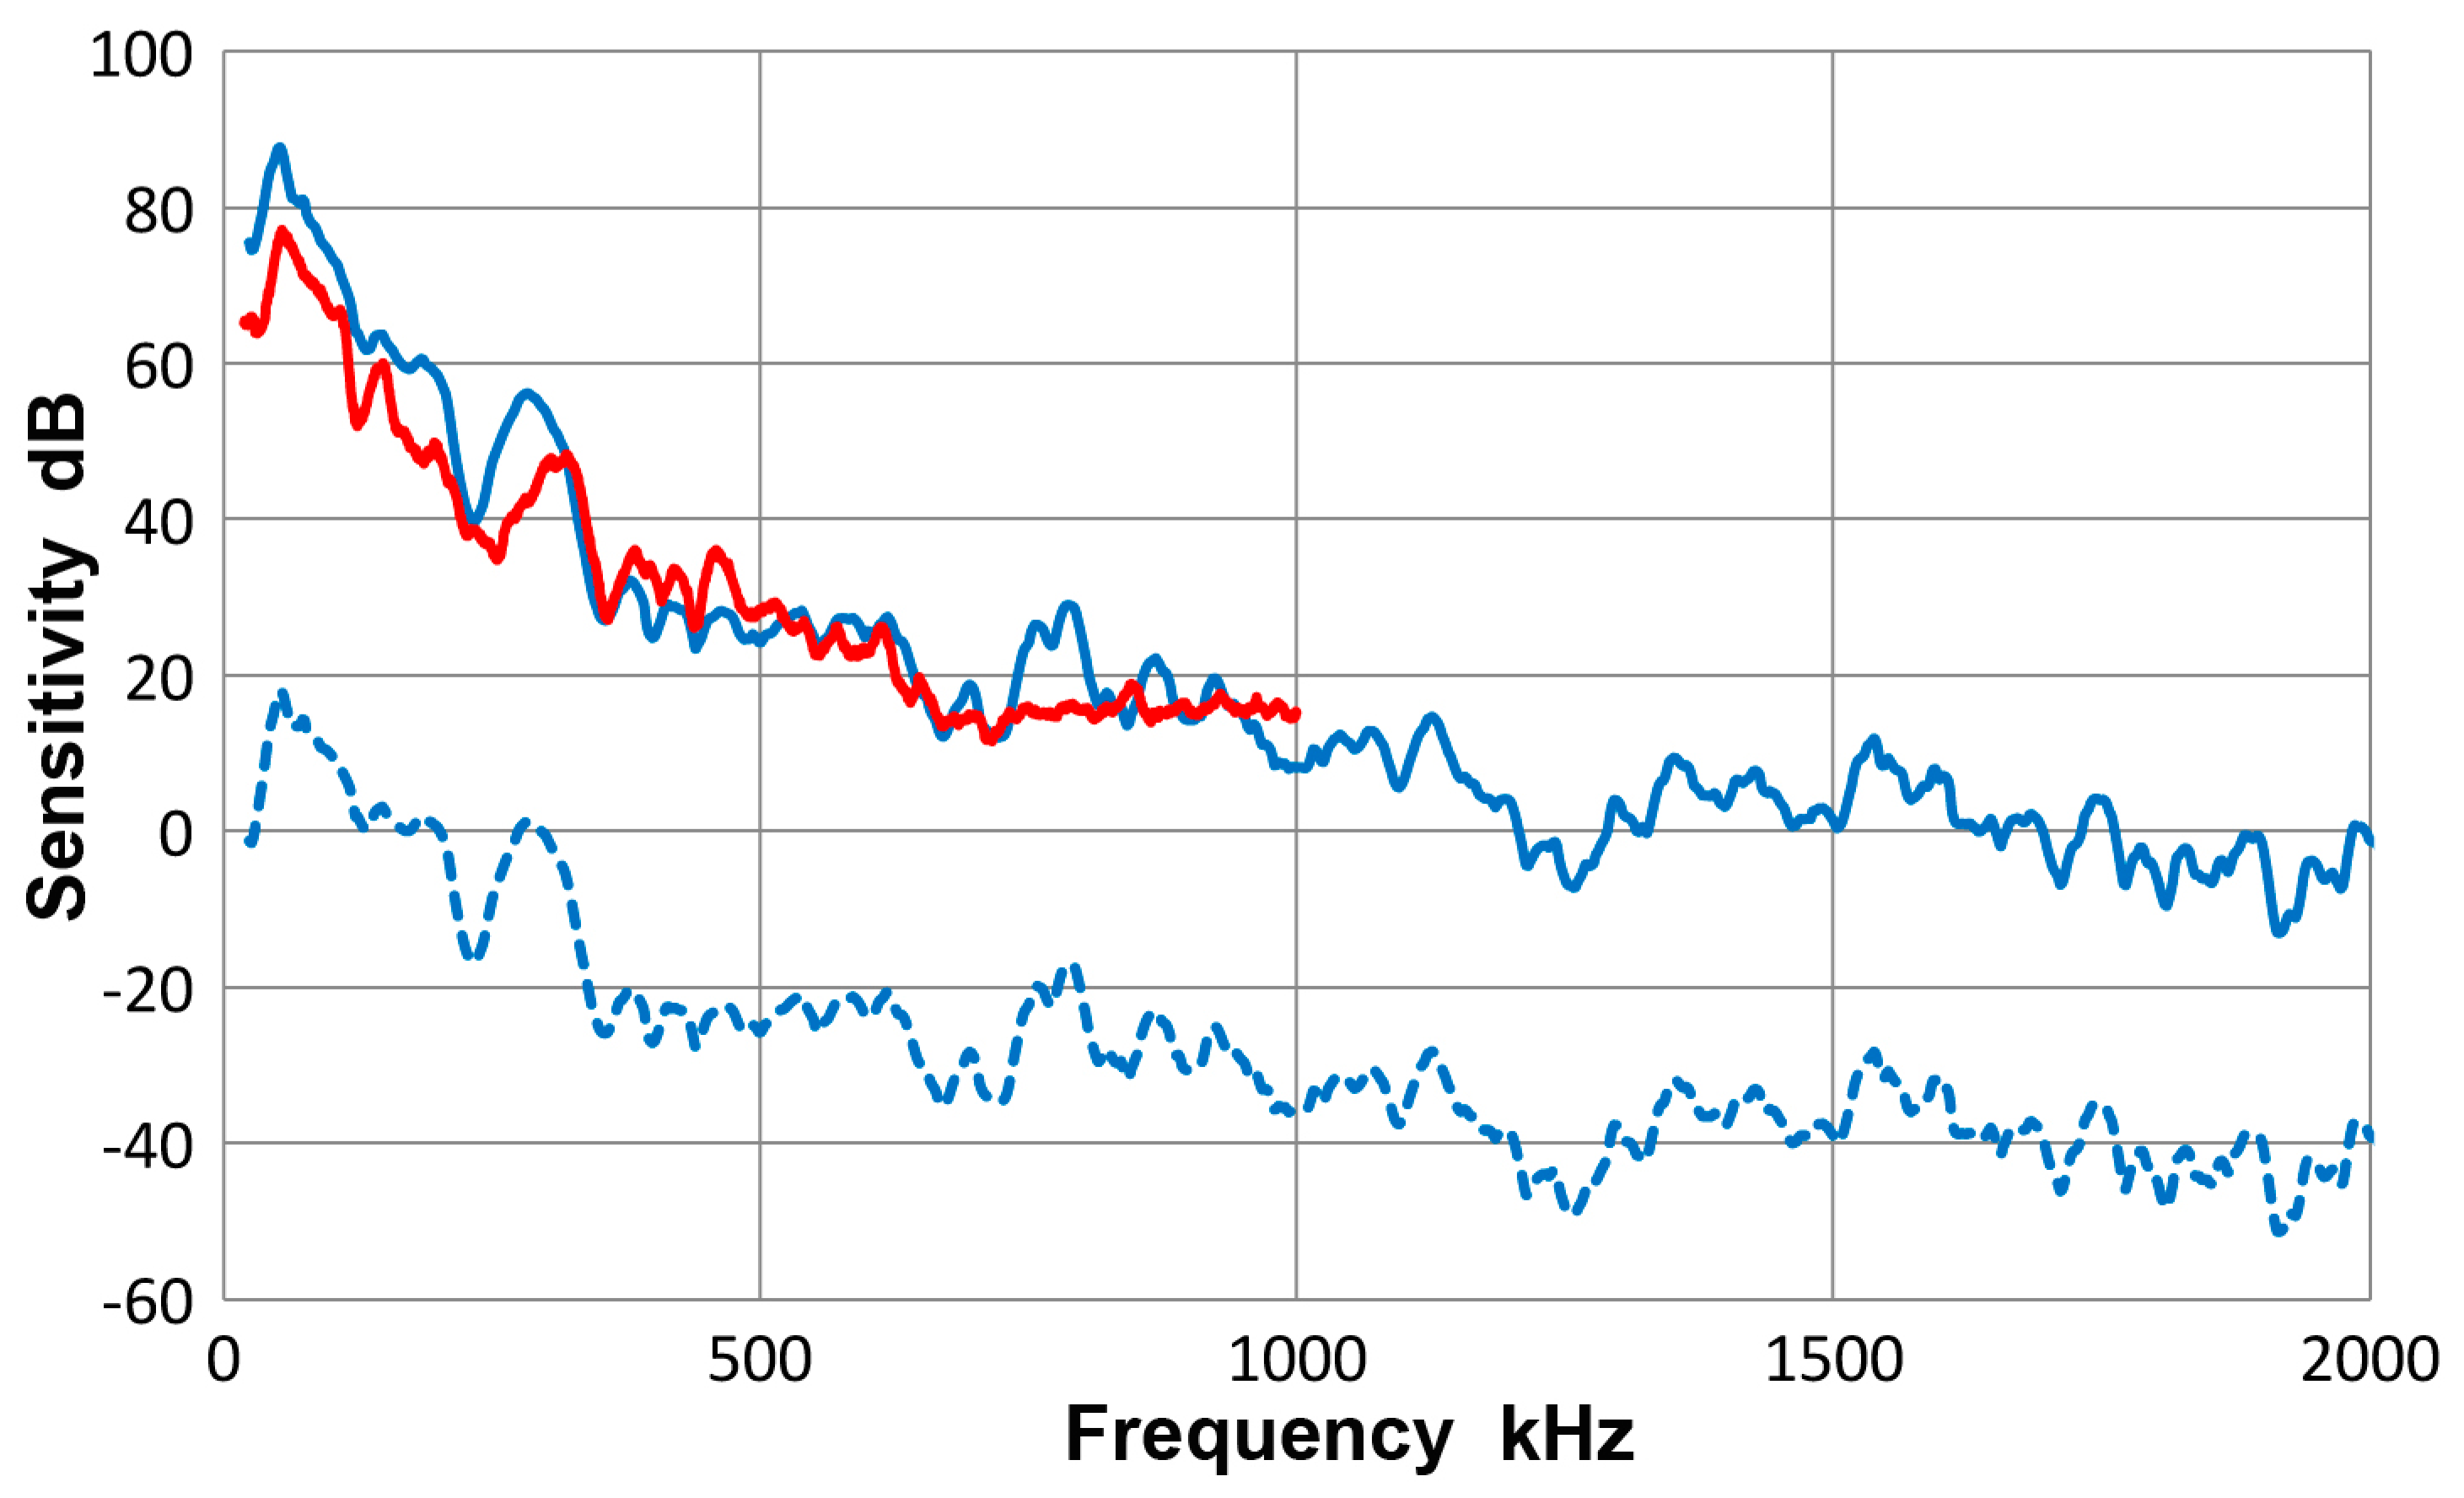
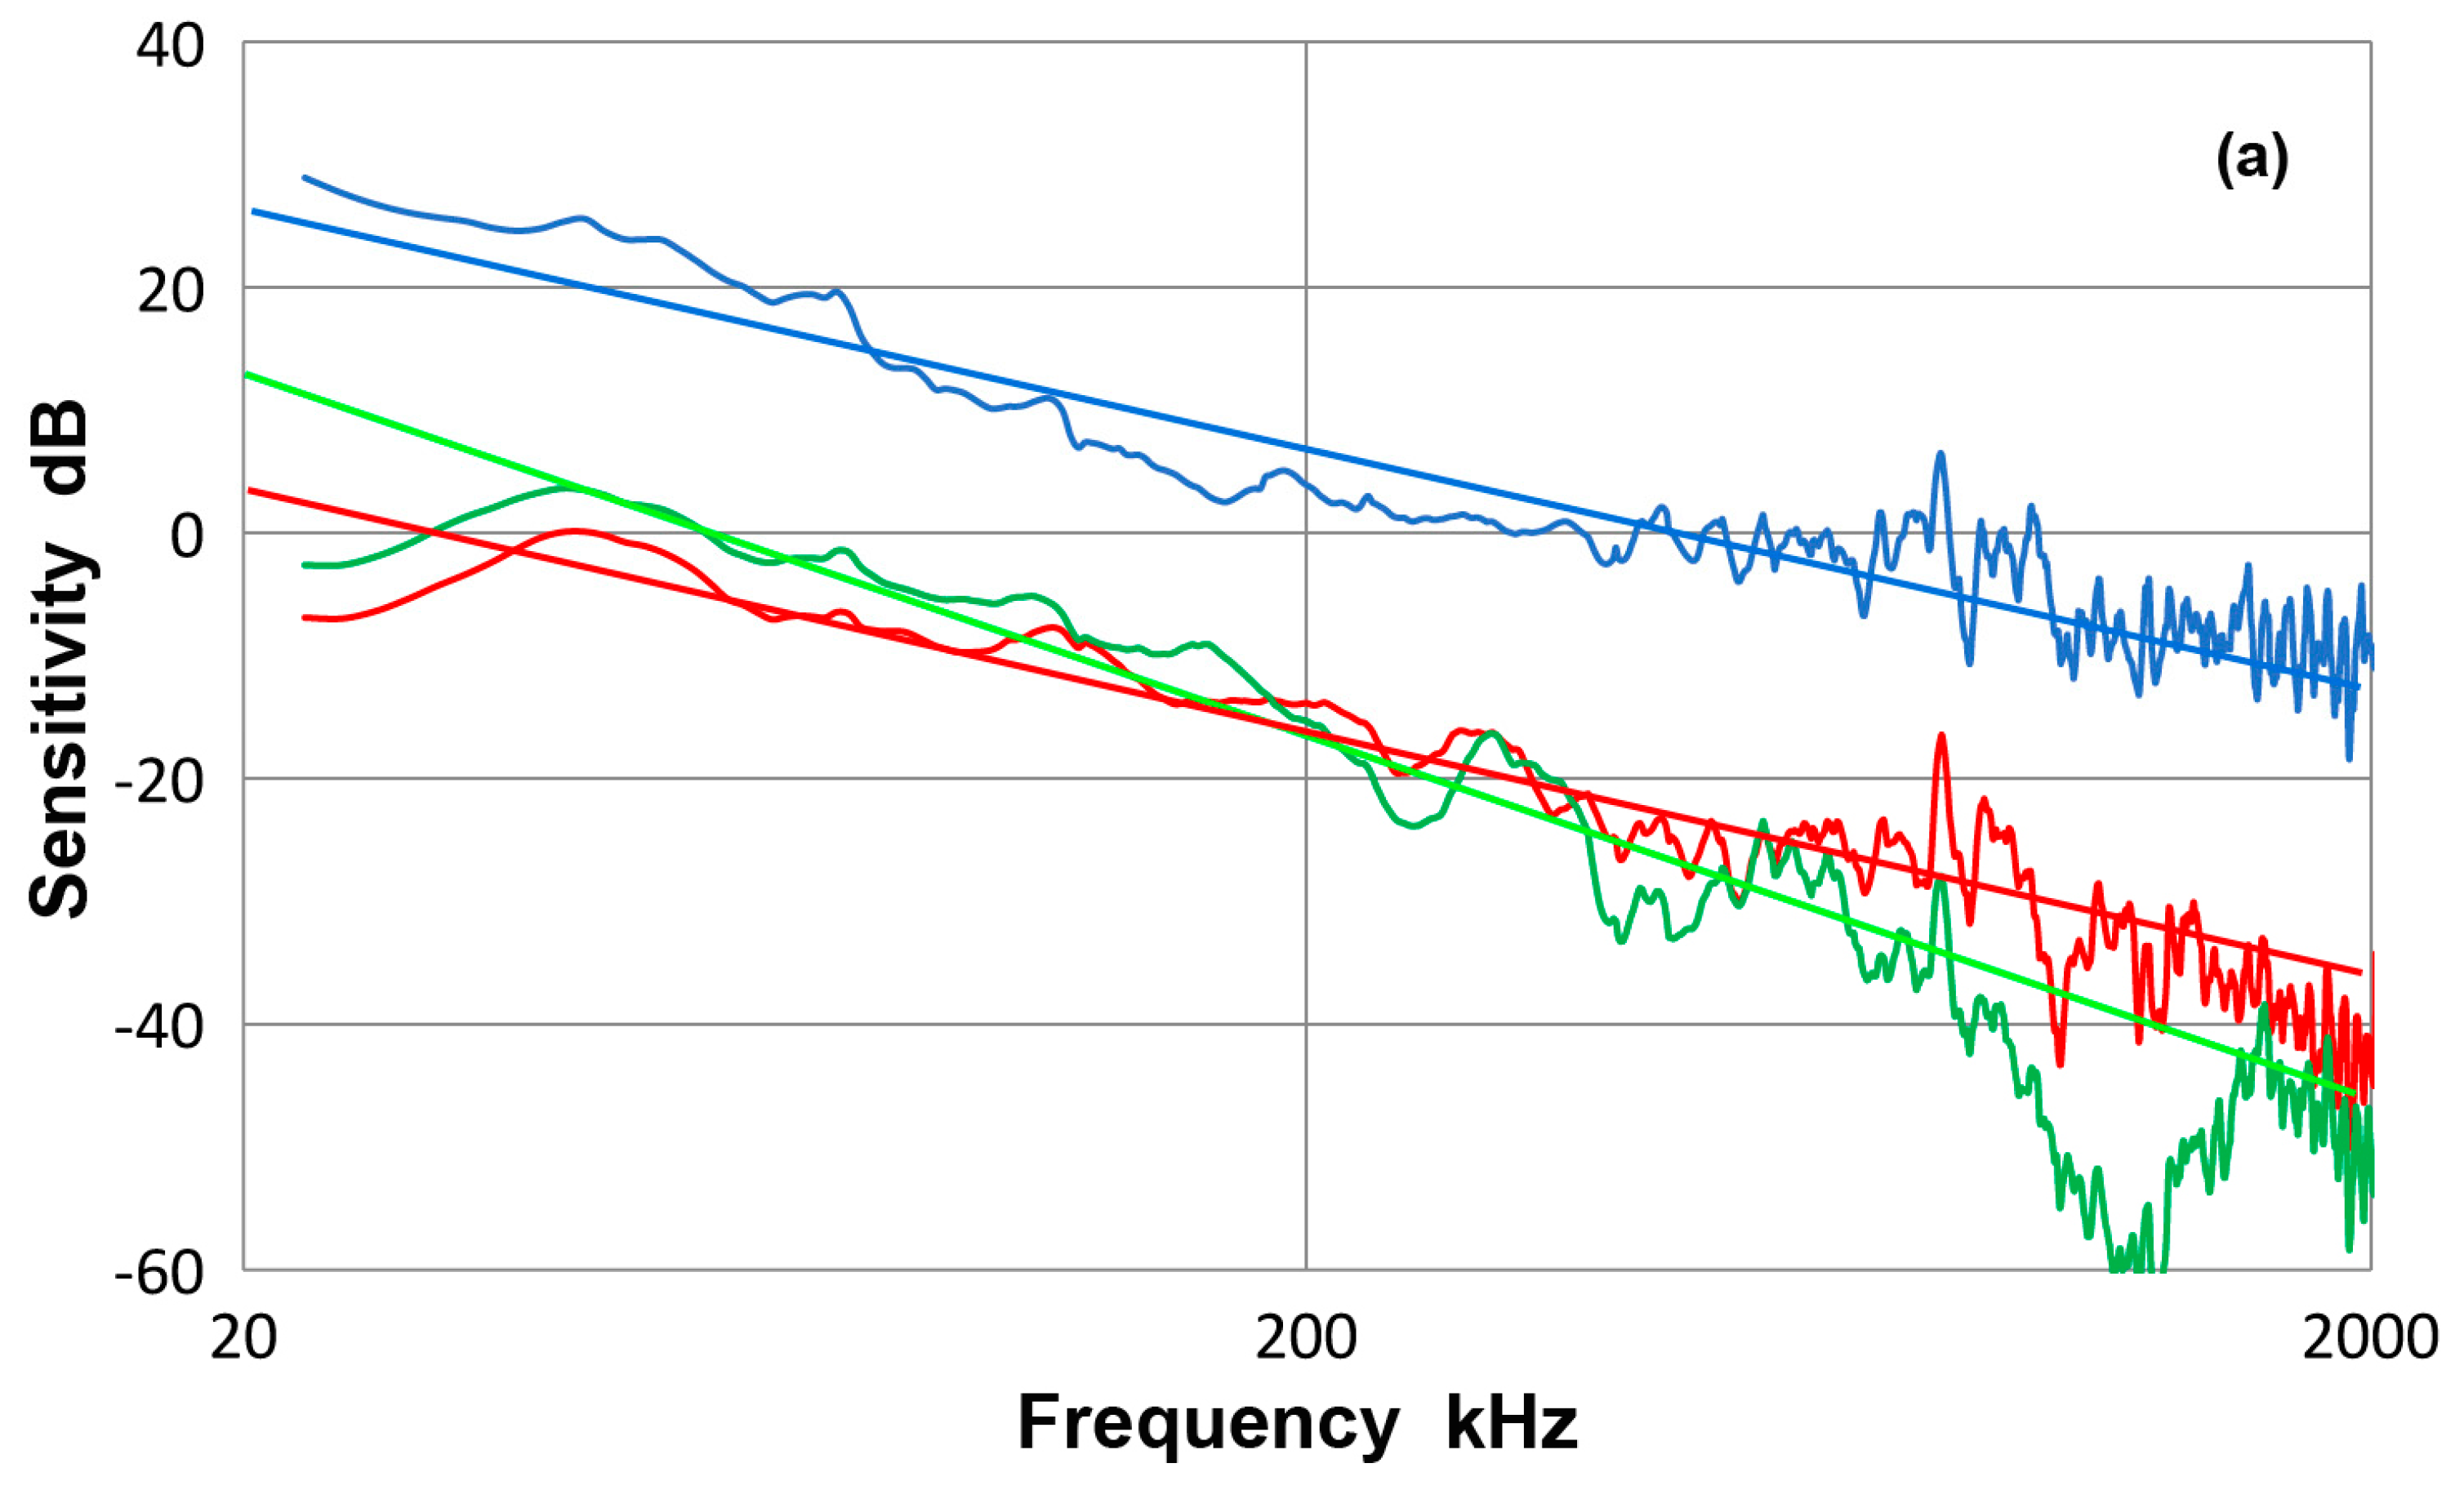
- The guided-wave receiving sensitivities obtained were completely different from the receiving sensitivities to NIW. This conclusion was identical to that reported for the cases when single bar-wave testing set-up was utilized [10].
- (d)
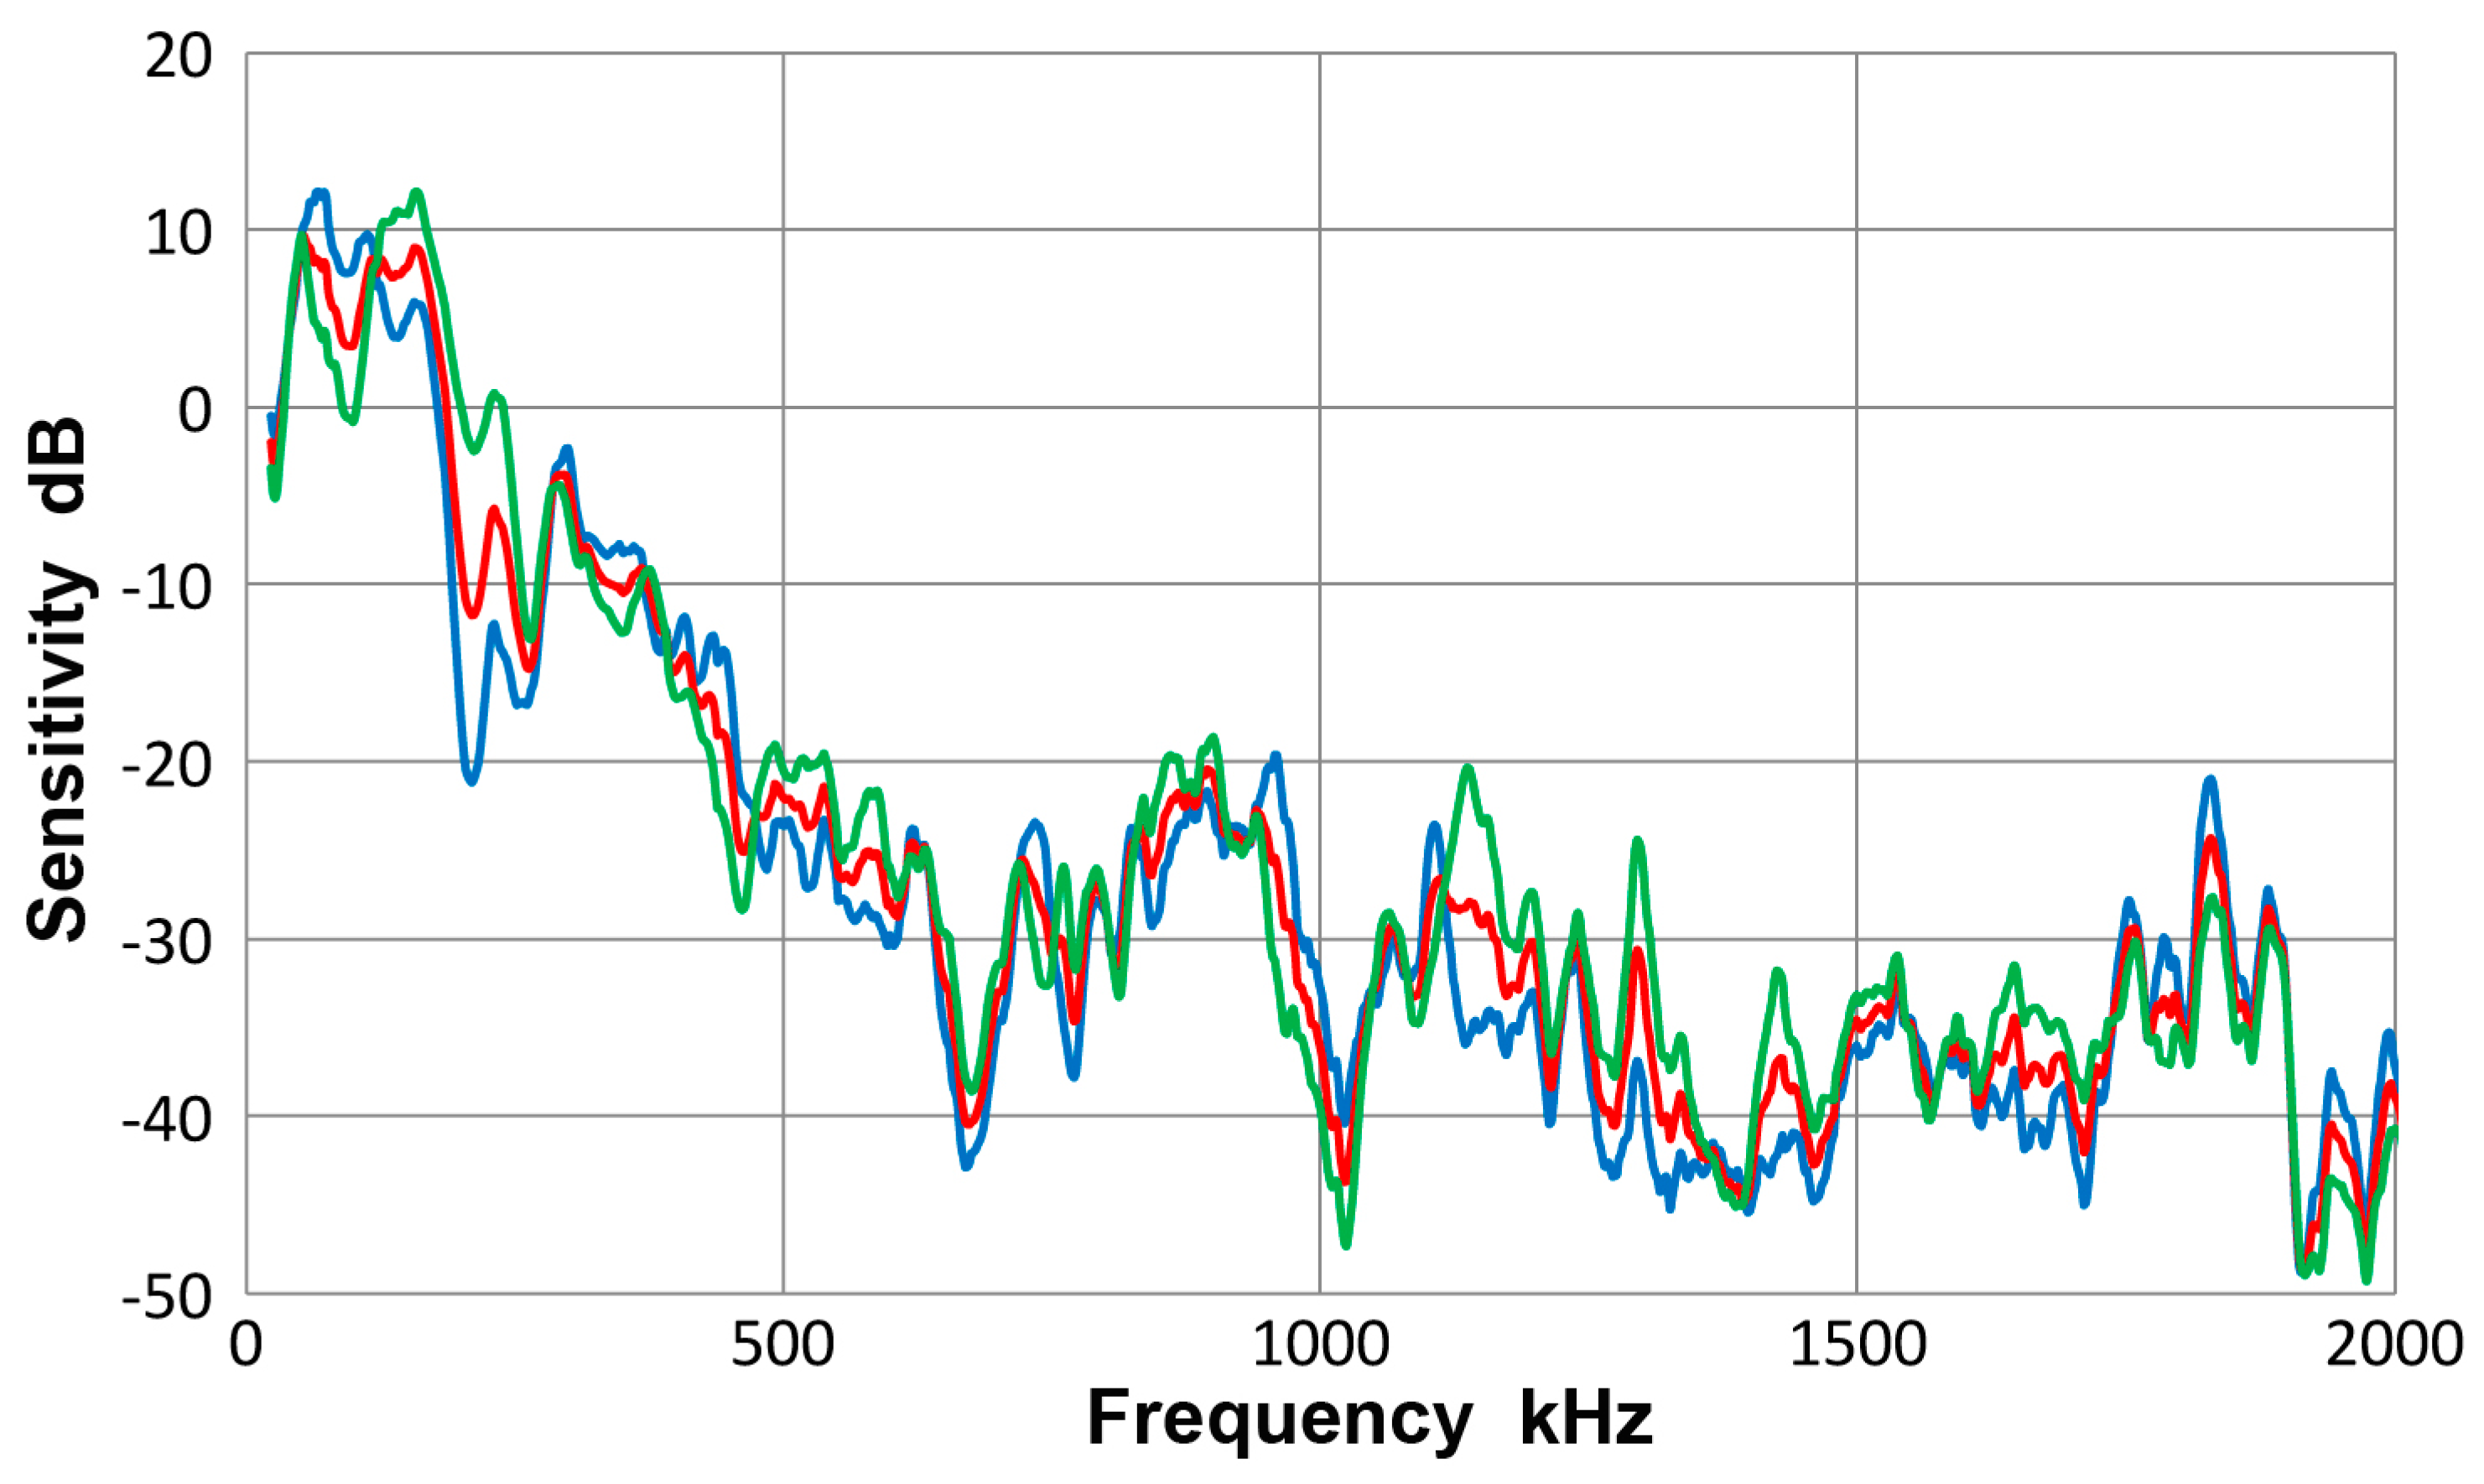
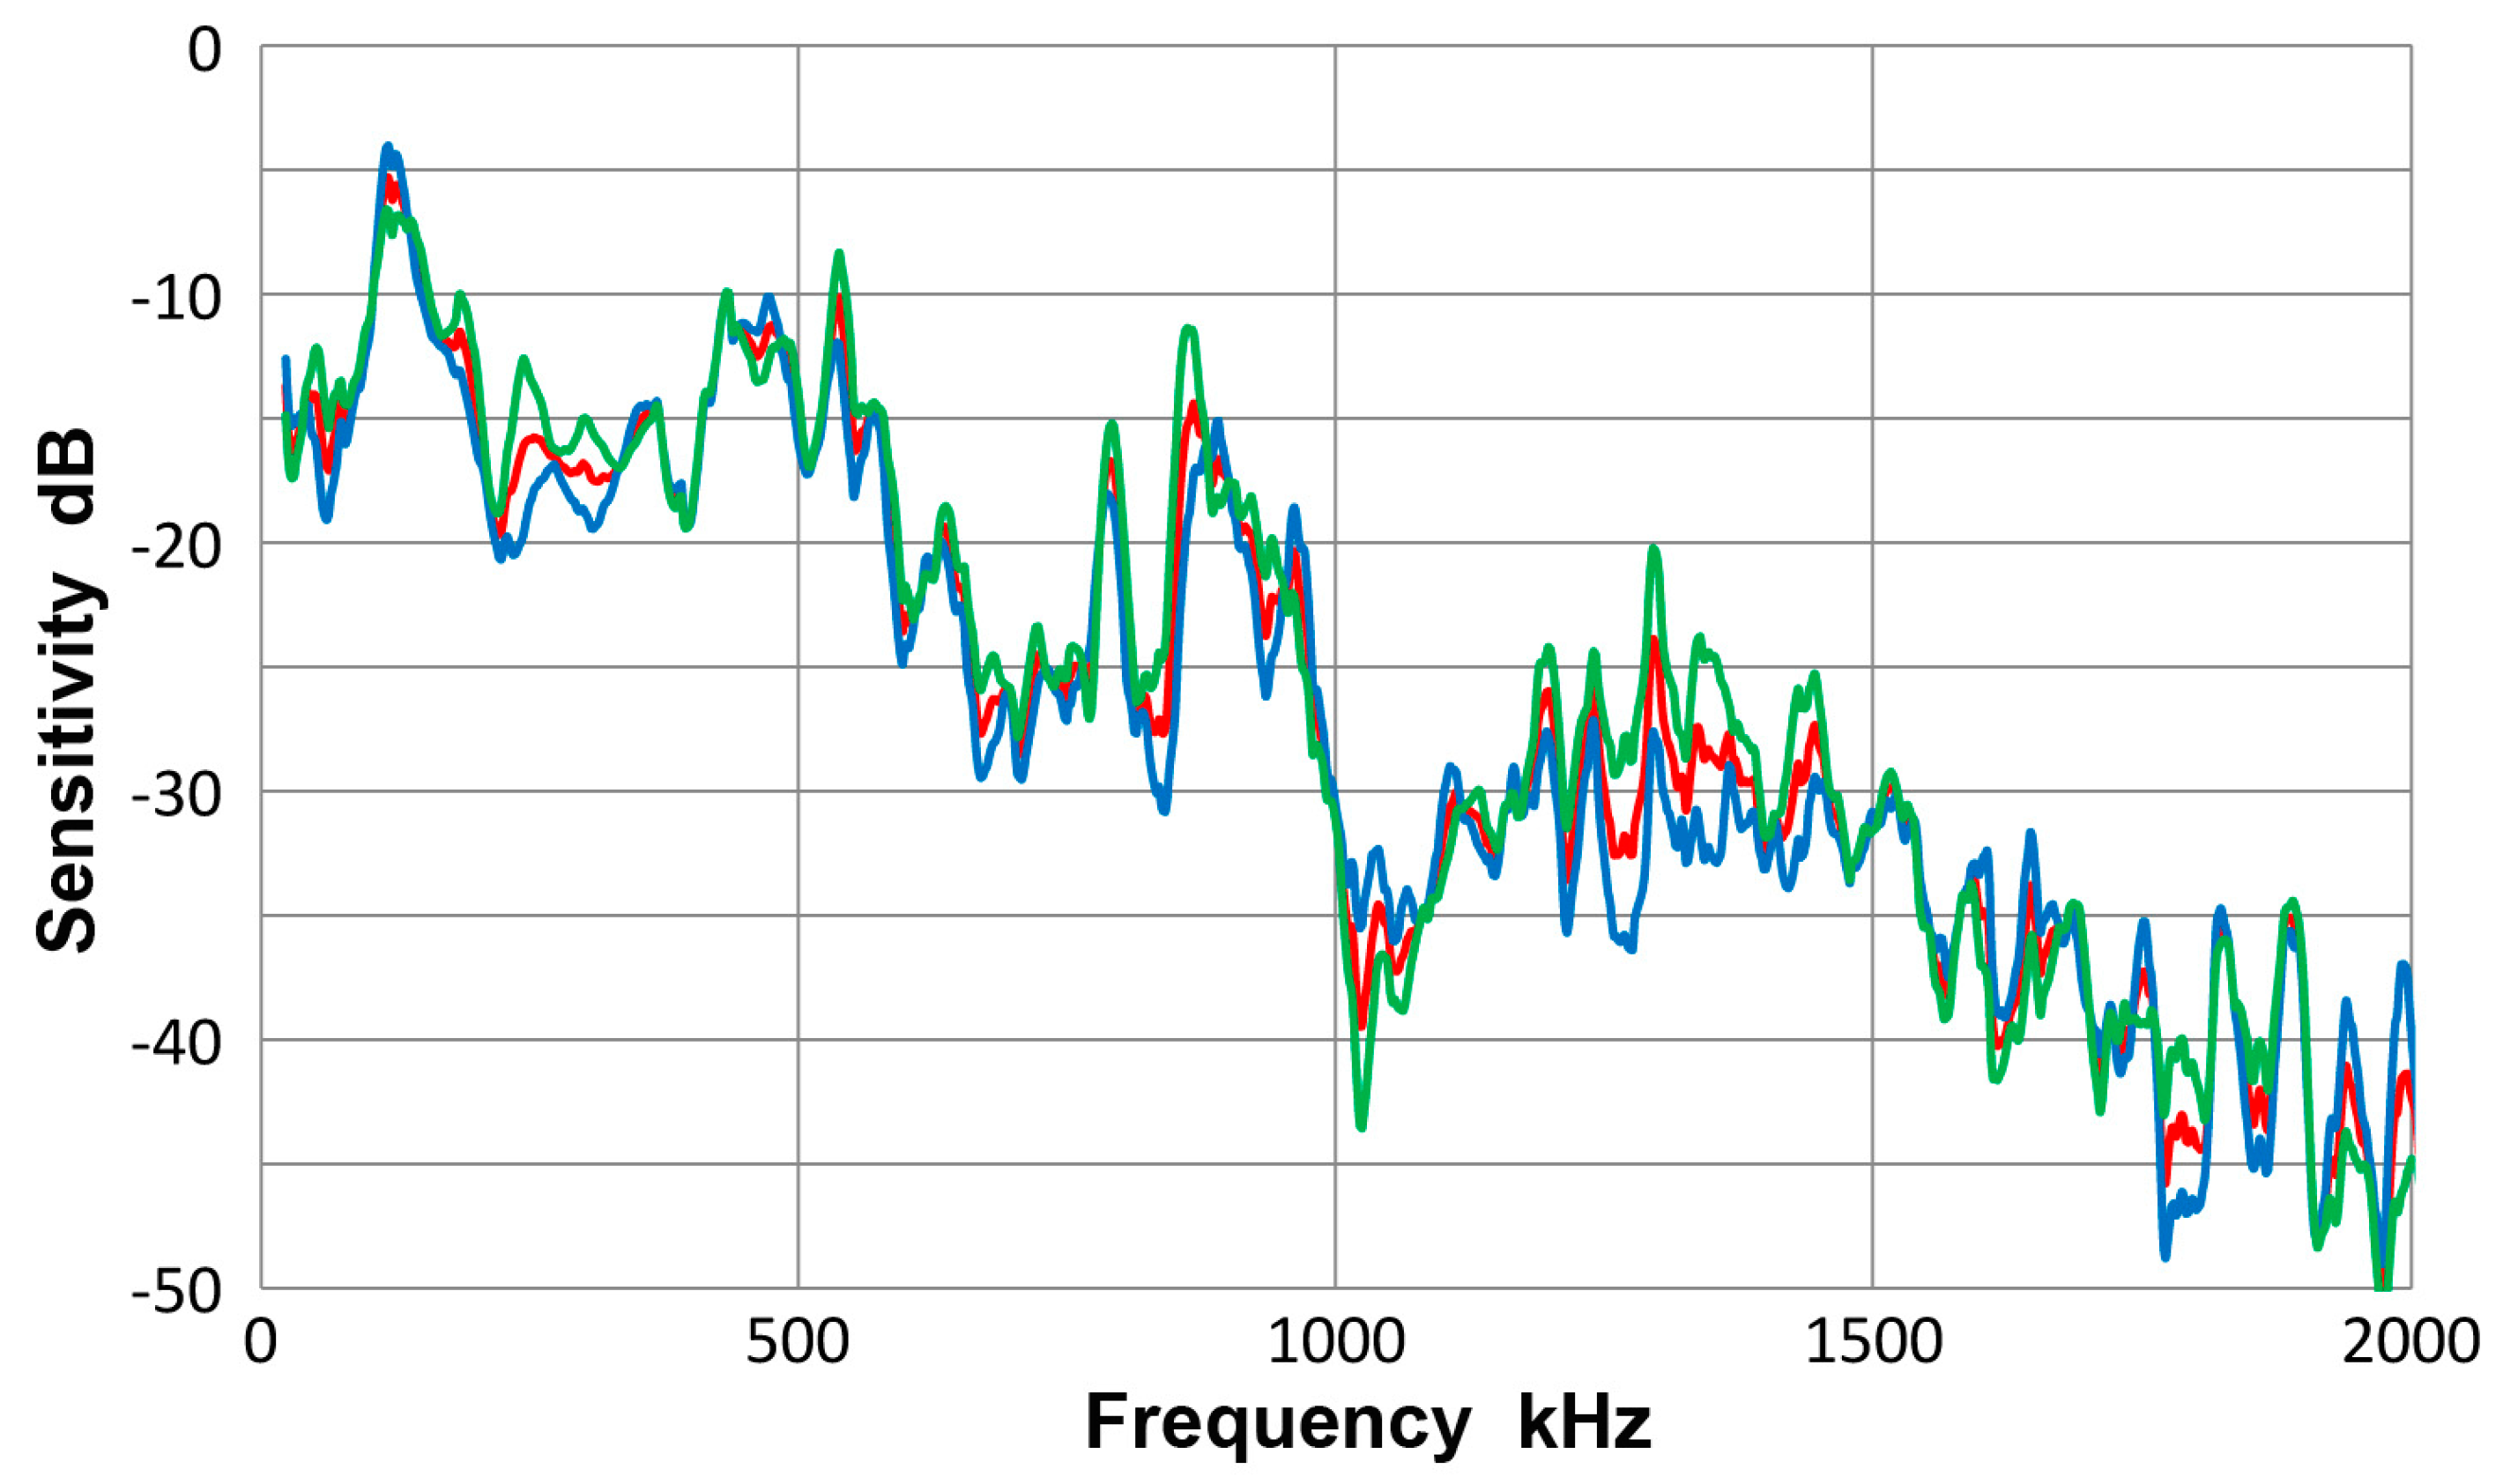
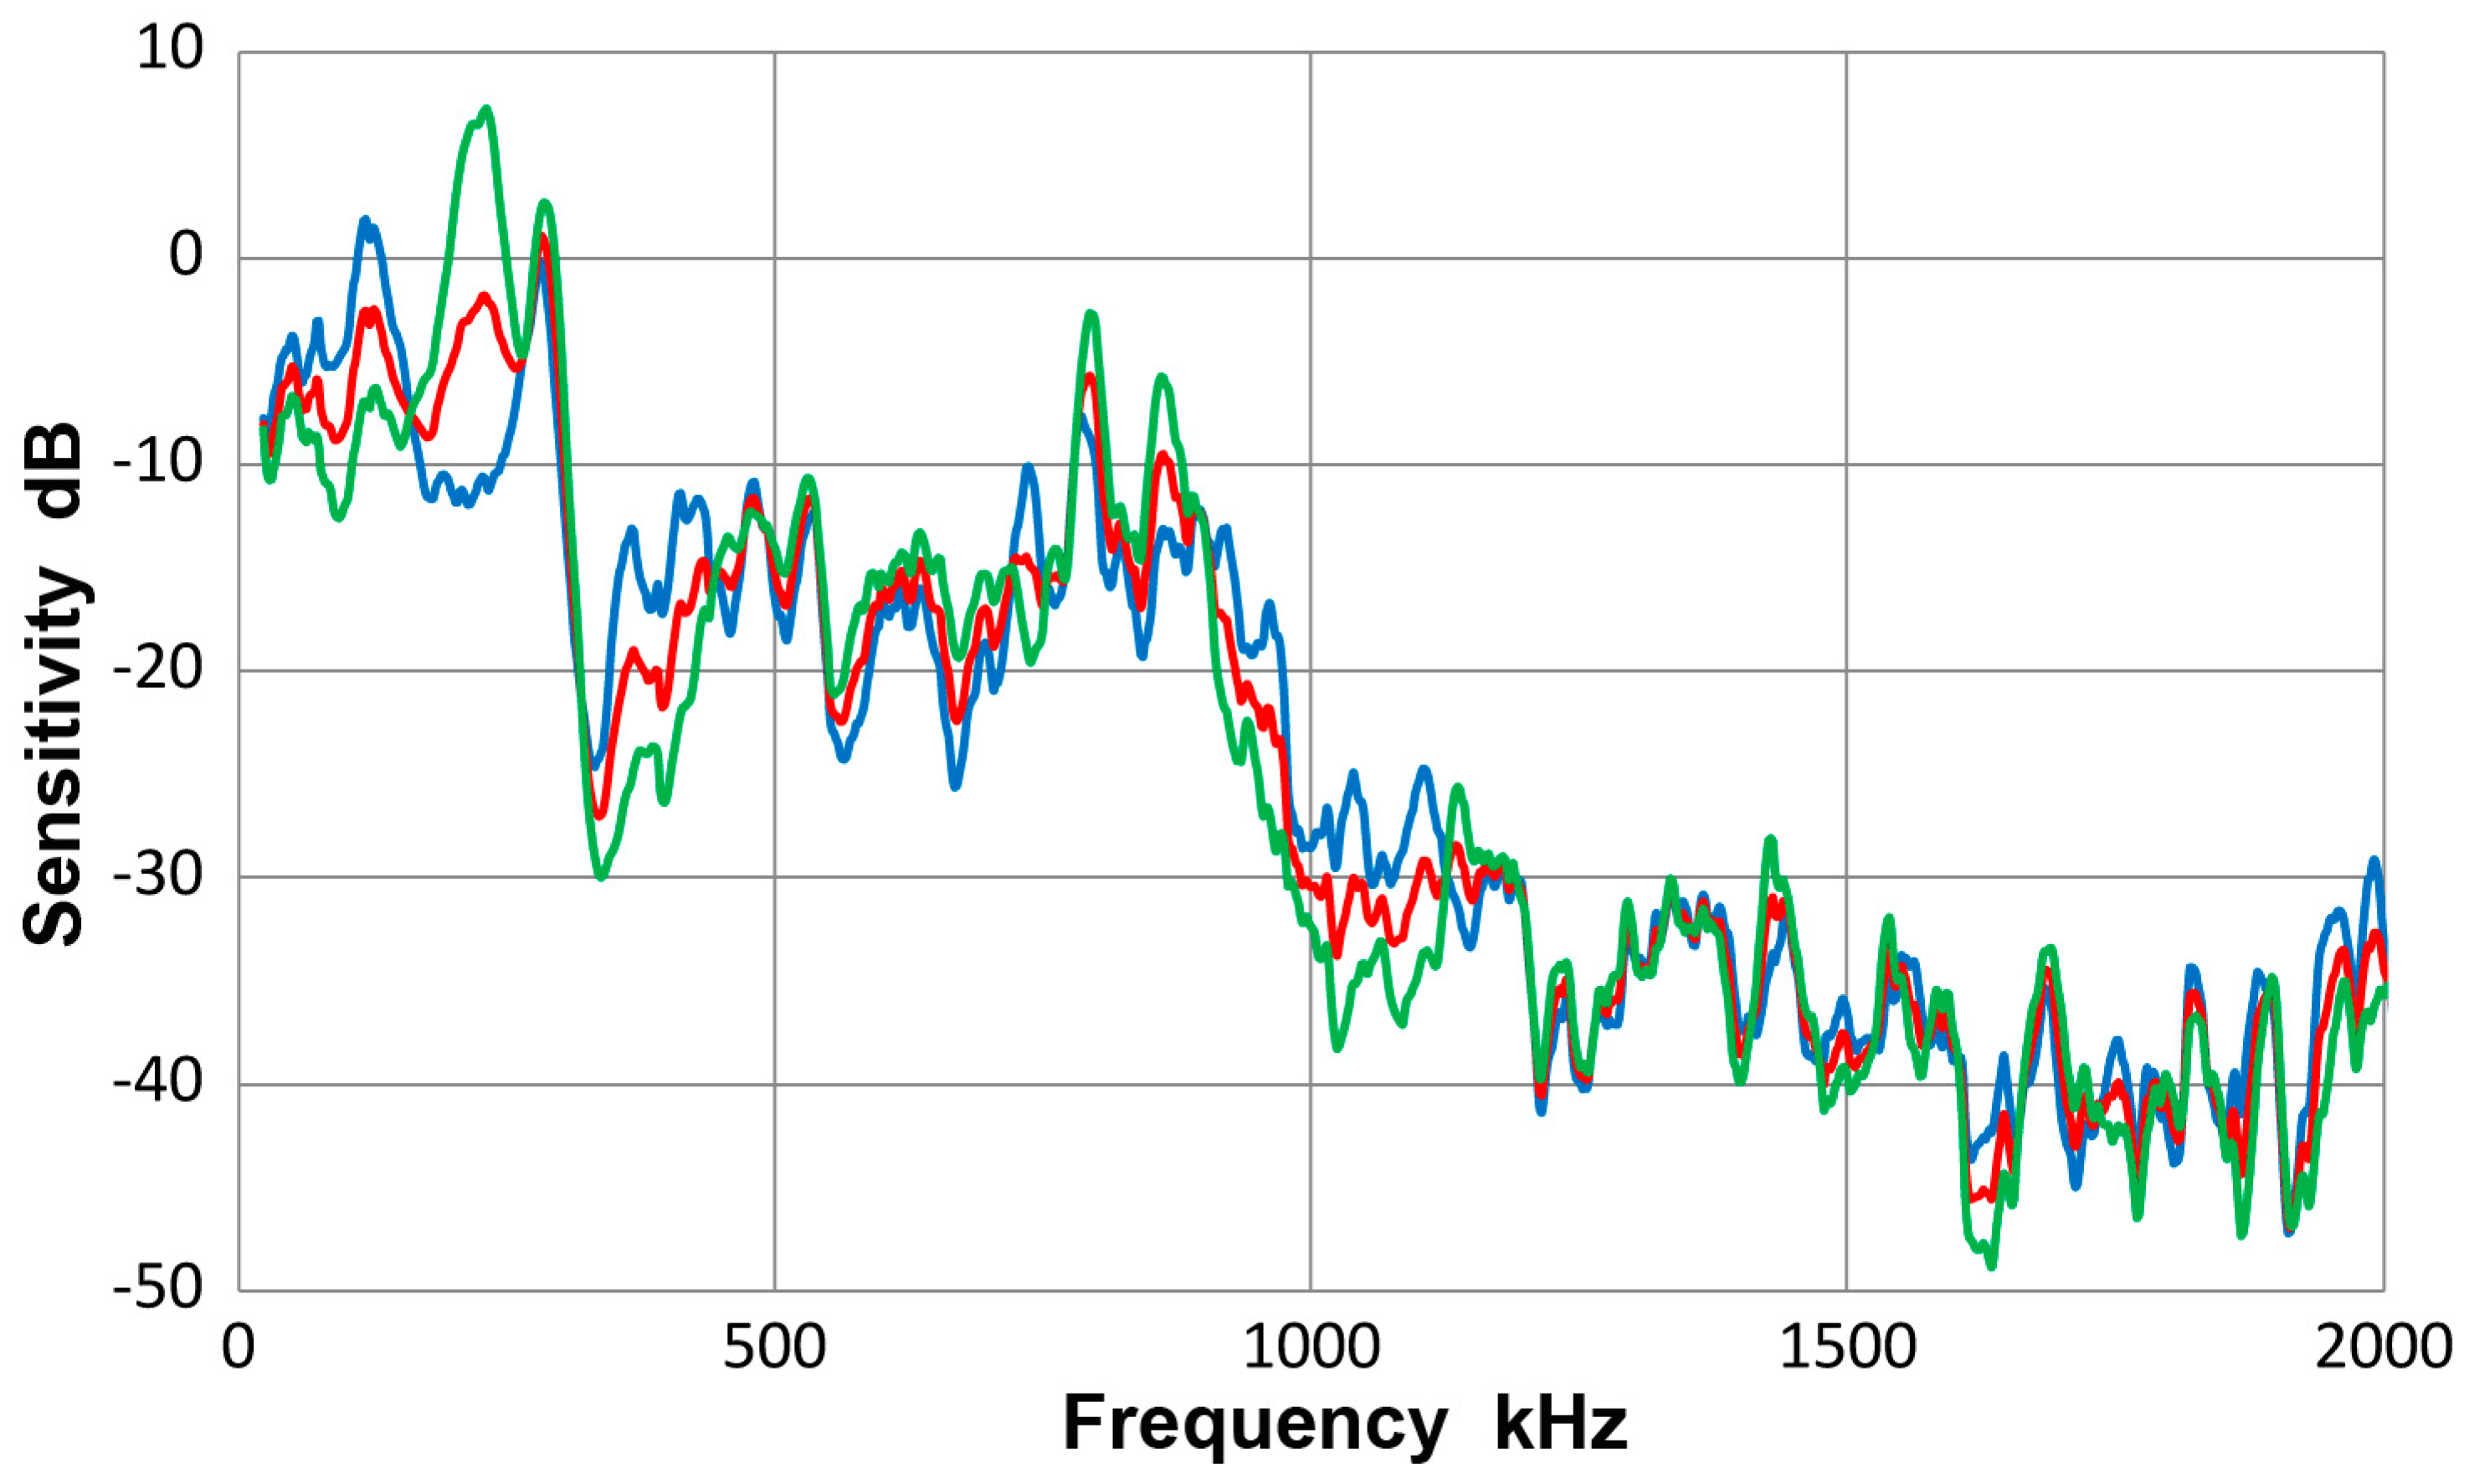
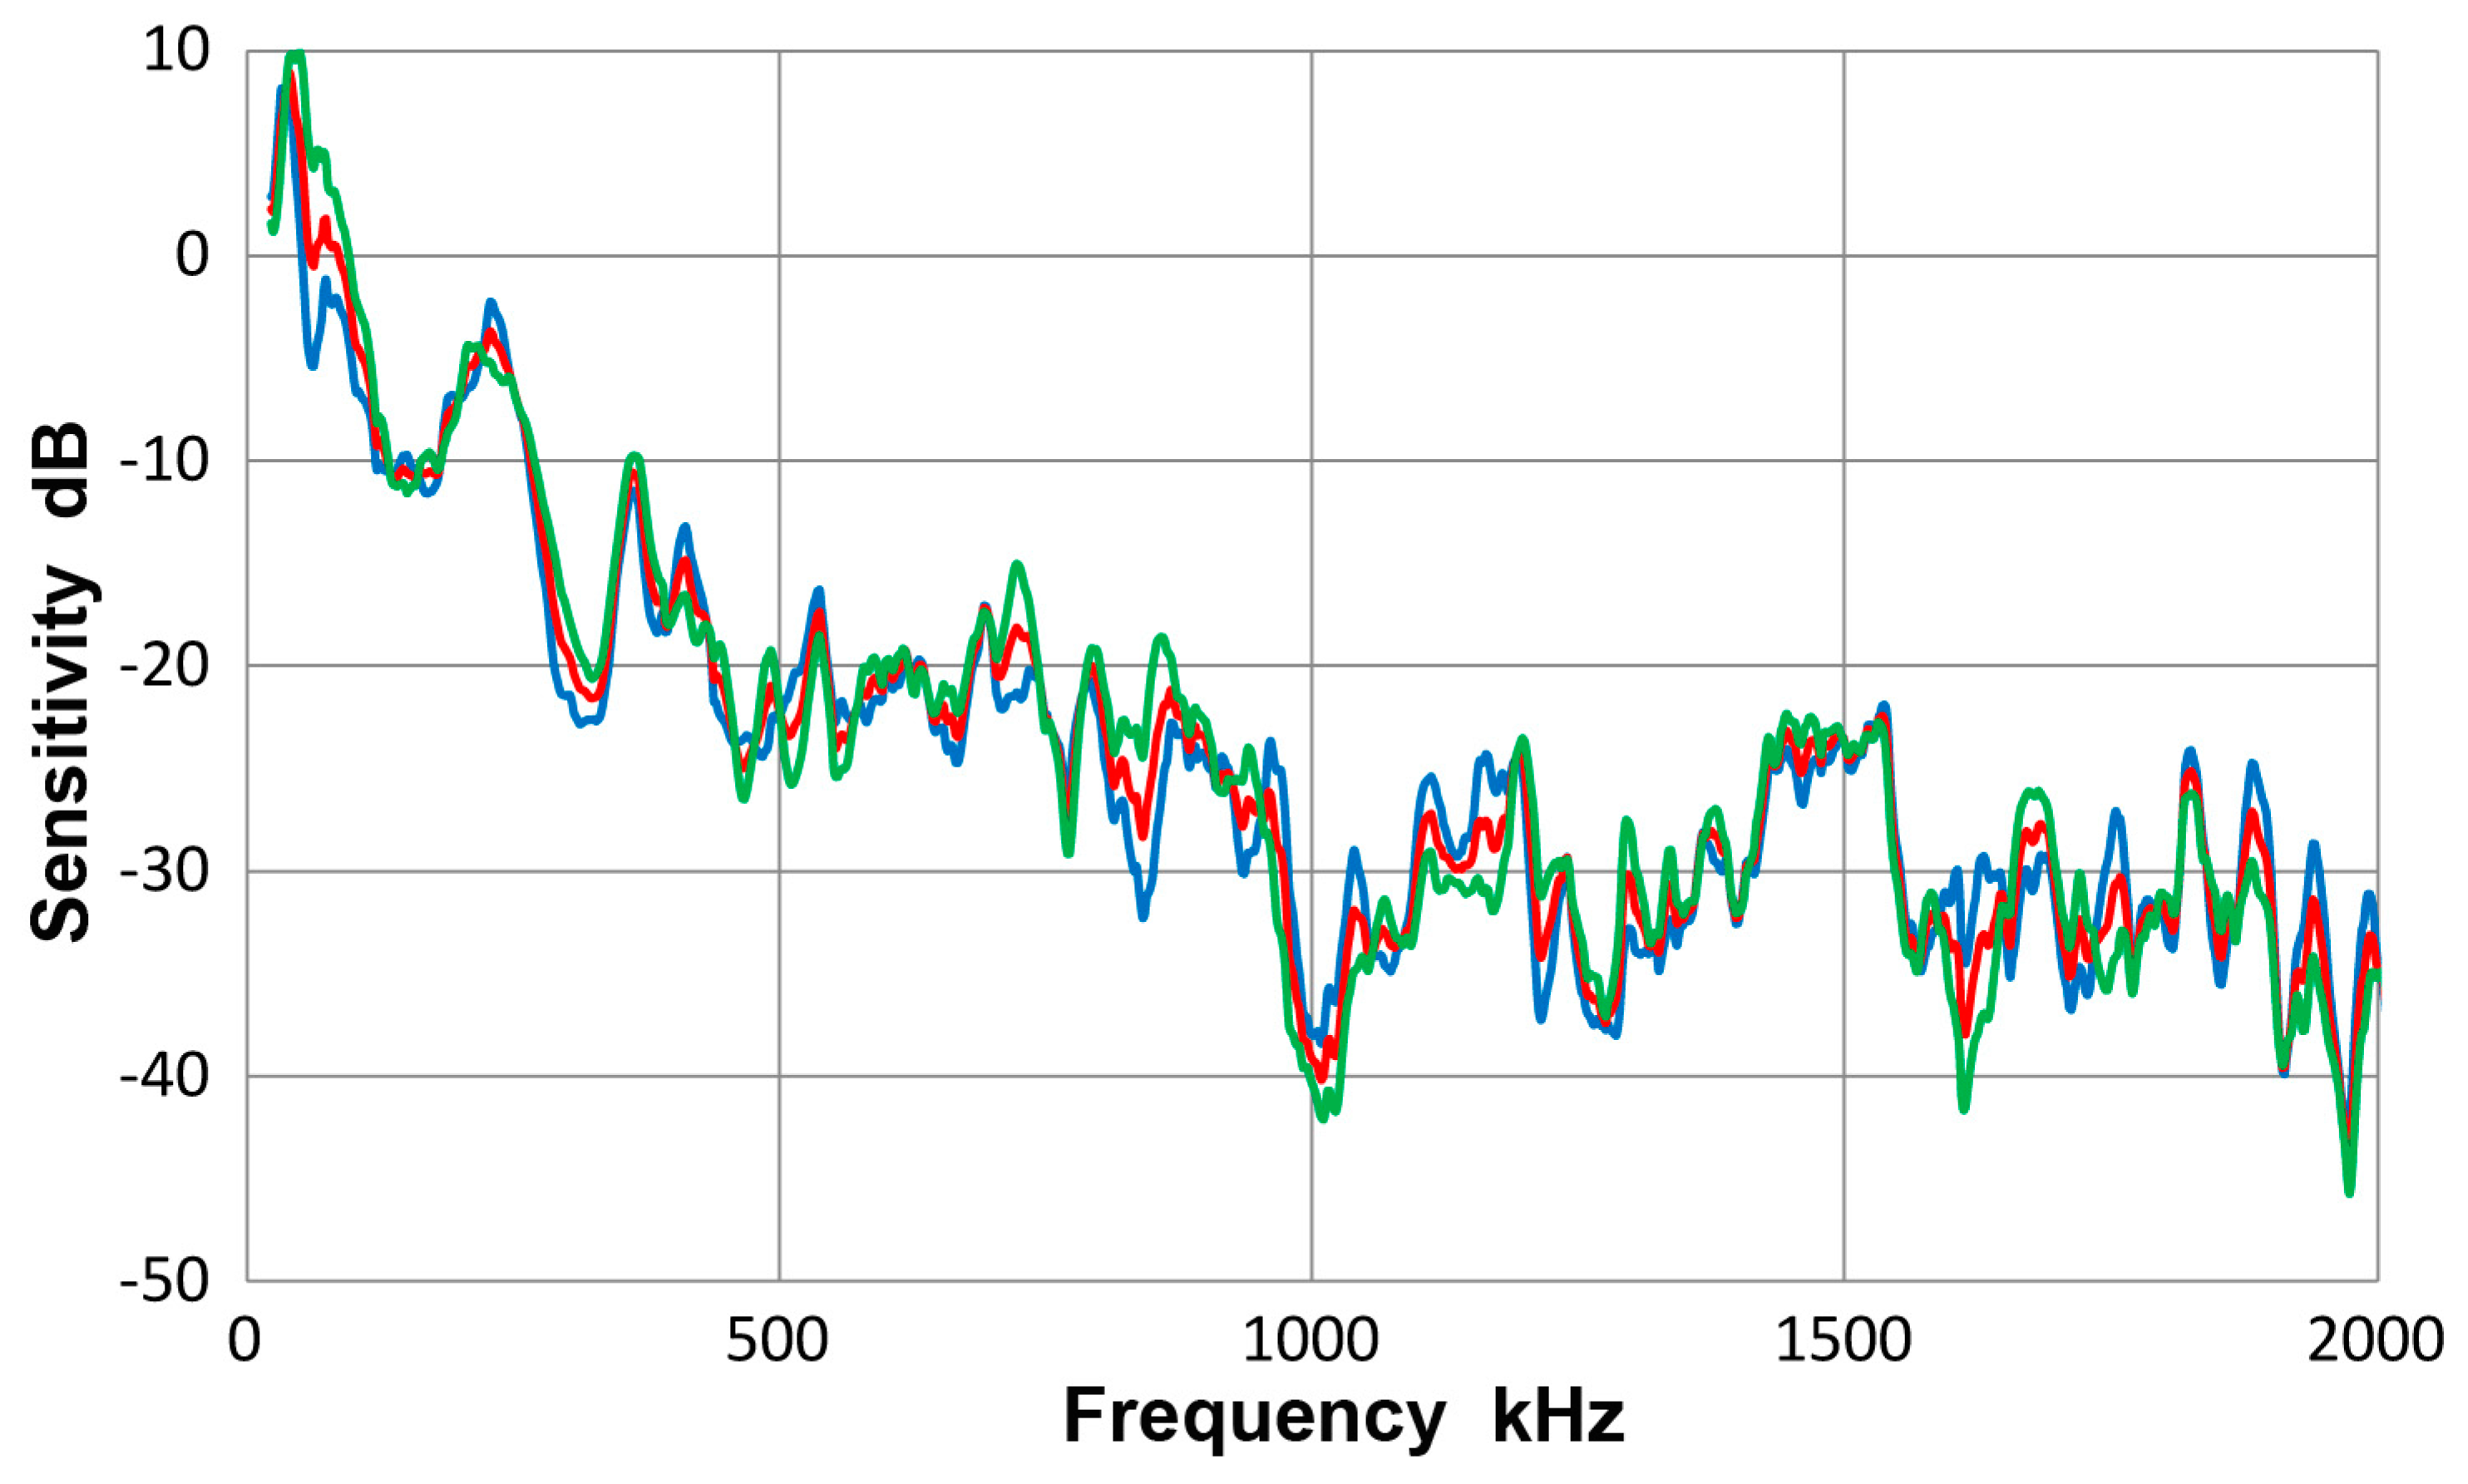
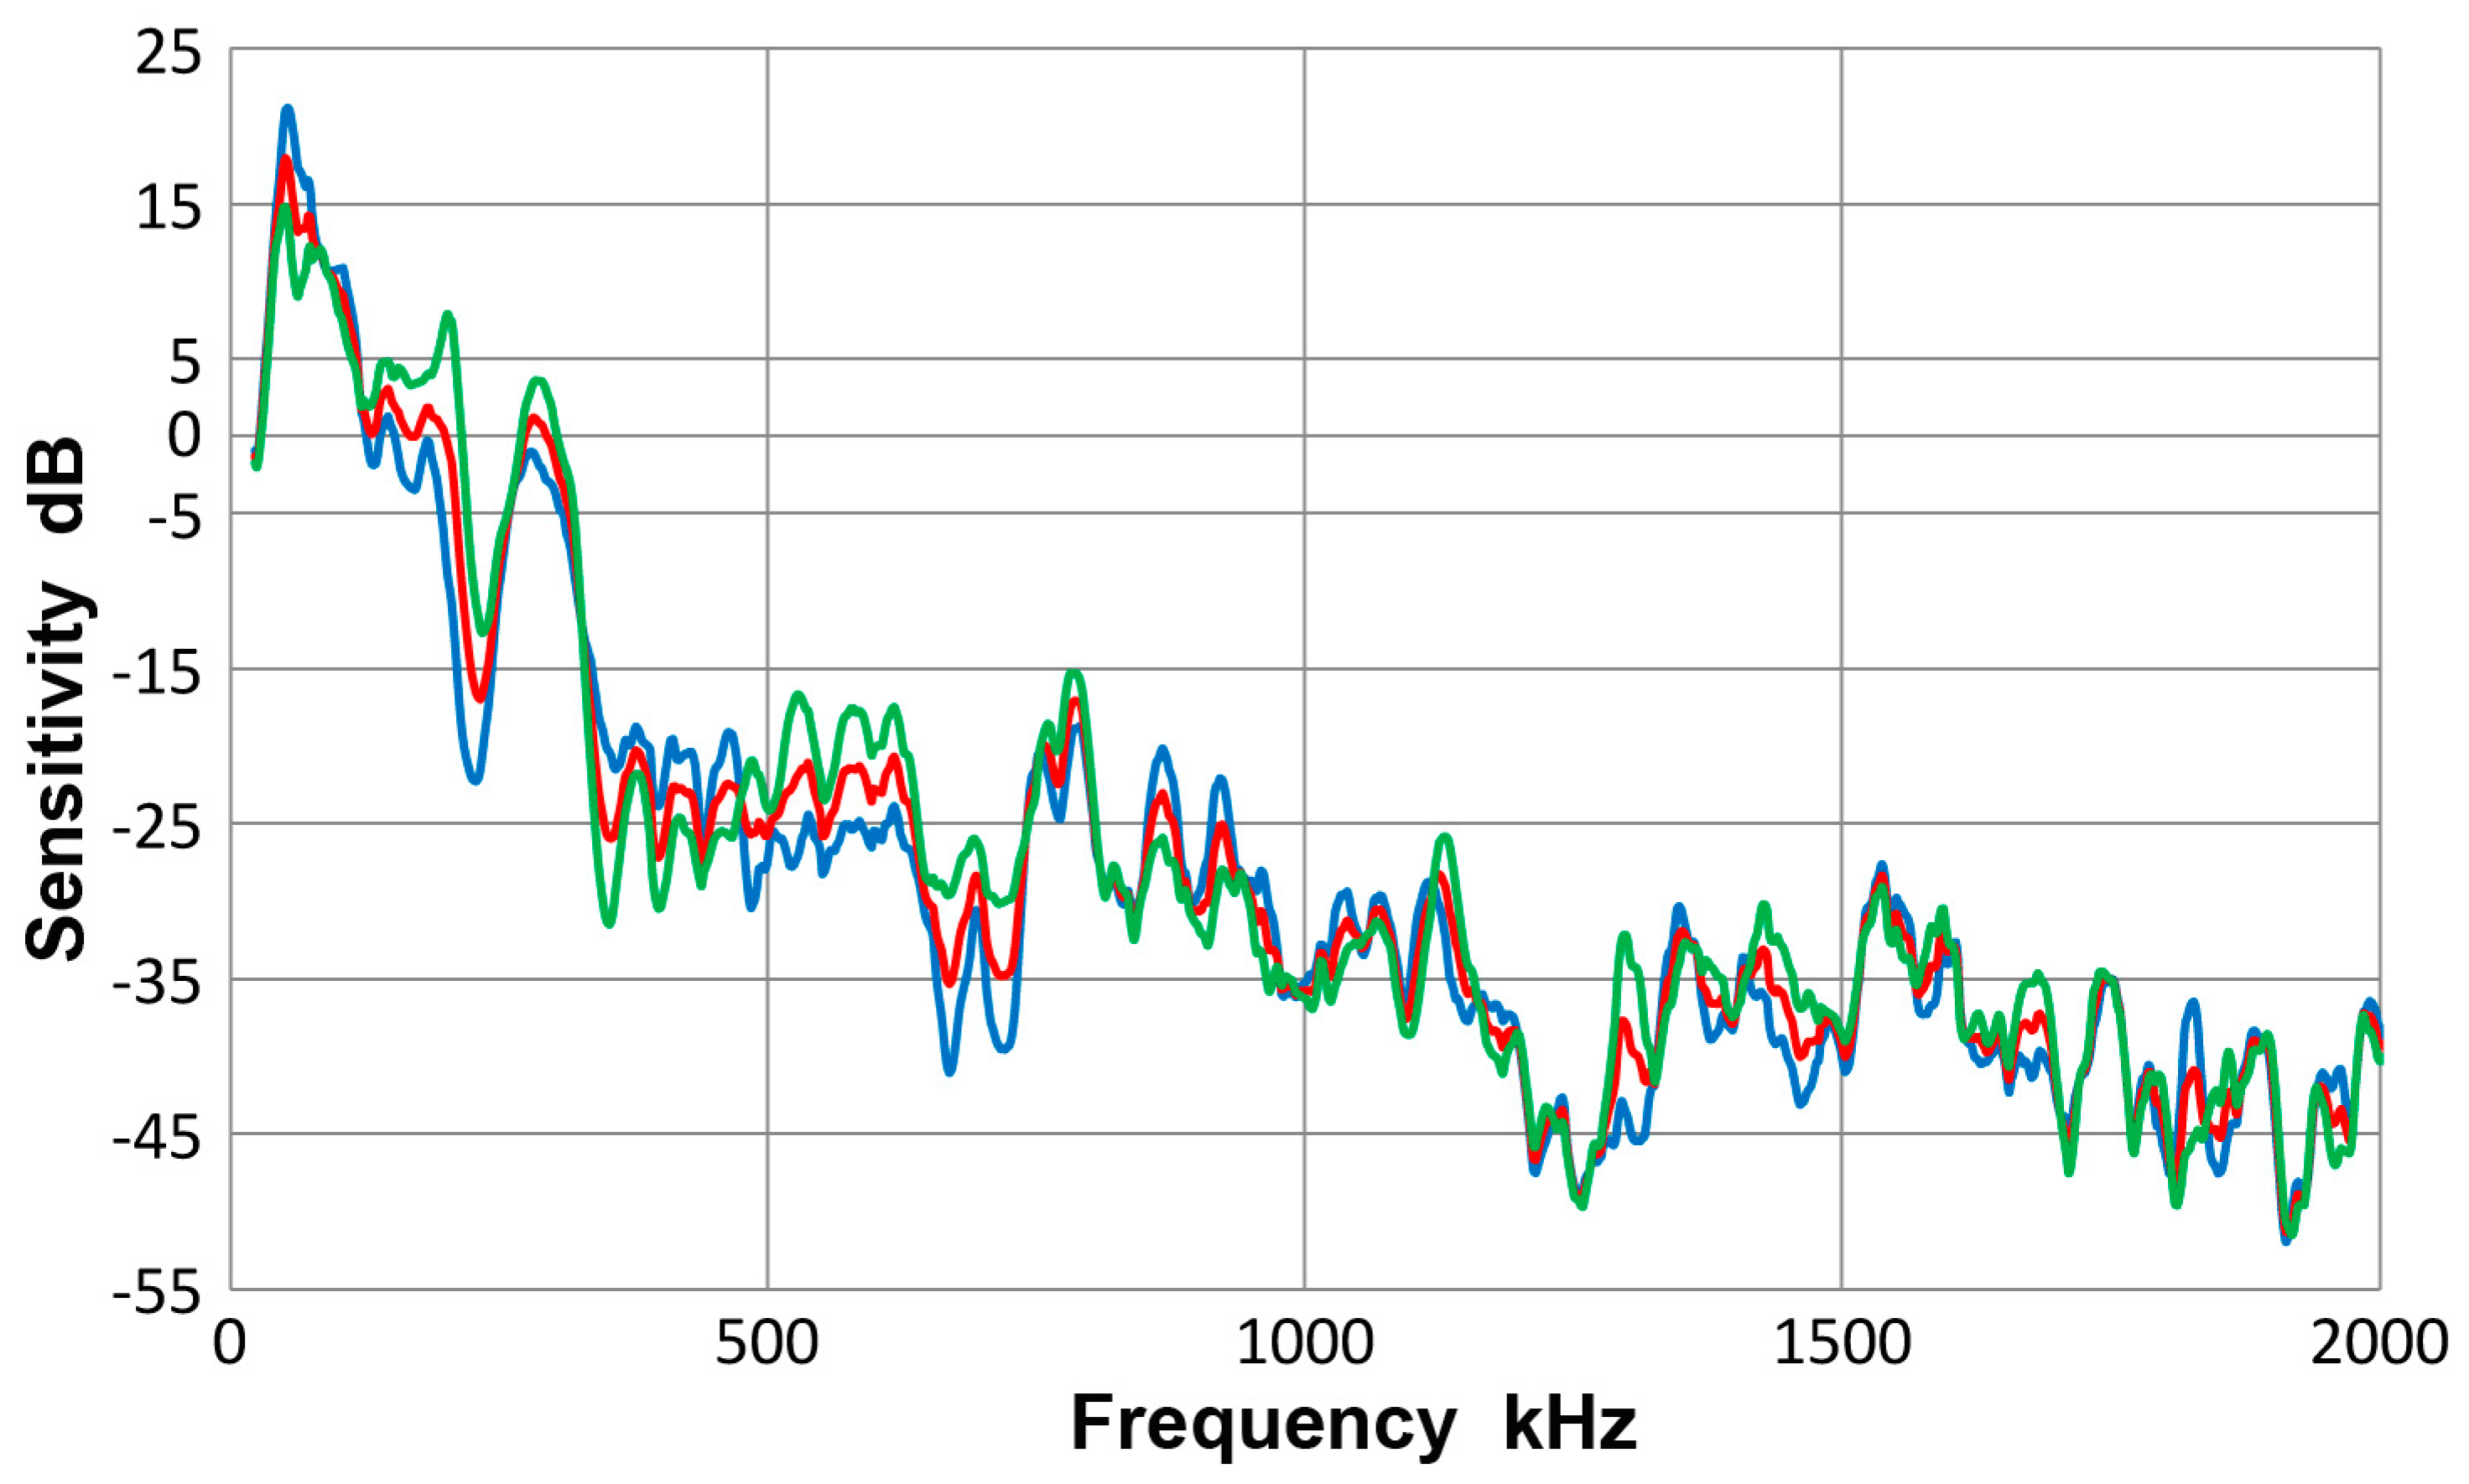
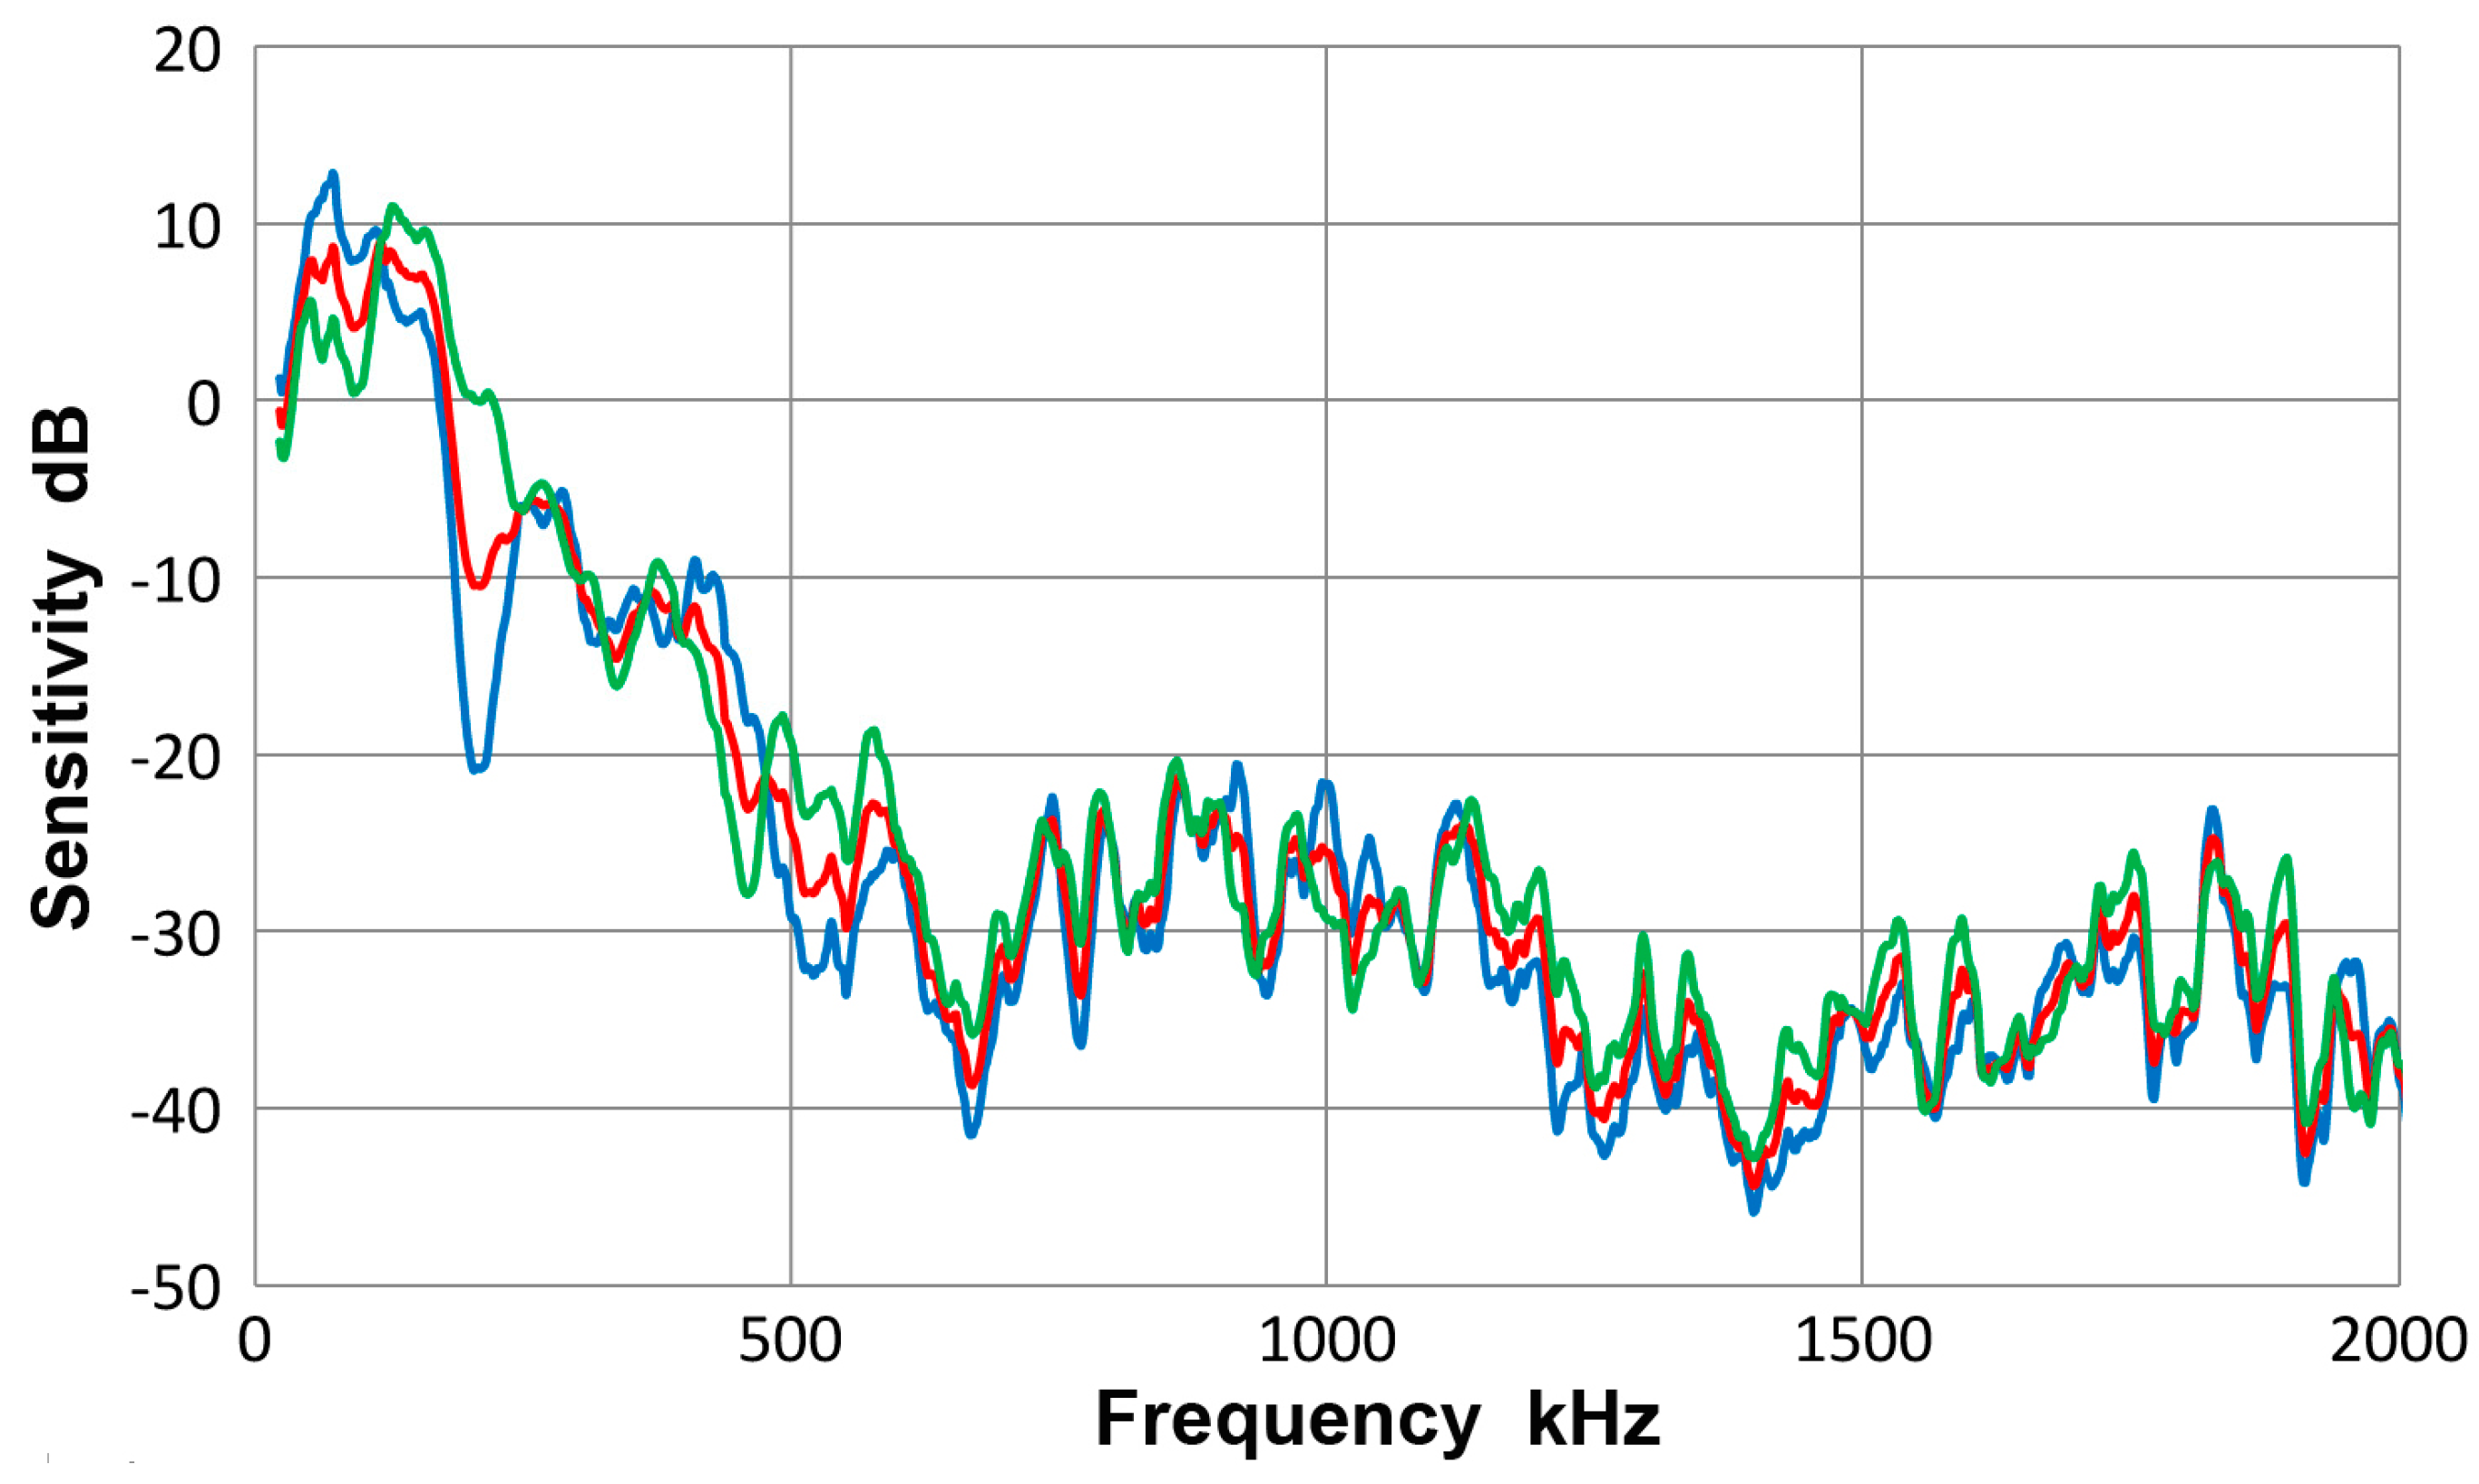
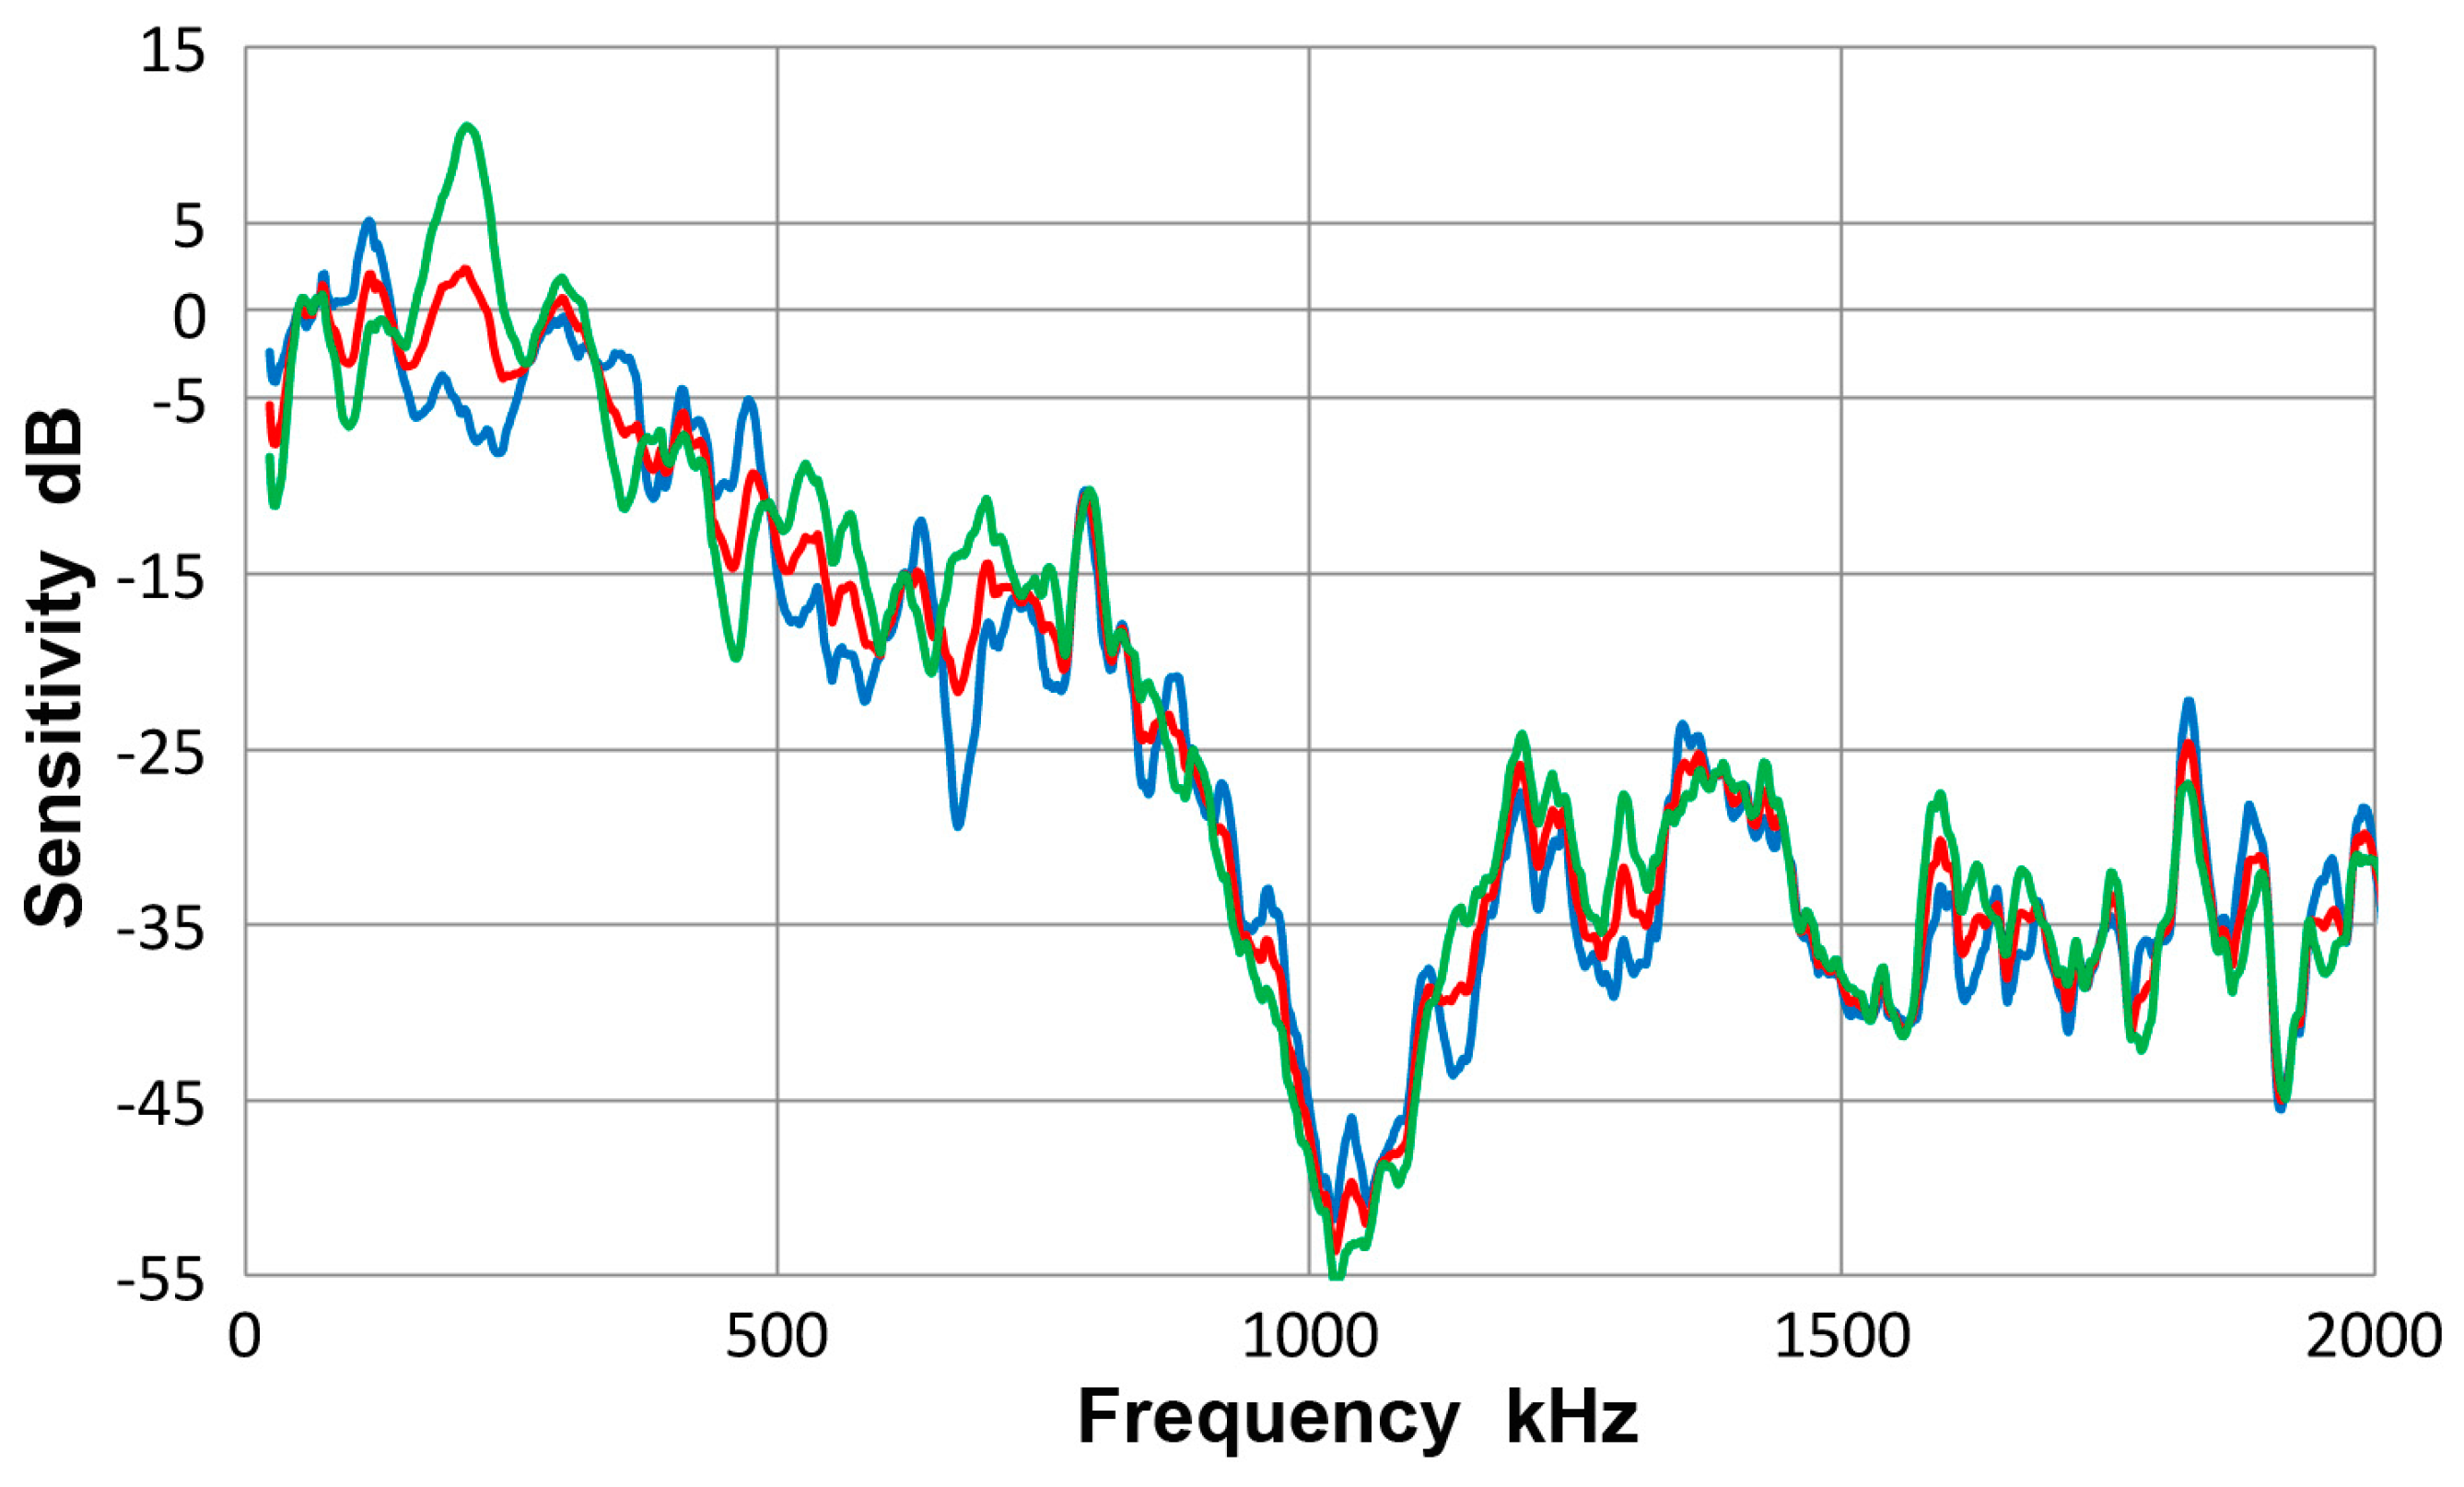
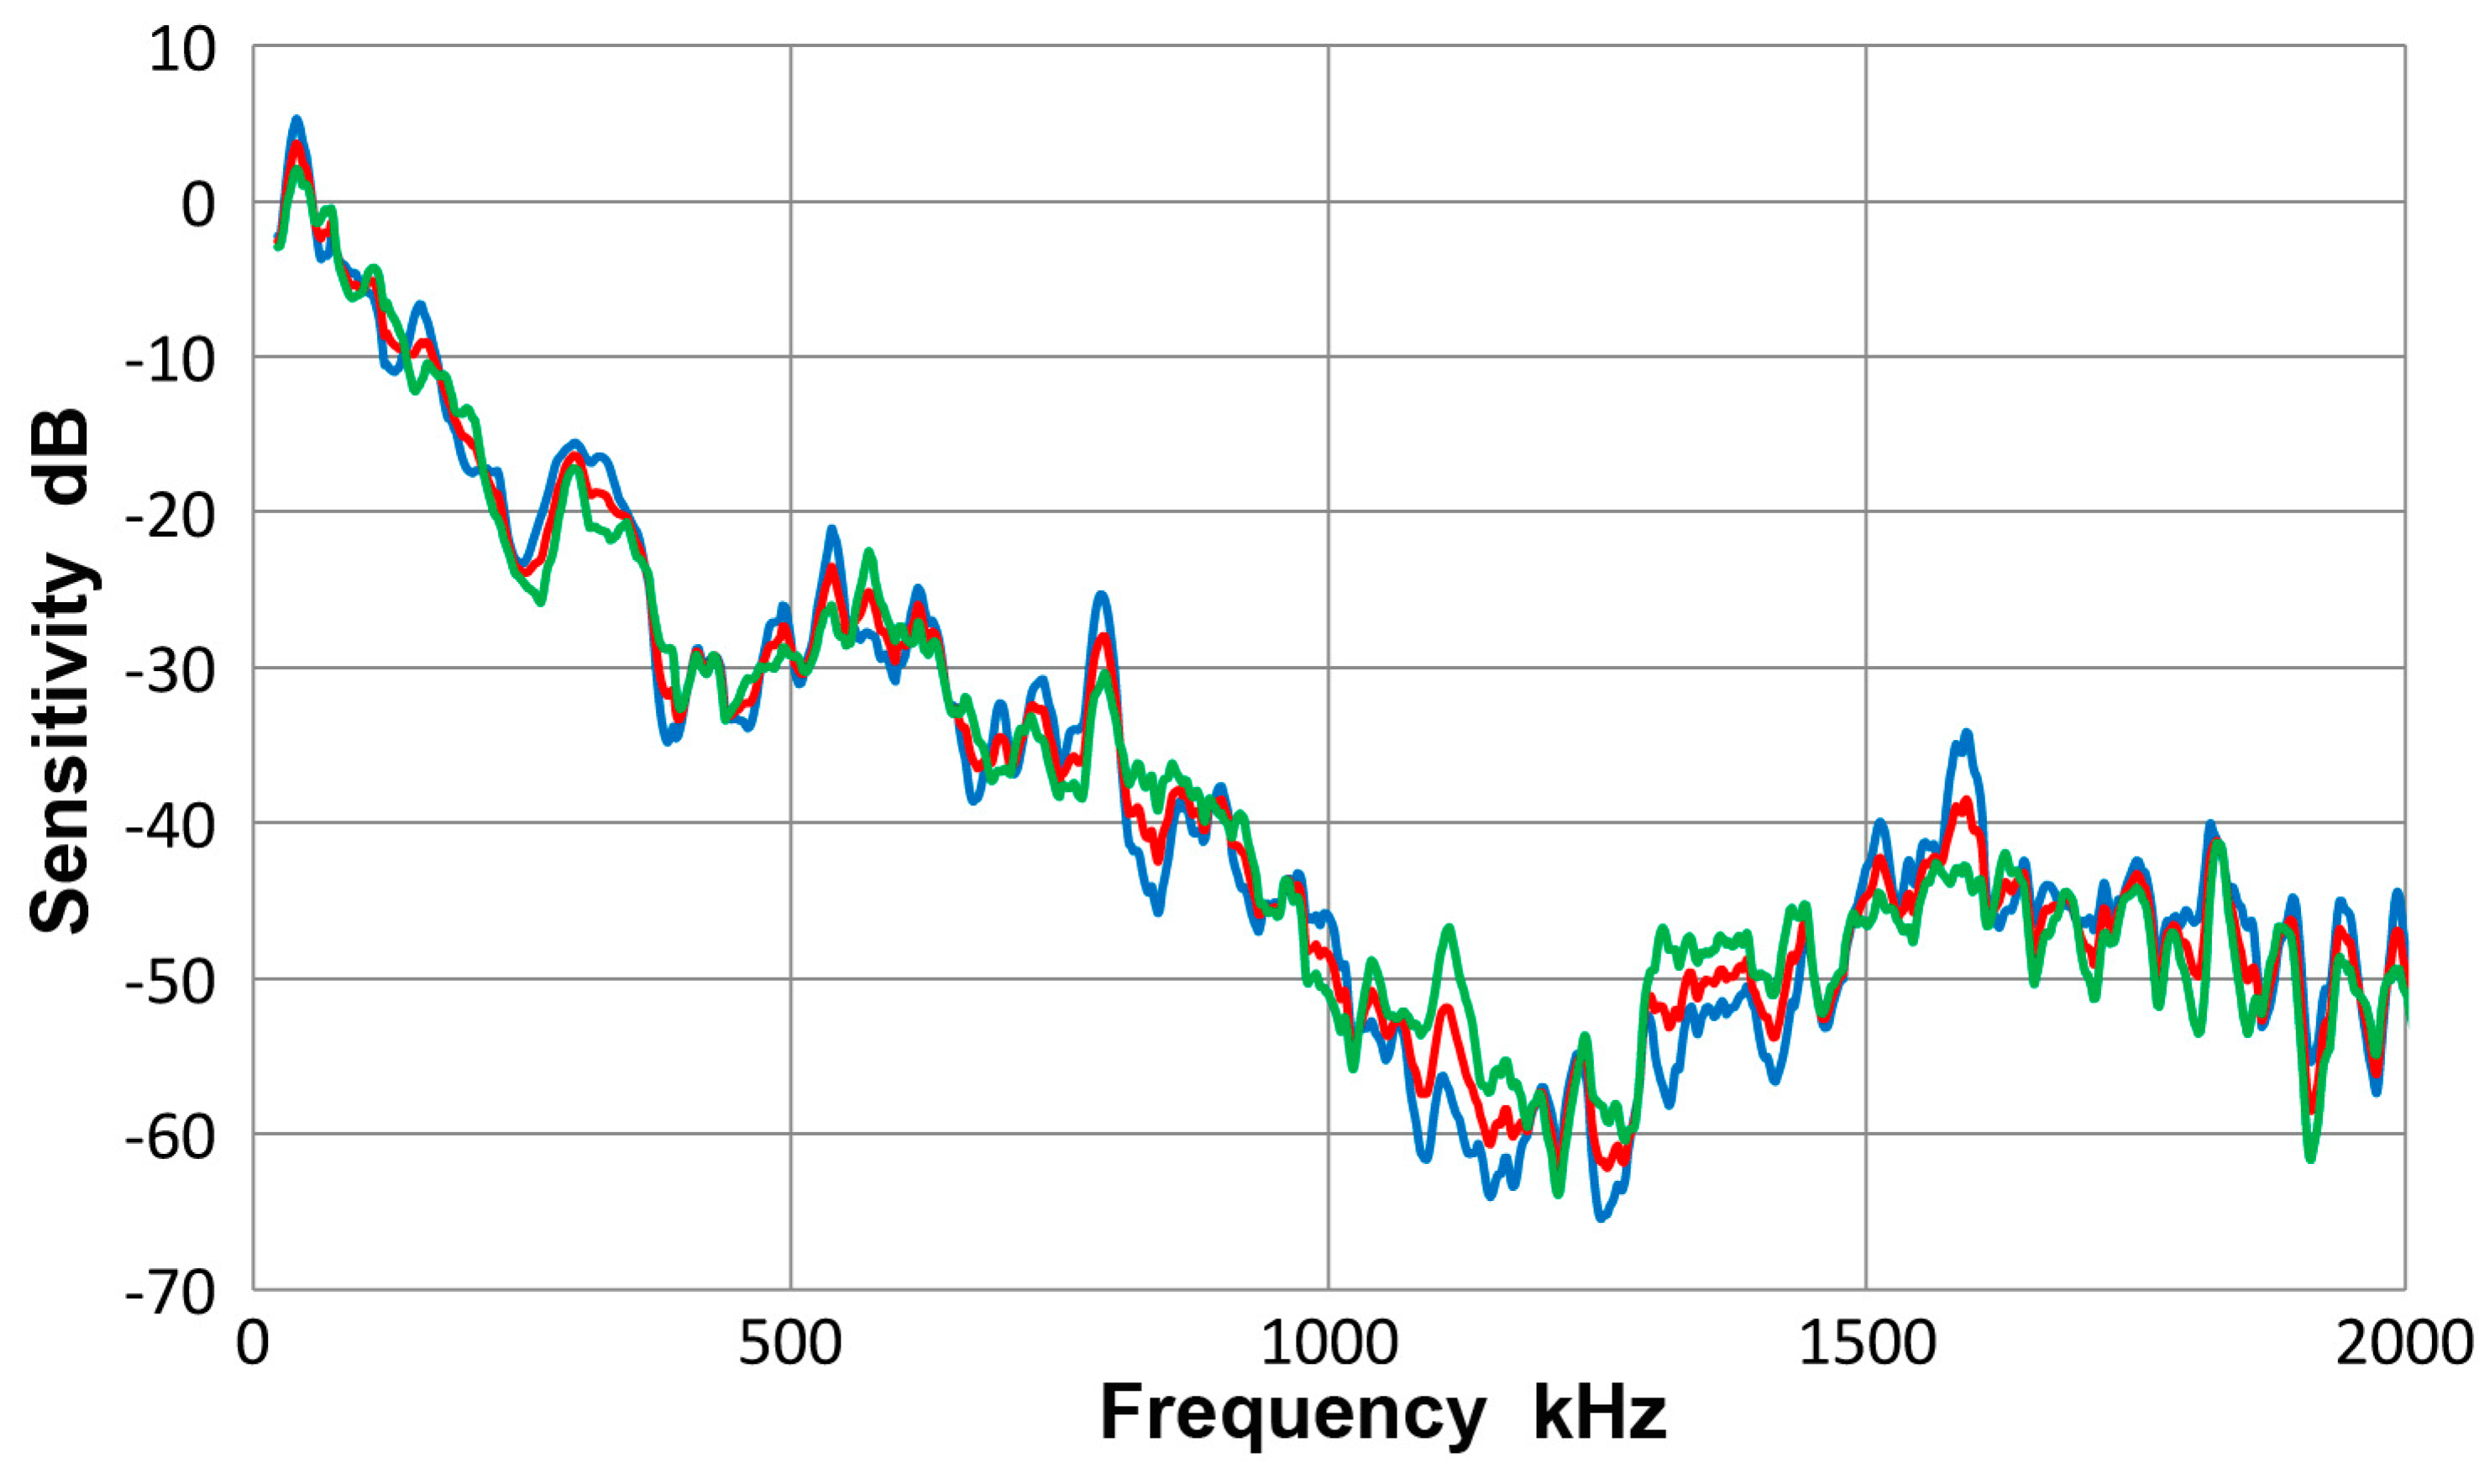
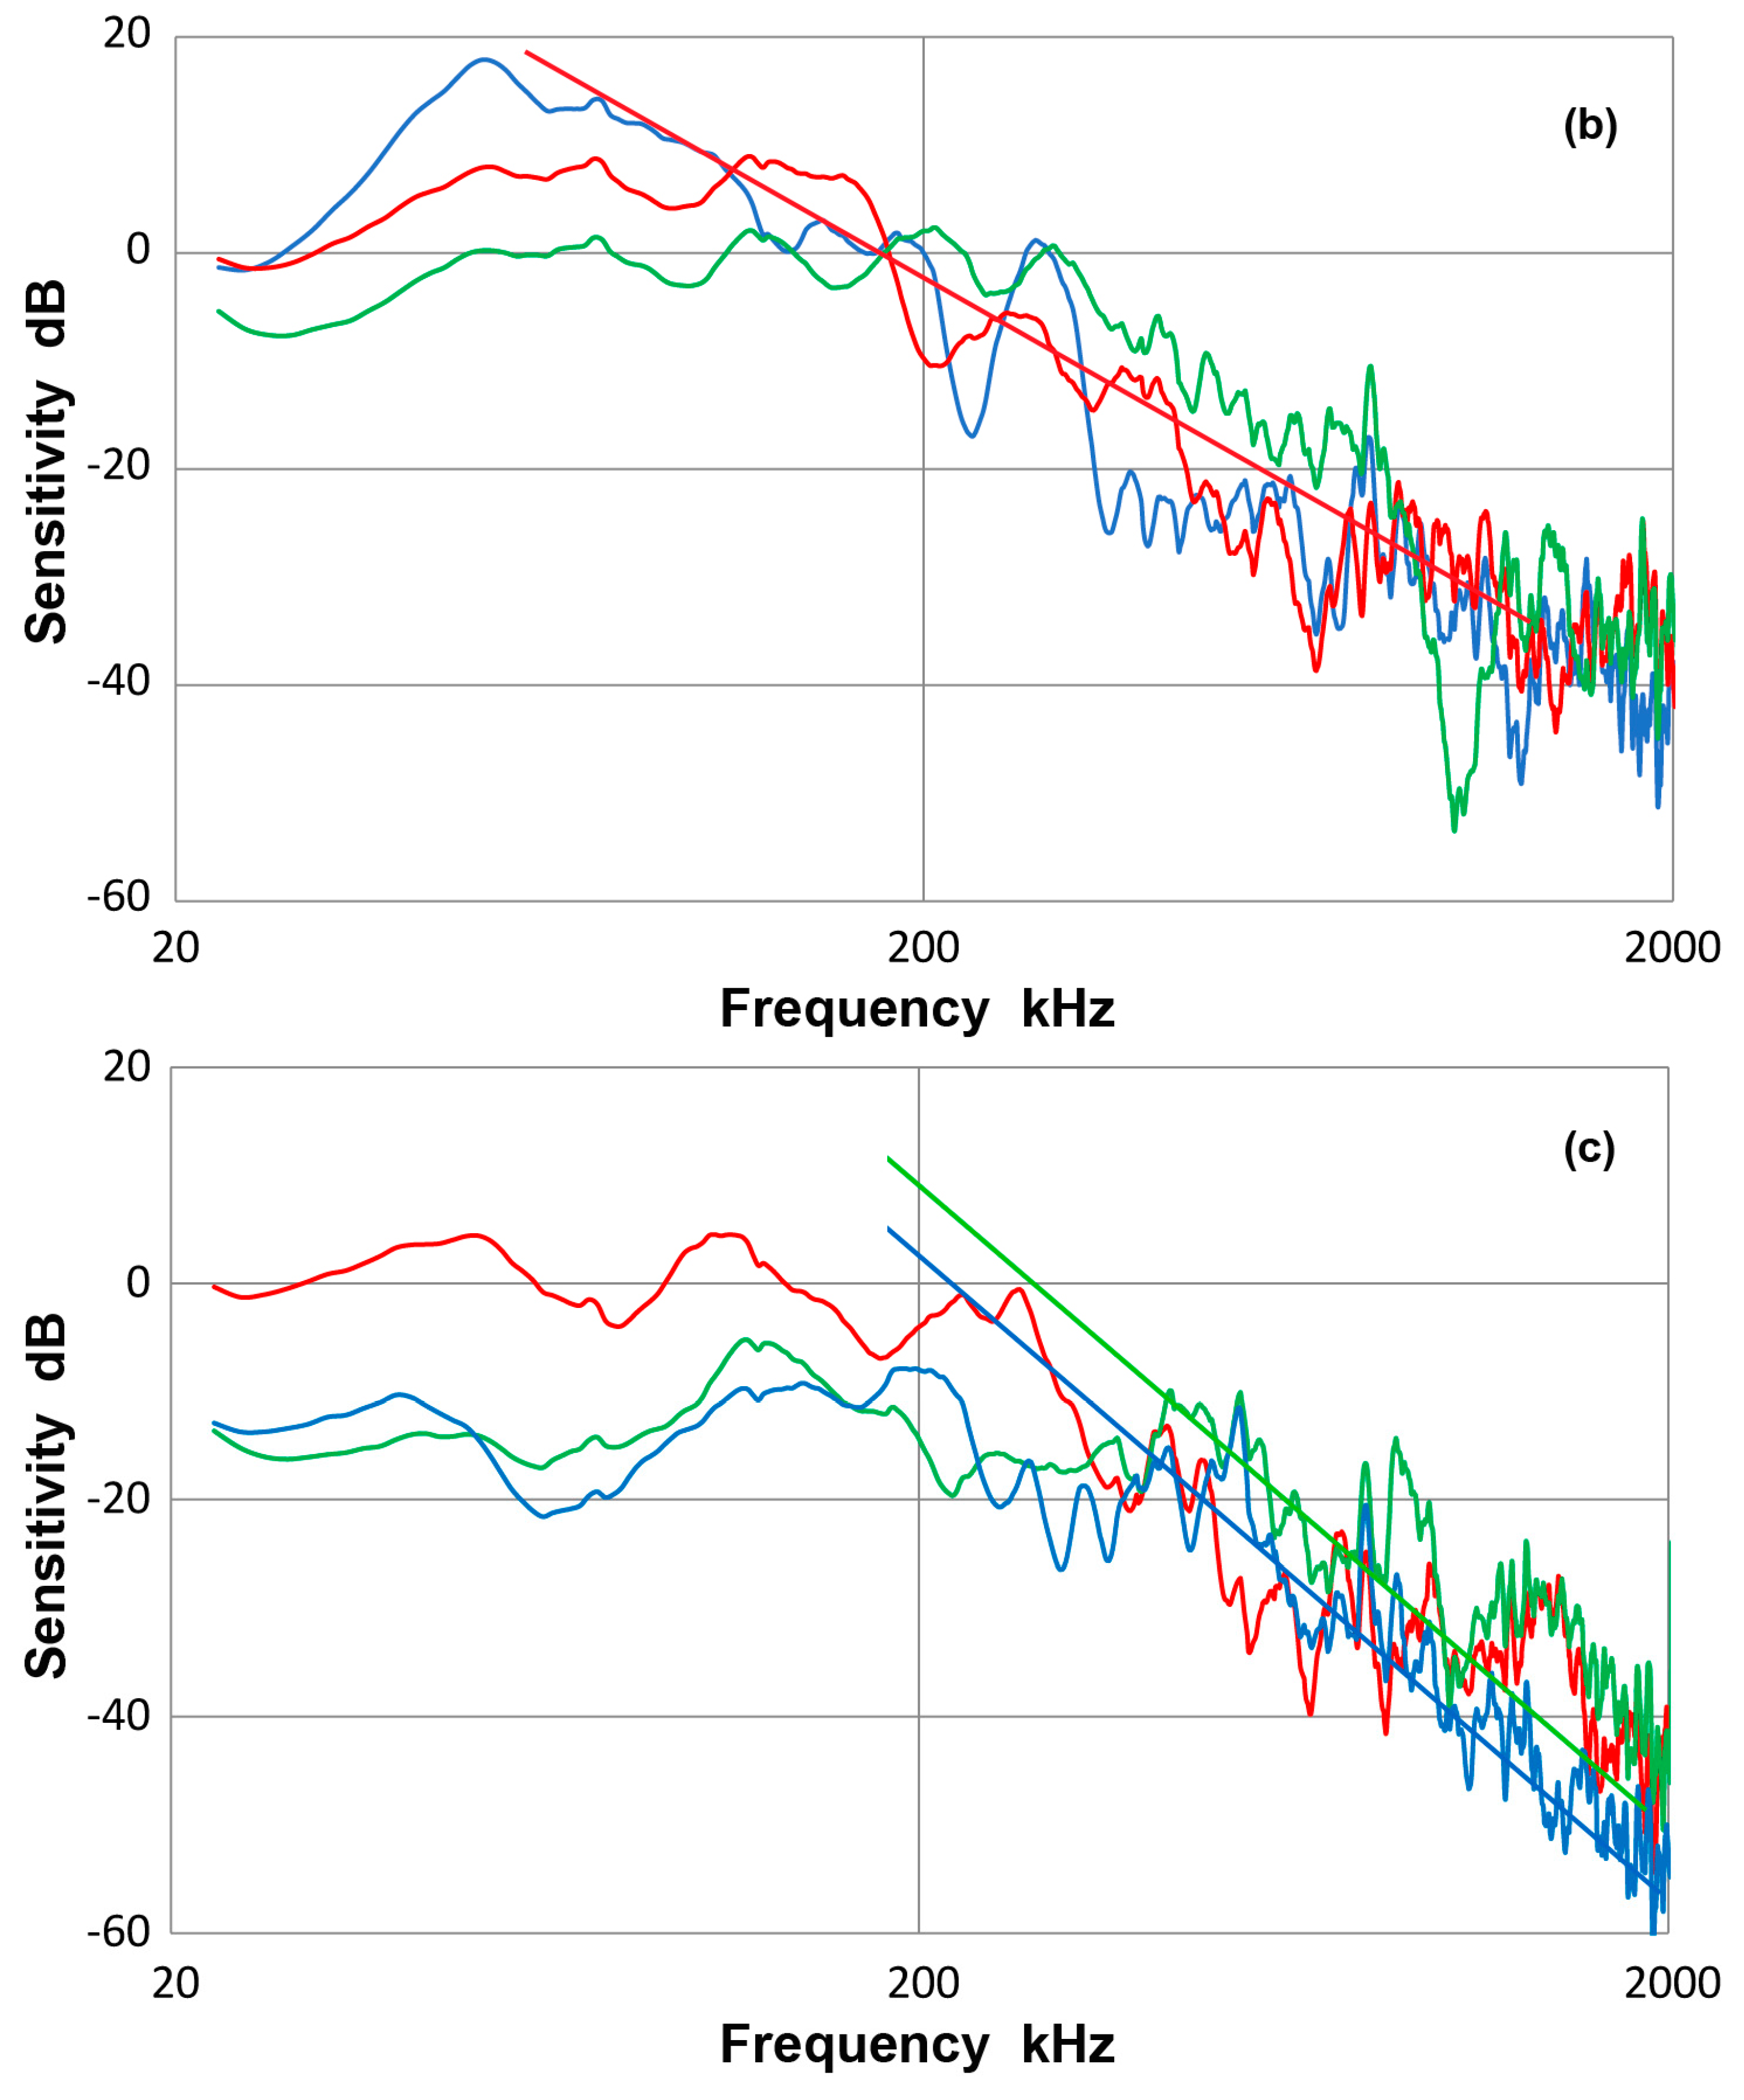
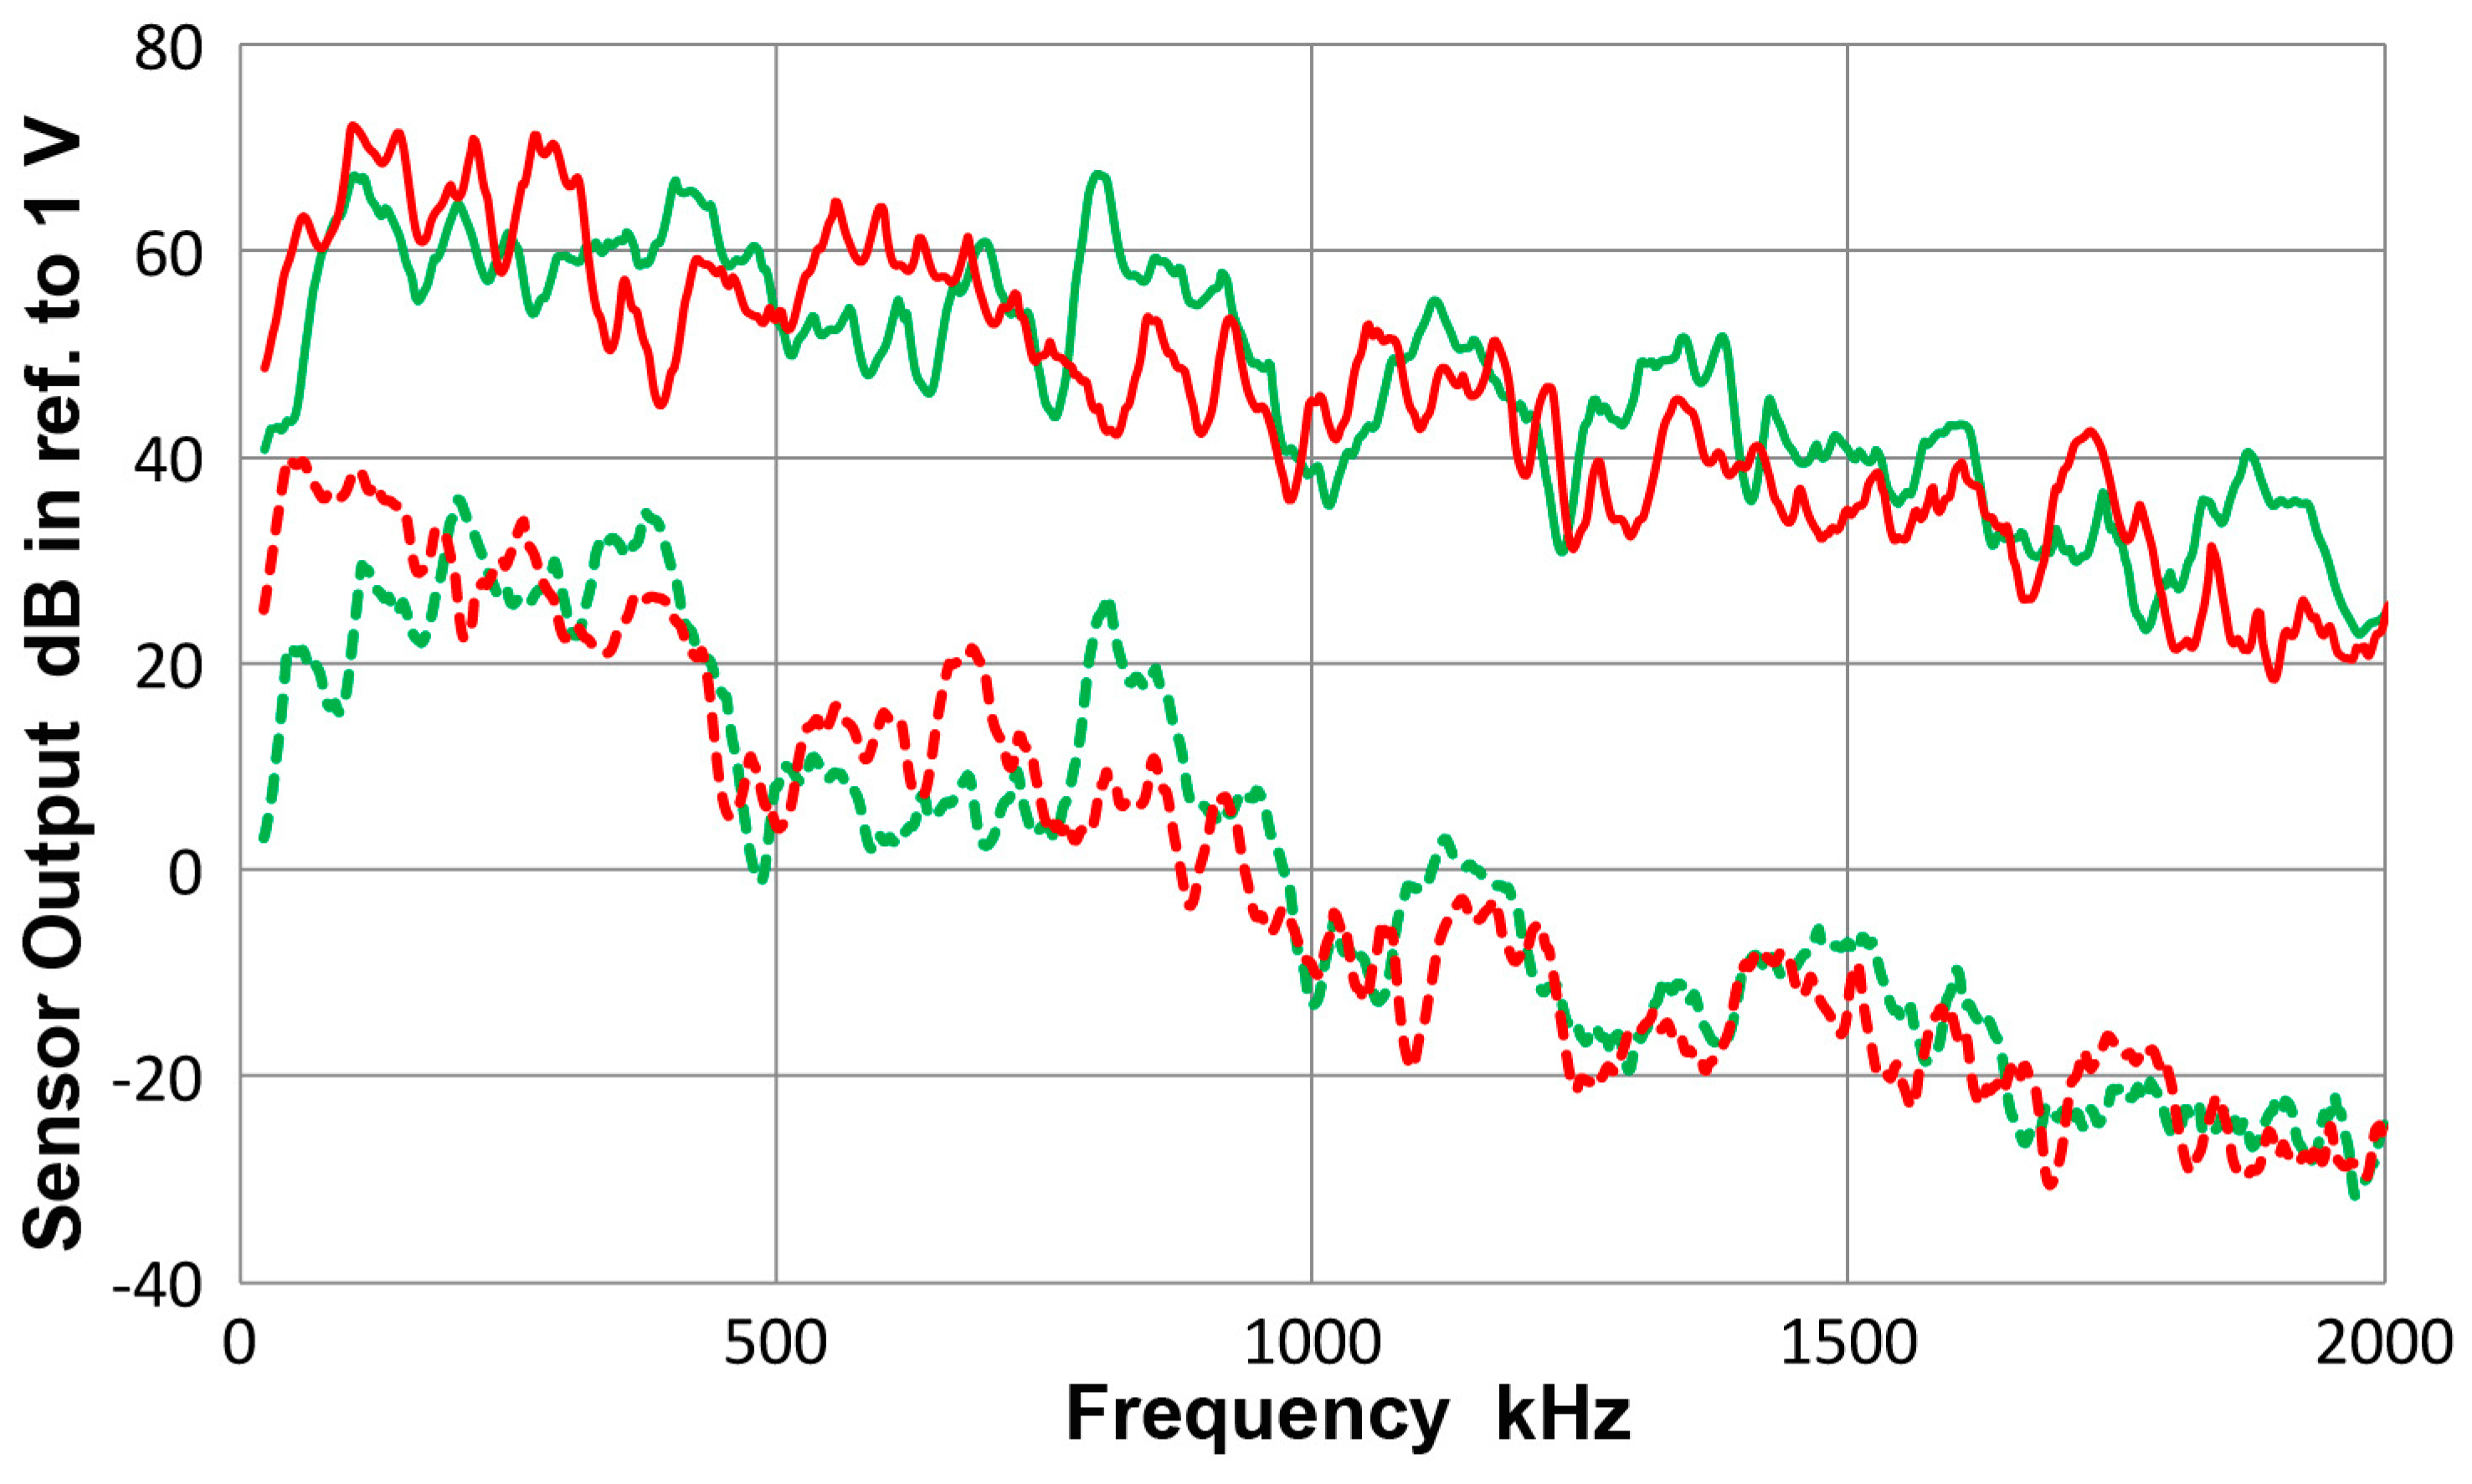
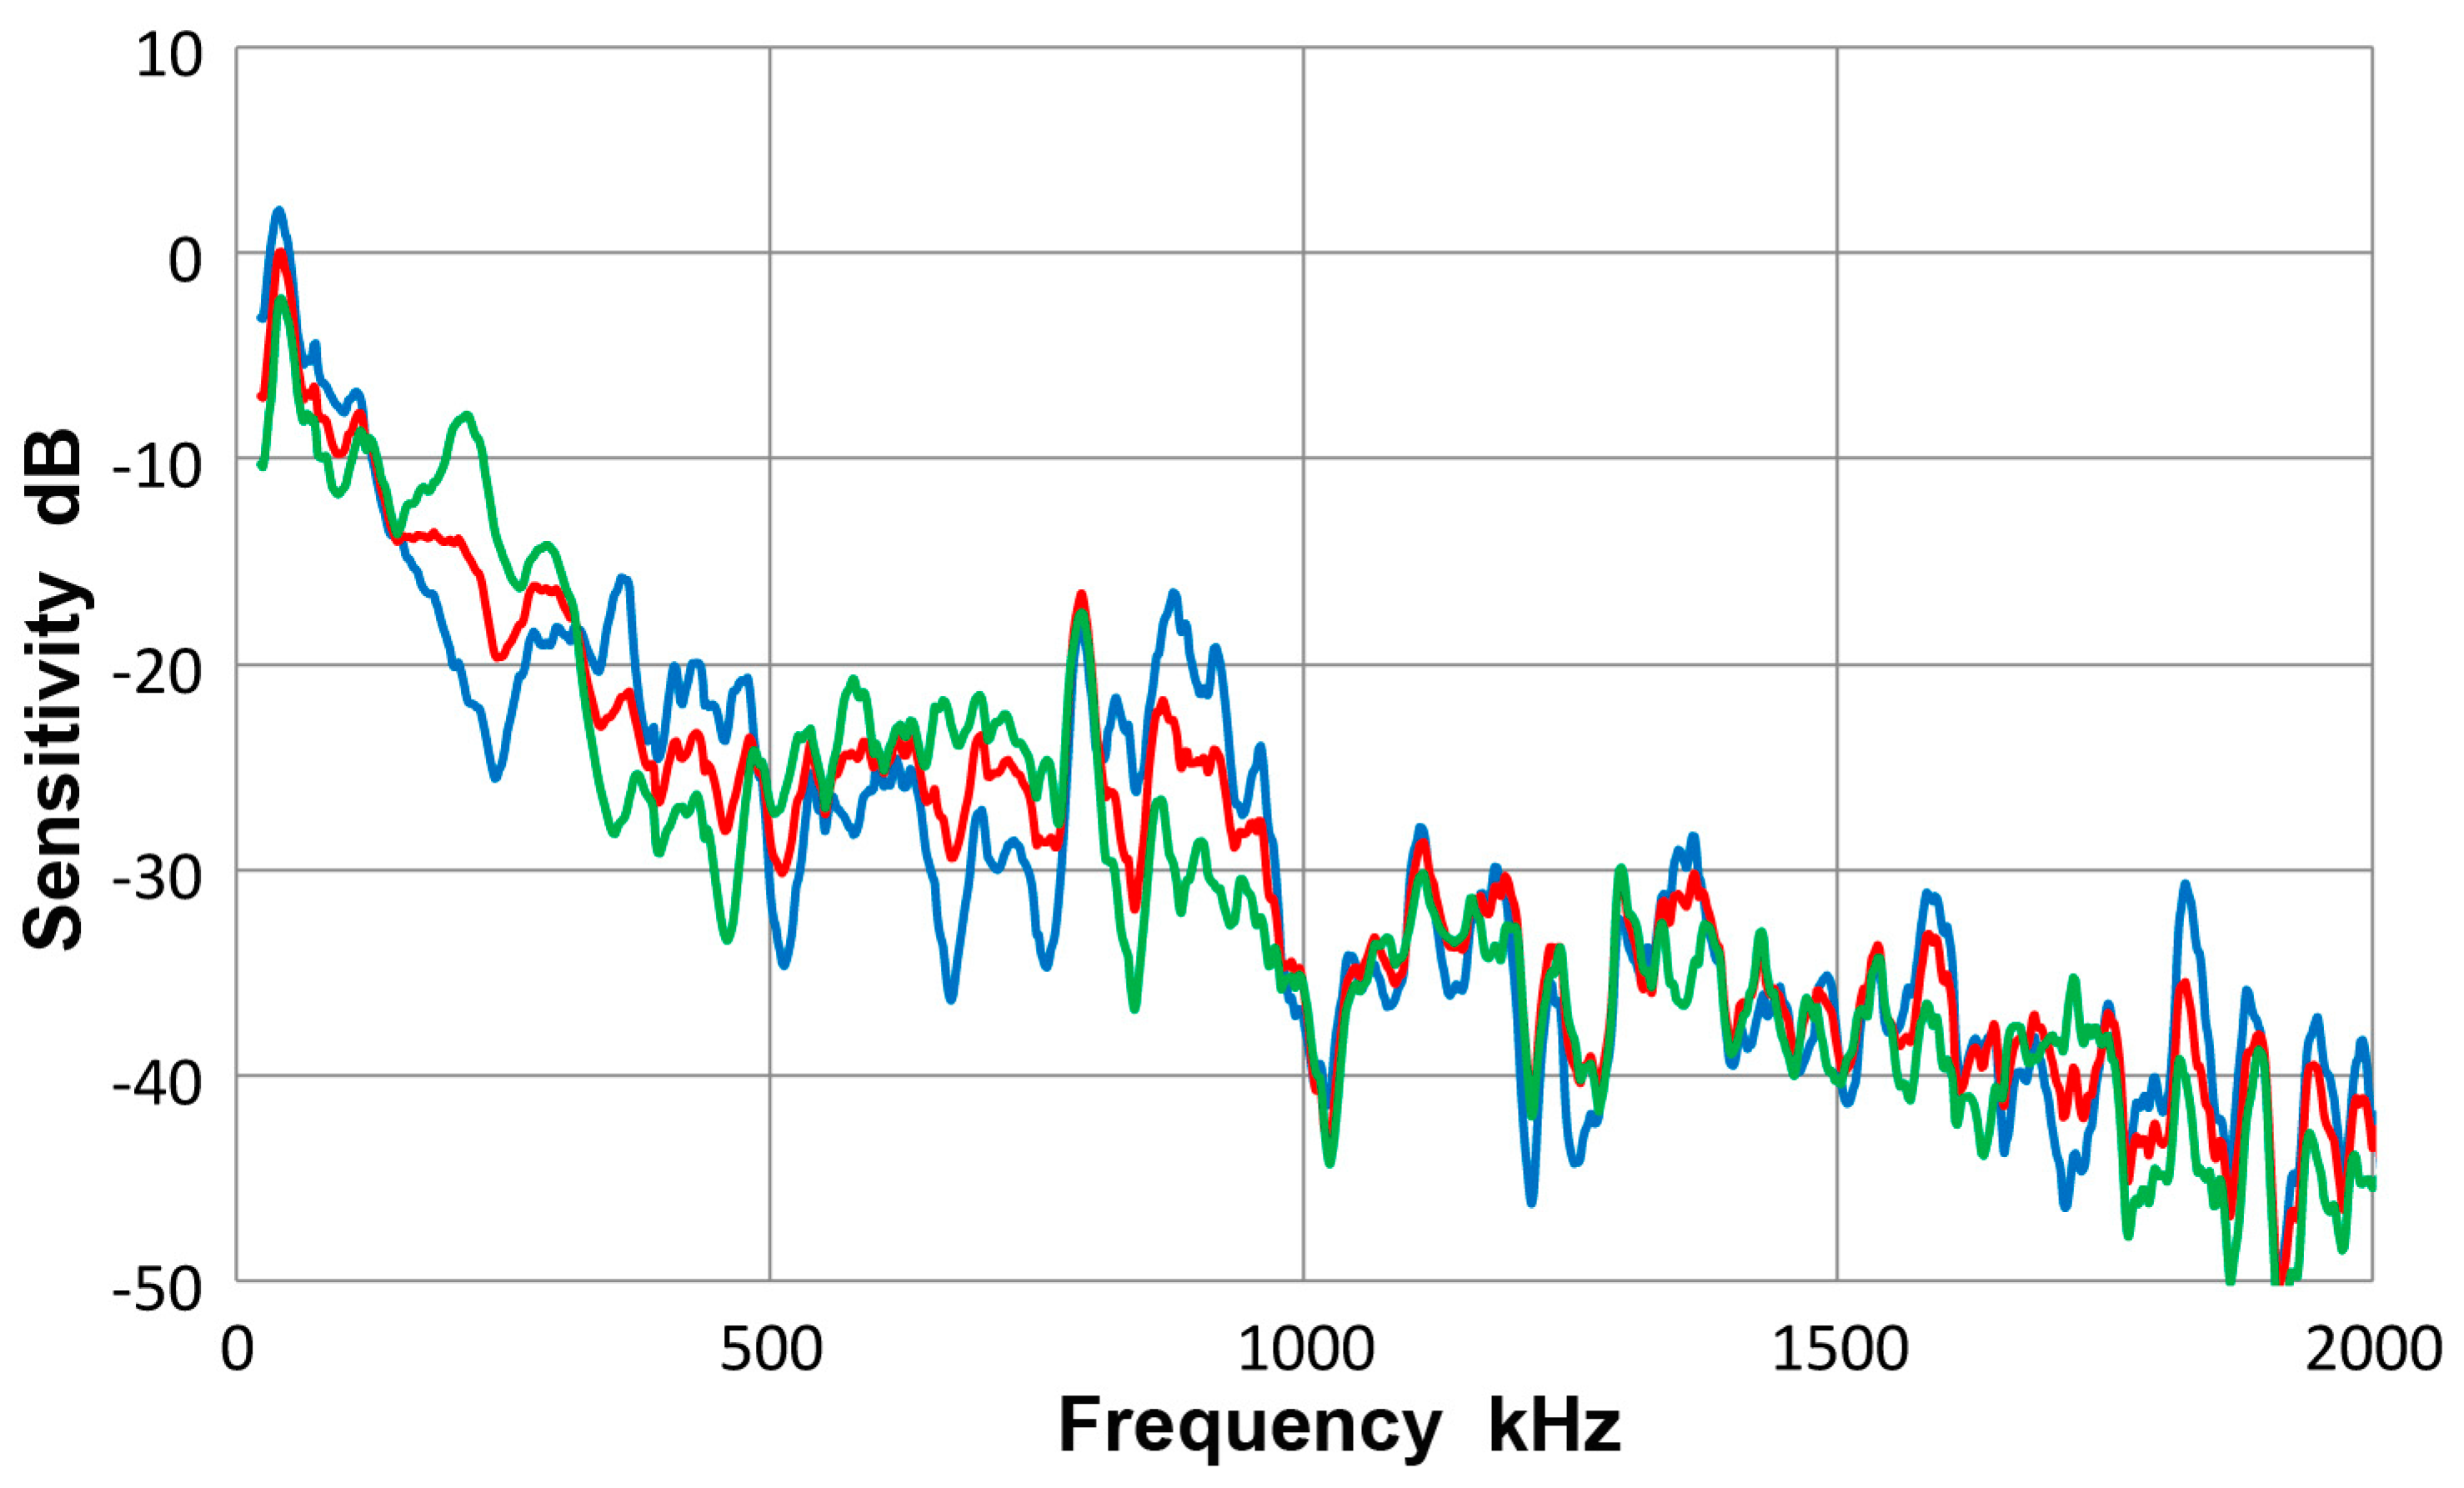
- The guided-wave receiving sensitivities showed a single intense peak or multiple intense peaks at low frequencies, typically below 300 kHz. The sensitivities always decreased with increasing frequencies. When the sensing element size is small (e.g., Pico, HD50 and S9220), or with multiple element construction (WD), a few more higher frequency peaks were observed in addition at around 0.5 and/or 0.8 MHz. In one case (F30a), three peaks appeared below 0.3 MHz, providing a broader frequency response.
3.12. Frequency Dependence of Receiving Sensitivity
3.13. Asymmetric Excitation
3.14. Thickness Effects
3.15. Recommendations
- (a)
- When one requires calibration in absolute units, use a laser interferometer and obtain the displacement spectrum on a long bar (>1 m length and a thickness-to-width ratio of 1:4 recommended), mounting longitudinal and shear wave transmitters on both ends for generating symmetric and asymmetric bar waves. Select another bar of different size, also mount longitudinal and shear transmitters on both ends, giving four set-ups. Determine the receiving sensitivities for the four different set-ups and average the results as conducted in the present work. For further improvement, include more thickness values.
- (b)
- For practical standardization of the sensor sensitivity to guided waves, one bar (>1 m length as above) can be used with one longitudinal wave transmitter on one end, obtaining a displacement (or velocity) output spectrum with a laser interferometer (or vibrometer) at a designated sensing position. A calibration spectrum is supplied in terms of excitation voltage-referenced displacement (or velocity). A recent work [29] showed that nearly identical sensitivity results were obtained from using a single-point laser interferometry and an averaged scanning laser vibrometry (for NIW). Thus, it is likely that the choice of laser instruments is not critical. While absolute calibration cannot be made, when the bar size is controlled, a guided wave sensitivity is obtained and can be compared among similarly calibrated sensors. This allows repeatable field measurements of sensor sensitivity to guided waves.
- (c)
- When only performance validation is required, skip the laser measurement, use one bar, still use both symmetric and asymmetric bar waves, obtain a reference sensor with known guided-wave sensitivity and get relative performance of sensor-under-test by comparing to the reference.
- (d)
- In guided-wave sensing, one must realize that useable frequency range is severely limited for typical AE sensors and ultrasonic transducers. Reducing the size helps, but the sensitivity is reduced. Newer composite-element sensor designs are needed to increase the performance at higher frequency.
4. Conclusions
- (a)
- The characteristics of piezoelectric detectors, or ultrasonic transducers and acoustic emission sensors, for quantifying the wave motion of guided ultrasonic waves, have been evaluated systematically. This study relied on laser interferometry for the base displacement measurement of bar waves, and determined surface displacements of eight different guided-wave test set-ups. These were used to obtain guided-wave receiving sensitivities of 12 ultrasonic transducers and AE sensors. Both plates and bars of 12.7 and 6.4 mm thickness were used as wave propagation media. These were excited with pulse-driven ultrasonic transmitters in symmetric and asymmetric manner. The upper frequency limit was 2 MHz.
- (b)
- Generally, the receiving sensitivities showed rapidly dropping response with increasing frequency due to waveform cancellation on their sensing areas. This effect contributed to vastly different sensitivities to guided waves and to normally incident waves.
- (c)
- The guided-wave receiving sensitivities showed a single intense peak or multiple intense peaks at low frequencies, typically below 300 kHz. The sensitivities always decreased with increasing frequencies. When the sensing element size is small (e.g., Pico, HD50 and S9220), or with multiple element construction (WD), a few more higher frequency peaks were observed in addition at around 0.5 and/or 0.8 MHz. In one case (F30a), three peaks appeared below 0.3 MHz, providing a broader frequency response.
- (d)
- Various other effects are discussed and recommendations on methods of implementing the approach developed here are provided.
Acknowledgments
Conflicts of Interest
Appendix A
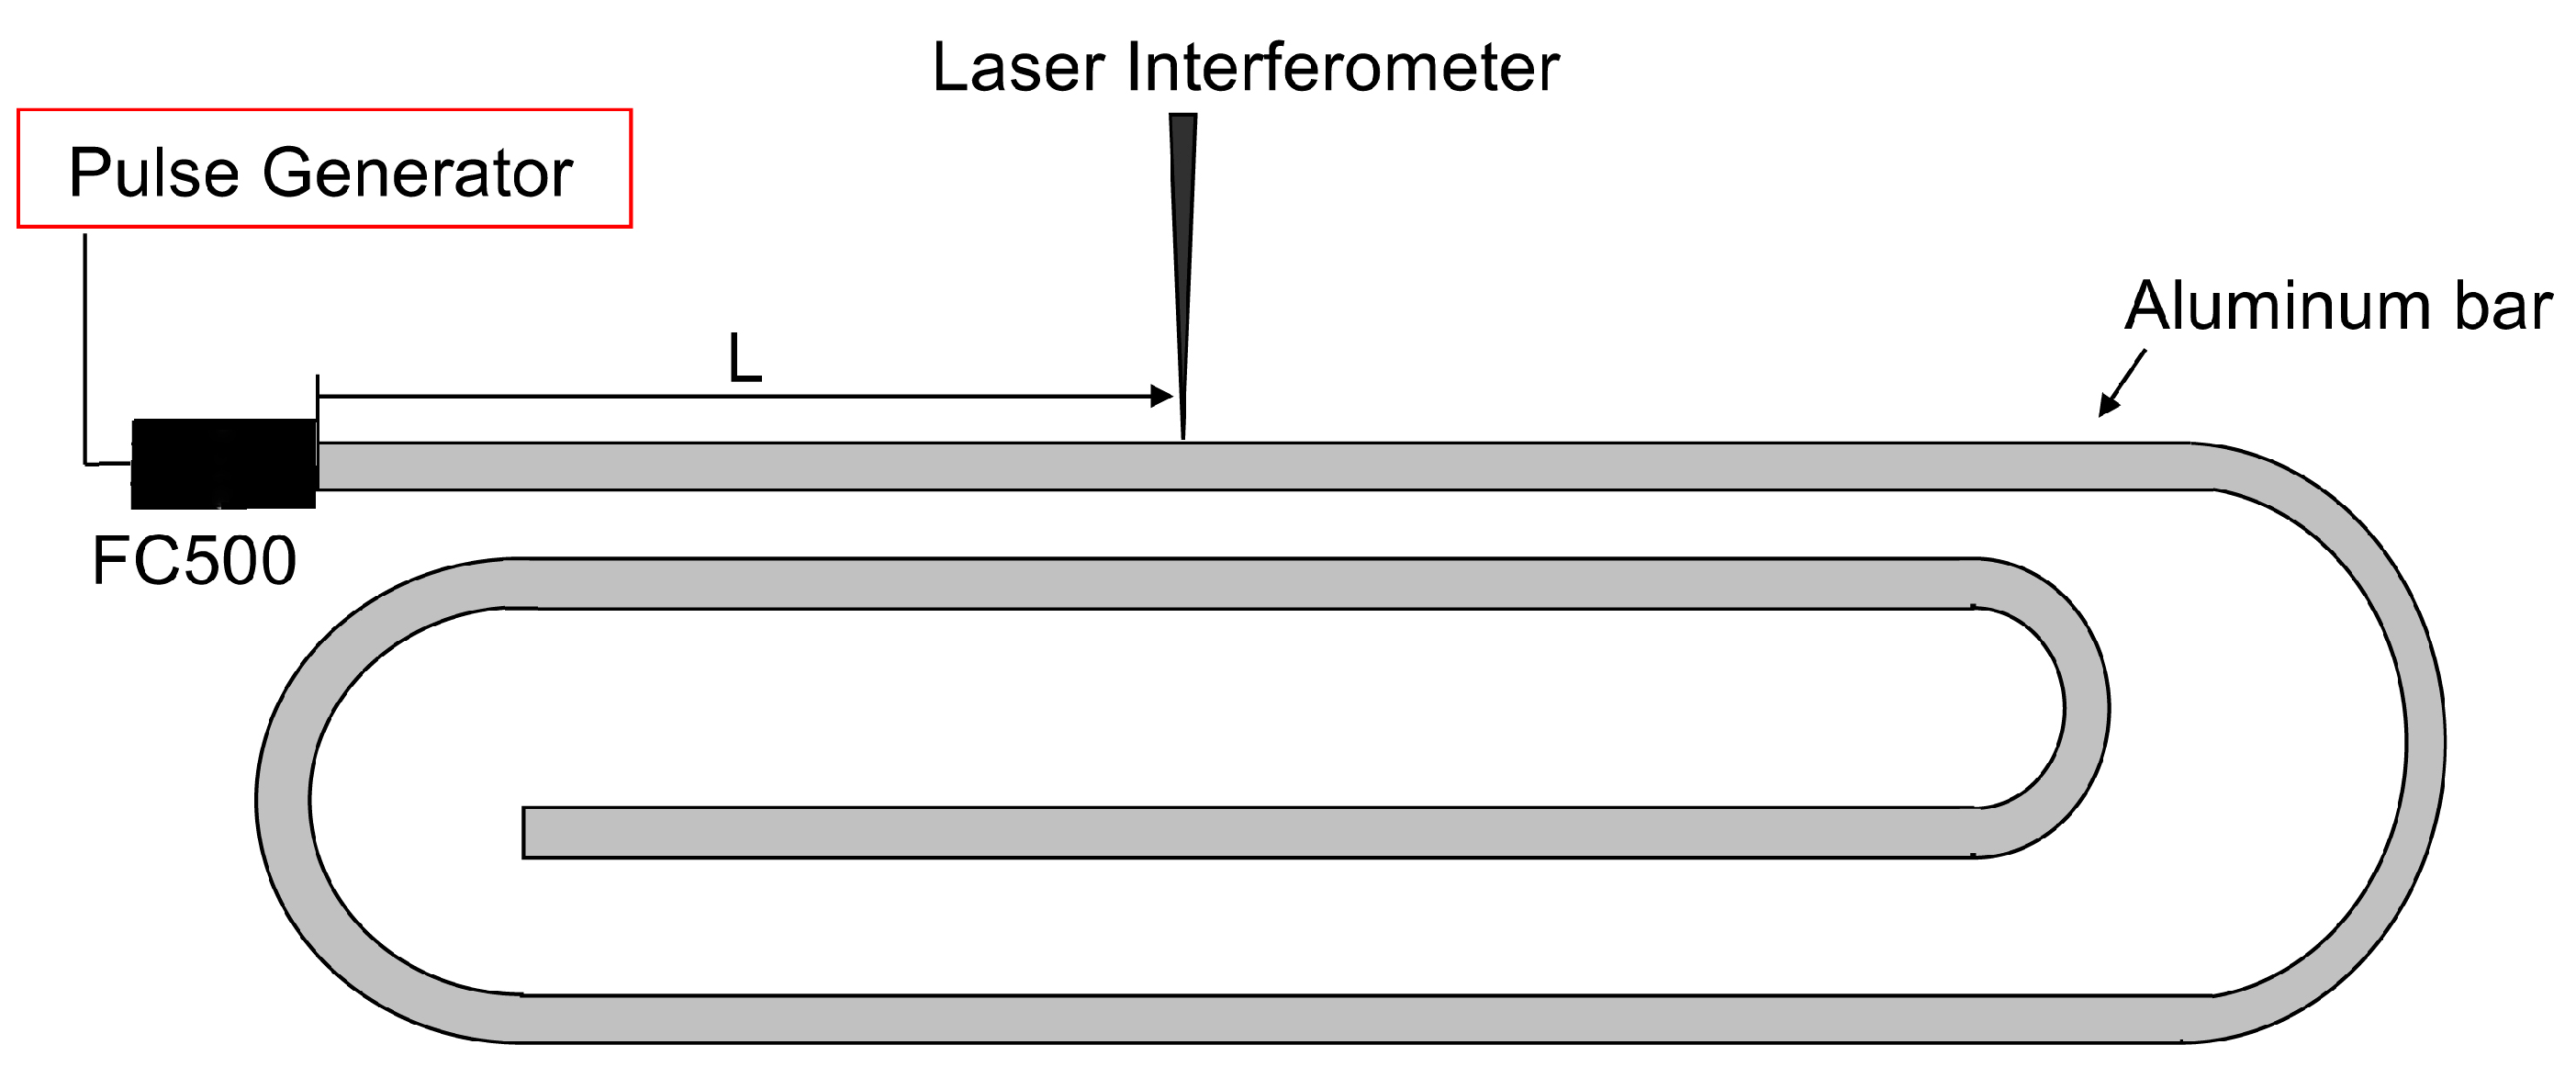
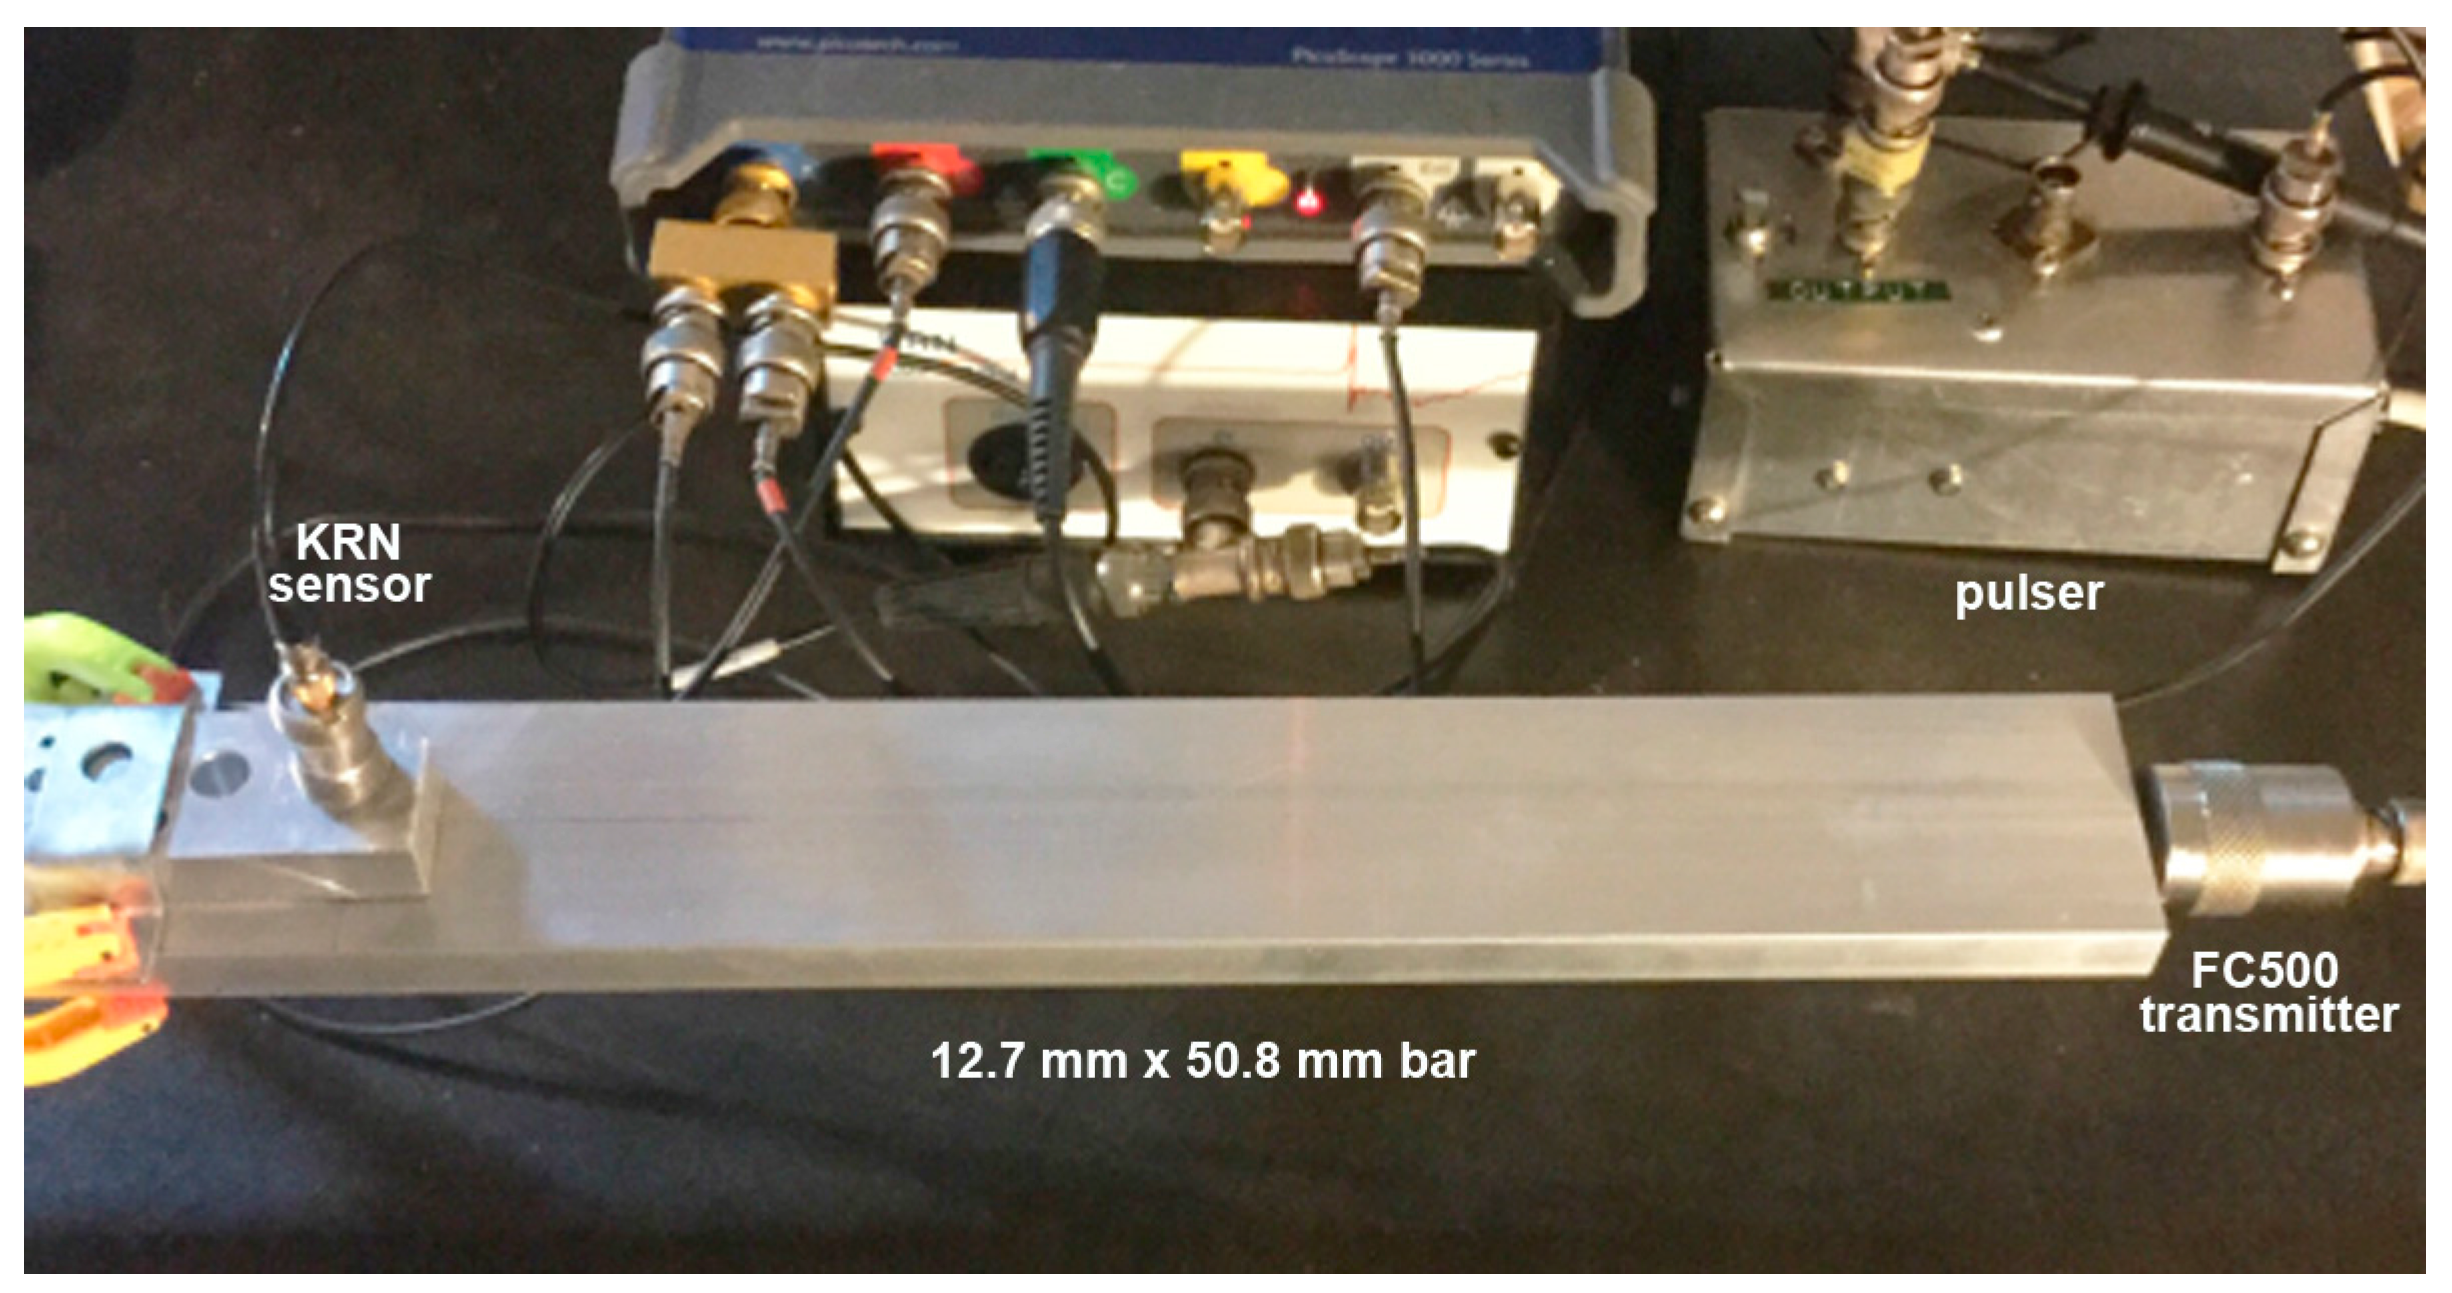
A.1. Calibration Set-Ups
A.2. Spectral Variation from Guided-Wave Variables
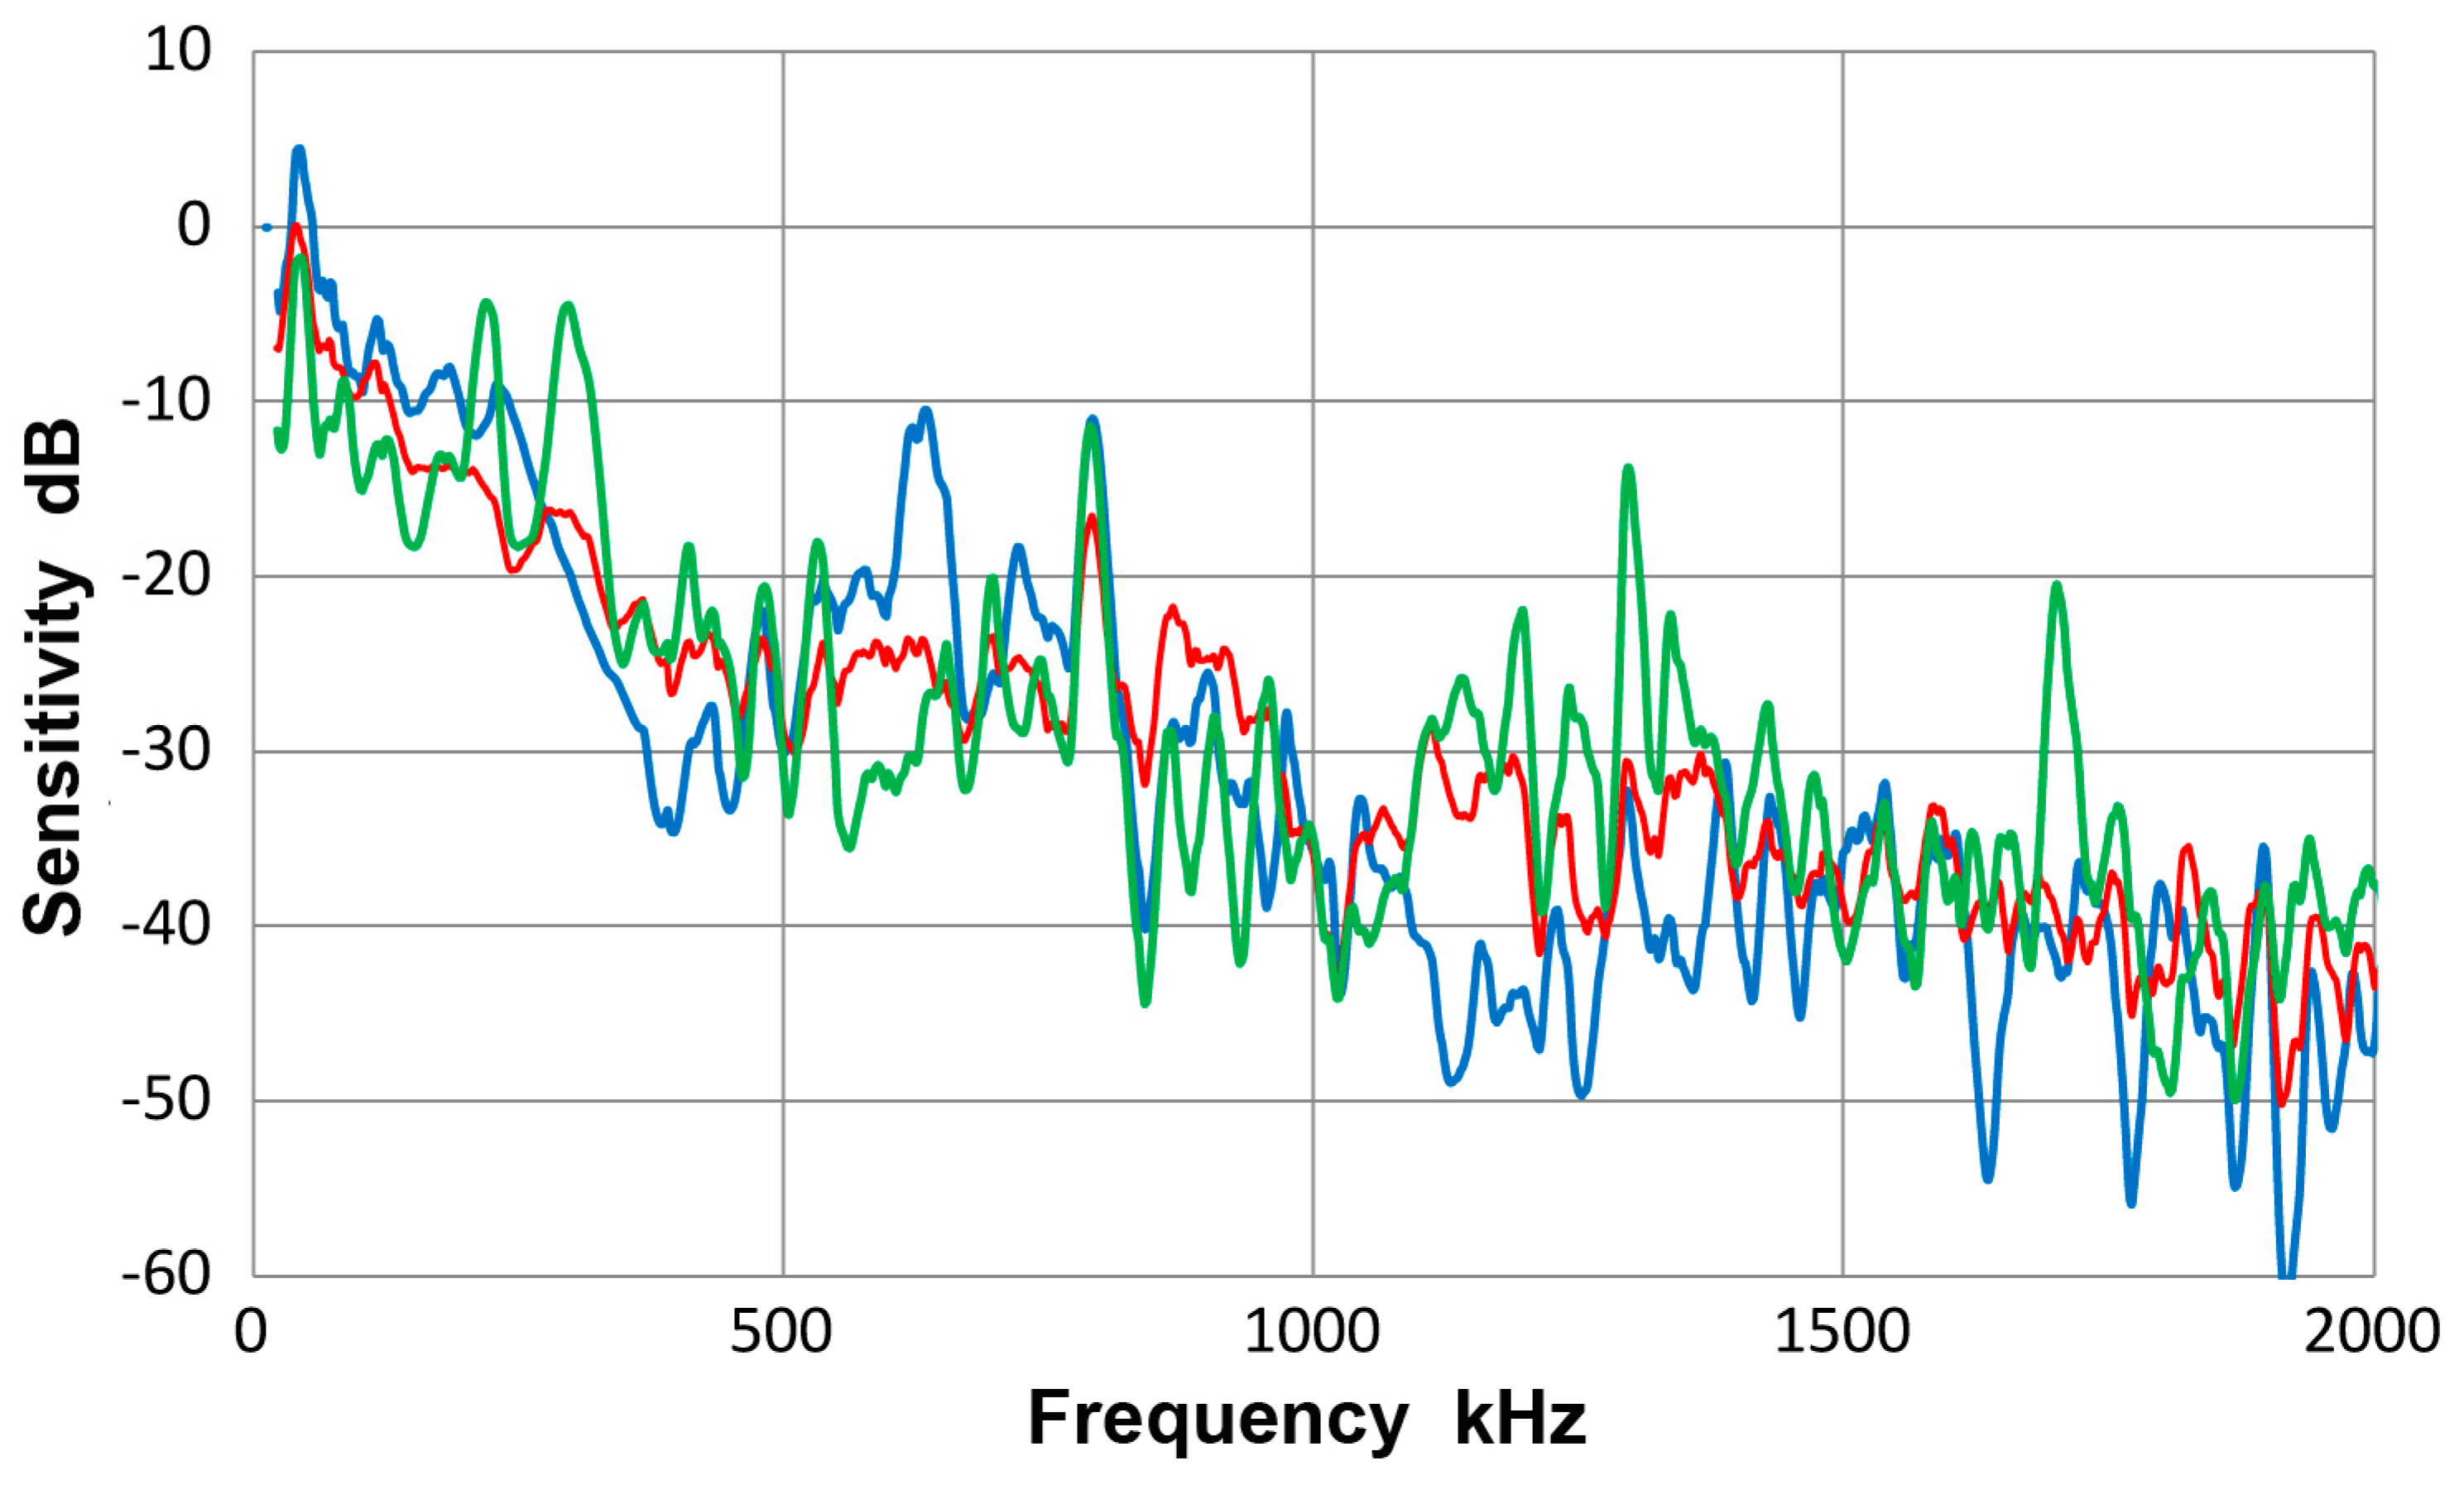
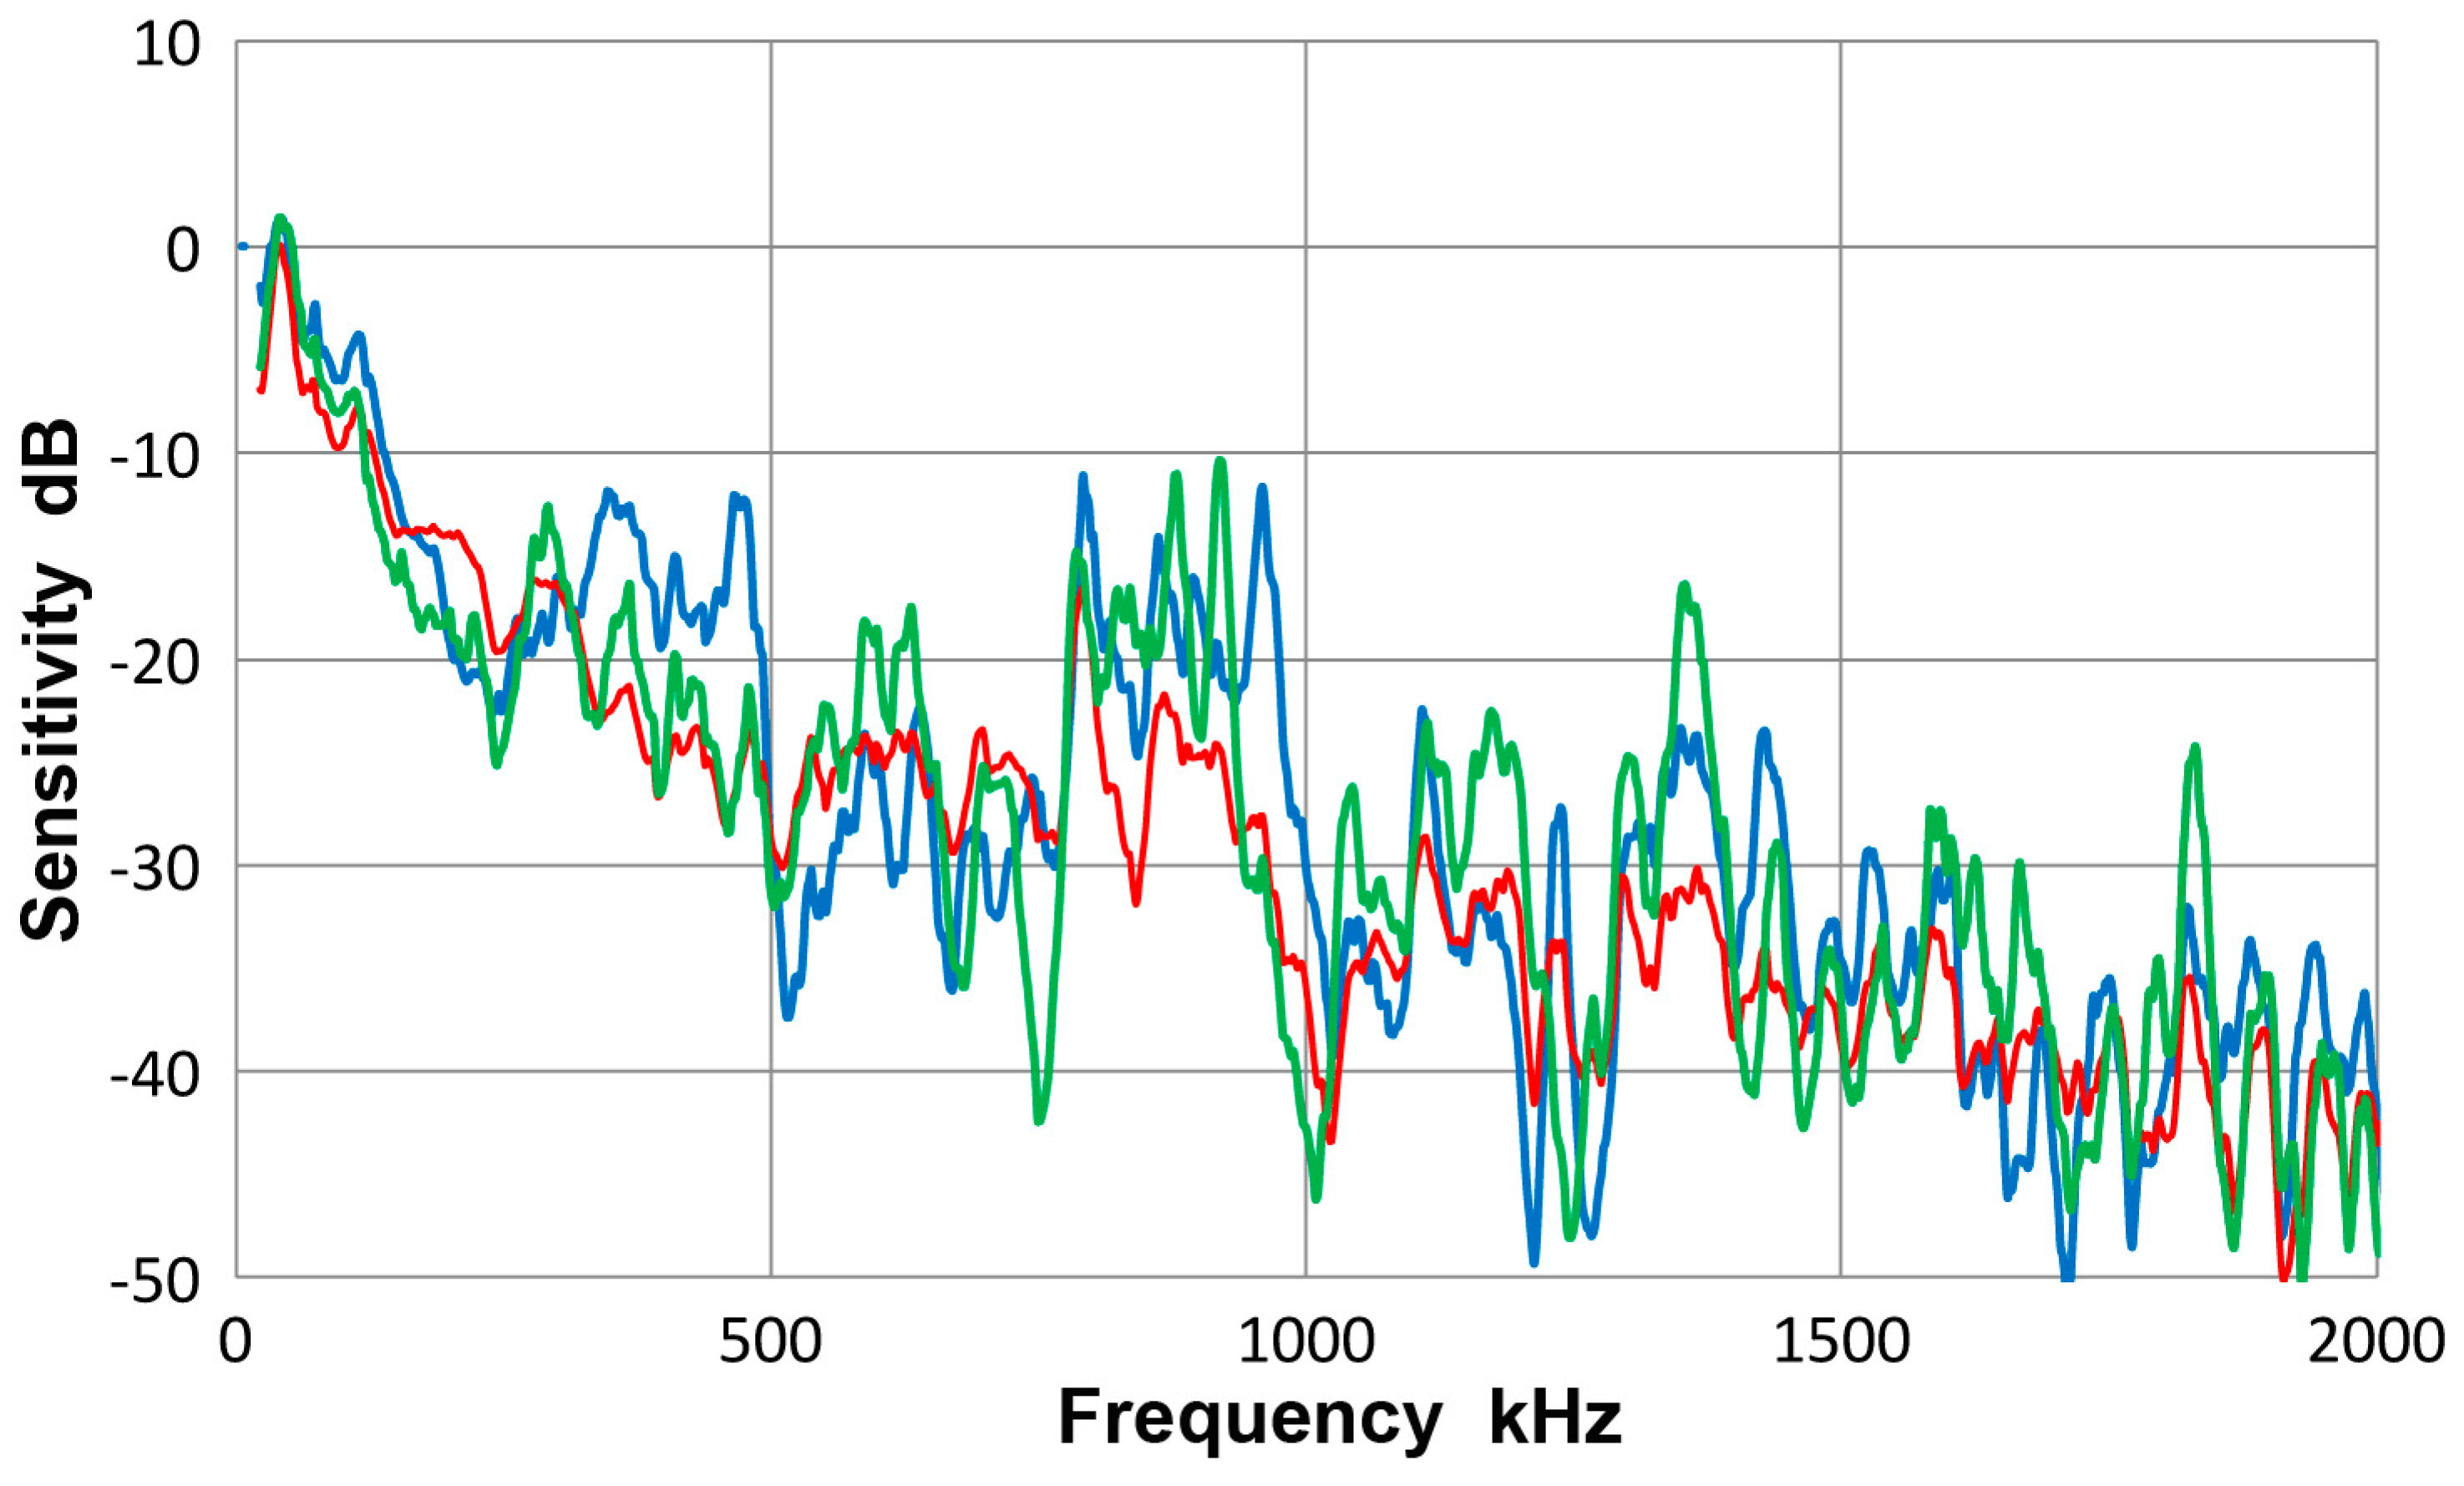
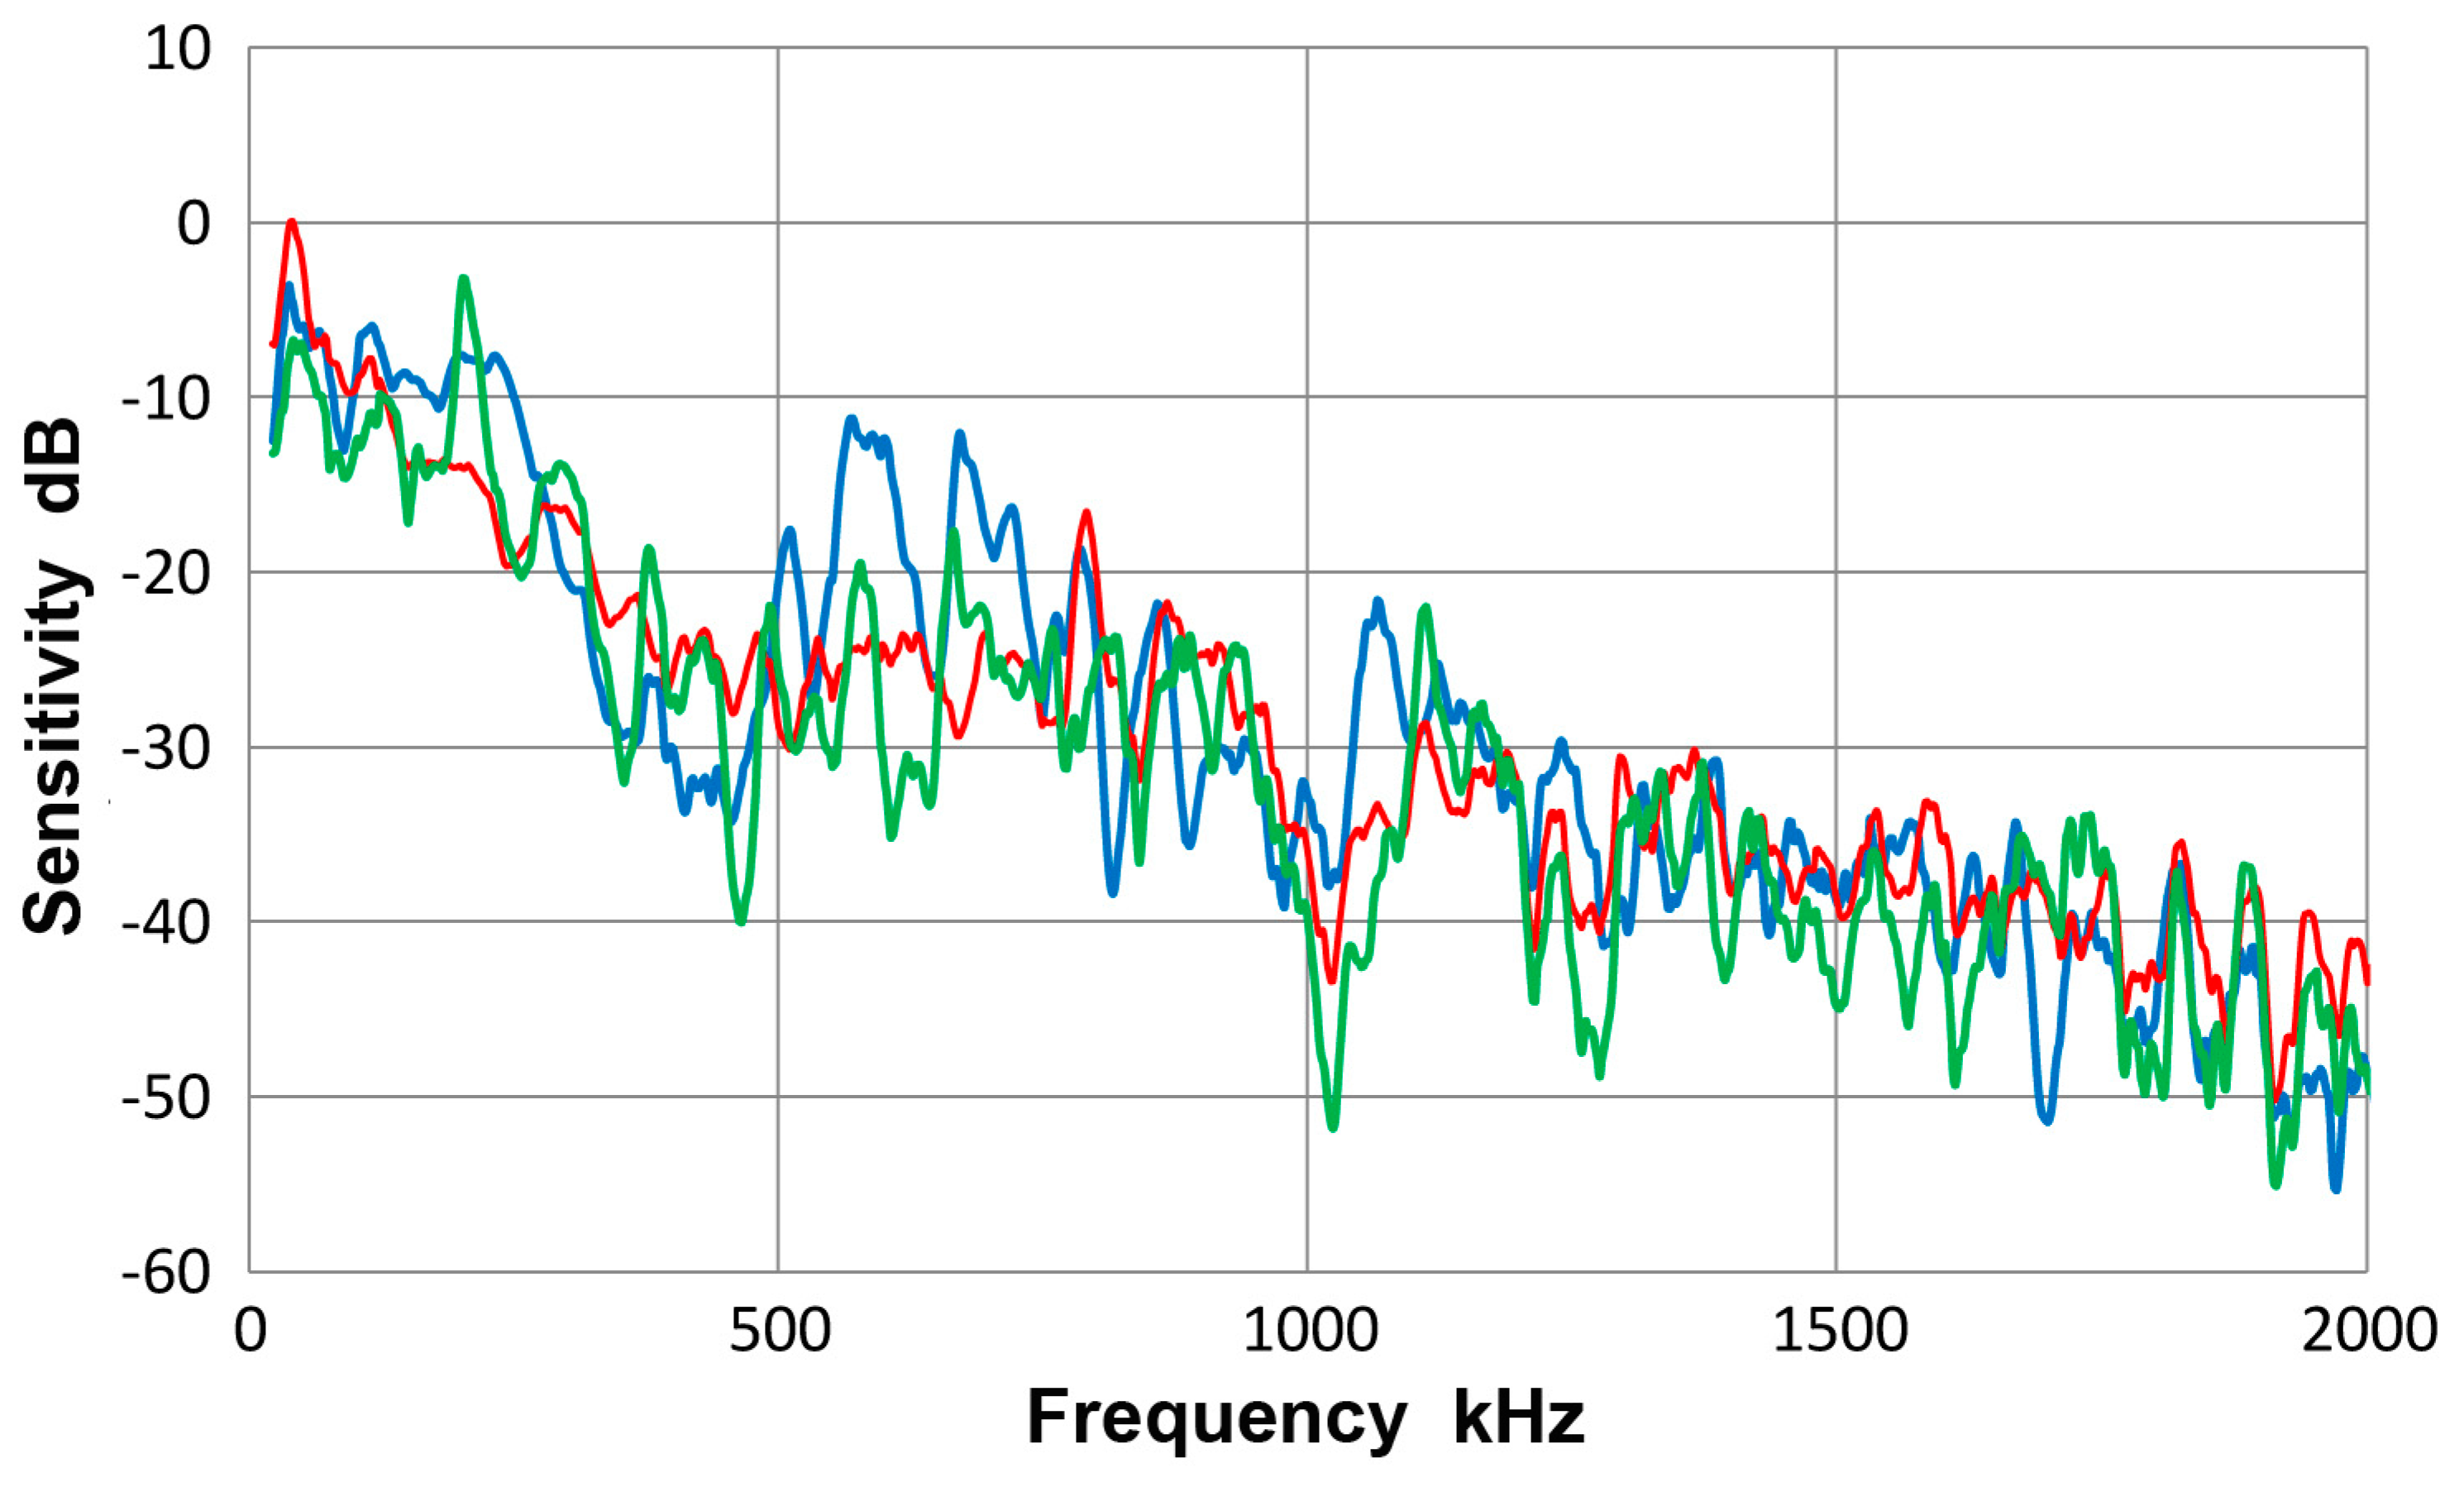
A.3. Sensor Characteristics
A.3.1. PAC HD50 Sensor
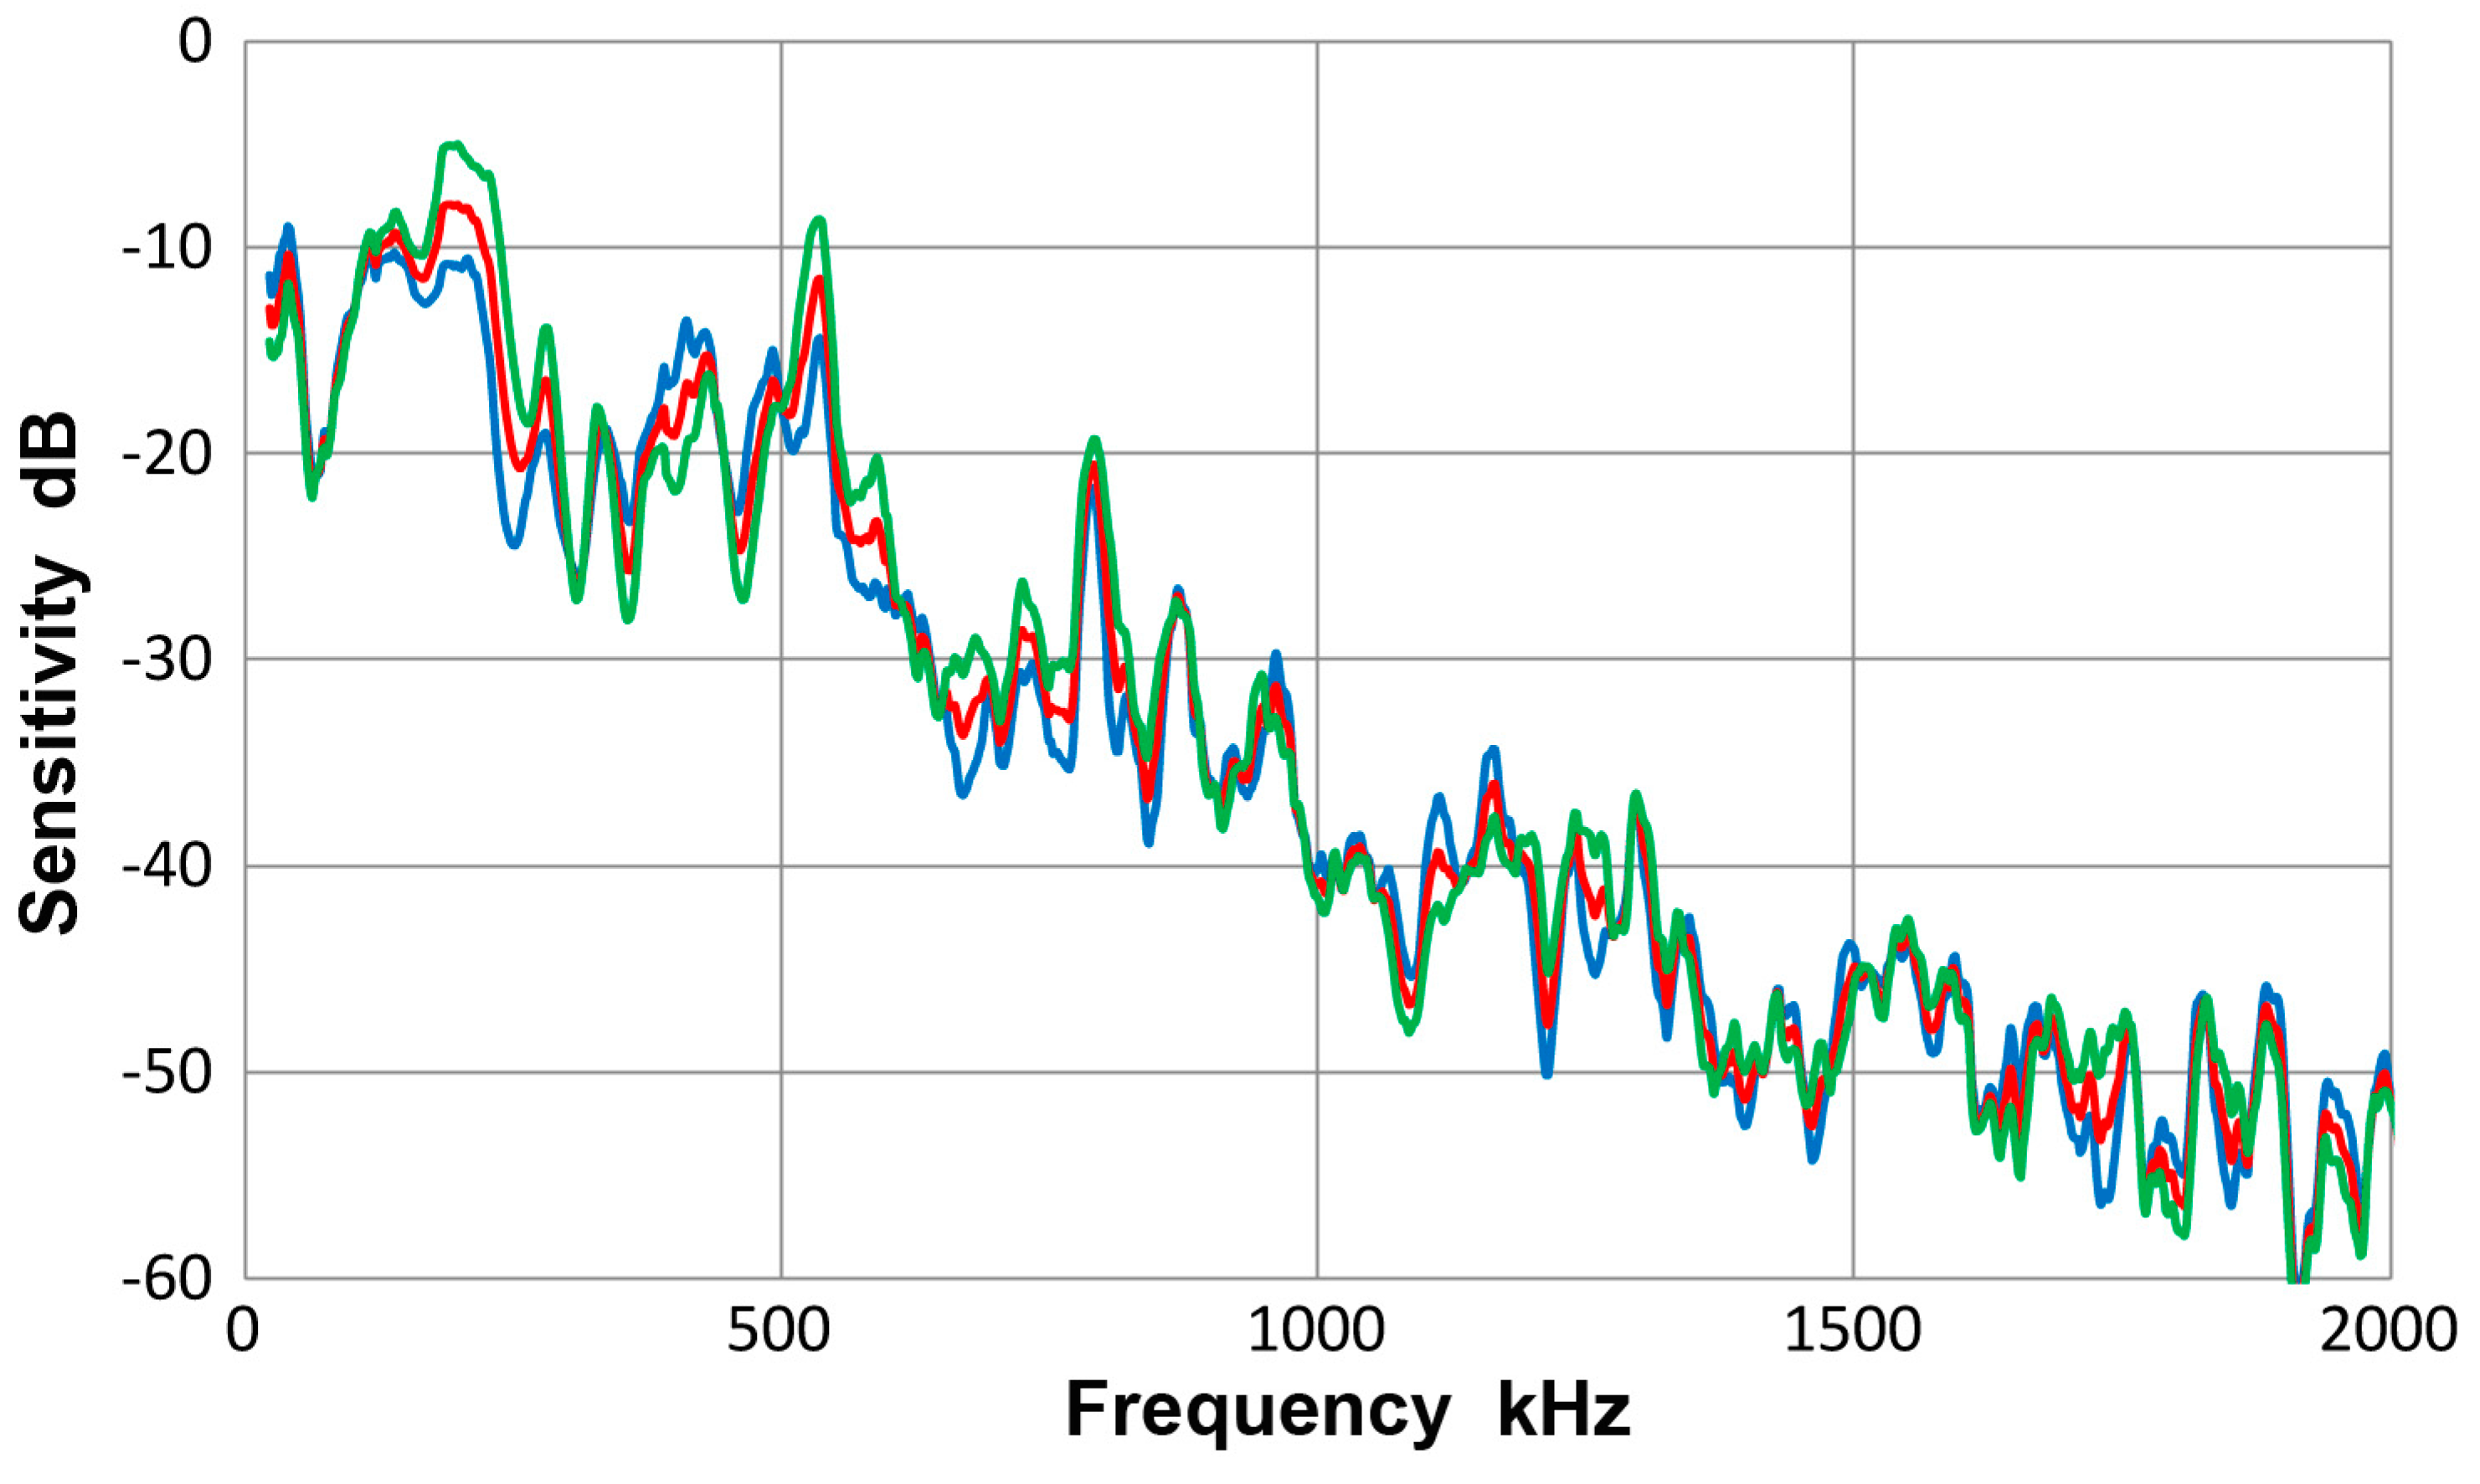
A.3.2. PAC S9220 Sensor
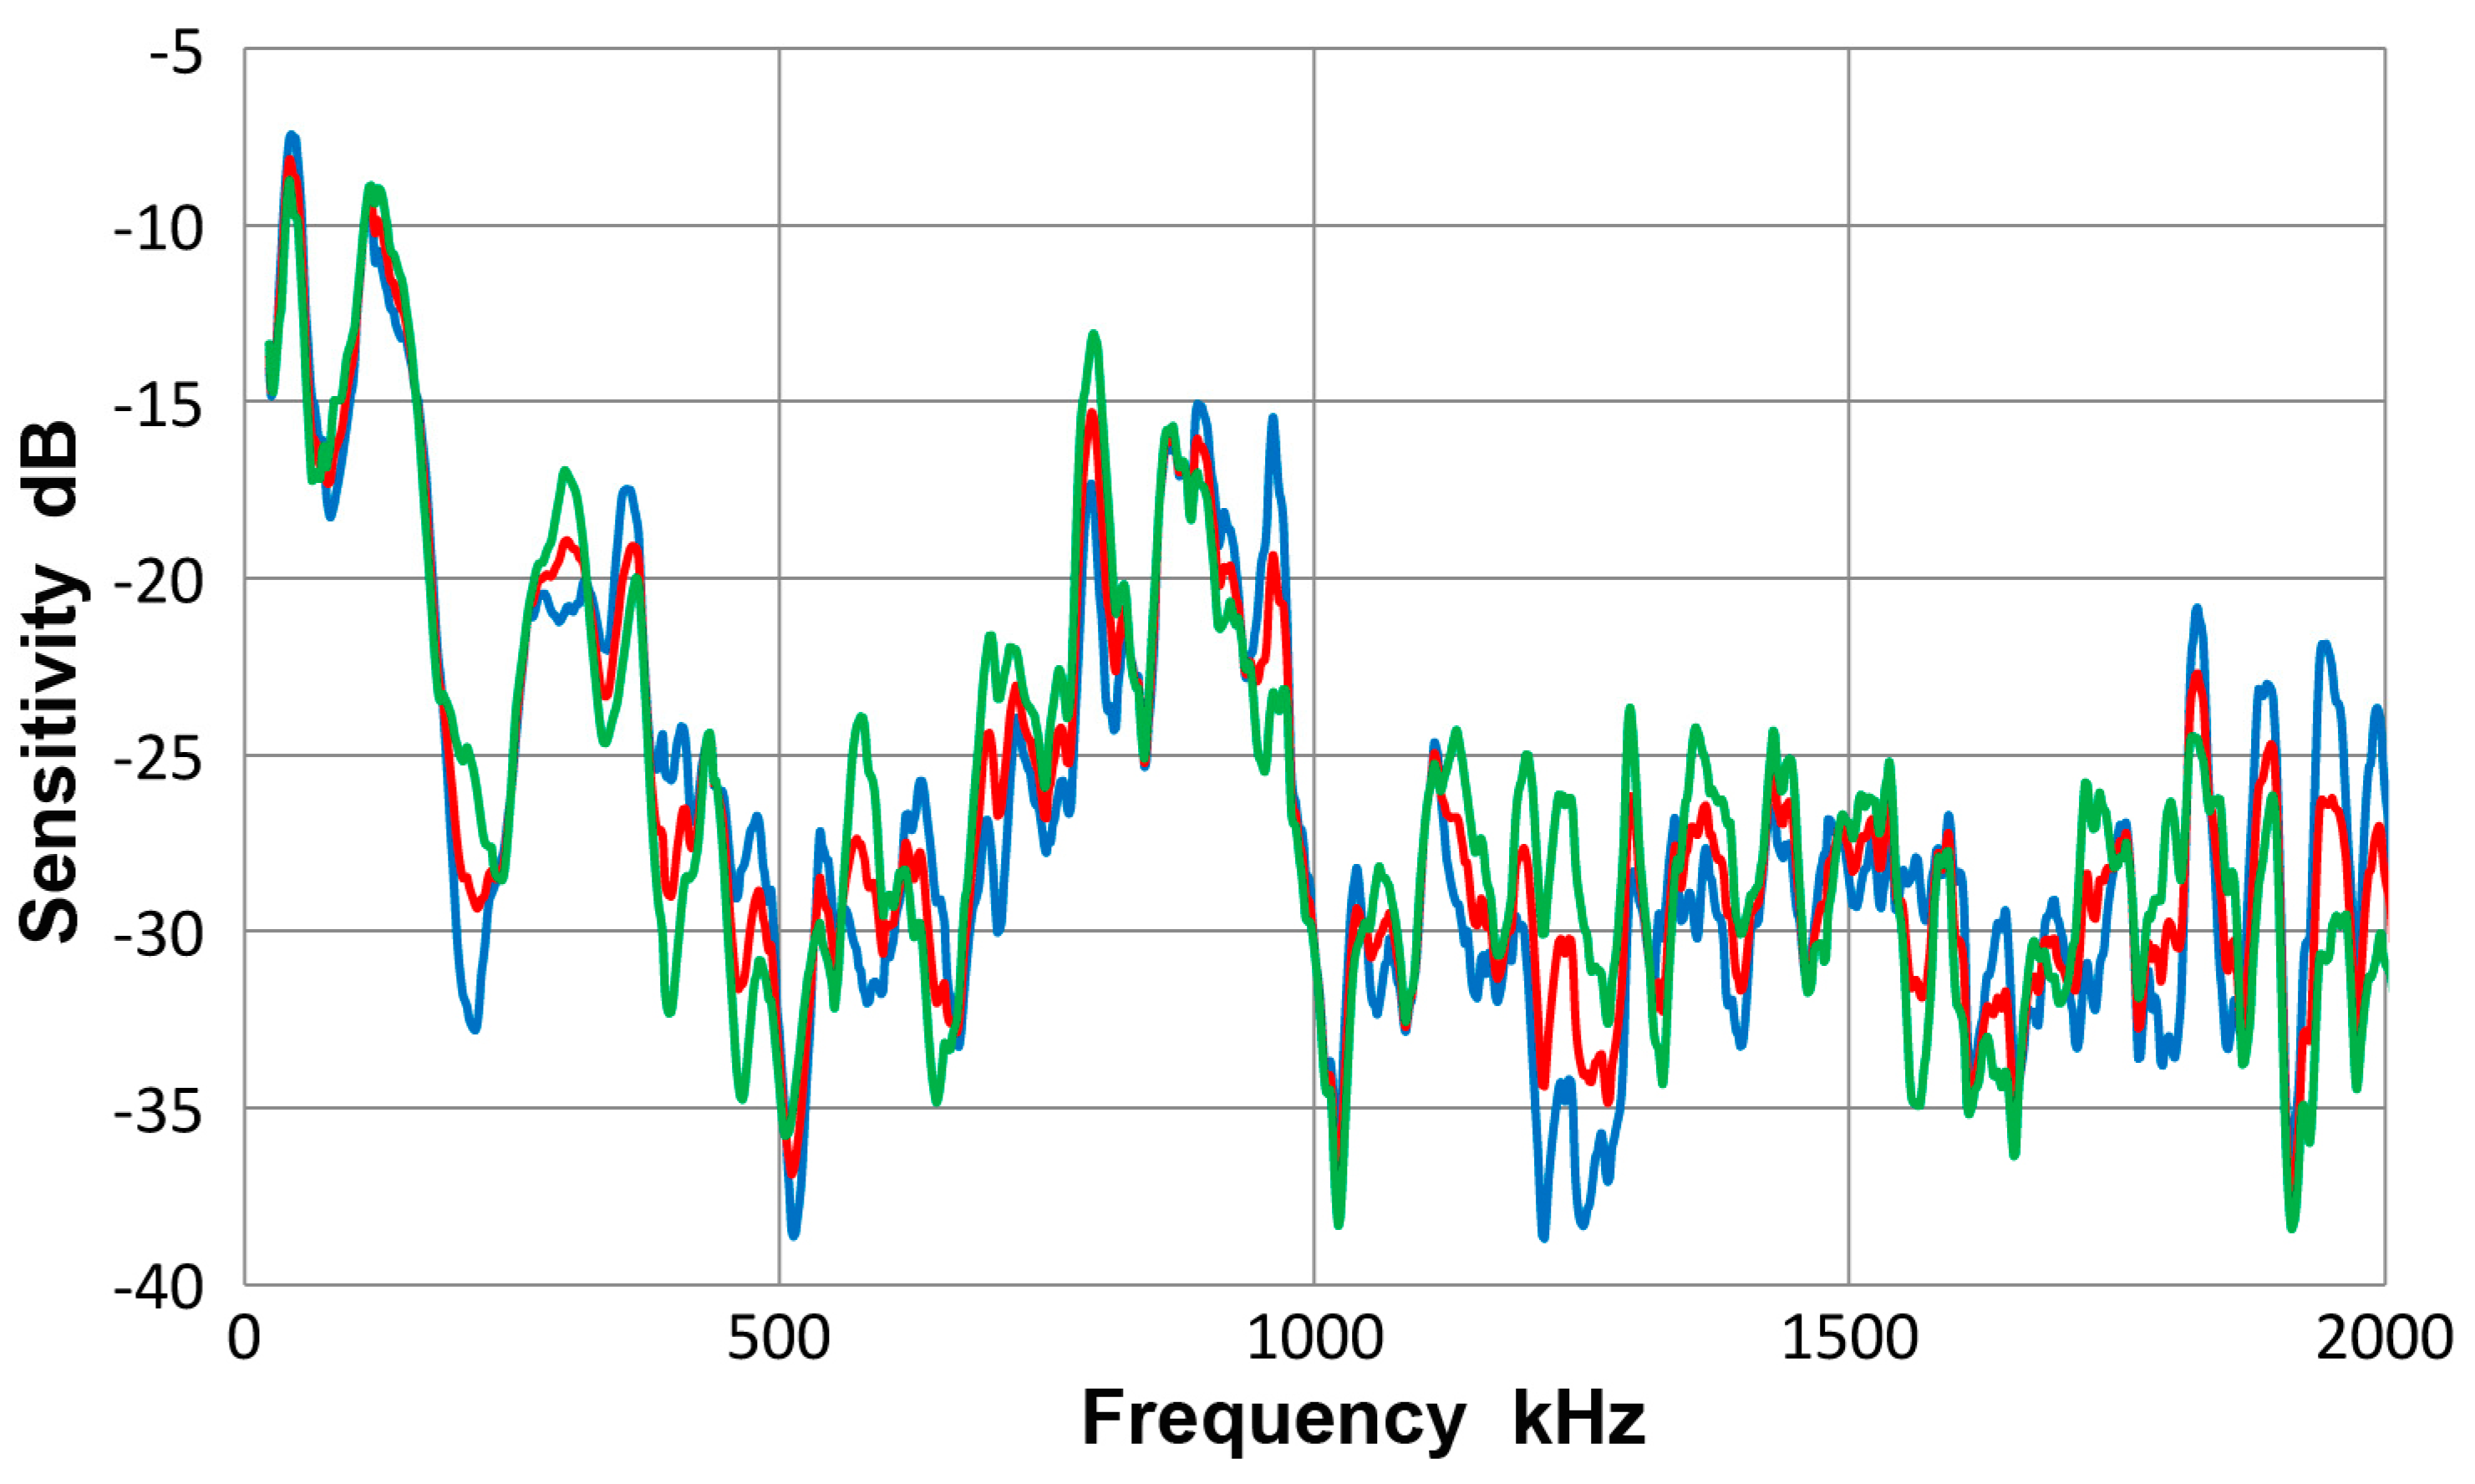
A.3.3. PAC µ30D Sensor
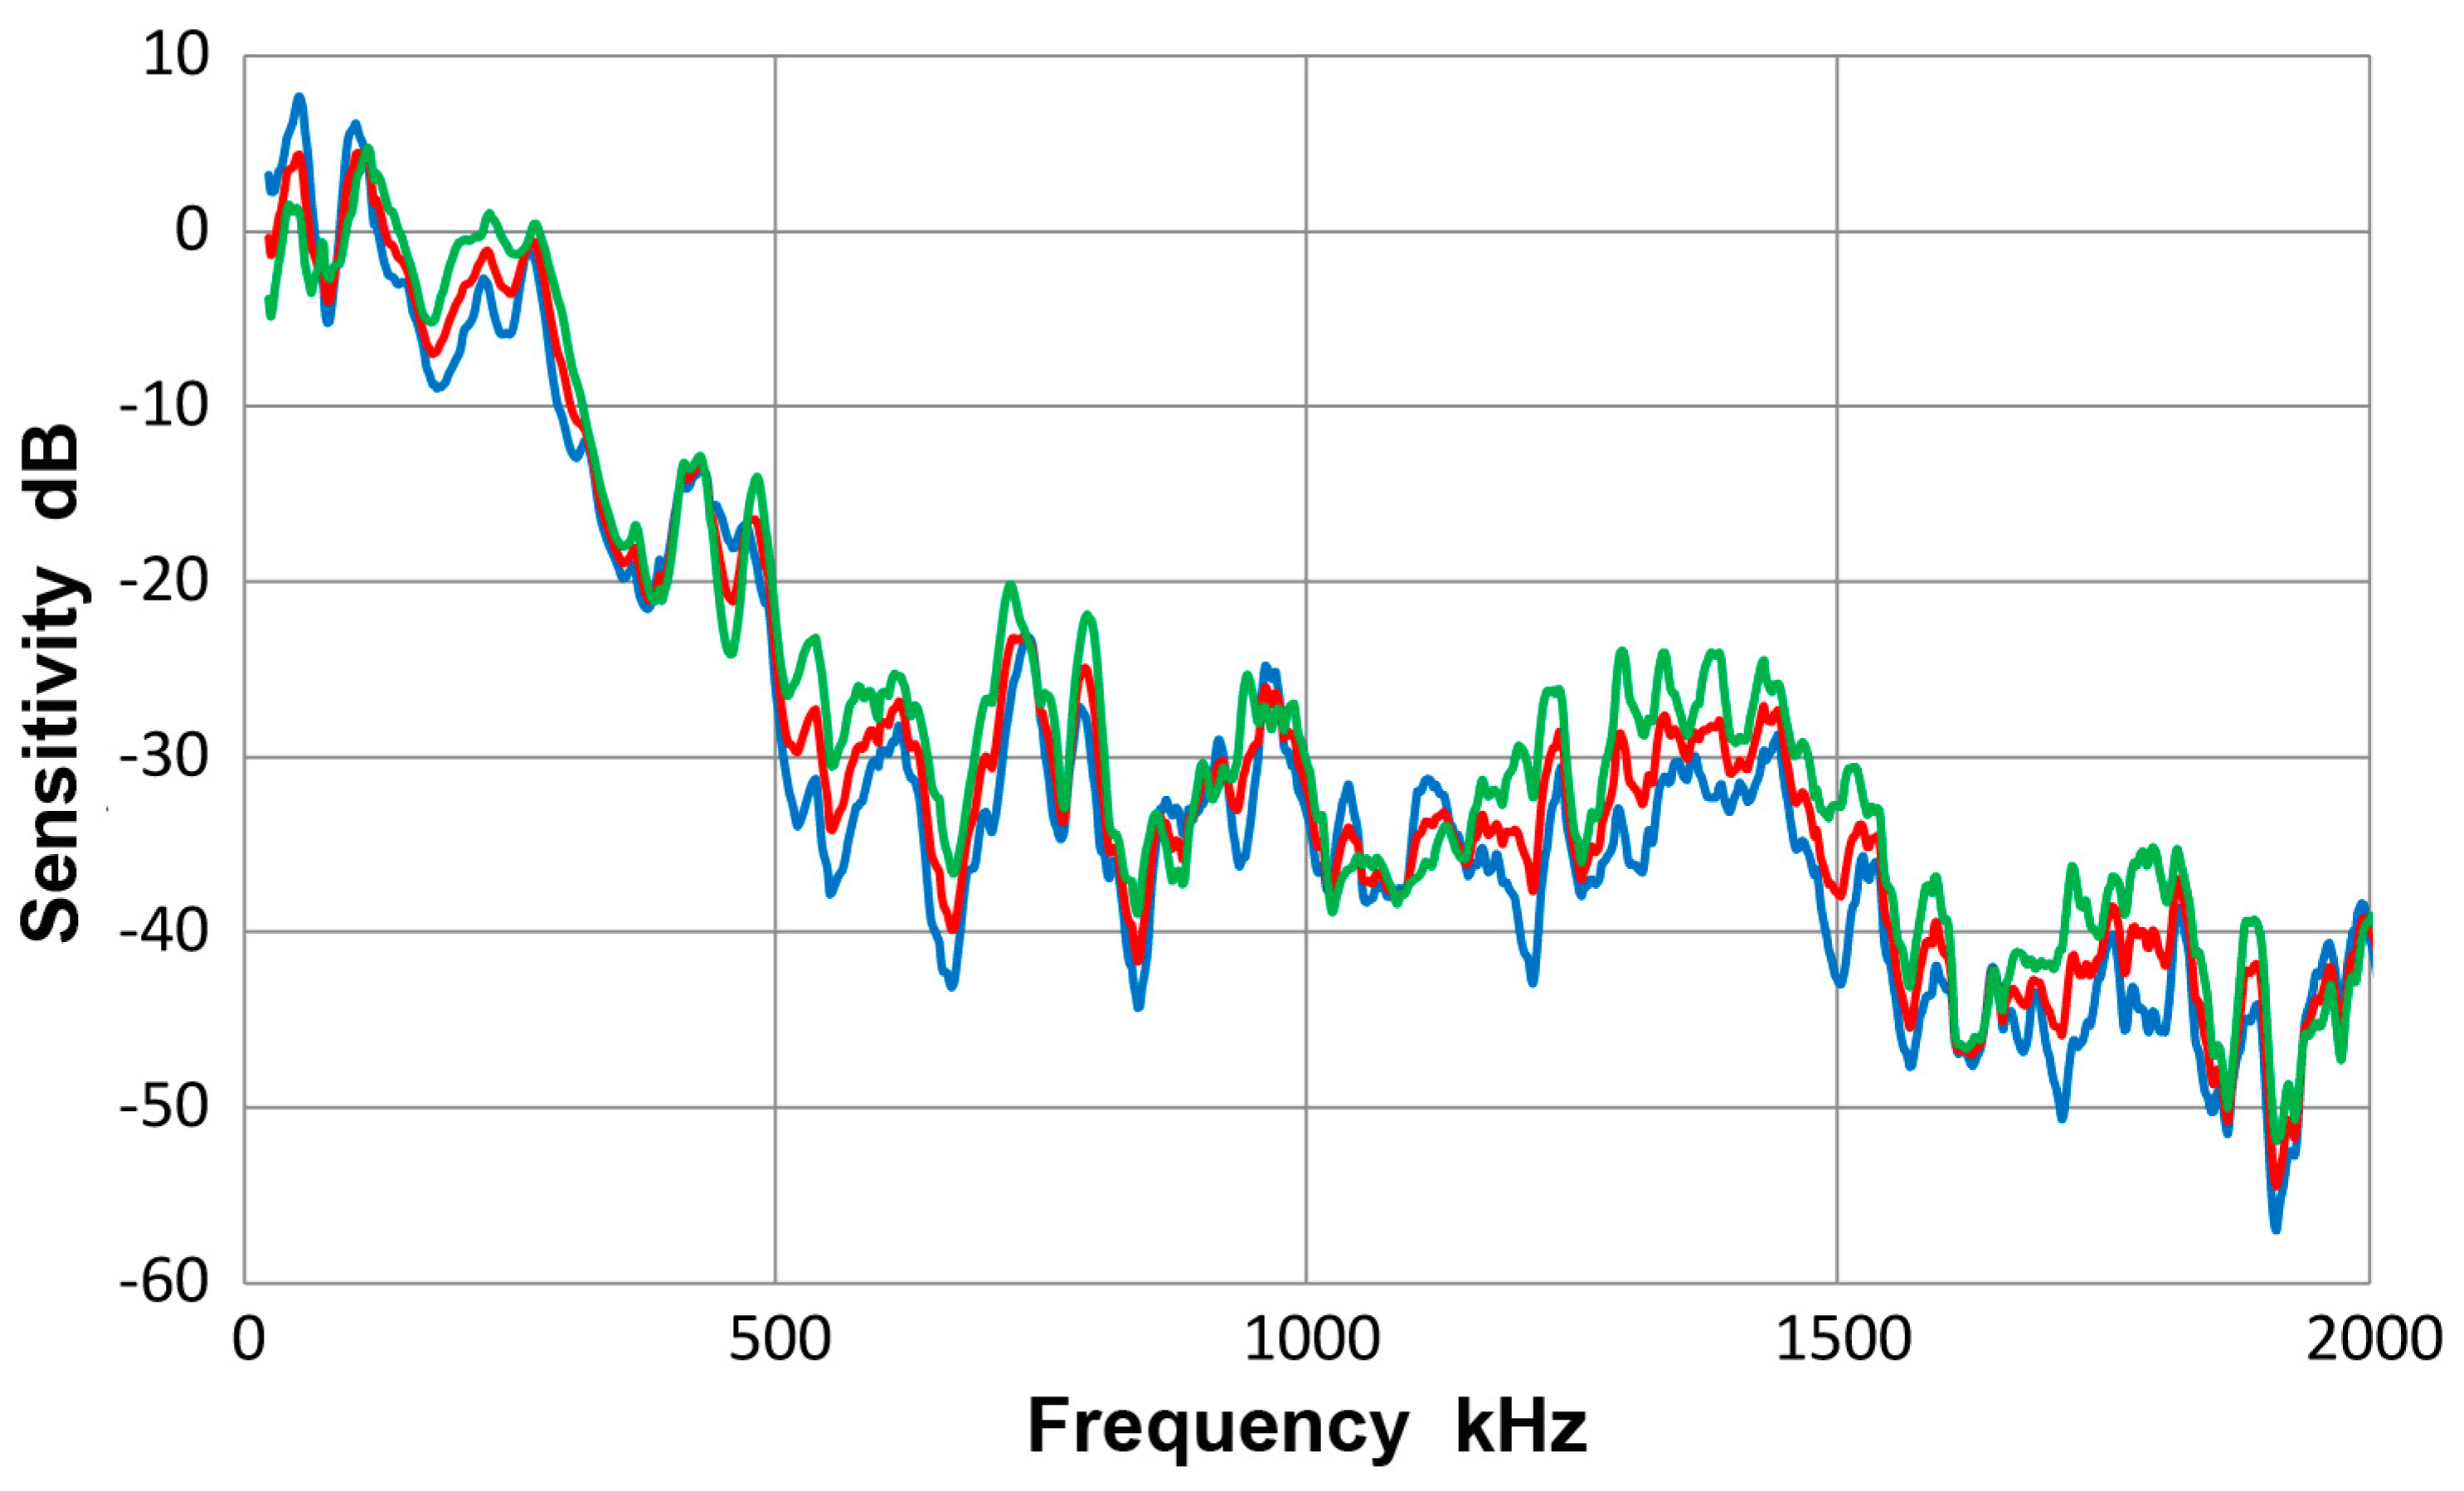
A.3.4. PAC R15a Sensor
References
- Boller, C.; Chang, F.-K.; Fujino, J. (Eds.) Encyclopedia of Structural Health Monitoring; J. Wiley: New York, NY, USA, 2009; Volume 1–3, p. 2960. [Google Scholar]
- Ono, K.; Dobmann, G. Nondestructive Testing. In Ullmann’s Encyclopedia of Industrial Chemistry; J. Wiley: New York, NY, USA, 2014; Volume 24, pp. 471–584. [Google Scholar]
- Bohse, J. Acoustic Emission. In Handbook of Technical Diagnosis; Czichos, H., Ed.; Springer: Berlin, Germany, 2013; Chapter 8; pp. 137–160. [Google Scholar]
- Gorman, M.R. Modal AE analysis of fracture and failure in composite materials, and the quality and life of high pressure composite pressure vessels. J. Acoust. Emiss. 2011, 29, 1–28. [Google Scholar]
- Viktorov, I.A. Rayleigh and Lamb Waves, Physical Theory and Applications; Plenum Press: New York, NY, USA, 1967; p. 154. [Google Scholar]
- Rose, J.L. Ultrasonic Waves in Solid Media; Cambridge University Press: Cambridge, UK, 1999; p. 476. [Google Scholar]
- Cawley, P.; Alleyne, D. The use of Lamb waves for the long-range inspection of large structures. Ultrasonics 1996, 34, 287–290. [Google Scholar] [CrossRef]
- Ostachowicz, W.; Kudela, P.; Marek Krawczuk, M.; Arkadiusz Zak, A. Guided Waves in Structures for SHM: The Time-Domain Spectral Element Method; Wiley: Chichester, UK, 2012. [Google Scholar]
- Ono, K. Calibration methods of acoustic emission sensors. Materials 2016, 9, 508. [Google Scholar] [CrossRef] [PubMed]
- Ono, K.; Hayashi, T.; Cho, H. Bar-wave calibration of acoustic emission sensors. Appl. Sci. 2017, 7, 964. [Google Scholar] [CrossRef]
- De Marchi, L.; Marzani, A.; Miniaci, M. A dispersion compensation procedure to extend pulse-echo defects location to irregular waveguides. NDT&E Int. 2013, 54, 115–122. [Google Scholar]
- CARP. Recommended Practice for Acoustic Emission Testing of Fiberglass Reinforced Plastic Tanks/Vessels. In Proceedings of the 37th Annual Conference, Reinforced Plastics/Composites Institute, New Orleans, LA, USA, 29 January–2 February 1979; The Society of the Plastics Industry, Inc.: New York, NY, USA, 1982; p. 13. [Google Scholar]
- ASME. Acoustic Emission Examination of Fiber Reinforced Plastic Vessels. In Boiler and Pressure Vessel Code; American Society of Mechanical Engineers: New York, NY, USA, 1985; pp. 149–173. [Google Scholar]
- American Society for Testing Materials. Standard Practice for Acoustic Emission Examination of Fiberglass Reinforced Plastic Resin (RP) Tanks/Vessels; ASTM, E-1067; ASTM (American Society for Testing Materials) International: West Conshohocken, PA, USA, 1985 and 2011; p. 13.
- American Society for Testing Materials. Standard Practice for Verifying the Consistency of AE-Sensor Response Using an Acrylic Rod; ASTM, E-2075; ASTM (American Society for Testing Materials) International: West Conshohocken, PA, USA, 2015; p. 4. [Google Scholar]
- Dunegan, H.L. Modal Analysis of Acoustic Emission Signals. J. Acoust. Emiss. 1997, 15, 53–61. [Google Scholar]
- Gary, J.; Hamstad, M.A. On the far-field structure of waves generated by a pencil break on a thin plate. J. Acoust. Emiss. 1994, 12, 157–170. [Google Scholar]
- Hamstad, M.A.; Gary, J.; O’Gallagher, A. Far-field acoustic emission waves by three-dimensional finite element modeling of pencil-lead breaks on a thick plate. J. Acoust. Emiss. 1996, 14, 103–114. [Google Scholar]
- Hamstad, M.A.; Gary, J.; O’Gallagher, A. Wideband acoustic emission displacement signals as a function of source rise-time and plate thickness. J. Acoust. Emiss. 1998, 16, S251–S260. [Google Scholar]
- Hamstad, M.A.; Gary, J.; O’Gallagher, A. Modeling of buried acoustic emission monopole and dipole sources with a finite element technique. J. Acoust. Emiss. 1999, 17, 97–110. [Google Scholar]
- Miniaci, M.; Gliozzi, A.S.; Morvan, B.; Krushynska, A.; Bosia, F.; Scalerandi, M.; Pugno, N.M. Proof of Concept for an Ultrasensitive Technique to Detect and Localize Sources of Elastic Nonlinearity Using Phononic Crystals. Phys. Rev. Lett. 2017, 118. [Google Scholar] [CrossRef] [PubMed]
- Dehghan Niri, E.; Salamone, S. A probabilistic framework for acoustic emission source localization in plate-like structures. Smart Mater. Struct. 2012, 21. [Google Scholar] [CrossRef]
- Ono, K. Critical examination of ultrasonic transducer characteristics and calibration methods. Res. Nondestruct. Eval. 2017, 1–46. [Google Scholar] [CrossRef]
- Japanese Society for Non-Destructive Inspection. Method for Absolute Calibration of Acoustic Emission Transducers by Reciprocity Technique; NDIS 2109–91; ISO-TR13115 (2011); Japanese Society for Non-Destructive Inspection: Tokyo, Japan, 1991. [Google Scholar]
- ASTM. Non-Destructive Testing—Acoustic Emission Inspection—Primary Calibration of Transducers; based on ASTM E1106–12 Standard Method for Primary Calibration of Acoustic Emission Sensors; ISO 12713: 1998(E); ASTM International: West Conshohocken, PA, USA, 2016; p. 12. [Google Scholar]
- Ono, K.; Cho, H.; Matsuo, T. New characterization methods of AE sensors. J. Acoust. Emiss. 2010, 28, 256–277. [Google Scholar]
- Ichikawa, F.; Kurita, K.; Maruyama, H.; Takahashi, S. Study on optimum conditions for Lamb wave ultrasonic testing and its application to product line. Kawasaki Steel Giho 1986, 18, 192–198. [Google Scholar]
- Ono, K.; Gallego, A. Research and applications of AE on advanced composites. J. Acoust. Emiss. 2012, 30, 180–229. [Google Scholar]
- Vallen, H. Proposal for an absolute AE sensor calibration setup. In Proceedings of the World Conference on Acoustic Emission, Xi’an, China, 11–13 October 2017. [Google Scholar]
- Ono, K.; Stern, R.; Long, M. Application of correlation analysis to acoustic emission. In Acoustic Emission; ASTM-STP-505; ASTM: Philadelphia, PA, USA, 1972; pp. 152–163. [Google Scholar]
- Ono, K.; Huang, Q. Pattern recognition analysis of acoustic emission signals. In Progress in Acoustic Emission VII; Kishi, T., Mori, Y., Enoki, M., Eds.; Japanese Society for Nondestructive Inspection: Tokyo, Japan, 1994; pp. 69–78. [Google Scholar]
- Huang, Q. Characterization of Acoustic Emission from Failure Processes of Carbon Fiber Epoxy Composites by Pattern Recognition. Ph.D. Thesis, University of California, Los Angeles, CA, USA, 1993. [Google Scholar]


| Transducer Model | Manufacturer | Frequency MHz | Element Size mm |
|---|---|---|---|
| FC500 | AET Corp | 2.25 | 19 T |
| V104 | Olympus | 2.25 | 25 T |
| KRNBB-PCP or -PC | KRN Services | 0.1–1 | 1 |
| V103 | Olympus | 1 | 12.7 |
| V101 | Olympus | 0.5 | 25.4 |
| R6-alpha | Physical Acoustics | 0.06 | 12.7 |
| R15 | Physical Acoustics | 0.15 | 12.7 |
| R15-alpha | Physical Acoustics | 0.15 | 12.7 |
| F30-alpha | Physical Acoustics | 0.2–0.7 | 12.7 * |
| WD | Physical Acoustics | 0.3–0.5 | 12.7 * |
| HD-50 | Physical Acoustics | 0.5 | 3 |
| µ30D | Physical Acoustics | 0.3 | 8 |
| Pico | Physical Acoustics | 0.5 | 3.2 |
| S9220 | Physical Acoustics | 0.9 | 8 |
| SH-225 | Dunegan Engineering | 0.225 | 6.3 × 12.6 ** |
| Sensor Diameter | 1 | 2 | 3 | 4 | 5 | |
|---|---|---|---|---|---|---|
| 12.7 mm | 260 | 515 | 670 | 760 | 1024 | (kHz) |
| 6.4 mm | 454 | 1024 | 1213 | 1565 | 2058 | (kHz) |
| Frequency Ratio | 1.75 | 1.99 | 1.81 | 2.06 | 2.02. |
© 2017 by the author. Licensee MDPI, Basel, Switzerland. This article is an open access article distributed under the terms and conditions of the Creative Commons Attribution (CC BY) license (http://creativecommons.org/licenses/by/4.0/).
Share and Cite
Ono, K. On the Piezoelectric Detection of Guided Ultrasonic Waves. Materials 2017, 10, 1325. https://doi.org/10.3390/ma10111325
Ono K. On the Piezoelectric Detection of Guided Ultrasonic Waves. Materials. 2017; 10(11):1325. https://doi.org/10.3390/ma10111325
Chicago/Turabian StyleOno, Kanji. 2017. "On the Piezoelectric Detection of Guided Ultrasonic Waves" Materials 10, no. 11: 1325. https://doi.org/10.3390/ma10111325
APA StyleOno, K. (2017). On the Piezoelectric Detection of Guided Ultrasonic Waves. Materials, 10(11), 1325. https://doi.org/10.3390/ma10111325


