Correlation of Structure, Tunable Colors, and Lifetimes of (Sr, Ca, Ba)Al2O4:Eu2+, Dy3+ Phosphors

1
School of Applied Physics and Materials, Wuyi University, Jiangmen 529020, China
2
School of Materials Science and Engineering, Harbin Institute of Technology, Harbin 150001, China
*
Authors to whom correspondence should be addressed.
Materials 2017, 10(10), 1198; https://doi.org/10.3390/ma10101198
Submission received: 15 September 2017
/
Revised: 11 October 2017
/
Accepted: 16 October 2017
/
Published: 18 October 2017
Abstract
:(Sr, Ca, Ba)Al2O4:Eu2+, Dy3+ phosphors were prepared via a high temperature solid-state reaction method. The correlation of phase structure, optical properties and lifetimes of the phosphors are investigated in this work. For the (Sr, Ca)Al2O4:Eu2+, Dy3+ phosphors, the different phase formation from monoclinic SrAl2O4 phase to hexagonal SrAl2O4 phase to monoclinic CaAl2O4 phase was observed when the Ca content increased. The emission color of SrAl2O4:Eu2+, Dy3+ phosphors varied from green to blue. For the (Sr, Ba)Al2O4:Eu2+, Dy3+ phosphors, different phase formation from the monoclinic SrAl2O4 phase to the hexagonal BaAl2O4 phase was observed, along with a shift of emission wavelength from 520 nm to 500 nm. More interestingly, the decay time of SrAl2O4:Eu2+, Dy3+ changed due to the different phase formations. Lifetime can be dramatically shortened by the substitution of Sr2+ with Ba2+ cations, resulting in improving the performance of the alternating current light emitting diode (AC-LED). Finally, intense LEDs are successfully obtained by combining these phosphors with Ga(In)N near UV chips.
1. Introduction
AC-LED is a new type of device that can be directly driven by the alternating current of city power. It has experienced rapid development and is widely applied in indoor and outdoor lighting due to its long life, low price, high efficiency, etc. [1,2,3,4].However, the vital defect of the AC-LED is the flickering effect, with a time gap of 5–20 ms [4,5,6], resulting in visual fatigue and health hazards. There have been several solutions to reduce flashing in AC-LED, such as using a converter-free AC-LED driver, increasing drive frequency etc. However, these solutions suffer from low power efficiency or large size. Fortunately, the use of long afterglow phosphors is considered to be a promising method to compensate for the time gap and reduce the flickering effect. Long afterglow phosphors, such as SrSi2O2N2:Eu2+, Mn2+ [2], SrAl2O4:Eu2+, Ce3+, Li+ [5], and SrAl2O4:Eu2+, and RE3+ (RE = Y, Dy) have been studied and applied to AC-LEDs [4,7].
SrAl2O4:Eu2+ is one of green phosphors for UVLEDs. When it is co-doped with RE3+ (RE = Dy, Y, Nd and Ho), SrAl2O4:Eu2+, Re3+ can store electrons to achieve long and persistent luminescence. However, the afterglow time of SrAl2O4:Eu2+, Dy3+ is too long to fulfill the requirement of AC-LED. In our previous research, we shortened the average lifetime of SrAl2O4:Eu2+, Dy3+ phosphors from 845.86 ms to 428.83 ms by changing the amount of SrCl2 flux. Moreover, MAl2O4:Eu2+, Dy3+ (M = Ca2+, Sr2+, Ba2+) phosphors with different cations also have different defect levels and afterglow times [7,8,9,10,11,12,13]. Therefore, the substitution of Sr2+ by Ca2+ or Ba2+ ions in SrAl2O4:Eu2+, Dy3+ phosphors is expected to tune the afterglow time. Furthermore, the emission and excitation spectra of Eu2+ ions can also be modified by the different radius of Ca2+, Sr2+ and Ba2+ ions and crystal structures [13,14,15,16].
This paper aims to improve the emission color and the average lifetime of SrAl2O4:Eu2+, Dy3+ phosphors by partially substituting Sr2+ with Ca2+ or Ba2+ ions. The effect and correlation of Ca2+ or Ba2+ ions substitution on the obtained phases, optical properties, and decay times of SrAl2O4:Eu2+, Dy3+ phosphors are systematically investigated. The electroluminescent properties of the as-fabricated LEDs based on UV-chips and MAl2O4:Eu2+, Dy3+ (M = Ca2+, Sr2+, Ba2+) phosphors are also investigated.
2. Experimental Procedure
Sr0.90−xCaxAl2O4:0.05Eu2+, 0.05Dy3+ and Sr0.90−yBayAl2O4:0.05Eu2+, 0.05Dy3+ samples (x or y = 0.00, 0.15, 0.30, 0.45, 0.60, 0.75, 0.90) were prepared by a high temperature solid-state reaction method. The raw materials CaCO3 (99.99%), SrCO3 (99.99%), BaCO3 (99.99%), Al2O3 (99.99%), Eu2O3 (99.99%), Dy2O3 (99.99%) and H3BO3 (99.99%) were weighted stoichiometrically. The original materials were mixed into an agate mortar and placed into a small alumina crucible. Then, the mixtures were put into a tubular furnace and heated to 900 °C for 2 h. Being reground, they were heated to 1400 °C for 4 h under a reductive atmosphere from burning activated carbon. Finally, the samples were cooled to room temperature, resulting in Sr0.9−xCaxAl2O4:0.05Eu2+, 0.05Dy3+, and Sr0.9−yBayAl2O4:0.05Eu2+, 0.05Dy3+ compounds.
The structure of Sr0.90−xCaxAl2O4:0.05Eu2+, 0.05Dy3+, and Sr0.90−yBayAl2O4:0.05Eu2+, 0.05Dy3+ phosphors were explored by X-ray powder diffraction (XRD) using a Diffractometer (X′ Pert PRO, Panalytical, Almelo, Netherlands) with Cu Kα radiation at 40 kV and 20 mA. The data were collected in the 2θ range of 10° to 80°. The photoluminescence (PL) spectra and decay curves were performed by a spectrofluorometer (F-4600, Hitachi, Tokyo, Japan) equipped with a 150W Xe lamp as the light source.
The phosphors were pre-coated on near-UV Ga(In)N chips with 365 and 395 nm emission, respectively. The emission spectra and parameters of the as-fabricated LEDs were measured by the LED spectrophotocolorimeter (PMS 50, Everfine Co., Ltd., Hangzhou, China) with an integrating sphere of 50 cm diameter. The normal forward-bias current was 20 mA. All measurements were conducted at room temperature.
3. Results and Discussion
3.1. X-ray Diffraction Analysis
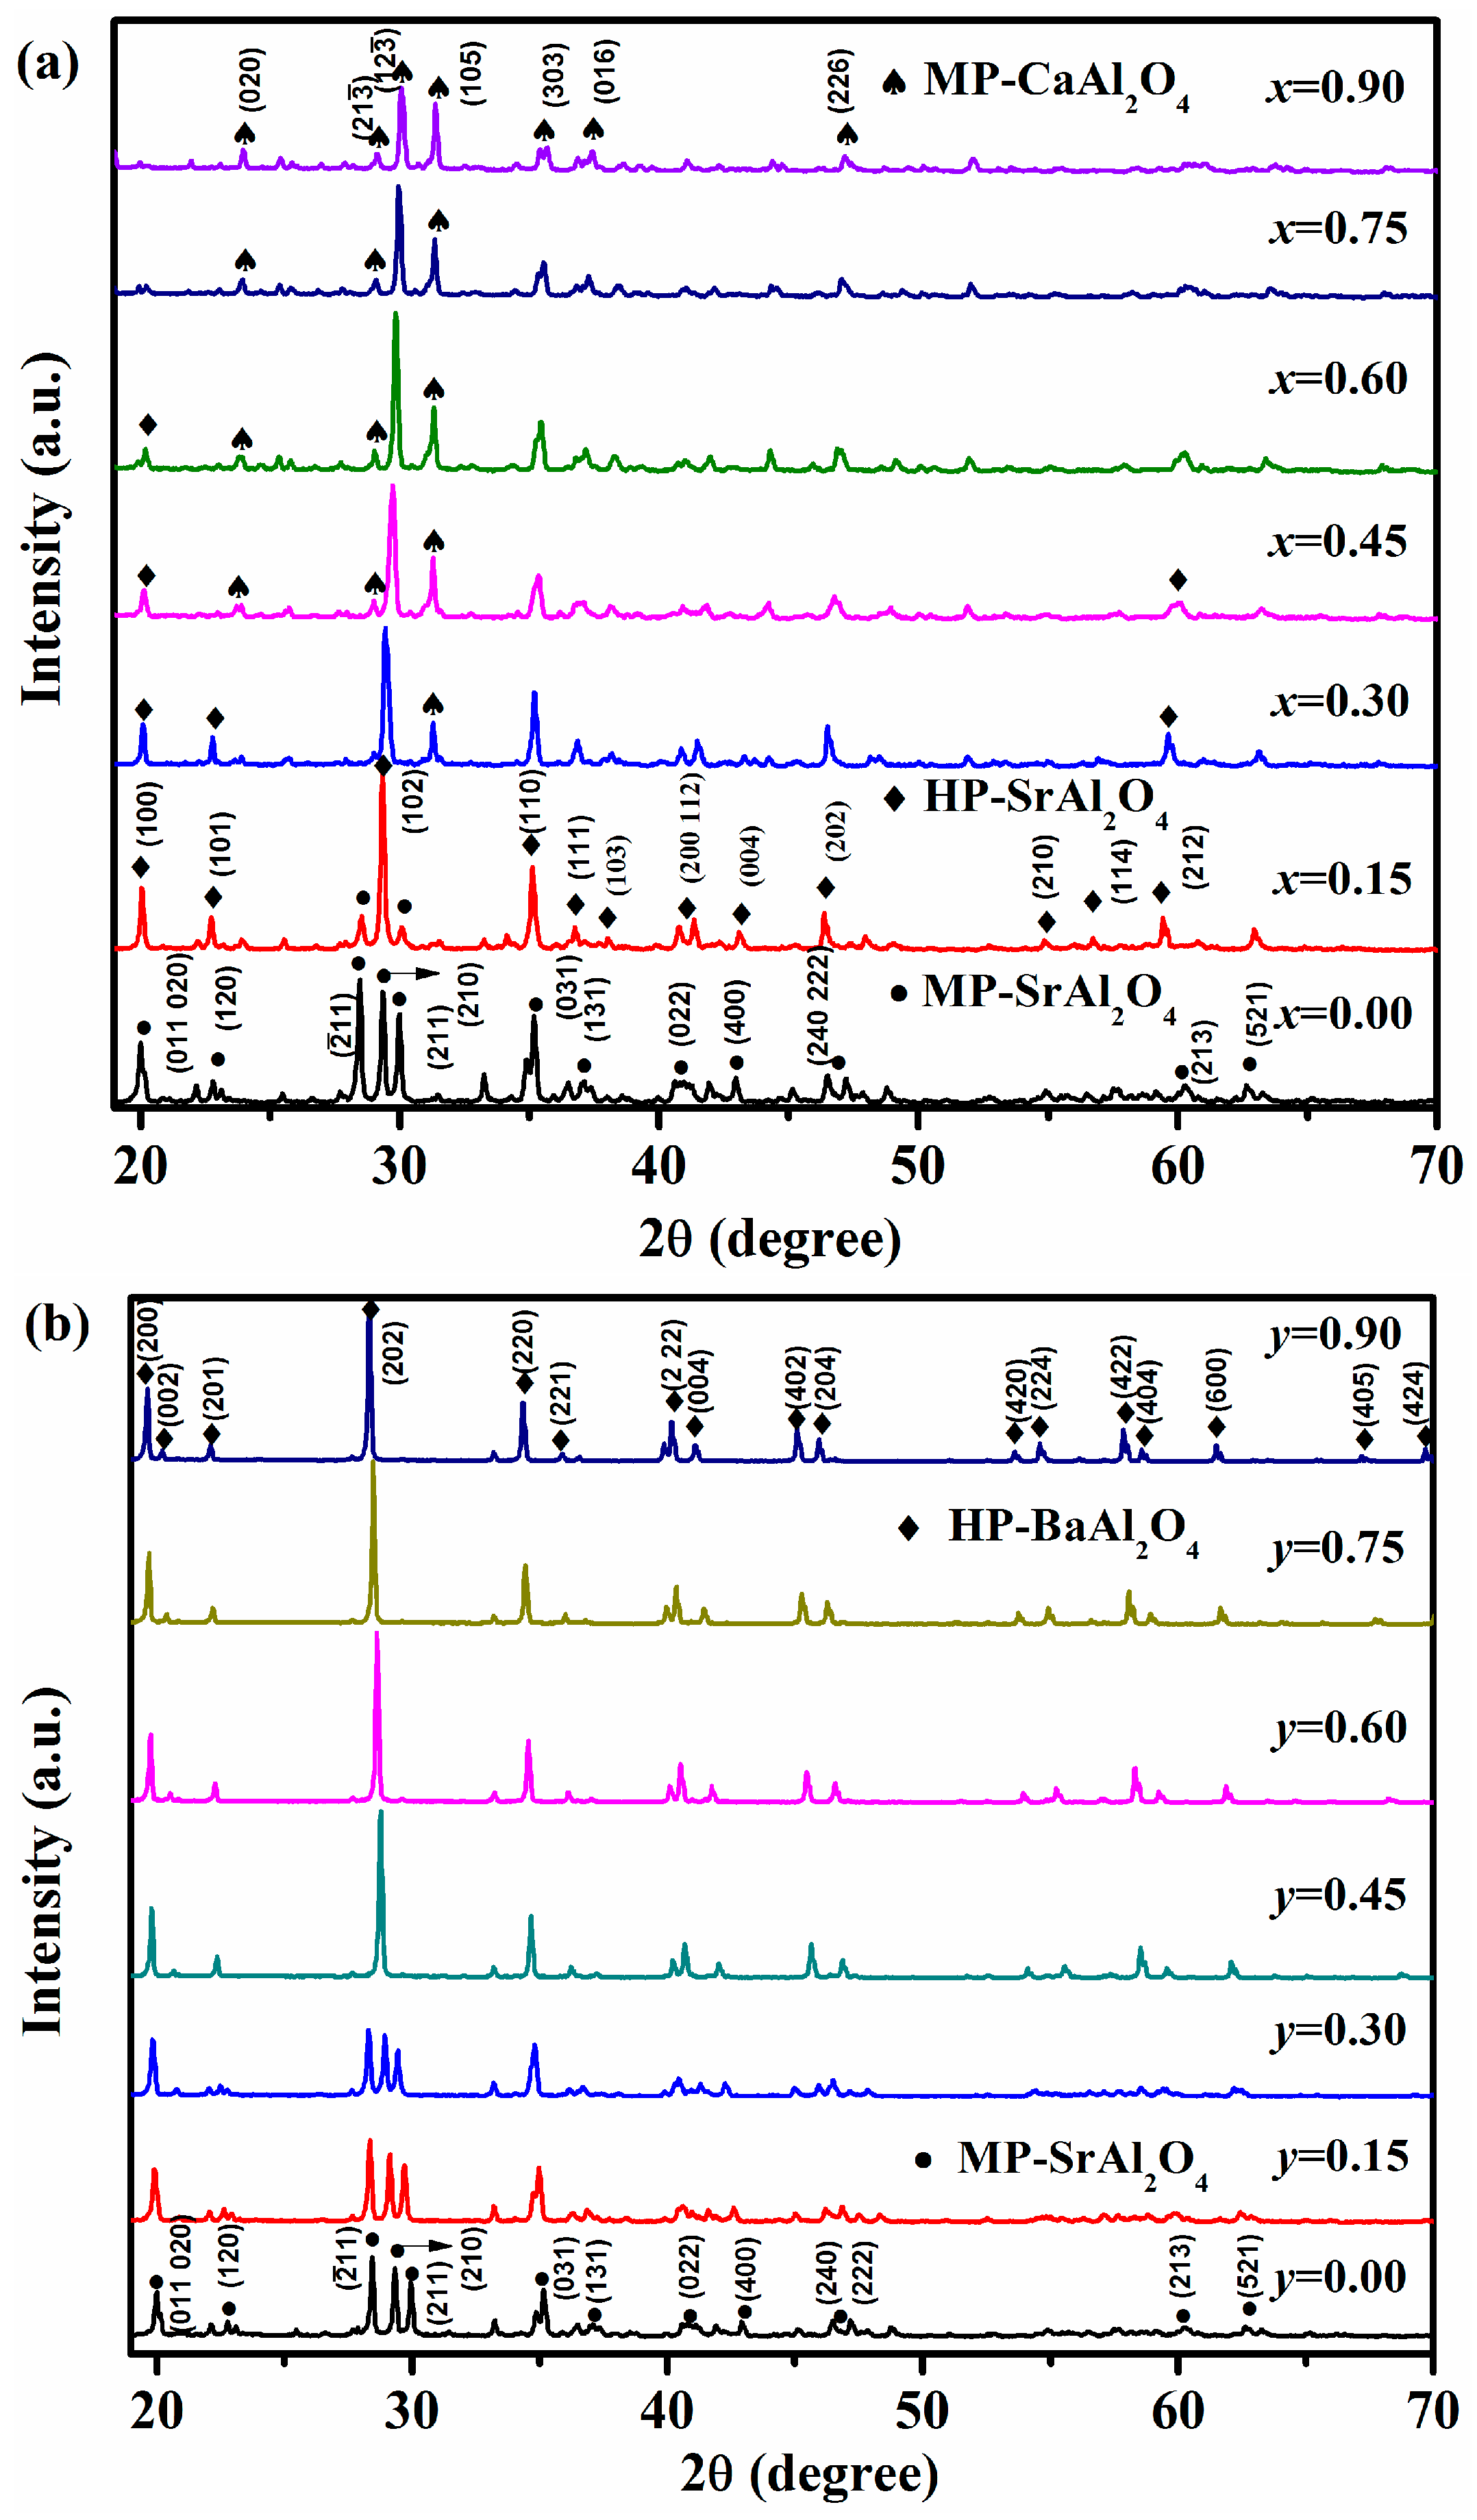
XRD patterns of Sr0.90−xCaxAl2O4:0.05Eu2+, 0.05Dy3+ (x = 0.00–0.90) phosphors with various x values are depicted in Figure 1a. The patterns are compared with the JCPDS standard cards of possible phases and marked with different symbols. For x(Ca2+) = 0.00, the diffraction peaks are well matched with the monoclinic SrAl2O4 (MP-SrAl2O4, JCPDS card No. 74-0794), and minor content of the raw material—Al2O3—is observed due to the incomplete reaction, which is explained by our previous work [4]. For x(Ca2+) = 0.15, the dominant phase is the hexagonal SrAl2O4 (HP-SrAl2O4, JCPDS card No. 31-1336). Thus, the different phase formation from the monoclinic to the hexagonal phase happens in Sr0.90−xCaxAl2O4:Eu2+, Dy3+ phosphors when the substitution of Sr2+ by Ca2+ increases from 0.00 to 0.15. The hexagonal phase remains when x(Ca2+) = 0.30. Simultaneously, the MP-SrAl2O4 disappears and minor content of monoclinic CaAl2O4 phase emerges. The monoclinic CaAl2O4 phase (MP-CaAl2O4, CPDS card No.53-0191) gradually increases with further elevating concentration of Ca2+ from 0.45 to 0.75, accompanying with the decrease of HP-SrAl2O4. For x(Ca2+) = 0.90, the dominant phase isMP-CaAl2O4. In general, as x(Ca2+) varies from 0.00 to 0.90, and the obtained phases can be varied as follows: MP-SrAl2O4 → HP-SrAl2O4 → MP-Cal2O4. Furthermore, it can be concluded that two different phase always coexist due to the cations substitution except for the samples with x(Ca2+) = 0.00 and 0.90. The phase change is different with that of other report under different synthesized condition [13].
Unlike the substitution of Sr2+ by Ca2+ in SrAl2O4:Eu2+, Dy3+ phosphors, there is only the variation from MP-SrAl2O4 to hexagonal BaAl2O4 phase (HP-BaAl2O4, JCPDS card No. 17-0306) during the substitution of Sr2+ by Ba2+. The coexistence of two phases cannot be observed from the XRD data, as displayed in Figure 2b. Specifically, when y(Ba2+) = 0.00–0.30, the crystal structure remains the MP-SrAl2O4. However, as y(Ba2+) = 0.45, the XRD patterns are consistent with the standard HP-BaAl2O4. It remains unchanged while y varies from 0.45 to 0.90, which stems from the small radius of Sr2+ compared to that of Ba2+ and the effect of chemical pressure of Ba2+ on the crystal structure. Therefore, the Sr0.90−yBayAl2O4:0.05Eu2+, 0.05Dy3+ compounds can be regarded as the hexagonal BaAl2O4phase replaced by Sr2+ ions as y(Ba2+) = 0.45–0.90. The different phase formation from MP-SrAl2O4 to HP-BaAl2O4 can be obtained when Sr2+ is replaced by Ba2+ in SrAl2O4:Eu2+, Dy3+ phosphors.
Another finding is that the peaks of the Sr0.90−xCaxAl2O4:0.05Eu2+, 0.05Dy3+ shift toward larger 2θ with Ca2+ concentration increased (x = 0.45–0.90), while the peaks of the Sr0.90−yBayAl2O4:0.05Eu2+, 0.05Dy3+ shift to smaller 2θ when Ba2+ concentration increased (y = 0.00–0.90). Both of these shifts can be explained by the variation of crystal lattice due to the different ionic radius of Ca2+, Sr2+, and Ba2+ ions of 0.114 nm, 0.123 nm and 0.134 nm, respectively [13,17]. Therefore, when Sr2+ is replaced by Ca2+, the crystal lattice of SrAl2O4 phase will shrink. On the contrary, it will expand when Sr2+ is substituted by Ba2+. Therefore, the difference in the ionic radius leads to the shifts of the diffraction peaks.
3.2. Luminescence Properties of Sr0.09−xCaxAl2O4:0.05Eu2+, 0.05Dy3+ and Sr0.90−yBayAl2O4:0.05Eu2+, 0.05Dy3+ Phosphors
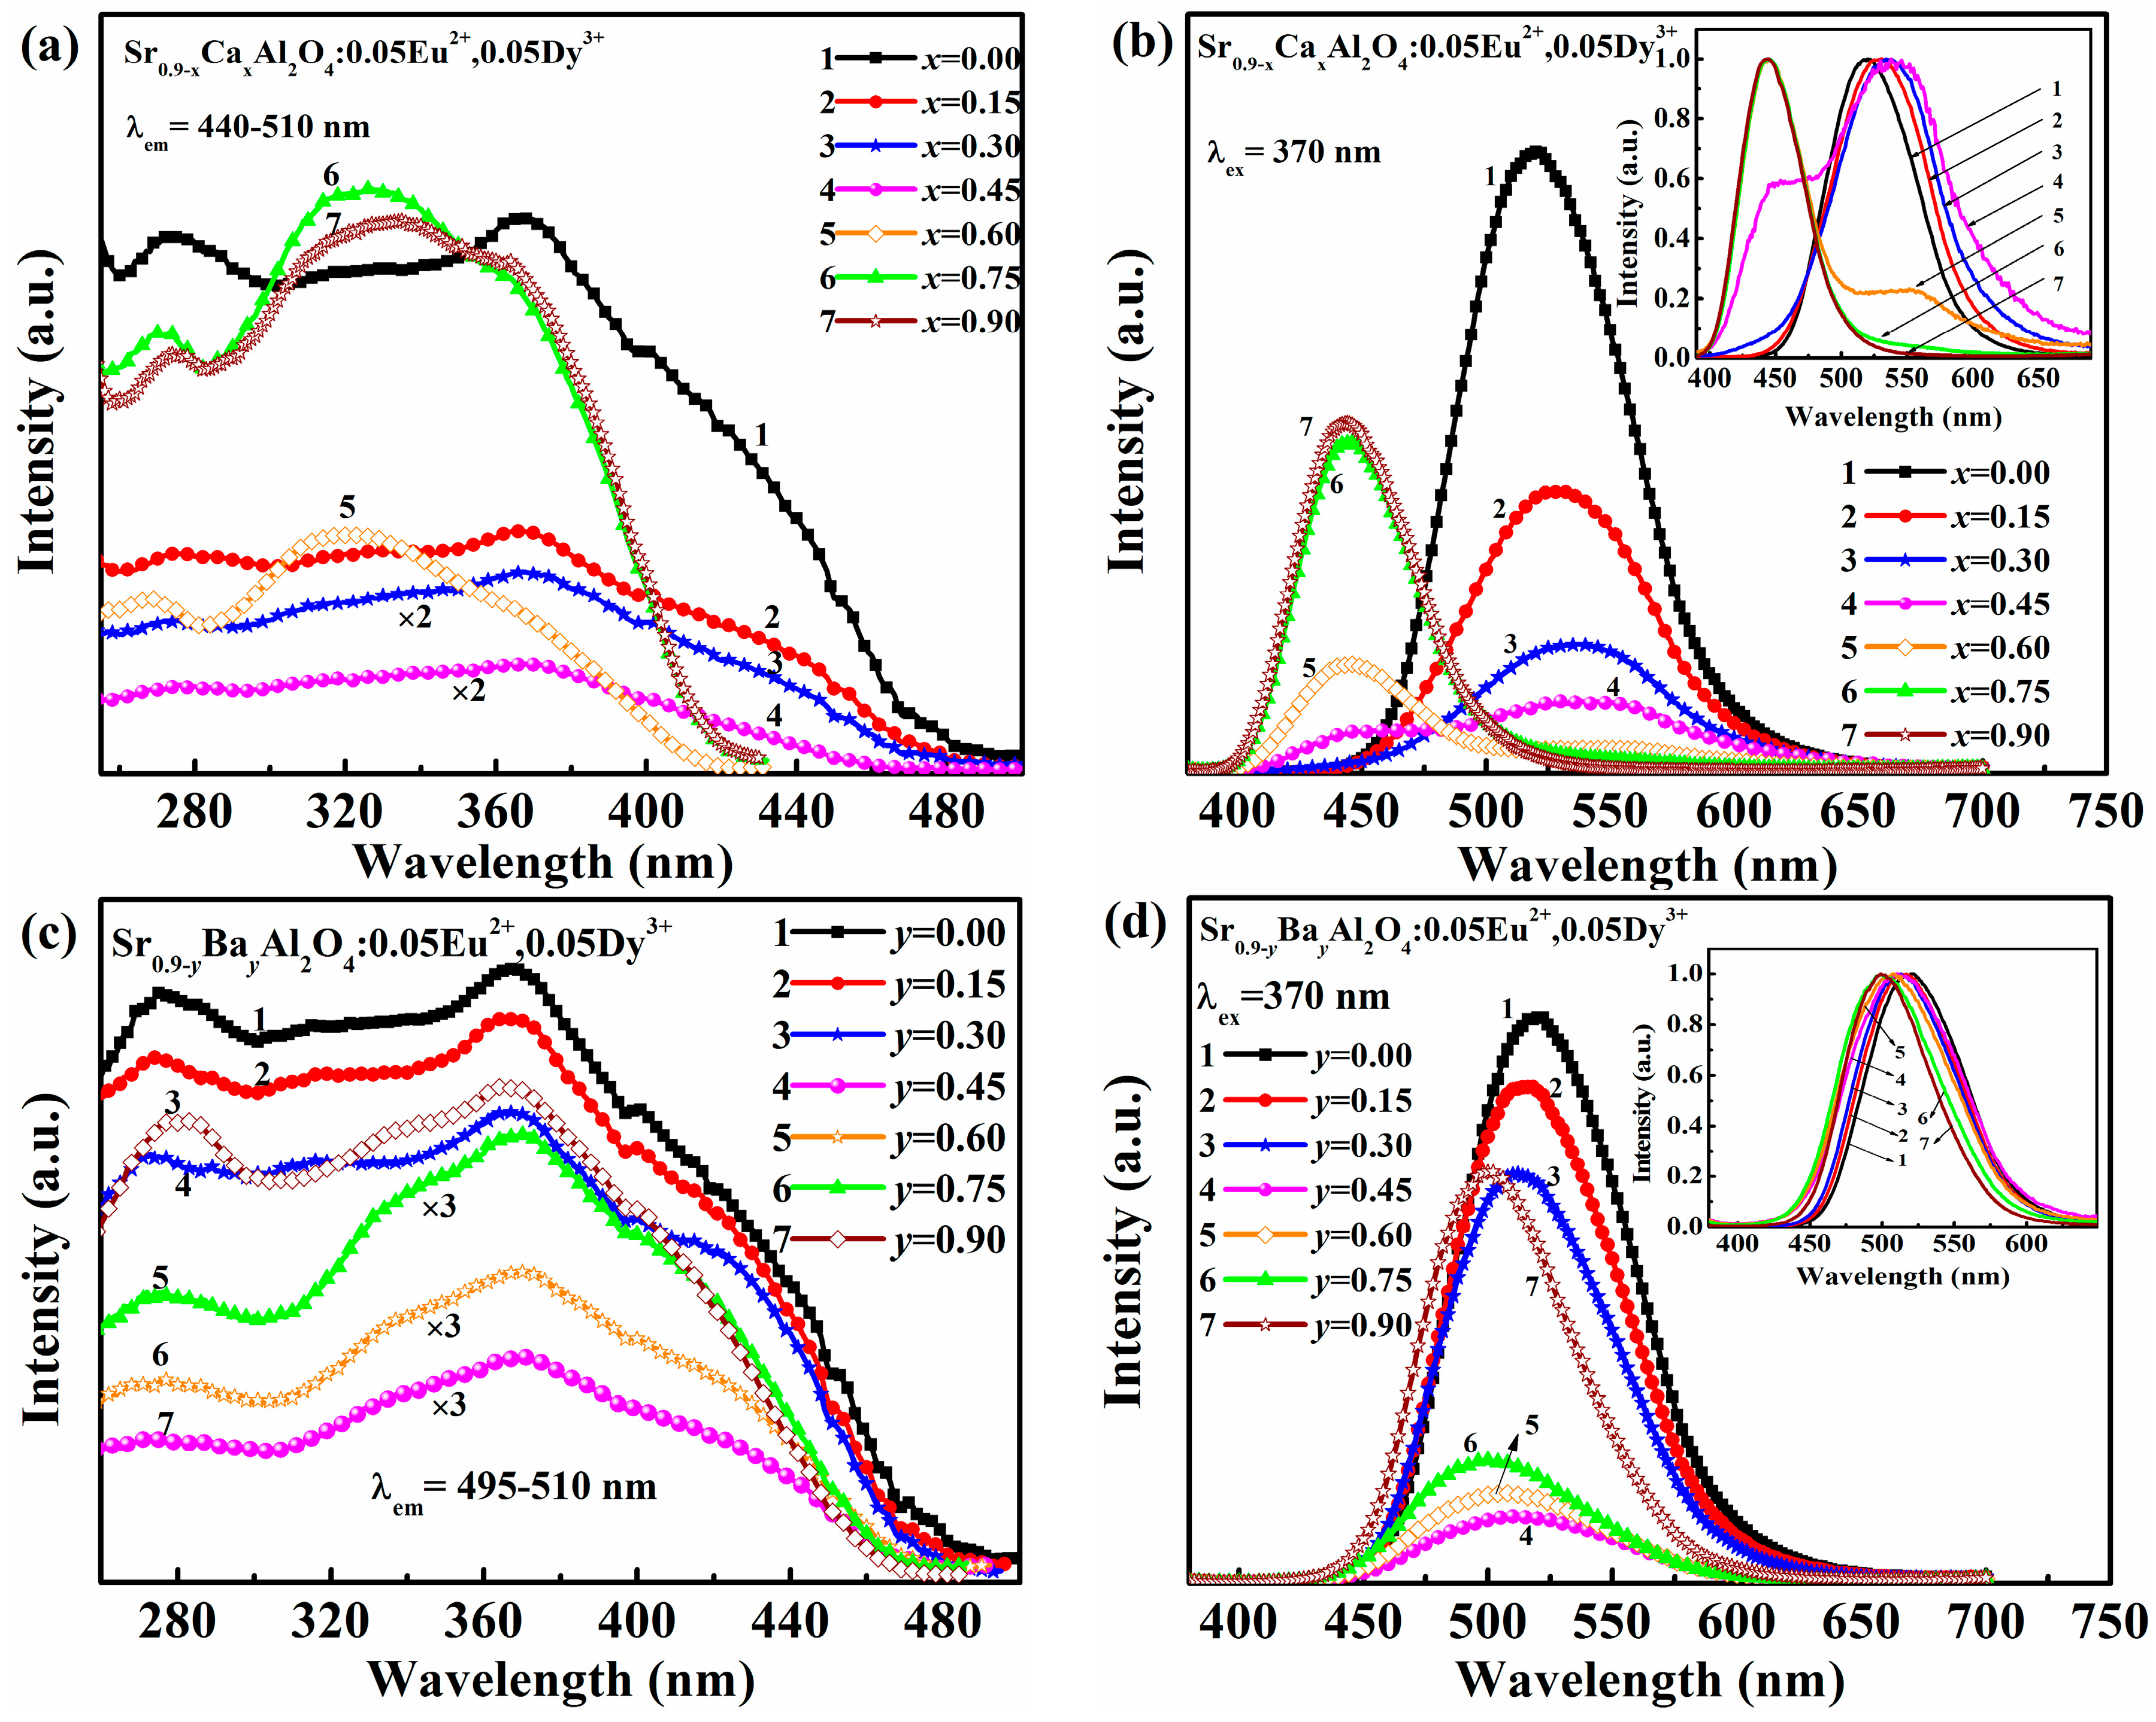
Figure 2 illustrates the emission and excitation spectra of Sr0.90−xCaxAl2O4:0.05Eu2+, 0.05Dy3+ and Sr0.90−yBayAl2O4:0.05 Eu2+, 0.05Dy3+ phosphors with x(y) ranged from 0.00 to 0.90. The excitation spectra of Sr0.90−xCaxAl2O4:0.05Eu2+, 0.05Dy3+ phosphors are depicted in Figure 2a with monitoring the emission of Eu2+ in the range of 440–510 nm. All samples present broad bands from 250 nm to 450 nm due to 4f7→4f65d1 transitions of Eu2+ ions [18]. The shape of excitation bands almost remain unchanged while the intensity decreases when x value (x= 0.00–0.45) increases. However, it should be noted that excitation bands are different from those of x < 0.60. The excitation bands of Sr0.90−xCaxAl2O4:0.05Eu2+, 0.05Dy3+ (x = 0.60–0.90) are similar and blue-shift, which is ascribed to the phase variation as discussed in XRD analysis. Figure 2b shows the emission spectra of Sr0.90−xCaxAl2O4:0.05Eu2+, 0.05Dy3+ phosphors. It can be divided into three sections (x = 0–0.30, x = 0.45–0.60, x = 0.75–0.90). Interestingly, these results are related to the phase transition. First, the luminescence intensity decreases and the emission peak shifts from 520 nm to 538 nm as x varied from 0.00 to 0.30. Second, two emission peaks around 450 nm, 540 nm at x = 0.45–0.60 are observed due to the coexistence of heterogeneous mixtures of two structures. Finally, the emission spectrum presents a single peak around 444 nm when x value increased from 0.75 to 0.90, while the dominant phase is monoclinic CaAl2O4.
The excitation and emission spectra of Sr0.90−yBayAl2O4:0.05Eu2+, 0.05Dy3+ phosphors are displayed in Figure 2c,d. The excitation spectra show similar outlines with two broad bands around 275 nm, 375 nm and a shoulder around 420 nm. The broad emission bands originate from the typical transitions of 4f7 → 4f65d1 of Eu2+ ions, which are affected by the crystal field of host lattice [19]. The emission band shifts to a shorter wavelength from 520 nm to 500 nm as y(Ba2+) increased. It can be explained that the crystal field splitting energy is decreased due to the phase change of the substation of Sr2+ by the larger Ba2+ ions. However, the luminescence intensity decreases when Ba2+ content is 0.00–0.45, while it increases when Ba2+ content is 0.60–0.90.These changes match very well with the XRD results mentioned above and can be ascribed to Eu2+ emission in different phase.
The CIE chromaticity coordinates calculated from the spectra of Sr0.90−xCaxAl2O4:0.05Eu2+, 0.05Dy3+ and Sr0.9-yBayAl2O4:0.05Eu2+, 0.05Dy3+ phosphors with varied x (or y) values are presented in Figure 3 and Table 1. These results show that the CIE color coordinates of SrAl2O4:Eu2+, Dy3+ phosphors can be tuned by Ca2+ or Sr2+ content. For Sr0.90−xCaxAl2O4:0.05Eu2+, 0.05Dy3+ phosphors, the color coordinates can be changed from green (0.2393, 0.5874, point M) to blue (0.1531, 0.0528, point A) area with x increased. In addition, the color coordinates of Sr0.9−yBayAl2O4:0.05Eu2+, 0.05Dy3+ phosphors have a little shift from green (0.2399, 0.5867, point M) to bluish green (0.1652, 0.4645, point B) area. The above discussion indicates that the emission color of SrAl2O4:Eu2+, Dy3+ can be tuned due to the phase change of the substitution of Sr2+ with Ca2+ or Ba2+ ions. It is an important challenge to tune the color of phosphors for improving the color rendering index of w-LEDs [20,21,22].
3.3. Decay Characteristics
The photoluminescence decay curves of SrAl2O4:Eu2+, Dy3+ phosphors with varied Ca2+ and Ba2+ content are shown in Figure 4a,b, respectively. The figures reveal the initial luminous intensity is different when Sr2+ is replaced by either Ca2+ or Ba2+ in SrAl2O4:Eu2+, Dy3+.Among these phosphors, Sr0.90Al2O4:0.05Eu2+, 0.05Dy3+ has the highest initial luminous intensity. The initial luminous intensity gradually decreases when the content of Ca2+(Ba2+) increased to 0.45. By further increasing the Ca2+ or Ba2+ concentration, the initial luminous intensity enhances. The variation of initial luminous intensity is consistent with the emission spectra, which can be explained by the change of crystal structure.
Moreover, the decay process of all samples is composed of fast decay, medium decay and subsequent of slow decay, which is consistent with our previous report. The decay curves of Ca0.90Al2O4:0.05Eu2+, 0.05Dy3+, Sr0.90Al2O4:0.05Eu2+, 0.05Dy3+, and Ba0.90Al2O4:0.05Eu2+, 0.05Dy3+ phosphors are fitted as representatives, which are presented in Figure 4c. The decay curves are well fitted with the following triple exponential functions:
where t is the time, I0 and I is the luminescence intensity at initial time and t, respectively. A, B and C are constants. 1, 2, and 3 are the decay time for the exponential components, respectively. The average lifetimes can be obtained as follows. The detail parameters are listed in Table 2.
On the basis of the Equation (2), the average lifetime (average) of SrAl2O4:Eu2+, Dy3+ phosphors with varied Ca2+ and Ba2+ contents are determined and shown in Figure 4d, respectively. The order of the average lifetimes is Sr0.90Al2O4:0.05Eu2+, 0.05Dy3+ > Ca0.90Al2O4:0.05Eu2+, 0.05Dy3+ > Ba0.90Al2O4:0.05Eu2+, 0.05Dy3+. The average lifetimes of Sr0.90−xCaxAl2O4:0.05Eu2+, 0.05Dy3+ phosphors vary with the change of Ca2+ content, and the maximum is about 1088.5 ms at x = 0.45. It could be ascribed to the complicate formation of the phase in Figure 1. Furthermore, the average lifetimes of Sr0.90−yBayAl2O4:0.05Eu2+, 0.05Dy3+ phosphors gradually decrease with Ba2+ content increased due to the different phase formation and reach the shortest time of 219.91 ms at y = 0.90, demonstrating that the average lifetime or decay characteristics of SrAl2O4:Eu2+. Dy3+ could be adjusted by the partial substitution of Ba2+, Ca2+. The results also indicate that the tuned lifetimes are more suitable for the application in AC-LEDs as the global widely utilize 50/60 Hz alternating current with a 5–20 ms dark duration.
3.4. Application of SrAl2O4:Eu2+, Dy3+ Phosphors with Varied Contents of Ca2+ and Ba2+ in LEDs
Finally, phosphors converted LEDs were fabricated with silicone, near UV-chips (~365 nm, 395 nm), Sr0.90−xCaxAl2O4:0.05Eu2+, 0.05Dy3+, and Sr0.90−yBayAl2O4:0.05Eu2+, 0.05Dy3+ phosphors. The phosphors account for 20% of the mass of silicone.
Figure 5 is the electroluminescence spectra of the as-fabricated LEDs based on Sr0.90−xCaxAl2O4:0.05Eu2+, 0.05Dy3+ phosphors and near UV Ga(In)N chips. In the Figure 4a, the shapes of all electroluminescence spectra in the as-fabricated LEDs are similar with the photoluminescence emission spectra of Sr0.90−xCaxAl2O4:0.05Eu2+, 0.05Dy3+ phosphors because the near UV around 365 nm of chips is completely absorbed by phosphors. Figure 5b depicts that the emission band located at 395 nm belongs to the UV-chips. And other emission bands are ascribed to Eu2+ emissions excited by 395 nm UV-chips. The results prove that the Sr0.90−xCaxAl2O4:0.05Eu2+, 0.05Dy3+ fluorescence materials can absorb the light with wavelength of 365 nm or 395 nm, and convert it into green or blue visible-light. The CIE color coordinates of as-fabricated LEDs are calculated and listed in Table 3. The inset of Figure 5 presents the chromaticity diagram of the as-fabricated LEDs based on SrAl2O4:Eu2+, Dy3+ phosphors, which can be tuned from green to blue area and are similar with that of phosphors. In addition, the luminous efficiency is also systematically investigated under 20 mA forward-bias current in this work, as indicated in Figure 5c. The luminous efficiency of the as-fabricated LEDs with 395 nm is higher than in the case of 365 nm UV chips. However, for both kinds of LEDs fabricated by 365 nm and 395 nm UV-chips, the luminous efficiency decreases strongly, then increases slowly with Ca2+ content elevated. The maximum luminous efficiency is 11.24 lm/W for 365 nm LEDs and 35.35 lm/W for 395 nm LEDs (x = 0).
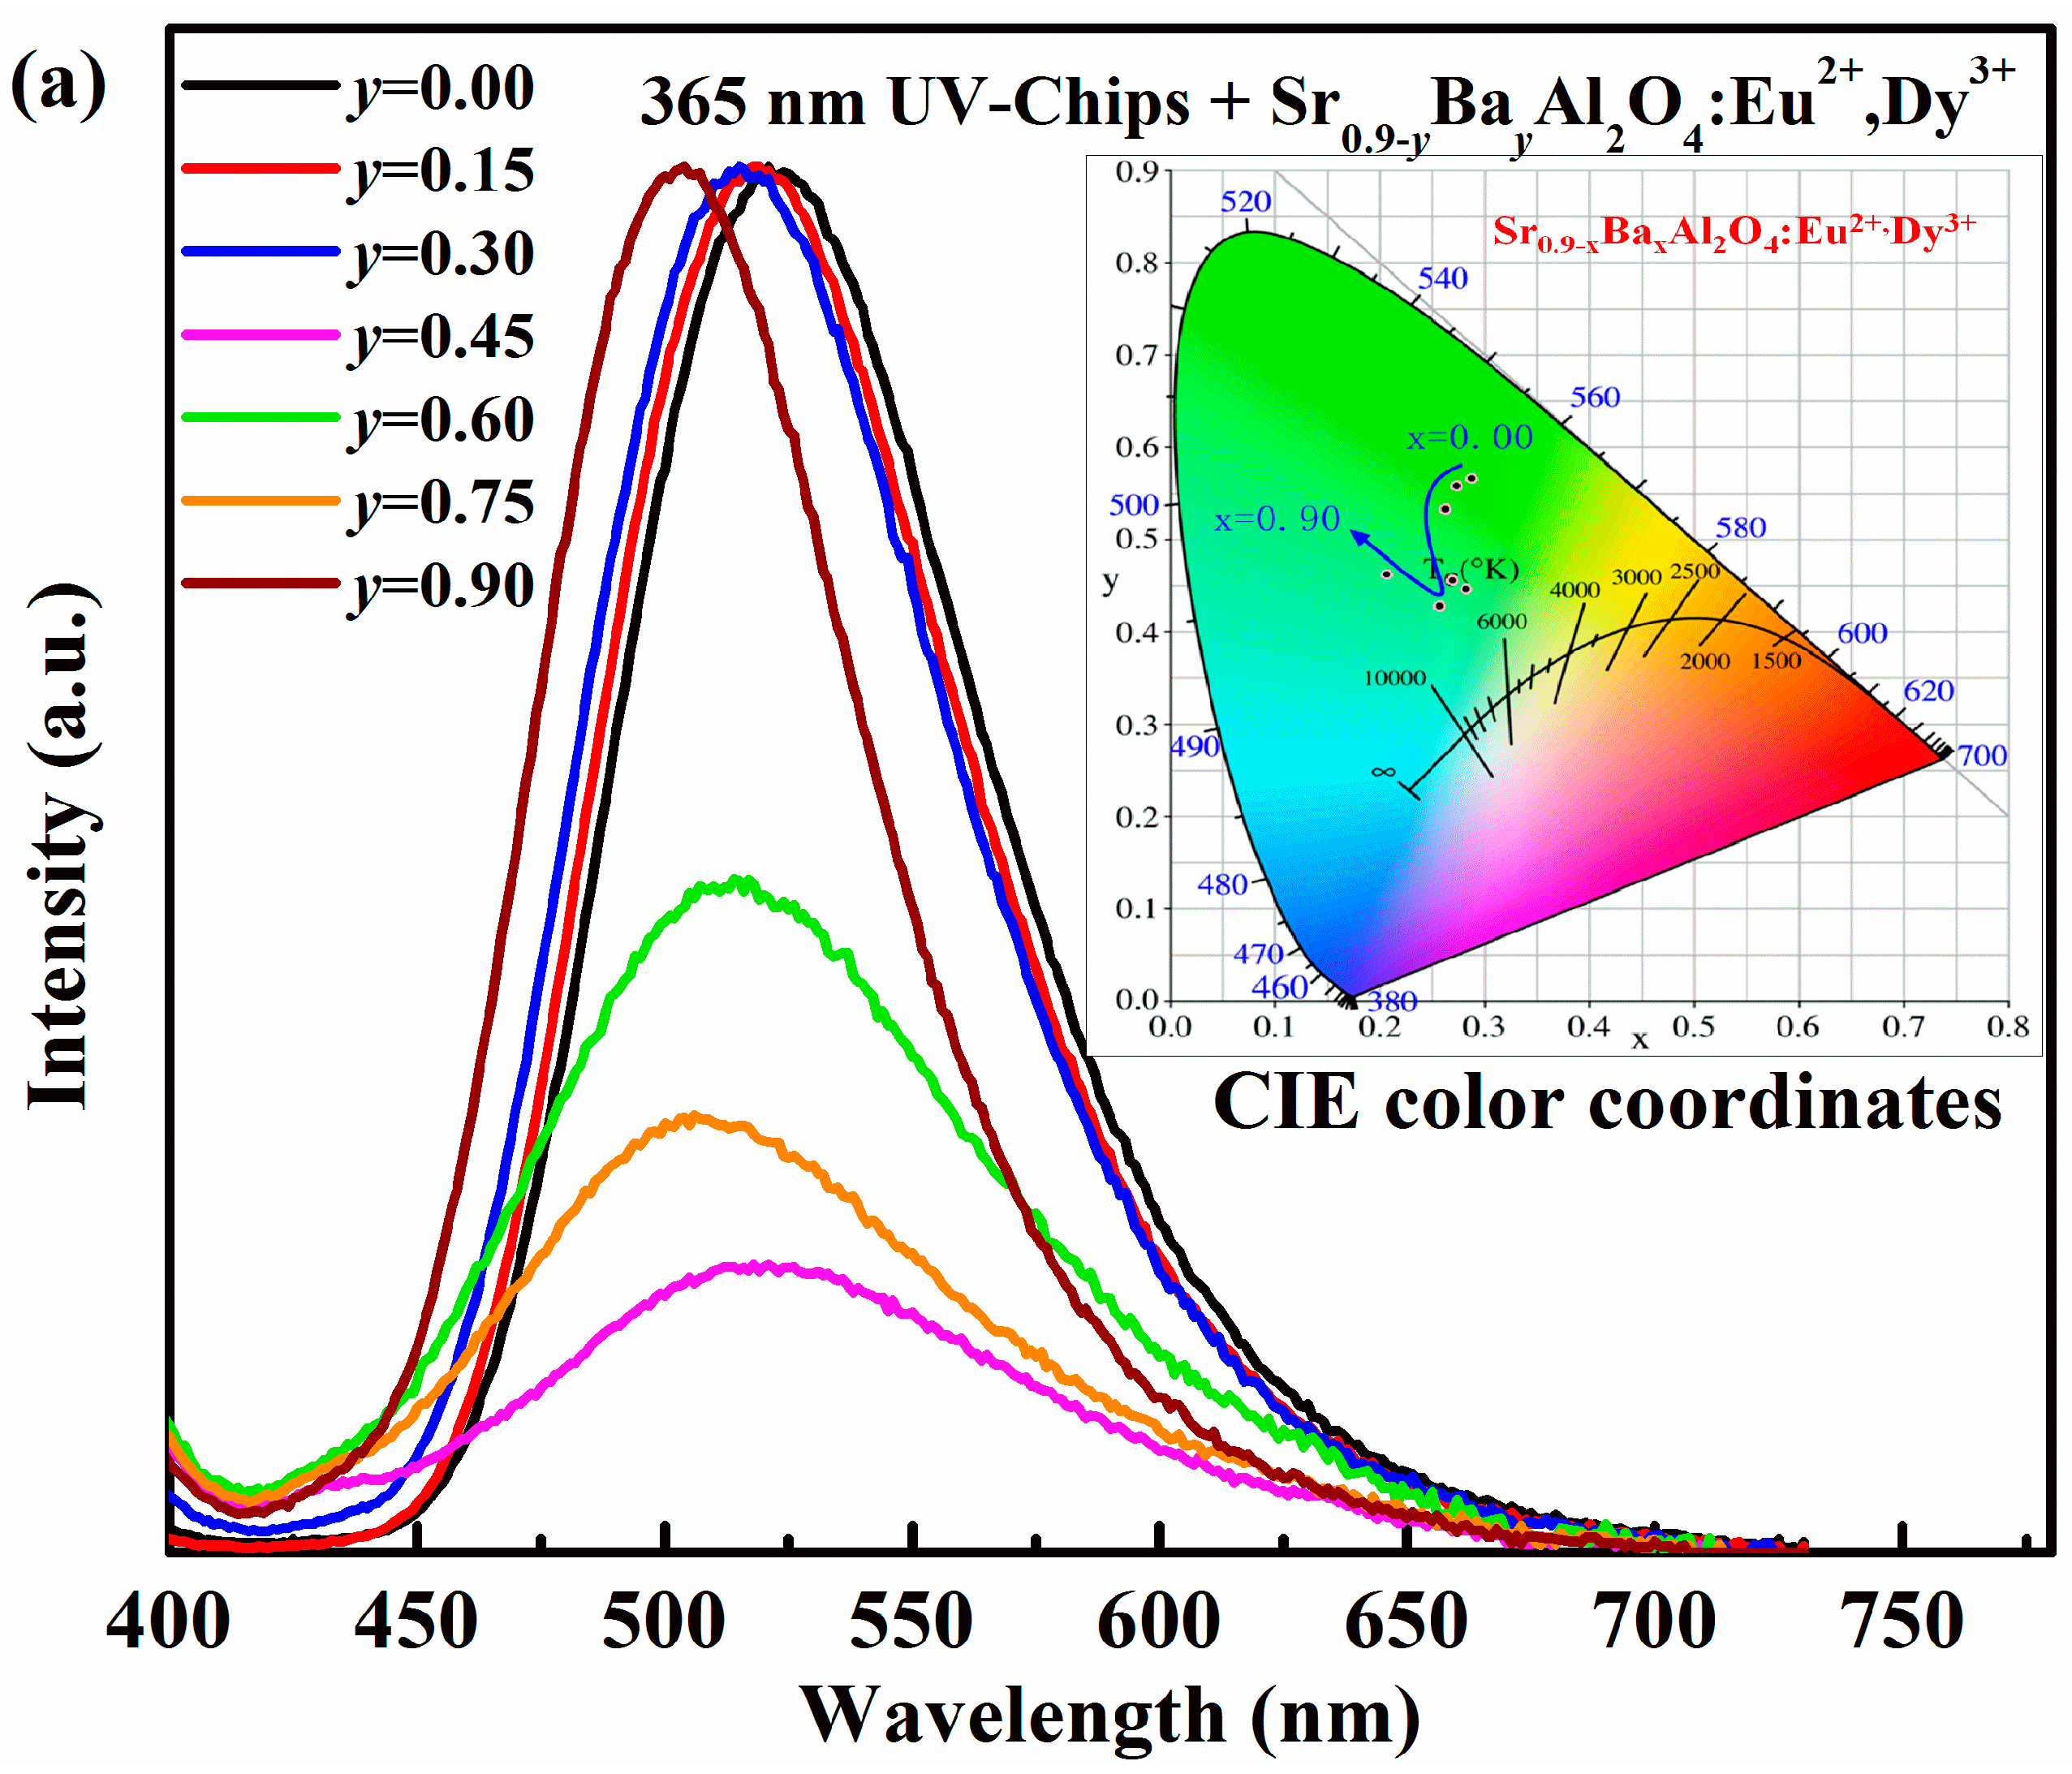
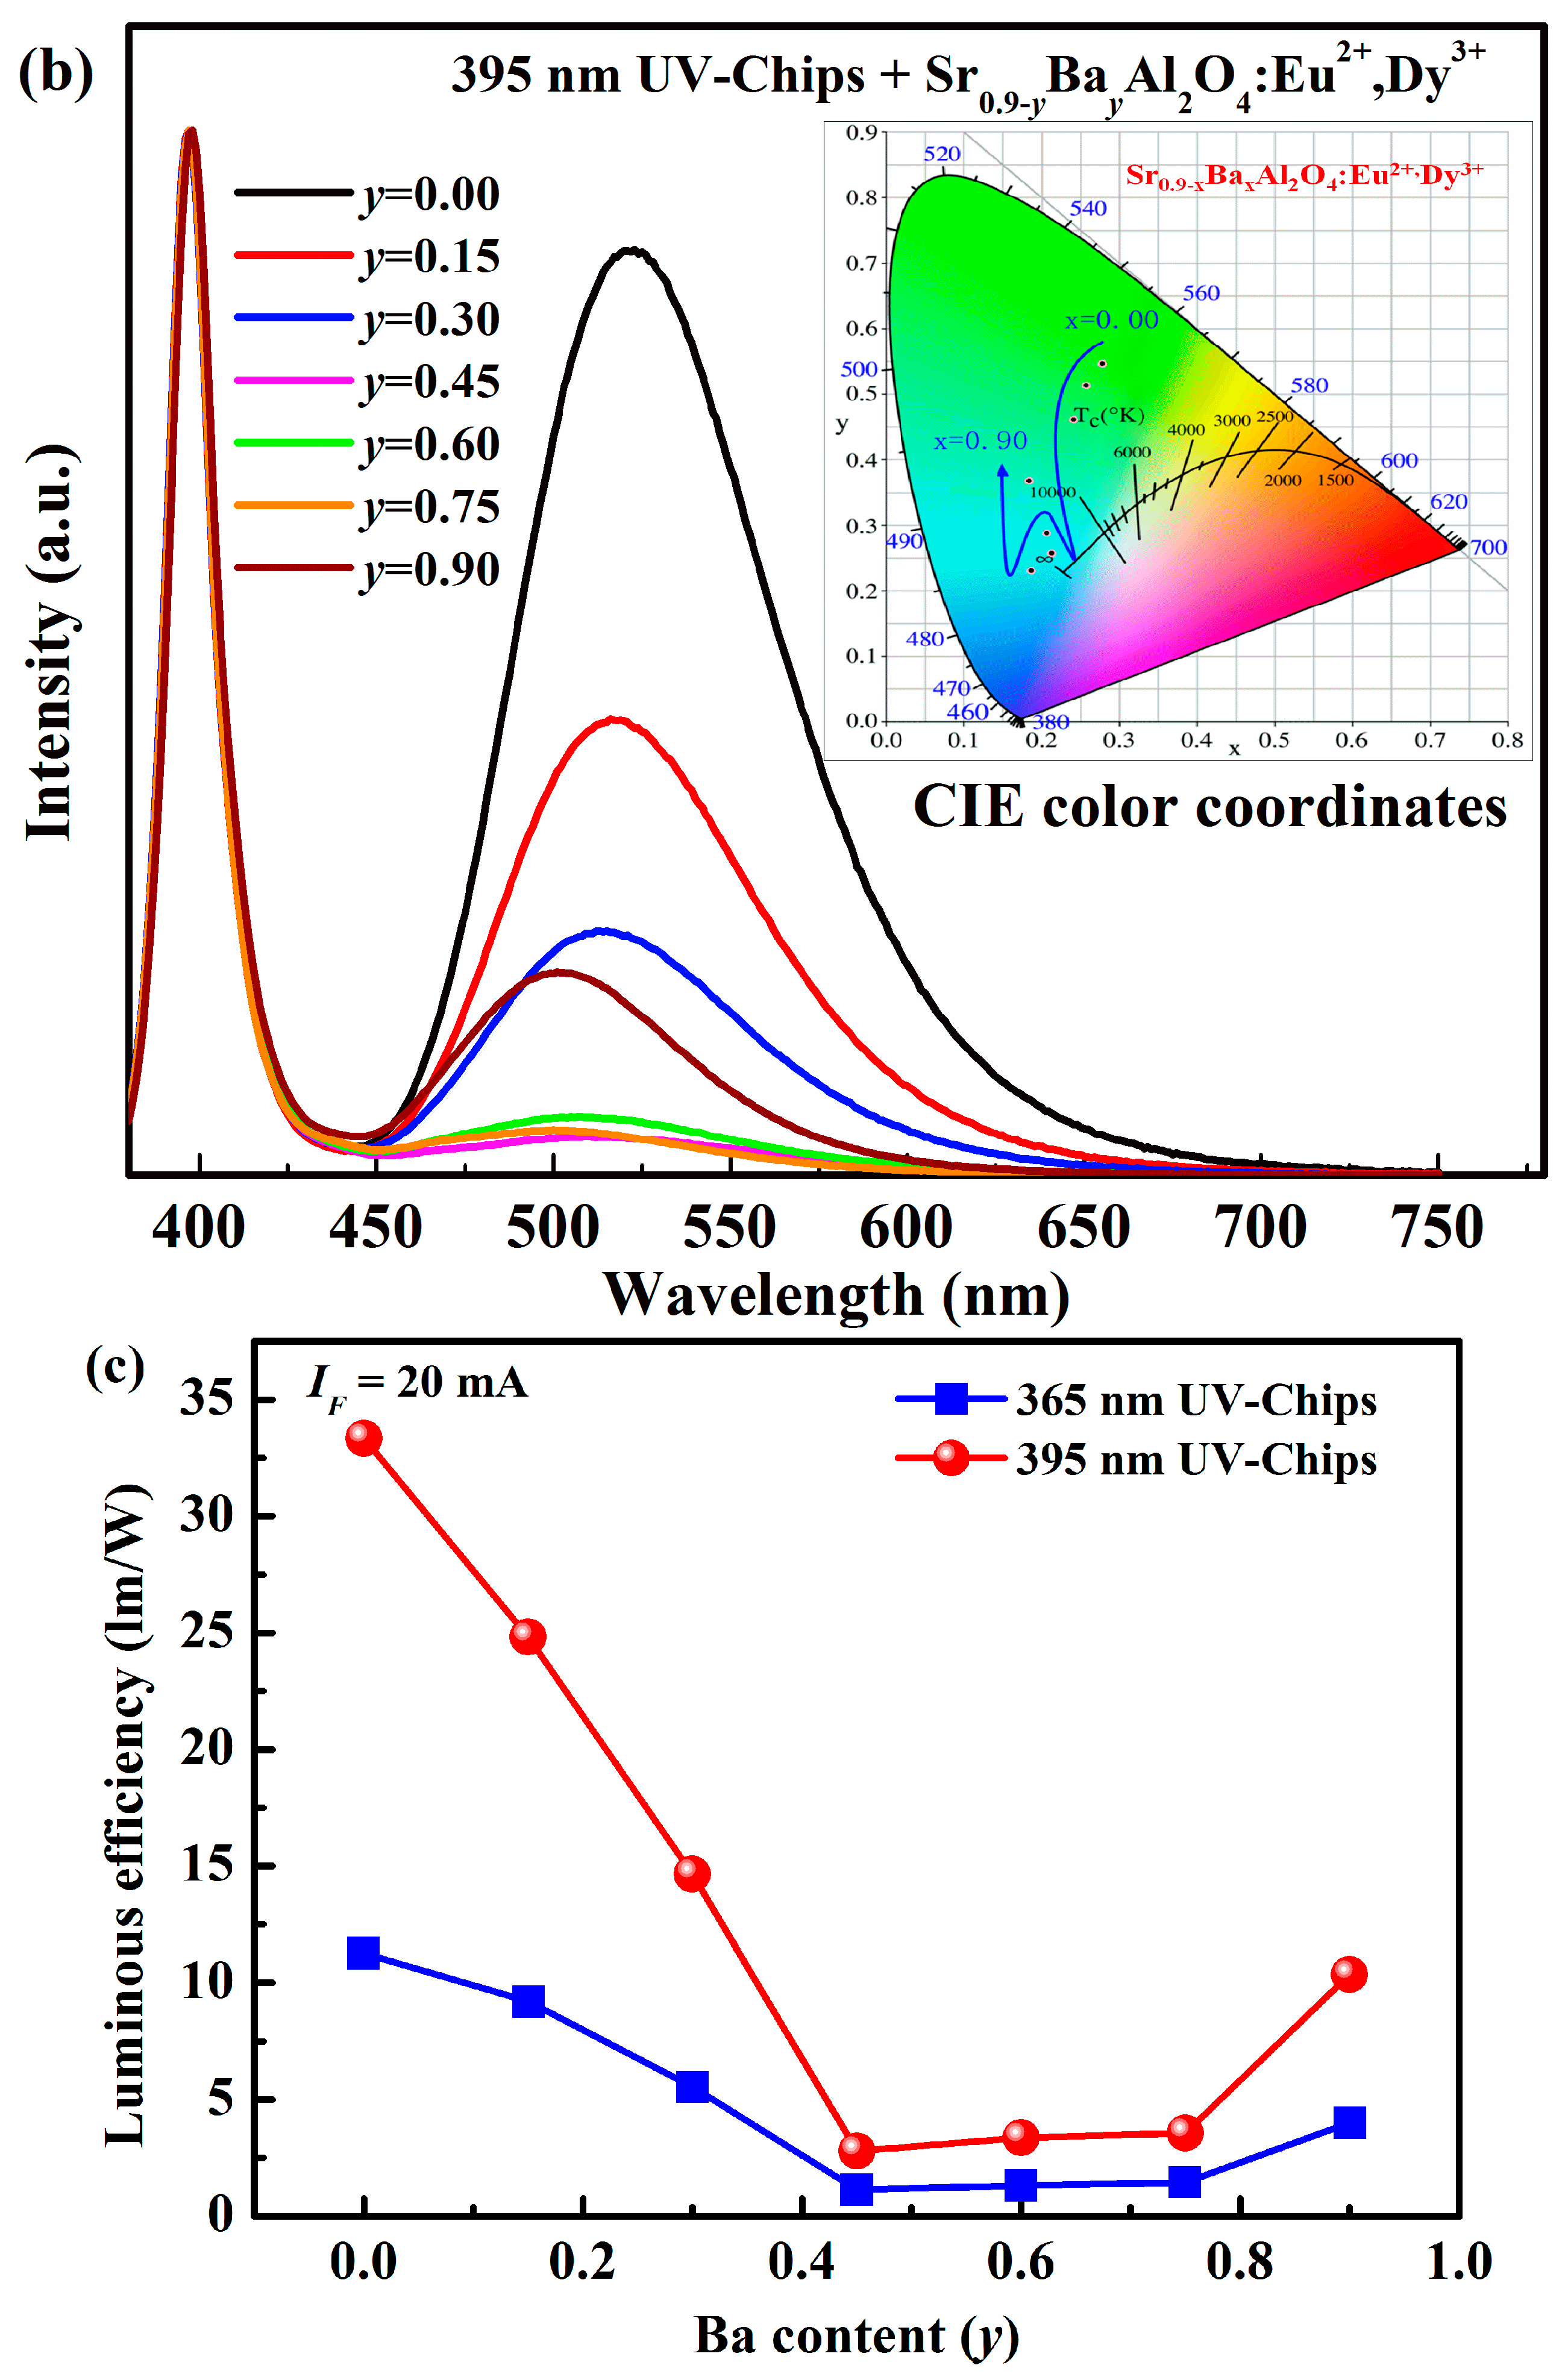
The electroluminescence spectra of LEDs based on Sr0.90−xBaxAl2O4:0.05Eu2+, 0.05Dy3+ phosphors are also investigated, as shown in Figure 6.Except emission peaks of the UV chip itself, all of the electroluminescence spectra of Sr0.90−yBayAl2O4:0.05Eu2+, 0.05Dy3+ excited by both 365 nm and 395 nm UV-chips are similar. It indicates that the Sr0.9-yBayAl2O4:Eu2+, Dy3+ phosphors can absorb 365 nm or 395 nm emission from Ga(N)In chips, and convert it into green or blue-green visible-light. The CIE color coordinates of the as-fabricated LEDs are calculated and listed in Table 4. By varying Ba2+ concentrations, the color of the as-fabricated LEDs can be tuned, but the adjustable zone is narrower than in the case of Ca2+. It suggests that the color coordinates of pc-LEDs cannot be influenced by near UV Ga(In)N chips. However, the luminous efficiency decreases at first, and then increases with Ba2+ content enhanced. The maximum luminous efficiency is 11.26 lm/W for 365 nm LEDs and 33.34 lm/W for 395 nm LEDs (y = 0). The variation of luminous efficiency of the as-fabricated LED is also consistent with the emission spectra due to the different phase formation.
4. Conclusions
Sr0.90−xCaxAl2O4:0.05Eu2+, 0.05Dy3+ and Sr0.90−yBayAl2O4:0.05Eu2+, 0.05Dy3+ (x or y = 0.00, 0.15, 0.30, 0.45, 0.60, 0.75, 0.90) phosphors were synthesized. The variation of optical properties for the phosphors is ascribed to the phase structures. For the series of Sr0.90−xCaxAl2O4:0.05Eu2+, 0.05Dy3+ phosphors, two heterogeneous structures coexist, except the samples with x(Ca2+) = 0.00 and 0.90. The emission color of SrAl2O4:Eu2+, Dy3+ phosphor can be adjusted largely from green to blue, and the lifetime can also be tuned largely from 1088.5 ms to 521.6 ms. For Sr0.90−yBayAl2O4:0.05Eu2+, 0.05Dy3+ phosphors, the phase transforms from monoclinic SrAl2O4 to hexagonal BaAl2O4 phase. Meanwhile, the emission wavelength shifts from 520 nm to 500 nm, and the color slightly changes from green to blue-green. More importantly, the average lifetime of SrAl2O4:Eu2+, Dy3+ can be shortened from 842.04 ms to 219.91 ms, which can appropriately compensate for the AC time gap. Finally, the LEDs are successfully fabricated by combining the phosphors with Ga(In)N UV-chips. The maximum of luminous efficiency reaches 33.34 lm/W based on SrAl2O4:Eu2+, Dy3+ phosphors.
Acknowledgments
This work is supported by the Science and Technology Projects of Guangdong Province (2015A090905010); Cultivation Fund of Outstanding Young Teachers in Higher Education of Guangdong Province (YQ2015161); Innovative Research Team in University of Guangdong (2015KCXTD027) and Science Foundation for Young Teachers of Wuyi University (2014td01).
Author Contributions
X.H. and M.Z. conceived and designed the experiments; Q.X. and B.L. performed the experiments; Y.C. and Q.Z. analyzed the data; M.Z. wrote the paper; X.H. revised the paper.
Conflicts of Interest
The authors declare no conflict of interest.
References
- Suh, Y.; Kim, M.; Ahn, C.-H. Novel flicker migration and EMI noise reduction circuit for AC direct LED lightings. J. Electr. Eng. Technol. 2017, 12, 874–879. [Google Scholar] [CrossRef]
- Yeh, C.-W.; Li, Y.; Wang, J.; Liu, R.-S. Appropriate green phosphor of SrSi2O2N2:Eu2+, Mn2+ for AC LEDs. Opt. Express 2012, 20, 18031–18043. [Google Scholar] [CrossRef] [PubMed]
- Lin, H.; Wang, B.; Xu, J.; Zhang, R.; Chen, H.; Yu, Y.; Wang, Y. Phosphor-in-glass for high-powered remote-type white AC-LED. ACS Appl. Mater. Interfaces 2014, 6, 21264–21269. [Google Scholar] [CrossRef] [PubMed]
- Li, B.; Zhang, J.; Zhang, M.; Long, Y.; He, X. Effects of SrCl2 as a flux on the structural and luminescent properties of SrAl2O4:Eu2+, Dy3+ phosphors for AC-LEDs. J. Alloys Compd. 2015, 651, 497–502. [Google Scholar] [CrossRef]
- Chen, L.; Zhang, Y.; Liu, F.; Luo, A.; Chen, Z.; Jiang, Y.; Chen, S.; Liu, R.-S. A new green phosphor of SrAl2O4:Eu2+, Ce3+, Li+ for alternating current driven light-emitting diodes. Mater. Res. Bull. 2012, 47, 4071–4075. [Google Scholar] [CrossRef]
- Tan, J.; Narendran, N. Defining phosphor luminescence property requirements for white AC LED flicker reduction. J. Lumin. 2015, 167, 21–26. [Google Scholar] [CrossRef]
- Chen, L.; Zhang, Y.; Xue, S.; Deng, X.; Luo, A.; Liu, F.; Jiang, Y.; Chen, S.; Bahader, A. The green phosphor SrAl2O4:Eu2+, R3+ (R = Y, Dy) and its application in alternating current light-emitting diodes. Funct. Mater. Lett. 2013, 6. [Google Scholar] [CrossRef]
- Rojas-Hernandez, R.E.; Rubio-Marcos, F.; Enríquez, E.; De La Rubia, M.A.; Fernandez, J.F. A low-energy milling approach to reduce particle size maintains the luminescence of strontium aluminates. RSC Adv. 2015, 5, 42559–42567. [Google Scholar] [CrossRef]
- Nagamani, S.; Panigrahi, B.S. Luminescence properties of SrO-Al2O3:Eu2+, Dy3+ prepared at different temperatures. J. Am. Ceram. Soc. 2010, 93, 3832–3836. [Google Scholar] [CrossRef]
- Rahimi, M.R.; Yun, G.J.; Doll, G.L.; Choi, J.S. Effects of persistent luminescence decay on mechanoluminescence phenomena of SrAl2O4:Eu2+, Dy3+ materials. Opt. Lett. 2013, 38, 4134–4137. [Google Scholar] [CrossRef] [PubMed]
- Timilsina, S.; Lee, K.H.; Kwon, Y.N.; Kim, J.S.; Reimanis, I. Optical evaluation of in situ crack propagation by using mechanoluminescence of SrAl2O4:Eu2+, Dy3+. J. Am. Ceram. Soc. 2015, 98, 2197–2204. [Google Scholar] [CrossRef]
- Katsumata, T.; Toyomane, S.; Sakai, R.; Komuro, S.; Morikawa, T. Trap levels in Eu-doped SrAl2O4 phosphor crystals co-doped with rare-earth elements. J. Am. Ceram. Soc. 2006, 89, 932–936. [Google Scholar] [CrossRef]
- Liu, C.; Wang, Y.; Hu, Y.; Chen, R.; Liao, F. Adjusting luminescence properties of SrxCa1−xAl2O4:Eu2+, Dy3+ phosphors by Sr/Ca ratio. J. Alloy. Compd. 2009, 470, 473–476. [Google Scholar] [CrossRef]
- Xie, W.; Quan, J.; Wu, H.; Shao, L.; Zou, C.; Zhang, J.; Shi, X.; Wang, Y. Structure and luminescence properties of SrAl2O4:Eu2+, Dy3+ by Ba2+ and Ca2+ co-doping. J. Alloys Compd. 2012, 514, 97–102. [Google Scholar] [CrossRef]
- Das, S.; Yang, C.-Y.; Lin, H.-C.; Lu, C.-H. Structural and luminescence properties of tunable white-emitting Sr0.5Ca0.5Al2O4:Eu2+, Dy3+ for UV-excited white-LEDs. RSC Adv. 2014, 4, 64956–64966. [Google Scholar] [CrossRef]
- Shi, W.S.; Yamada, H.; Nishikubo, K.; Kusaba, H.; Xu, C.N. Novel structural behavior of strontium aluminate doped with europium. J. Electrochem. Soc. 2004, 151, H97–H100. [Google Scholar] [CrossRef]
- Ju, S.H.; Kim, S.G.; Choi, J.C.; Park, H.L.; Mho, S.I.; Kim, T.W. Determination of the solid solubility of SrAl2O4 in CaAl2O4 through crystal field-dependent Eu2+ signatures. Mater. Res. Bull. 1999, 34, 1905–1909. [Google Scholar] [CrossRef]
- Pololla, F.C.; Levine, A.K.; Tomkus, M.R. Fluorescent properties of alkaline earth aluminates of the type MAl2O4 activated by divalent europium. J. Electrochem. Soc. 1968, 115, 642–644. [Google Scholar] [CrossRef]
- Nazarov, M.; Brik, M.G.; Spassky, D.; Tsukerblat, B. Crystal field splitting of 5d states and luminescence mechanism in SrAl2O4:Eu2+ phosphor. J. Lumin. 2017, 182, 79–86. [Google Scholar] [CrossRef]
- Bachmann, V.; Ronda, C.; Oeckler, O.; Schnick, W.; Meijerink, A. Color point tuning for (Sr, Ca, Ba)Si2O2N2:Eu2+ for white light LEDs. Chem. Mater. 2009, 21, 316–325. [Google Scholar] [CrossRef]
- Ye, S.; Xiao, F.; Pan, Y.X.; Ma, Y.Y.; Zhang, Q.Y. Phosphors in phosphor-converted white light-emitting diodes: Recent advances in materials, techniques and properties. Mater. Sci. Eng. R Rep. 2010, 71, 1–34. [Google Scholar] [CrossRef]
- Sommer, C.; Hartmann, P.; Pachler, P.; Hoschopf, H.; Wenzl, F.P. The phosphor’s optical properties—Chromaticity coordinate relationship of phosphor converted white LEDs. Opt. Quantum Electron. 2011, 44, 111–117. [Google Scholar] [CrossRef]
Figure 1.
(a) X-ray powder diffraction (XRD) patterns of Sr0.90−xCaxAl2O4:0.05Eu2+, 0.05Dy3+ phosphors with various x (x = 0.00, 0.15, 0.30, 0.45, 0.60, 0.75, 0.90); (b) XRD patterns of Sr0.90−yBayAl2O4:0.05Eu2+, 0.05Dy3+ phosphors with various y (y = 0.00, 0.15, 0.30, 0.45, 0.60, 0.75, 0.90).
Figure 1.
(a) X-ray powder diffraction (XRD) patterns of Sr0.90−xCaxAl2O4:0.05Eu2+, 0.05Dy3+ phosphors with various x (x = 0.00, 0.15, 0.30, 0.45, 0.60, 0.75, 0.90); (b) XRD patterns of Sr0.90−yBayAl2O4:0.05Eu2+, 0.05Dy3+ phosphors with various y (y = 0.00, 0.15, 0.30, 0.45, 0.60, 0.75, 0.90).

Figure 2.
(a) Excitation and (b) emission spectra of Sr0.90−xCaxAl2O4:0.05Eu2+, 0.05Dy3+ phosphors with varied x values (Inset is the normalized emission spectra of); (c) excitation and (d) emission spectra of Sr0.90−yBayAl2O4:0.05Eu2+, 0.05Dy3+ phosphors with varied y values (Inset is the normalized emission spectra).

Figure 3.
CIE chromaticity diagram of Sr0.90−xCaxAl2O4:0.05Eu2+, 0.05Dy3+ and Sr0.90−yBayAl2O4:0.05Eu2+, 0.05Dy3+ phosphors with various x (or y) values (x, y= 0.00–0.90).
Figure 3.
CIE chromaticity diagram of Sr0.90−xCaxAl2O4:0.05Eu2+, 0.05Dy3+ and Sr0.90−yBayAl2O4:0.05Eu2+, 0.05Dy3+ phosphors with various x (or y) values (x, y= 0.00–0.90).

Figure 4.
(a) Photoluminescence decay curves of Sr0.90−xCaxAl2O4:0.05Eu2+, 0.05Dy3+ with various x(Ca2+) (λex = 370 nm λem = 440–510 nm); (b) photoluminescence decay curves of Sr0.90−yBayAl2O4:0.05Eu2+, 0.05Dy3+ with various y(Ba2+) (λex = 370 nm λem = 495–510 nm); (c) normalized decay and fitted curves of phosphors (Ca0.90Al2O4:0.05Eu2+, 0.05Dy3+, Sr0.90Al2O4:0.05Eu2+, 0.05Dy3+, Ba0.90Al2O4:0.05Eu2+, 0.05Dy3+); (d) average lifetimes of Sr0.90−xCaxAl2O4:0.05Eu2+, 0.05Dy3+, and Sr0.90−yBayAl2O4:0.05Eu2+, 0.05Dy3+.
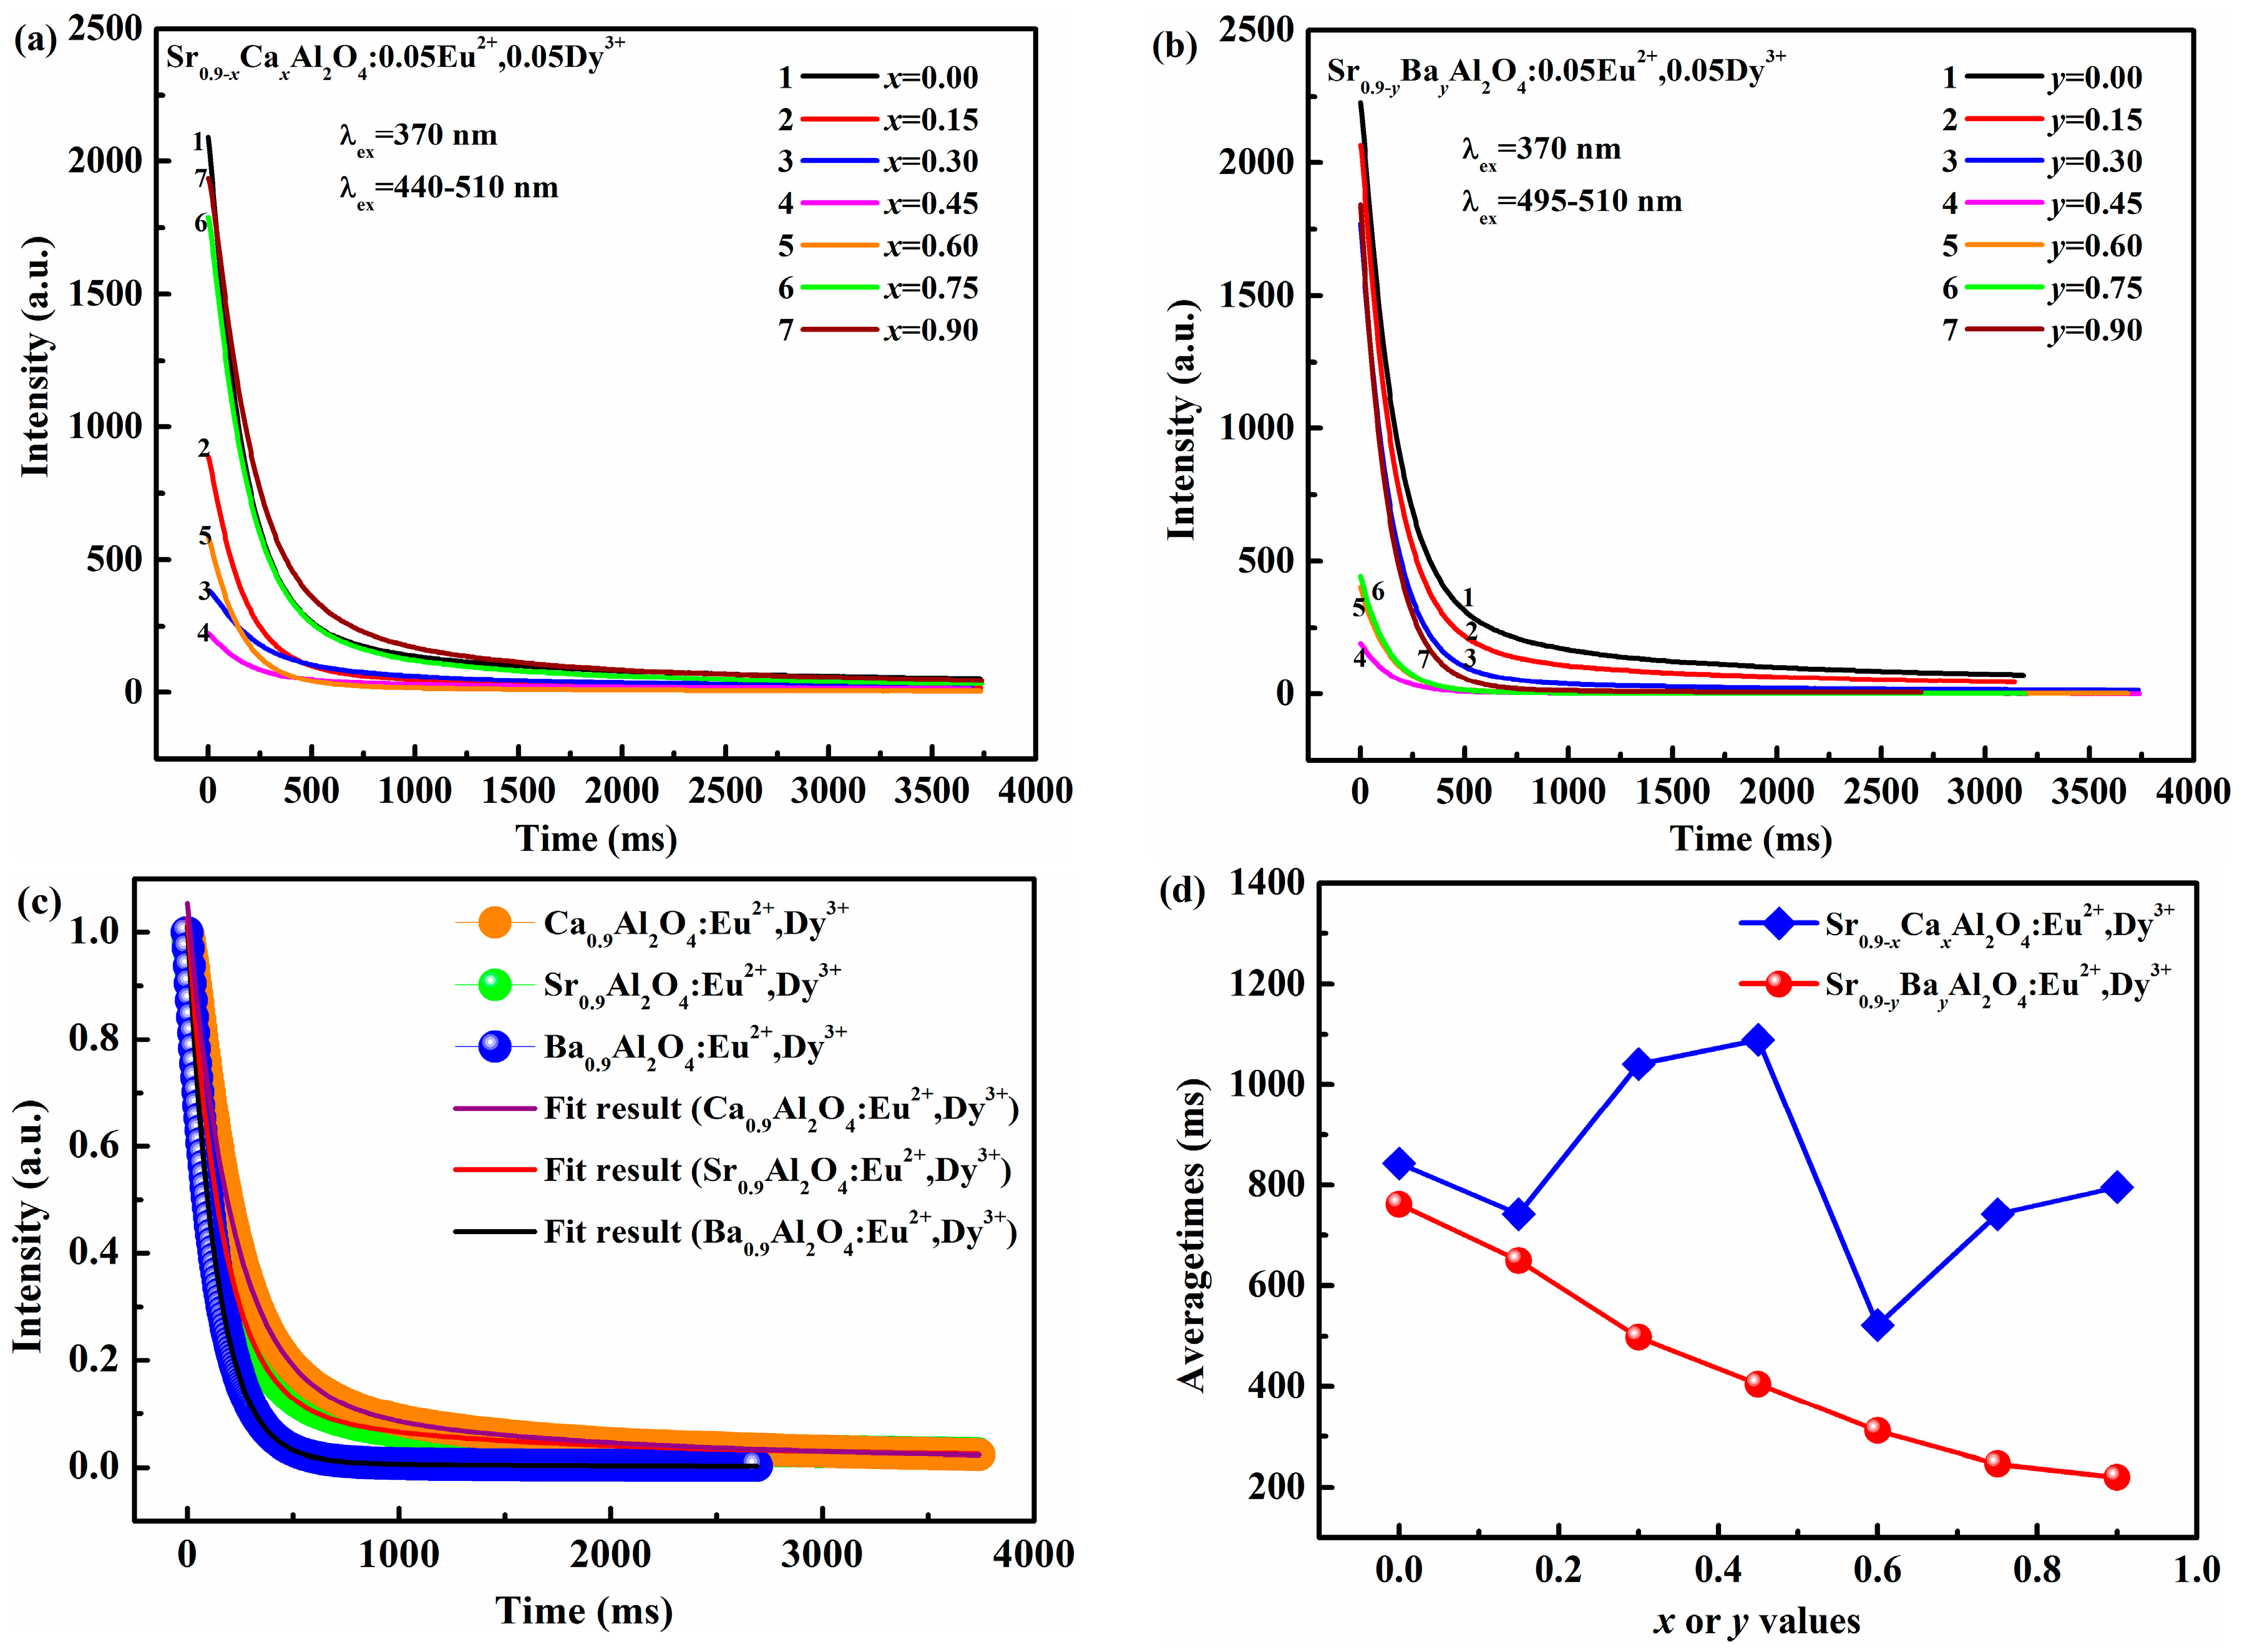
Figure 5.
Electroluminescence spectra of the as-fabricated LEDs based on UV chip and Sr0.90−xCaxAl2O4:0.05Eu2+, 0.05Dy3+ phosphors under 20 mA forward-bias current (i.e., IF = 20 mA). Inset is chromaticity diagram of the as-fabricated LEDs: (a) 365 nm UV chip; (b) 395 nm UV-chip; (c) Luminous efficiency of as-fabricated LEDs with different Ca2+ content under IF = 20 mA.
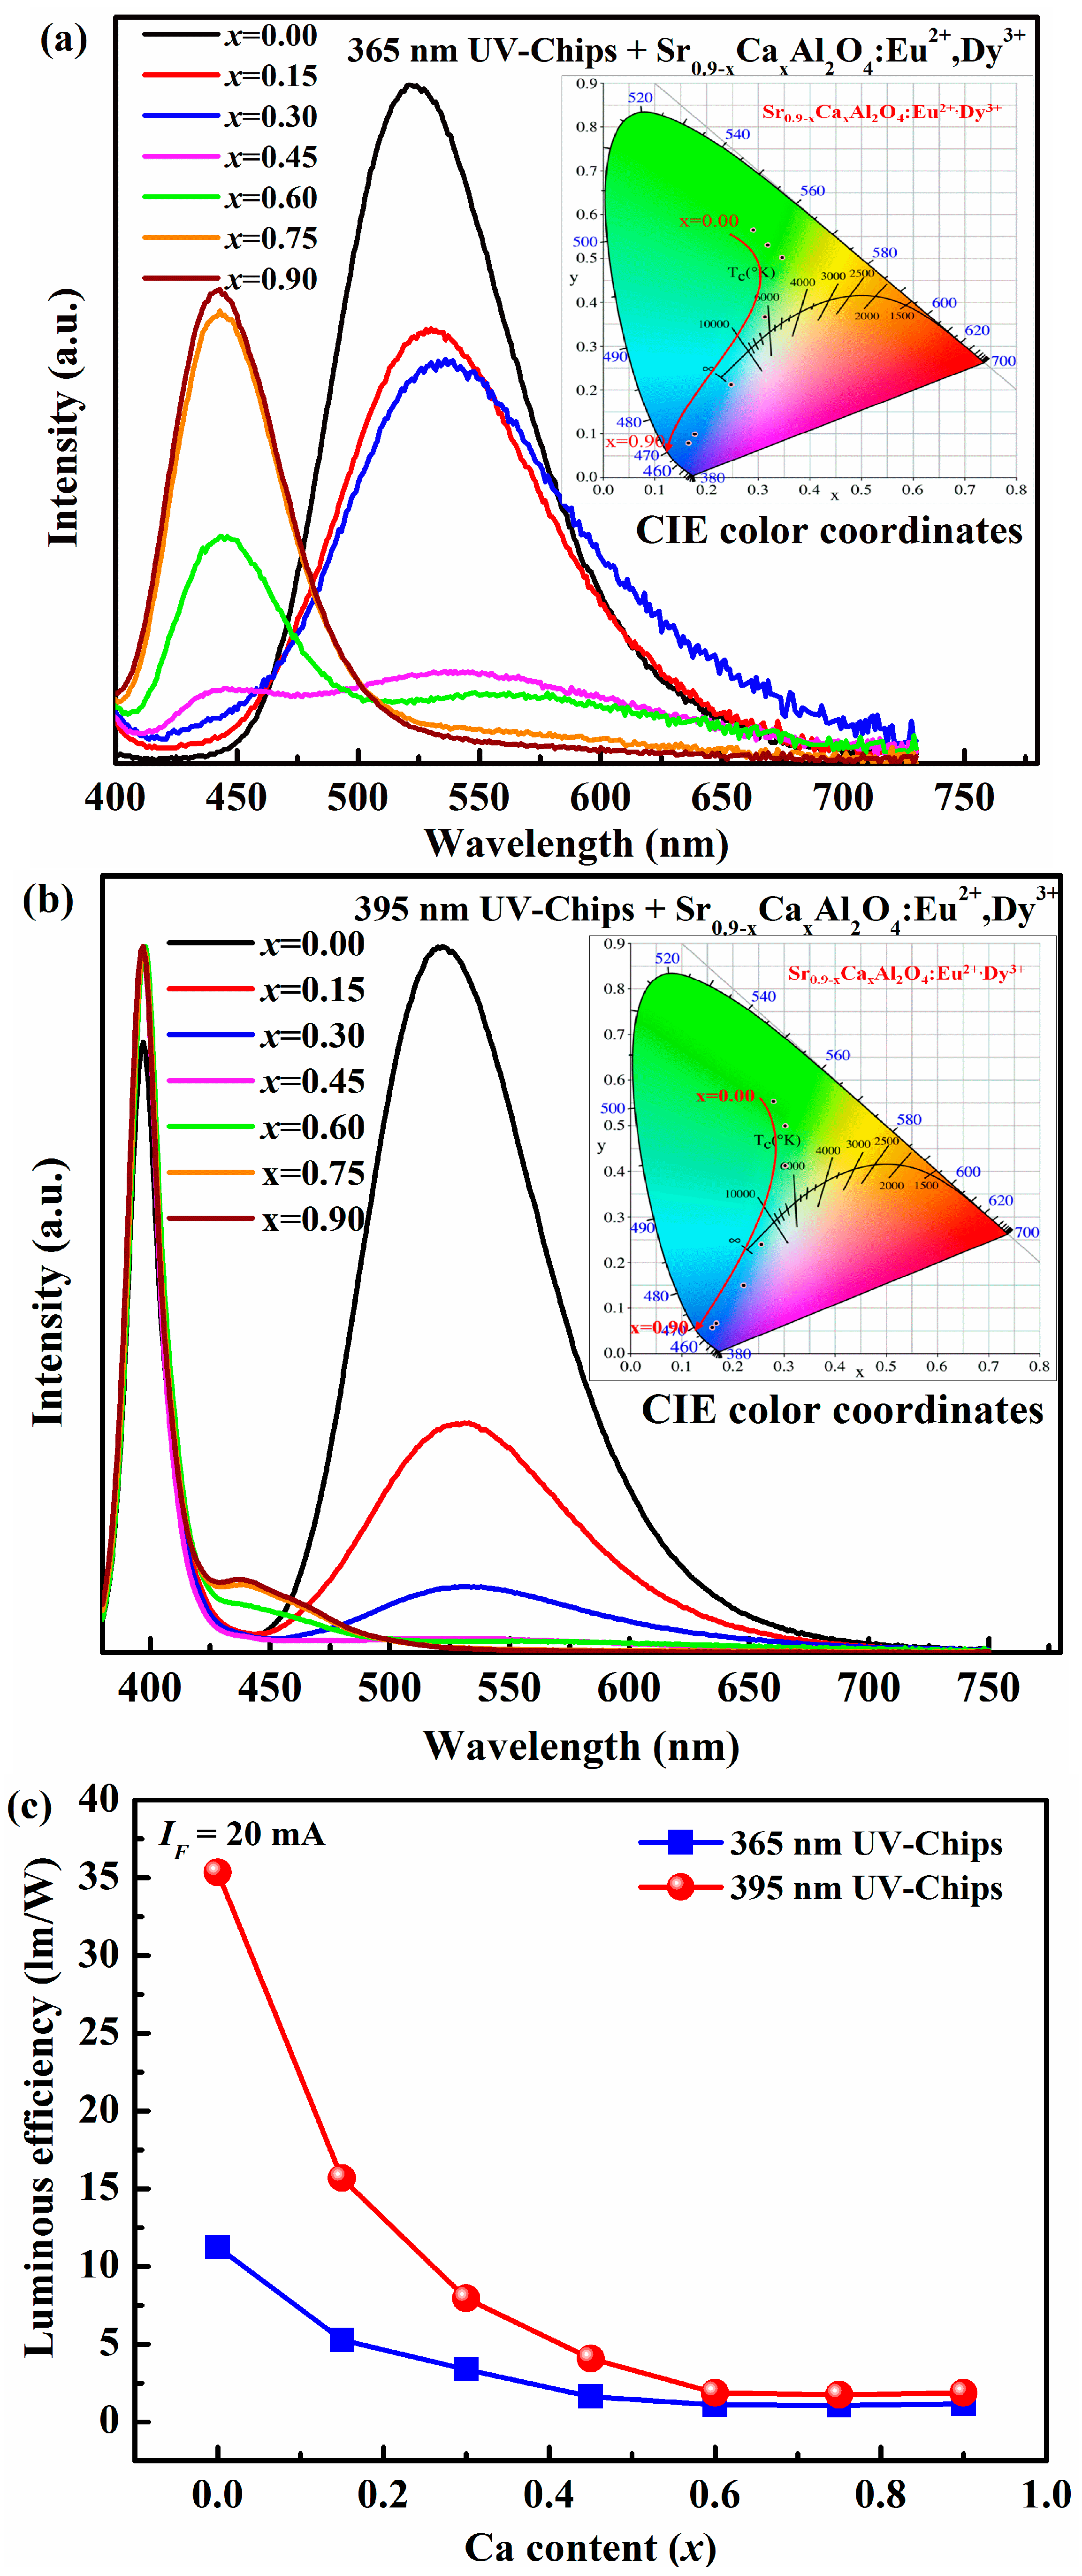
Figure 6.
Electroluminescence spectra of the as-fabricated LEDs based on UV-chip and Sr0.90−yBayAl2O4:0.05Eu2+, 0.05Dy3+ phosphors under 20 mA forward-bias current (i.e., IF = 20 mA). Inset is chromaticity diagram of the as-fabricated LEDs: (a) 365 nm UV-chip; (b) 395 nm UV-chip; (c) Luminous efficiency of as-fabricated LEDs with different Ba2+ content under IF = 20 mA.

Table 1.
Color coordinates of Sr0.90−xCaxAl2O4:0.05Eu2+, 0.05Dy3+ and Sr0.90−yBayAl2O4:0.05Eu2+, 0.05Dy3+ phosphors (x, y = 0.00–0.90).
Table 1.
Color coordinates of Sr0.90−xCaxAl2O4:0.05Eu2+, 0.05Dy3+ and Sr0.90−yBayAl2O4:0.05Eu2+, 0.05Dy3+ phosphors (x, y = 0.00–0.90).
| x (or y) Values | Sr0.90−xCaxAl2O4:0.05Eu2+, 0.05Dy3+ | Sr0.90−yBayAl2O4:0.05Eu2+, 0.05Dy3+ | ||
|---|---|---|---|---|
| CIE (x, y) | CIE (x, y) | |||
| x | y | x | y | |
| 0.00 | 0.2393 | 0.5874 | 0.2399 | 0.5867 |
| 0.15 | 0.2741 | 0.5754 | 0.2251 | 0.5675 |
| 0.30 | 0.3029 | 0.5456 | 0.2170 | 0.5477 |
| 0.45 | 0.2860 | 0.4086 | 0.2258 | 0.4952 |
| 0.60 | 0.2059 | 0.1712 | 0.2054 | 0.4741 |
| 0.75 | 0.1607 | 0.0729 | 0.1823 | 0.4412 |
| 0.90 | 0.1531 | 0.0528 | 0.1652 | 0.4645 |
Table 2.
Results for fitted decay curve of Ca0.90−xAl2O4:0.05Eu2+, 0.05Dy3+, Sr0.90−xAl2O4:0.05Eu2+, 0.05Dy3+, and Ba0.90−x Al2O4:0.05Eu2+, 0.05Dy3+ phosphors.
Table 2.
Results for fitted decay curve of Ca0.90−xAl2O4:0.05Eu2+, 0.05Dy3+, Sr0.90−xAl2O4:0.05Eu2+, 0.05Dy3+, and Ba0.90−x Al2O4:0.05Eu2+, 0.05Dy3+ phosphors.
| Samples | Decay Lifetimes (ms) | |||
|---|---|---|---|---|
| 1 | 2 | 3 | average | |
| Ca0.90Al2O4:0.05Eu2+, 0.05Dy3+ | 210.28 | 210.28 | 1410.88 | 795.11 |
| Sr0.90Al2O4:0.05Eu2+, 0.05Dy3+ | 1264.65 | 165.05 | 165.05 | 842.04 |
| Ba0.90Al2O4:0.05Eu2+, 0.05Dy3+ | 134.50 | 1502.09 | 134.50 | 219.91 |
Table 3.
Parameter of chromaticity coordinates based on Sr0.90−xCaxAl2O4:0.05Eu2+, 0.05Dy3+ phosphors with 365 nm and 395 nm UV-Chips under 20 mA forward-bias current.
Table 3.
Parameter of chromaticity coordinates based on Sr0.90−xCaxAl2O4:0.05Eu2+, 0.05Dy3+ phosphors with 365 nm and 395 nm UV-Chips under 20 mA forward-bias current.
| x Values | 395 UV-Chips | 365 UV-Chips | ||
|---|---|---|---|---|
| CIE (x, y) | CIE (x, y) | |||
| x | y | x | y | |
| 0.00 | 0.2805 | 0.5527 | 0.2907 | 0.5657 |
| 0.15 | 0.3029 | 0.5005 | 0.3181 | 0.5301 |
| 0.30 | 0.3033 | 0.4120 | 0.3462 | 0.5032 |
| 0.45 | 0.2555 | 0.2402 | 0.3139 | 0.3662 |
| 0.60 | 0.2209 | 0.1497 | 0.2486 | 0.2125 |
| 0.75 | 0.1675 | 0.0669 | 0.1771 | 0.0983 |
| 0.90 | 0.1599 | 0.0572 | 0.1655 | 0.0791 |
Table 4.
Parameter of chromaticity coordinates based on Sr0.90−xBaxAl2O4:0.05Eu2+, 0.05Dy3+ phosphors with 365 nm and 395 nm UV-Chips under 20 mA forward-bias current.
Table 4.
Parameter of chromaticity coordinates based on Sr0.90−xBaxAl2O4:0.05Eu2+, 0.05Dy3+ phosphors with 365 nm and 395 nm UV-Chips under 20 mA forward-bias current.
| y Values | 395 UV-Chips | 365 UV-Chips | ||
|---|---|---|---|---|
| CIE (x, y) | CIE (x, y) | |||
| x | y | x | y | |
| 0.00 | 0.2782 | 0.5471 | 0.2879 | 0.5666 |
| 0.15 | 0.2569 | 0.5045 | 0.2735 | 0.5584 |
| 0.30 | 0.2412 | 0.4612 | 0.2627 | 0.5331 |
| 0.45 | 0.2127 | 0.2568 | 0.2825 | 0.4471 |
| 0.60 | 0.2071 | 0.2881 | 0.2693 | 0.4560 |
| 0.75 | 0.1864 | 0.2309 | 0.2580 | 0.4278 |
| 0.90 | 0.1839 | 0.3678 | 0.2070 | 0.4628 |
© 2017 by the authors. Licensee MDPI, Basel, Switzerland. This article is an open access article distributed under the terms and conditions of the Creative Commons Attribution (CC BY) license (http://creativecommons.org/licenses/by/4.0/).
Share and Cite
MDPI and ACS Style
Xie, Q.; Li, B.; He, X.; Zhang, M.; Chen, Y.; Zeng, Q. Correlation of Structure, Tunable Colors, and Lifetimes of (Sr, Ca, Ba)Al2O4:Eu2+, Dy3+ Phosphors. Materials 2017, 10, 1198. https://doi.org/10.3390/ma10101198
AMA Style
Xie Q, Li B, He X, Zhang M, Chen Y, Zeng Q. Correlation of Structure, Tunable Colors, and Lifetimes of (Sr, Ca, Ba)Al2O4:Eu2+, Dy3+ Phosphors. Materials. 2017; 10(10):1198. https://doi.org/10.3390/ma10101198
Chicago/Turabian StyleXie, Qidi, Bowen Li, Xin He, Mei Zhang, Yan Chen, and Qingguang Zeng. 2017. "Correlation of Structure, Tunable Colors, and Lifetimes of (Sr, Ca, Ba)Al2O4:Eu2+, Dy3+ Phosphors" Materials 10, no. 10: 1198. https://doi.org/10.3390/ma10101198
Note that from the first issue of 2016, this journal uses article numbers instead of page numbers. See further details here.