
Exergy Analysis of the Supply of Energy and Material Resources in the Swedish Society

1
School of Business, Engineering and Science, Halmstad University, Halmstad 30118, Sweden
2
Öxbo, Lerum 44392, Sweden
*
Author to whom correspondence should be addressed.
Energies 2016, 9(9), 707; https://doi.org/10.3390/en9090707
Submission received: 2 July 2016
/
Revised: 24 August 2016
/
Accepted: 30 August 2016
/
Published: 2 September 2016
Abstract
:Exergy is applied to the Swedish energy supply system for the period 1970–2013. Exergy flow diagrams for the systems of electricity and district heating as well as for the total supply system of energy and material resources for 2012 are presented. The share of renewable use has increased in both electricity and district heat production. The resource use is discussed in four sectors: residential and service, transportation, industry and agriculture. The resource use is also analyzed with respect to exergy efficiency and renewable share. The total exergy input of energy and material resources amounts to about 2700 PJ of which about 530 PJ was used for final consumption in 2012. The results are also compared with similar studies. Even though the share of renewable resource use has increased from 42% in 1980 to 47% in 2012, poor efficiency is still occurring in transportation, space heating, and food production. A strong dependence on fossil and nuclear fuels also implies a serious lack of sustainability. A more exergy efficient technology and a higher renewable energy share are needed in order to become a more sustainable society.
1. Introduction
Exergy is the “fuel” for dissipative systems, i.e., systems that are sustained by converting energy and materials; e.g., a living cell, an organism, an eco-system, the Earth’s surface with its material cycles, or a society, i.e., metabolic processes. The exergy concept could and should therefore, in this sense, be used systematically to describe such systems scientifically [1].
The first and second laws of thermodynamics together with the physical conditions on the Earth have a crucial impact on our living conditions. The resource use in the modern society implies resource depletion and an environmental destruction never seen before in the history of mankind. Resource management is characterized by unconscious incompetence, mainly based on a number of myths and lack of morals [1,2]. In order to improve energy and material conversion processes the exergy concept should be applied. Thus, exergy and exergy analysis are necessary tools to create and maintain a sustainable or rather a vital society.
Exergy analyses have been applied to the physical resource use of countries including forestry, agriculture and industrial processes [3,4,5,6,7,8,9,10,11,12,13,14,15]. Exergy flow diagrams are used to analyze the main conversions of energy and material resources in a society, from the resource base to final consumption. Also so called extended-exergy analysis including cost and labor has been applied to some societies, e.g., China [16], Turkey [17], Norway [18]. The first exergy flow diagram of the total energy and material resource supply system of a society was done in 1977 for Sweden 1975 [3] and later for Sweden 1980 [1]. Exergy flow diagrams have also been made for several other countries, e.g., Japan [5], Canada [8], Italy [6], Norway [9,18], and China [19,20,21,22,23,24]. Ertesvåg [25] estimated the total exergy efficiency for a number of different countries to be approximately 0.1 to 0.3 and concluded that the structure of the energy system is of main importance in this regard.
This paper will mainly focus on surveying the supply of energy and materials in the Swedish society, and the detailed processes will not be analyzed in this paper. In Sweden the use of energy resources has changed dramatically since 1970. The use of fossil fuels has dropped and the use of electricity which is mainly derived from nuclear power has increased. Fossil fuel is a non-renewable resource or deposit resource. Electricity and district heat are not resources but forms of exergy carriers. Thus, the production of electricity and district heat must be carefully investigated to be able to determine how shifting from fossil fuel to electricity and district heat would affect sustainability. Presently, the use of solar and wind is steadily growing. The purpose of this exergy analysis is to address the exergy efficiency and to realize to what extent the resource supply system is renewable, i.e., is the Swedish supply of energy and material resources becoming more sustainable or not?
2. Method
2.1. Exergy and Exergy Factor
Exergy is a measure of how far a given system deviates from equilibrium with its environment, a given reference state or an internal equilibrium. The exergy E of a system in a large environment is [3,26,27]:
where T0 is the temperature of the environment, and ΔStot is the change of the entropy of the total system due to irreversibility, i.e., the system and the environment. Equation (1) is known as the Gouy-Stodola theorem [28,29]. When heat Q is transferred between two reservoirs at temperatures T and T0, the exergy becomes [27]:
This is a generalization of the Carnot relation or the maximum work that can be extracted from two reservoirs. The exergy factor is the ratio between exergy and energy, mostly a number between 0 and 1. The exergy factor of heat is strongly dependent on temperature, see Table 1. It should be noticed that some factors are only approximate due to an unknown moisture content of the fuel.
In this analysis the average outdoor temperature was used as reference temperature. The thermal exergy for all raw materials and chemical fuels was neglected except for high temperature fuels. The output exergy includes both exergy of products and exergy of waste. The exergy destruction due to irreversibility is not visible since this is exergy that simply vanish into nothing. Exergy is never in balance in irreversible or real processes whereas energy is always in balance. This condition is of major importance in the understanding of the main benefit of analyzing exergy instead of energy. However, this fact is too often neglected in the literature.
2.2. Data Sources
Data are mostly from the Statistics Sweden, Swedish Forest Agency, Swedish Energy Agency, and International Energy Agency (IEA). The data related to woods and forests are mainly from Swedish Statistical Yearbook of Forestry and for agriculture and food from Yearbook of Agricultural Statistics including food statistics. Due to variations in the data from different sources some data have been estimated. In the Swedish statistics the exergy of biomass is based on the lower heating value (LHV).
2.3. Exergy Flow Diagrams
Exergy flow diagrams offer an overview of the exergy conversions from the resource base to end-users. The width of a flow represents the amount of exergy. Thus, inefficiencies are made visual and so are potentials for improvement and savings which are of crucial importance in decision making. Primary resources or the resource base appear in the left hand side of the diagram. In the middle are conversion and transmission processes and to the right are end uses or final consumption. Losses appear either as flows of waste to the environment directed downwards or as decreasing width from the destruction of exergy or due to irreversibilities.
3. The Production and Distribution of Electricity and District Heat
The production of electricity and district heat in Sweden has increased since 1970. Exergy flow diagrams for the production and distribution of these exergy carriers are presented below. In these diagrams the final conversion is excluded which will be covered in the complete exergy flow diagram for the Swedish society in Section 5 below.
3.1. Electricity
Figure 1 shows the electricity production from five different supply systems. Hydro and nuclear fuels (U-235) are the main resources in the production of electricity, together they account for 69% in 1970 and about 90% from 1980 until 2008 of the total electricity production. From 2008 the installed capacity of wind power and solar photovoltaic is increasing at the average rate of about 24% and 44% per year respectively [32,33]. Conventional thermal power plants use fossil fuel, peat, biofuel and municipal solid waste. These plants accounted for 31% in 1970 and 11% or less from 1980 of the total electricity production. Electricity is produced in condensing power plants and combined heat and power plants (CHP). A CHP not only produces electricity, but also district heat by a so-called back-pressure process. The use of renewable fuels in these plants is increasing.
The electricity certificate system is a support system in order to increase electricity produced from renewable resources. Sweden and Norway have an open electricity certificate market since 1 January 2012 with the goal of increasing the production of renewable electricity by at least 95 PJ in both countries between 2012 and 2020. In Sweden electricity from sunlight and wind has increased to 7% of the total electricity production in 2013. Installed grid-connected photovoltaic (PV) systems increased from 0.56 MW in 2006 to 17 MW in 2012 [35] and the trend is a continued increase. Hydropower remains more or less constant during these years.
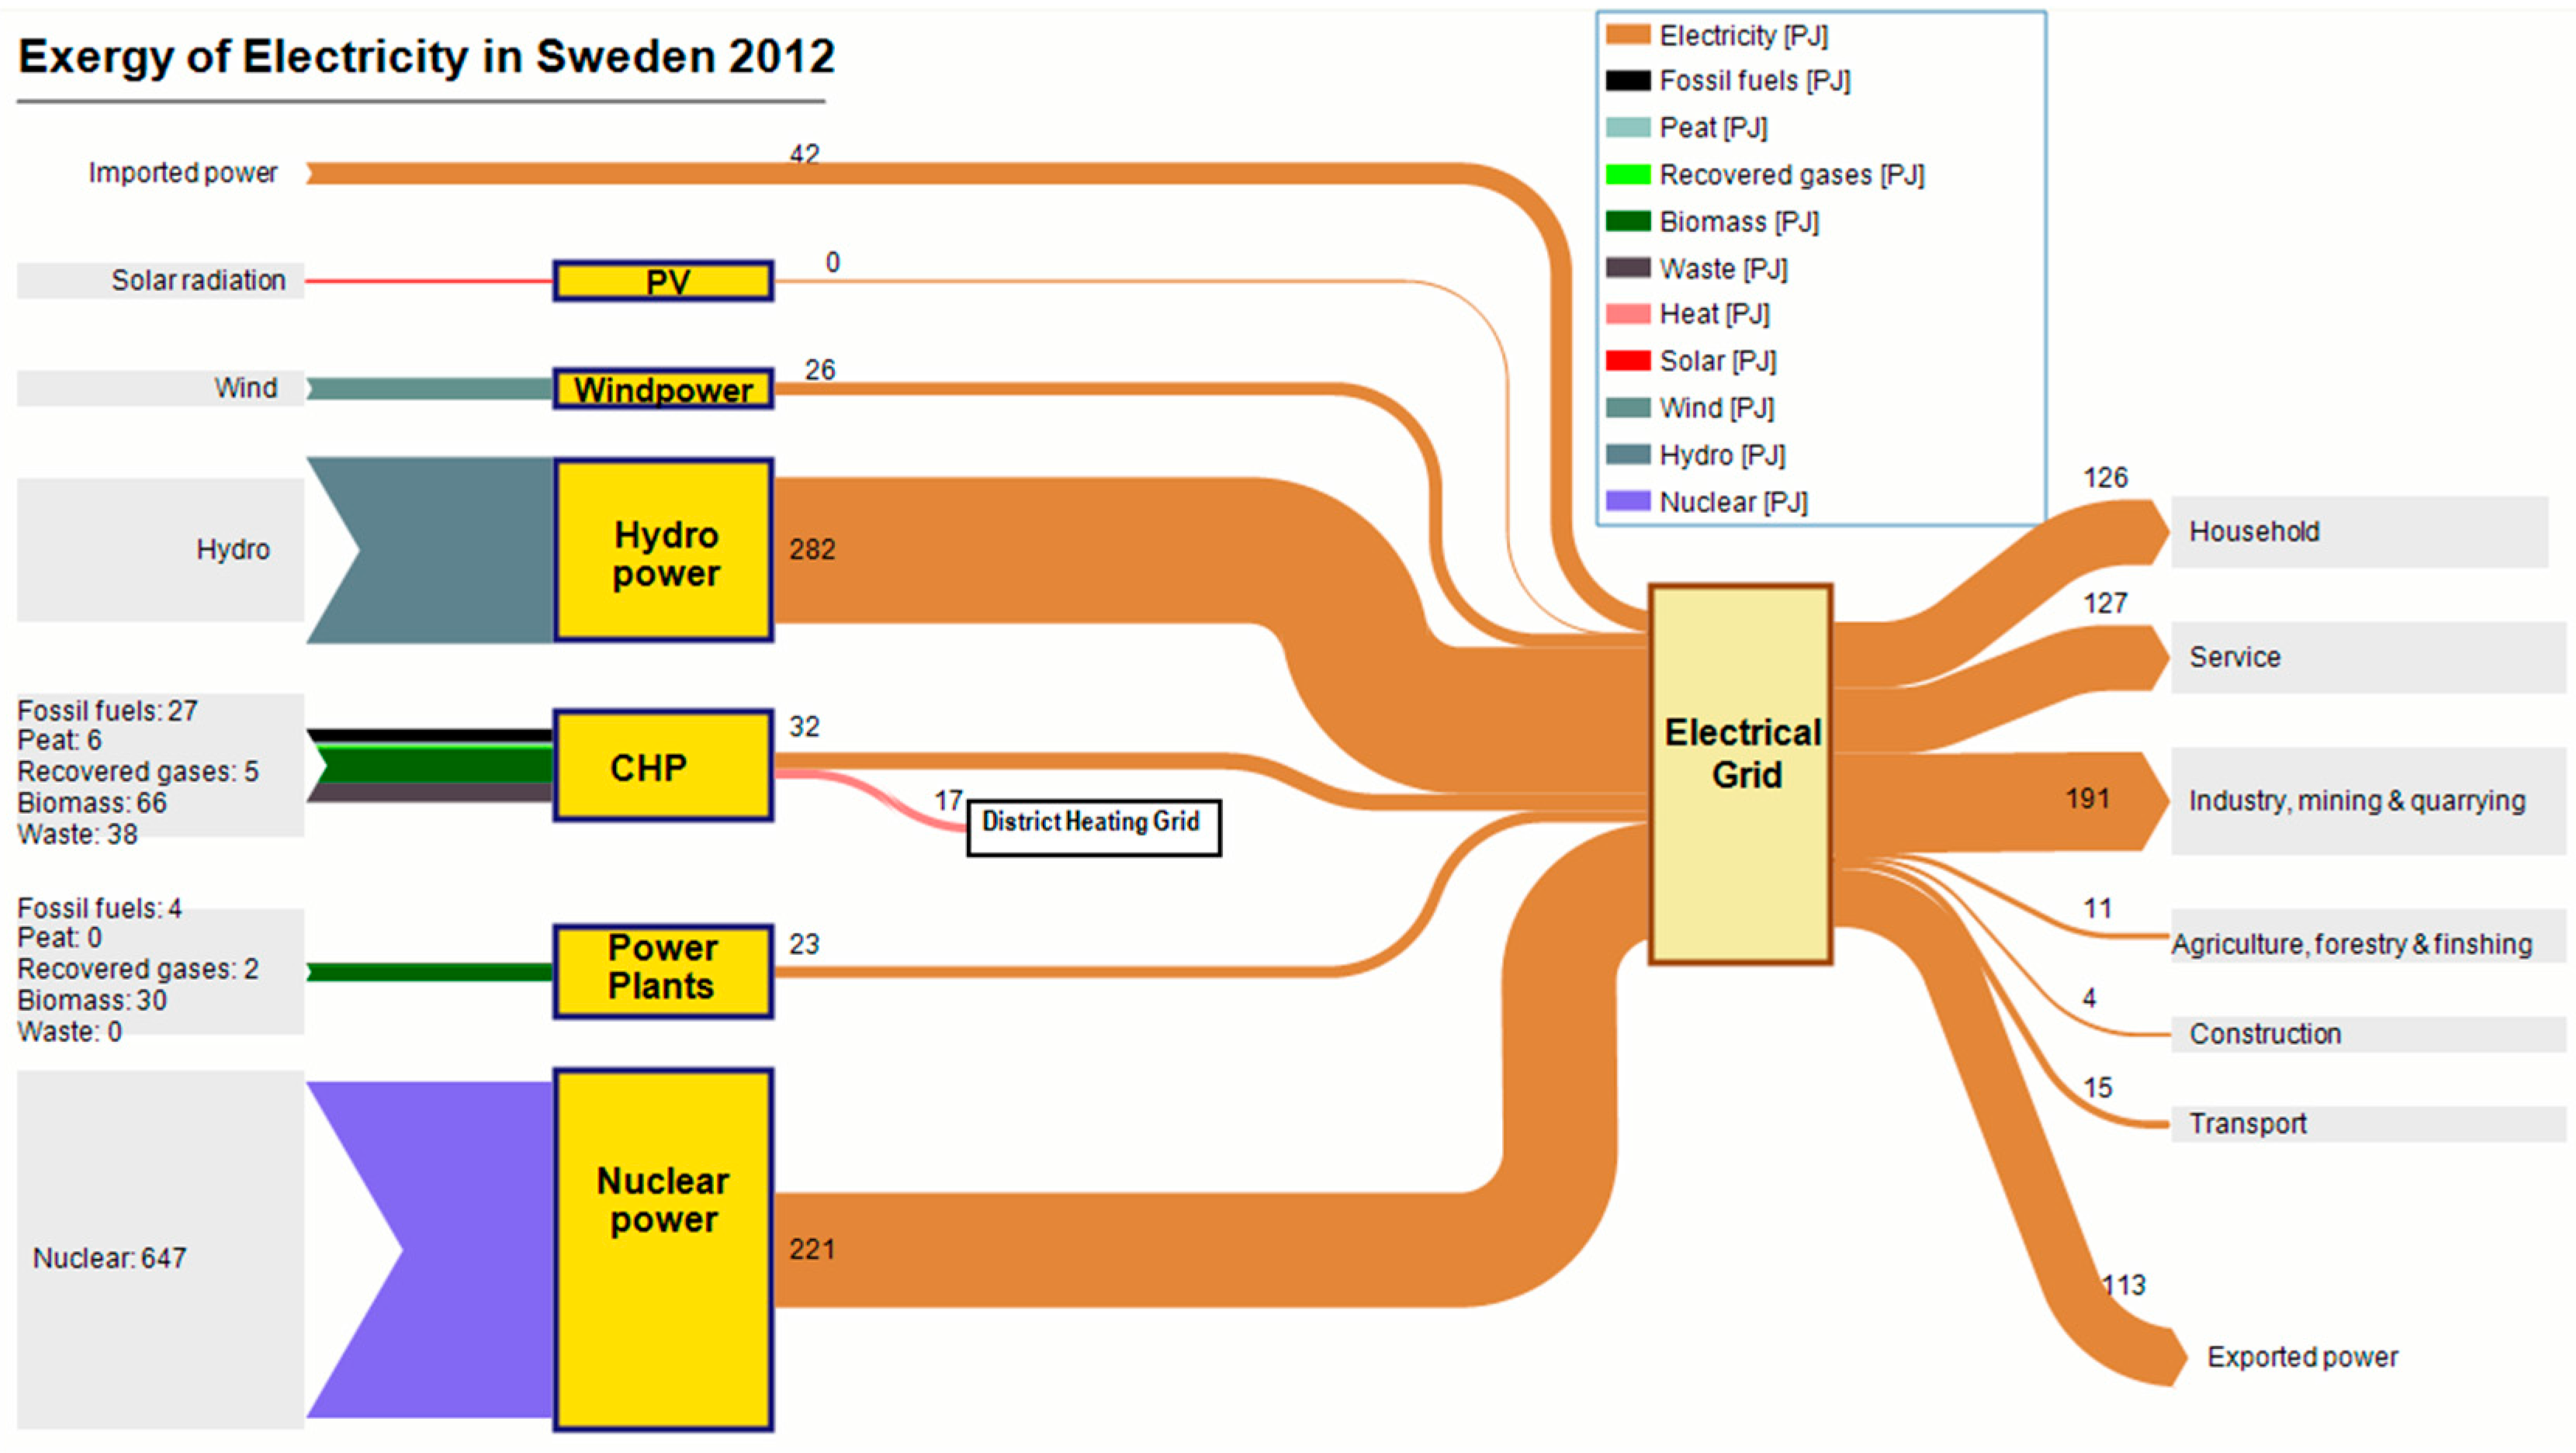
The total production of electricity reached 585 PJ in 2012 with large net exports. This includes conversion losses of potential energy in the dam, transformer losses at the power stations and pumping losses in pumping stations. 81% of the total electricity production was delivered to different users, as shown in Figure 2. The rest 39 PJ was lost due to electric resistance and imperfect adaptation between production and consumption, i.e., transmission losses.
Figure 2 shows the exergy flow of electricity from different sources and imported electricity to the end use in 2012, the diagram also includes the related district heating in the CHP plants. The middle of the diagram shows various power plants, electrical grid and heat from CHP plants to district heating grid. The heat losses are close to ambient temperature so exergy is very small. The difference between incoming and outgoing flows for the conversion processes is due to irreversibility or exergy destruction. The largest conversion loss appears in nuclear power plants. 76% of the total amount of fuels used in conventional thermal power plants came from biomass and municipal solid waste. The exergy of district heat is only 17 PJ whereas the energy value is 102 PJ.
Electricity was mainly used in residential and service sector and industry sector which was 94% of total electricity use in Sweden. The household used about 126 PJ of electricity for lighting, heating and other services. The service sector used 127 PJ and industry used about 191 PJ of electricity for manufacturing, mining and quarrying. About 11 PJ of electricity were used for agriculture, forestry, mining and fishing. About 15 PJ of electricity were used by railway, urban and other types of transport and supporting activities including street and road lighting. The rest of electricity was used for construction.
3.2. District Heat
District heating was introduced in 1950s mainly by the use of boilers. The energy supply for district heating has been almost constant since 1994. The dominant fuels today are biomass and waste, and the share of coal and oil is less than 10% [36]. This creates a nearly fossil fuel free district heating system. Due to the prohibition of landfilling of combustible waste from 2002 and organic waste from 2005 waste incineration plants are used as base loads in several Swedish cities. With an open electricity market in Northern Europe CHP plants have become more common for producing district heat. The efficiency of waste fueled CHP plants has been improved with flue gas condensation.
In order to calculate the exergy content of district heat, the average annual outdoor temperature in Sweden was used as a reference temperature. The average supply and return temperature of districted heat in Sweden were 85 and 55 °C respectively. These temperatures were used in the exergy analysis. The exergy of heat delivered to the end users differs a lot. In this analysis the normal required temperatures in Sweden used for space heating and domestic hot water were 20 °C and 50 °C respectively. In single- and multi-family buildings about one third of the heat demand is for domestic hot water in contrast to the service sector only 2%–3% is used for this purpose whereas the rest is used for space heating [37].
In industry about 5% of the district heat is used as high temperature heat. The temperature for heat demands in the industry can be divided into three temperature levels: low temperature level (<100 °C) for space heating, domestic hot water, washing, rinsing and food preparation; medium temperature level (100–400 °C) for evaporating and drying; high temperature level (>400 °C) for manufacturing of metals, ceramics, and glass etc. High and medium temperature processes often generate waste or excess heat to be recovered in district heating systems. In 2012 the energy and exergy of this excess heat were 17 and 4 PJ respectively.
Figure 3 gives an exergy overview of the production and distribution of district heat including a part of the electrical grid in Sweden during 2012. There is a large difference between energy and exergy flow diagrams due to district heat having a low exergy factor or about 17%, see Table 1. The α-value, i.e. the ratio of electricity to heat, based on energy and exergy were 0.3 and 2, respectively. Thus, a lot of exergy is destroyed in heat production processes. In the right hand side of Figure 3, the flows to grey boxes show exergy of distributed hot water. The final conversion to space heating and domestic hot water means that only about one third of the delivered exergy will be utilized as a comfortable indoor climate for the final user [38]. In Sweden the average ratio of exergy utilized by the user of the delivered heat was about 40%, thus most of the exergy is lost in the production, distribution and final conversion to heat at relatively low temperature levels [31].
4. The Swedish Supply System in Four Sectors
All parts of the society are highly dependent on the supply of exergy carried by energy and material resources. In this section the energy and material supply system mainly related to the user is divided into four sectors: residential and service, transport, industry, and agriculture and food production. The exergy use within these four sectors was analyzed for the period 1970 to 2013.
4.1. Residential and Service Sector
In this sector almost 60% of the energy usage is for space heating and domestic hot water [39]. The heat demand is directly depending on the outdoor temperature, which implies large variations daily, yearly, and from north to south. The outdoor temperature in Sweden may vary from −30 °C in winter to +30 °C in summer. The largest heat demand in 2010 was due to cold weather. District heating mostly serves multi-family buildings. In one- and two-dwelling buildings electricity was the most commonly used form of energy and to a large extent for space heating and domestic hot water by electric heaters [40]. This implies very low exergy efficiencies. However, to the better number of heat pumps is steadily increasing. Data for this is unfortunately out of the reach by the statistical authorities and can only be estimated.
Figure 4 shows the exergy use in the residential and services sector. Oil fueled heating has been replaced by electric heaters and district heating. Thus, the use of fossil fuels, mainly oil products, has decreased rapidly since 1979. The use of electricity has been increasing since 1970, but remains constant over the last 10 years. The thermal energy delivered by district heating was about one third of the total energy use in residential and service sector during the recent years. However, due to the relatively low temperature of district heat, the delivered exergy as district heat was less than 10% of total exergy supply.
Even though the use of solar energy still is small, it plays an increasingly important role in Sweden. The solar heating systems in Sweden are mainly for heating water during summer. The installation of solar heating systems did amount to over 20,000 m2 in 1980. However, then dropped until 2001 when it exceeded this amount [41]. Installation of solar heating systems was very much related to state governed subsidies from 2009 to 2011. In 2012 only half as many solar heating systems was installed compare to the early years with subsidies. With a state governed financial support to solar PV since 2009, the grid-connected PV systems have been rapidly increasing [35]. The financial support to grid-connected solar PV system was gradually decreased from about 60% per year in 2009 to 30% for companies and 20% for private persons in 2015. Even through decreasing subsidies the grid-connected PV systems continue to increase due to the drop of the cost for solar PV systems.
4.2. Transportation Sector
Road transports consumed 94% of the total exergy used in transport sector during 2013 [39]. Figure 5 shows the exergy use in the transportation sector where the highest use or about 324 PJ was in 2007. Fossil fuels were the dominating fuel in this sector or more than 94% of total exergy use. The use of diesel has increased and in 2010 it exceeded the petrol usage. The diesel price has changed from less expensive to more or less the same level as petrol. The electricity use has been more or less constant. The main biofuels used in Sweden for transports are biodiesel, ethanol and biogas. The use of biofuels gradually increased to 8.5 PJ in 2013. The recent government policy encourages renewable energy-fueled car by changing the definition of eco-cars and applying new tax on low admixture transport biofuels in January 2013. Even though the use of electricity and biomass have increased for vehicles, fossil fuels are difficult to replace by renewable resources. Still the transportation of food and people more or less completely depend on the availability of fossil fuels.
4.3. Industry Sector
Figure 6 shows the exergy use in the industry sector. Pulp and paper industry used more than one third of the total exergy used while iron and steel industry, chemical industry, and manufacturing industry accounted for about 10% each [39].
The use of fossil fuels has dropped by about one percent annually. Electricity and biofuels plays an increasing role or about 1%–2% increase annually during the last 10 years or more than 70% of the total exergy use. District heat accounted for less than one percent of the total exergy used and was mostly used for space heating.
In 2004 an Energy Efficiency Improvement Program in energy intensive industries (PFE) was proposed with a reduction of the energy tax on electricity for the participating companies [42]. In January 2007 the EU’s 20/20/20 targets launched 20% improvement in the efficiency of energy use [43]. The PFE program continues and even more companies got involved in this program. With an improvement of the efficiency the total industrial exergy use has been relatively constant even though the production has increased. The industrial sector has successfully transferred from fossil fuels to electricity and biofuels.
The largest industry in Sweden is pulp and paper industry with strong connections to forestry, forest industry, and biofuel production. Chemical pulp mills, mechanical pulp and paper mills, and sawmills also offer potentials for production of biofuels as well as new raw materials in the future. The forest biomass demand is over 727 PJ/year [44].
In forestry the stocks of timber and the raw materials from the forest are generally quantified in m3 wood without bark (m3 fub). Wood is here used as a unifying name of many different kinds of wood. The exergy content of wood is given by the total change of chemical and “structural” exergy. The chemical exergy is the exergy stored in the material as lack of binding exergy between the atoms in a molecule. The structural exergy is the exergy or information stored in the structure of a material. This part is of great value for certain materials such as proteins or cellulose fibers. The structural exergy is well utilized when wood is used as building material or as raw material for the production of paper. By burning useful wood this part is badly utilized and it is better to burn only useless wood or paper. The structural exergy is, however, often a very small part of the total exergy content of a material but never the less very useful. The exergy of wood is about 17.9 MJ/kilogram dry solid. The natural water content of wood is about 25%. The wood with an average value of density equal to 450 kg of dry solid per m3 has an exergy of 8 GJ/m3.
During 2012 the consumption of wood from Swedish forest production was 81 Mm3 fub. 46.4 Mm3 fub went to pulp and paper industry, 33.6 Mm3 fub went to sawmills that in turn generate 10.8 Mm3 fub by-products for use in the pulp and wood panel industries. The final 0.8 Mm3 fub went to the wood panel industry [45].
In the pulp production there is a great loss of exergy due to the conversion of chemical exergy into heat at the boiling of pulp. 371 PJ of wood, 28 PJ of recycled paper and 86 PJ of electricity were used to produce about 194 PJ of final products of which most were exported. The exergy content of the outputs consisting of deal, pulp, and paper was about 174 PJ.
In the mineral industry Sweden was a leading producer of iron ore in the European Union. The Swedish iron ore has an average iron weight content of about 60% and the exergy content of iron ore was calculated to 0.51 MJ/kg [4]. The production of iron ore was 29 Mton in 2012 [46] and the ore represents a total exergy quantity of 15 PJ.
4.4. Agriculture and Food Production Sector
Harvested crops are converted into food. The input in agriculture and food industry is not only solar radiation but also fertilizers, fuels and electricity. The food consists partly of plant substances such as vegetables and bread and partly of animal substances such as milk and meat. In Sweden crops are cultivated not only for food but also for specific energy use or generation of biogas. The outflow of food is very small, mainly due to heavy losses in the conversion of vegetable products into animal products. The agricultural land in Sweden covers about 2.6 million hectares at present and this area varies with only a few percent per year.
Table 2 shows the vegetable yield in exergy of the most common Swedish crops in 2012. There is an uncertainty in the precise composition of the materials especially concerning the water content. The total exergy content of the vegetation products was about 151 PJ. In addition to this there were hay, straw and harvesting losses estimated to about 190 PJ, i.e., in total about 341 PJ of crop production.
The animal production is listed in Table 3 with a total production of about 22 PJ. Exergy from 6 PJ fossil fuels and 3 PJ electricity were used in agriculture, in greenhouses, and in the food industry. The export and import of agricultural products were approximately equal in exergy terms. Mostly cereals were exported and animal food was imported. The indirect use of exergy mainly in the form of fertilizers is not included here. Food is the output of this sector.
The food consumption in Sweden for 2012 with approximately 9.55 million inhabitants can be estimated in different ways. According to the recommended daily intake, the people in Sweden should consume about 33 PJ with considerations taken to the age-distribution. The statistical yearbook states an average food energy supply of 13.2 MJ/day and person [47]. This adds up to 46 PJ for the Swedish consumption. This indicates that food is wasted and overconsumed leading to overweight and related diseases. Thus, a large amount of the produced food is wasted both in the distribution system and in the households.
5. Energy and Material Resource Use in Sweden
5.1. The Use of Energy Resources in the Period 1970–2013
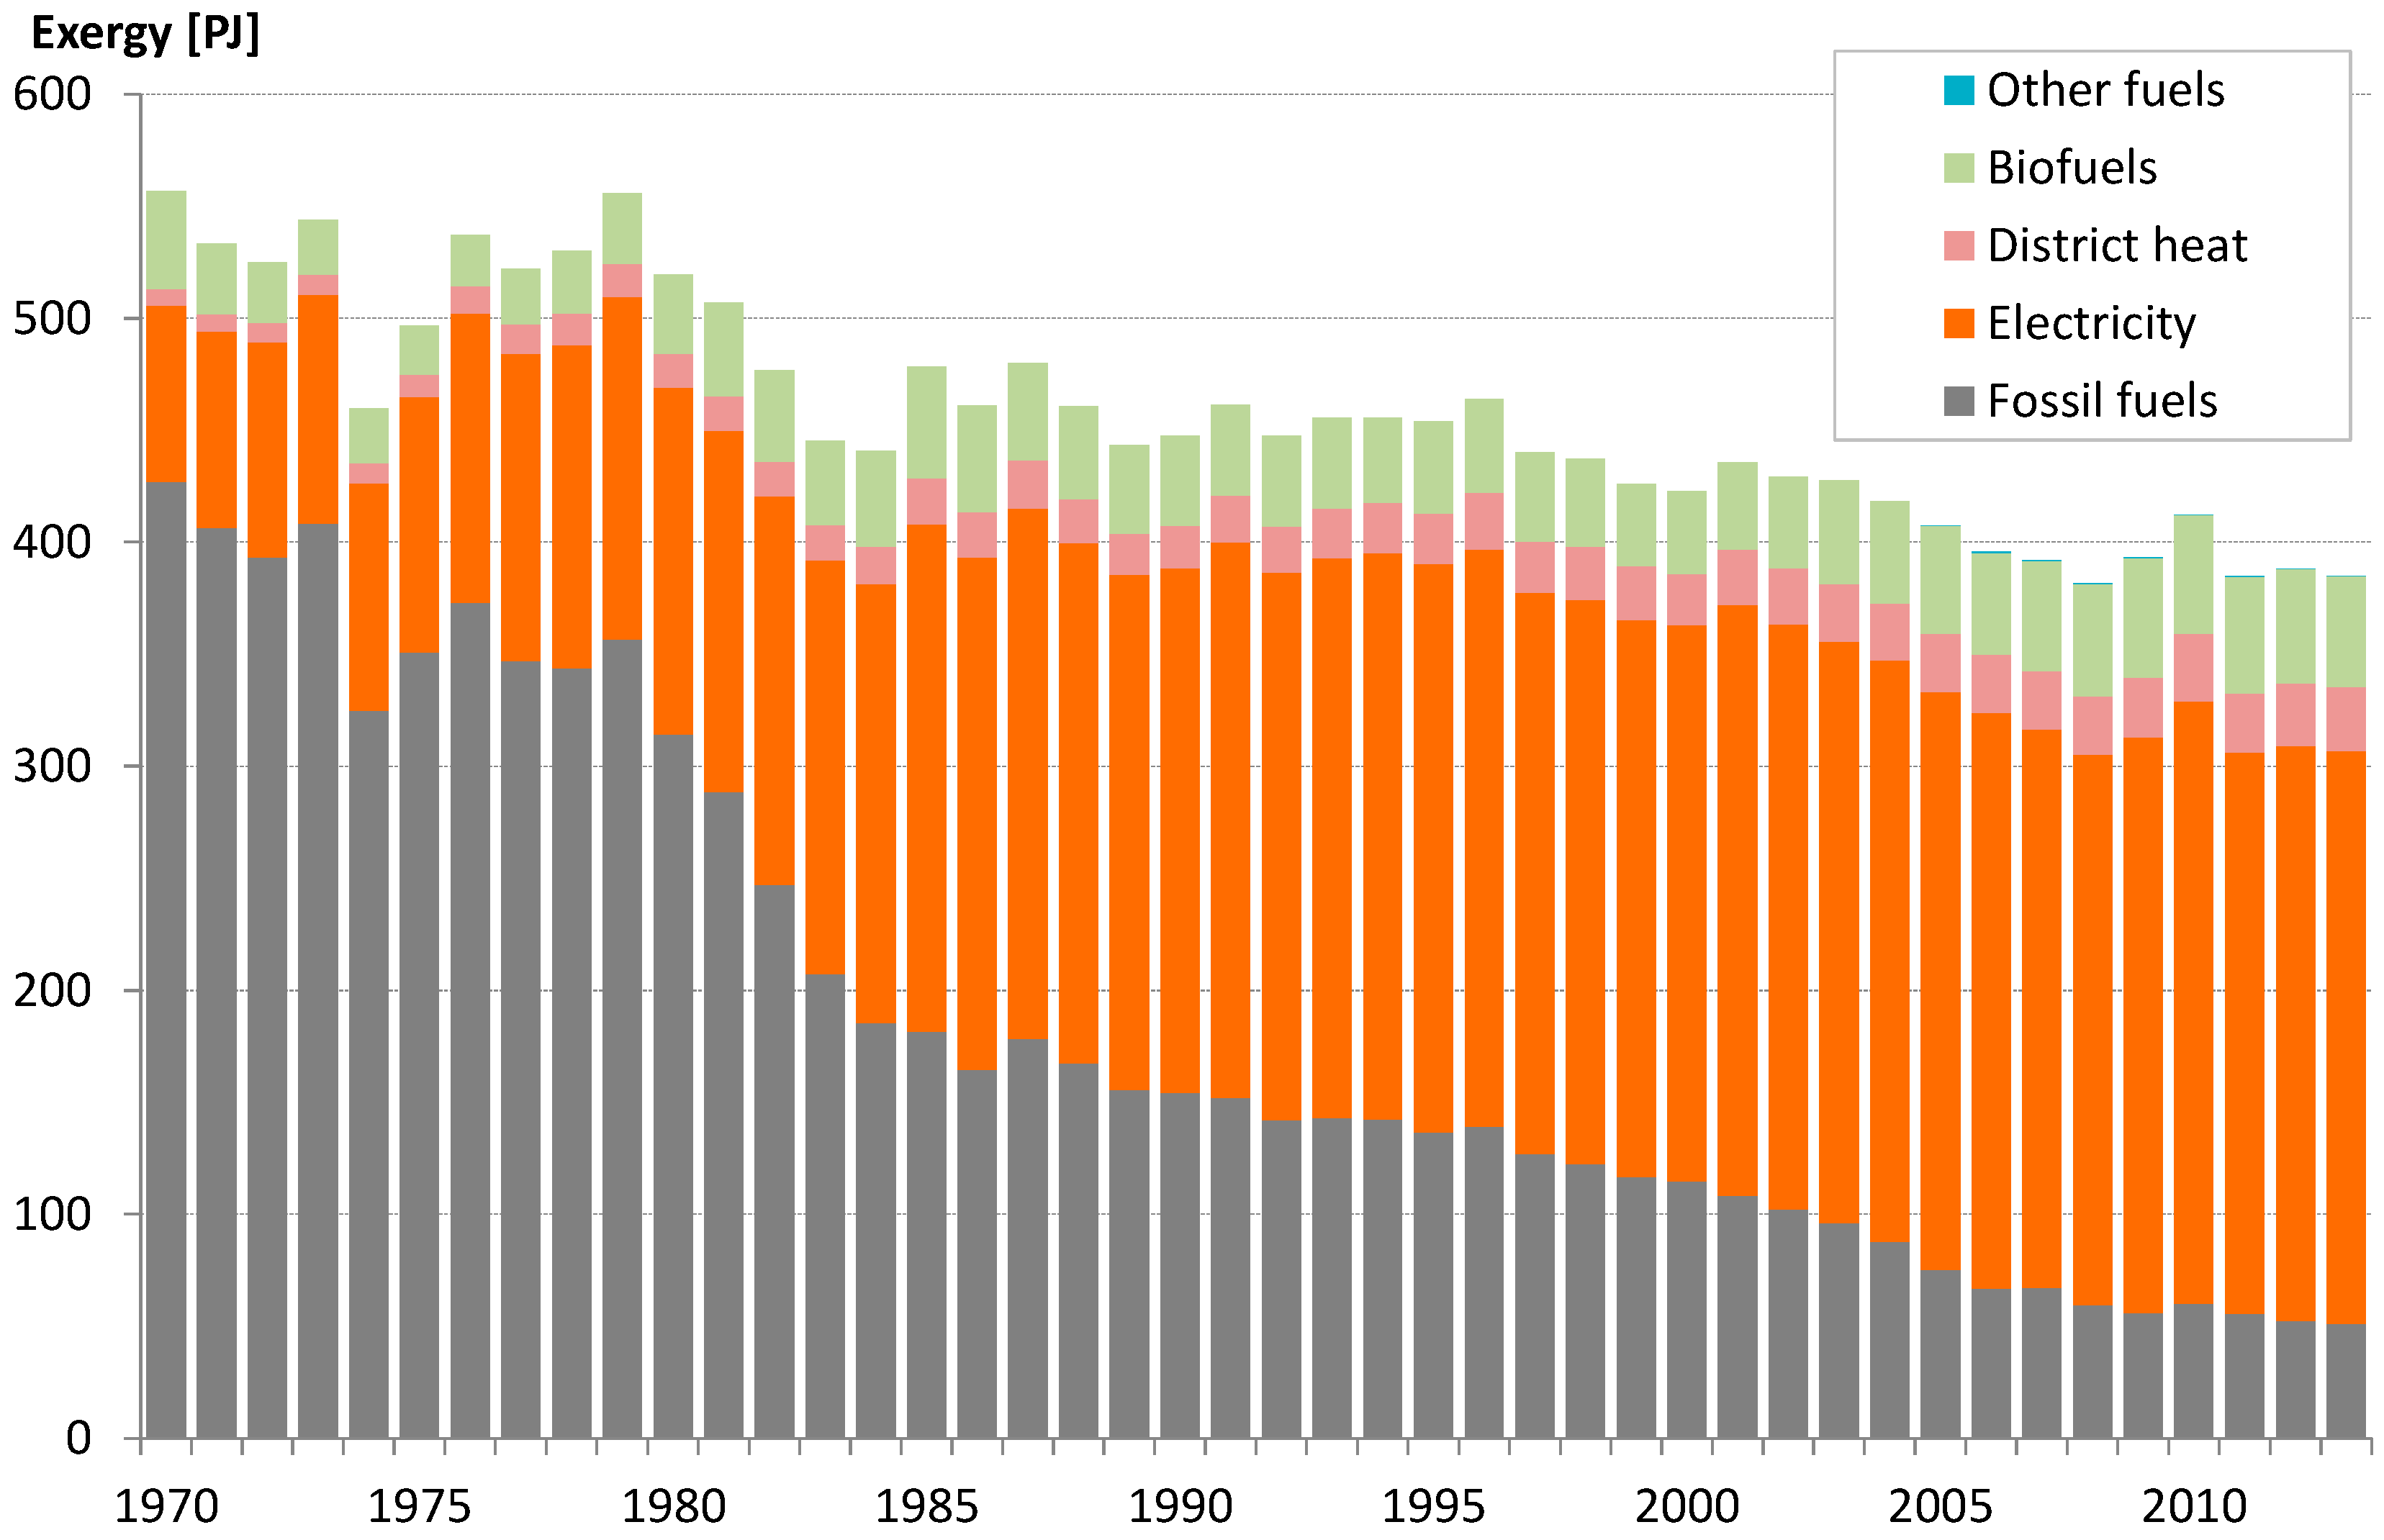
The use of energy resources, electricity and district heat from 1970 to 2013 is presented in exergy units in Figure 7. The exergy used, i.e., excluding losses, is more or less constant or about 1400 PJ/year. The use of fossil fuels from coal, oil and gas has decreased since 1980, however, not in the transport sector, see Figure 5. In short, fossil fuels have been replaced by electricity from nuclear power which explains the increased loss during this period. Also the use of biofuels has increased.
5.2. Exergy Flow Diagram of the Supply System for Energy and Material Resources in 2012
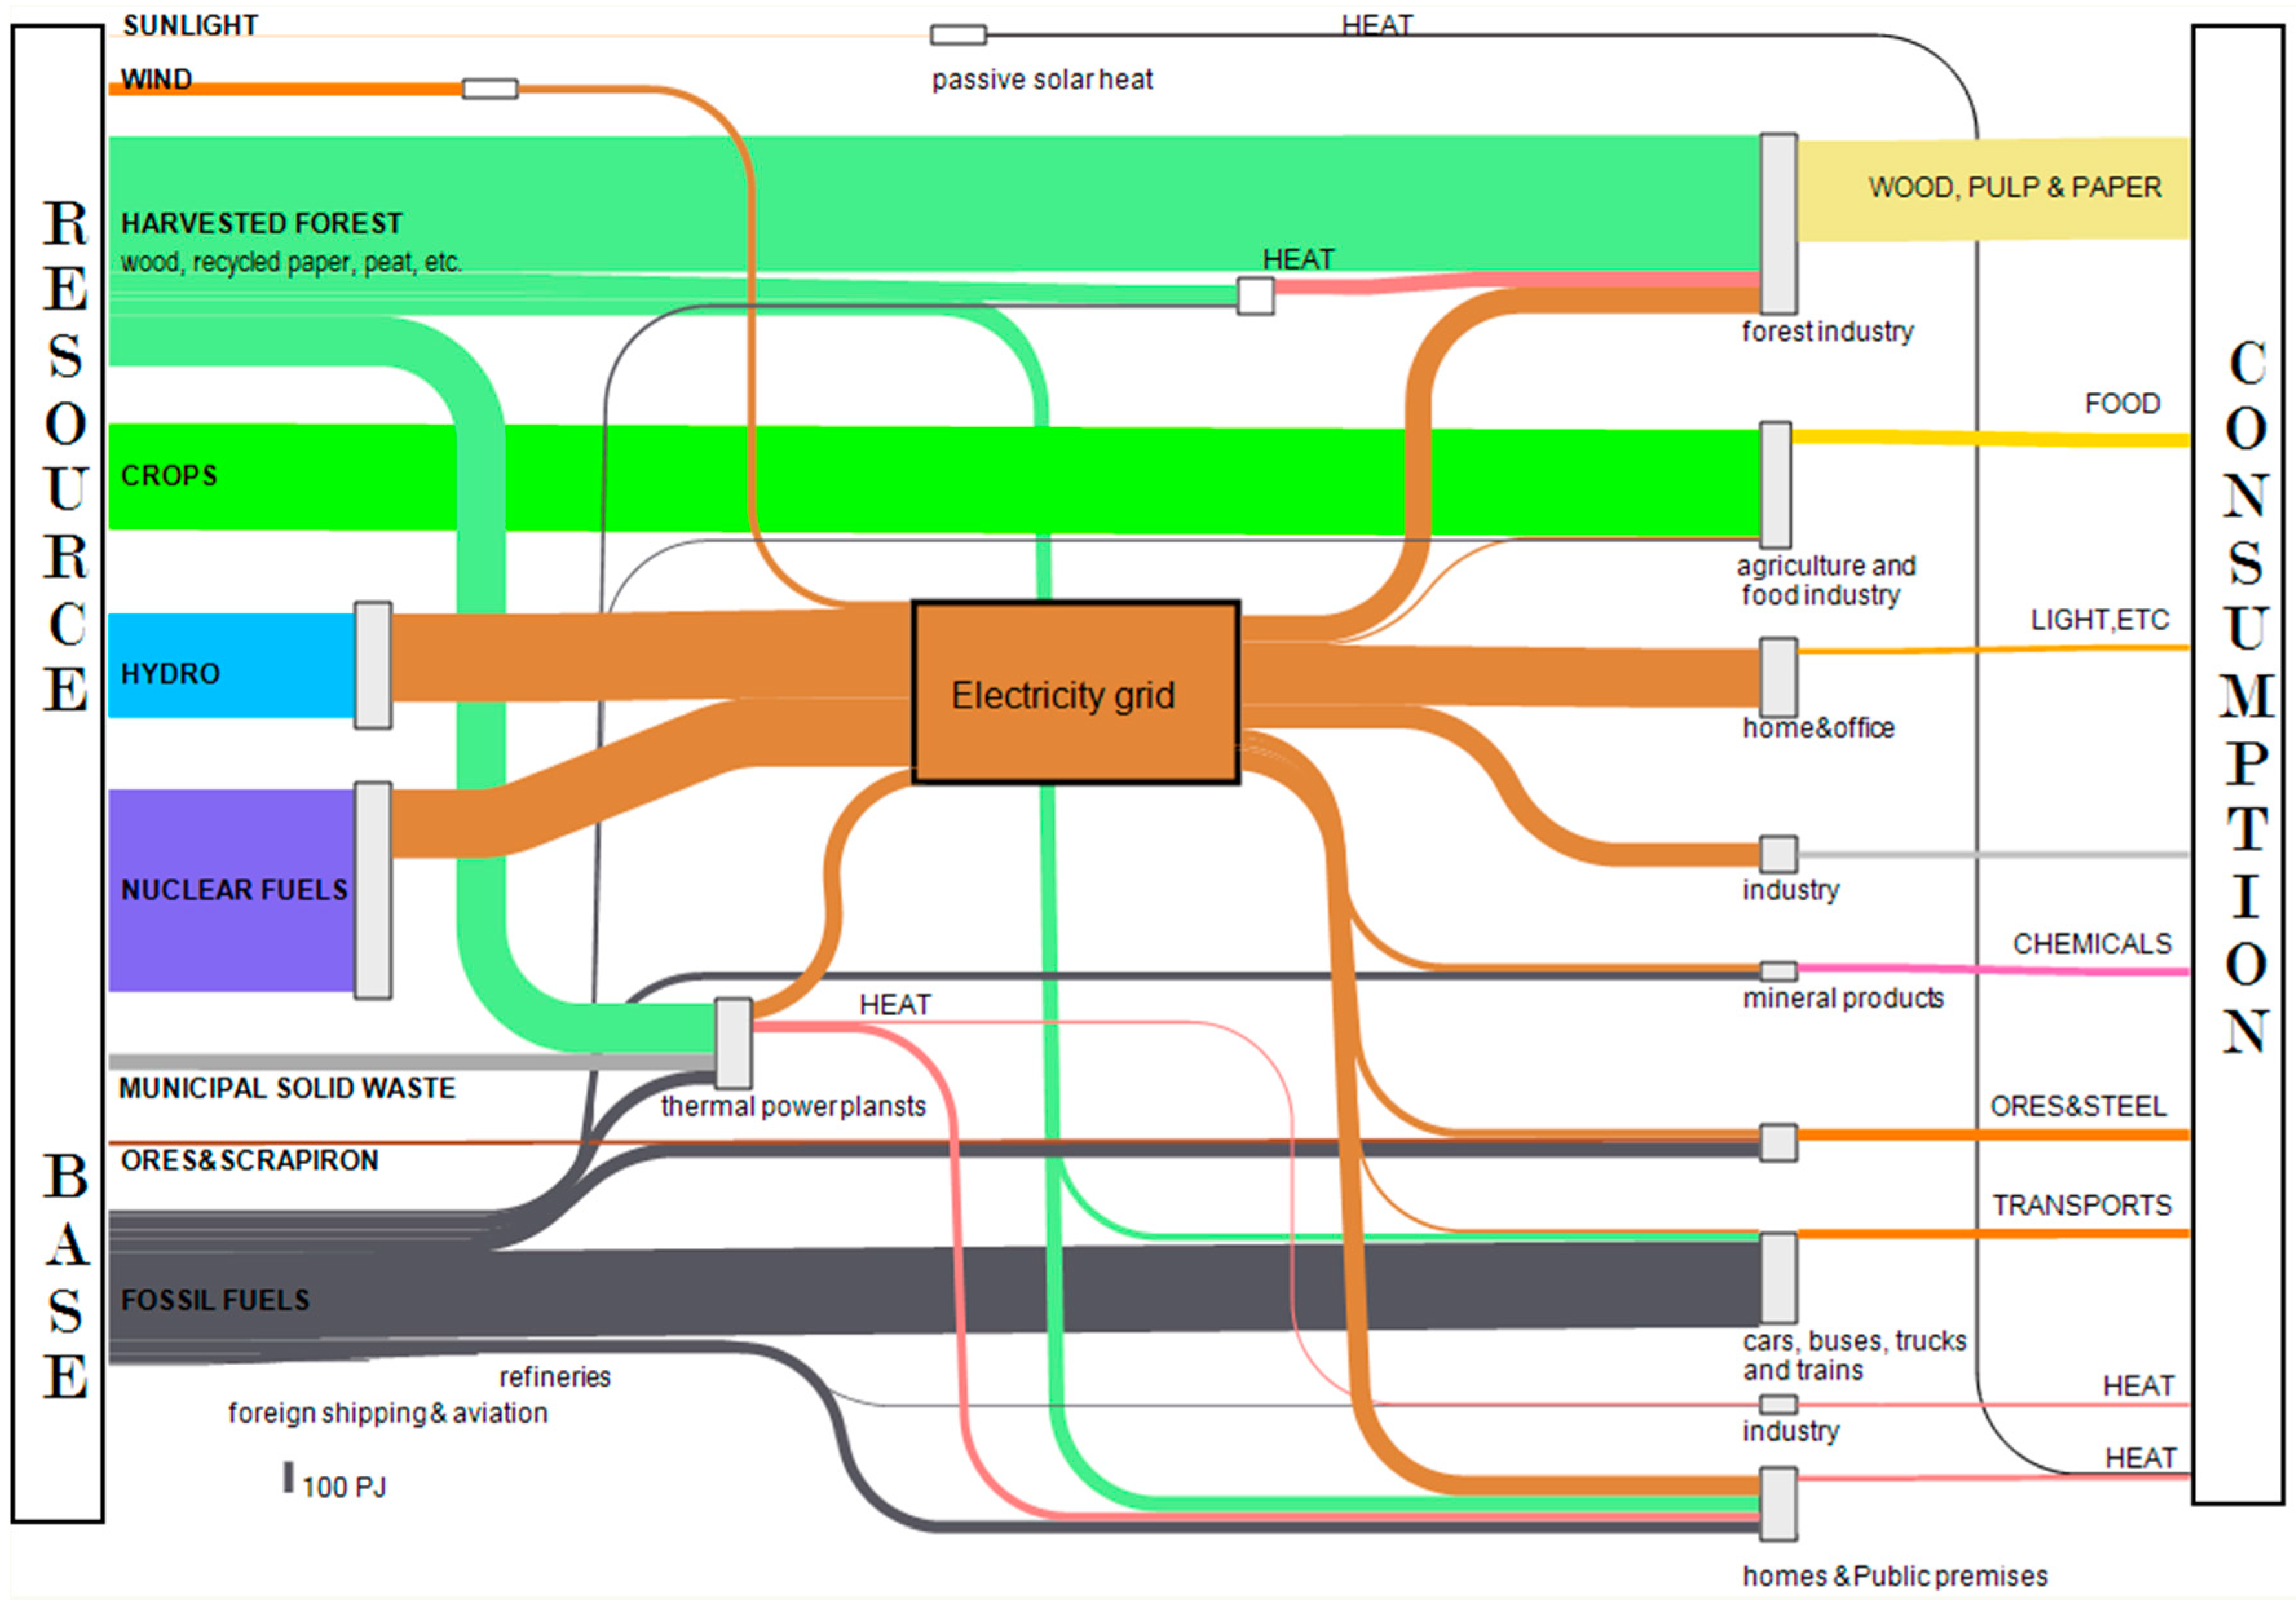
The main conversions of energy and material resources in the Swedish society in 2012 are shown by the exergy flow diagram in Figure 8. As discussed above, the flows of resources goes from left to right in the diagram, i.e., from the resource base to final consumption. The diagram represents the supply of physical resources into the society from different sectors and how these resources are being converted into goods and services for consumption in a number of different processes. The width of the flows is defined by their exergy content and the unit of the flows is PJ/year. The unfilled boxes represent conversion processes of resources from one form into another and always with the efficiency less than 1. The inaccuracies of the flows vary among the different parts. For the electricity and district heating system the accuracy is quite high. However, for the same cannot be said regarding agriculture and forestry with completely different conditions for obvious reasons. In order to make the diagram less complicated only exergy flows exceeding 5 PJ/year were included but with few exceptions.
The inflows were ordered according to their origins from renewable resources such as natural flows, e.g., sunlight and wind, and flows from fund resources, e.g., biomass and hydro, to non-renewable resources or flows from deposit resources, e.g., nuclear and fossil fuels. Even though the sunlight was far less than 5 PJ/year, it is made visible in order to show the direct use of a renewable natural flow. Wind power increase year by year and recently reached well over 5 PJ annually. Both the use of sunlight and wind is increasing. Harvested forests, agricultural crops and hydropower are renewable exergy flows deriving from funds founded on the renewable natural flow of sunlight. Municipal solid waste is classified as a renewable resource since it mainly originates from biomass. However, municipal solid waste also contains non-renewable resources or non-biogenic matter. In 2012 the Swedish household waste amounted to 4.4 Mton or about 1 kg per capita per day, of which 32% went to material recycling, 15% to biological treatment, 52% to energy recovery, and less than 1% to landfill [48]. Household waste was also imported to Sweden for energy recovery, standing for nearly 54 PJ or 12% of the total energy for generating both electricity and heat in 2012 [49]. Iron ore, nuclear fuels and fossil fuels are classified as non-renewable exergy flows from deposits, which are both exhaustible and carrier of toxic substances.
The resources actually demanded in the society appear as outflows on the right hand side of the diagram. The demand for non-renewable resources was very high in the transport section due to the dominating dependence on petrol and diesel. This dependence will likely remain for many years to come or until renewable transportation systems will be available and affordable.
During 2012 the total inflow of resources accounted to about 2700 PJ or 280 GJ/capita and the net output were 530 PJ or 55 GJ/capita. Thus, the overall efficiency of the supply sector can be estimated to about 20%. Some sectors have a much lower efficiency; especially sectors with extremely poor utilization of incoming exergy, such as food producing sector, transport sector and sectors with high exergy inputs in addition to low exergy needs, e.g., space heating.
6. Comparison with Other Studies
Exergy flow diagrams from a number of previous studies, from several countries are available, for example Sweden, Ghana, Japan, Italy and Norway. Due to differences in the classification of data in the original databases, the results are not entirely comparable. However, this does not interfere with the main conclusions drawn from this comparison. Table 4 shows the resource input, output, overall efficiency, and the renewable share of total resource use for this and some early studies. Only studies that cover both energy and material resources are considered. Overall efficiency is the part of the primary resource that reaches the end user. The renewable share is defined as the fraction of the total resource input that originates from renewable resources. This renewable share together with the overall efficiency offers an indicator of sustainability [1].
Compared to previous studies for Sweden [3,4,50,51] wind power and municipal solid waste now appear in the resource base. The overall efficiency is more or less the same, but the renewable share has increased from 32% to 47% in 2012.
In a strict physical sense some societies seems more efficient than others, however in a wider perspective a society cannot be simplified like this [25]. Still, exergy analysis can be used in order to better understand the quality of and degradation of physical resources in the society at all levels. The overall efficiency varies from 14% for Sweden 1994 to 24% for Norway 1995.
Norway, the land of fjords, has a higher renewable share since more than 90% of the electricity comes from hydro. China has a higher renewable share than expected due to a large amount of resources from agricultural yields and biomass (straw and firewood). If material use was excluded, the renewable share for China will decrease to 20% [53]. Japan and Italy have lower renewable shares since more than half of the incoming exergy are fossil fuels used for transports and heating.
7. Discussion
7.1. Renewable Exergy Share
From about 1985 the total exergy use, the production of electricity, and the resource use in all sectors of the society has been more or less constant. The only main change since 1970 is the phase out of fossil fuels in favor of electricity from nuclear power for space heating purposes. Since 1985 about half of the electricity production originates from nuclear power. Electricity from hydro power and conventional thermal power has been more or less constant for the last decade. Thermal power plants have a significant contribution to the end use, however, with heavy exergy losses. Wind power is increasing a lot in the new millennium and will continue to grow. Sweden has almost completely managed to redirect the district heating supply system away from fossil fuels.
The residential and service sector in many societies represents a major sector of exergy destruction from poor conversion efficiency and heavy use of fossil fuels. However, in this sector the use of fossil fuel has decreased from over 400 PJ in 1970 to about 50 PJ today. The transportation sector is still heavily depending on fossil fuels, which indicate that a renewable transportation system will be a major topic for the future. The industry sector has reduced its use of fossil fuels from about 300 PJ in 1970 to about 100 PJ annually, mainly by introducing electricity from nuclear power and biofuels.
7.2. Exergy Efficiency
The exergy flow diagram of the Swedish district heating system reveals extremely poor utilization of energy resources. While the inflow of resource is about 226 PJ, only about one third of 36 PJ remains in the final use as space heat or a comfortable indoor climate. This indicates a need for large improvements and savings. The same is true for the total exergy flow diagram for Sweden and specifically in the production of food, transports, and low temperature heat. All these sectors show an efficiency of about 10% or less. It is also of importance to check the net utilization from the exergy flow diagram when a resource is converted in several steps before it reaches final consumption. This is the case for nuclear fuel used for space heating by electric heaters, i.e., generating heat from electric short circuiting. The exergy flow diagram in Figure 2 and Figure 8 show that the net efficiency becomes about 1.5% or about 30% times 5%, see Table 1. In addition nuclear power in Sweden only extracts about 1.5% of the available exergy in the nuclear fuel due to physical limitations in the nuclear process from light water reactor technology. This, however, cannot be seen from this exergy flow diagram. The potentially available exergy of the nuclear fuel is about 60 times larger than the depicted flow of nuclear fuel in Figure 8, which makes it impossible to add this to the exergy flow diagram in this case. Thus, when nuclear fuel is used in a light water reactor to produce electricity that is later converted to space heat in electrical resistors, the net utilization of exergy is about 0.02%.
7.3. Possible Improvement
The accuracy in this study varies due to limitations in available statistical data. The comparison with different countries must be done with caution due to differences in data structure and classification. Accuracy can be improved with better statistics and a common data structure and classification.
In this analysis the final utilization of exergy by end user was excluded except for some minor comments in Section 3.2 on district heat. However, in order to improve the exergy efficiency in a society this must include also the end users as well as a careful analysis of their actual need or purpose. Electricity delivered to household is often used for lighting, cooking, heating, cooling, and electric equipment with poor exergy efficiency. Thus, most of the delivered exergy is destroyed in poor conversion processes. By using low exergy renewable energy resources, such as geothermal and solar thermal energy for heating purpose exergy efficiency will increase. Also by adopting economizing and conservational methods the need can be reduced considerably. Better planning of the transportation and distribution of goods and people could probably save both resources and time. Efficiency may also be improved by looking closer into each process since this may disclose inefficient sub processes.
8. Concluding Remarks
By applying exergy to the Swedish resource supply system for the period 1970–2013 and by drawing exergy flow diagrams the development of sustainability can be evaluated with respect to efficiency and renewable share. Exergy analysis offers detailed and valuable information.
Sweden has successfully phased out fossil fuels in district heating production. Even though electricity from wind and solar have increased, still half of the electricity comes from nuclear power.
The transport sector has the highest non-renewable share in Sweden. The renewable share has increased in all sectors with the support of electricity certificate and other policies. However, district heat has a low exergy share of the supply due to its heat at relatively low temperature.
In 2012, the total exergy input of energy and material resources amounts to about 2700 PJ of which about 530 PJ was consumed by the final user. The renewable share in the Swedish society has increased from 42% to 47%, however, the overall efficiency has not improved.
Among the available studies for different countries Norway has the highest renewable share and Japan has the lowest. The overall efficiencies for most countries were about 20%. A more exergy efficient technology and a higher renewable share together with more focus on economizing, conservation and better planning are needed in order to become a more sustainable society.
Author Contributions
The authors have contributed their efforts to make sure the paper is qualified. Göran Wall assisted the work and some writing. Mei Gong performed calculations, tables, figures, and wrote most of the paper.
Conflicts of Interest
The authors declare no conflict of interest.
References
- Wall, G. Exergy, Life and Sustainable Development. Probl. Sustain. Dev. 2013, 8, 27–41. [Google Scholar]
- Wall, G. Exergy, ecology and democracy—Concepts of a vital society or a proposal for an exergy tax. In Proceedings of the International conference on energy systems and ecology, Krakow, Poland, 5–9 July 1993.
- Wall, G. Exergy—A Useful Concept within Resource Accounting; Institute of Theoretical Physics: Göteborg, Sweden, 1977. [Google Scholar]
- Wall, G. Exergy conversion in the Swedish society. Res. Energy 1987, 9, 55–73. [Google Scholar] [CrossRef]
- Wall, G. Exergy conversion in the Japanese society. Energy 1990, 15, 435–444. [Google Scholar] [CrossRef]
- Wall, G.; Sciubba, E.; Naso, V. Exergy use in the Italian society. Energy 1994, 19, 1267–1274. [Google Scholar] [CrossRef]
- Gong, M.; Wall, G. On exergy and sustainable development—Part 2: Indicators and methods. Exergy Int. J. 2001, 1, 217–233. [Google Scholar] [CrossRef]
- Rosen, M.A. Evaluation of energy utilization efficiency in Canada using energy and exergy analyses. Energy 1992, 17, 339–350. [Google Scholar] [CrossRef]
- Ertesvåg, I.S.; Mielnik, M. Exergy analysis of the Norwegian society. Energy 2000, 25, 957–973. [Google Scholar] [CrossRef]
- Szargut, J.; Morris, D.R.; Steward, F.R. Exergy Analysis of Thermal, Chemical, and Metallurgical Processes; Hemisphere Publishing Corporation: New York, NY, USA, 1988. [Google Scholar]
- Gong, M. Exergy analysis of a pulp and paper mill. Int. J. Energy Res. 2005, 29, 79–93. [Google Scholar] [CrossRef]
- Ozgener, L.; Hepbasli, A.; Dincer, I. Energy and exergy analysis of Salihli geothermal district heating system in Manisa, Turkey. Int. J. Energy Res. 2005, 29, 393–408. [Google Scholar] [CrossRef]
- Kotas, T.J. The Exergy Method of Thermal Plant Analysis; Krieger Publishing Company: Malabar, FL, USA, 1995. [Google Scholar]
- Piacentino, A. Application of advanced thermodynamics, thermoeconomics and exergy costing to a Multiple Effect Distillation plant: In-depth analysis of cost formation process. Desalination 2015, 371, 88–103. [Google Scholar] [CrossRef]
- Valero, A.; Domínguez, A.; Valero, A. Exergy cost allocation of by-products in the mining and metallurgical industry. Res. Conser. Recycl. 2015, 102, 128–142. [Google Scholar] [CrossRef]
- Chen, G.Q.; Chen, B. Extended-exergy analysis of the Chinese society. Energy 2009, 34, 1127–1144. [Google Scholar] [CrossRef]
- Seckin, C.; Sciubba, E.; Bayulken, A.R. An application of the extended exergy accounting method to the Turkish society, year 2006. Energy 2012, 40, 151–163. [Google Scholar] [CrossRef]
- Ertesvåg, I.S. Energy, exergy, and extended-exergy analysis of the Norwegian society 2000. Energy 2005, 30, 649–675. [Google Scholar] [CrossRef]
- Chen, B.; Chen, G.Q. Exergy analysis for resource conversion of the Chinese Society 1993 under the material product system. Energy 2006, 31, 1115–1150. [Google Scholar] [CrossRef]
- Chen, G.Q.; Chen, B. Resource analysis of the Chinese society 1980–2002 based on exergy—Part 1: Fossil fuels and energy minerals. Energy Policy 2007, 35, 2038–2050. [Google Scholar] [CrossRef]
- Chen, B.; Chen, G.Q. Resource analysis of the Chinese society 1980–2002 based on exergy—Part 2: Renewable energy sources and forest. Energy Policy 2007, 35, 2051–2064. [Google Scholar] [CrossRef]
- Chen, B.; Chen, G.Q. Resource analysis of the Chinese society 1980–2002 based on exergy—Part 3: Agricultural products. Energy Policy 2007, 35, 2065–2078. [Google Scholar] [CrossRef]
- Chen, B.; Chen, G.Q. Resource analysis of the Chinese society 1980–2002 based on exergy—Part 4: Fishery and rangeland. Energy Policy 2007, 35, 2079–2086. [Google Scholar] [CrossRef]
- Chen, G.Q.; Chen, B. Resource analysis of the Chinese society 1980–2002 based on energy—Part 5: Resource structure and intensity. Energy Policy 2007, 35, 2087–2095. [Google Scholar] [CrossRef]
- Ertesvåg, I.S. Society exergy analysis: a comparison of different societies. Energy 2001, 26, 253–270. [Google Scholar] [CrossRef]
- Wall, G. Exergy—A Useful Concept. Ph.D. Thesis, Chalmers University of Technology, Göteborg, Sweden, 1986. [Google Scholar]
- Wall, G.; Gong, M. On exergy and sustainable development—Part 1: Conditions and concepts. Exergy Int. J. 2001, 1, 128–145. [Google Scholar] [CrossRef]
- Gouy, G. About available energy. J. Phys. II 1889, 8, 501–518. (In French) [Google Scholar]
- Stodola, A. The cyclic processes of the gas engine. Z. VDI 1898, 32, 1086–1091. (In German) [Google Scholar]
- Nakićenović, N.; Gilli, P.V.; Kurz, R. Regional and global exergy and energy efficiencies. Energy 1996, 21, 223–237. [Google Scholar] [CrossRef]
- Gong, M.; Werner, S. Exergy analysis of network temperature levels in Swedish and Danish district heating systems. Renew. Energy 2015, 84, 106–113. [Google Scholar] [CrossRef]
- Vindkraftstatistik 2014 (Wind Power Statistics 2014); Swedish Energy Agency: Eskilstuna, Sweden, 2015.
- Lindahl, J. National Survey Report of PV Power Applications in Sweden 2014; International Energy Agency: Uppsala, Sweden, 2015. [Google Scholar]
- Swedish Energy Agency, Statistics Sweden. El-, gas- och fjärrvärmeförsörjningen (Electricity supply, district heating and supply of natural gas). Available online: http://www.scb.se/ (accessed on 1 September 2016).
- Lindahl, J. National Survey Report of PV Power Applications in Sweden 2012; Swedish Energy Agency: Eskilstuna, Sweden, 2013. [Google Scholar]
- Gong, M.; Werner, S. An assessment of district heating research in China. Renew. Energy 2015, 84, 97–105. [Google Scholar] [CrossRef]
- Frederiksen, S.; Werner, S. District Heating and Cooling; Studentlitteratur AB: Lund, Sweden, 2013. [Google Scholar]
- Gong, M.; Werner, S. Mapping Energy and Exergy Flows of District Heating in Sweden. In Proceedings of the 15th International Symposium on District Heating and Cooling, Seoul, Korea, 4–7 September 2016.
- Energy in Sweden 2013; Swedish Energy Agency: Eskilstuna, Sweden, 2014.
- Energistatistik för Småhus, Flerbostadshus Och Lokaler 2014 (Summary of Energy Statistics for Dwellings and Non-Residential Premises for 2014); Swedish Energy Agency: Eskilstuna, Sweden, 2015.
- Siden, G. Förnybar Energi (Renewable Energy); Studentlitteratur: Lund, Sweden, 2015. [Google Scholar]
- Programme for Improving Energy Efficiency-Experiences and Results after Five Years with PFE; Swedish Energy Agency: Eskilstuna, Sweden, 2011.
- European Commission 2020 climate & energy package. Available online: http://ec.europa.eu/clima/policies/strategies/2020/index_en.htm (accessed on 1 September 2016).
- Pettersson, K.; Wetterlund, E.; Athanassiadis, D.; Lundmark, R.; Ehn, C.; Lundgren, J.; Berglin, N. Integration of next-generation biofuel production in the Swedish forest industry—A geographically explicit approach. Appl. Energy 2015, 154, 317–332. [Google Scholar] [CrossRef]
- Swedish Statistical Yearbook of Forestry 2014; Swedish Forest Agency: Jönköping, Sweden, 2014.
- 2012 Minerals Yearbook Sweden; U.S. Geological Survey: Reston, VA, USA, 2014.
- Statistisk Årsbok för Sverige 2014 (Statistical Yearbook of Sweden 2014); Statistics Sweden: Stockholm, Sweden, 2014.
- Swedish Waste Management; Swedish Waste Management (Avfall Sverige): Malmö, Sweden, 2013.
- El-, Gas- Och Fjärrvärmeförsörjningen 2013 (Electricity Supply, District Heating and Supply of Natural Gas 2013); Swedish Energy Agency, Statistics Sweden: Stockholm, Sweden, 2014.
- Wall, G. The Use of Natural Resources in Society. In EOLSS Our Fragile World; Tolba, M.K., Ed.; Eolss Publishers: Oxford, UK, 2001; pp. 209–230. [Google Scholar]
- Wall, G. Exergy use in the Swedish society 1994. In Thermodynamic analysis and improvement of energy systems. In Proceedings of the International Conference on Thermodynamic Analysis and Improvement of Energy Systems, Beijing, China, 10–13 June 1997.
- Chen, B.; Chen, G.Q.; Yang, Z.F. Exergy-based resource accounting for China. Ecol. Model. 2006, 196, 313–328. [Google Scholar] [CrossRef]
- Energy Balances of OECD/Non-OECD Countries 2014; International Energy Agency (IEA): Paris, France, 2014.
Figure 1.
Electricity production by sources without net import and export, 1970–2014. Data source: [34].
Figure 1.
Electricity production by sources without net import and export, 1970–2014. Data source: [34].
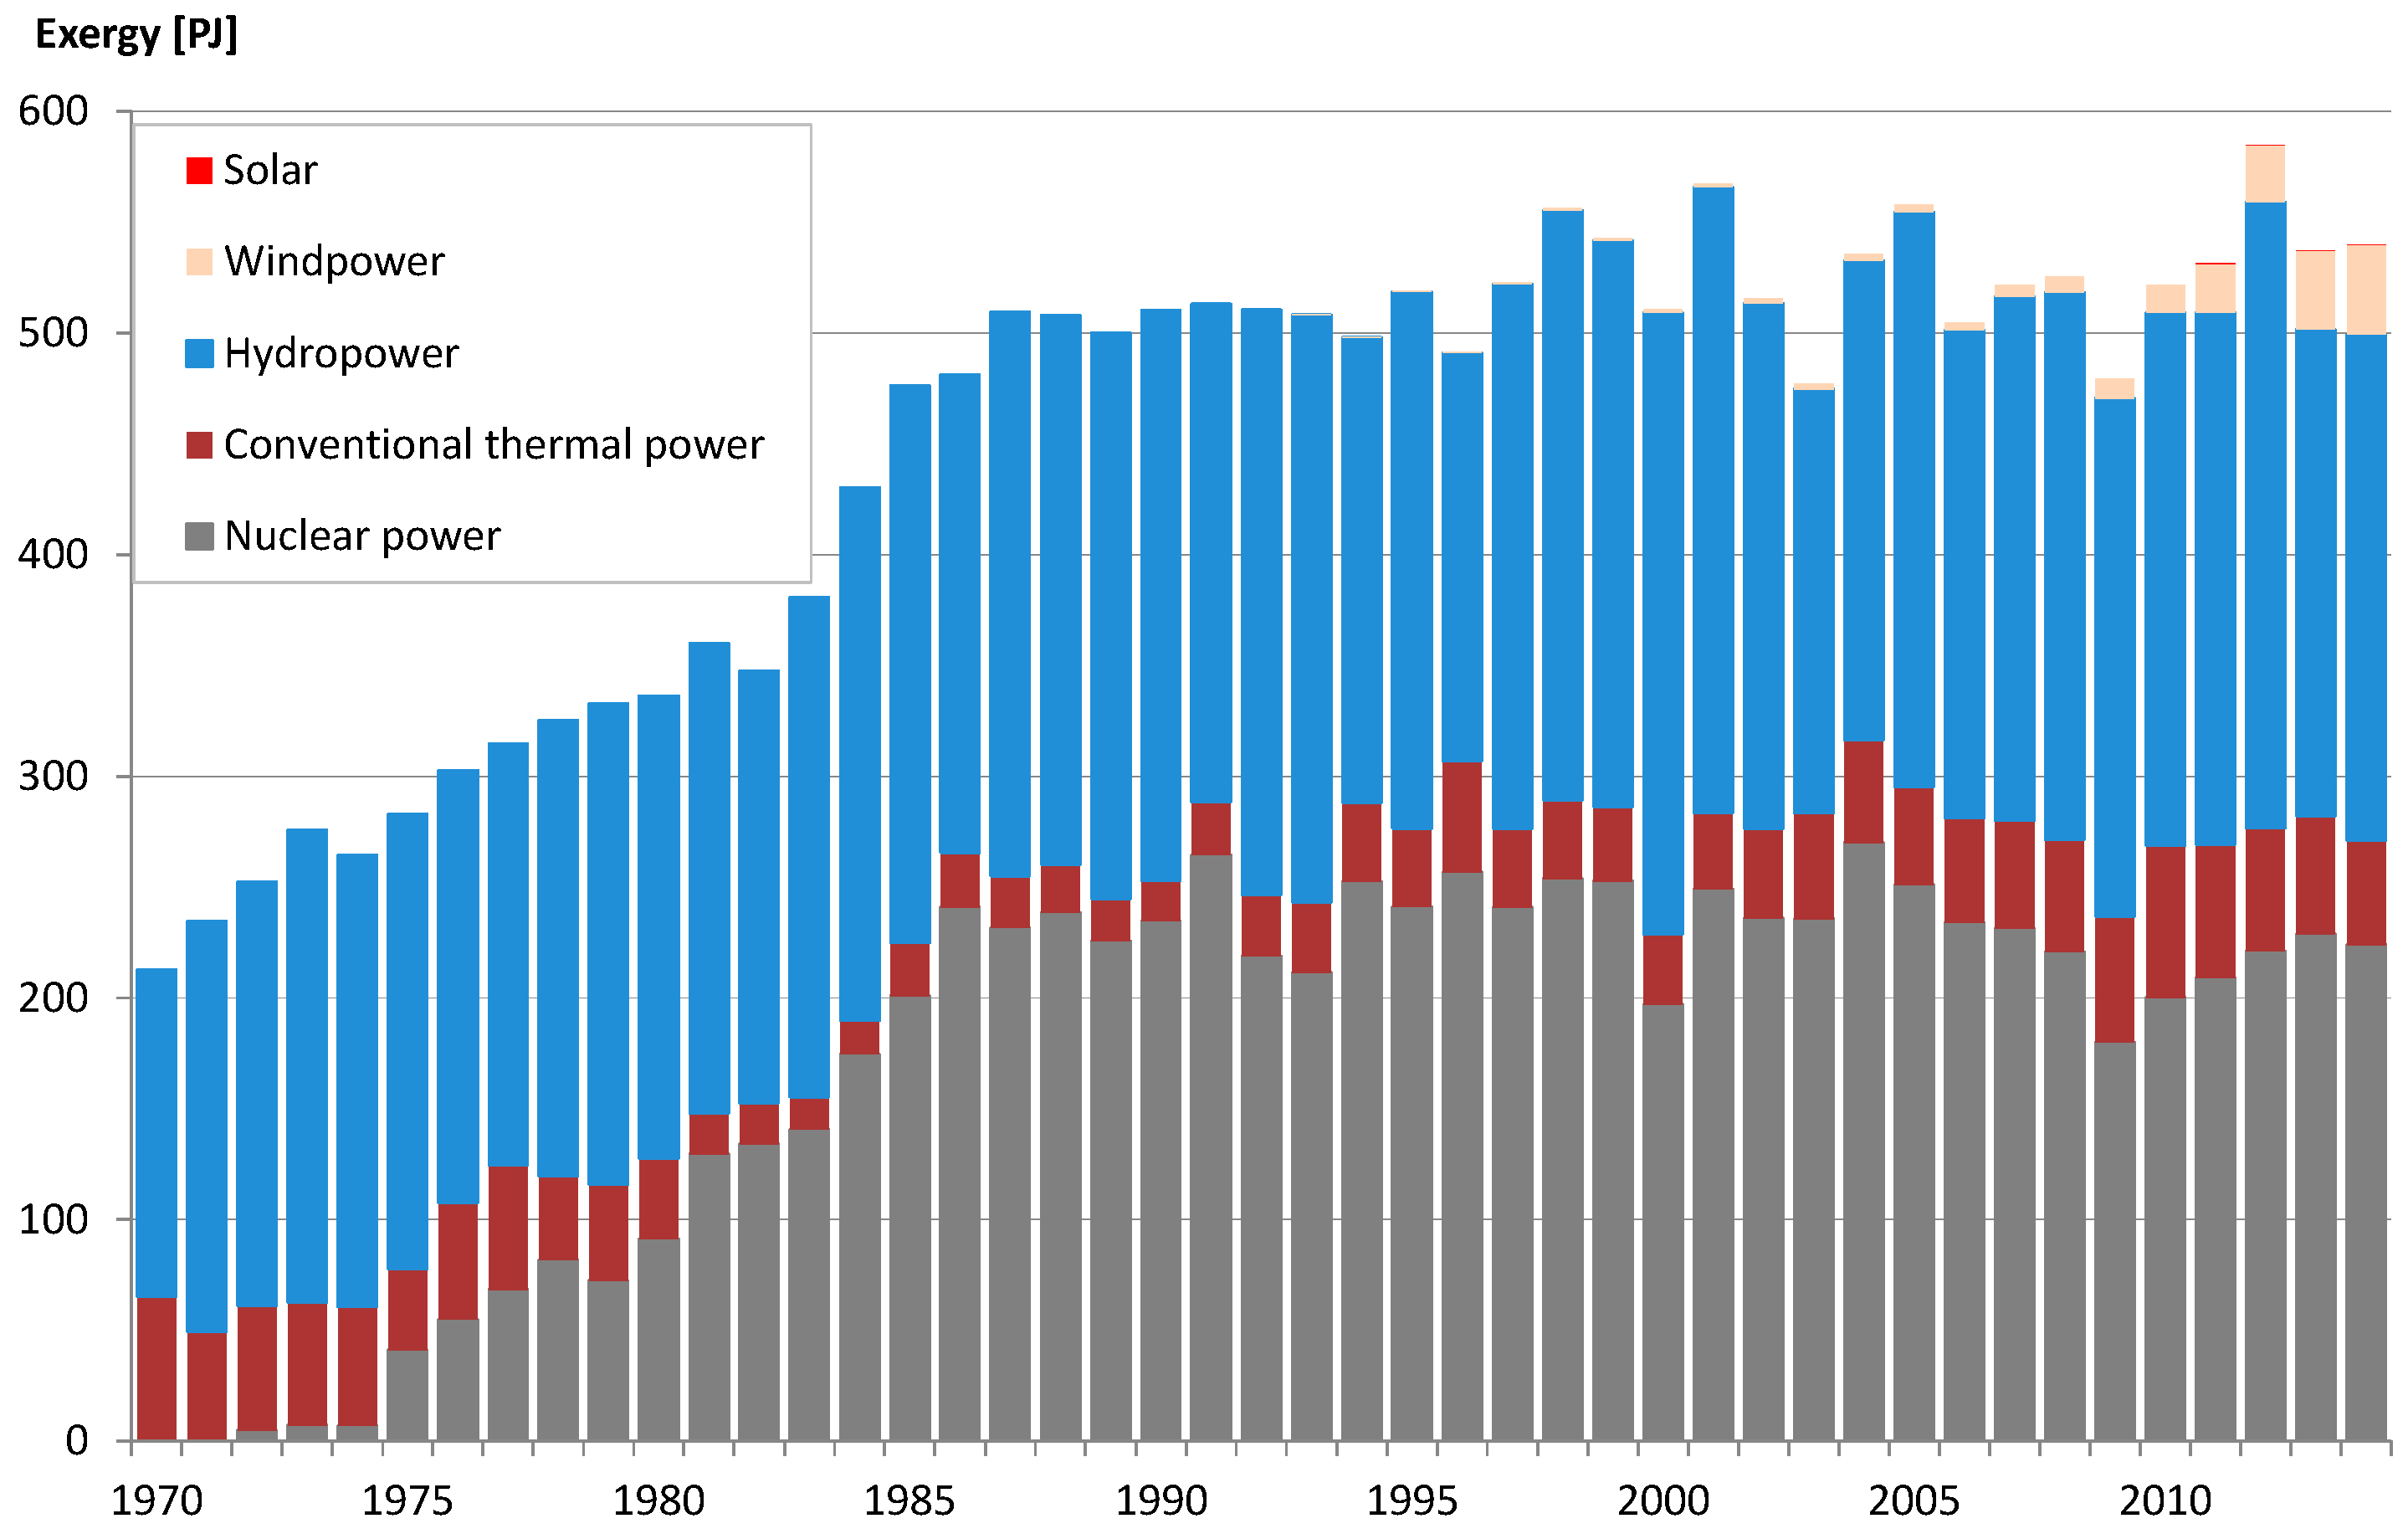
Figure 2.
Exergy flow diagram of the system for electricity in Sweden during 2012. Data source: [34].
Figure 2.
Exergy flow diagram of the system for electricity in Sweden during 2012. Data source: [34].

Figure 3.
Exergy flow diagram of the district heating system in Sweden in 2012. Data source: [34].
Figure 3.
Exergy flow diagram of the district heating system in Sweden in 2012. Data source: [34].
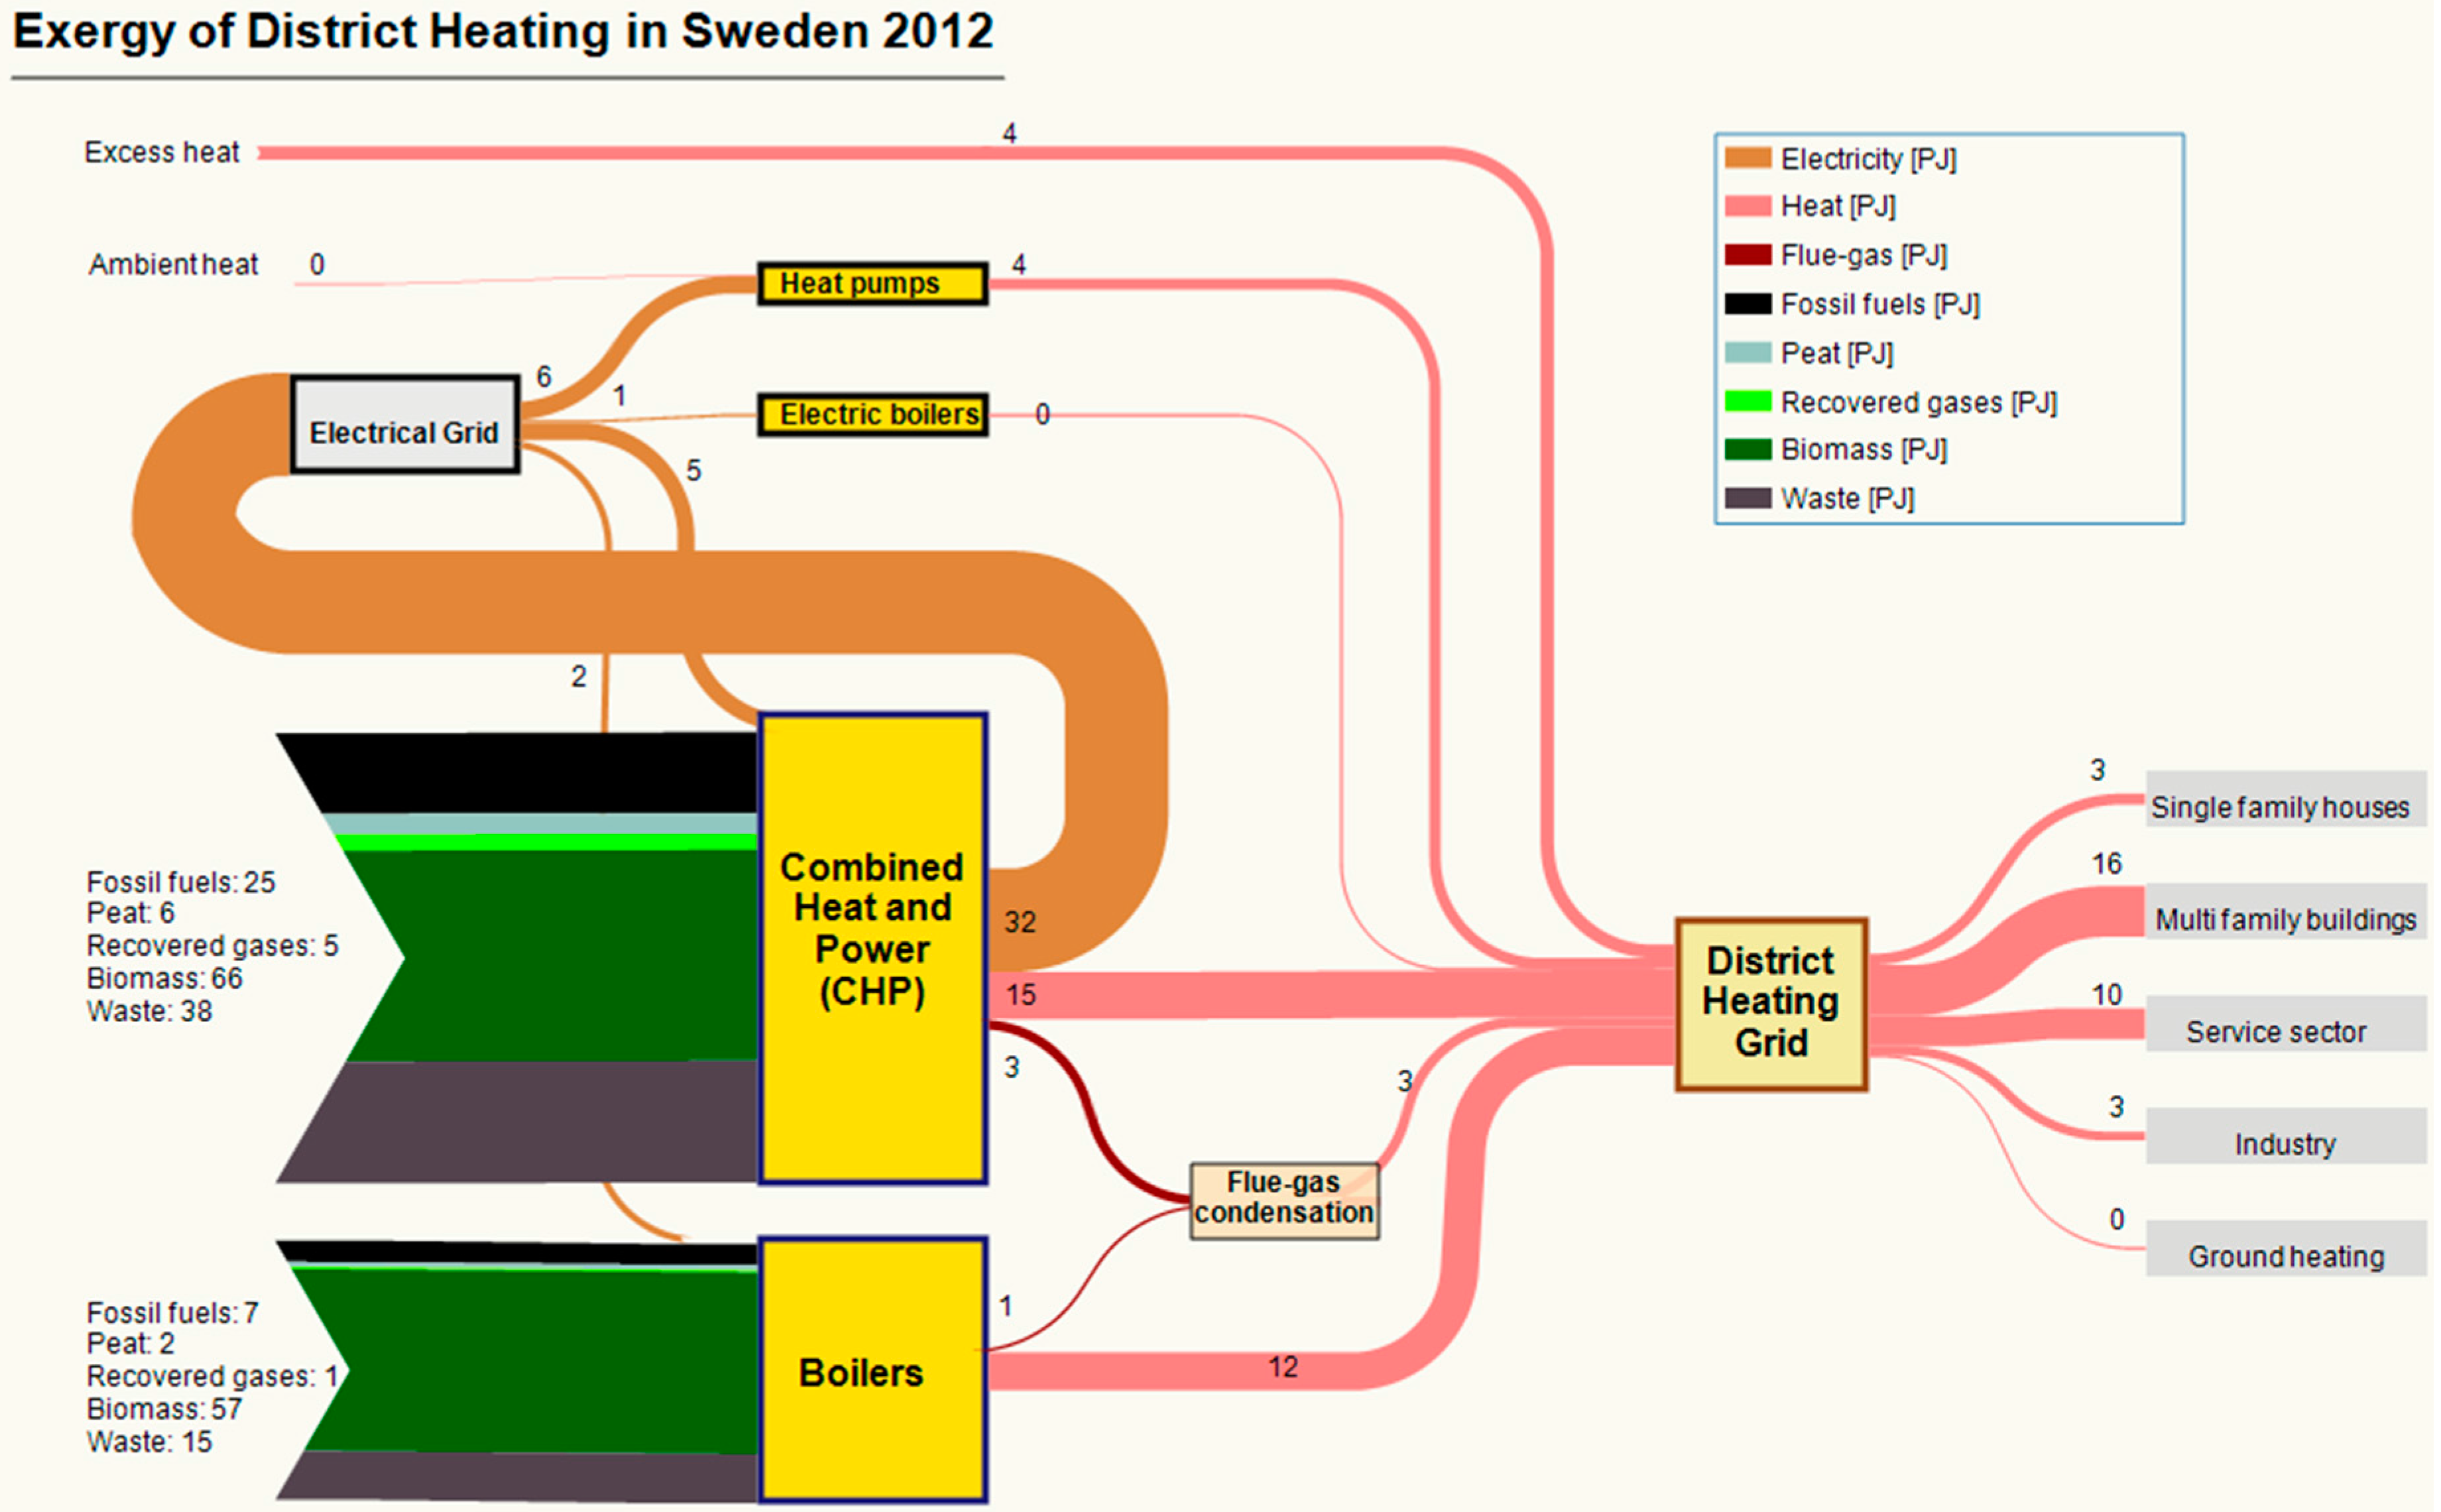
Figure 4.
Exergy use in the residential and services sector 1970–2013. Data source: [39].
Figure 4.
Exergy use in the residential and services sector 1970–2013. Data source: [39].

Figure 5.
Exergy use in the transport sector, including international transport 1970–2013. Data source: [39].
Figure 5.
Exergy use in the transport sector, including international transport 1970–2013. Data source: [39].

Figure 6.
Exergy use in the industrial sector 1970–2013. Data source: [39].
Figure 6.
Exergy use in the industrial sector 1970–2013. Data source: [39].
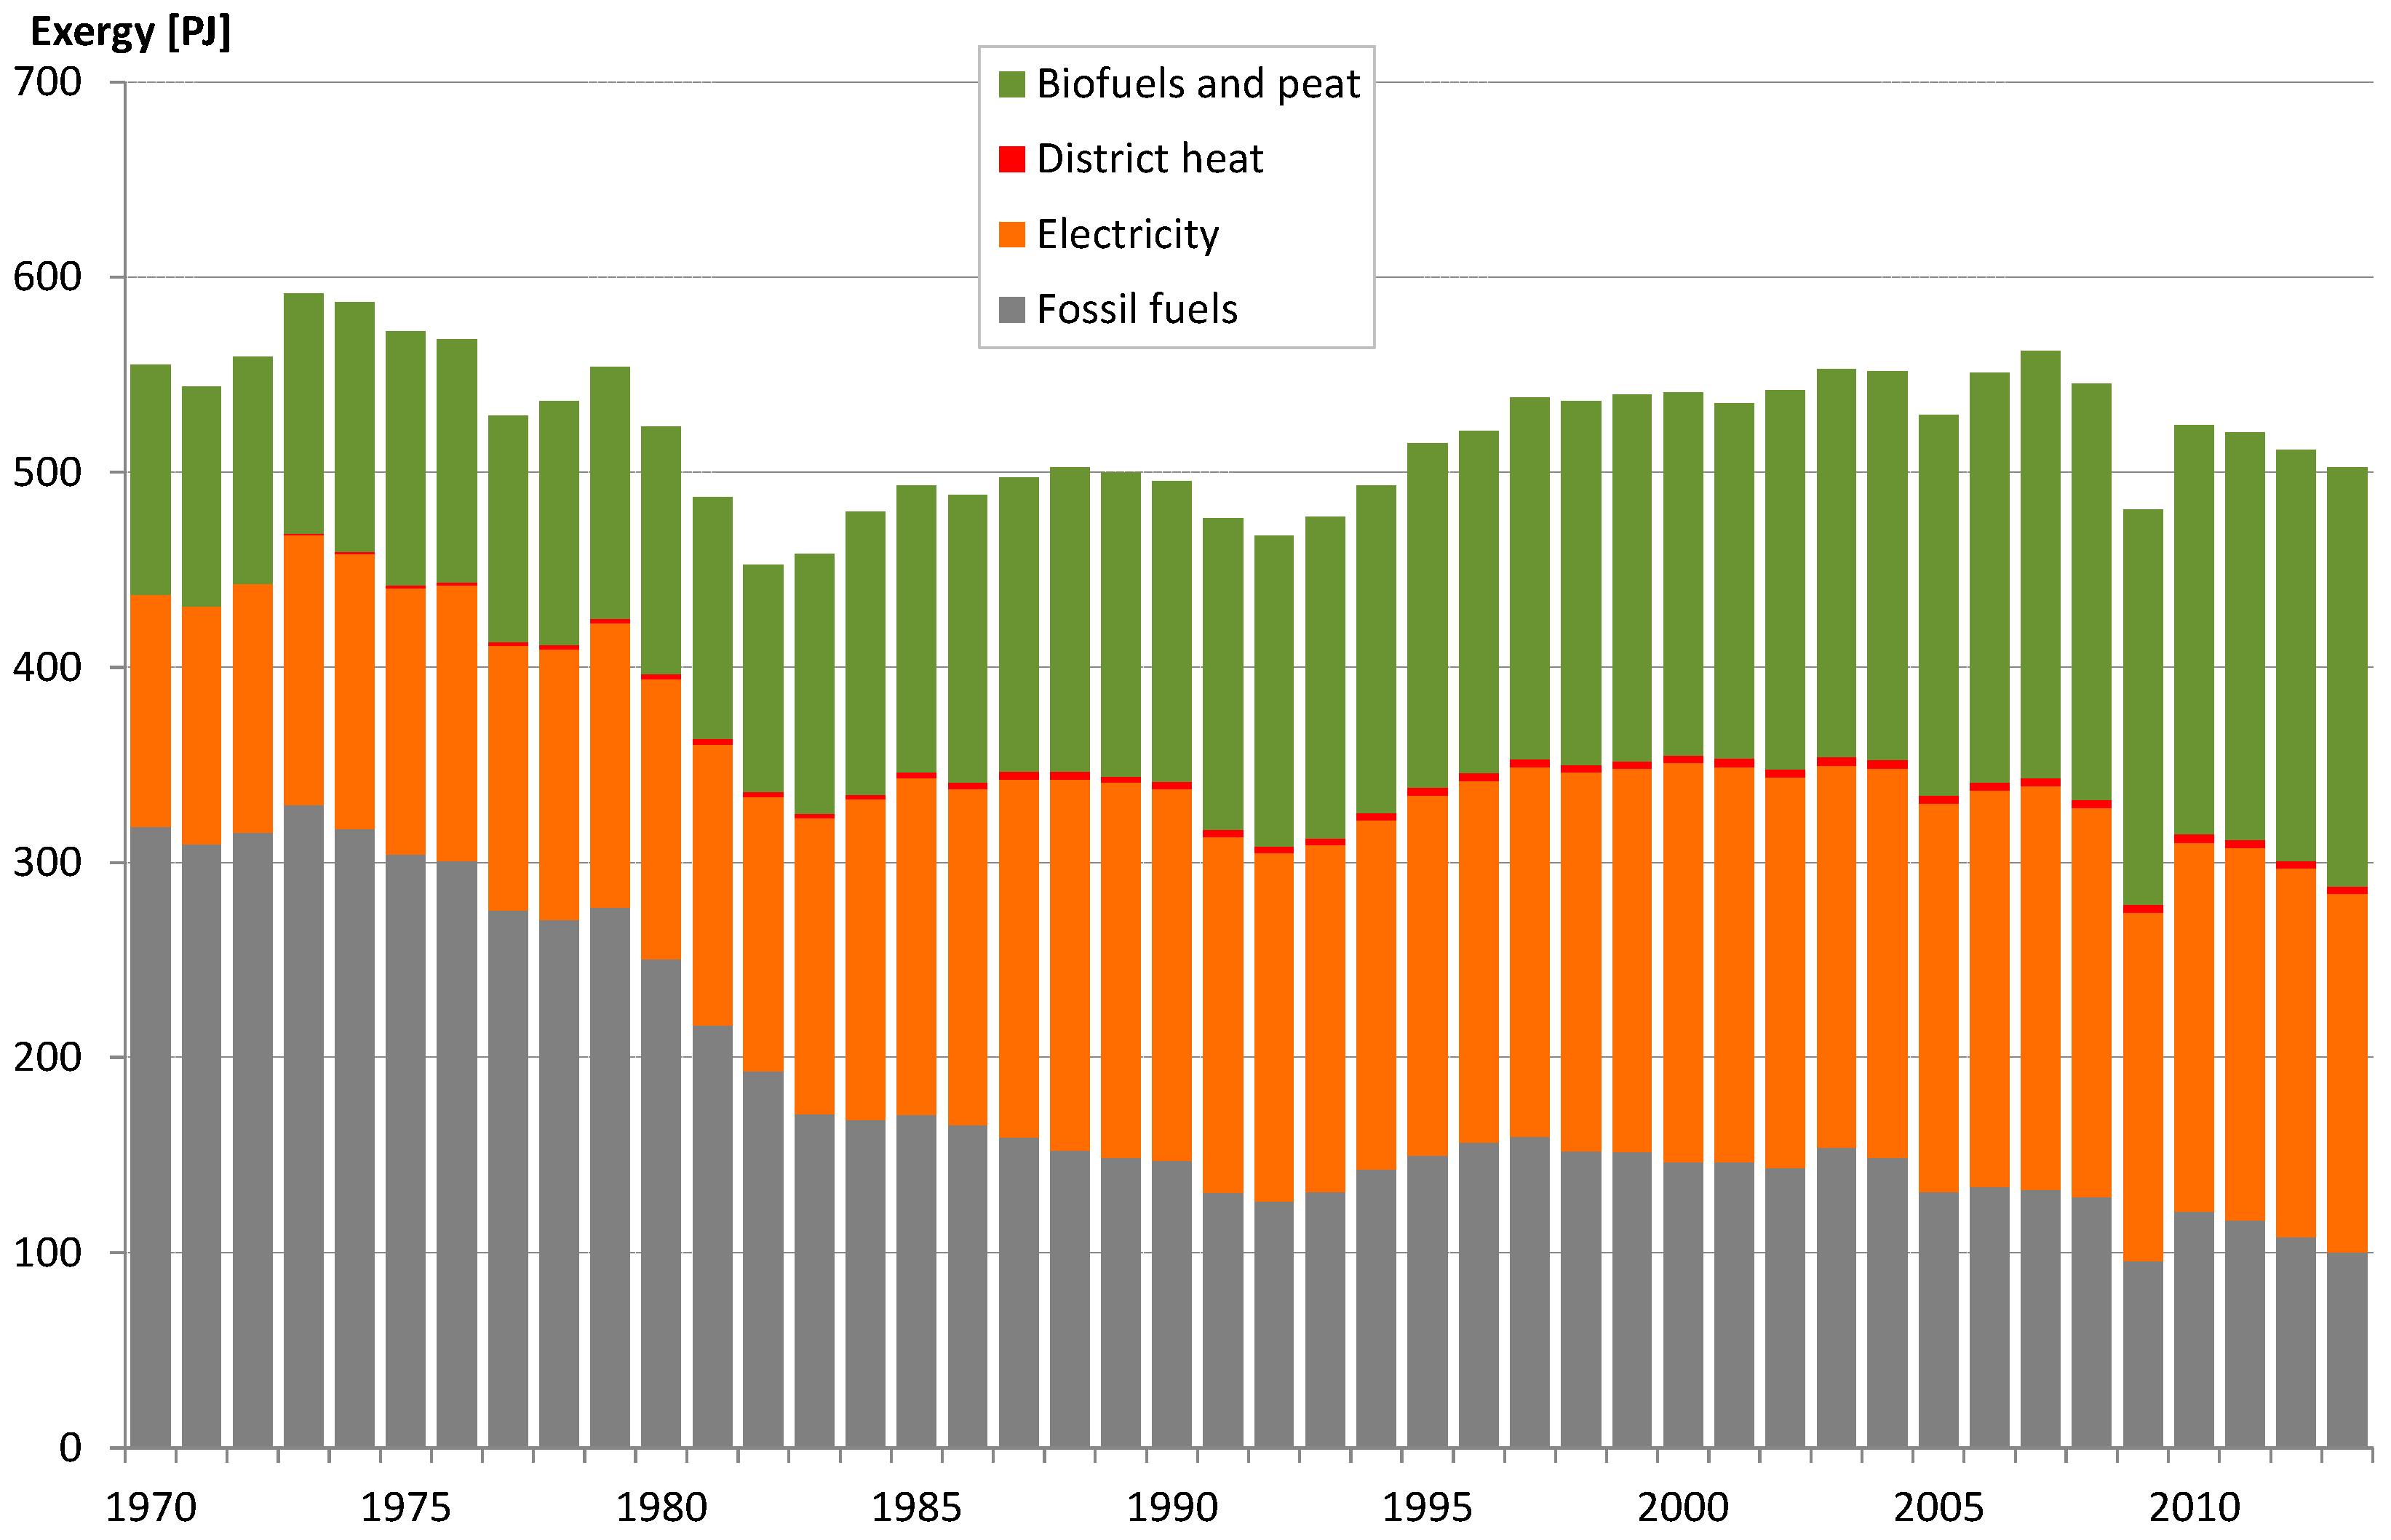
Figure 7.
Exergy use by energy carrier in Sweden 1970–2013. Data source: [39].
Figure 7.
Exergy use by energy carrier in Sweden 1970–2013. Data source: [39].
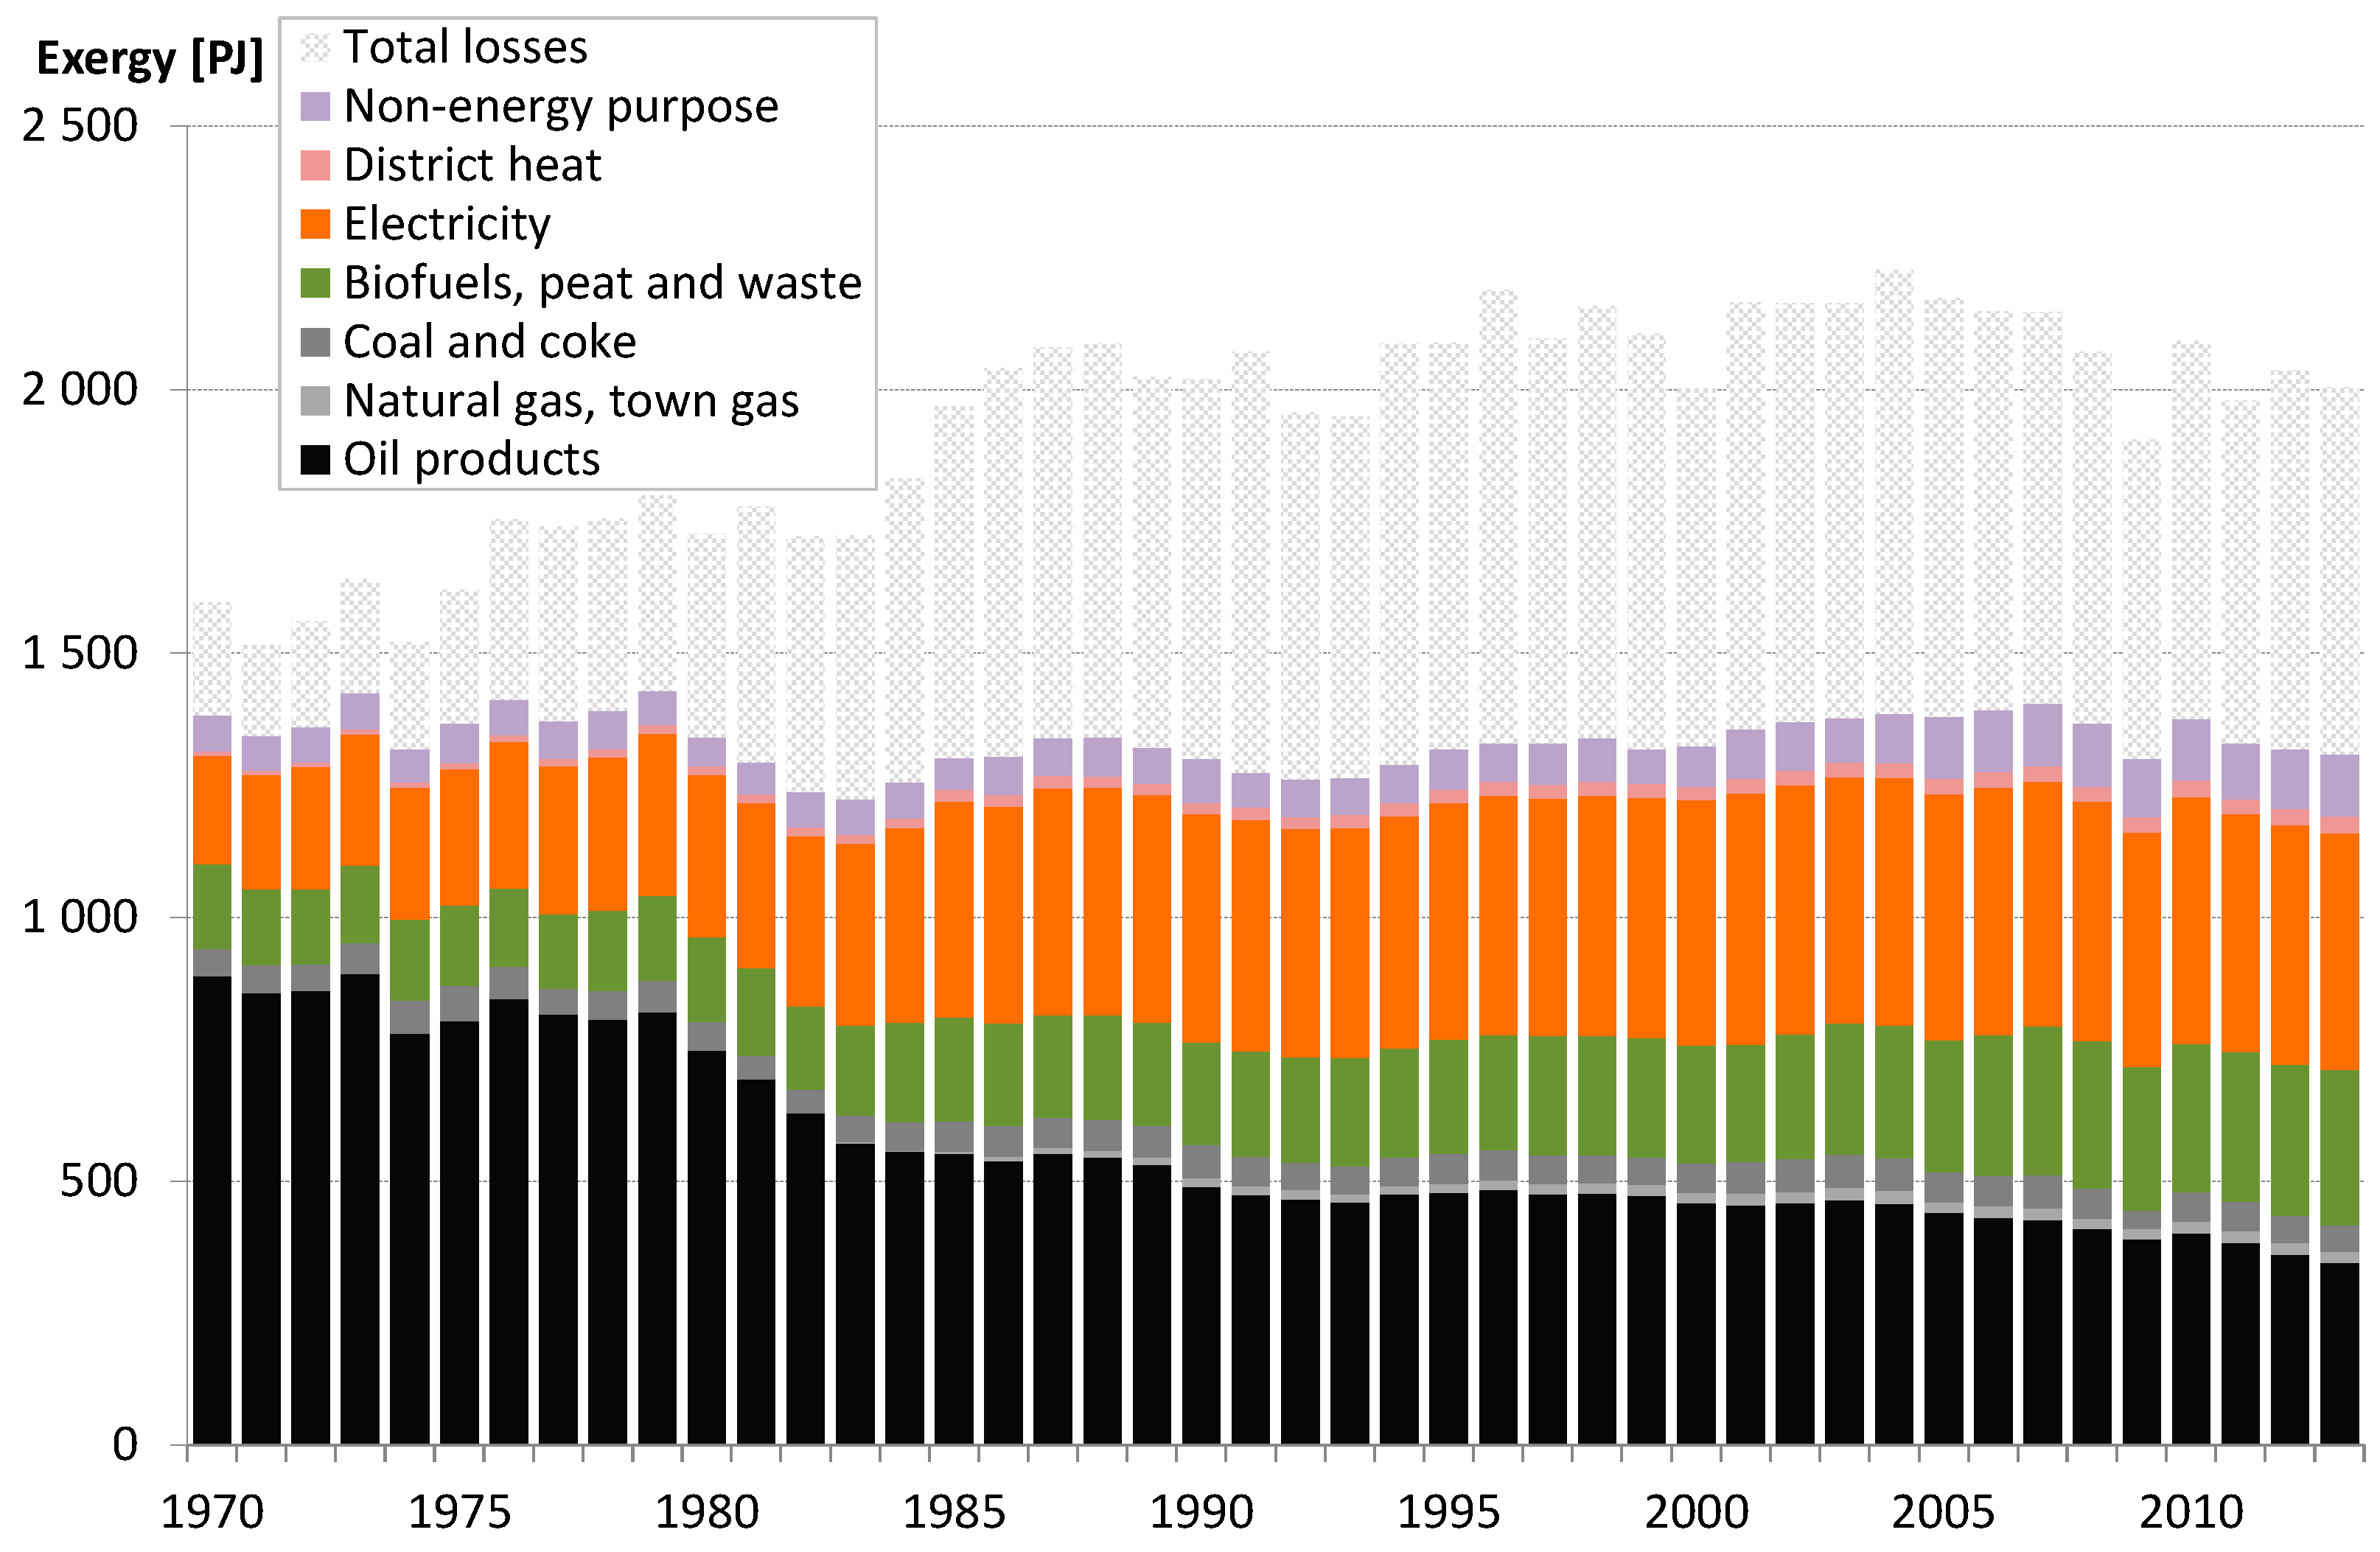
Figure 8.
Exergy flow diagram of the Swedish society in 2012. Total input about 2700 PJ or 280 GJ/capita, net output about 530 PJ or 55 GJ/capita.
Figure 8.
Exergy flow diagram of the Swedish society in 2012. Total input about 2700 PJ or 280 GJ/capita, net output about 530 PJ or 55 GJ/capita.

| Energy Form | Exergy Factor |
|---|---|
| Mechanical energy | 1.0 |
| Electrical energy | 1.0 |
| Chemical energy | about 1.0 a |
| Oil, petroleum products | 1.04 |
| Natural gas | 1.03 |
| Coal | 1.06 |
| Coke | 1.05 |
| Fuelwood (20% humidity) | 1.13 |
| Nuclear energy | 0.95 |
| Sunlight | 0.93 |
| Hot steam (600 °C) | 0.6 |
| District heat (current 3rd generation) | 0.17 b |
| Thermal energy at room temperature (20 °C) | 0–0.1 c |
| Thermal radiation from earth | 0 |
| Yield in | Mton | PJ/Mton | PJ |
|---|---|---|---|
| Winter wheat | 1.934 | 16 | 30.9 |
| Spring wheat | 0.356 | 16 | 5.7 |
| Rye | 0.14 | 15.5 | 2.2 |
| Winter barley | 0.06 | 15.5 | 0.9 |
| Spring barley | 1.641 | 15.5 | 25.4 |
| Oats | 0.731 | 17.9 | 13.1 |
| Triticale | 0.14 | 16 | 2.2 |
| Mixed grain | 0.053 | 16 | 0.8 |
| Peas | 0.035 | 16 | 0.6 |
| Field beans | 0.058 | 16 | 0.9 |
| Ley | 3.125 | 16.1 | 50.3 |
| Potatoes | 0.805 | 3.5 | 2.8 |
| Sugar beets | 2.314 | 2.8 | 6.5 |
| Rapes | 0.322 | 19.1 | 6.2 |
| Oil flax | 0.124 | 19.1 | 2.4 |
| Total yield | - | - | 151 |
| Animal Production | Mton | PJ/Mton | PJ |
|---|---|---|---|
| Milk | 2.861 | 3.3 | 9.44 |
| Meat, pork and poultry | 0.47 | 22 | 10.34 |
| Eggs | 0.122 | 22 | 2.68 |
| Total production | - | - | 22.47 |
| Year | Input/Capita (GJ/Capita) | Output/Capita (GJ/Capita) | Overall Efficiency (%) | Renewable Share (%) |
|---|---|---|---|---|
| Sweden | ||||
| 1920 [50] | 180 | 40 | 22 | - |
| 1975 [3] | 300 | 55 | 18 | - |
| 1980 [4] | 305 | 60 | 20 | 42 |
| 1994 [7,51] | 310 | 43 | 14 | 32 |
| 2012 | 280 | 55 | 20 | 47 |
| Other Countries | ||||
| Japan 1985 [5] | 150 | 31 | 21 | 5 |
| Italy 1990 [6] | 140 | 25 | 18 | 10 |
| Norway 1995 [18] | 278 | 68 | 24 | 63 |
| China 2000 [52] | 51 | 10 | 20 | 39 |
© 2016 by the authors; licensee MDPI, Basel, Switzerland. This article is an open access article distributed under the terms and conditions of the Creative Commons Attribution (CC-BY) license (http://creativecommons.org/licenses/by/4.0/).
Share and Cite
MDPI and ACS Style
Gong, M.; Wall, G. Exergy Analysis of the Supply of Energy and Material Resources in the Swedish Society. Energies 2016, 9, 707. https://doi.org/10.3390/en9090707
AMA Style
Gong M, Wall G. Exergy Analysis of the Supply of Energy and Material Resources in the Swedish Society. Energies. 2016; 9(9):707. https://doi.org/10.3390/en9090707
Chicago/Turabian StyleGong, Mei, and Göran Wall. 2016. "Exergy Analysis of the Supply of Energy and Material Resources in the Swedish Society" Energies 9, no. 9: 707. https://doi.org/10.3390/en9090707
Note that from the first issue of 2016, this journal uses article numbers instead of page numbers. See further details here.