Article

Energy Link Optimization in a Wireless Power Transfer Grid under Energy Autonomy Based on the Improved Genetic Algorithm

1
State Key Laboratory of Power Transmission Equipment & System Security and New Technology, Chongqing 400044, China
2
College of Automation, Chongqing University, Chongqing 400044, China
3
Department of Engineering, The University of Auckland, Auckland 1142, New Zealand
*
Author to whom correspondence should be addressed.
Energies 2016, 9(9), 682; https://doi.org/10.3390/en9090682
Submission received: 28 March 2016 / Revised: 31 July 2016 / Accepted: 18 August 2016 / Published: 26 August 2016
(This article belongs to the Special Issue Control of Energy Storage)

Abstract

:
In this paper, an optimization method is proposed for the energy link in a wireless power transfer grid, which is a regional smart microgrid comprised of distributed devices equipped with wireless power transfer technology in a certain area. The relevant optimization model of the energy link is established by considering the wireless power transfer characteristics and the grid characteristics brought in by the device repeaters. Then, a concentration adaptive genetic algorithm (CAGA) is proposed to optimize the energy link. The algorithm avoided the unification trend by introducing the concentration mechanism and a new crossover method named forward order crossover, as well as the adaptive parameter mechanism, which are utilized together to keep the diversity of the optimization solution groups. The results show that CAGA is feasible and competitive for the energy link optimization in different situations. This proposed algorithm performs better than its counterparts in the global convergence ability and the algorithm robustness.

1. Introduction

Wireless power transfer (WPT) technology has widely attracted attention from research institutions and companies all over the world. The power could be transferred through magnetic field [1,2,3,4,5], electric field [6,7,8,9], Radio Frequency Identification (RFID) [10,11,12,13], etc., from the power supply to the load without any electrical connections with the introduction of WPT. It contributes to eliminating the cable constraints in the traditional power transfer pattern and, thus, increases the flexibility of the power supply. Meanwhile, a number of advantages are also brought in as the power transfer process is unaffected by dirt, ice, water and other chemicals and, thereby, is environmentally inert and maintenance free. Consequently, WPT is widely used in numerous applications, including electric vehicles [14], electronics [15], biomedical implants [16], etc.
However, due to the traditional point-point mechanism in the WPT system in which the power is transferred from the power supply to the load directly, the power transfer efficiency (PTE) and coverage area are highly restricted. The system operation frequency is usually increased to improve the system performance. However, with the increase of the system operation frequency, the relevant electromagnetic interference (EMI) problem, which is common in high frequency applications, becomes worse in the WPT system. Therefore, another alternative should be proposed to enhance the power transfer performance.
Recent advances in WPT technology have made it possible to transfer sufficient power to the electrical devices over a large air gap with the introduction of repeaters (resonance coils). The PTE and coverage area are both increased without sacrificing the operation frequency [17], and thus, the EMI is diminished. However, certain space is occupied by these existing coils, and thus, the space utilization is reduced. Consequently, this pattern is not suitable for the power transfer process within a multi-device system in which devices are randomly distributed, such as a robot soccer match, a rechargeable wireless sensor network and distributed satellites. To achieve the power transfer process within a multi-device system, a regional smart microgrid [18,19] named the wireless power transfer grid (WPTG) [20,21] has been proposed recently. It contributes to ensuring real-time energy supplies and energy load balance during the power transfer process. This energy grid is comprised of battery-powered device nodes. They are equipped with WPT technology and distributed randomly in a certain area. The network routing (multi-hop) theory in the traditional information network is also introduced for the energy link during the power transfer process, as well. As shown in Figure 1, the whole grid could be linked to the external power injection, which could be fulfilled by the power grid. The energy link, which is comprised of sub-links, is the abstract channel of the power flow from the external power injection to the load node. Each sub-link represents the abstract power transfer channel between every two involved device nodes within the energy link. Therefore, with the introduction of device repeaters, the energy could be relayed to enlarge the power transfer area without compromising PTE. Any load node within the coverage of the WPTG will be able to be charged. However, the power injection would possibly be cut off in some extreme situations, like earthquakes and power failures. During this broken period of the external power injection, the whole grid is isolated from the external power injection, and then, nodes in this grid are running under the energy autonomy situation. When one member node has power demand, the energy link needs to be established to generate power flow to extend the battery life of this load node. Additionally, this power flow is based on the nodes’ own energy storage. Hence, the comprehensive optimization in the energy link needs to be studied. The PTE has been taken into consideration to reduce the power dissipation during the power transfer process in previous studies. However, a time delay is also brought in by the introduction of the device repeaters. Furthermore, the energy balance during the power transfer process is also worthy of being noted, as well, in this energy autonomy situation.
In this paper, the energy link optimization in WPTG under energy autonomy will be presented with the consideration of power transfer and grid characteristics. The relevant multi-criteria in energy link optimization are analysed. Then, an improved algorithm (concentration adaptive genetic algorithm (CAGA)) is proposed to get the optimal energy link with these multi-criteria. Several key improvements are also introduced to resolve the local optimum problem in the optimization process. They contribute to keeping the diversity of the solution group and, thus, motivate the solution evolution to reach the global optimal result. This paper is organized as follows. Section 2 introduces the WPTG under energy autonomy. Section 3 analyses the energy link in WPTG and presents the optimization model with these multi-criteria in the energy link. The detailed optimization algorithm is provided in Section 4. The simulation results and discussions are demonstrated in Section 5. Section 6 provides conclusions and discussions for future research directions.

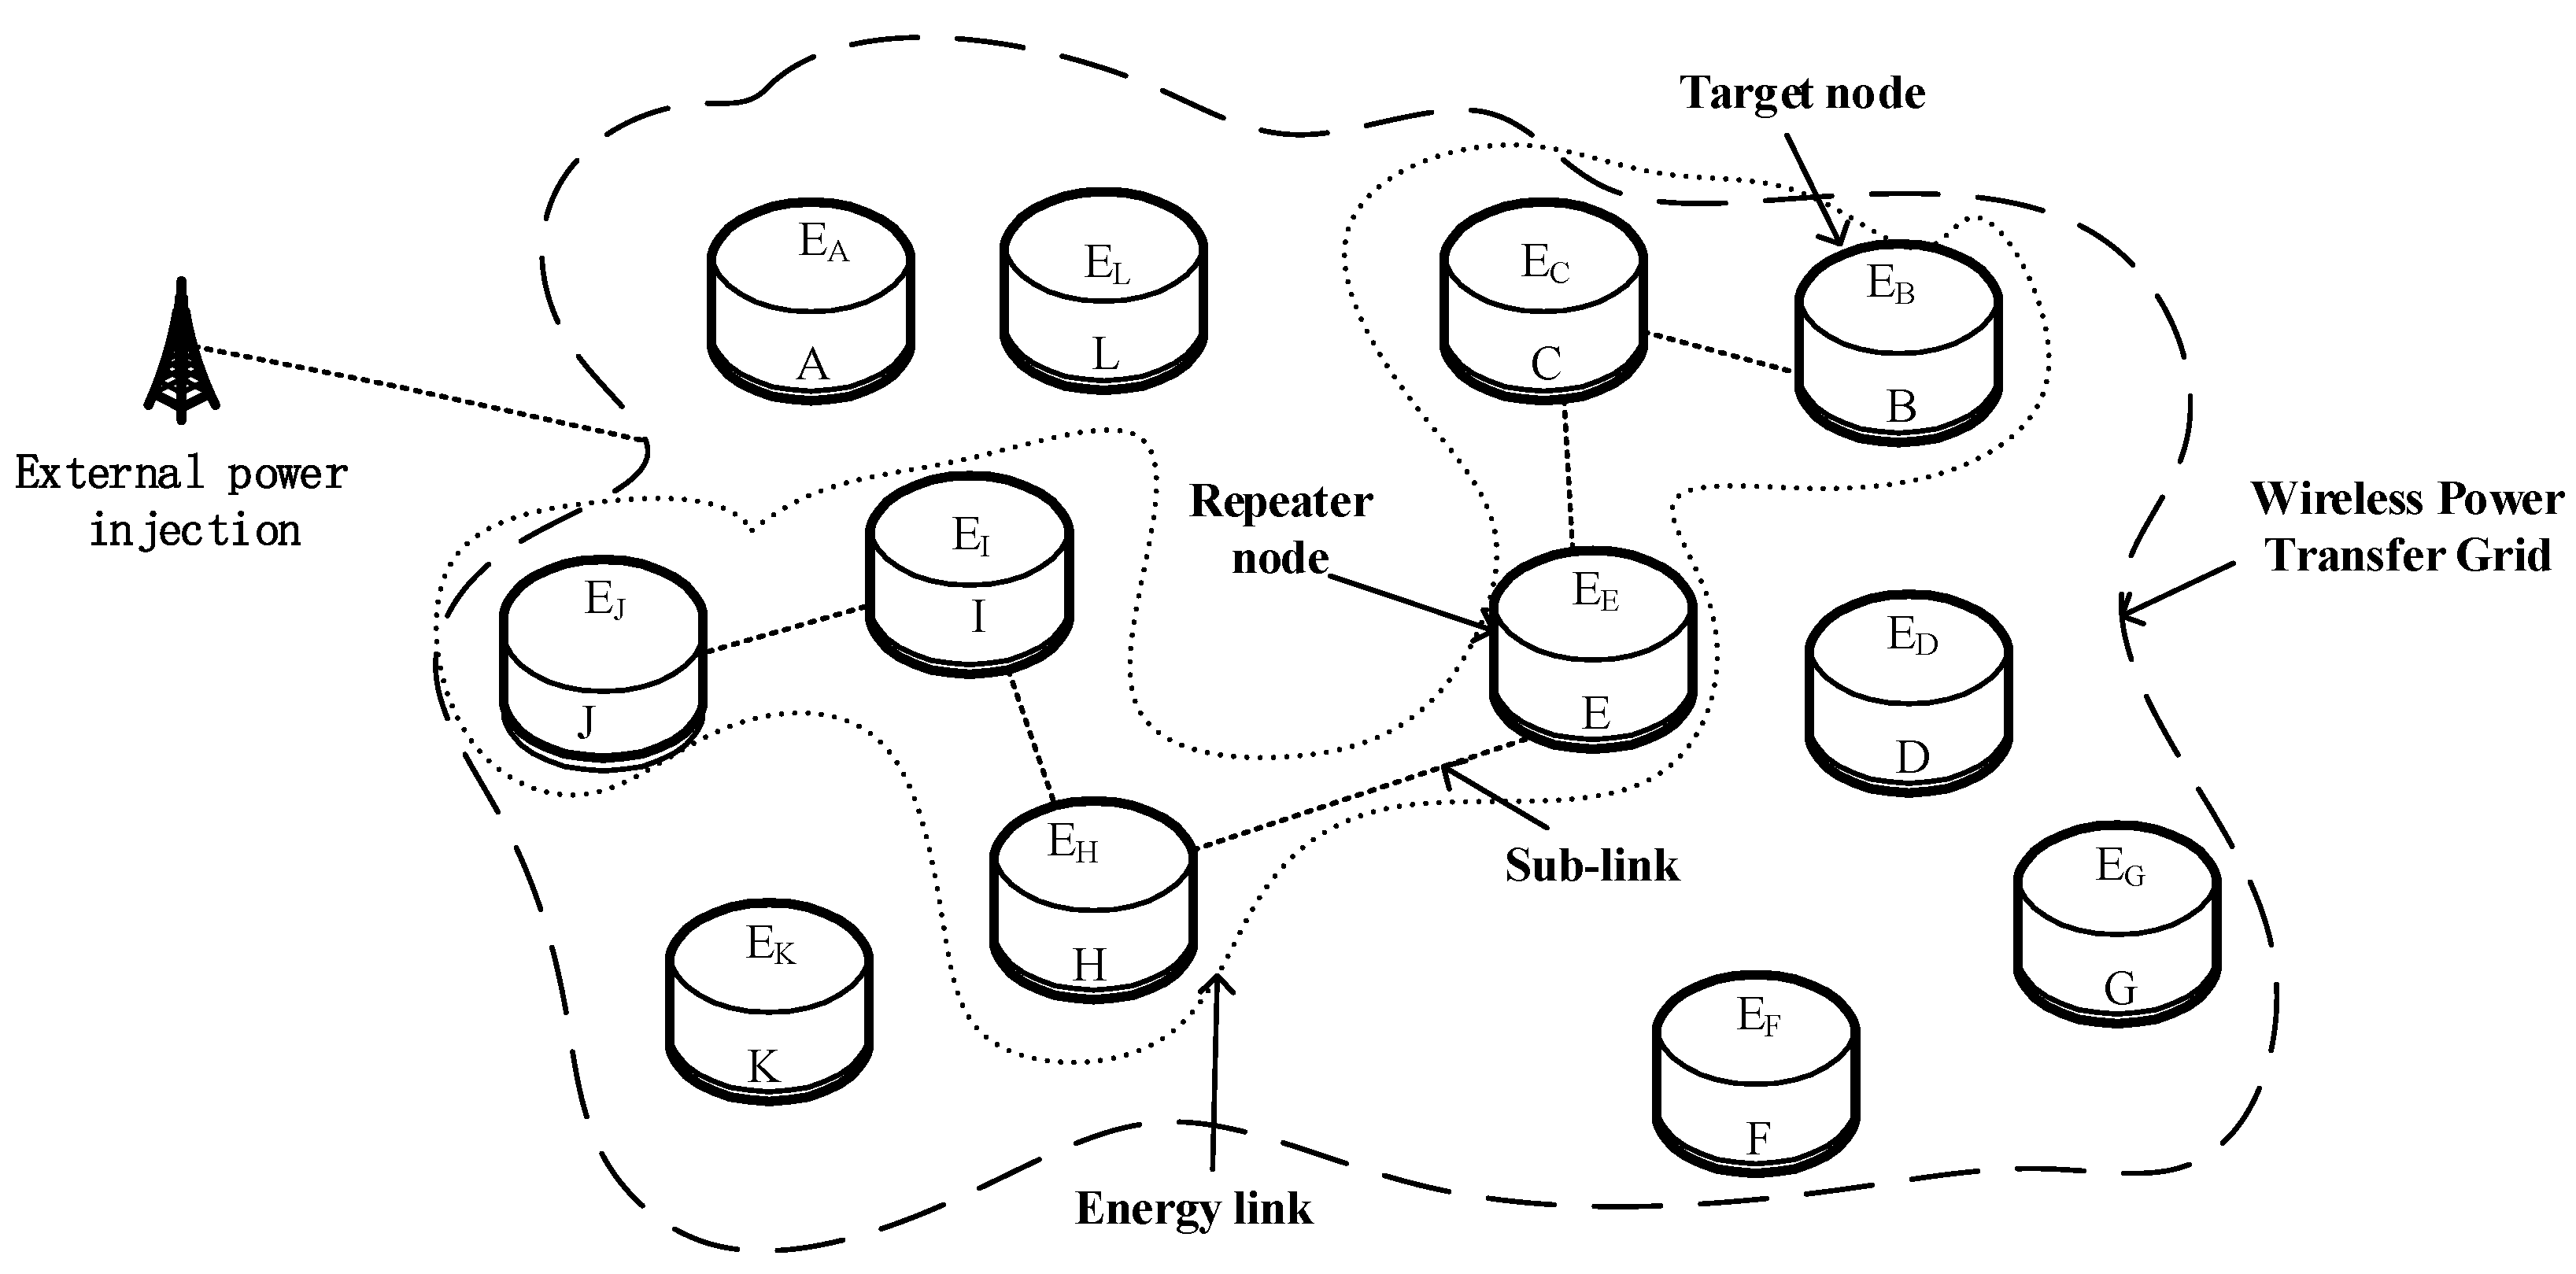
2. Wireless Power Transfer Grid under Energy Autonomy

2.1. Grid Introduction

The WPTG consists of battery-powered device nodes. When the external power injection in Figure 1 is cut off, the device repeaters in WPTG are selected to establish the energy links for power transferring to the load node. With the relay function of these repeaters during the transferring process, the energy dissipation is reduced, and the power transfer flexibility is augmented.

2.2. Node Parameters

Device nodes are assumed to be homogeneous as follows.
1
Each node is assumed to operate with the functional load; therefore, the energy storage in each node is declining with time. Each node will reach three energy situations with the variation of its energy storage:
Normal situation
Energy-poor situation
Energy-disabled situation
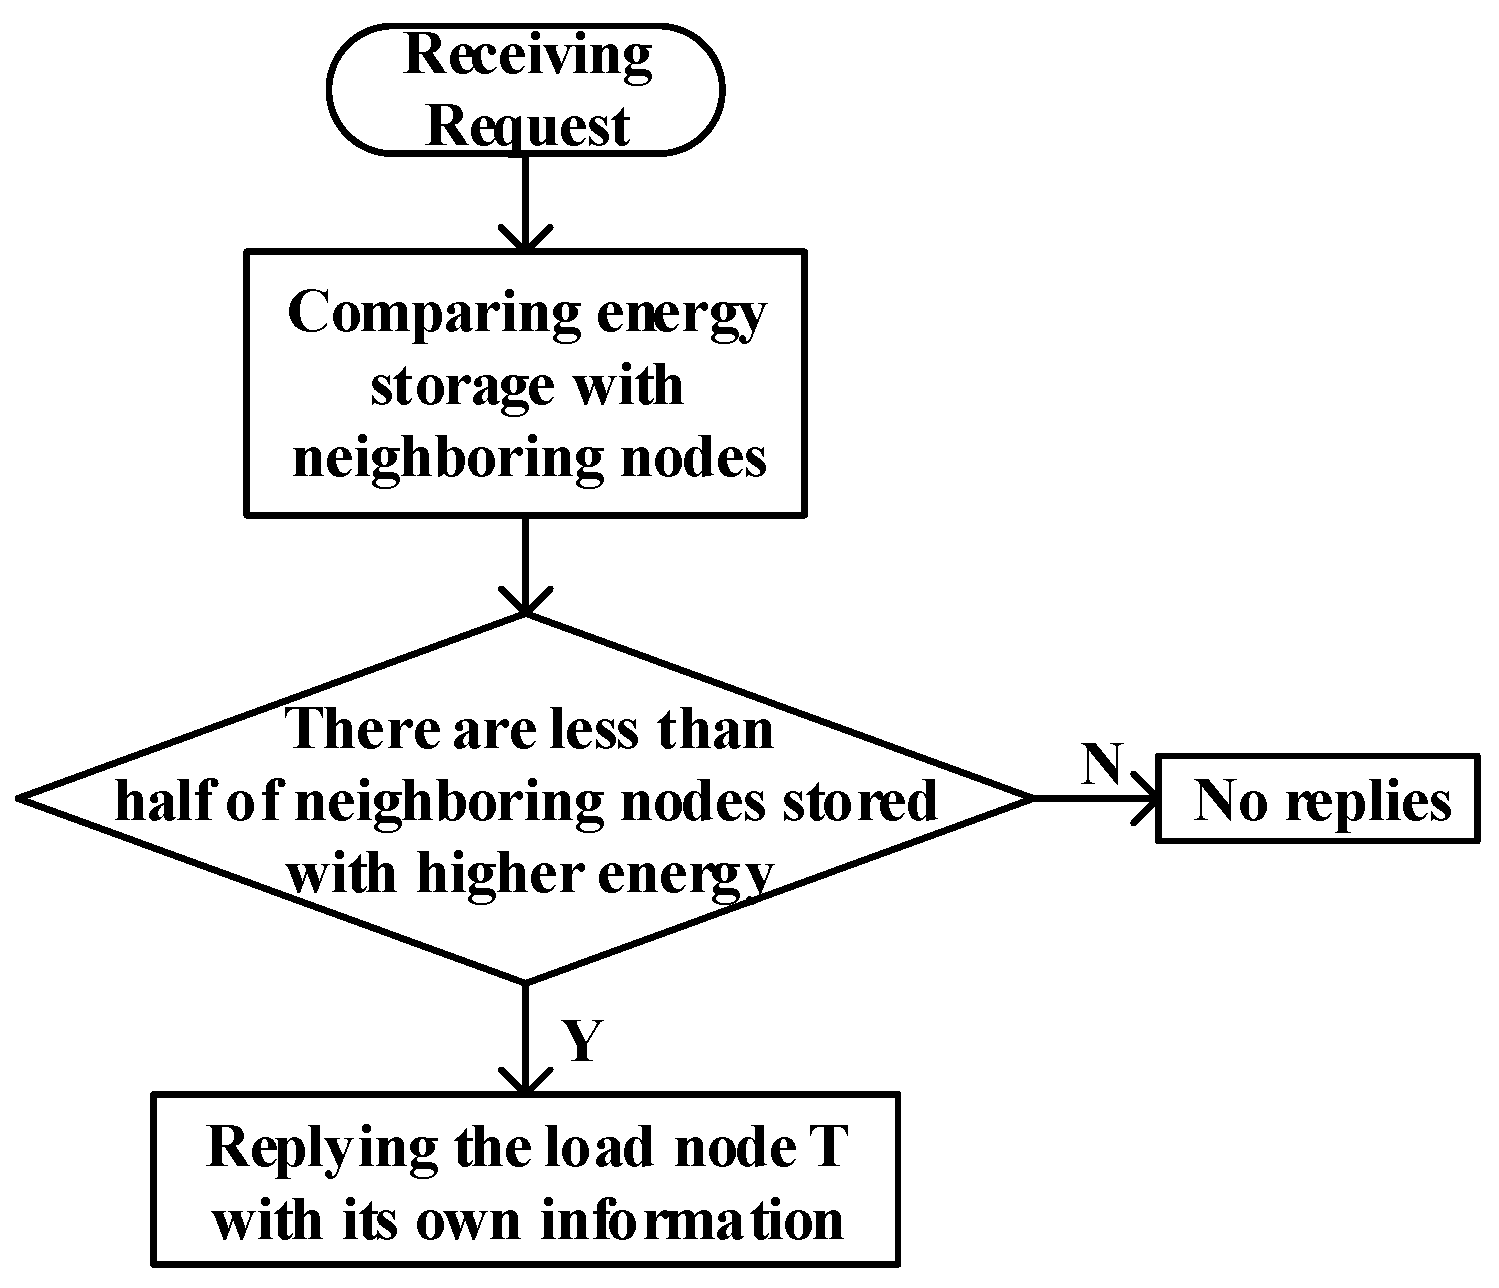
Nodes will be removed from WPTG for maintaining its own functional load if they reach the energy-disabled situation. Therefore, the node in the energy-poor situation will call for energy supplies to avoid this worst situation.
2
Each node is assumed to be able to detect the surrounding (neighbouring) nodes’ information.
3
Relevant nodes in the energy link act as:
Power supply node S
Repeater node R
Load node T
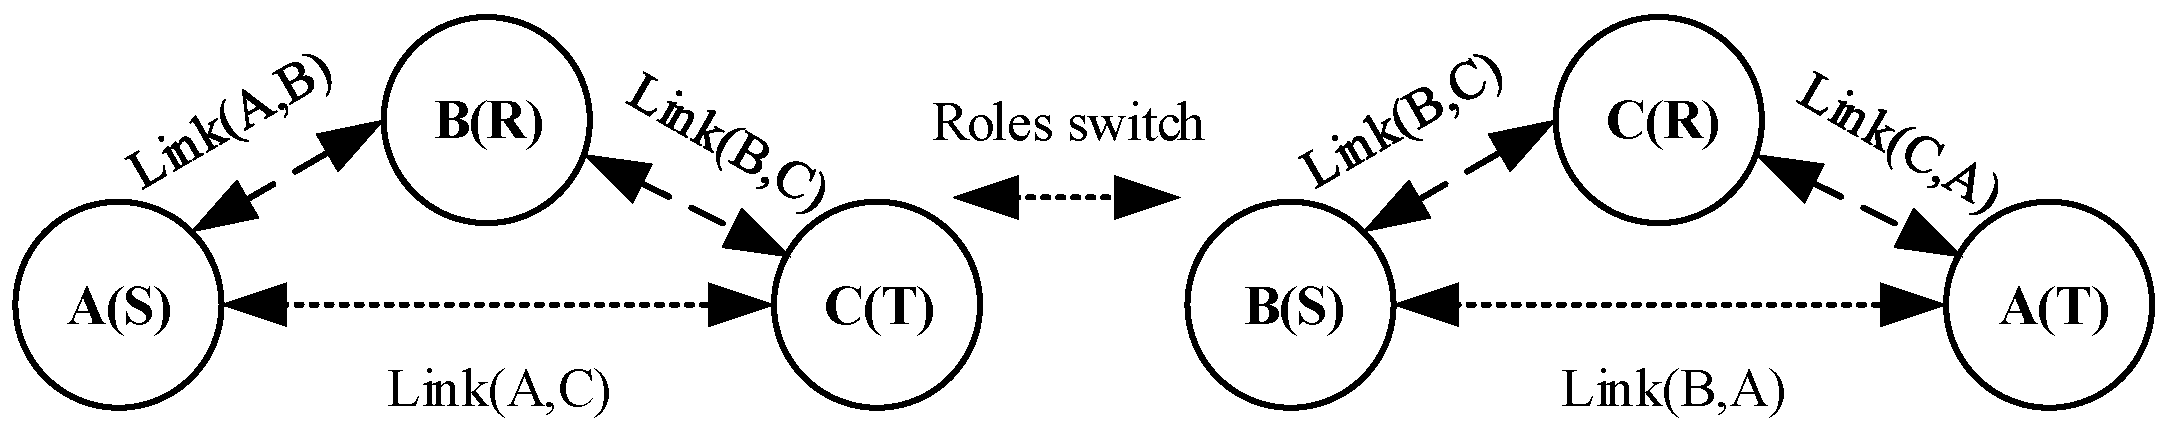
Without the external power injection, a certain node will be chosen as the power supply node S. Additionally, the power transfer process could be achieved from the power supply node S to the load node T through the repeater node R. As shown in Figure 2, power supply node A transfers power to load node C through repeater node B. Nevertheless, these roles are not fixed, and they will vary with the change of the load node. Thus, when node A calls for energy supplies and transforms into the load node, power supply node B transfers the power through repeater node C to meet its demand. Meanwhile, the bi-directional wireless power transfer [22,23] technology is introduced, which means the power transfer flow is reversible.
4
During the power transfer process, the involved nodes will suffer from the extra energy load, which is related to the detailed power conditioning performance. Due to the fact that it is beyond the scope of this paper, it will not be explained in detail.

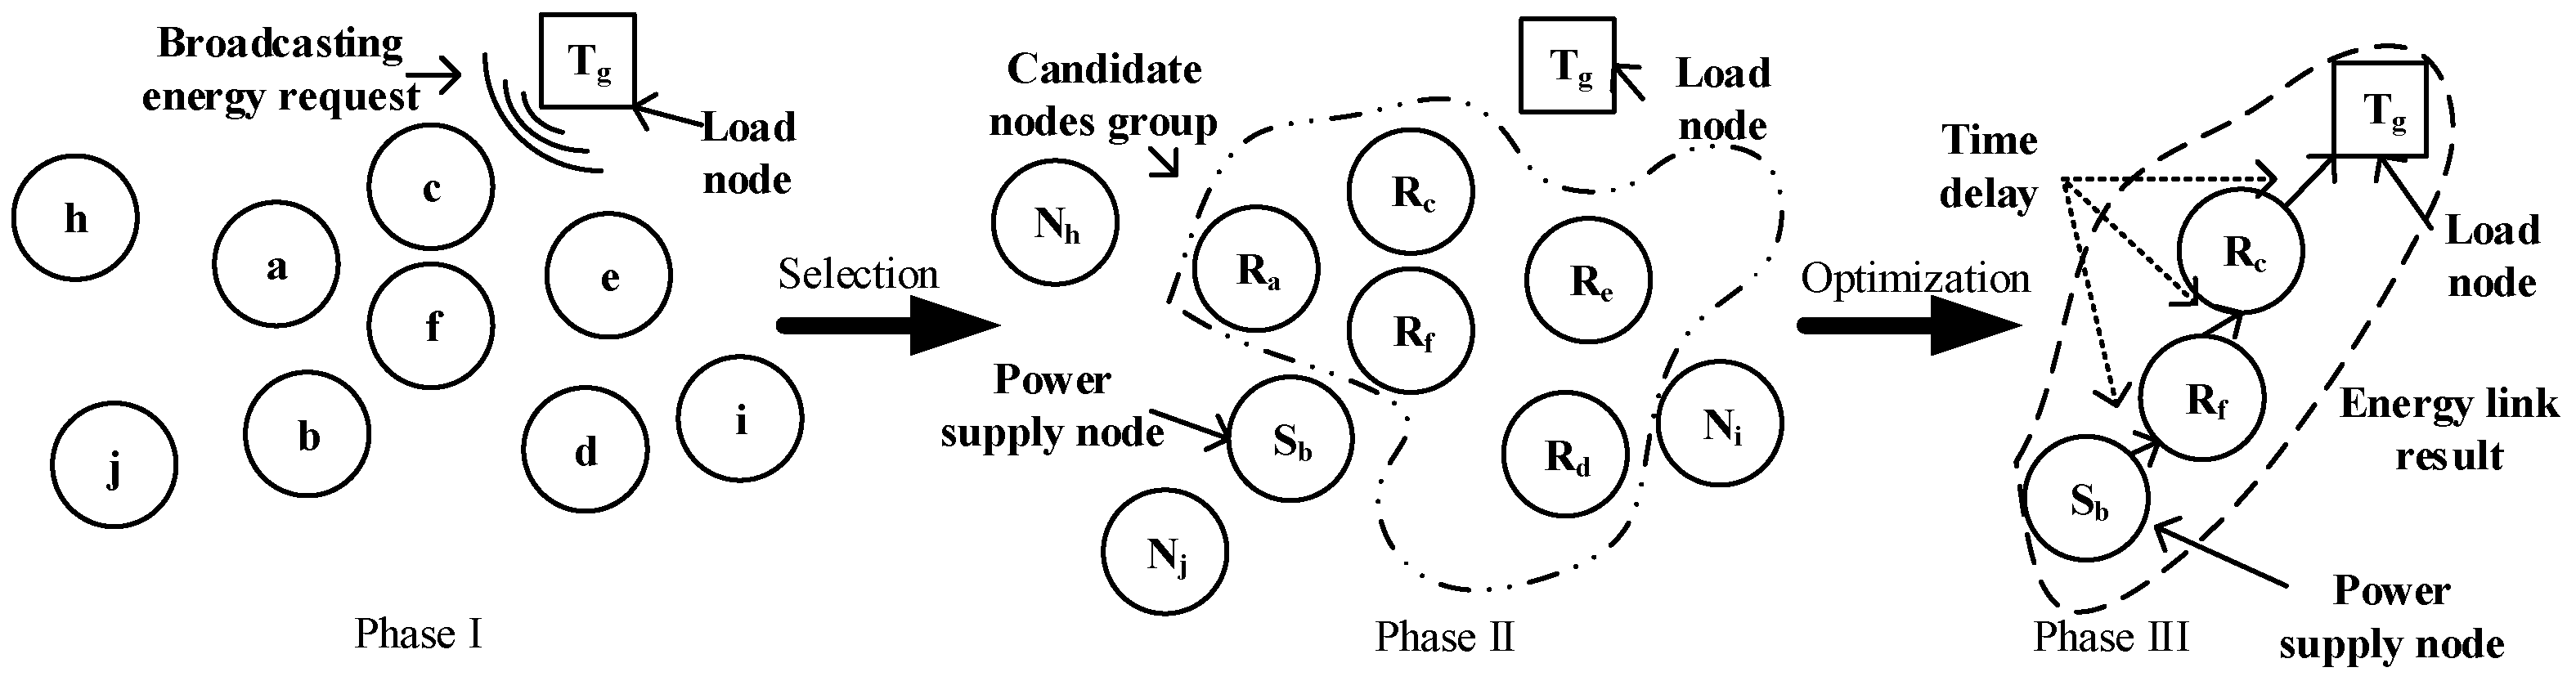
2.3. Grid Operating Mechanism

As shown in Figure 3, the grid operation mechanism could be divided into three phases. During Phase I, the node will broadcast the energy requests and transform itself into load node T if it reaches the energy-poor situation. The surrounding nodes will relay it to their neighbouring nodes after they receive this energy request. Meanwhile, as shown in Figure 4, the nodes compare their own energy storage with the neighbouring nodes. If one node among them has stored more energy than fifty percent of its neighbouring nodes, it will reply with its own energy storage information to node T. Then, nodes that have not replied will not be involved in the consequent operations, and they will be labelled as N in Phase II. Additionally, the involved nodes will be labelled as R i .
In Phase II, load node T will compare the received energy storage information, as well. The node with maximum energy storage will be selected to be the power supply node S i (subscript i denotes that node i is chosen as the power supply node i), and the rest of the communication nodes will be chosen as candidates for repeater nodes. The node with maximum energy storage is selected to achieve the energy balance. This selection mechanism helps to distribute the energy load among the whole grid. With the node information of these candidate nodes shared with the power supply node S i , node S i chooses nodes from these candidate nodes to establish the optimal energy link ( { b , f , c , g } in Figure 3) to transfer the power from node S i to node T in Phase III. We will focus on this non-linear optimization process in this paper, which could be represented as Equation (1).
τ o p = a r g m i n ( J ( τ i ) ) , τ i τ s . t . c o n s
where τ = τ 1 , τ 1 , . . . , τ n ( n N * ) is the solution group, C o n s represents the constraints, J ( τ i ) is the performance index of the i-th solution and τ o p is the optimal energy link with the minimum performance index J. This optimization process will be discussed in detail in subsequent analyses.

3. Energy Link Optimization Model

3.1. Energy Link Analysis

In the traditional point-point WPT system, the PTE and power capacity are two main performance indexes. In this paper, the power capacity is assumed to be able to meet the load node’s power demand, and thus, the PTE could be utilized to measure the power dissipation during the power transfer process. Therefore, during the operating process of WPTG, the power supply node S, as shown in Figure 3, has to select repeater nodes from the candidate nodes’ group to establish the optimal energy link with the consideration of the PTE index. Furthermore, due to the repeater nodes, the time delay is also introduced including (1) the communication delay and (2) the power conditioning delay. The latter is overwhelmed by the former. Only the communication delay will be taken into consideration in this paper. Meanwhile, the nodes with small energy storage should be chosen to be repeaters with less possibility considering the energy load balance. Therefore, these multi-criteria for this optimization issue are listed as follows:
  • Power transfer efficiency PTE: During the energy autonomy situation, the power demand of the load node is satisfied by the energy stored in other nodes. The PTE should be improved to reduce the power dissipation during the power transfer process.
  • Time delay D e l : The communications are undertaken to inform the repeater nodes to join the energy link; therefore, a time delay is introduced in the power transfer process. In order to improve its real-time performance, the time delay should be reduced.
  • Energy load balance S m s t : If the nodes with small energy storage are selected to join the energy link, due to the extra energy load during the power transfer process, these will quickly be driven to reach the energy-disabled situation, which should be avoided. Hence, this extra energy load should be distributed among the nodes with higher energy storage to achieve the energy load balance in the WPTG. The minimum energy storage S m s t in the selected energy link is utilized to represent this index.
As shown in Figure 5, relevant nodes will be chosen to establish the optimal energy link from the repeater nodes’ group.
E i represents the energy storage in node i. During the comparison, energy link τ j = { B , C , E , H , I , J } is chosen, in which node D is selected rather than node C due to its higher energy storage; { E , H , J } also performs better than its counterpart in the index value of PTE and D e l .

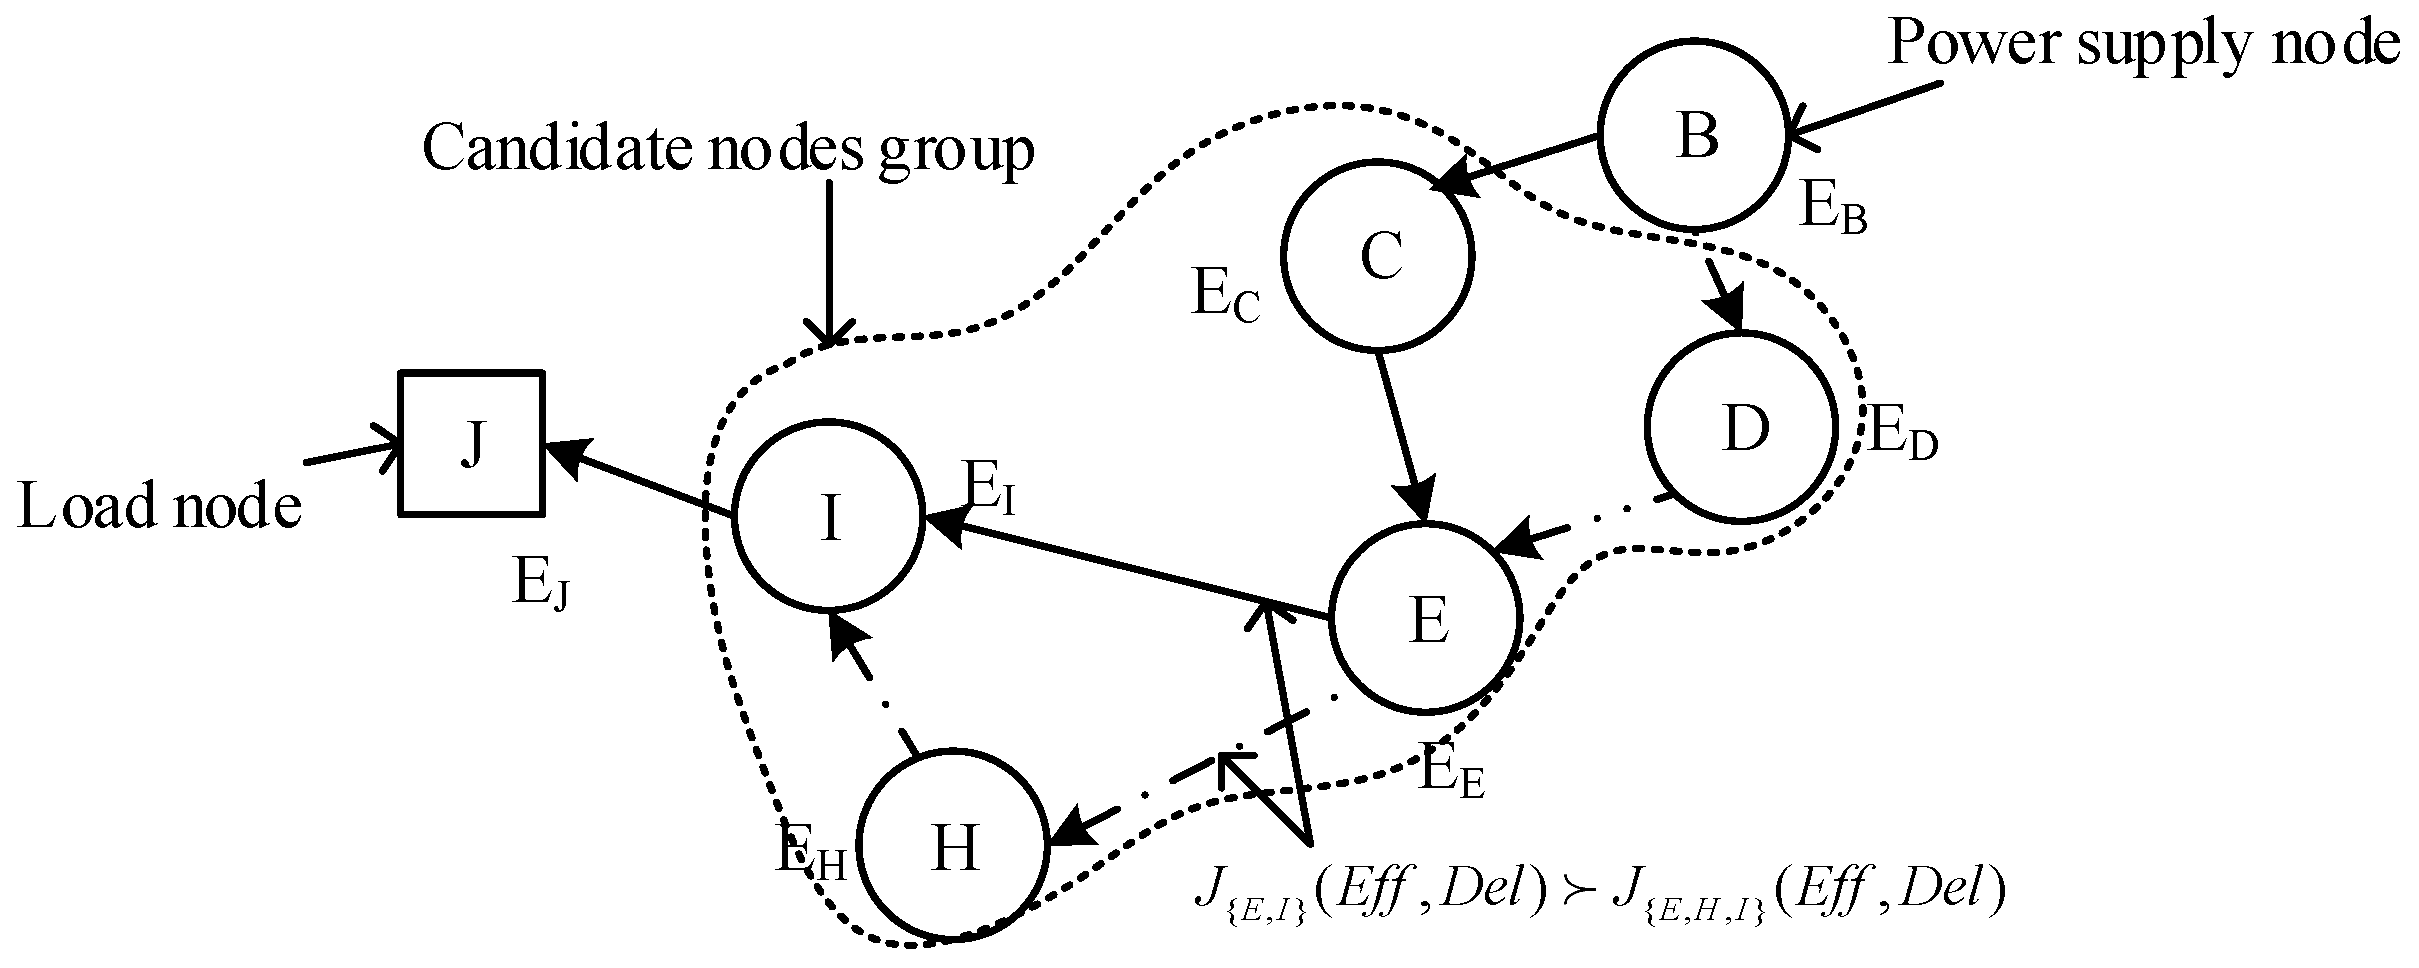
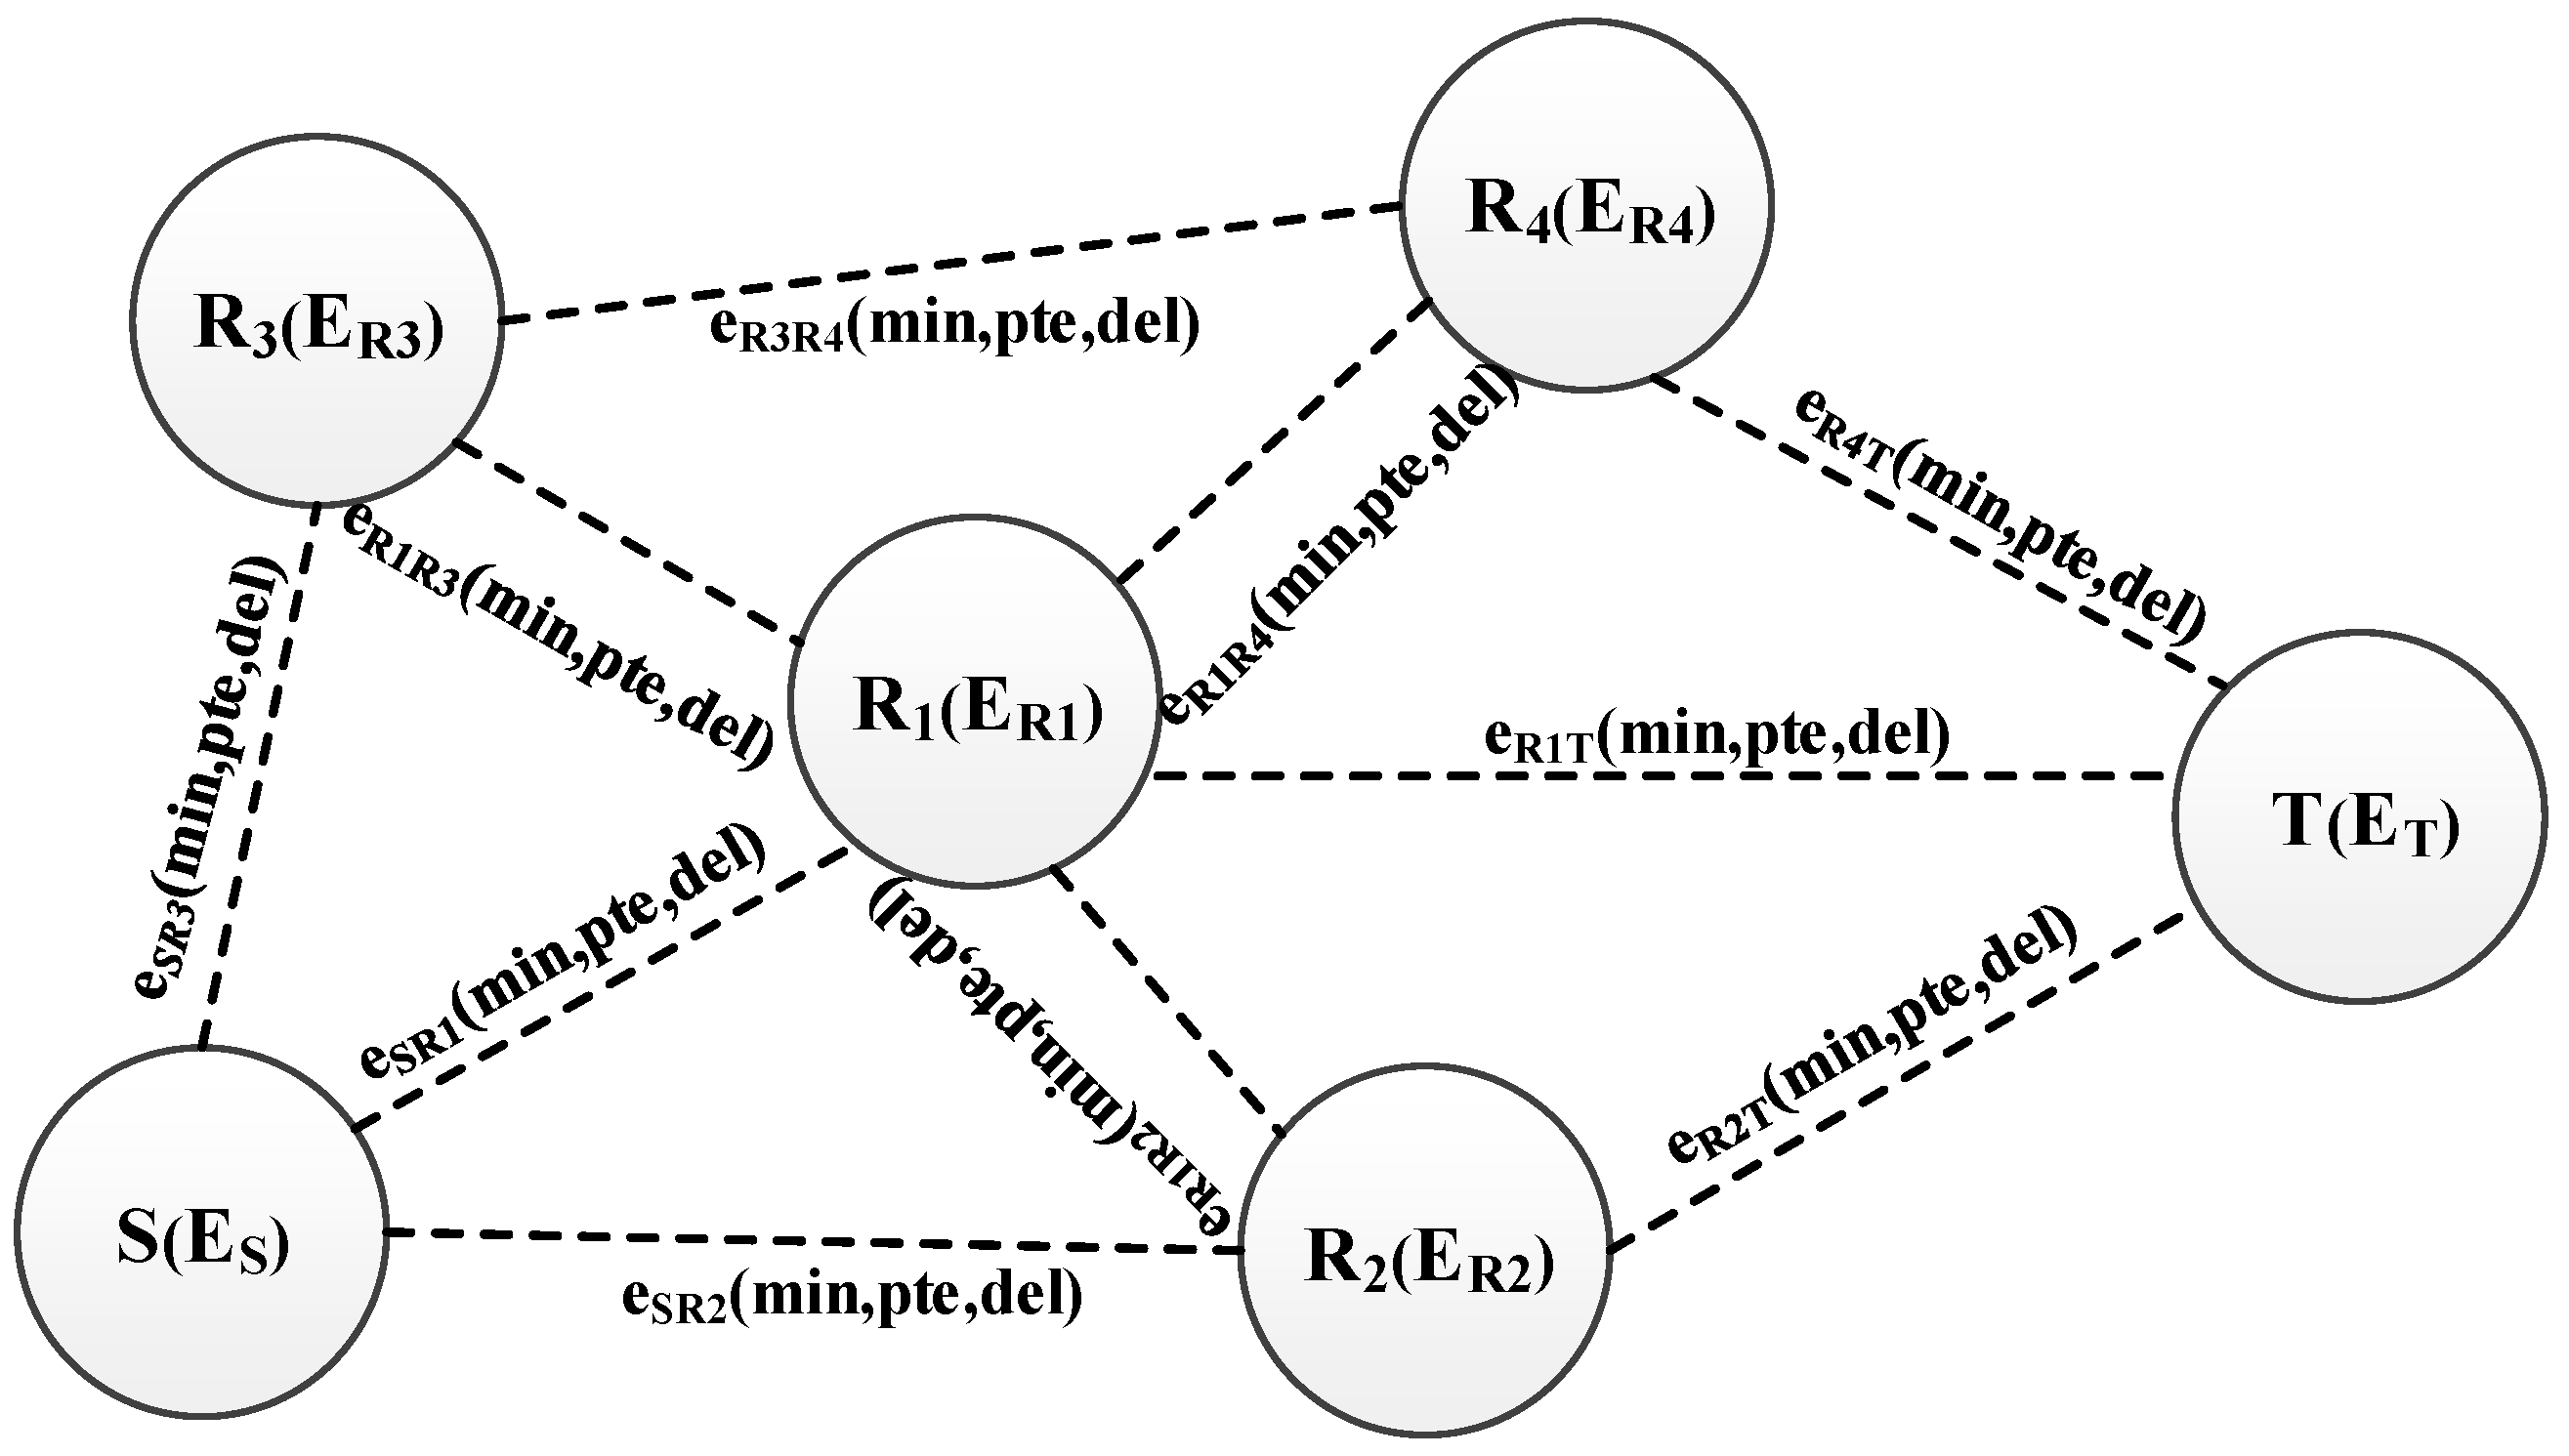
3.2. Optimization Graph

As shown in Figure 5, the potential energy links for power transfer will be compared to get the optimal result. They are the combination of sub-links among relevant nodes in the energy link. Each sub-link is an abstract object of the power transfer channel during the power transfer process between two linked nodes. Meanwhile, the channel parameters are assumed to be constant during the power transfer process. Therefore, the whole optimization grid could be abstracted as an undirected weighted graph G = < V , E > in Figure 6. Node set V represents the device nodes; weighted edge set E means the abstract energy links in which e i j is the abstract energy link between node i and j; weight set ( m i n i j , p t e i j , d e l i j ) in the edges means the energy link weight, in which m i n i j stands for the minimum energy storage in two linked nodes; p t e i j is the power transfer efficiency during the power transfer process between node i and j; d e l i j represents the time delay. Meanwhile, the power flow direction is not restrained due to the bi-directional WPT technology mentioned before.
Therefore, the multi-criteria in energy link τ i could be represented as follows:
D e l ( τ i ) = d e l i j , e i j τ i
P T E ( τ i ) = p t e i j , e i j τ i
S m s t ( τ i ) = M i n { m i n i , j } , e i j τ i
The global delay D e l and PTE are both the accumulation of relevant sub-links. The S m s t is the minimum value of the energy storage of nodes in the energy link. Then, the global performance index J could be represented as a function of these multi-criteria as below:
J ( τ i ) = f ( D e l ( τ i ) , P T E ( τ i ) , S m s t ( τ i ) )
Meanwhile, with the considerations of the performance threshold in the power transfer process, the non-linear optimization model for the energy link could be obtained:
a r g m i n ( J ( τ i ) ) , τ i τ s . t . g 1 ( P T E ) = P T E m p t e i j 0 , e i j τ i g 2 ( D e l ) = d e l i j D m 0 , e i j τ i g 3 ( S m s t ) = S m m i n i j 0 , e i j τ i
where P T E m , D m , S m indicate the threshold value for the power transfer efficiency, the time delay and the energy storage in the energy link solution, respectively. P T E m is set for the power transfer performance. D m is set to ensure the real-time energy supplies. S m is used to manipulate the energy load for the energy balance. This optimization is an NP-hard issue; therefore, the traditional derivation method could not be utilized. Consequently, an intelligent optimization algorithm will be presented in the next section for this optimization issue.

4. Energy Link Optimization Algorithm

The energy link optimization issue could be demonstrated as the routing path problem. Due to its discrete characteristic, a common continuous optimization method, like the particle swarm optimization algorithm [24,25,26], could not be utilized. The ant colony algorithm [27,28] is easily trapped by local optima due to its open-loop control. In comparison, the genetic algorithm (GA) [29,30,31,32,33] is effective in both discrete and continuous optimization issues. Meanwhile, GA is easily modified to resolve specific issues. As a result, CAGA is proposed to select the optimal energy link. The entire algorithm flowchart is shown in Figure 7.

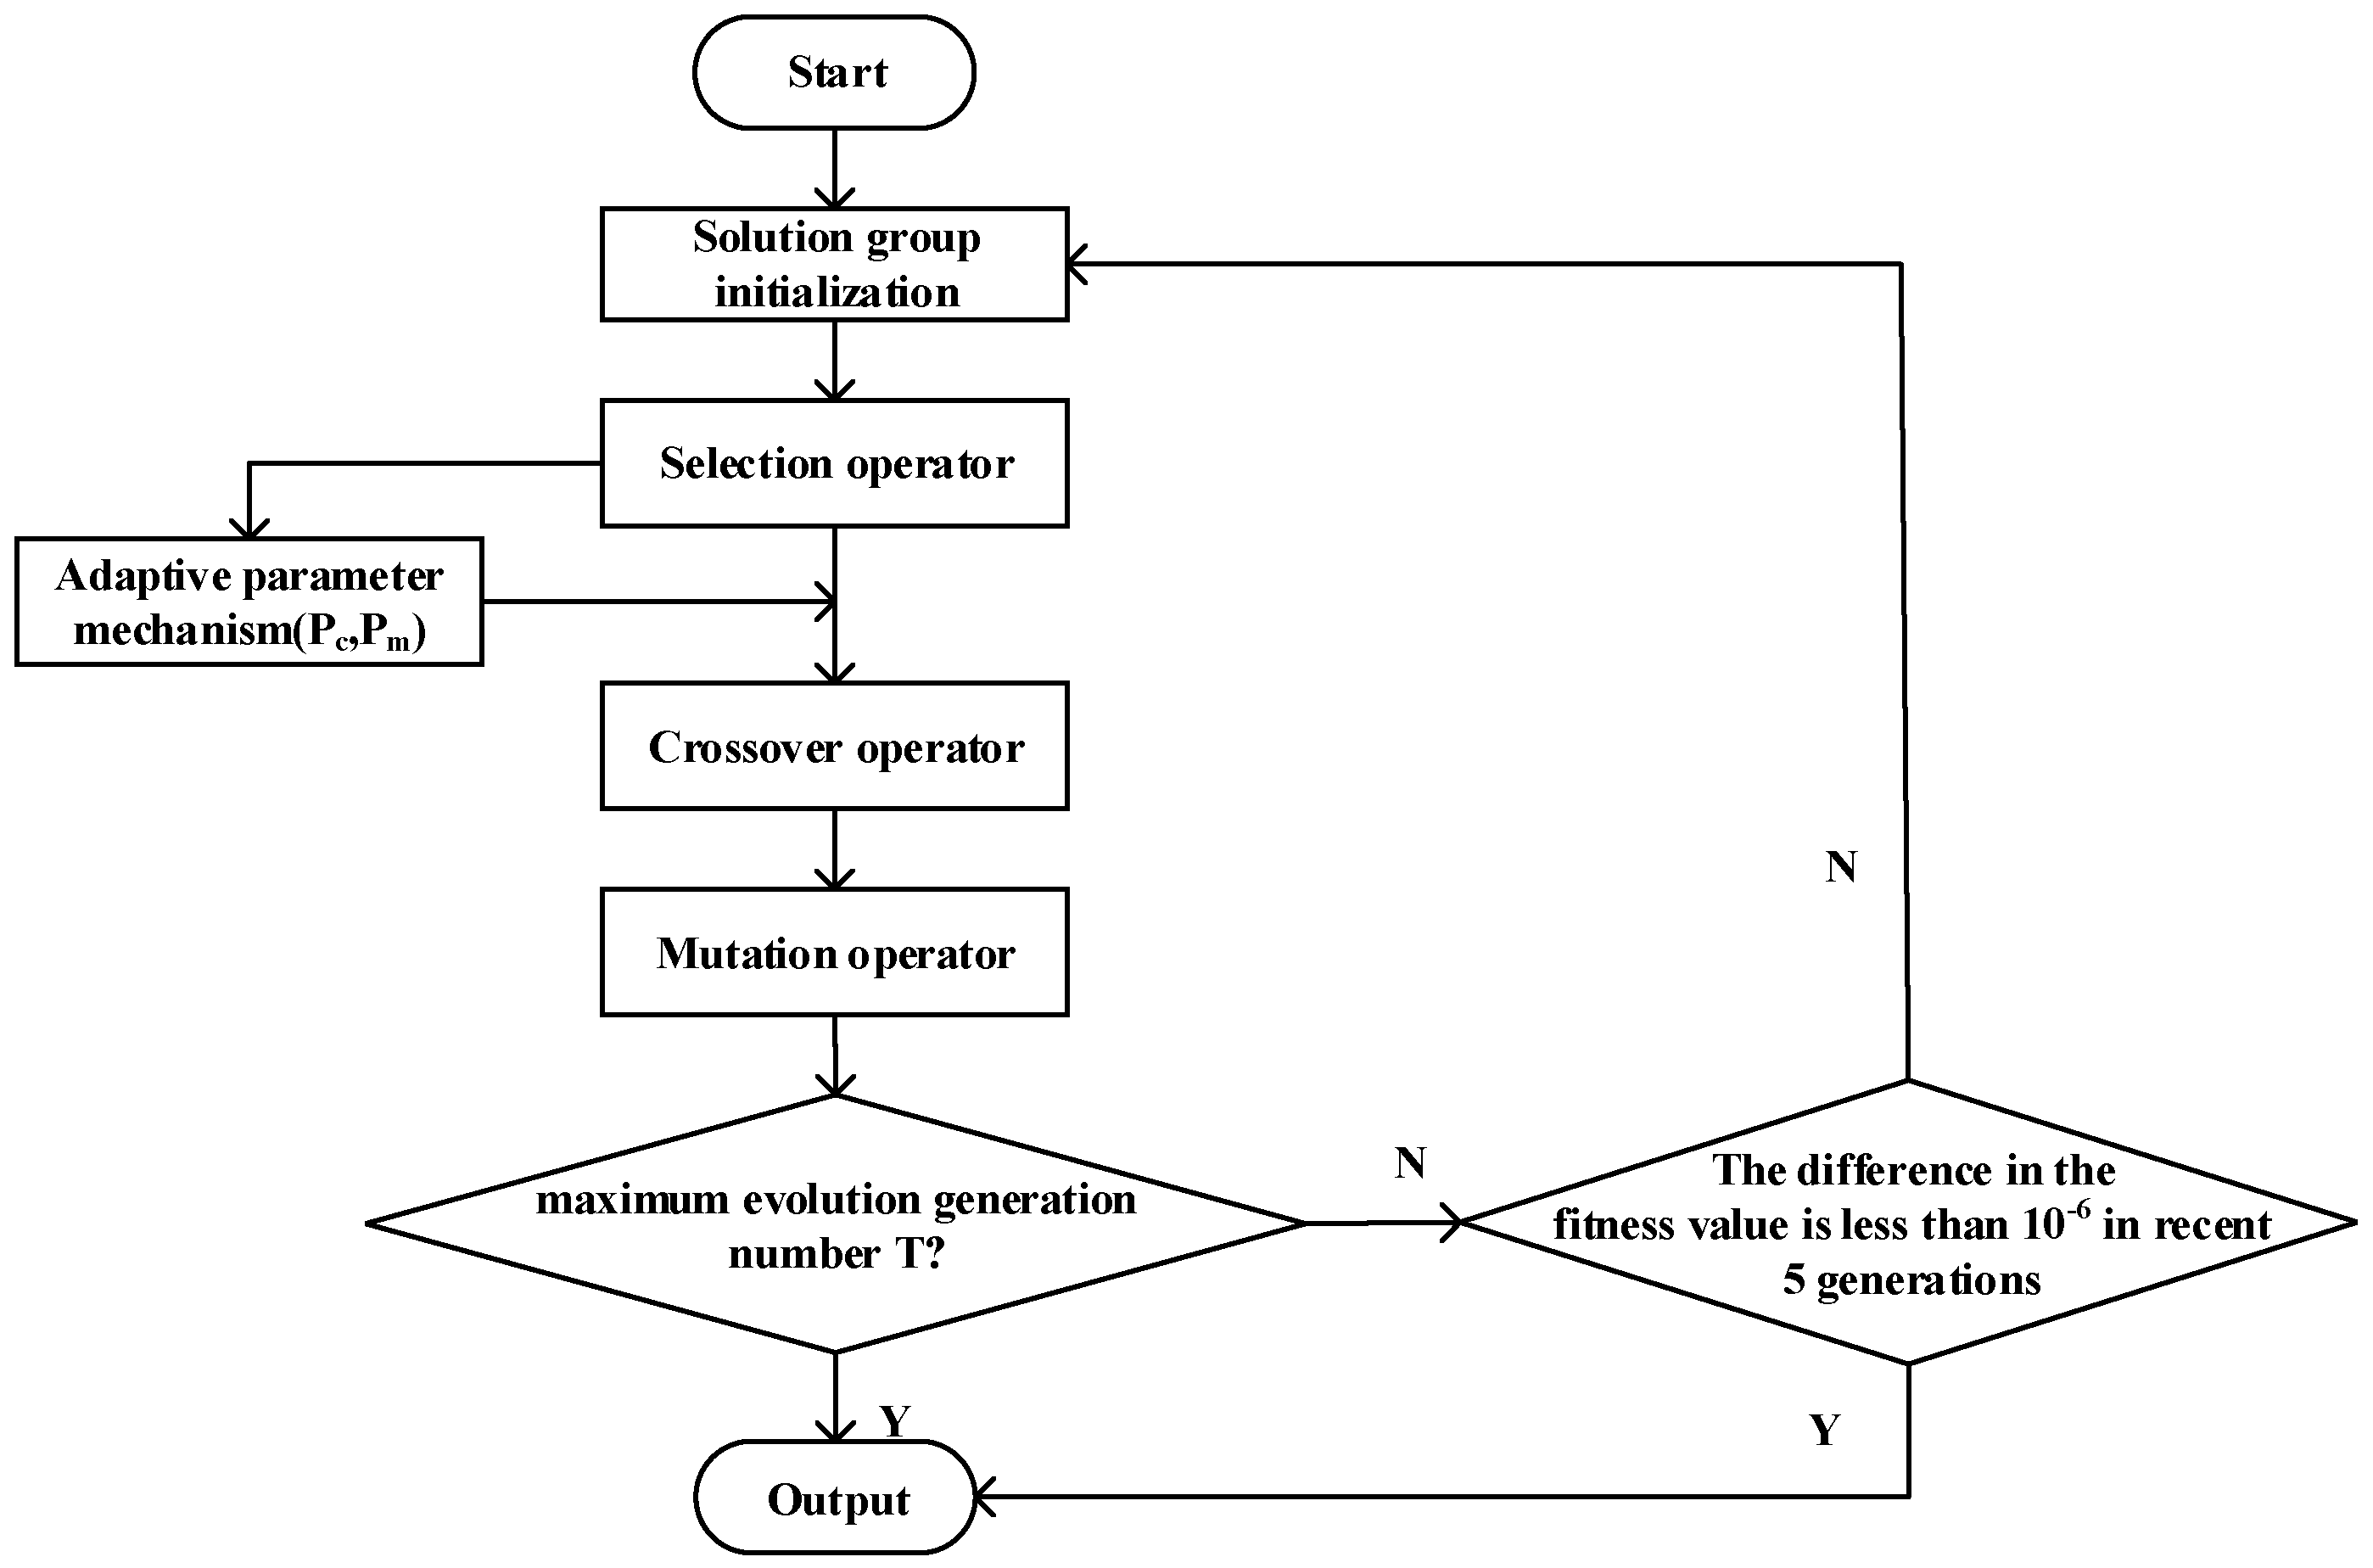
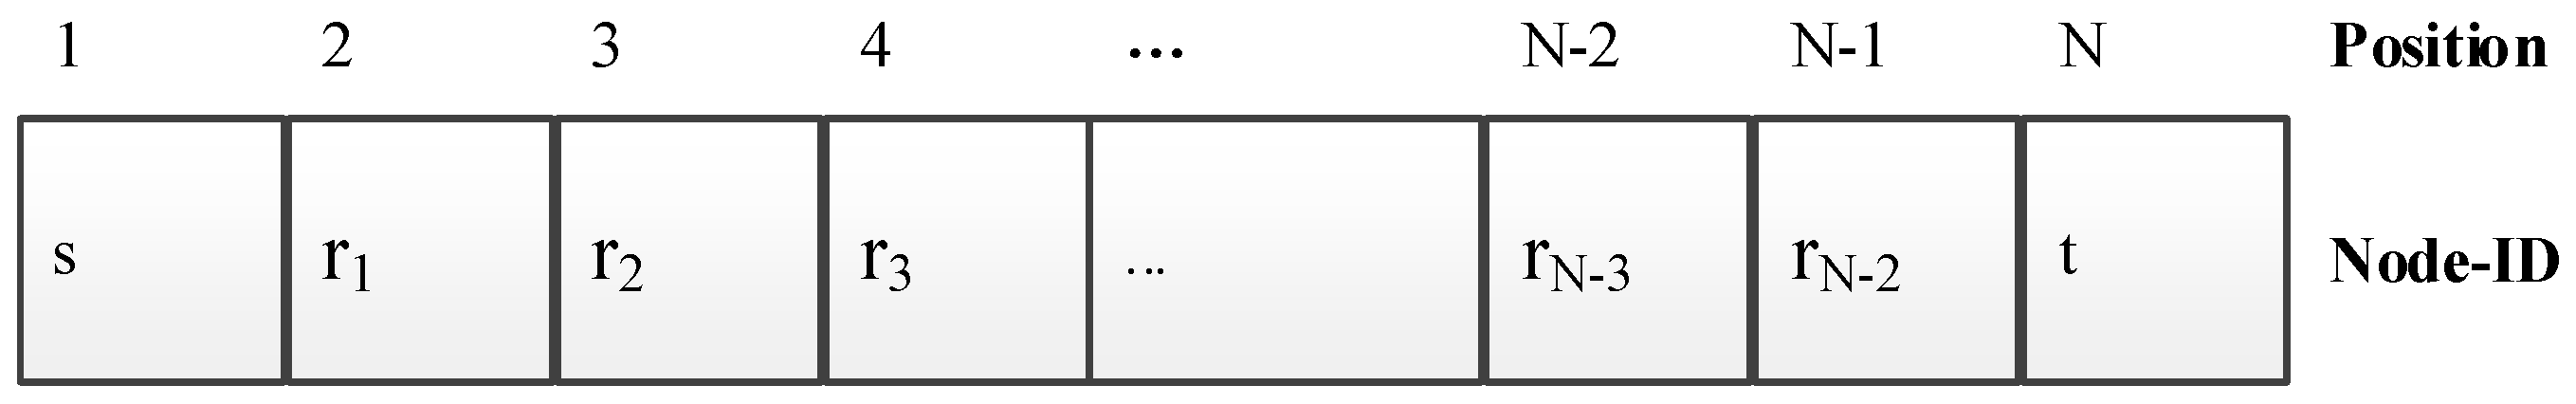
4.1. Algorithm Initialization

The variable-length encoding mechanism is adopted for the energy link solution encoding. The position is used to represent the sequence of the nodes in the energy link, and its value is the node I D (gene) within the path. As illustrated in Figure 8, there are N nodes (genes) in the chromosome. Thus, this solution is started from source node S to node T, through repeater nodes r 1 , r 2 , . . . , r N 2 .

4.2. Fitness Function

The fitness function is used to judge the performance of the solutions during the optimization process. The normalization is undertaken firstly to eliminate the difference in the order of magnitude of these multi-criteria.
P T E ( τ i ) = P T E ( τ i ) / P T E m a x D e l ( τ i ) = P T E ( τ i ) / D e l m a x S m s t ( τ i ) = S m s t ( τ i ) / E m a x
where P T E m a x is the maximum power transfer efficiency in WPTG. D e l m a x is the maximum time delay. E m a x represents the maximum energy storage in the nodes. The fitness function could be expressed with the consideration of the multi-criteria:
J = 1 / e E ( τ i ) ω 1 × S m s t ( τ i ) ω 2 / D e l ( τ i ) ω 3
where ω 1 , ω 2 , ω 3 represent the performance index weight for the multi-criteria, and they satisfy the following condition:
ω 1 + ω 2 + ω 3 = 1
However, with the constraints in the value of the multi-criteria, the penalty function should be introduced firstly to remove the constraints:
ψ ( g i , θ ) = θ × Σ [ m a x { 0 , g i } ] 2
where θ is a large positive number and g i represents the constraint function in Equation (6). Thus, the energy link can be converted to an optimization issue without any constraints:
Θ = J + ψ ( g i , θ )
Based on Equation (11), the optimal energy link with the best value of the global performance index (with the minimum value of Θ) will be chosen, which means the energy link with high energy storage and power transfer efficiency, as well as a small time delay will be selected.

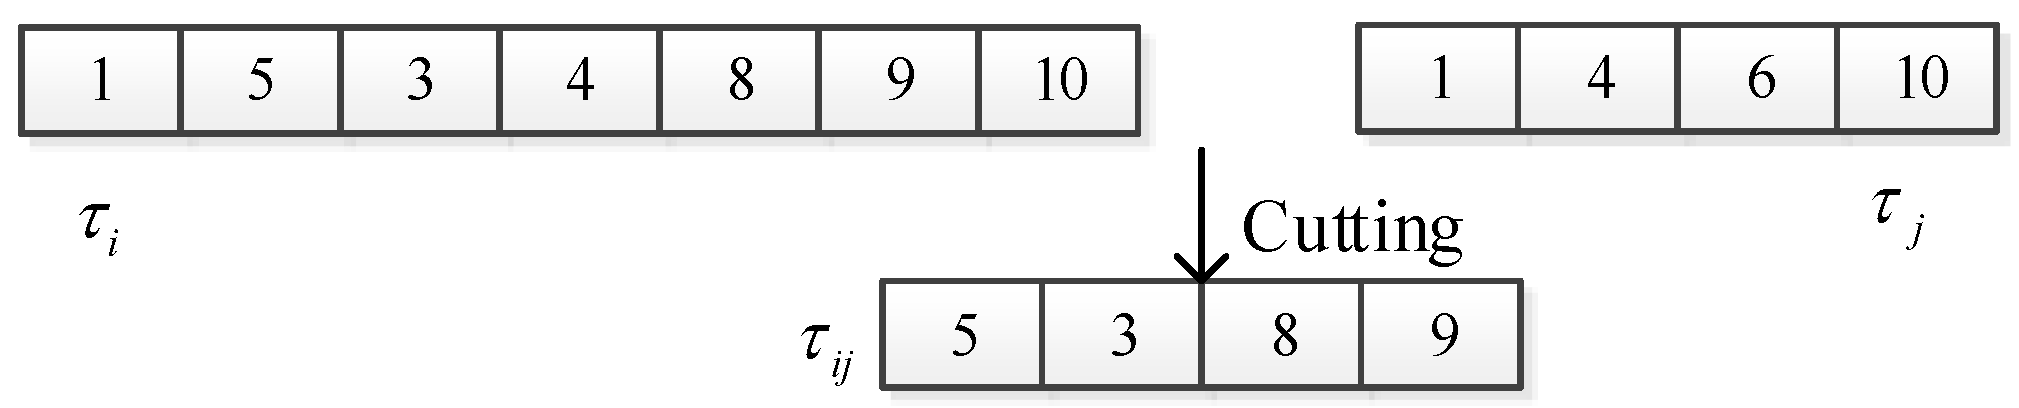
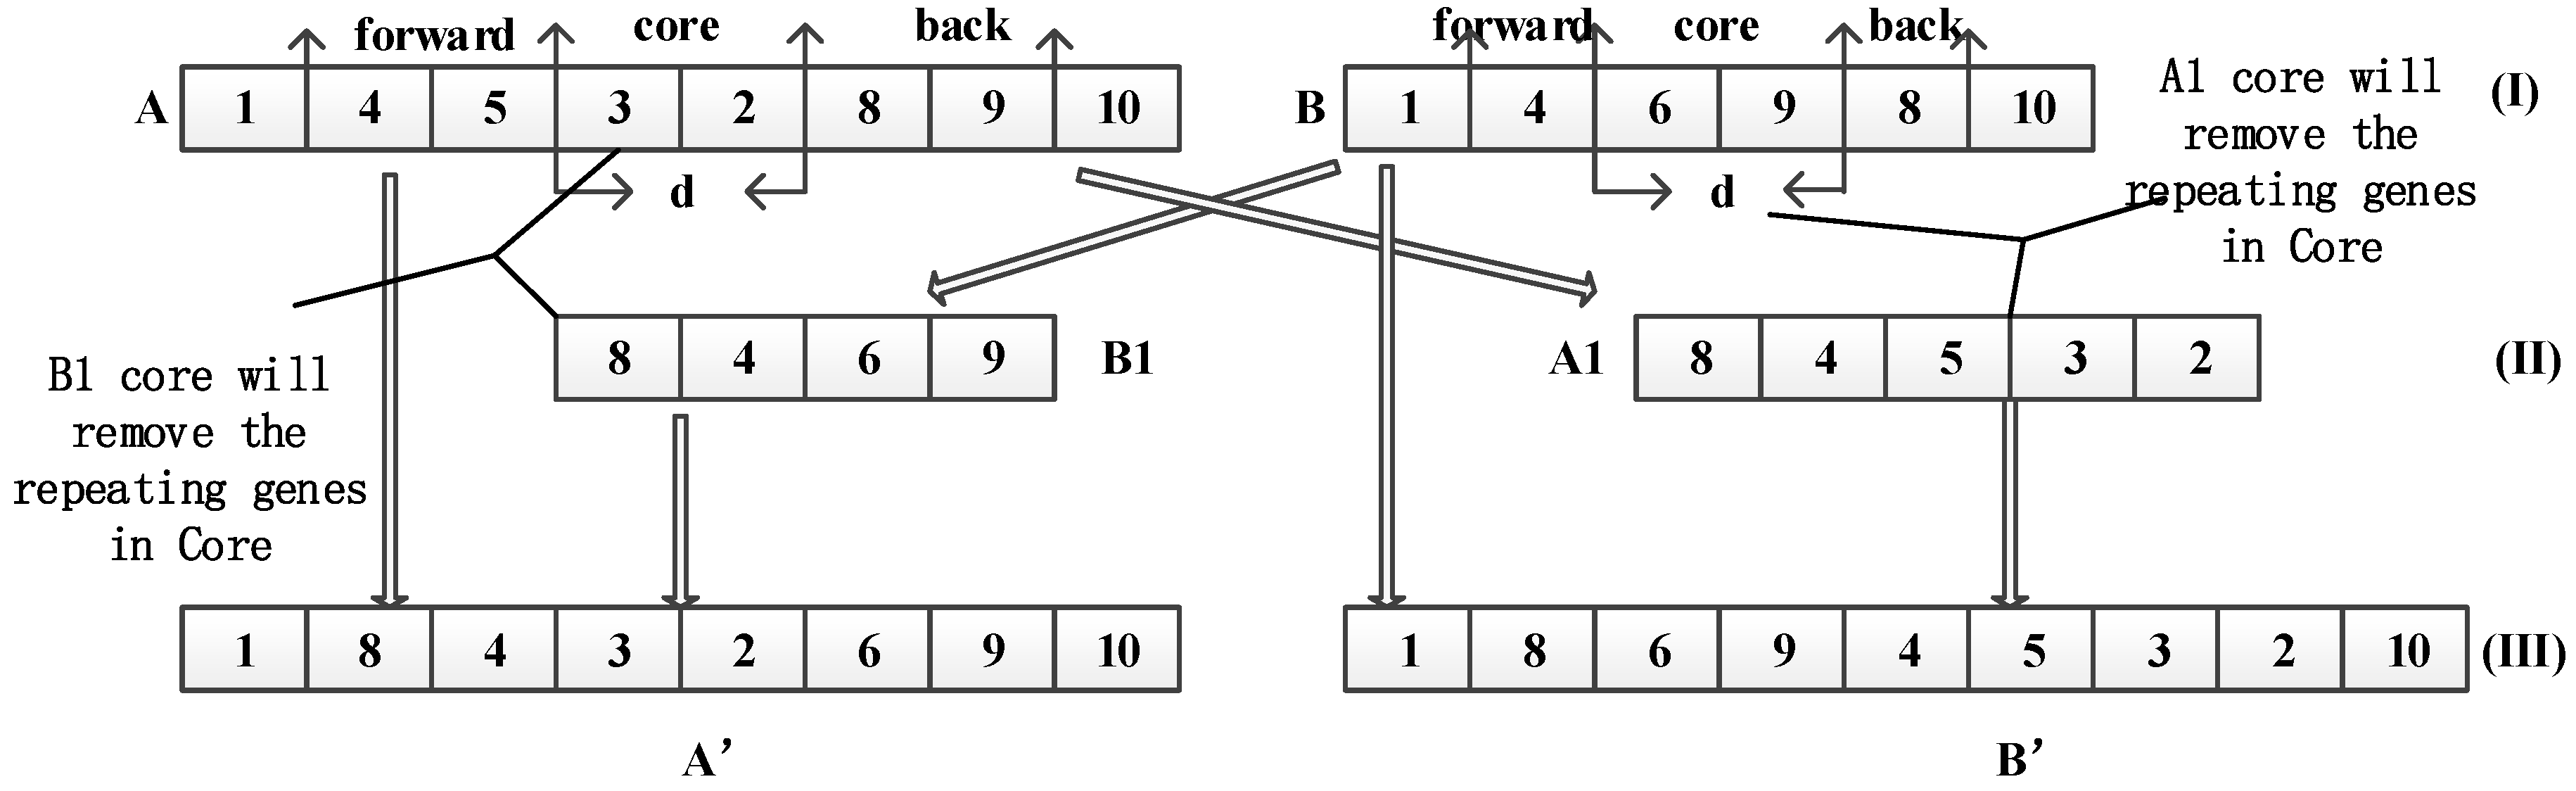
4.3. Algorithm Operators

The all of the operators of CAGA are comprised of the selection operator, crossover operator and mutation operator. The selection operator is run to select the solutions for the next generation, and the quality of solutions is critical for the optimization performance. To avoid local optima, the concentration mechanism is introduced to compel the unification trend in the solution group. Firstly, the distance factor F is set to measure the diversity of every two solutions. As shown in Figure 9, the distance factor F of two solutions is set based on the length of their different genes F ( τ i τ j ) = L e n g t h ( τ i j ) , and the arrow represents the elimination of the similar genes.
Firstly, the concentration value ( C ( τ i ) ) of each solution is set as follows:
C ( τ i ) = 1 / Σ j = 1 G s F ( τ i τ j ) , i = 1 , 2 , . . . , G s
The concentration value will be high if the solution is similar to others. However, this unification trends should be avoided during the evolution process. Therefore, the selection factor ϕ is introduced to avoid this trend.
ϕ ( τ i ) = ln C ( τ i ) / Σ i = 1 G s ln C ( τ i ) , i = 1 , 2 , . . . , G s
During the selection process, the elite solution in each generation will be selected out firstly for the next generation, which contributes to compelling the evolution process with better performance. Meanwhile, the rest of the solutions will be chosen based on the selection factor ϕ. This is due to the fact that the normalization trend dominates the evolution process and, thus, contributes to the local optimum. Through the introduction of the concentration factor, the good genes in some solutions with terrible fitness values will be kept to motivate the evolution to reach the global optimum.
Furthermore, to accelerate the evolution speed, a forward order crossover method will be brought in to recombine the genes in the solutions. As shown in Figure 10, firstly, d genes in the candidate solutions A and B will be utilized as the gene segment c o r e in Phase I . The solution is divided into three parts, including ( a ) f o r w a r d , ( b ) c o r e and ( c ) b a c k ; then, these three segments will be combined following the sequence ( b a c k f o r w a r d c o r e ) , and the respective repeating genes in two c o r e part will be removed ( A 1 removes the repeating Gene 9, which exists in the c o r e of candidate solution B). The new gene segments A 1 and B 1 are generated consequently in Phase II. Next, the new gene segments will be put in the respective candidate solution, for example { 8 , 4 } in B 1 will replace the original f o r w a r d part in A, and the rest { 6 , 9 } will replace the b a c k part. Finally, the new results A and B will be generated. With the operation of the genes close to the source node, the global evolution speed and accuracy could be improved due to the optimization characteristic of the shortest path issue. Meanwhile, the diversity of the solution group is also improved.
As for the mutation operator, the swap mutation method is chosen due to its simpleness and high efficiency. As shown in Figure 11, the arrow means two genes in solution A are randomly picked up to be exchanged in the solution sequence. Finally, a new result solution ( A ) will be reproduced. This operator contributes to bringing in the variation to the evolution process, and thus, compels the evolution to get rid of the local optimum trap quickly.

4.4. Algorithm Adaptive Parameter Mechanism

The adaptive parameters are usually used to compel the algorithm to ignore the local optimum trap and accelerate the evolution speed. Therefore, the crossover and mutation rate will be modified respectively to compel the evolution to reach the global optimum. The crossover rate P c is usually set with a higher value, and its counterpart P m is lower in comparison at the beginning, which contributes to accelerating the evolution speed of the algorithm at the first stage. During the evolution, as mentioned before, the unification trend will appear, in which most of the solutions in the solution group will be similar to the others. It will be difficult to ignore the local optimum due to this trend. Thus, the mutation rate should be increased to improve the solution group diversity, which is measured by the average length of the solutions ( L ( g ) ¯ ). This is due to the fact that the solution with a higher length could provide more likely good genes for evolution.
L a v g ( g ) = L o f f ( g ) ¯ L p a r ( g ) ¯ = 1 G s ( i = 1 G s L i ( g ) i = 1 G s L i ( g 1 ) )
ε ( x ) = 1 , x 0 1 , o t h e r w i s e
( g ) = t = 0 n 1 ε ( L a v g ( g t ) ) , g n
P c ( g ) = P c ( g 1 ) ( g ) T
P m ( g ) = P m ( g 1 ) + ( g ) T
where G s in Equation (14) indicates the size of the solution group, L o f f ( g ) ¯ and L p a r ( g ) ¯ are the average length of the g-th and ( g 1 ) -th solution groups, ε in Equation (15) represents the recording of the diversity varying trend, ▵ means the accumulation of the diversity change in the latest n generations, P c ( g ) and P m ( g ) are the crossover and mutation rate in the g-th generation and T is the threshold value for the maximum evolution generation. Consequently, CAGA is undertaken to adaptively update the rate of crossover and mutation by recording the diversity varying trend during the evolution process.

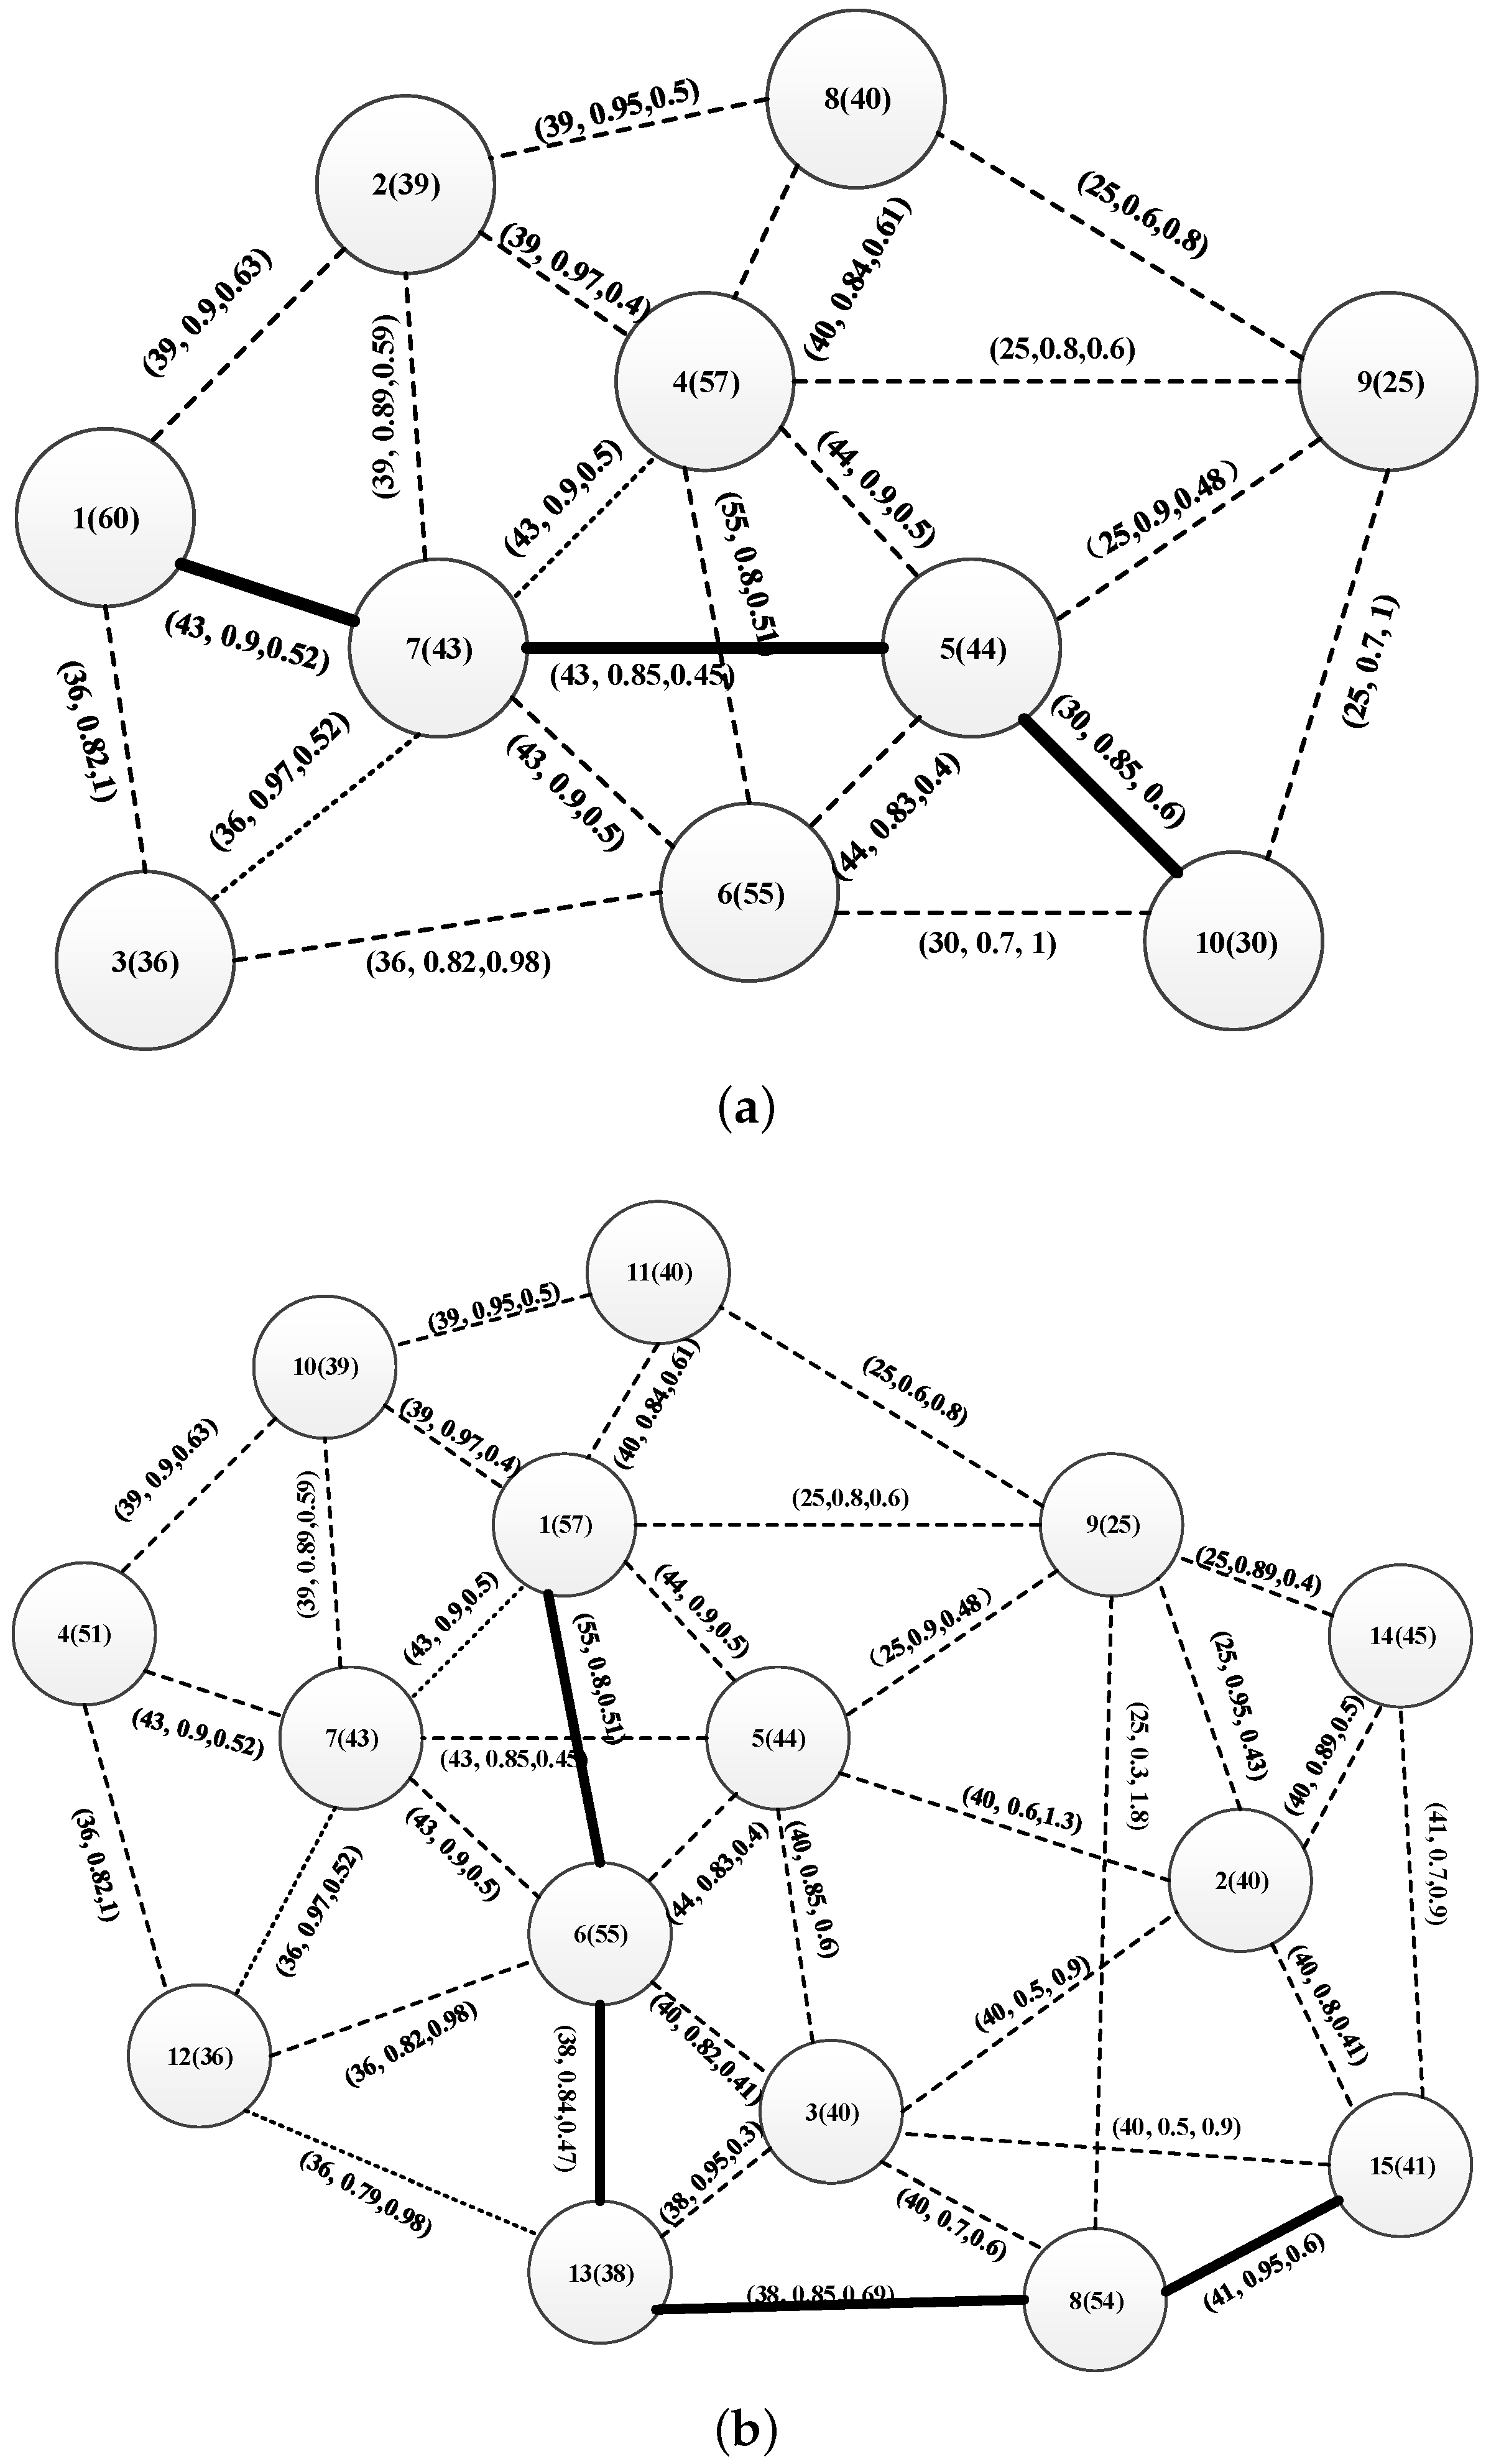
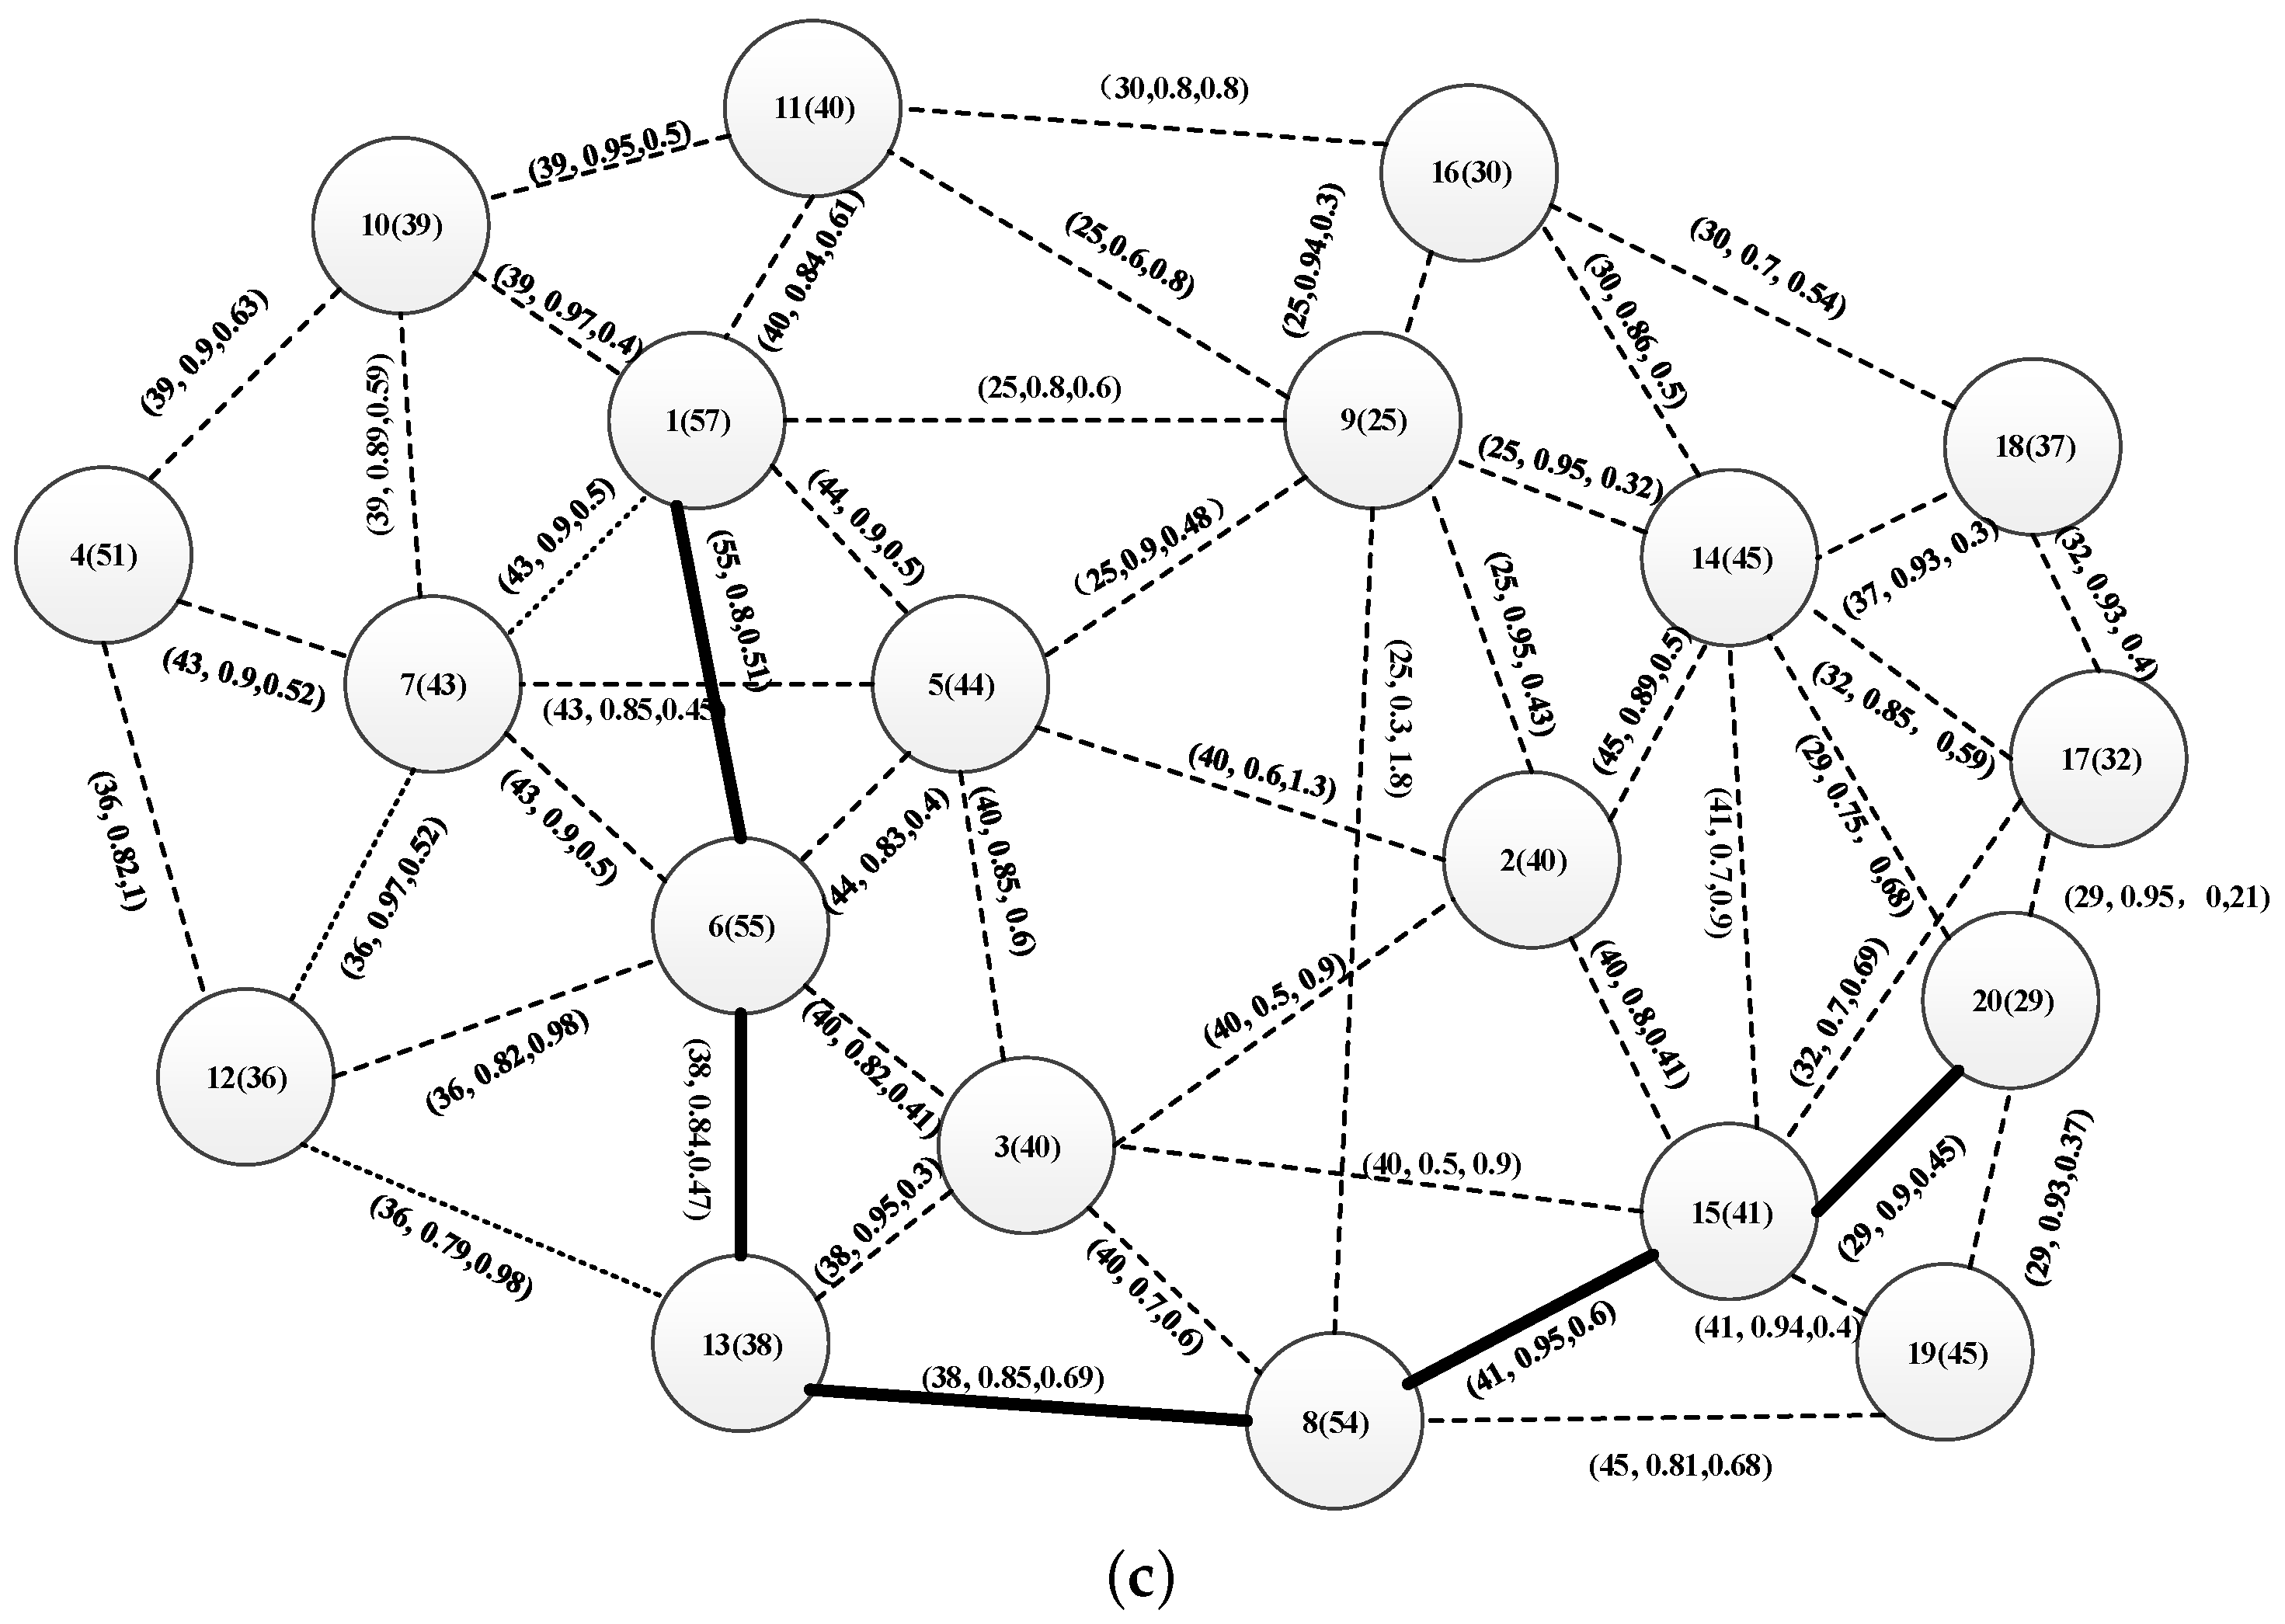
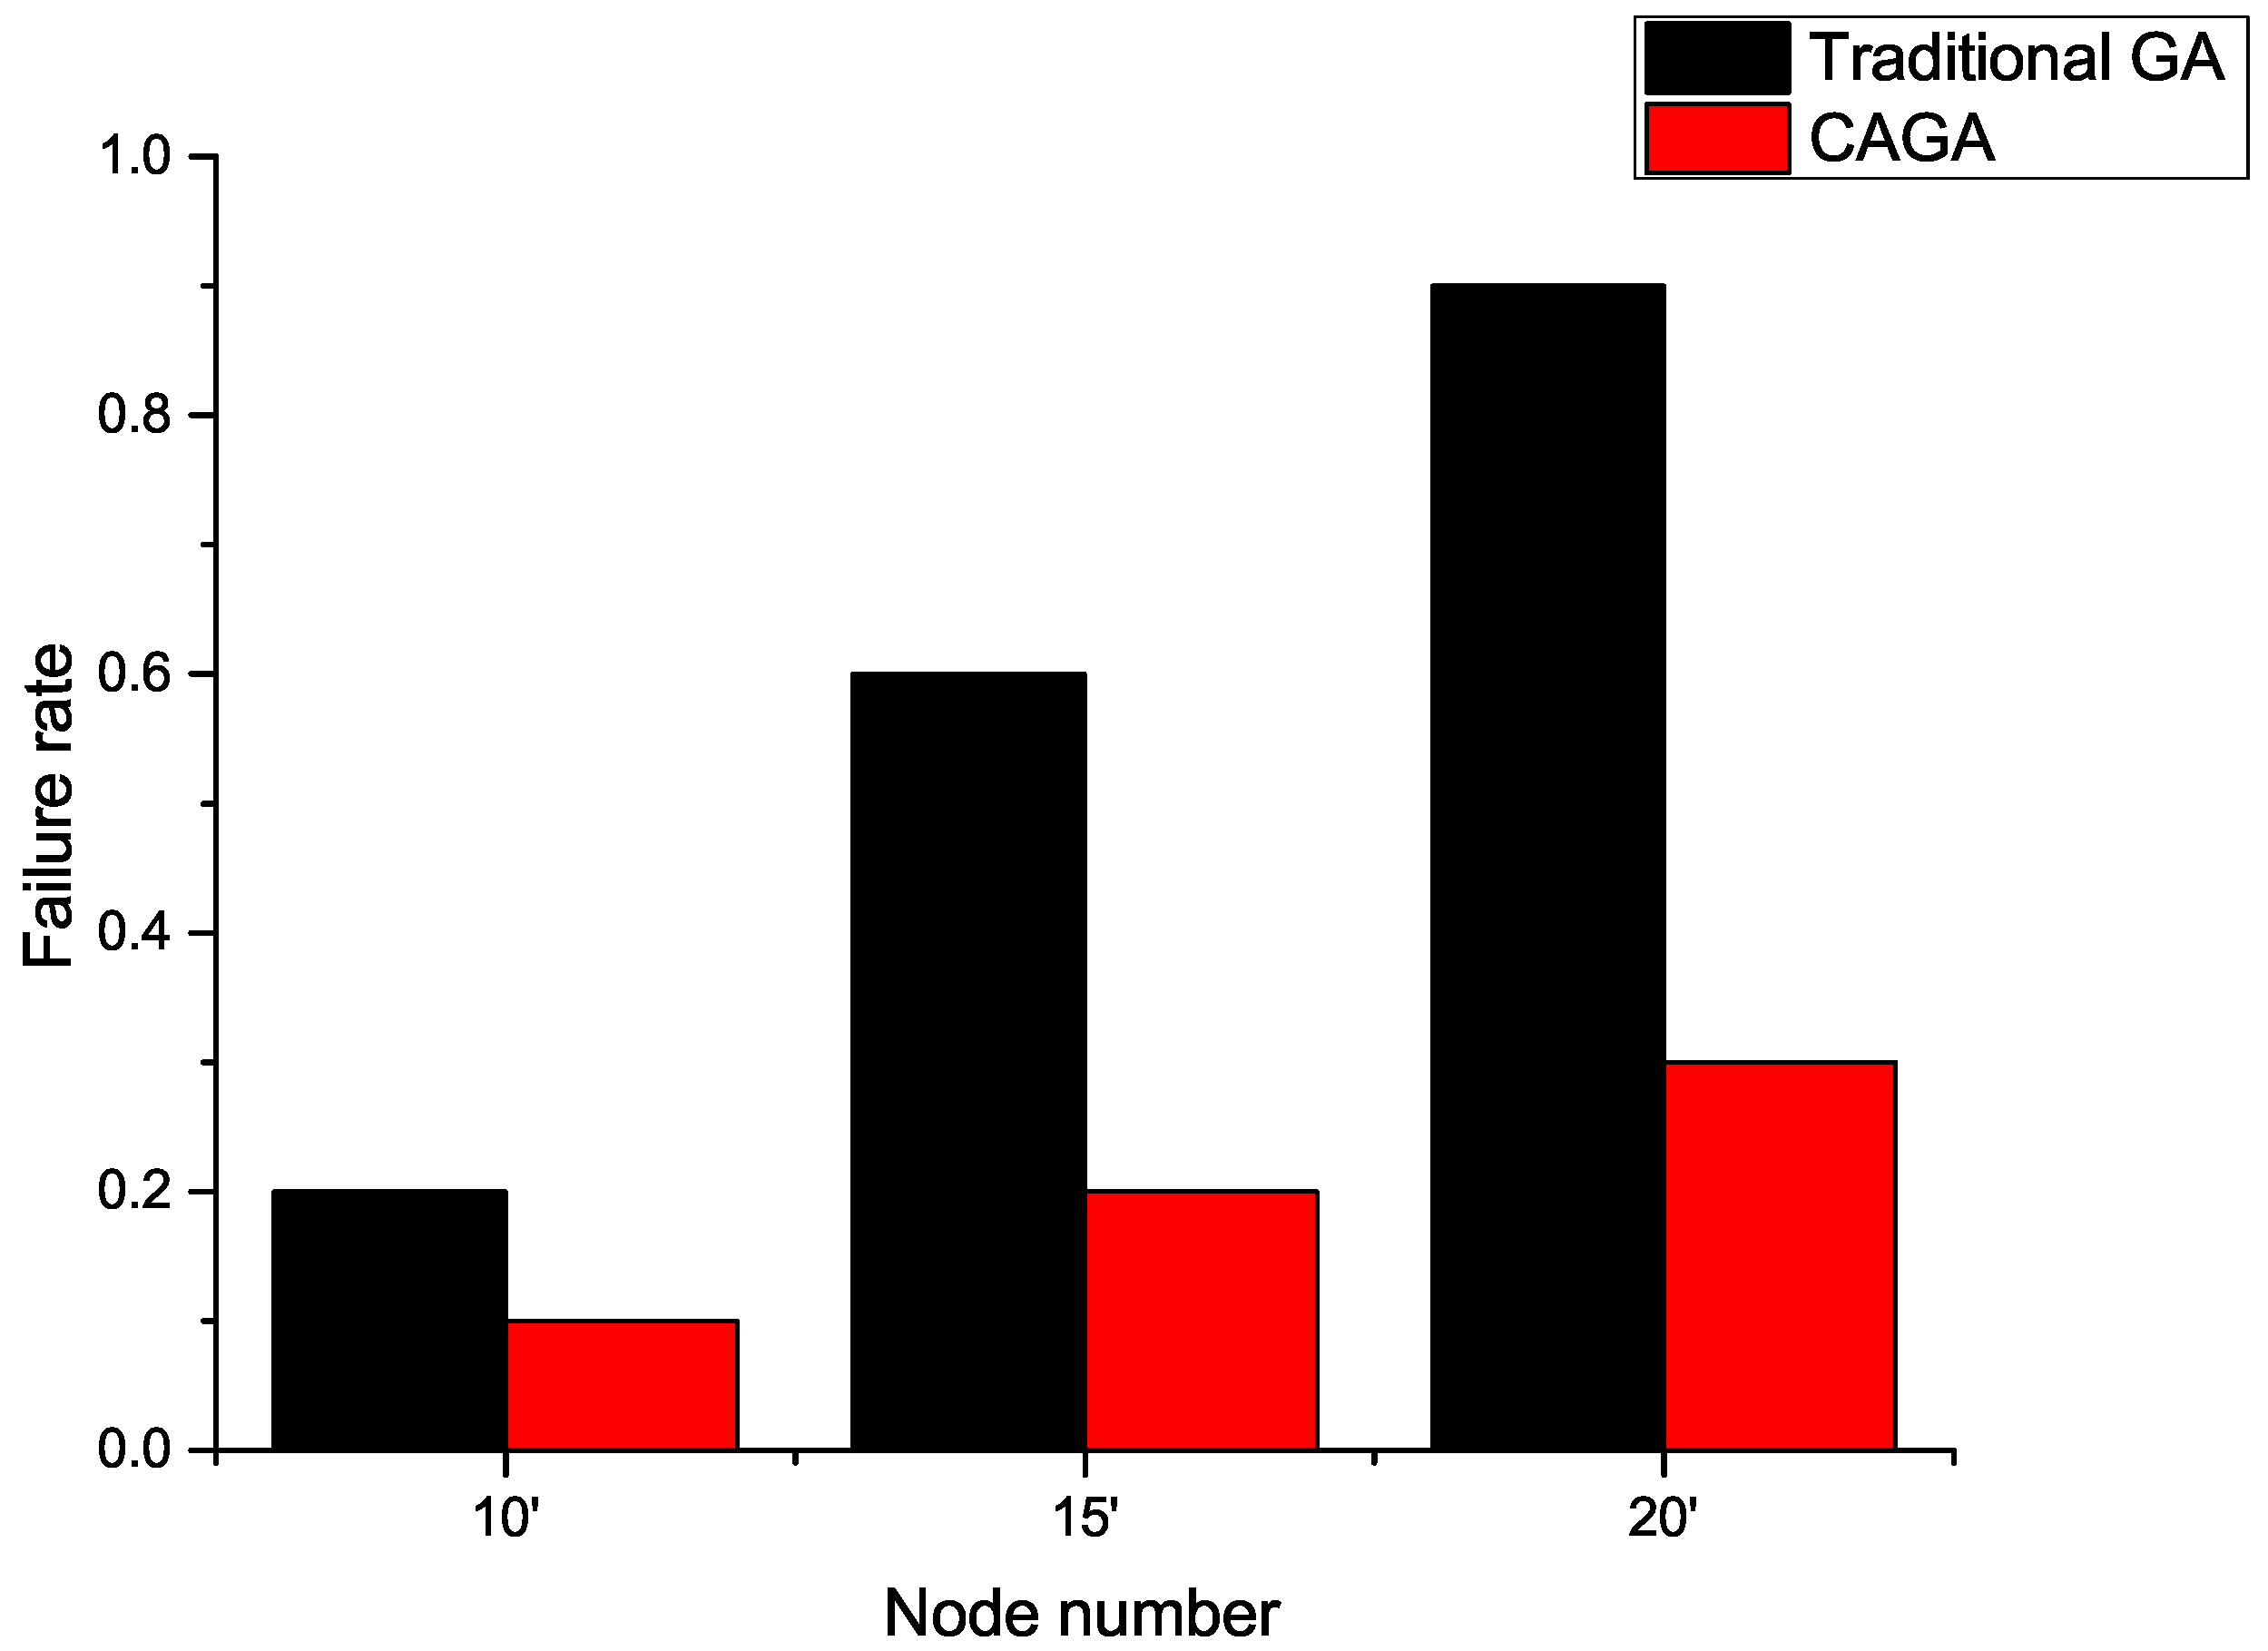
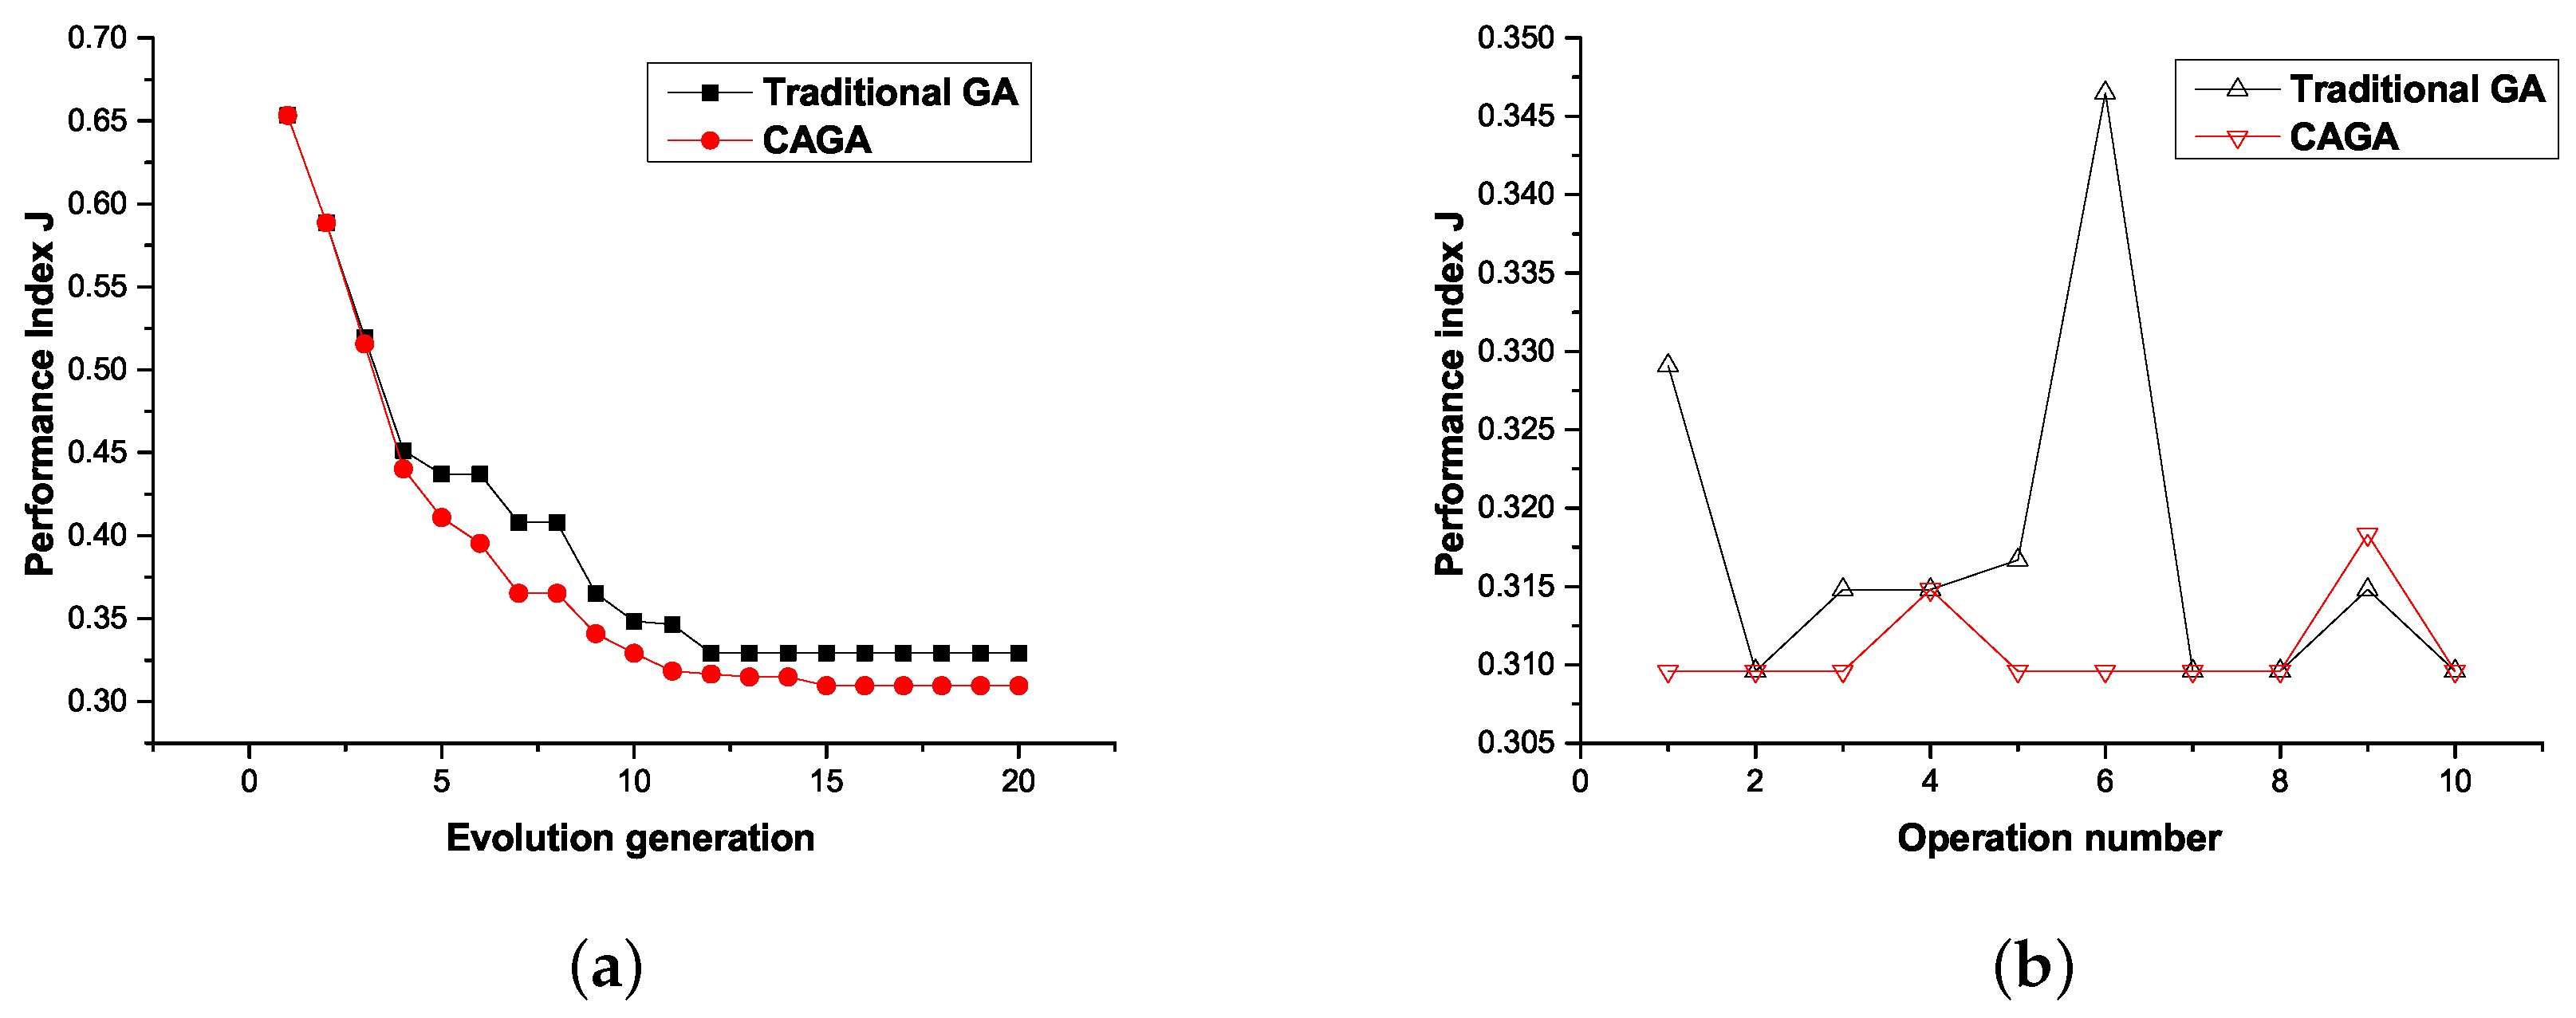
5. Simulation and Verification

In this section, to verify the proposed method for the energy link optimization, the WPTG with different amounts of nodes (N = 10, 15, 20) will be established with a no weight preferences situation ( ω 1 = 0 . 4 , ω 2 = 0 . 3 , ω 3 = 0 . 3 ). As shown in Figure 12, each node is assumed to be distributed randomly, and the weighted link between two nodes is used to represent the abstract energy link. Then, random index weight values are set on the energy link to simulate the power transfer and grid characteristics. Consequently, the optimization process will be undertaken based on these grid topologies, respectively. The power supply node is set as Node 1, and the load node is set as node N in these three situations. The rest nodes act as the candidate repeater nodes. Additionally, the optimal energy link is labelled with a bold line in each grid. In comparison with the traditional genetic algorithm [34], CAGA is undertaken to run the optimization by establishing an optimal energy link through selecting the nodes’ repeater nodes from the candidates. The detailed algorithm parameters are listed as shown in Table 1. This simulation experiment is performed on a PC with a Intel Xeon(R) 3 GHz processor and 4 Gbytes of runtime memory, running Microsoft Windows 7 professional version. MATLAB is utilized to implement all of the programs.
The optimization results and their respective time costs of three grids are listed in Table 2. It indicates that the CAGA could get the optimal result in different situations. However, the traditional GA method always gets trapped in the local optimum. This performance difference is due to the improvements in the algorithm operators in CAGA. These improvements contribute to keeping the diversity of the solution groups, which drives the evolution process to the global optimal result. The time cost is also reduced with the improvement in the diversity of the solution group. As for the algorithm robustness, the performance difference is shown in Figure 13. The results show that with the increase in the node number, the failure rate of the proposed algorithm is almost kept steady at a low level. However, the traditional GA changes greatly with the increase in the node number. Thus, the effect of keeping the diversity of the solution group on algorithm robustness is verified, as well.
To make the algorithm performance difference clearer, the WPTG with 15 nodes is utilized to present it in detail. As shown in Table 3, the convergence results are list to show the two methods’ convergence performance in different index weight preferences. The results of the optimized energy link are listed in Table 3, which shows that the energy link ( { 1 , 6 , 13 , 8 , 15 } ) optimized by CAGA performs better than the traditional genetic algorithm method in the condition of no weight preferences. The time delay is reduced by 17 . 8 % , while the PTE is only reduced by 1 . 24 % in the CAGA in comparison with the traditional result. Thus, the comprehensive performance is improved greatly, which is also confirmed in the performance index value ( 0.3096 0.3291 ); During the weight preference situation, the result of CAGA is increased by 8 % in comparison with the traditional method in the PTE preference situation. The improvement appears in the energy balance and time delay preferences situations as well. Consequently, the feasibility of CAGA proposed in this paper for energy link optimization is verified.
The convergence process and robustness of these two methods are also compared in Figure 14. As shown in Figure 14a, the traditional GA method gets trapped in the 12th evolution generation. In comparison, the proposed CAGA method gets trapped in the 13th generation, but reaches the global optimum in the 15th generation. Meanwhile, the robustness of the algorithm is compared in Figure 14b. The CAGA only fails in the fourth and ninth operation, and thus, the failure rate is 20 % . The traditional GA method only succeeds four times in the repeating 10 operations. Therefore, the conclusion can be made that the CAGA method overwhelms the traditional GA method in different weight preference situations, as well as the algorithm robustness. This result is also due to the fact that GA is a kind of metaheuristic algorithm, which tends to get trapped in the local optimal result. The centralization mechanism and a new crossover method named forward order crossover, as well as the adaptive parameter mechanism are introduced to keep the diversity of the solution group in the proposed method. It greatly contributes to driving the evolution process forward to the global optimal result, and thus, it also improves the robustness.

6. Conclusions and Future Directions

WPTG is a novel energy grid for resolving the power transfer issues in device groups. In this paper, an optimization method for the energy link in WPTG is proposed to get the optimal energy link from the power supply node to the load node. The power transfer characteristic (PTE) and the grid characteristics (time delay and energy load balance) are taken into consideration to establish the optimization model. An advanced genetic algorithm (CAGA) is proposed to undertake the optimization process. This method is running based on the concentration of the solutions and adaptively varying the algorithm parameters. A forward order crossover operator is also introduced to accelerate the evolution speed. The simulation results confirm the feasibility of the proposed method. In future works, the detailed engineering applications of the wireless power transfer grid will be further studied and developed.

Acknowledgments

This work is financially supported by the National High-tech R&D Program (863 Program, Grant No. 2015AA016201), the National Natural Science Foundation of China (Grant No. 51277192; 51377183; 61573074) and the Fundamental Research Funds of Chongqing (Grant No. cstc2013jcyjA0235).

Author Contributions

Zhihao Zhao designed the optimization method and analysed the results. Zhihao Zhao, Yue Sun and Aiguo Patrick Hu analysed the system characteristics and designed the multi-criteria. Xin Dai and Chunsen Tang provided guidance and key suggestions.

Conflicts of Interest

The authors declare no conflict of interest.

Abbreviations

The following abbreviations are used in this manuscript:
WPT
Wireless power transfer
WPTG
Wireless power transfer grid
PTE
Power transfer efficiency
CAGA
Concentration adaptive genetic algorithm

References

  1. Hu, A.P. Selected Resonant Converters for IPT Power Supplies. Ph.D. Thesis, The University of Auckland, Auckland, New Zealand, 2001. [Google Scholar]
  2. Chwei-Sen, W.; Covic, G.A.; Stielau, O.H. Power transfer capability and bifurcation phenomena of loosely coupled inductive power transfer systems. IEEE Trans. Ind. Electron. 2004, 51, 148–157. [Google Scholar]
  3. Kurs, A.; Karalis, A.; Moffatt, R.; Joannopoulos, J.D.; Fisher, P.; Soljacic, M. Wireless power transfer via strongly coupled magnetic resonances. Science 2007, 317, 83–86. [Google Scholar] [CrossRef] [PubMed]
  4. Wang, Z.-H.; Li, Y.-P.; Sun, Y.; Tang, C.-S.; Lv, X. Load detection model of voltage-fed inductive power transfer system. IEEE Trans. Power Electron. 2013, 28, 5233–5243. [Google Scholar] [CrossRef]
  5. Vijayakumaran Nair, V.; Choi, R.J. An efficiency enhancement technique for a wireless power transmission system based on a multiple coil switching technique. Energies 2016, 9, 156. [Google Scholar] [CrossRef]
  6. Liu, C.; Hu, A.P. Effect of series tuning inductor position on power transfer capability of CCPT system. Electron. Lett. 2011, 47, 136–137. [Google Scholar] [CrossRef]
  7. Dai, J.; Ludois, D.C. Single active switch power electronics for kilowatt scale capacitive power transfer. IEEE J. Emerg. Sel. Top. Power Electron. 2015, 3, 315–323. [Google Scholar]
  8. Lu, F.; Zhang, H.; Hofmann, H.; Mi, C. A double-sided LCLC-compensated capacitive power transfer system for electric vehicle charging. IEEE Trans. Power Electron. 2015, 30, 6011–6014. [Google Scholar] [CrossRef]
  9. Huang, L.; Hu, A.P. Defining the mutual coupling of capacitive power transfer for wireless power transfer. Electron. Lett. 2015, 51, 1806–1807. [Google Scholar] [CrossRef]
  10. Krikidis, I.; Timotheou, S.; Zheng, G.; Ng, D.W.K.; Schober, R. Simultaneous wireless information and power transfer in modern communication systems. IEEE Commun. Mag. 2014, 52, 104–110. [Google Scholar] [CrossRef] [Green Version]
  11. Lu, P.; Yang, X.-S.; Li, J.-L.; Wang, B.-Z. A Compact frequency reconfigurable rectenna for 5.2- and 5.8-GHz wireless power transmission. IEEE Trans. Power Electron. 2015, 30, 6006–6010. [Google Scholar] [CrossRef]
  12. Yuan, F.; Jin, S.; Huang, Y.; Wong, K.-K.; Zhang, Q.-T.; Zhu, H. Joint wireless information and energy transfer in massive distributed antenna systems. IEEE Commun. Mag. 2015, 53, 109–116. [Google Scholar] [CrossRef]
  13. Ding, Z.-G.; Zhong, C.-J.; Ng, D.W.K.; Peng, M.-G.; Suraweera, H.A.; Schober, R.; Poor, H.V. Application of smart antenna technologies in simultaneous wireless information and power transfer. IEEE Commun. Mag. 2015, 53, 86–93. [Google Scholar] [CrossRef]
  14. Lin, F.-Y.; Covic, G.A.; Boys, J.T. Evaluation of magnetic pad sizes and topologies for electric vehicle charging. IEEE Trans. Power Electron. 2015, 30, 6391–6407. [Google Scholar] [CrossRef]
  15. Raval, P.; Kacprzak, D.; Hu, A.P. Analysis of flux leakage of a 3-D inductive power transfer system. IEEE J. Emerg. Sel. Top. Power Electron. 2015, 3, 205–214. [Google Scholar] [CrossRef]
  16. Sun, T.-J.; Xie, X.; Li, G.-L.; Gu, Y.-K.; Deng, Y.-D.; Wang, Z.-H. A two-hop wireless power transfer system with an efficiency-enhanced power receiver for motion-free capsule endoscopy inspection. IEEE Trans. Biomed. Eng. 2012, 59, 3247–3254. [Google Scholar] [PubMed]
  17. Lee, C.K.; Zhong, W.-X.; Hui, S.Y.R. Effects of magnetic coupling of nonadjacent resonators on wireless power domino-resonator systems. IEEE Trans. Power Electron. 2010, 27, 1905–1916. [Google Scholar] [CrossRef]
  18. Liang, H.; Zhuang, W. Stochastic modeling and optimization in a microgrid: A survey. Energies 2014, 7, 2027–2050. [Google Scholar] [CrossRef]
  19. Lin, F.Y. Smart distribution: Coupled microgrids. Proc. IEEE 2011, 99, 1074–1082. [Google Scholar]
  20. Sun, Y.; Yang, F.-X.; Dai, X. Construction of wireless power transfer networks based on improved ant colony optimization. J. South China Univ. Technol. 2011, 39, 146–164. [Google Scholar]
  21. Xiang, L.-J.; Sun, Y.; Dai, X.; Chen, Y.; Lv, X. Route optimization for wireless power transfer network based on the ce method. In Proceedings of the International Power Electronics and Application Conference and Exposition, Shanghai, China, 5–8 November 2014; pp. 630–634.
  22. Dai, X.; Sun, Y.; Su, Y.-G.; Tang, C.-S.; Wang, Z.-H. Study on contactless power bi-directional push mode. Proc. Chin. Soc. Electr. Eng. 2010, 30, 55–61. [Google Scholar]
  23. Madawala, U.K.; Thrimawithana, D.J. Current sourced bi-directional inductive power transfer system. IET Power Electron. 2011, 4, 471–480. [Google Scholar] [CrossRef]
  24. Clerc, M.; Kennedy, J. The particle swarm-explosion, stability, and convergence in a multidimensional complex space. IEEE Trans. Evulut. Comput. 2002, 6, 58–73. [Google Scholar] [CrossRef]
  25. Zhan, Z.-H.; Zhang, J.; Li, Y.; Chung, H.S.H. Adaptive particle swarm optimization. IEEE Trans. Syst. Man Cybern. B 2009, 39, 1362–1381. [Google Scholar] [CrossRef] [PubMed]
  26. AlRashidi, M.R.; El-Hawary, M.E. A survey of particle swarm optimization applications in electric power systems. IEEE Trans. Evulut. Comput. 2009, 13, 913–918. [Google Scholar] [CrossRef]
  27. Hui, Q.; Zhang, H. Optimal balanced coordinated network resource allocation using swarm optimization. IEEE Trans. Syst. Man Cybern. Syst. 2015, 45, 770–787. [Google Scholar]
  28. Ho, S.L.; Yang, S. A computationally efficient vector optimizer using ant colony optimizations algorithm for multobjective designs. IEEE Tans. Magn. 2008, 44, 1034–1037. [Google Scholar]
  29. Gan, R.; Guo, Q.; Chang, H.; Yi, Y. Improved ant colony optimization algorithm for the traveling salesman problems. J. Syst. Eng. Electron. 2010, 21, 329–333. [Google Scholar] [CrossRef]
  30. Ding, C.; Cheng, Y.; He, M. Two-level genetic algorithm for clustered traveling salesman problem with application in large-scale tsps. Tsinghua Sci. Technol. 2007, 12, 459–465. [Google Scholar] [CrossRef]
  31. Ewald, G.; Kurek, W.; Brdys, M.A. Grid implementation of a parallel multiobjective genetic algorithm for optimized allocation of chlorination stations in drinking water distribution systems: Chojnice case study. IEEE Trans. Syst. Man Cybern. C 2008, 38, 497–509. [Google Scholar] [CrossRef]
  32. Liu, F.; Liang, S.; Xian, X. Optimal robot path planning for multiple goals visiting based on tailored genetic algorithm. Int. J. Comput. Intell. Syst. 2014, 7, 1109–1122. [Google Scholar] [CrossRef]
  33. May, G.; Stahl, B.; Taisch, M.; Prabhu, V. Multi-objective genetic algorithm for energy-efficient job shop scheduling. Int. J. Prod. Res. 2015, 53, 7071–7089. [Google Scholar] [CrossRef]
  34. Munetomo, M.; Taka, Y.; Sato, Y. A migration scheme for the genetic adaptive routing algorithm. In Proceedings of the IEEE International Conference on Systems, Man, and Cybernetics, San Diego, CA, USA, 11–14 October 1998; pp. 2774–2779.
Figure 1. Architecture of a wireless power transfer grid with external power injection.
Energies 09 00682 g001
Figure 2. Power transfer roles.
Energies 09 00682 g002
Figure 3. Grid operating mechanism.
Energies 09 00682 g003
Figure 4. Flowchart of energy request decision.
Energies 09 00682 g004
Figure 5. Energy link comparison.
Energies 09 00682 g005
Figure 6. Energy link optimization graph.
Energies 09 00682 g006
Figure 7. Algorithm flowchart.
Energies 09 00682 g007
Figure 8. CAGA encoding.
Energies 09 00682 g008
Figure 9. Different genes in two solutions.
Energies 09 00682 g009
Figure 10. Crossover operator.
Energies 09 00682 g010
Figure 11. Mutation operator.
Energies 09 00682 g011
Figure 12. Grid topology (N nodes), ω 1 = 0 . 4 , ω 2 = 0 . 3 , ω 3 = 0 . 3 . (a) N = 10; (b) N = 15; (c) N = 20.
Energies 09 00682 g012aEnergies 09 00682 g012b
Figure 13. Robustness performance comparison.
Energies 09 00682 g013
Figure 14. Algorithm performance comparison, ω 1 = 0 . 4 , ω 2 = 0 . 3 , ω 3 = 0 . 3 . (a) Convergence comparison; (b) Robustness comparison.
Energies 09 00682 g014
Table 1. Optimization parameters.
ParameterValue
Solution group size G s 40
Maximum evolution generations T50
Initial crossover rate P c 0 . 9
Initial mutation rate P m 0 . 1
Trend recording number n3
Constrain value for PTE P T E m 0 . 5
Constrain value for time delay D m / s 1 . 5
Constrain value for energy storage S m / k W h 27
Table 2. Performance comparison of the convergence.
Optimization MethodN = 10N = 15N = 20
Traditional GA method{1,2,4,5,10}/1.1 s{1,7,6,13,8,15}/1.97 s{1,5,3,13,8,15,20}/3.1 s
CAGA{1,7,5,10}/0.88 s{1,6,13,8,15}/1.43 s{1,6,13,8,15,20}/1.91 s
Table 3. Convergence results (N = 15).
Optimization MethodIndex WeightOptimized Energy LinkJ P T E D e l S m s t
Traditional GA method { 0 . 4 , 0 . 3 , 0 . 3 } { 1 , 7 , 6 , 13 , 8 , 15 } 0.32910.54942.7638
CAGA { 0 . 4 , 0 . 3 , 0 . 3 } { 1 , 6 , 13 , 8 , 15 } 0.30960.54262.2738
Traditional GA method { 0 . 7 , 0 . 2 , 0 . 1 } { 1 , 7 , 12 , 13 , 8 , 15 } 0.40110.54693.2936
CAGA { 0 . 7 , 0 . 2 , 0 . 1 } { 1 , 5 , 3 , 13 , 8 , 15 } 0.37630.58692.6938
Traditional GA method { 0 . 2 , 0 . 7 , 0 . 1 } { 1 , 7 , 12 , 13 , 8 , 15 } 0.52440.54693.2936
CAGA { 0 . 2 , 0 . 7 , 0 . 1 } { 1 , 5 , 3 , 8 , 15 } 0.4930.50872.340
Traditional GA method { 0 . 2 , 0 . 1 , 0 . 7 } { 1 , 6 , 3 , 8 , 15 } 0.09540.43622.1240
CAGA { 0 . 2 , 0 . 1 , 0 . 7 } { 1 , 5 , 3 , 15 } 0.09220.38251.8240

