Next Article in Journal
Promoting Effect of Inorganic Alkali on Carbon Dioxide Adsorption in Amine-Modified MCM-41
Next Article in Special Issue
Analysis of a Hybrid Solar-Assisted Trigeneration System
Previous Article in Journal
Energy Management of an Off-Grid Hybrid Power Plant with Multiple Energy Storage Systems
Previous Article in Special Issue
Energy Simulation of a Holographic PVT Concentrating System for Building Integration Applications
 
 
Correction published on 21 June 2017, see Energies 2017, 10(6), 829.
Article

Thermoeconomic Modeling and Parametric Study of a Photovoltaic-Assisted 1 MWe Combined Cooling, Heating, and Power System

by
Alexandros Arsalis
1,2,*,
Andreas N. Alexandrou
1,2 and
George E. Georghiou
2,3
1
Department of Mechanical and Manufacturing Engineering, University of Cyprus, Nicosia 1678, Cyprus
2
FOSS Research Centre for Sustainable Energy, University of Cyprus, Nicosia 1678, Cyprus
3
Department of Electrical and Computer Engineering, University of Cyprus, Nicosia 1678, Cyprus
*
Author to whom correspondence should be addressed.
Energies 2016, 9(8), 663; https://doi.org/10.3390/en9080663
Submission received: 26 July 2016 / Revised: 30 July 2016 / Accepted: 11 August 2016 / Published: 20 August 2016
(This article belongs to the Special Issue Simulation of Polygeneration Systems)

Abstract

:
In this study a small-scale, completely autonomous combined cooling, heating, and power (CCHP) system is coupled to a photovoltaic (PV) subsystem, to investigate the possibility of reducing fuel consumption. The CCHP system generates electrical energy with the use of a simple gas turbine cycle, with a rated nominal power output of 1 MWe. The nominal power output of the PV subsystem is examined in a parametric study, ranging from 0 to 600 kWe, to investigate which configuration results in a minimum lifecycle cost (LCC) for a system lifetime of 20 years of service. The load profile considered is applied for a complex of households in Nicosia, Cyprus. The solar data for the PV subsystem are taken on an hourly basis for a whole year. The results suggest that apart from economic benefits, the proposed system also results in high efficiency and reduced CO2 emissions. The parametric study shows that the optimum PV capacity is 300 kWe. The minimum lifecycle cost for the PV-assisted CCHP system is found to be 3.509 million €, as compared to 3.577 million € for a system without a PV subsystem. The total cost for the PV subsystem is 547,445 €, while the total cost for operating the system (fuel) is 731,814 € (compared to 952,201 € for a CCHP system without PVs). Overall, the proposed system generates a total electrical energy output of 52,433 MWh (during its whole lifetime), which translates to a unit cost of electricity of 0.067 €/kWh.

Graphical Abstract

1. Introduction

Cogeneration has gained more attention in recent years in an effort to develop highly efficient systems at all scales from the kW to the MW range [1,2,3,4]. It is a method that has the potential of attaining high fuel efficiency, since the exhaust gases leave the system and enter the atmosphere with a very low exergy [5], which also suggests reduction in greenhouse gases (e.g. CO2 emissions) [6]. However, rigorous design considerations have to be made to achieve high system efficiency at minimum lifecycle cost (LCC). Cogeneration can have various applications, which can typically combine the generation of power, heating and cooling. In climates which require both space heating and space cooling in different periods of the year, a promising application of cogeneration is combined cooling, heating, and power (CCHP). Therefore, CCHP systems can be considered as alternatives to large-scale, electricity-only generating power plants, to improve fuel efficiency by recovering the rejected heat from the thermal cycle for district heating and district cooling. Although such a system can be applied in various scales, configurations and capacities, an interesting application is in small-scale, decentralized, completely autonomous systems. These distributed energy systems operate with minimum losses, due to their proximity with the serviced buildings. They typically range from 1 to 10 MWe and can provide power, space heating, domestic hot water and space cooling. Heating, or cooling, can be provided with a simple district energy network connecting the consumption site with the CCHP system. Since heating and cooling loads do not generally coincide, the same district network can be used in the summer to distribute cooling, produced by thermally activated absorption chillers, also located within the CCHP system [5,7].
Photovoltaic technology converts solar radiation directly into electricity and two commercialized types that are currently the most popular ones for practical applications are: (1) polycrystalline silicon photovoltaics (PVs), which is a well-established, tested, and mature technology; and (2) thin film solar cells, which is a relatively new technology, which can operate more efficiently than polycrystalline PVs (~10%) in low-light conditions (e.g., dawn, or cloudy day). In recent years, due to improvements in PV panel efficiency and manufacturing methods, the payback times have fallen to 2–3 years for crystalline silicon PV systems, and to almost 1 year for some thin-film ones, under moderate levels of sunshine [8]. However the major problem is the high cost of manufacturing the sheets of semiconductor materials needed for power systems. The cost of PV modules in 2012 was 0.8 USD/W, but it was expected to drop to 0.6 USD/W (thin-film “First Solar”) [9]. The most important advantages of PV technology are: (a) they can be installed in a wide variety of places; (b) additional modules can be added incrementally; (c) quick installation; (d) little maintenance; (e) power can be produced during the afternoon hours when demand is at its peak; and (f) power generation is often on-site, thereby eliminating transmission losses [10]. The economic feasibility of solar energy depends heavily on energy cost and available subsidies. Subsidies for PV systems in Cyprus are generally on the order of 50% of the total price (including purchase and installation costs). In addition, a further step could involve the integration of a hydrogen generating and storage subsystem. This modification could lead to the eventual development of a self-sustainable, hydrocarbon-free CCHP system. This can be achieved by further integration of an electrolyzer-hydrogen storage unit with the CCHP system, where a gas turbine cycle will be able to combust renewable hydrogen when solar energy is unavailable [11]. The modular nature of both PVs and electrolyzer stacks is thereby a significant advantage in achieving these targets.
In recent publications, the authors have presented a liquefied natural gas (LNG)-fueled CCHP system, considering different system capacities (1–10 MWe), to investigate the feasibility of such systems to penetrate the energy market in countries with hot climates requiring both cooling and heating energy [5,7]. In this study a PV-assisted 1 MWe CCHP system is considered for application in a hot climatic region, where the system is assumed to be located far from existing central power plants, e.g., to fulfill the energy needs of a remote community. An interesting aspect in terms of fueling could be liquefied natural gas (LNG), which is readily available in different areas of the world. However, it should be noted that the system is not restricted to the use of LNG, and most conventional hydrocarbons could be used to fuel the CCHP system. In this study, a PV subsystem is considered for operation along with the CCHP system, in the vicinity of the latter, to reduce fuel consumption when solar energy is available. The capacity of the integrated units (i.e., available heating and cooling) will vary according to the operating scheme of the gas turbine cycle. The absorption chiller unit is assumed to be of the double-effect LiBr-H2O type. Therefore, this research work investigates the above options and modifications to quantify and analyze the thermoeconomic performance of the proposed system.

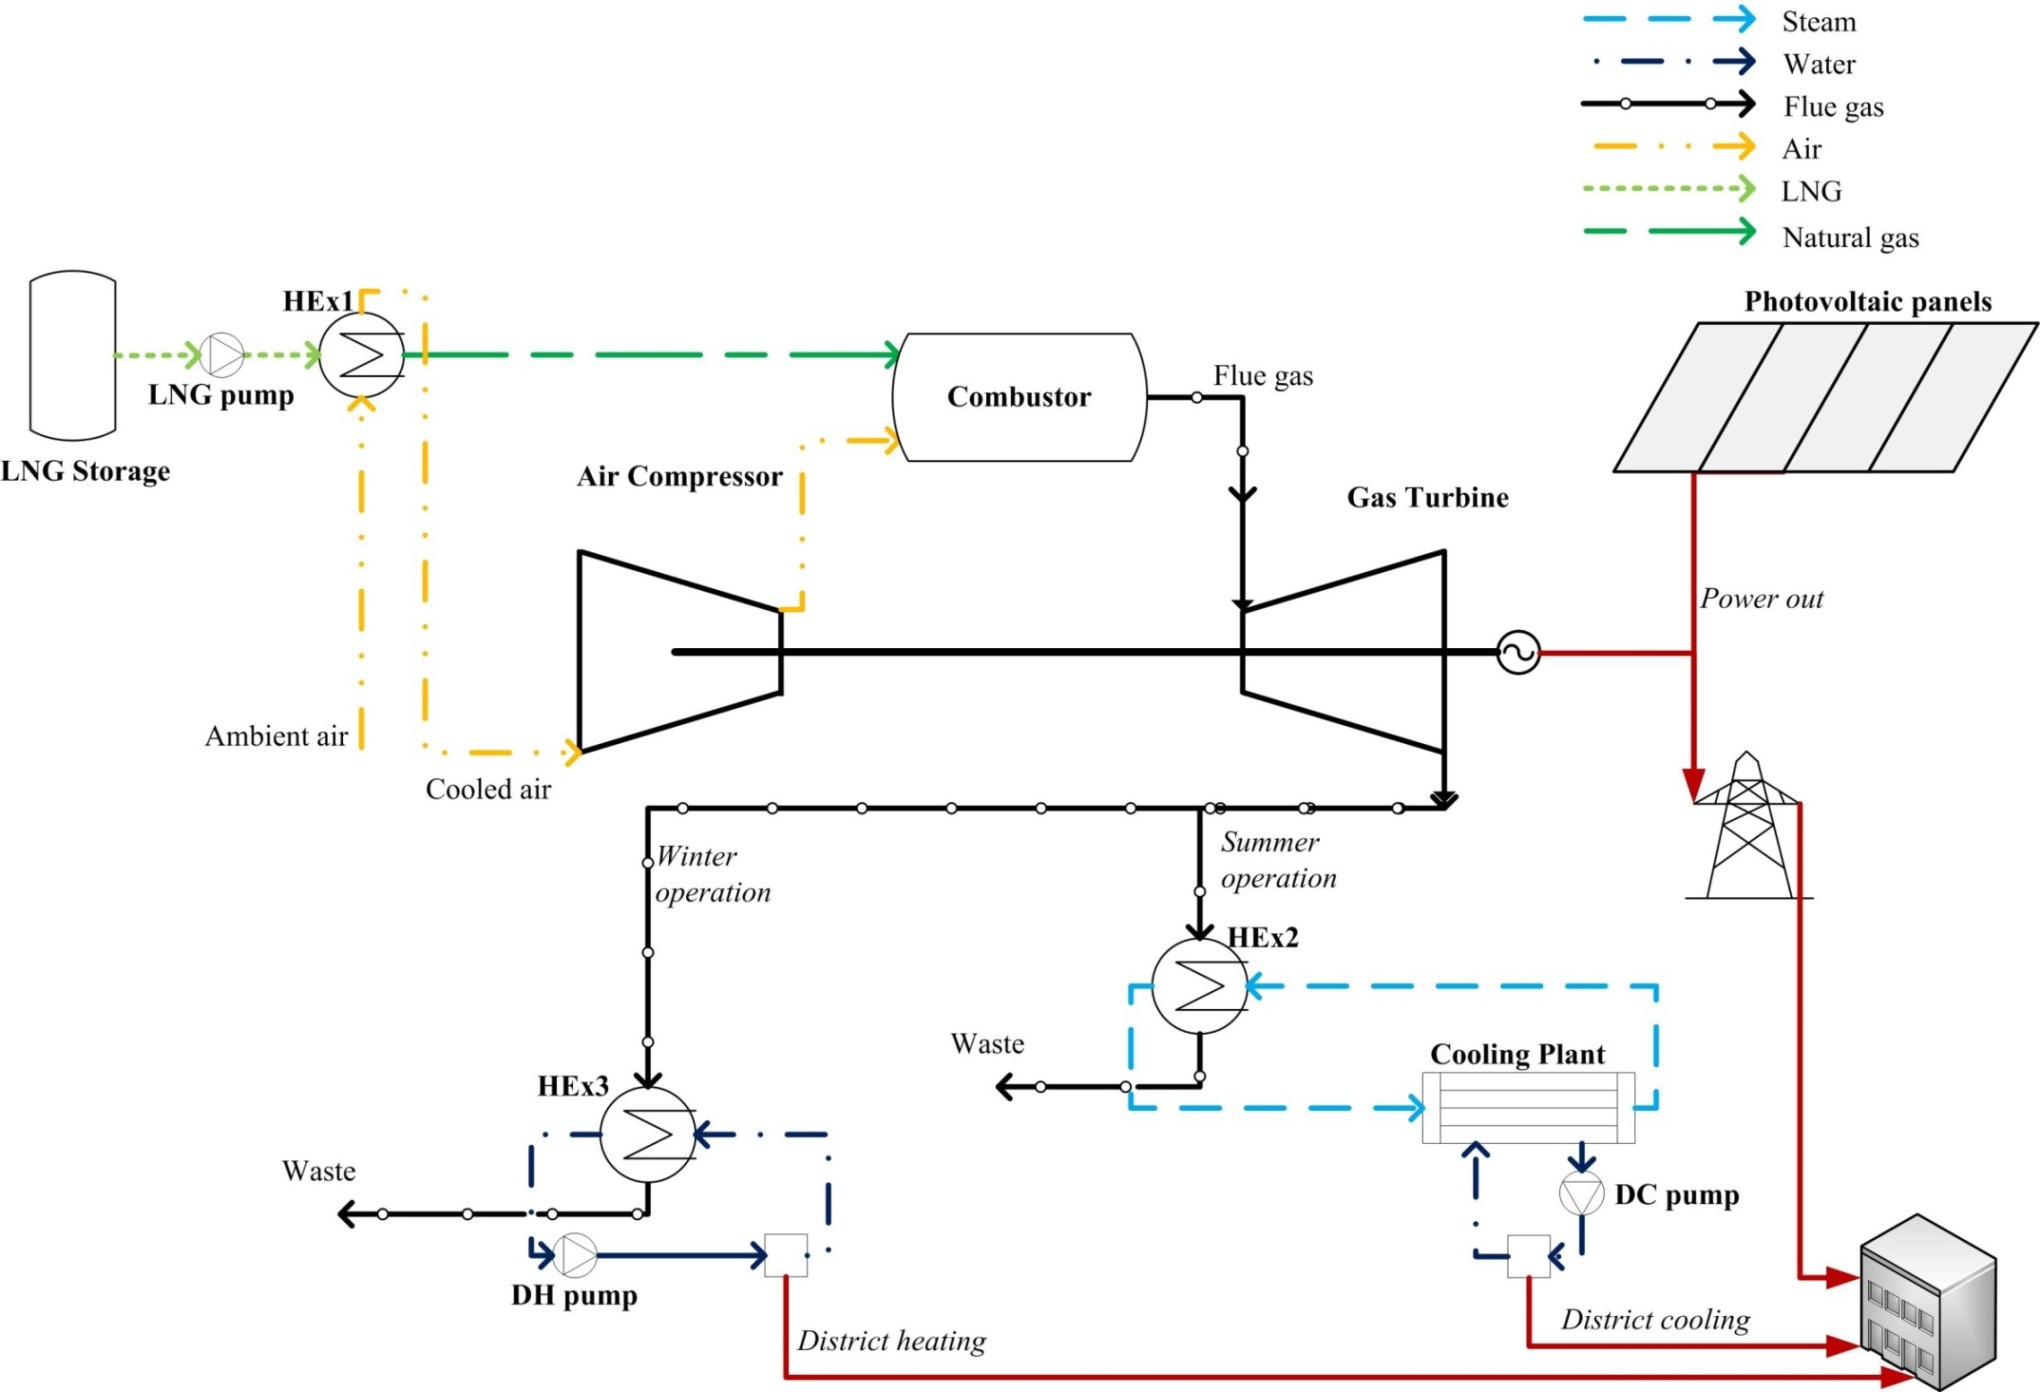
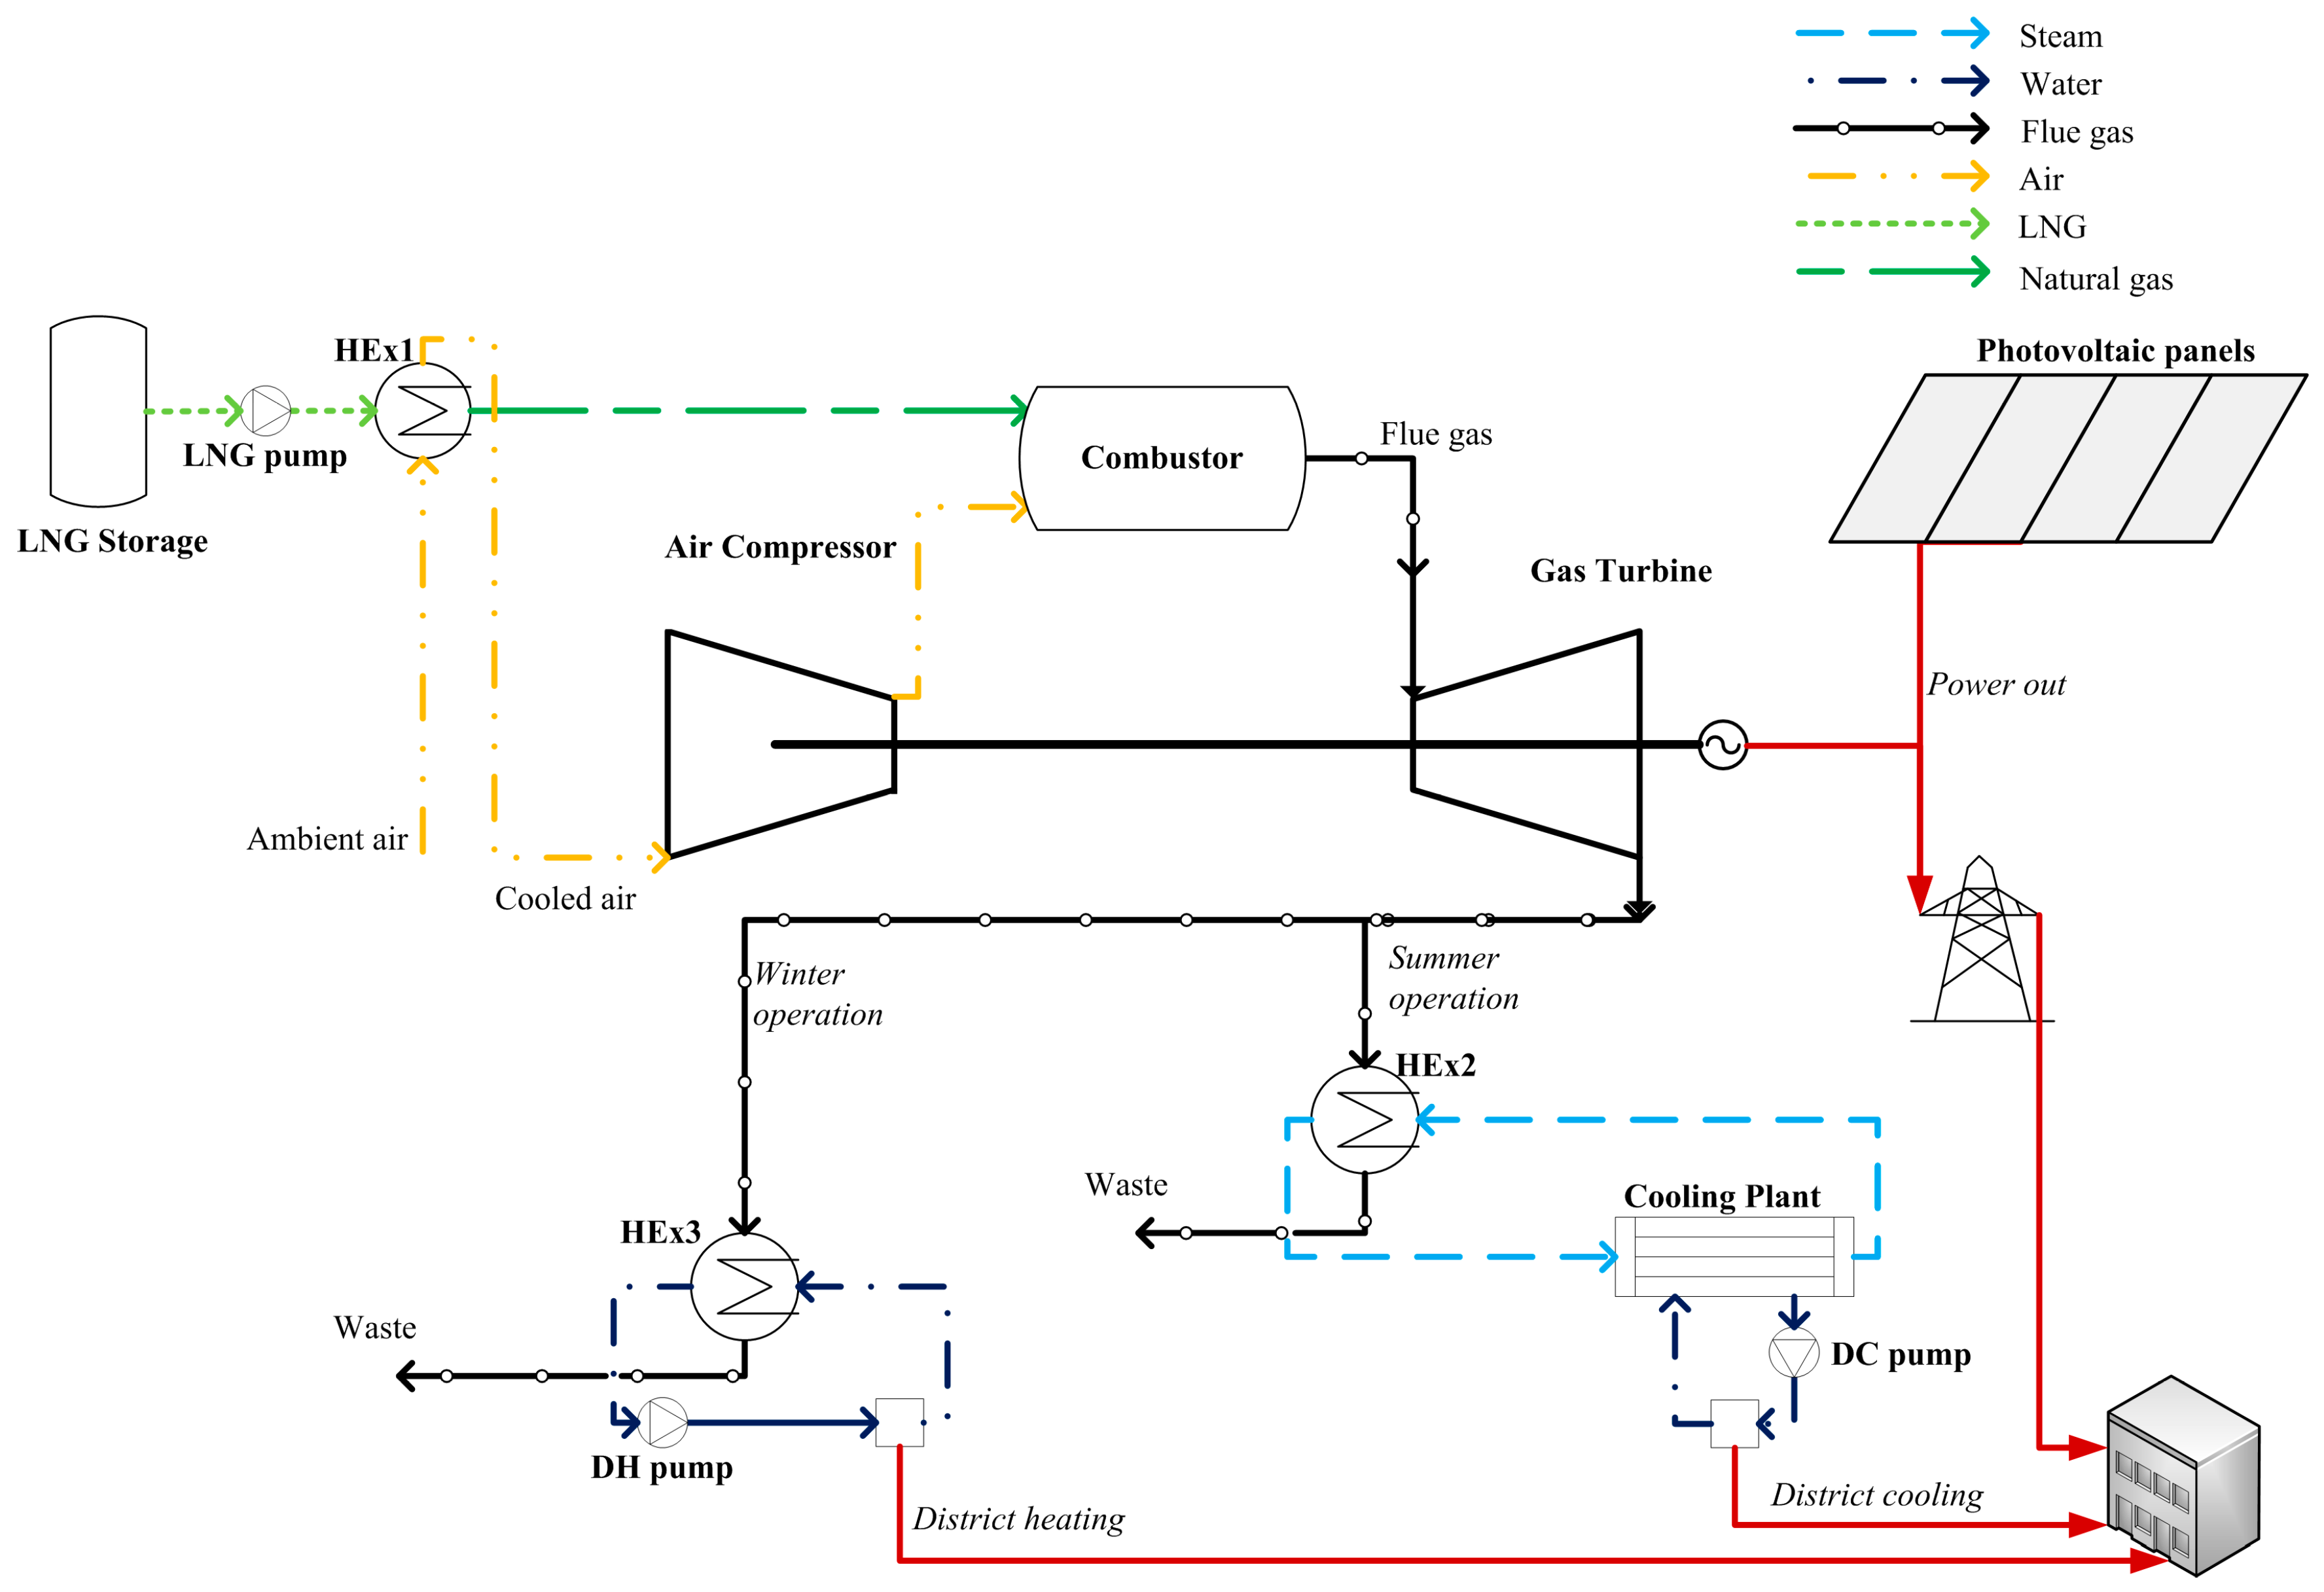
2. System Configuration

The system configuration is shown schematically in Figure 1. LNG is transported to the CCHP system location and, before combustion, natural gas is preheated and converted to gasified form. This is achieved by heat exchanger (HEx) 1, which receives atmospheric air. This air is subsequently fed to the air compressor for combustion. The generated flue gas in the combustor is expanded in the gas turbine to produce electricity through the electric generator. The hot exhausted flue gas from the gas turbine can be used in summer operation to produce steam in HEx 2, which is fed to the heat-activated cooling plant comprised of the LiBr-H2O absorption chiller. The produced cooling energy is distributed to nearby buildings by means of a district energy network. During winter operation, the heat is recovered by HEx 3 and distributed to the buildings with the district energy network.
The study assumes 5% heat losses in the heat exchangers and the pipelines of the district energy network. To simplify calculations, natural gas is assumed to consist only of methane. Pressure losses at a rate of 5% are assumed for every component (heat exchangers, pumps, and combustor), and 10% for the district energy network. Power input to the pumps is neglected in the calculations, because it is very small compared to the power generated by the system (less than 1%). The reason is due to the fact that the energy transferred through the network is in a closed circuit, meaning that only minimum amount of power is needed to supplement pressure losses (also the energy network is rather small, with a total length of 2 km). The completely autonomous system follows an electricity-led operating strategy to avoid the need of interacting with a central power grid, i.e., import/ export of electricity. The gas turbine cycle does not require a fuel (natural gas) compressor, because the fuel is already at high pressure, specifically at 4.5 MPa [5,7]. Finally, the modeling of the proposed system does not include components related to regulating voltage/frequency (i.e., capacitors, batteries, etc.). It is acknowledged that in a complete system, some of these components would have to be included in the system, along with a control system.

3. Modeling Methodology

The models combine theoretical principles and experimental data, where applicable and available from manufacturers, or the literature. In the following subsections each mathematical model of the proposed system is described in detail and all relationships used are given along with the input values (shown in Table 1). Also details are given for the system energy balance equations, which relate the power, heating, and cooling outputs of the proposed PV-assisted CCHP system to the energy requirements of the serviced buildings (i.e., the load profile). Finally the cost model for each component and the overall system are given in the end of this section.
In summary, the following procedure is carried out to generate the simulation data:
  • The components/subsystems for the CCHP system are modeled individually from first principles, and then they are combined to produce the total CCHP system model.
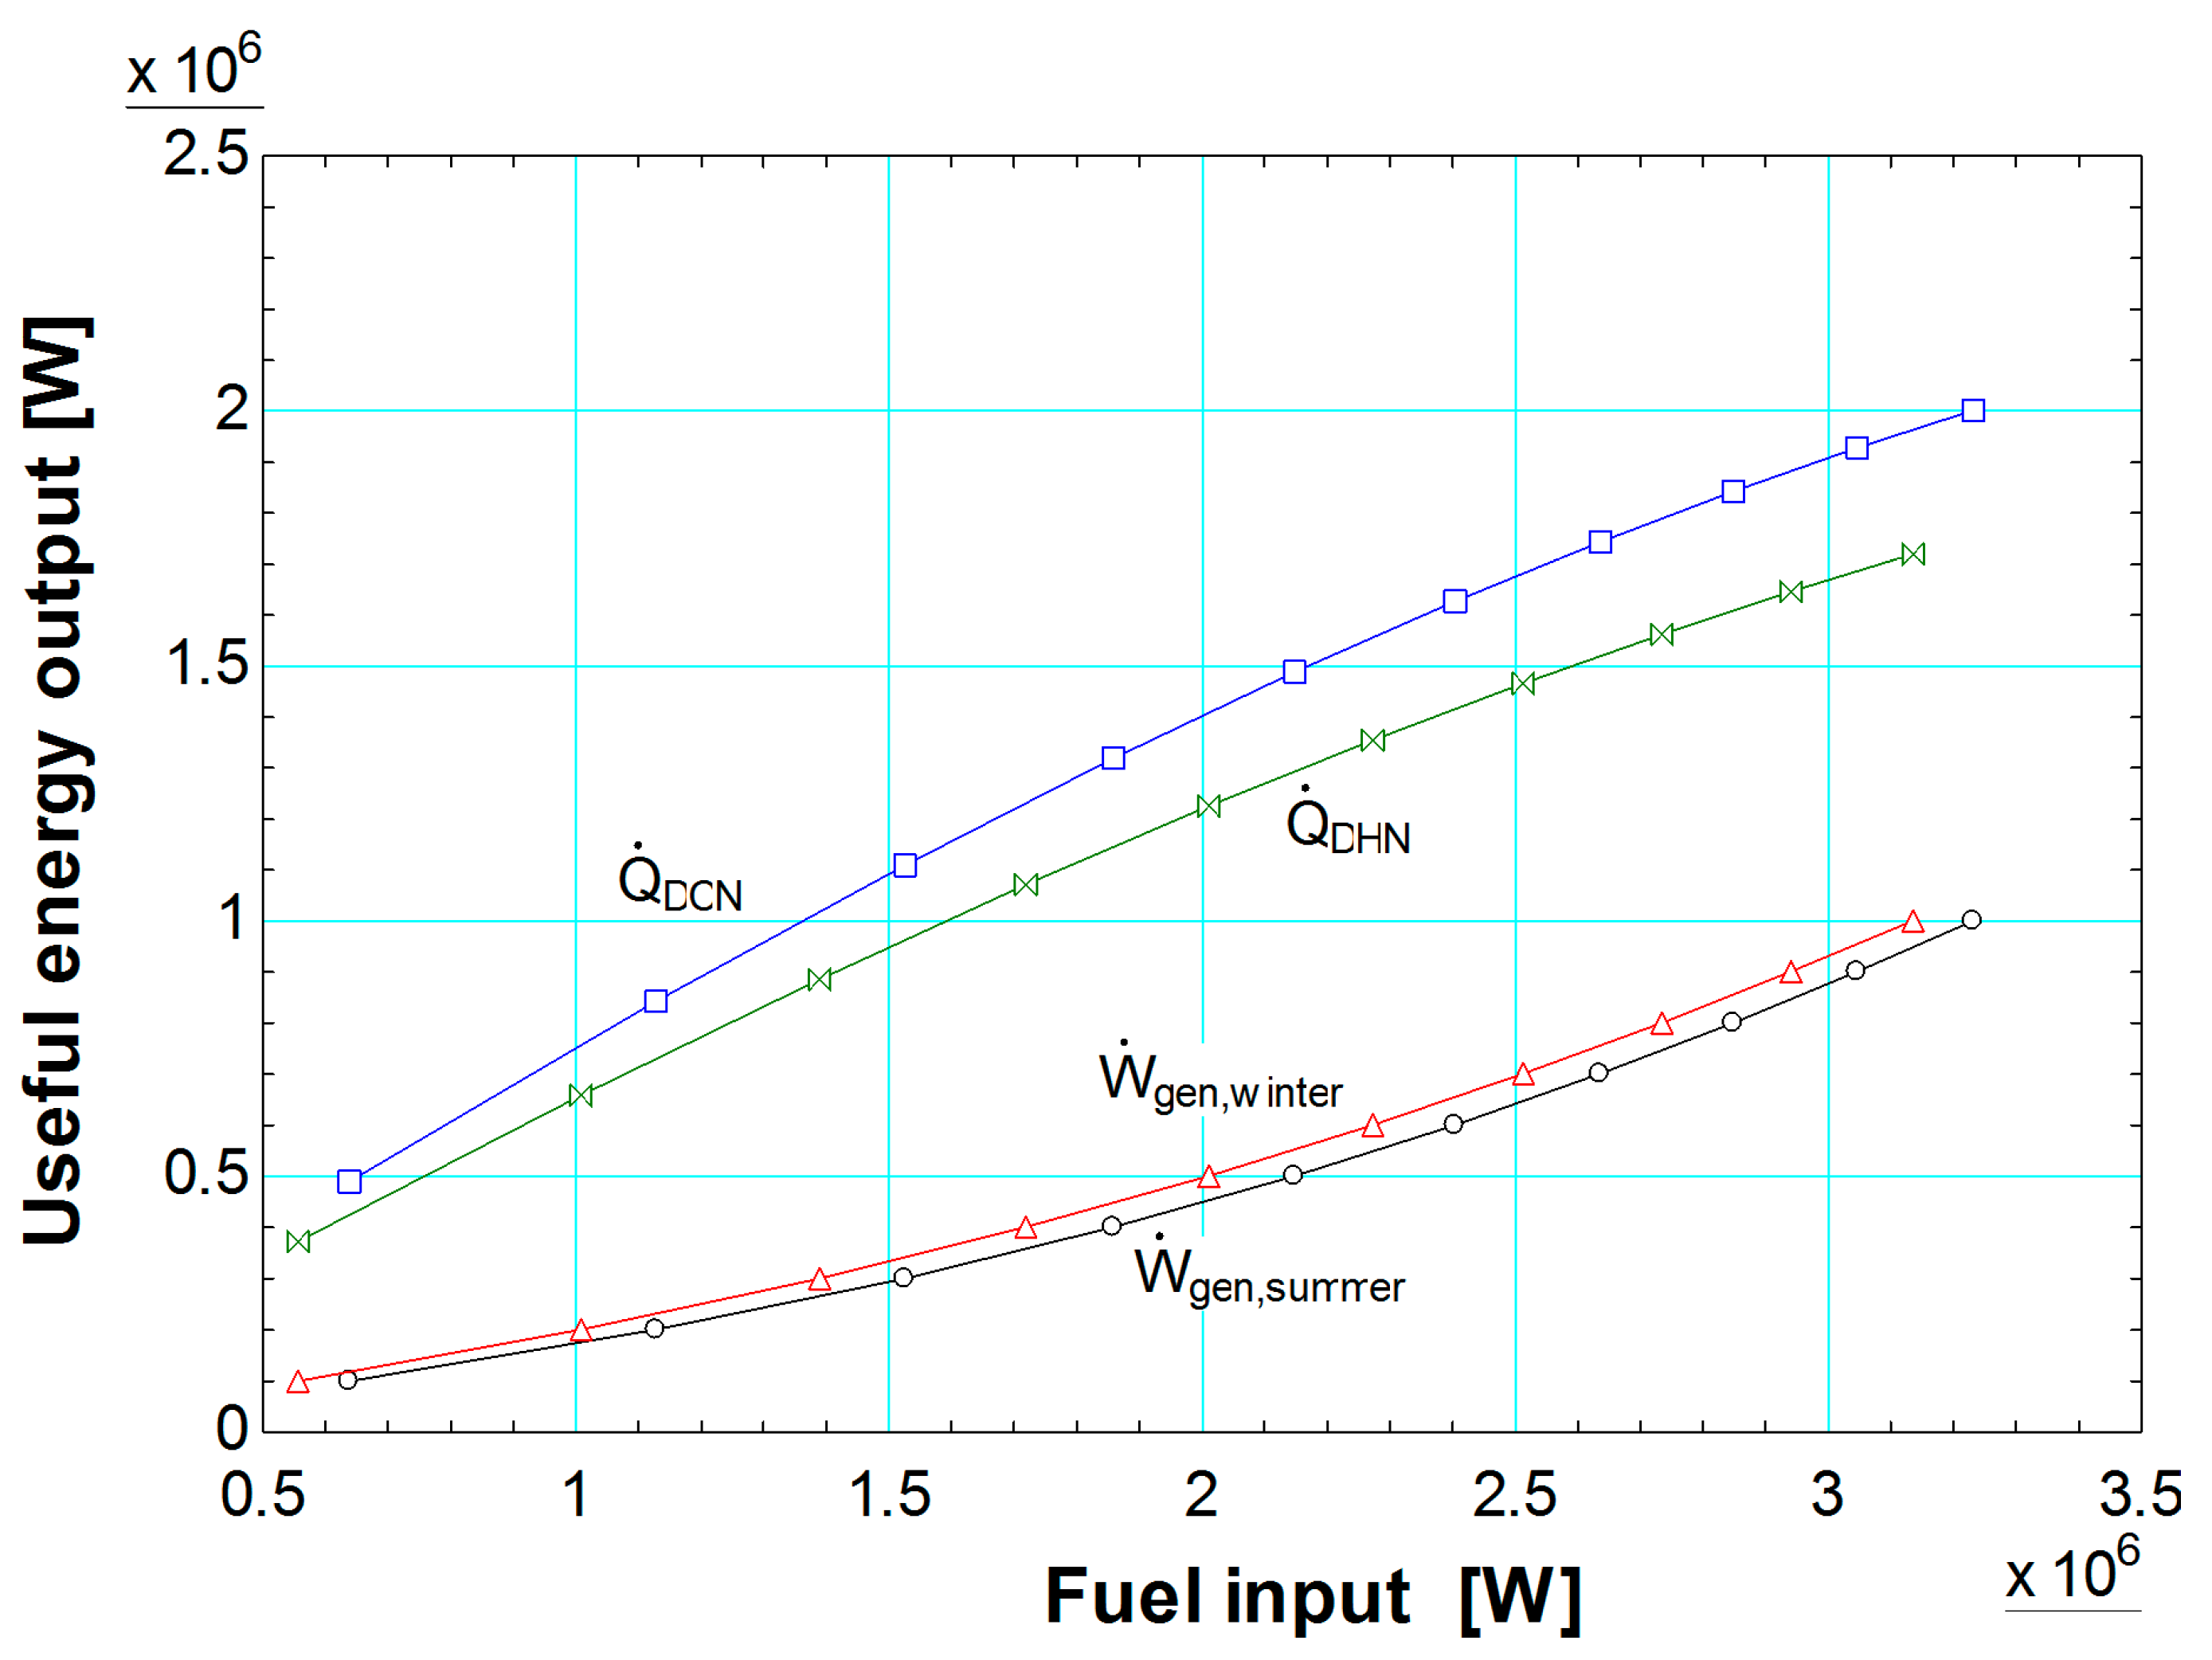
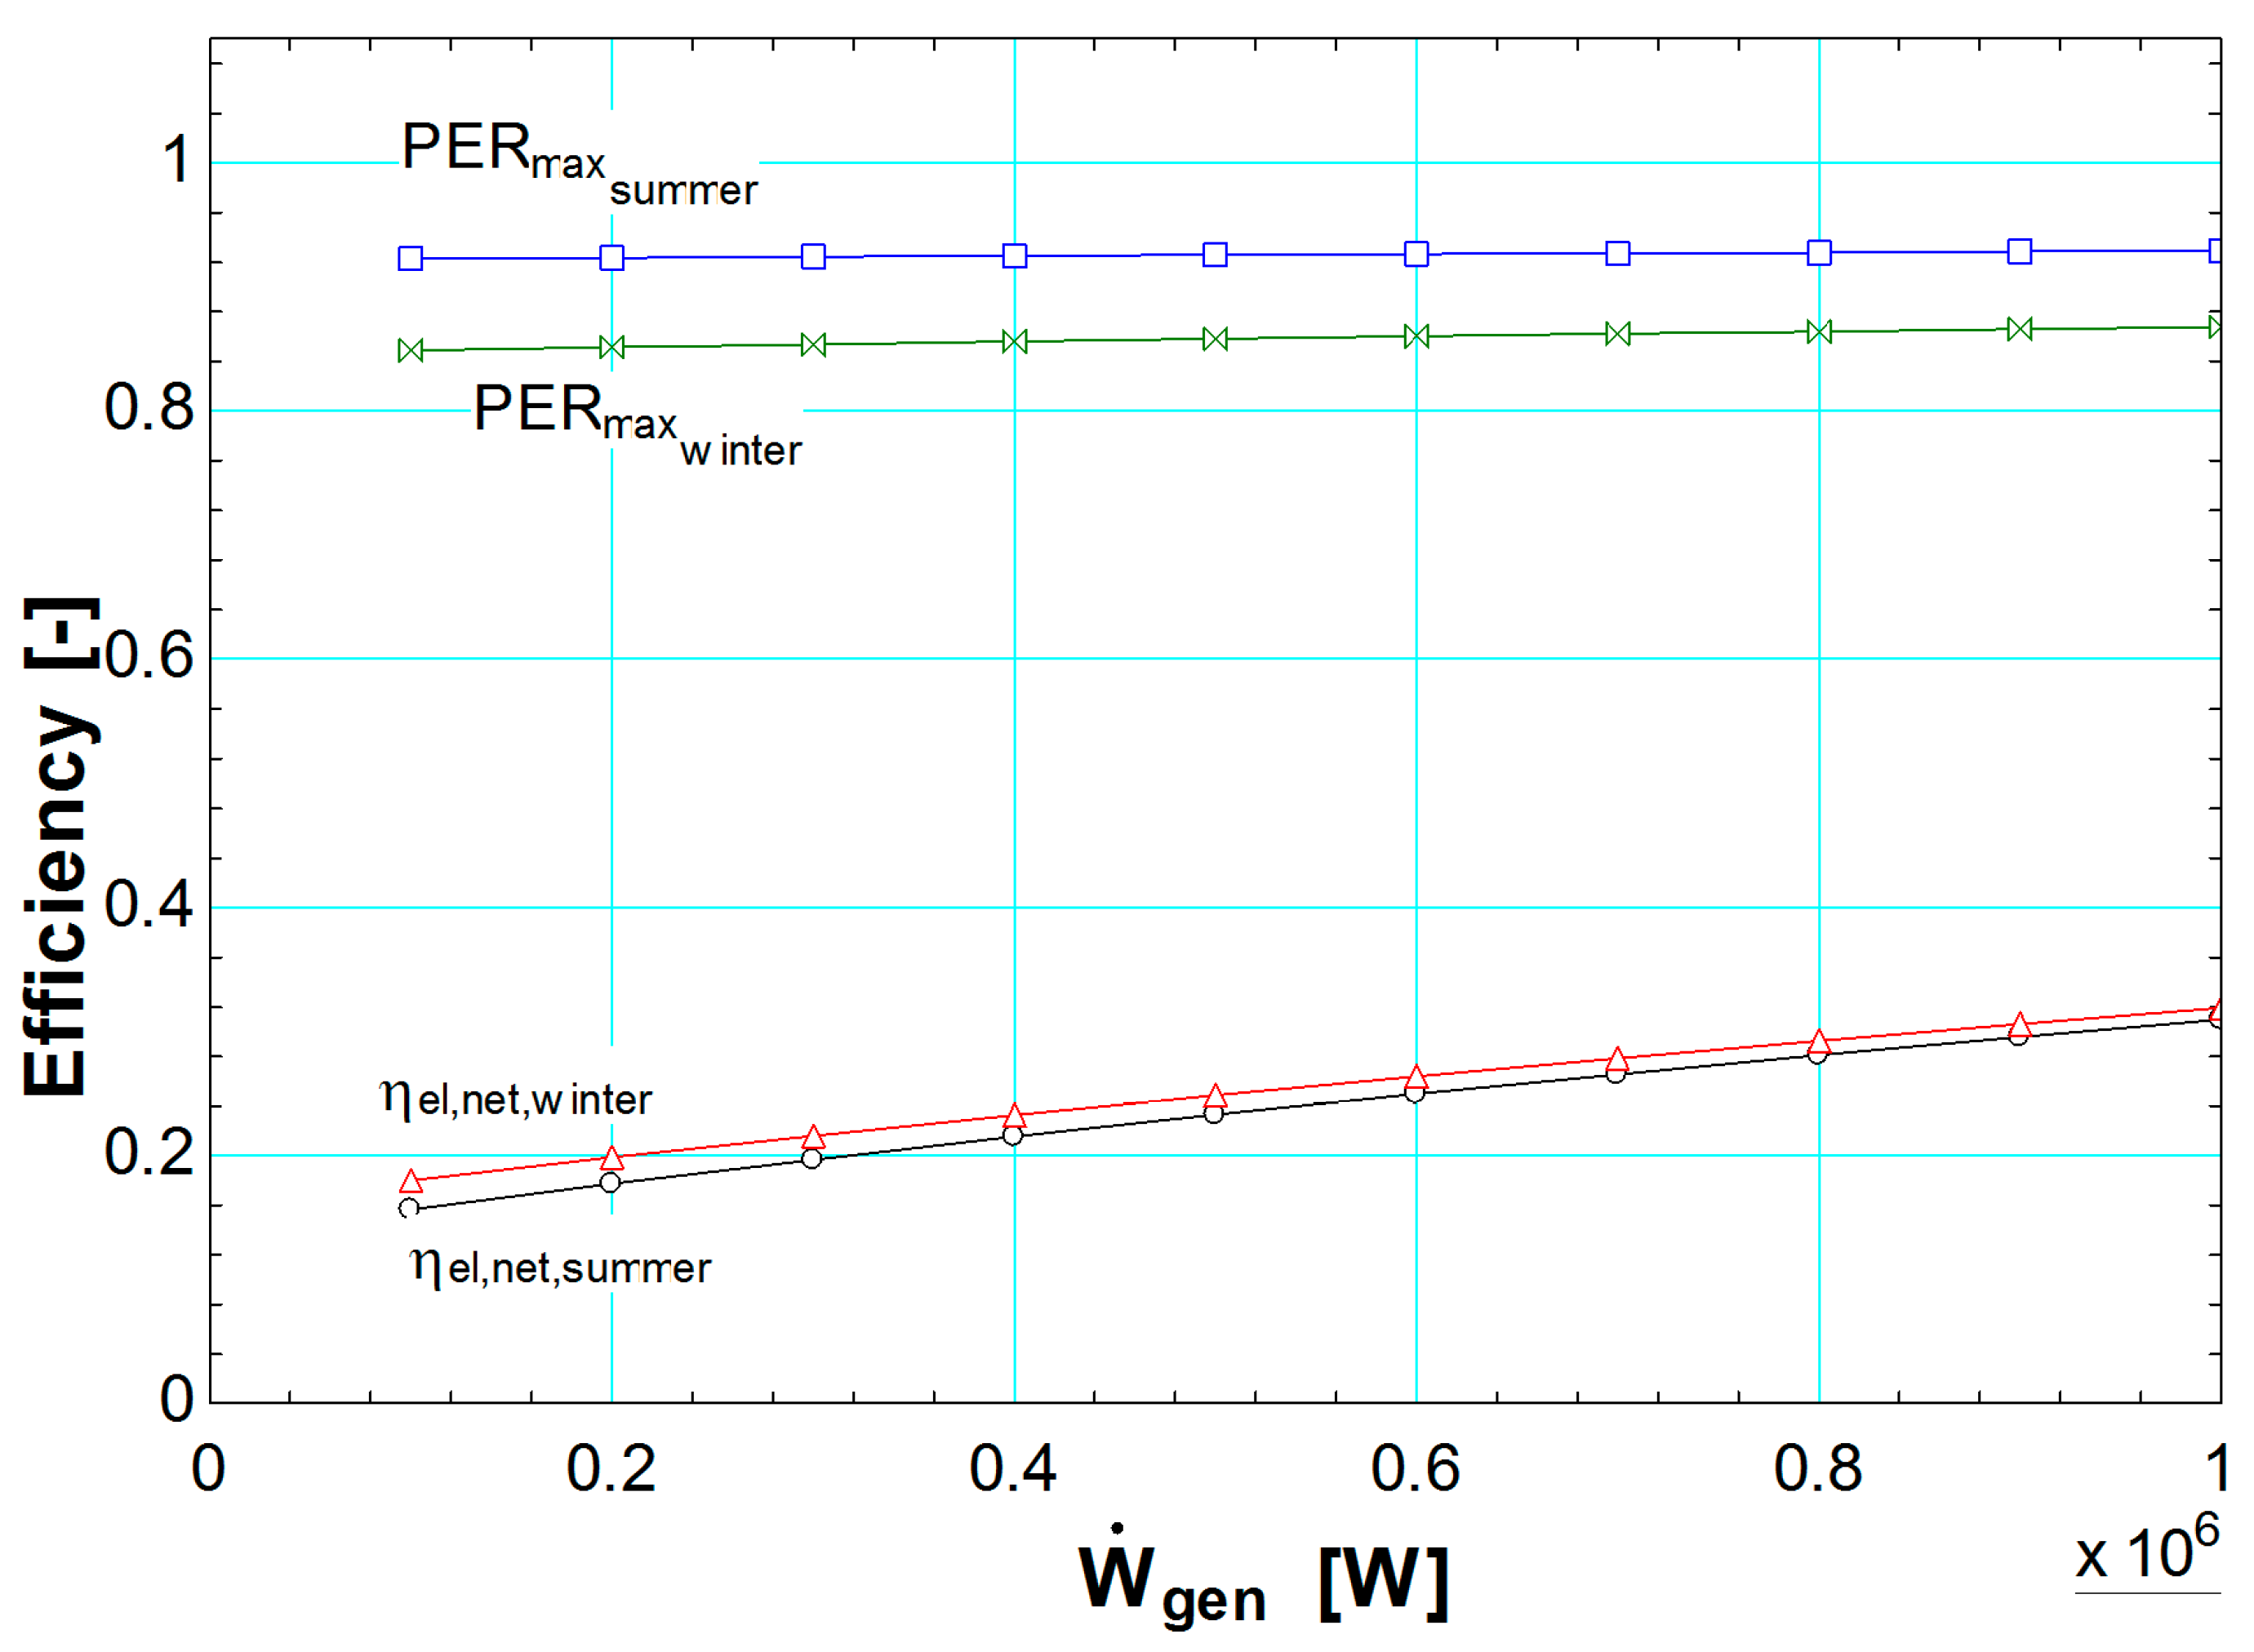
  • The CCHP system is simulated at full-load and part-load to generate operating data for the nominal power output and the part-loads, i.e., 0–1 MWe. The power output of the system, along with the isentropic efficiencies for the compressor and the gas turbine of the gas turbine cycle are therefore varied, as input parameters in each simulation. Simulation data are generated for both modes of operation, i.e., summer and winter modes. The output parameters of these simulations are the following: available cooling energy in the district cooling network (DCN) or available heating energy in the district heating network (DHN) (for summer or winter operation, respectively), input fuel energy, net electrical efficiency, primary energy ratio, and mass flow rate of input fuel.
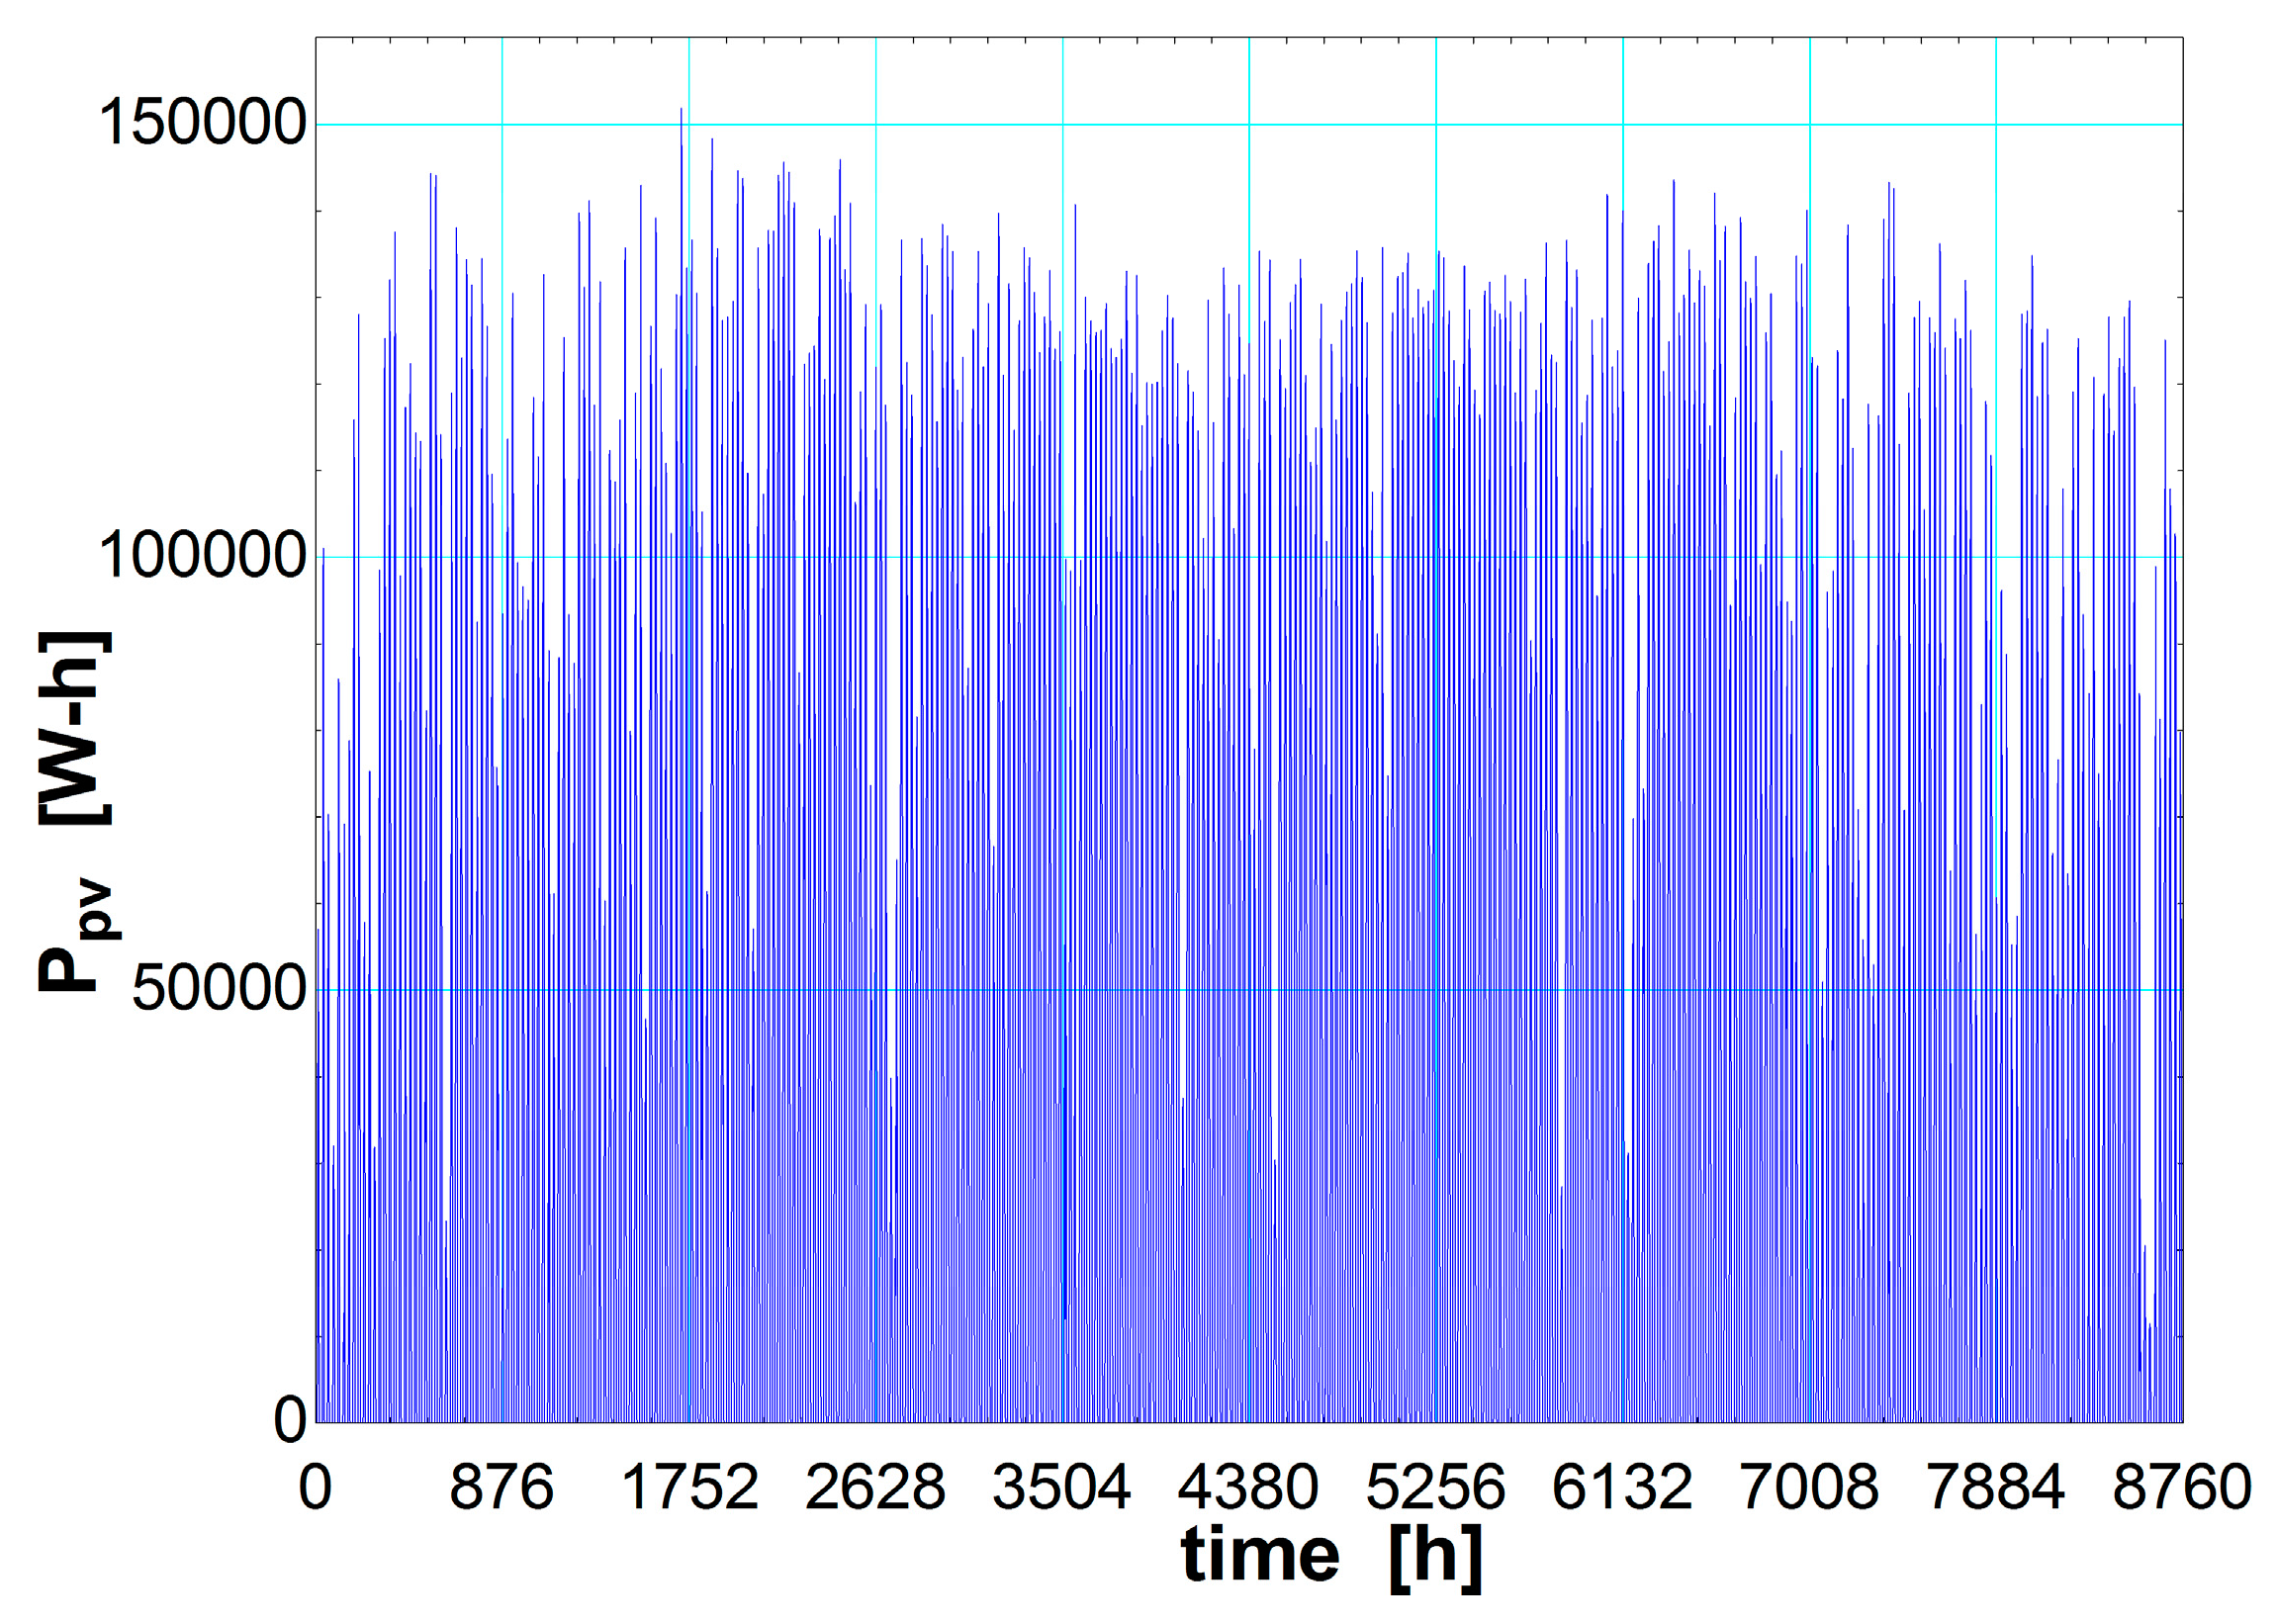
  • The PV subsystem is modeled and operating data are generated based on Typical Meteorological Year (TMY2) data for Nicosia, Cyprus. The area of the PV array is varied to change the nominal power output of the PV subsystem, as needed. Data are generated for the whole year on an hourly basis, i.e., 8760 time segments. The output data include: the incident solar radiation, the PV array temperature, the maximum power point efficiency of the PV array, and the PV power output.
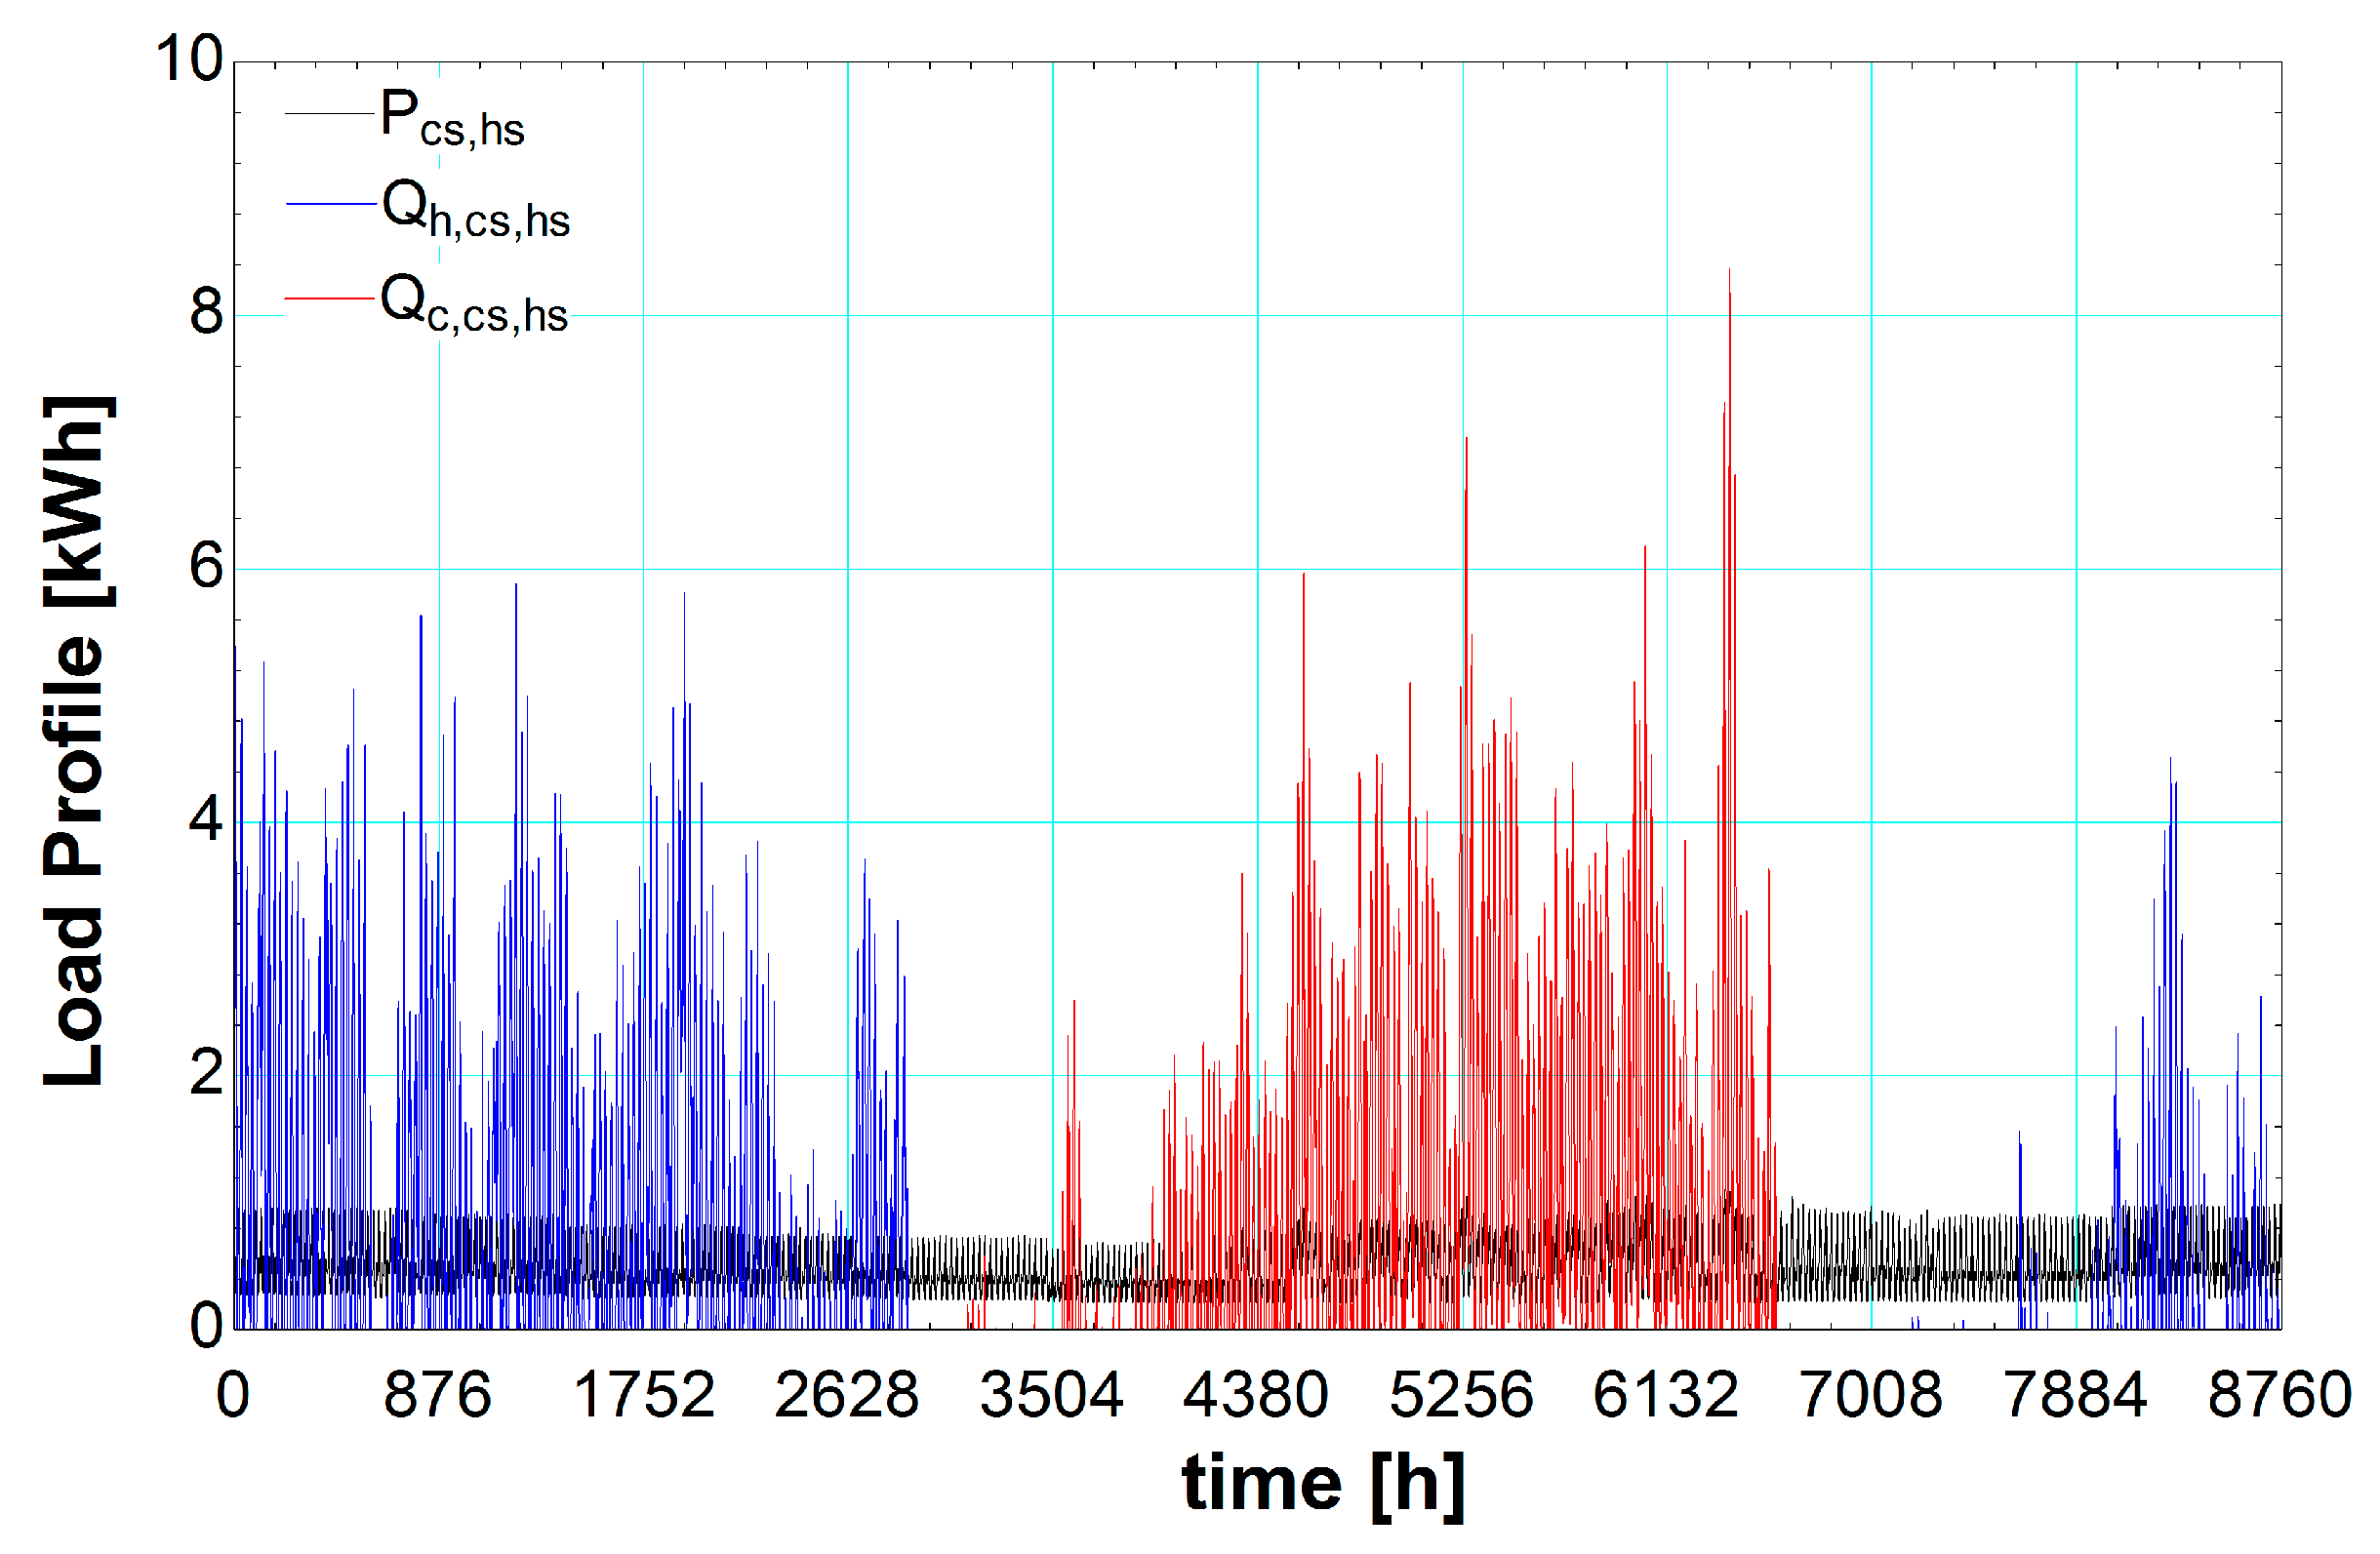
  • The generated data from the CCHP system and the PV subsystem are then combined with the load profile to calculate the number of households that can be serviced from the system, cost data and thermodynamic data.
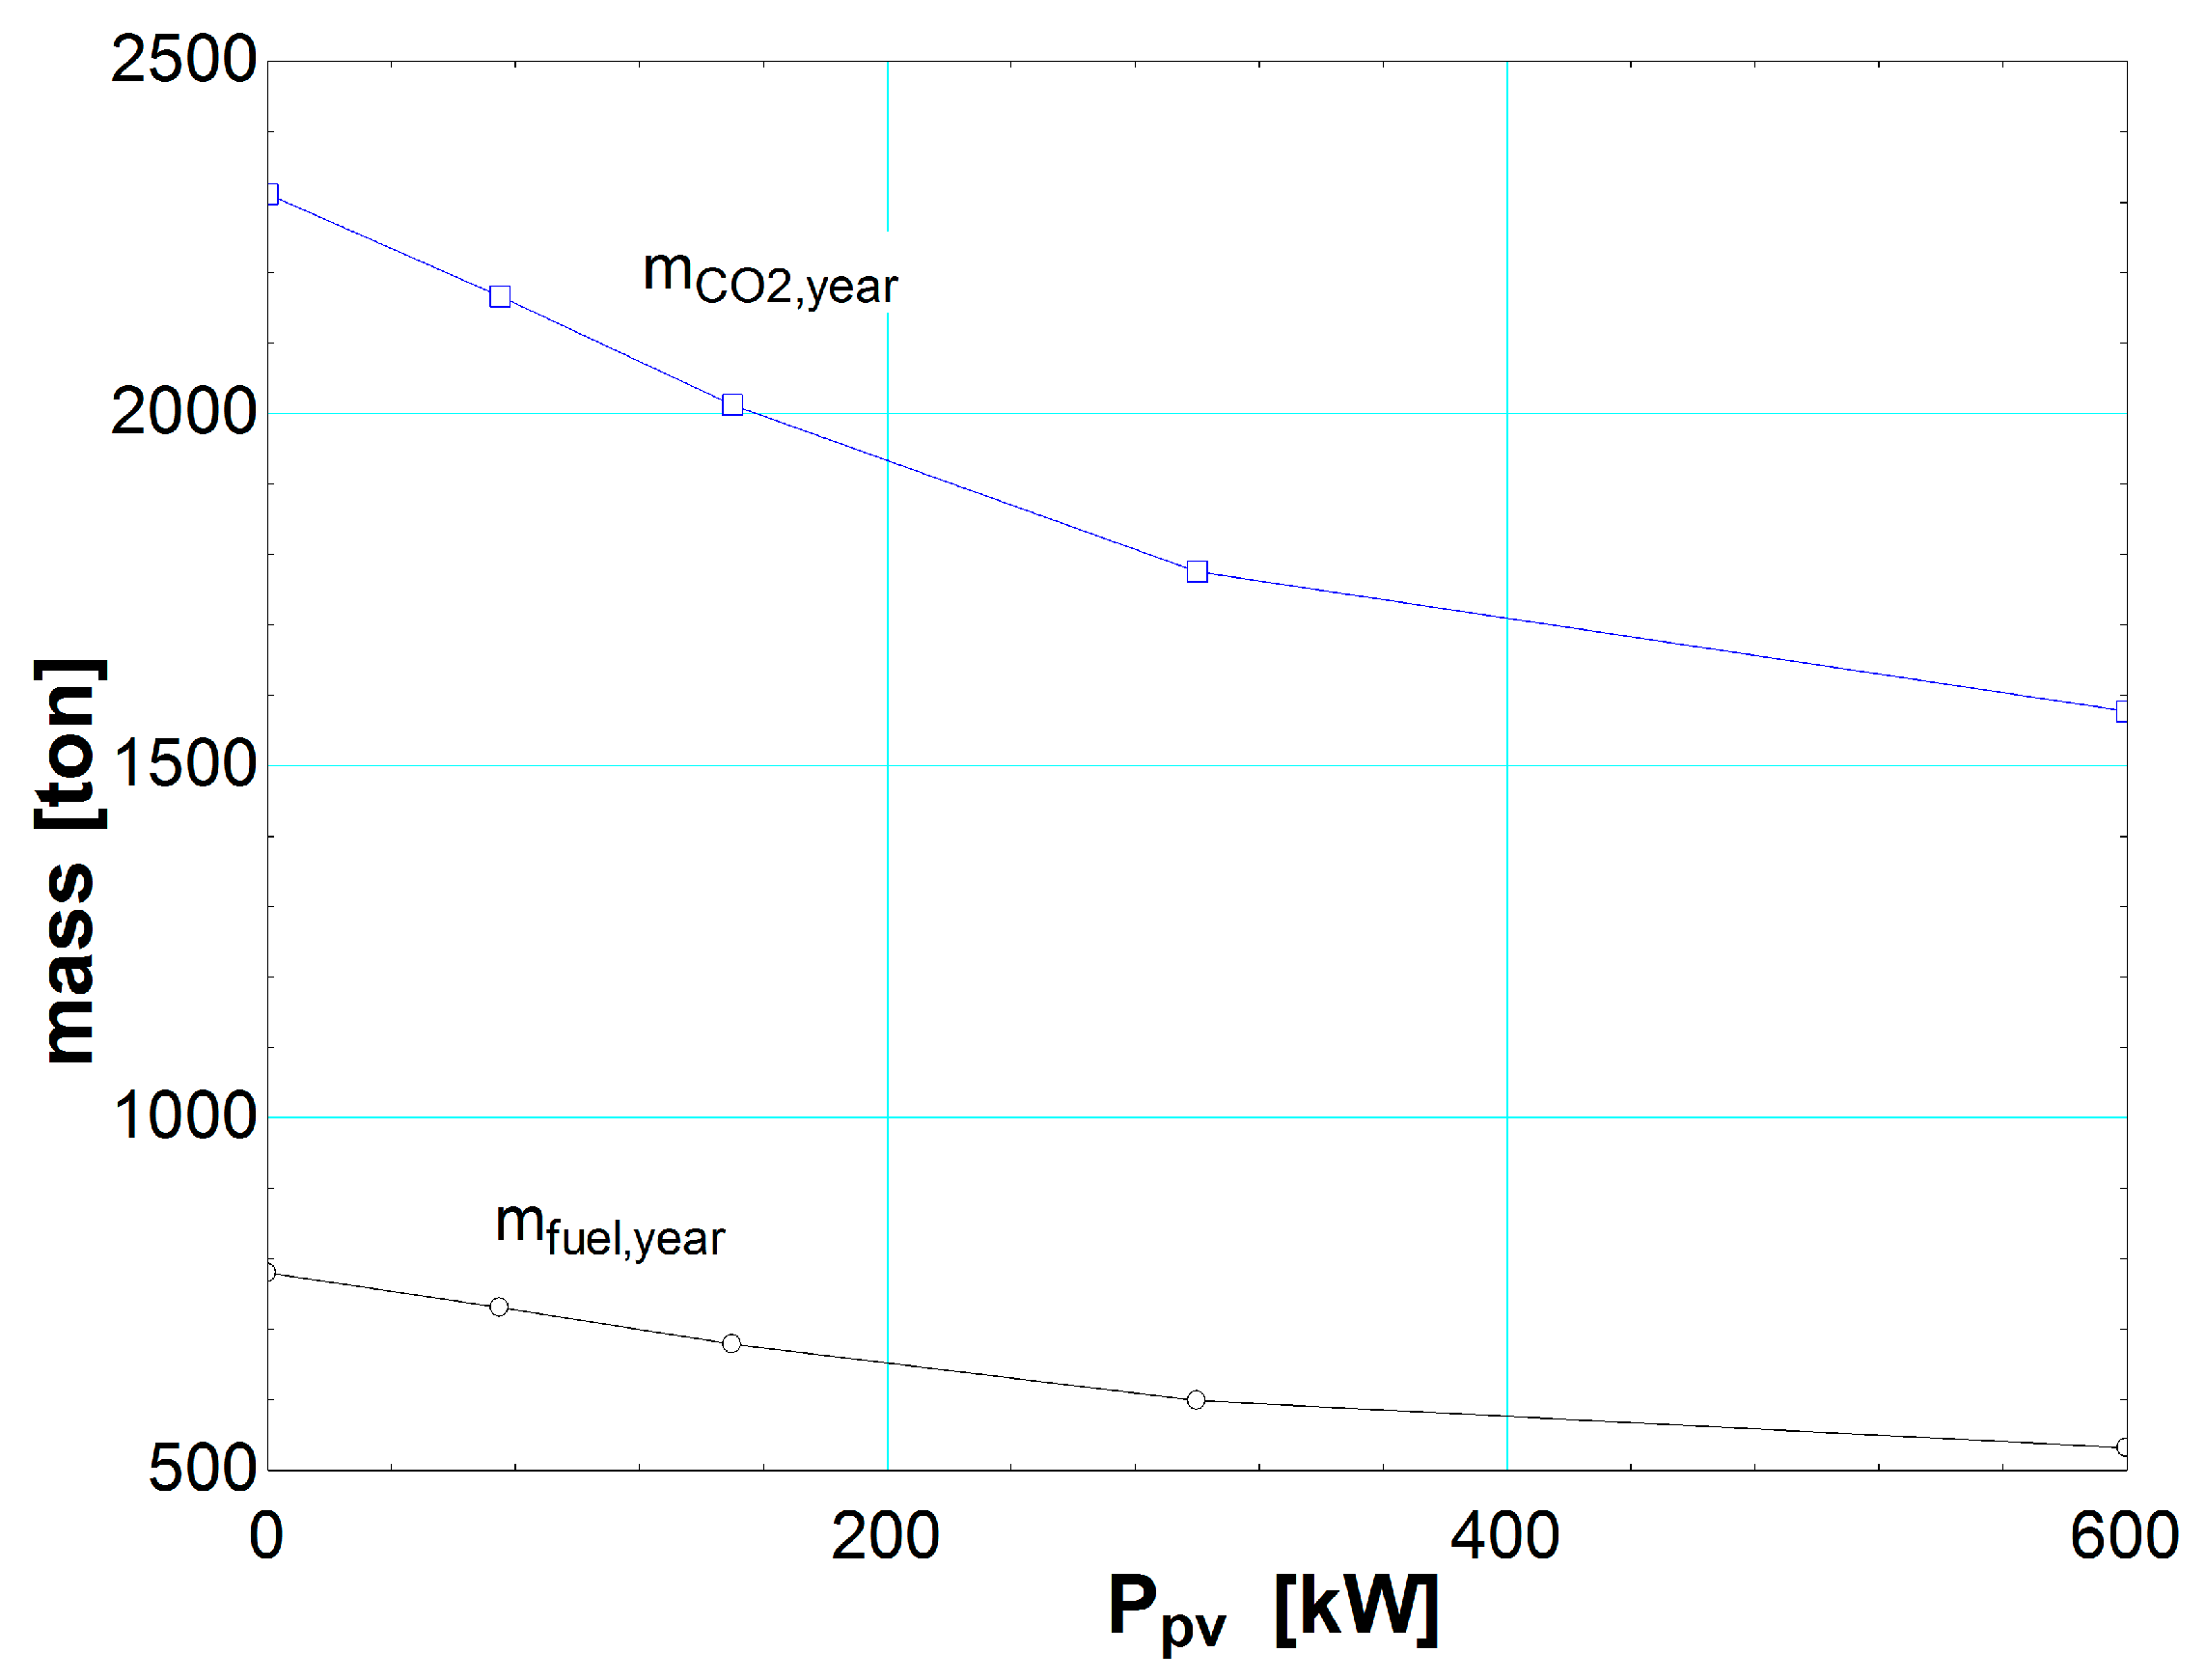
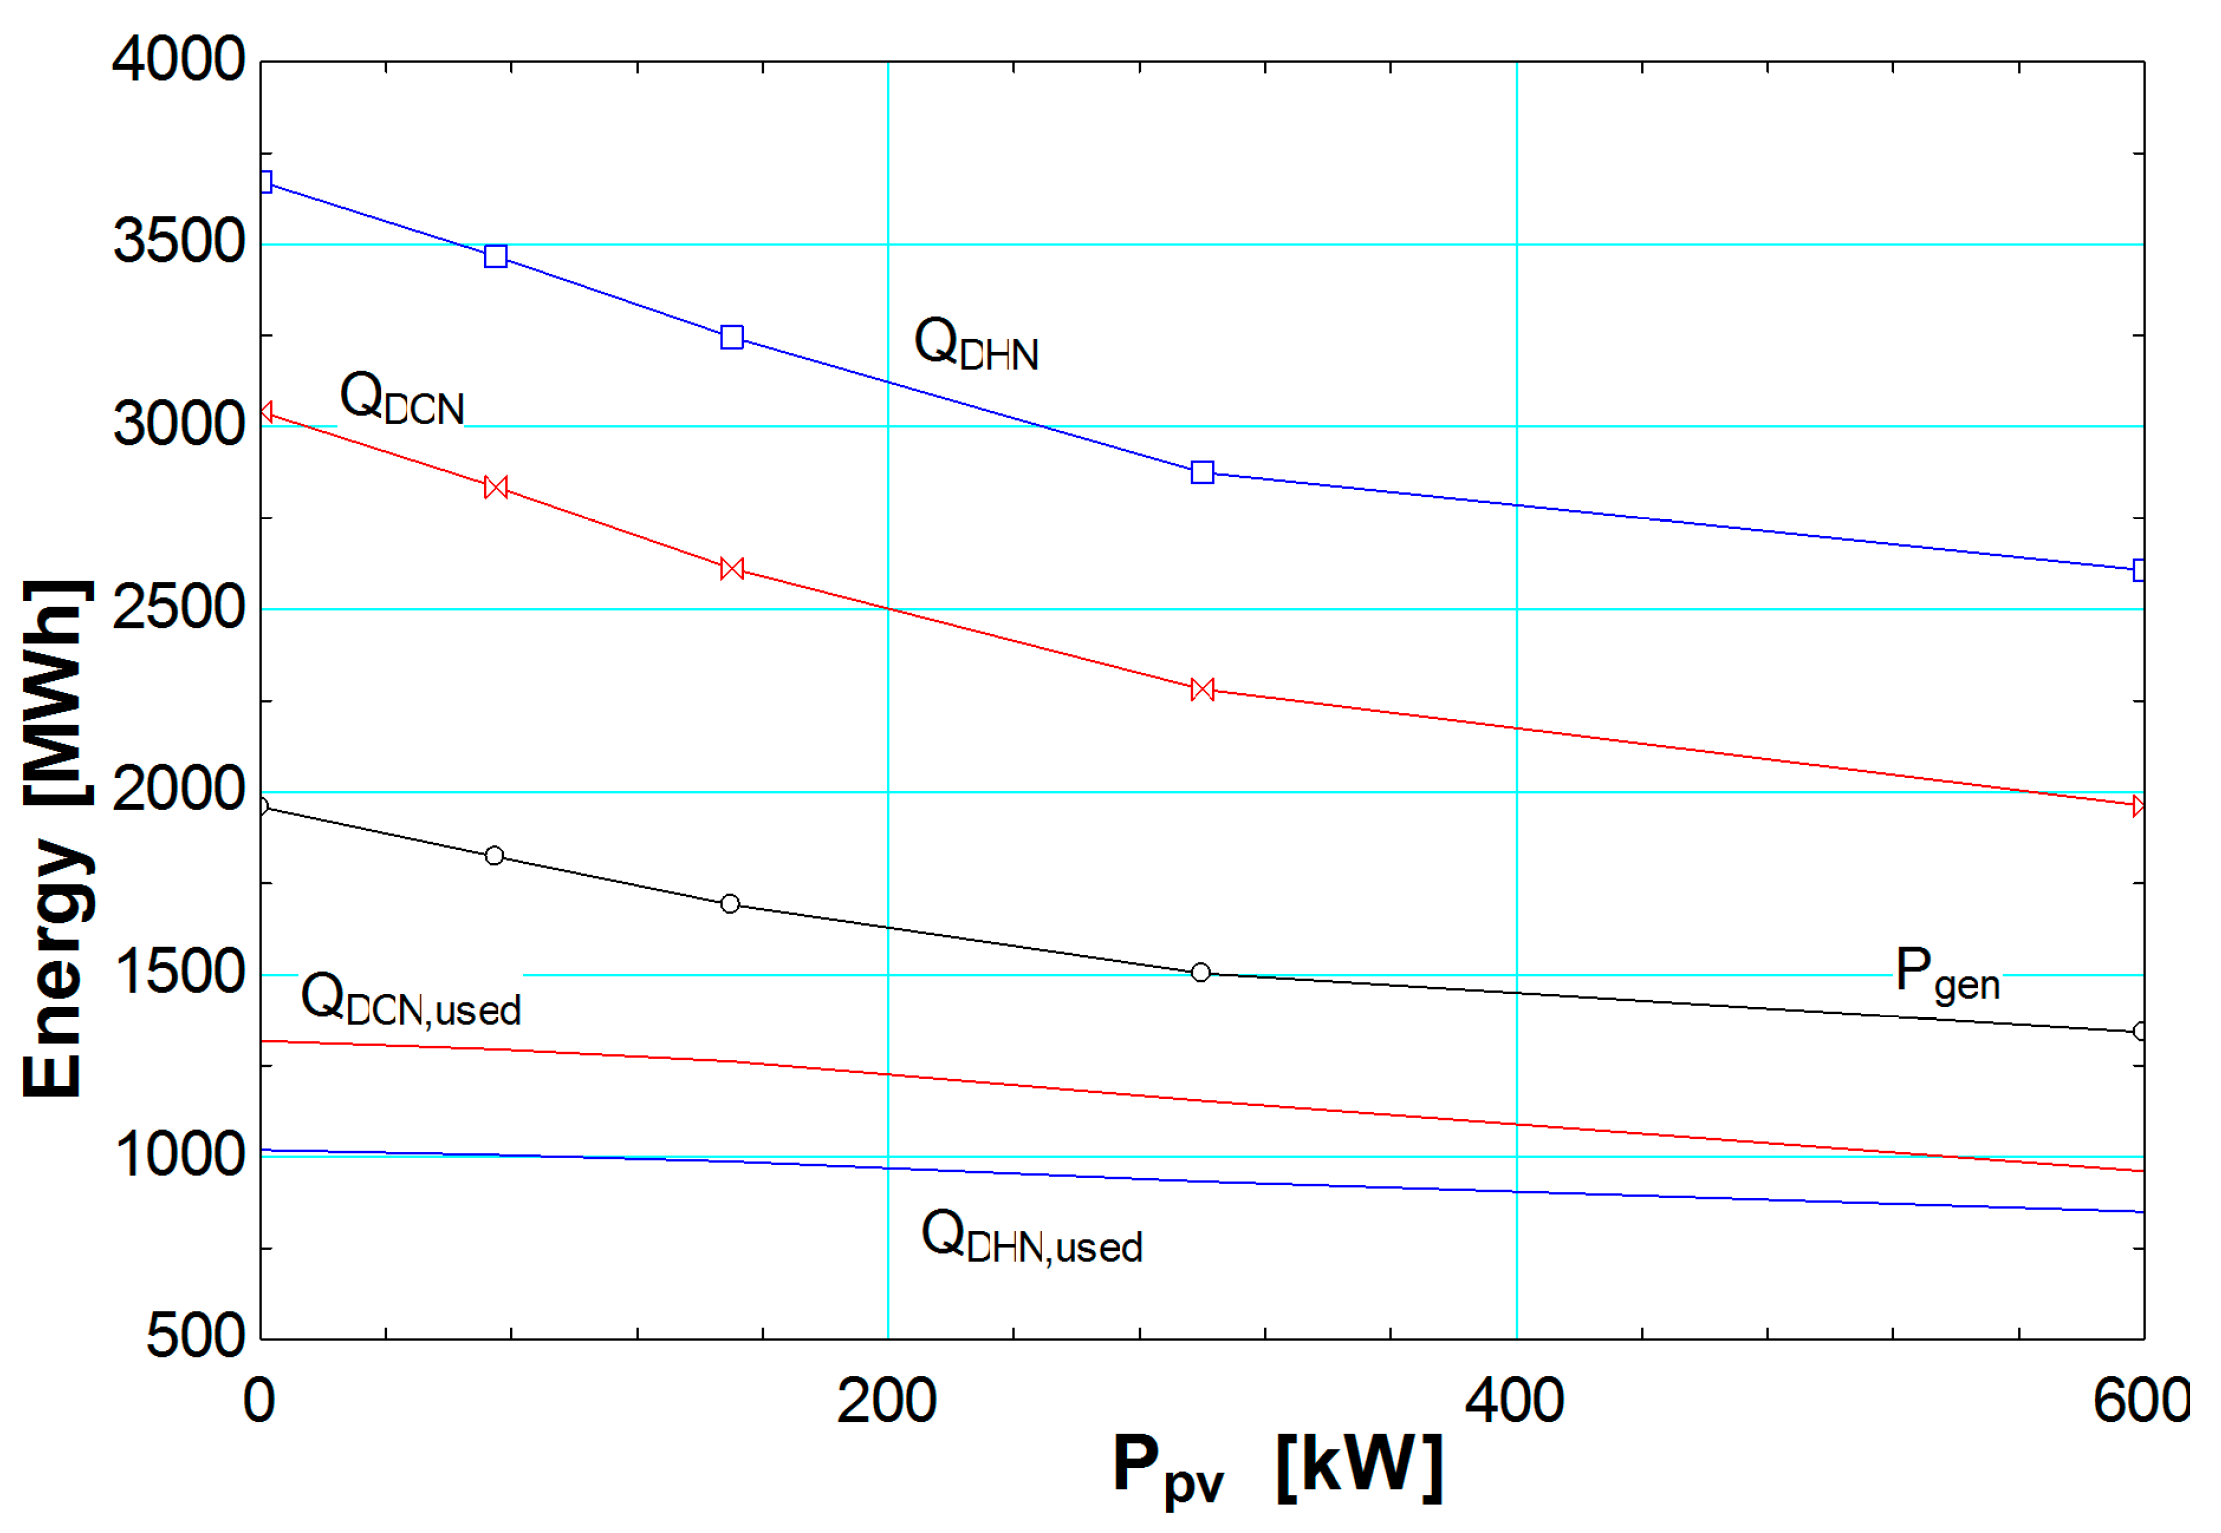
  • A parametric study is conducted to investigate how different values of nominal power output for the PV subsystem affect the cost.
The system is modeled and simulated in the commercial software Engineering Equation Solver (EES) Professional version, which offers the capability of carrying out parametric studies with different built-in tools, such as parametric tables and thermo-physical data.

3.1. Gas Turbine Cycle

The gas turbine cycle includes an air compressor, a combustor and a gas turbine. The cooling energy recovered by the LNG regasification process improves overall system efficiency, since the specific volume of the air is reduced [5,7]. The enthalpy at the air compressor at exit is:
h ¯ 2 = h ¯ 1 + h ¯ s , 2 h ¯ 1 η c
where h ¯ 1 is the enthalpy at inlet and h ¯ s , 2 is the isentropic enthalpy at exit.
The combustion process can be modeled with an energy balance including the reactants (methane, oxygen and nitrogen) and the products (carbon dioxide, water, nitrogen and oxygen). The produced net electrical power output through the gas turbine process, in relation to the consumed fuel, is given as a function of the molar flow rate of methane, enthalpy of the products exiting the combustor per mole of fuel:
W ˙ g e n = n ˙ CH 4 [ ( H P H 4 ) a ( h ¯ 2 h ¯ 1 ) ] η g e n
The net electrical efficiency of the system is defined as the ratio of the net electrical power output to the chemical energy of the fuel (based on the lower heating value (LHV)):
η e l , n e t = W ˙ g e n n ˙ CH 4 L H V

3.2. Heat Exchangers

The heat exchangers, shown in Figure 1, assume energy balance modeling (cold and hot sides). Therefore the heat transfer rate of the hot and cold sides can be defined as follows:
Q ˙ = m ˙ c o l d ( h c o l d , o u t h c o l d , i n ) = m ˙ h o t ( h h o t , i n h h o t , o u t )
where m ˙ is the mass flow rate (cold and hot sides) and h is the specific enthalpy. The LNG regasification process is shown to be a simple heat exchanger process in this study. However, it should be noted that this process is much more complicated in an actual system, but since this is not the scope of the study, a simple thermodynamic process is assumed to be adequate.

3.3. Absorption Chiller

The absorption chiller is of the LiBr-H2O type, since this is an efficient chiller with coefficient of performance (COP) values of 1.2–1.3 (double-effect) [12,13]. It is suitable for air-conditioning applications, since it generates a cooling output of 5–10 °C in the form of cold water at the evaporator output. A double-effect chiller is chosen over a single-effect one, since the heat source (steam generated in a heat recovery steam generator) is at a suitable temperature to operate a double-effect absorption chiller. The absorption chiller follows the modeling explained in detail by some of the authors in [14].

3.4. District Energy Network

As mentioned above, the district energy network consists of two operating modes: summer and winter modes. When operating at summer mode, heat recovered from the gas turbine exhaust’s flue gas is used to activate the absorption chiller, generating cold water [13]. The cold water is distributed to the building from the CCHP location through the district cooling network’s pipelines for space cooling application at a temperature of 22 °C [7]. When operating in winter mode, the heat is recovered through a heat exchanger and distributed to the buildings through the district heating network to generate domestic hot water and space heating at a temperature of 50 °C and 22 °C, respectively [7].

3.5. Photovoltaic Panels

The PV subsystem is integrated into the CCHP system to reduce fuel consumption. The PV model is based on the theoretical assumptions found in [15]. The model calculates the total incident solar radiation on a tilted surface, which considers both the ground-reflected and beam terms, as defined in the results of the HDKR (Hay, Davies, Klucher, and Reindl) model:
I T = ( I b + I d A i ) R b + I d ( 1 A i ) ( 1 + cos β 2 ) [ 1 + f sin 3 ( β 2 ) ] + I ρ g ( 1 cos β 2 )
The temperature of the PV array, T c , is calculated by use of the following relation (the effect of the wind speed is neglected):
T c T a T N O C T T a , N O C T = I T I T , r e f ( 1 η r e f 0.9 )
The maximum power point efficiency of the PV array is given as follows:
η m p = η r e f ( 1 + μ m p ( T c T a , N O C T ) )
The power output of the PV array is given by:
P = A a r r a y I T η m p

3.6. Load Profile and System Balance

Since the proposed PV-assisted CCHP system is completely autonomous (no power and/or heating/cooling is imported and/or exported from/to the central power grid/central district energy network, respectively), the selected operating strategy must ensure that it will be able to completely fulfill the load profile [16]. For this study the consumption data for the load profile for an average 100 m2 household in Cyprus are adjusted on an hourly basis. Since power is the most expensive energy type, no surplus power should be produced, and therefore an electricity-led operation must be followed. Since the system will be operated at both full-load and part-load, it means that power-to-heating and power-to-cooling ratios will vary accordingly. Since the available thermal energy output and, in effect, the district energy delivered to the buildings will be inadequate for certain loads, it is necessary to generate additional thermal energy (heating or cooling) with other means. Specifically, thermal energy can be generated with vapor-compression units, i.e., central electric chillers (located at the site of the CCHP system) or with electric heat pumps located inside the buildings. It is assumed in this study that the proposed CCHP system will service buildings that are already equipped with electric heat pumps, and therefore central electric chillers are not considered, as these would add an unnecessary extra cost to the system. However, for new buildings, central chiller units would be a more ideal option, since overall efficiency and performance would improve. The average COP value for the electric heat pumps is assumed to be 3.0. The cooling load is the space cooling energy, whereas the heating load is the combined space heating and domestic hot water load for the buildings. The electrical load is the load needed for lighting and appliances. The electrical energy for the operation of the heat pumps is added in the energy balance, which is shown below.
The electrical load profile (excluding the power input to the electric heat pumps), P c s , is the product of the electrical energy consumption per household, P c s , h s , and the number of households, n :
P c s = P c s , h s n
Similarly, the heating load profile, Q h , c s , is the product of the heating energy consumption per household, Q h , c s , h s , and the number of households; while the cooling load profile, Q c , c s , is the product of the cooling energy consumption per household, Q c , c s , h s , and the number of households:
Q h , c s = Q h , c s , h s n
Q c , c s = Q c , c s , h s n
The available heating energy output, Q ˙ D H N , in the district energy network during winter operation is calculated through interpolation of the CCHP system model data for a given input CCHP electrical energy power output, W ˙ g e n . Similarly, the fuel input to the system, E f u e l , i n , net electrical efficiency, η e l , n e t , and fuel mass flow rate, m ˙ L N G , are calculated through interpolation. The available cooling energy output, Q ˙ D C N , is calculated in the same manner.
Since a heat-led operating strategy is not followed, the available heating or cooling energy generated by the CCHP system will not match the heating and cooling load profiles. The power input to the electric heat pumps must be provided with additional electrical energy generation from the CCHP system. However, the additional electrical energy generation also translates to additional thermal energy generation. Therefore, an energy balance, which includes all of these parameters, must be formulated to ensure that the system will be able to fully and accurately match the load profile requirements.
The amount of available heating energy in the district energy network which is actually used in the load profile is given as follows:
Q D H N , u s e d = Q h , c s Q h p , h
Q h p , h = max ( 0 , Q h , c s Q D H N )
P h p , h = Q h p , h C O P
Similarly, the amount of available cooling energy in the district energy network which is actually used in the load profile is given as follows:
Q D C N , u s e d = Q c , c s Q h p , c
Q h p , c = max ( 0 , Q c , c s Q D C N )
P h p , c = Q h p , c C O P
The additional heating and cooling energy generated with the electric heat pumps, Q h p , h , and Q h p , c , respectively, is used to calculate the required power input to the heat pump, P h p , h , and P h p , c , respectively.
The overall energy balance of the PV-assisted CCHP system can be formulated to include all of the above parameters, and calculate the electrical energy power output of the CCHP-system, P g e n , for any given time segment:
P g e n = max ( 0 , P c s + P h p , h + P h p , c P p v )
The last term, P p v , is the power output of the PV subsystem.
To assess the performance of the proposed system, an appraisal criterion parameter, called the “primary energy ratio” ( P E R ), is defined:
P E R = P g e n + Q D H N , u s e d + Q D C N , u s e d E f u e l , i n
It should be clarified that this definition is preferred over “total system efficiency”, since the latter could be a misleading definition if related to thermodynamic efficiency, since the proposed system combines both thermal and refrigeration cycles.

3.7. Cost Model

The cost model, which is partly based on the cost analysis found in Dincer & Zamfirescu [17], includes all cost functions that are needed to evaluate the projected total LCC of each system configuration. As mentioned above, the LCC is calculated in a parametric study, where the PV power output is varied, ranging from 0 to 600 kWe. The cost model is integrated to the PV-assisted CCHP system model, and all the included cost functions are shown in Table 2. Table 3 includes the values for the cost factor input parameters, and Table 4 includes the values for the cost input parameters. These values are taken from [17], unless specified otherwise. The cost of LNG, c L N G , is taken as 3.082 €/GJ [18], while the system lifetime is approximated at 20 years of service [17]. The specific cost for the PV subsystem is set at 1.825 €/W, based on an approximation of values found in [9].
The volumetric flow rate of LNG is calculated as follows:
V L N G = m L N G ρ L N G
It is assumed that each LNG truck has a capacity of t r u c k L N G = 58 m3 [19]. The LNG supply times per year can be calculated as follows:
s u p p l y L N G , y r = V L N G , y r t r u c k L N G
The fan-coil units are assumed to have an average power input, Q ˙ f c , of 1 kW per unit [17].

4. Results and Discussion

In this section the results for the proposed PV-assisted CCHP system are analyzed in terms of thermodynamics and cost. Finally, a parametric study is used to evaluate the system configuration resulting in minimum LCC.

4.1. Validation of the Model

The CCHP system model is validated with reported data for commercially available gas turbine systems and the results of the validation show good agreement between these data and the modeling. The validation has been shown in detail by the authors in [7].

4.2. Simulation of the CCHP System and the PV Subsystem

The CCHP system is simulated at part-load and full-load, i.e., in a power output ranging between 0 and 1 MWe. As shown in Figure 2, the useful energy output of the CCHP system depends on the selected load; at full-load the CCHP system has a heating-to-power ratio of 1.72, and a cooling-to-power ratio of 2.00; at half-load these values are 2.45 and 2.98, respectively. The increase of these ratios is due to the comparatively higher heating available from the gas turbine exhaust, since the gas turbine cycle becomes less efficient (in terms of electrical energy output) as the load decreases. This is shown more clearly in Figure 3, where the PER is shown to remain almost constant at all loads, due to the way it was defined in the previous section, since the electrical energy output decreases; at the same time, the useful heating (or cooling) energy output increases as the load decreases.
The PV subsystem integrated into the CCHP system aims to reduce the fuel consumption through the partial production of the power needed to satisfy the load profile. The power output of the PV panels depends on the availability of solar radiation. For example, for a PV subsystem with a nominal power output of 150 kWe, the pattern of power generation is shown in Figure 4, with the electrical energy output (in W-h) shown on an hourly basis for a whole year as applied for the weather conditions in Nicosia, Cyprus. The average power output is 34.1 kWe.

4.3. Application of the PV-assisted CCHP System to a Selected Load Profile

The load profile consists of the following consumption data: (a) power, i.e., the electrical energy needed to satisfy all building needs (including the heat pumps); (b) heating needed for space heating and domestic hot water (winter operation mode); (c) cooling needed for space cooling (summer operation mode). The summer operation mode assumes that domestic hot water will be available through other means (e.g., solar collectors) and therefore it is neglected in the calculations. The load profile is shown in Figure 5. From an observation, the electrical load profile remains constant throughout the year, while the heating load profile starts in November and ends in April. The cooling load profile starts in May and ends in September. There are some small periods of time between the winter and summer periods, where neither heating nor cooling is required (the so called “shoulder” months). Therefore, from this pattern, it is evident that the CCHP system will need to provide additional electrical energy to operate the heat pumps when heating (or cooling) generation from the CCHP system will be insufficient.
The CCHP system can completely fulfill the load profile of 436 households having the characteristics of the load profile shown in Figure 5. Without the integration of a PV subsystem, the CCHP system must generate a total electrical energy of 1959 MWh per year. This figure includes both the electrical load profile and the operation of the electric heat pumps. The latter requires 146 MWh of electrical energy per year. The total fuel input energy is 9825 MWh per year (or 780 tons), generating 2311 tons of CO2. The average net electrical efficiency of the system is 19.6%, while the average PER is 39.4%.

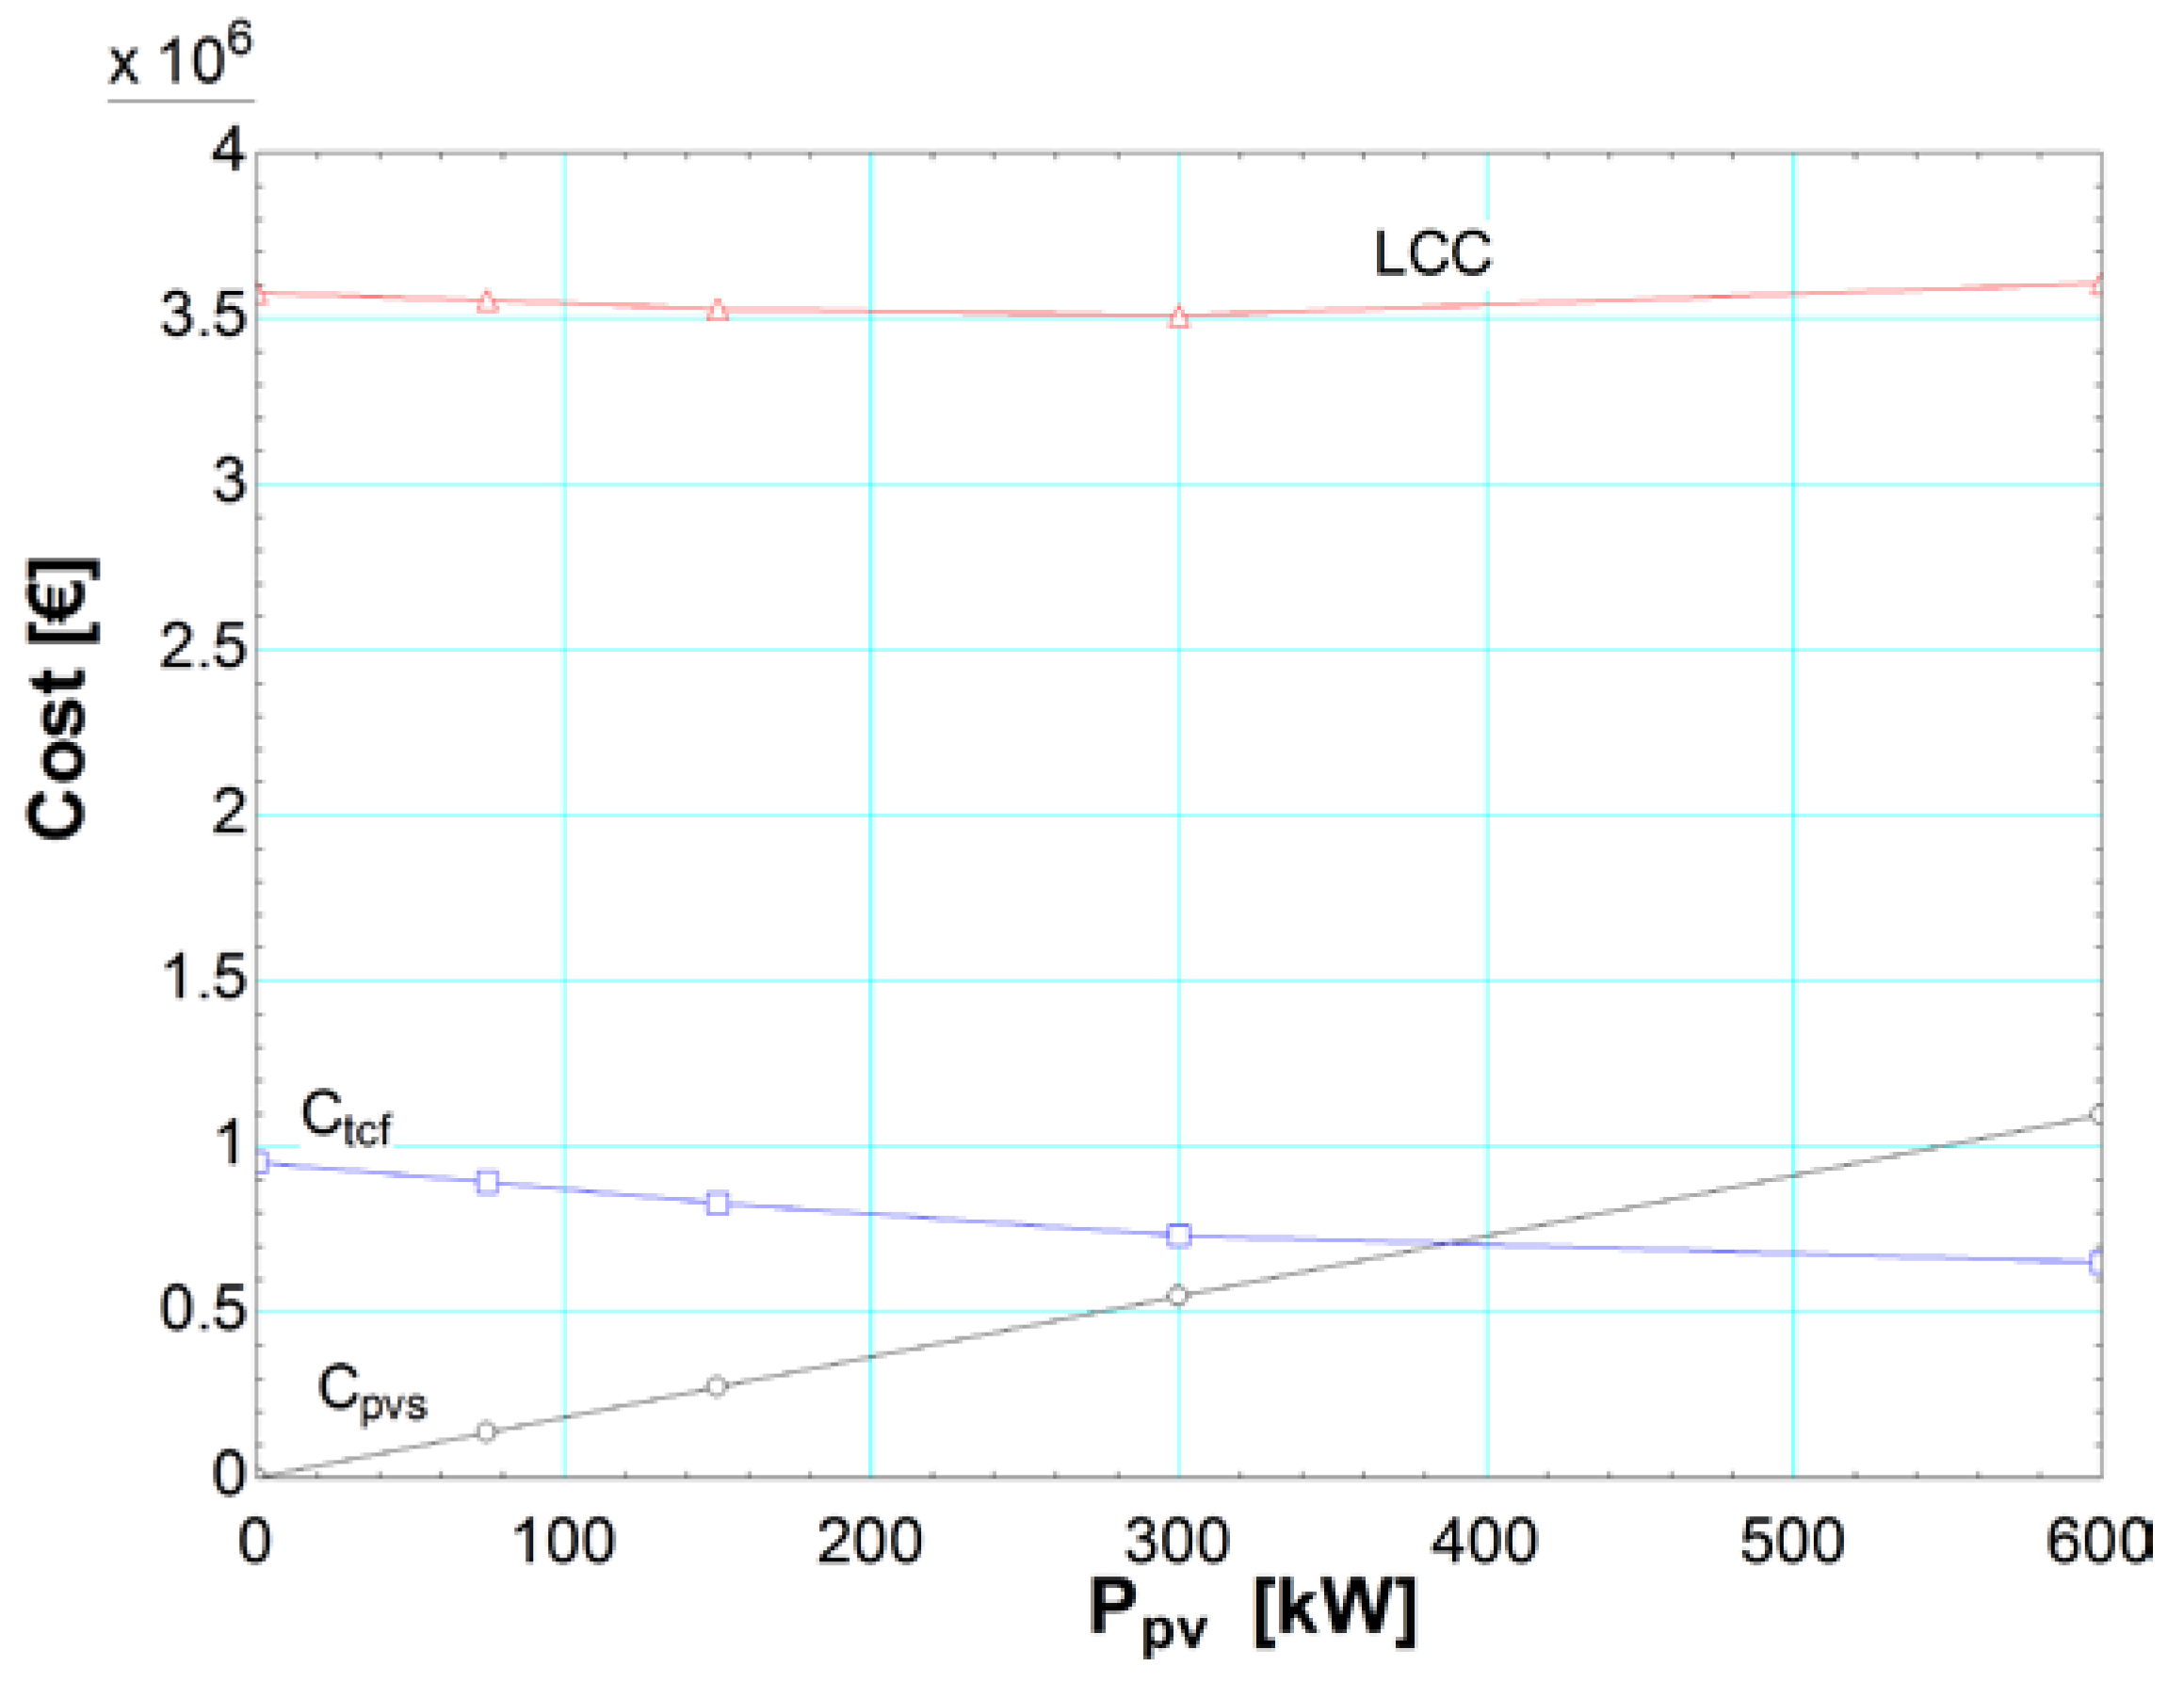
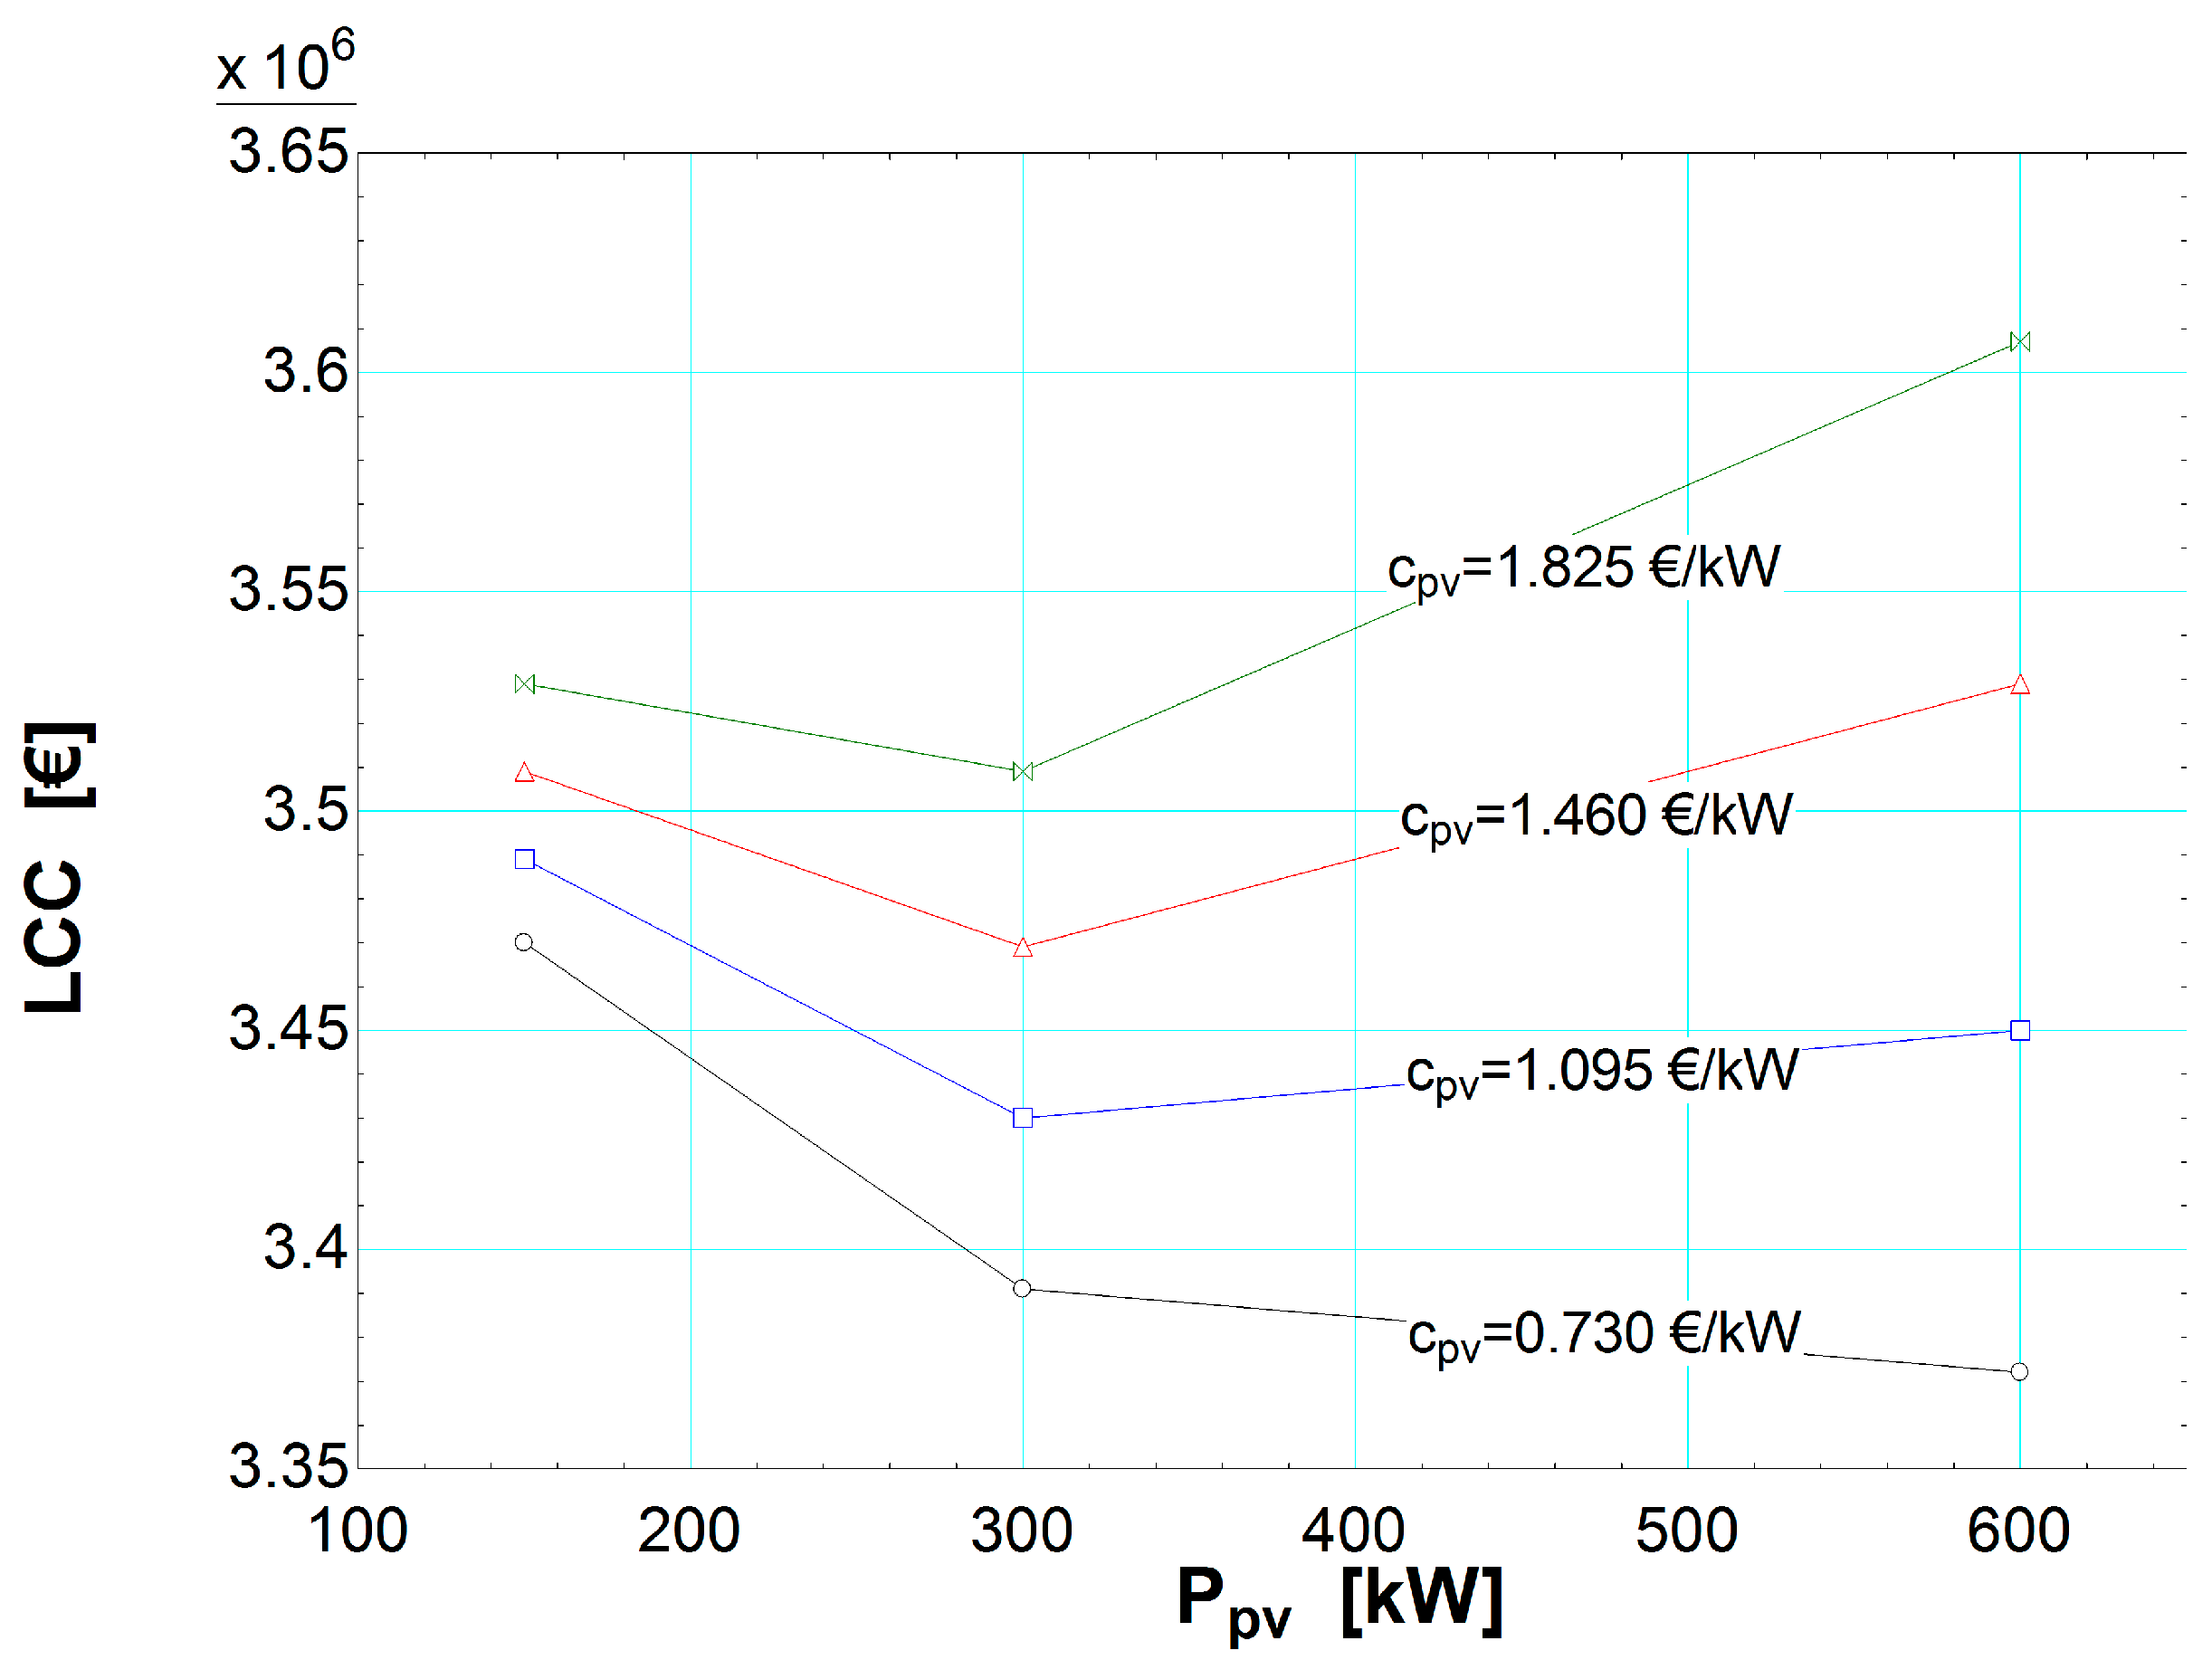
4.4. Parametric Study

The effect of the integration of the PV subsystem to the CCHP system is shown through a parametric study, where the size of the PV subsystem is varied ranging from 0 to 600 kWe. Figure 6 shows the variation of useful energy output. It is obvious that less heating (or cooling) is generated as the PV capacity increases, since less natural gas is combusted in the gas turbine cycle. As the PV subsystem increases, it is also better for the overall performance of the system, as more heating (or cooling), which is available, is actually used in the load profile. This is shown more clearly in Figure 7, where the average PER increases as the PV nominal power output increases, at the expense, however, of lower average net electrical efficiency. This is inevitable, since the gas turbine cycle is forced to operate at lower loads and, in the case of a 600 kWe PV subsystem, the gas turbine basically operates either at peak loads (i.e., during daytime), or when solar energy is unavailable (i.e., during nighttime). Figure 8 shows the significant reduction in fuel consumption and CO2 emissions, as the nominal power output of the PV subsystem increases. This has significant benefits in operating cost, and environmentally it can help reduce greenhouse gas emissions, especially if the system is situated in sensitive locations where this is desirable.
The cost analysis for the proposed system is shown in Figure 9, where LCC is varied depending on the size of the nominal PV power output. Interestingly, LCC drops as the PV subsystem capacity increases, but only up to 300 kWe. After this point the LCC increases and, at 600 kWe, it reaches its maximum value for this parametric study. The reason is that at 600 kWe the useful power output of the PV subsystem is not enough to account for the higher capital cost of the PV subsystem. In other words, more electrical energy is available for consumption, but since the PV subsystem is oversized, it cannot match the requirements of the load profile. Therefore, in this case, electricity generated from the PV subsystem is wasted. The minimum, and thereby the optimum, value for the LCC is at 300 kWe of nominal power output for the PV subsystem. This pattern could change if the unit cost of PV is decreased in the future. In this case, a higher capacity for the PV subsystem could be desirable. The effect of the specific cost of the PV subsystem on the LCC of the proposed CCHP system is shown in Figure 10, where the specific cost of the PV subsystem is varied from 0.730 to 1.825 €/kWe. Specifically, a PV subsystem with a capacity of 600 kWe results in the lowest LCC in the case of a c p v at 0.730 €/kWe. In this case the LCC is 3.372 million €.

5. Conclusions

In this study the effects of integrating a proposed 1 MWe CCHP system, fueled by LNG, with a PV subsystem are analyzed in terms of thermoeconomic modeling and a parametric study. The study shows that the PV subsystem can significantly reduce the power generation (and thereby fuel consumption and CO2 emissions) needed from the CCHP system. In the parametric study, PV capacity (nominal power output) is varied from 0 to 600 kWe, and the optimum PV capacity is found to be 300 kWe. The minimum LCC for the PV-assisted CCHP system is found to be 3.509 million €, as compared to 3.577 million € for a system without a PV subsystem. The total cost of the PV subsystem is 547,445 €, while the total cost for operating the system (fuel) is 731,814 € (compared to 952,201 € for a CCHP system without PVs). These cost savings could increase in the future as the unit PV cost decreases and the unit cost of natural gas increases.
Overall, the proposed PV-assisted CCHP system generates the following amounts of useful energy (energy that is actually utilized in the load profile throughout the total lifetime (20 years) of the system): 33,940 MWh of electrical energy, 26,580 MWh of heating energy, and 28,900 MWh of cooling energy. For comparison to a conventional system, where heating and cooling energies are supplied through an electric heat pump unit with an assumed average COP value of 3.0, the heating and cooling energies correspond to an electrical input of 8860 MWh and 9633 MWh, respectively. Therefore, for a total electrical energy output of 52,433 MWh, this results in a unit cost of electricity of 0.067 €/kWh. Additionally, the study shows that if the specific cost of the PV subsystem drops in the future, eventually the gas turbine (or any other conventional prime mover) will switch roles with the PV subsystem. In other words, the gas turbine could act as an auxiliary power generator for periods of time where no solar radiation will be available. Finally, better utilization of the available heating and cooling energy is shown for the CCHP system with a PV subsystem, since the system becomes more electricity-dependent, offering the capability of converting electricity to heating (or cooling) through the electric heat pumps. Thereby, more control and flexibility is provided to adjust the generation of thermal energy as dictated by the varying load profile.

Acknowledgments

The authors would like to thank C. Shacolas and the University of Cyprus for providing a Research Fellowship to conduct this study.

Author Contributions

Alexandros Arsalis conducted the research work through numerical simulations and was responsible for the production of this manuscript. Andreas N. Alexandrou provided ideas on the design and the configuration of the proposed system. George E. Georghiou provided insight on the modeling methodology for the photovoltaic subsystem.

Conflicts of Interest

The authors declare no conflict of interest.

References

  1. Kong, X.Q.; Wang, R.Z.; Huang, X.H. Energy efficiency and economic feasibility of CCHP driven by stirling engine. Energy Convers. Manag. 2004, 45, 1433–1442. [Google Scholar] [CrossRef]
  2. Moné, C.D.; Chau, D.S.; Phelan, P.E. Economic feasibility of combined heat and power and absorption refrigeration with commercially available gas turbines. Energy Convers. Manag. 2001, 42, 1559–1573. [Google Scholar] [CrossRef]
  3. Popli, S.; Rodgers, P.; Eveloy, V. Trigeneration scheme for energy efficiency enhancement in a natural gas processing plant through turbine exhaust gas waste heat utilization. Appl. Energy 2012, 93, 624–636. [Google Scholar] [CrossRef]
  4. Wang, J.-J.; Jing, Y.-Y.; Zhang, C.-F.; Zhai, Z. Performance comparison of combined cooling heating and power system in different operation modes. Appl. Energy 2011, 88, 4621–4631. [Google Scholar] [CrossRef]
  5. Arsalis, A.; Alexandrou, A. Thermoeconomic modeling and exergy analysis of a decentralized liquefied natural gas-fueled combined-cooling–heating-and-power plant. J. Nat. Gas Sci. Eng. 2014, 21, 209–220. [Google Scholar] [CrossRef]
  6. Calise, F. Thermoeconomic analysis and optimization of high efficiency solar heating and cooling systems for different Italian school buildings and climates. Energy Build. 2010, 42, 992–1003. [Google Scholar] [CrossRef]
  7. Arsalis, A.; Alexandrou, A. Design and modeling of 1–10 MWe liquefied natural gas-fueled combined cooling, heating and power plants for building applications. Energy Build. 2015, 86, 257–267. [Google Scholar] [CrossRef]
  8. Fthenakis, V.M.; Kim, H.C. Photovoltaics: Life-cycle analyses. Solar Energy 2011, 85, 1609–1628. [Google Scholar] [CrossRef]
  9. Barbose, G.; Darghouth, N.; Wiser, R. Tracking the Sun III The Installed Cost of Photovoltaics; Environmental Energy Technologies Division, Ernest Orlando Lawrence Berkeley National Laboratory: Berkeley, CA, USA, 2010. [Google Scholar]
  10. Tidball, R.; Bluestein, J.; Rodriguez, N.; Knoke, S. Cost and Performance Assumptions for Modeling Electricity Generation Technologies; National Renewable Energy Laboratory: Fairfax, VA, USA, 2010.
  11. Arsalis, A.; Alexandrou, A.N. Modeling and optimization of a small-scale photovoltaic-electrolyzer-fuel cell system. In Proceedings of the 5th International Conference on Renewable Energy Sources & Energy Efficiency, Nicosia, Cyprus, 5–8 May 2016; p. 9.
  12. Herold, K.E.; Radermacher, R.; Klein, S.A. Absorption Chillers and Heat Pumps; CRC Press: Boca Raton, FL, USA, 1996. [Google Scholar]
  13. Deng, J.; Wang, R.Z.; Han, G.Y. A review of thermally activated cooling technologies for combined cooling, heating and power systems. Prog. Energy Combust Sci. 2011, 37, 172–203. [Google Scholar] [CrossRef]
  14. Arsalis, A. Modeling and simulation of a 100 kWe HT-PEMFC subsystem integrated with an absorption chiller subsystem. Int. J. Hydrogen Energy 2012, 37, 13484–13490. [Google Scholar] [CrossRef]
  15. Duffie, J.A.; Beckman, W.A. Solar Engineering of Thermal Processes, 4th ed.; Wiley: Hoboken, NJ, USA, 2013. [Google Scholar]
  16. Arsalis, A.; Alexandrou, A.N. Development of a small-scale combined-cooling-heating-and-power system for distributed generation. In Proceedings of the 5th International Conference on Renewable Energy Sources & Energy Efficiency, Nicosia, Cyprus, 5–8 May 2016; p. 11.
  17. Dincer, I.; Zamfirescu, C. Sustainable Energy Systems and Applications; Springer: New York, NY, USA, 2011. [Google Scholar]
  18. Federal Energy Regulatory Commission Other Markets: LNG—Imports, Sendouts, & World Prices. Available online: http://www.ferc.gov/market-oversight/othr-mkts/lng.asp (accessed on 15 May 2016).
  19. Linde AG: Baseload LNG Production in Stavanger. Available online: http://www.linde.com/en/index.html (accessed on 7 March 2015).
Figure 1. Schematic configuration of the proposed photovoltaic (PV)-assisted 1 MWe combined cooling, heating, and power system.
Energies 09 00663 g001
Figure 2. Simulation of the 1 MWe combined cooling, heating, and power system at part-load and full-load: fuel input vs. useful energy output.
Energies 09 00663 g002
Figure 3. Simulation of the 1 MWe combined cooling, heating, and power system at part-load and full-load: variation of efficiency at full-load and part-load operation.
Energies 09 00663 g003
Figure 4. Generation of electrical energy in the photovoltaic subsystem throughout the year.
Energies 09 00663 g004
Figure 5. Annual load profile (power, heating, and cooling) for the average household considered in the study on an hourly basis.
Energies 09 00663 g005
Figure 6. Parametric study: annual useful energy output for different photovoltaic subsystem capacities ranging from 0 to 600 kWe.
Energies 09 00663 g006
Figure 7. Parametric study: annual average net electrical efficiency and average primary energy ratio (PER) for different photovoltaic subsystem capacities ranging from 0 to 600 kWe.
Energies 09 00663 g007
Figure 8. Parametric study: annual consumption of fuel and CO2 emissions for different photovoltaic subsystem capacities ranging from 0 to 600 kWe.
Energies 09 00663 g008
Figure 9. Parametric study: cost analysis for different photovoltaic subsystem capacities ranging from 0 to 600 kWe.
Energies 09 00663 g009
Figure 10. Effect of the specific cost for the photovoltaic subsystem on the lifecycle cost of the proposed system.
Energies 09 00663 g010
Table 1. Values of the system input parameters.
Parameter DescriptionValue
Ambient temperature25 °C
Ambient pressure1 atm
Generator efficiency0.972
Gas turbine nominal power output1 MWe
Flue gas exhaust temperature (summer operation)145 °C
Flue gas exhaust temperature (winter operation)65 °C
Liquefied natural gas (LNG) storage temperature−160 °C
Natural gas temperature (after regasification)10 °C
Steam supply temperature150 °C
Steam return temperature142 °C
Cold water supply temperature (district cooling)7 °C
Cold water return temperature (district cooling)15 °C
Hot water supply temperature (district heating)80 °C
Hot water return temperature (district heating)60 °C
Absorption chiller coefficient of performance1.3
Compressor pressure ratio12.6
Compressor isentropic efficiency0.741
Gas turbine isentropic efficiency0.811
Gas turbine exhaust temperature519 °C
Table 2. Cost model for the proposed photovoltaic-assisted combined cooling, heating, and power system.
Variable Description (Unit)Model Equation
c f y y Annual cost of fuel (excl. regasification) (€/year) c f y y = E p y c L N G
c r e g Annual regasification cost (€/year) c r g f = E p y c r g f
c f y Annual cost of fuel (incl. regasification) (€/year) c f y = c f y y + c r e g
C t r Total cost of LNG transport (€) C t r = c t r , k m L t r V t r u c k s u p p l y L N G , y r N
C c c Total cost of chillers (€) C c c = c c Q ˙ c
Q f c y Annual fan-coil unit energy input (J) Q f c y = ( Q ˙ f c 1 [ yr ] ) |   3.1536 × 10 10   J kW yr   |
Q h c y Total thermal energy production from combined cooling, heating, and power (CCHP) system (J) Q h c y = Q h y + Q c y
N f c Number of fan-coil units (−) N f c = Q h c y Q f c y
C d n Cost of distribution network (€) C d n = L c l
C p p Cost of power plant (€) C p p = c p P e
C f c t Total cost of fan-coil units (€) C f c t = c f c N f c Q ˙ f c
C c p Total cost of central plant (€) C c p = C p p + C c c
C C H P , 0 Total cost of CCHP system (€) C C H P , 0 = C c p + C d n + C f c t
C p v s Total cost of PV subsystem (€) C p v s = c p v W ˙ p v , n o m
C C H P Total cost of PV-assisted CCHP system (€) C C H P = C C H P , 0 + C p v s
C d o w n Down payment (€) C d o w n = ( 1 f l o a n ) C C H P
A P n Capital recovery factor (−) A P n = r n 1 ( 1 + r n ) N
r 1 = r m L i r 2 = r m L r 3 = r 2 r 1 0.01 + r 1 r 4 = r m L r e 1 + r e
P A n Uniform series present worth factor (−) P A n = ( A P n ) 1
F P n Compound amount factor (−) F P n = ( 1 + r n ) N
P F n Present worth factor (−) P F n = ( F P n ) 1
C l o a n Cost of the loan (€) C l o a n = A P 1 A P 2 f l o a n C C H P
D l o a n Tax deduction on the loan (€) D l o a n = t f l o a n C C H P ( A P 1 A P 2 A P 1 r 1 ( 1 + r 1 ) A P 3 )
C t w c Total worth of capital (€) C t w c = C d o w n + C l o a n D l o a n
D d e p Linear depreciation of capital (€) D d e p = C C H P N t P A 2
D c r e d Tax credit (€) D c r e d = t c r e d C C H P
D s a l v Salvage worth (€) D s a l v = f s a l v C C H P P F 2 ( 1 t s a l v )
C p r o p Tax paid on property (€) C p r o p = f p r o p C C H P t p r o p ( 1 t )
C o m i Operation, maintenance and insurance cost (€) C o m i = f o m i C C H P P A 2 3 ( 1 t )
C t c f Total cost of fuel (€) C t c f = c f y ( 1 t A P 4 )
L C C Lifecycle cost (€) L C C = C t r + C t w c + C p r o p + C o m i + C t c f ( D d e p + D c r e d + D s a l v )
Table 3. Input cost factor values.
ParameterValue
r e 0.01
i 0.01
r m 0.06
r m L 0.05
f l o a n 0.08
t 0.40
t c r e d 0.02
f s a l v 0.10
t s a l v 0.20
f p r o p 0.50
t p r o p 0.25
f o m i 0.01
Table 4. Input values for the cost model.
Input Parameter DescriptionValue
c L N G Specific cost of LNG fuel for the first year3.082 €/GJ
L Length of pipe network2 km
f Heat loss factor0.05
c c Specific cost of cooling plant365 €/kW
c l Specific cost of distribution line2920 €/m
c p Specific cost of natural gas-fired power plant365 €/GW
c f c Specific cost of fan-coil unit73 €/kW
N Number of years of service20
c r g f Specific cost of LNG regasification0.208 €/GJ
c p v Specific cost of PV subsystem1.825 €/W

