Abstract
The construction of a cyber physical system in a power grid provides more potential control strategies for the power grid. With the rapid employment of intelligent terminal equipment (e.g., smart meters and intelligent appliances) in the environment of a smart grid, abundant dynamic response information could be introduced to support a secure and stable power system. Combining demand response technology with the traditional under-frequency load shedding (UFLS) scheme, a new UFLS strategy-determining method involving intelligent appliances is put forward to achieve the coordinated control of quick response resources and the traditional control resources. Based on this method, intelligent appliances can be used to meet the regulatory requirements of system operation in advance and prevent significant frequency drop, thereby improving the flexibility and stability of the system. Time-domain simulation verifies the effectiveness of the scheme, which is able to mitigate frequency drop and reduce the amount of load shedding.
1. Introduction
With the accelerating application and deployment of smart grid technologies, the modern power system is becoming a typical cyber physical system (CPS) [1,2], which is a hybrid autonomous heterogeneous system with deep integration of information with the physical world. As the traditional analysis and control methods of a power system are vastly improved via the use of advanced information communication technology (ICT) [3], the power grid is being developed into a more sustainable system.
In a conventional power system, power loads are usually viewed as passively controlled objects participating in dispatching and control applications, such as day-ahead dispatch optimization and under-frequency/under-voltage load shedding (UFLS/UVLS) [4,5]. In contrast, in the environment of a smart grid, the increasing employment of smart meters, intelligent appliances, and other intelligent terminal equipment provides abundant dynamic information to secure and stabilize the power grid, thereby enabling the power loads to actively participate in more advanced applications (especially in load shifting [6,7] and frequency regulation [8,9,10,11,12]) in response to a price signal or an event trigger. Because all of the existing applications of active load control are performed over a relatively long time scale (at least at the minute level), there is widespread interest discovering whether these power loads can actively participate in handling the emergency situations of a power system, such as the frequency stability issue at the second or millisecond level.
UFLS devices have long played an important role in the secure and stable operation of power systems. Conventional UFLS devices, which are usually installed at substations or switching stations, are configured based on local electrical information and are beneficial for the reliability of devices. Some research studies have been devoted to improving the relay setting of UFLS based on the magnitude and falling rate of frequency in abnormal conditions [13]. However, lack of global information makes it difficult for conventional strategies to achieve an optimal result. As a suitable alternative, adaptive load shedding strategies have become the current research focus [14,15,16]. The estimation of frequency drops and the precise load shedding method are the two main concerns. Gu et al. [15] proposed a multi-agent system-based, decentralized UFLS scheme to maintain the frequency stability of an islanded distribution network, with only limited communication resources and information. To restrict the overshoot in the frequency response caused by extra load shedding, Laghari et al. [16] provided a one-step optimal load shedding scheme, with accurate calculation of power imbalance after disturbance and selection of the load combination with the minimum absolute error. In this paper, this scheme is selected for comparison purposes because the simulation results in [16] demonstrate that it offers improved performance over other adaptive load shedding strategies. Using the minimum load shedding magnitude to achieve a better frequency recovery effect is the main purpose of the above studies. On the one hand, because the degrees of importance of power loads connected to the same circuit-breaker are quite different, cutting off all loads simultaneously is inappropriate and will cause serious social impacts; on the other hand, the traditional UFLS scheme does not make full use of demand-side resources (e.g., interruptible load) [17]. Researchers have noted that demand-side resources should be considered when determining the priority of power loads, although no specific method was given. With the development of ICT [18], a high-speed, reliable, and secure data communication system now provides support for better observability and controllability of an entire power system, making it possible to use active power loads to respond to a UFLS process.
In summary, the existing studies of demand-side response are mostly concentrated on applications on a relatively long time scale, for which emergency stability control is rarely considered. Most existing studies of transient frequency stability are focused on the tendency of frequency after disturbance and the coordination between stages of UFLS strategy, and few investigations have considered involving the demand-side response at the terminals at the distribution level. To enable the load side control to participate in stability control, two major issues need to be discussed: the strategy coordinated with the existing load shedding method and the requirements of the supporting communication network.
The original contributions of this paper include: (1) the framework of using an intelligent interruptible load to participate in emergency frequency control is studied; (2) the requirements of the supporting communication network are discussed and the control terminal of an intelligent appliance is described; (3) the coordinated scheme of intelligent appliances with UFLS is proposed.
2. Structure of a Cyber Physical Power System
A typical structure of a cyber physical power system from a real utility in China is shown in Figure 1. Two physical networks are included: a multi-resource power network formed by physical power equipment (e.g., traditional power plants, power loads, transmission lines, distributed generation, energy storage and power electronic equipment) and a multi-layer communication network (which can be divided into a premise area network layer, a neighborhood/field area network layer, and a wide area network layer based on the data transmission rate and coverage range).
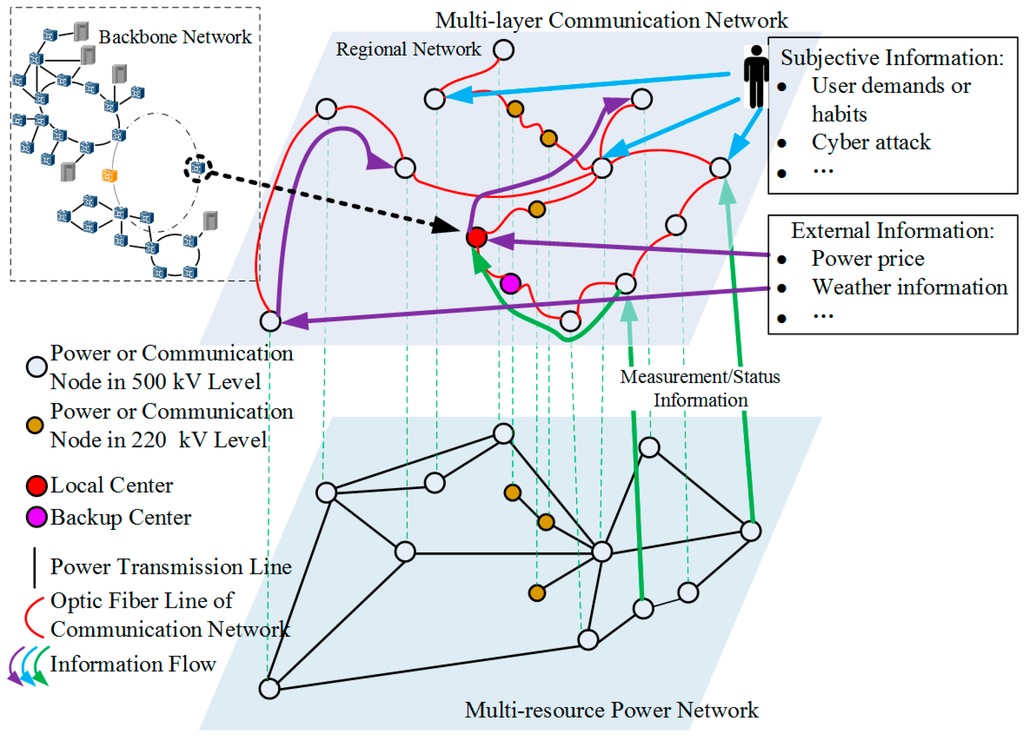
Figure 1.
Typical structure of a cyber physical power system of a real utility in China.
Moreover, the invisible information flow also plays a key role in the entire system. Not only the measurement information (e.g., the voltage and current of power buses) and the status information (e.g., the switch status of substations and tap positions of transformers) but also the external information (e.g., power price and weather information) and the subjective information from human beings (e.g., user demands or habits and cyber-attack information) are involved. The information is transmitted to the control center or distributed to control devices through a multi-layer communication network (e.g., the Internet, optical fiber private channels, or wireless communication channels) to support the control and regulation applications of a physical power grid.
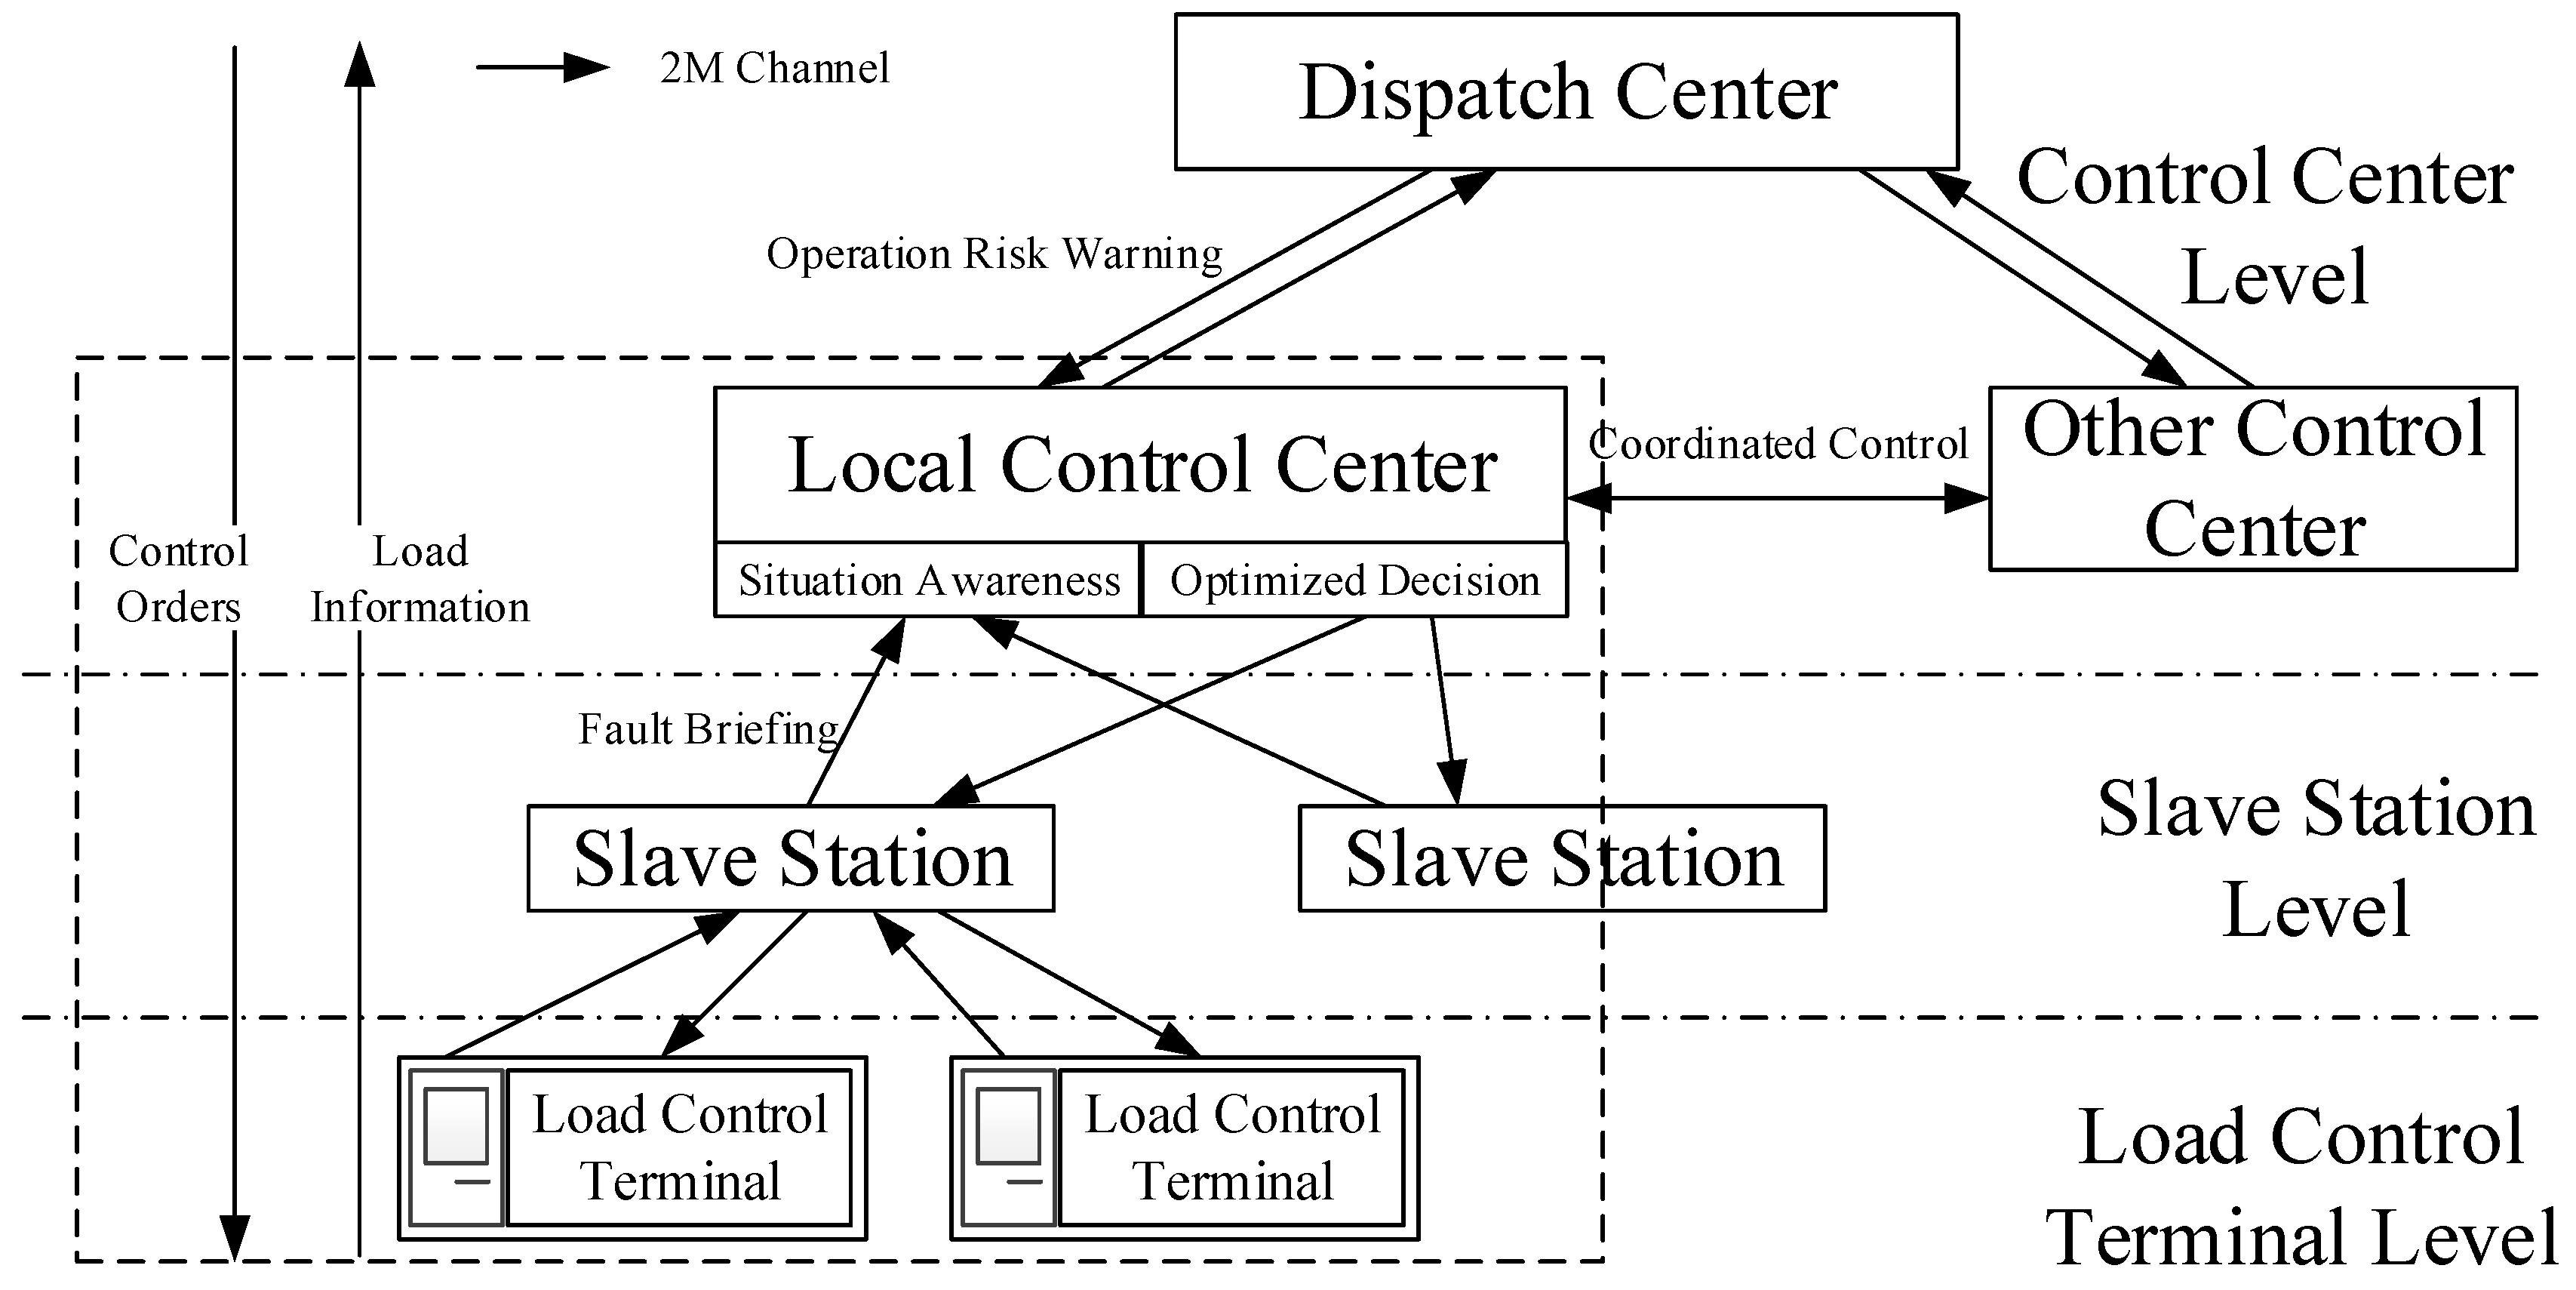
Regarding the active power load participating in the frequency emergency control (i.e., UFLS) considered in this paper, a more detailed control structure of this application is shown in Figure 2. Three levels are involved: the control center level (dispatch center and local control center), slave station level, and load control terminal level. The load information and operation status are transmitted from the bottom up; the control orders are distributed reversely. The control center receives an operation risk warning from a higher level dispatch center and a fault briefing from slave stations based on the fault perception method used. The optimization decision module is used to formulate the step control strategy and to regulate orders based on the control effect. The coordination module is responsible for coordinating the load control strategy with other systems. The contents in the dashed frame are the main focus of this work.

Figure 2.
Control structure of the active power load participating in the frequency emergency control.
3. Emergency Frequency Control with Consideration of Intelligent Terminal Equipment
3.1. Dynamic Frequency Response of the Power System
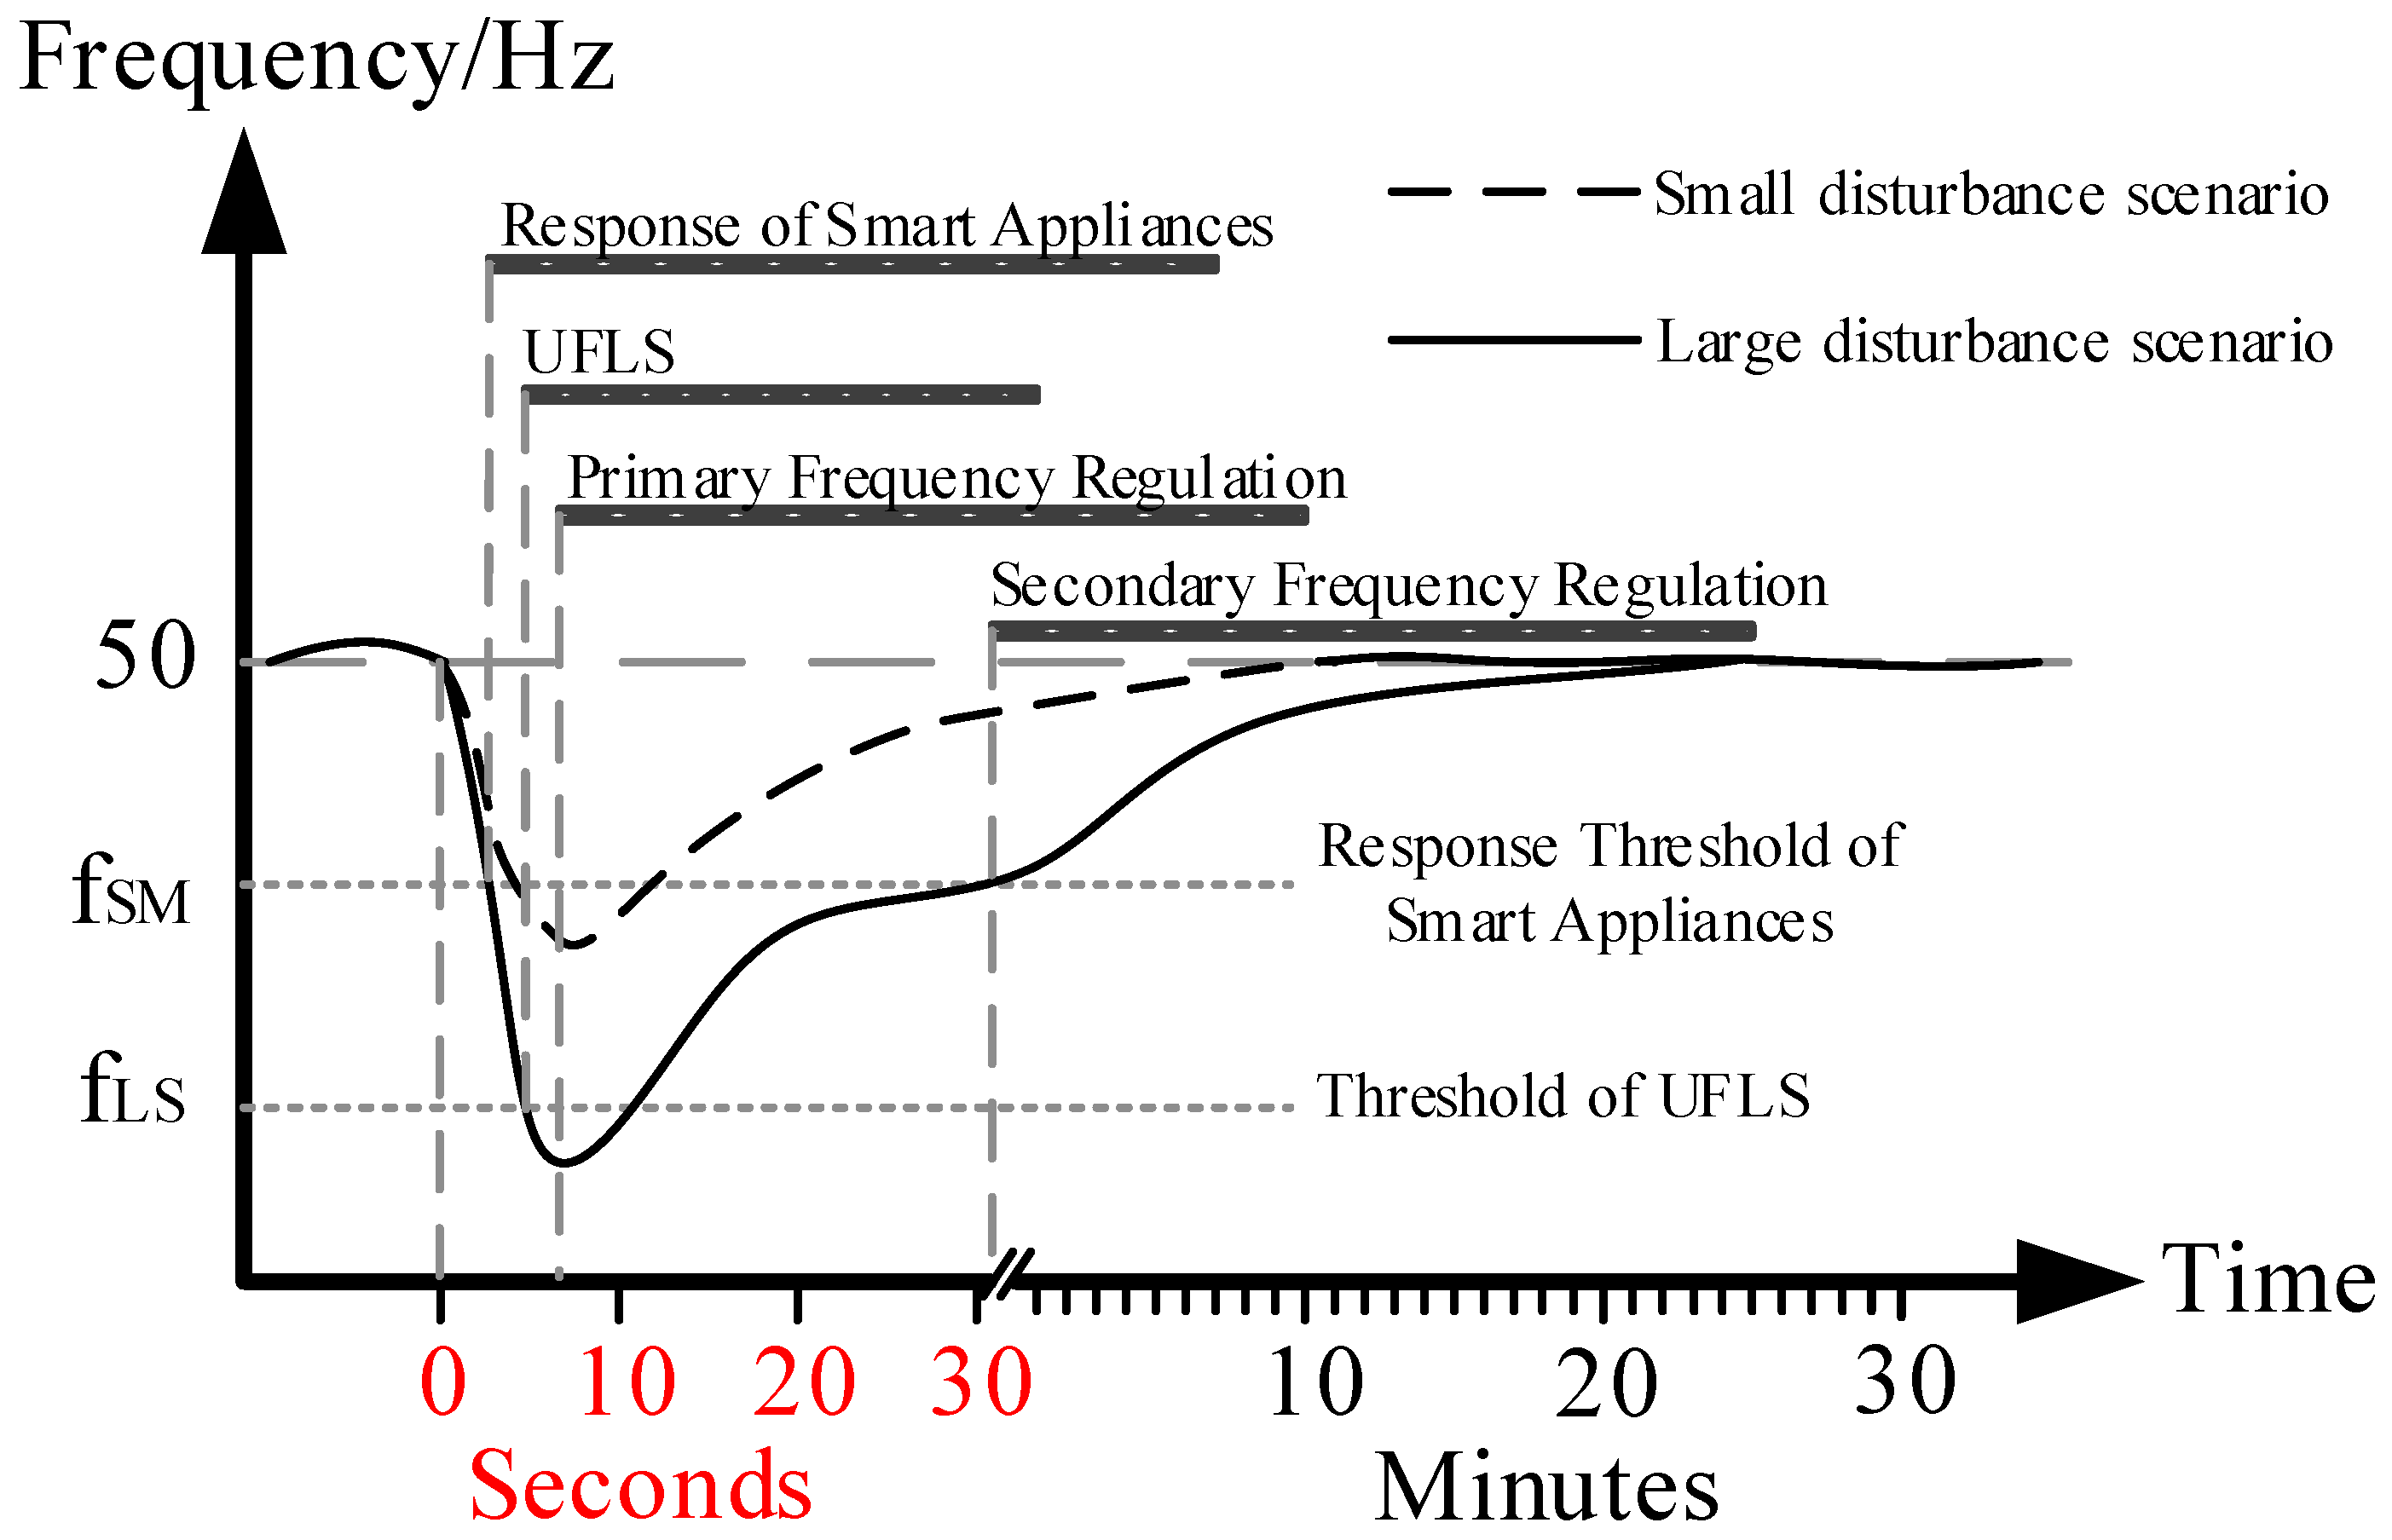
Upon the occurrence of a large system disturbance, the active power balance is broken, and the frequency drops dramatically, as shown in Figure 3. The discrepancy of power between the source and load sides leads to a series of dynamic frequency responses. When the active power is unbalanced, the rotor of the generator compensates for the active power shortage in the form of kinetic energy, and when the frequency crosses the dead zone boundary, the governor begins to increase or decrease power generation. Meanwhile, the change in frequency results in a change in power consumption of the frequency sensitive load. Automatic generation control (AGC) is not considered in this paper, as its response time is several minutes [19], which is much longer than the time scale of interest here.

Figure 3.
Dynamic curve of frequency after a disturbance in a smart grid.
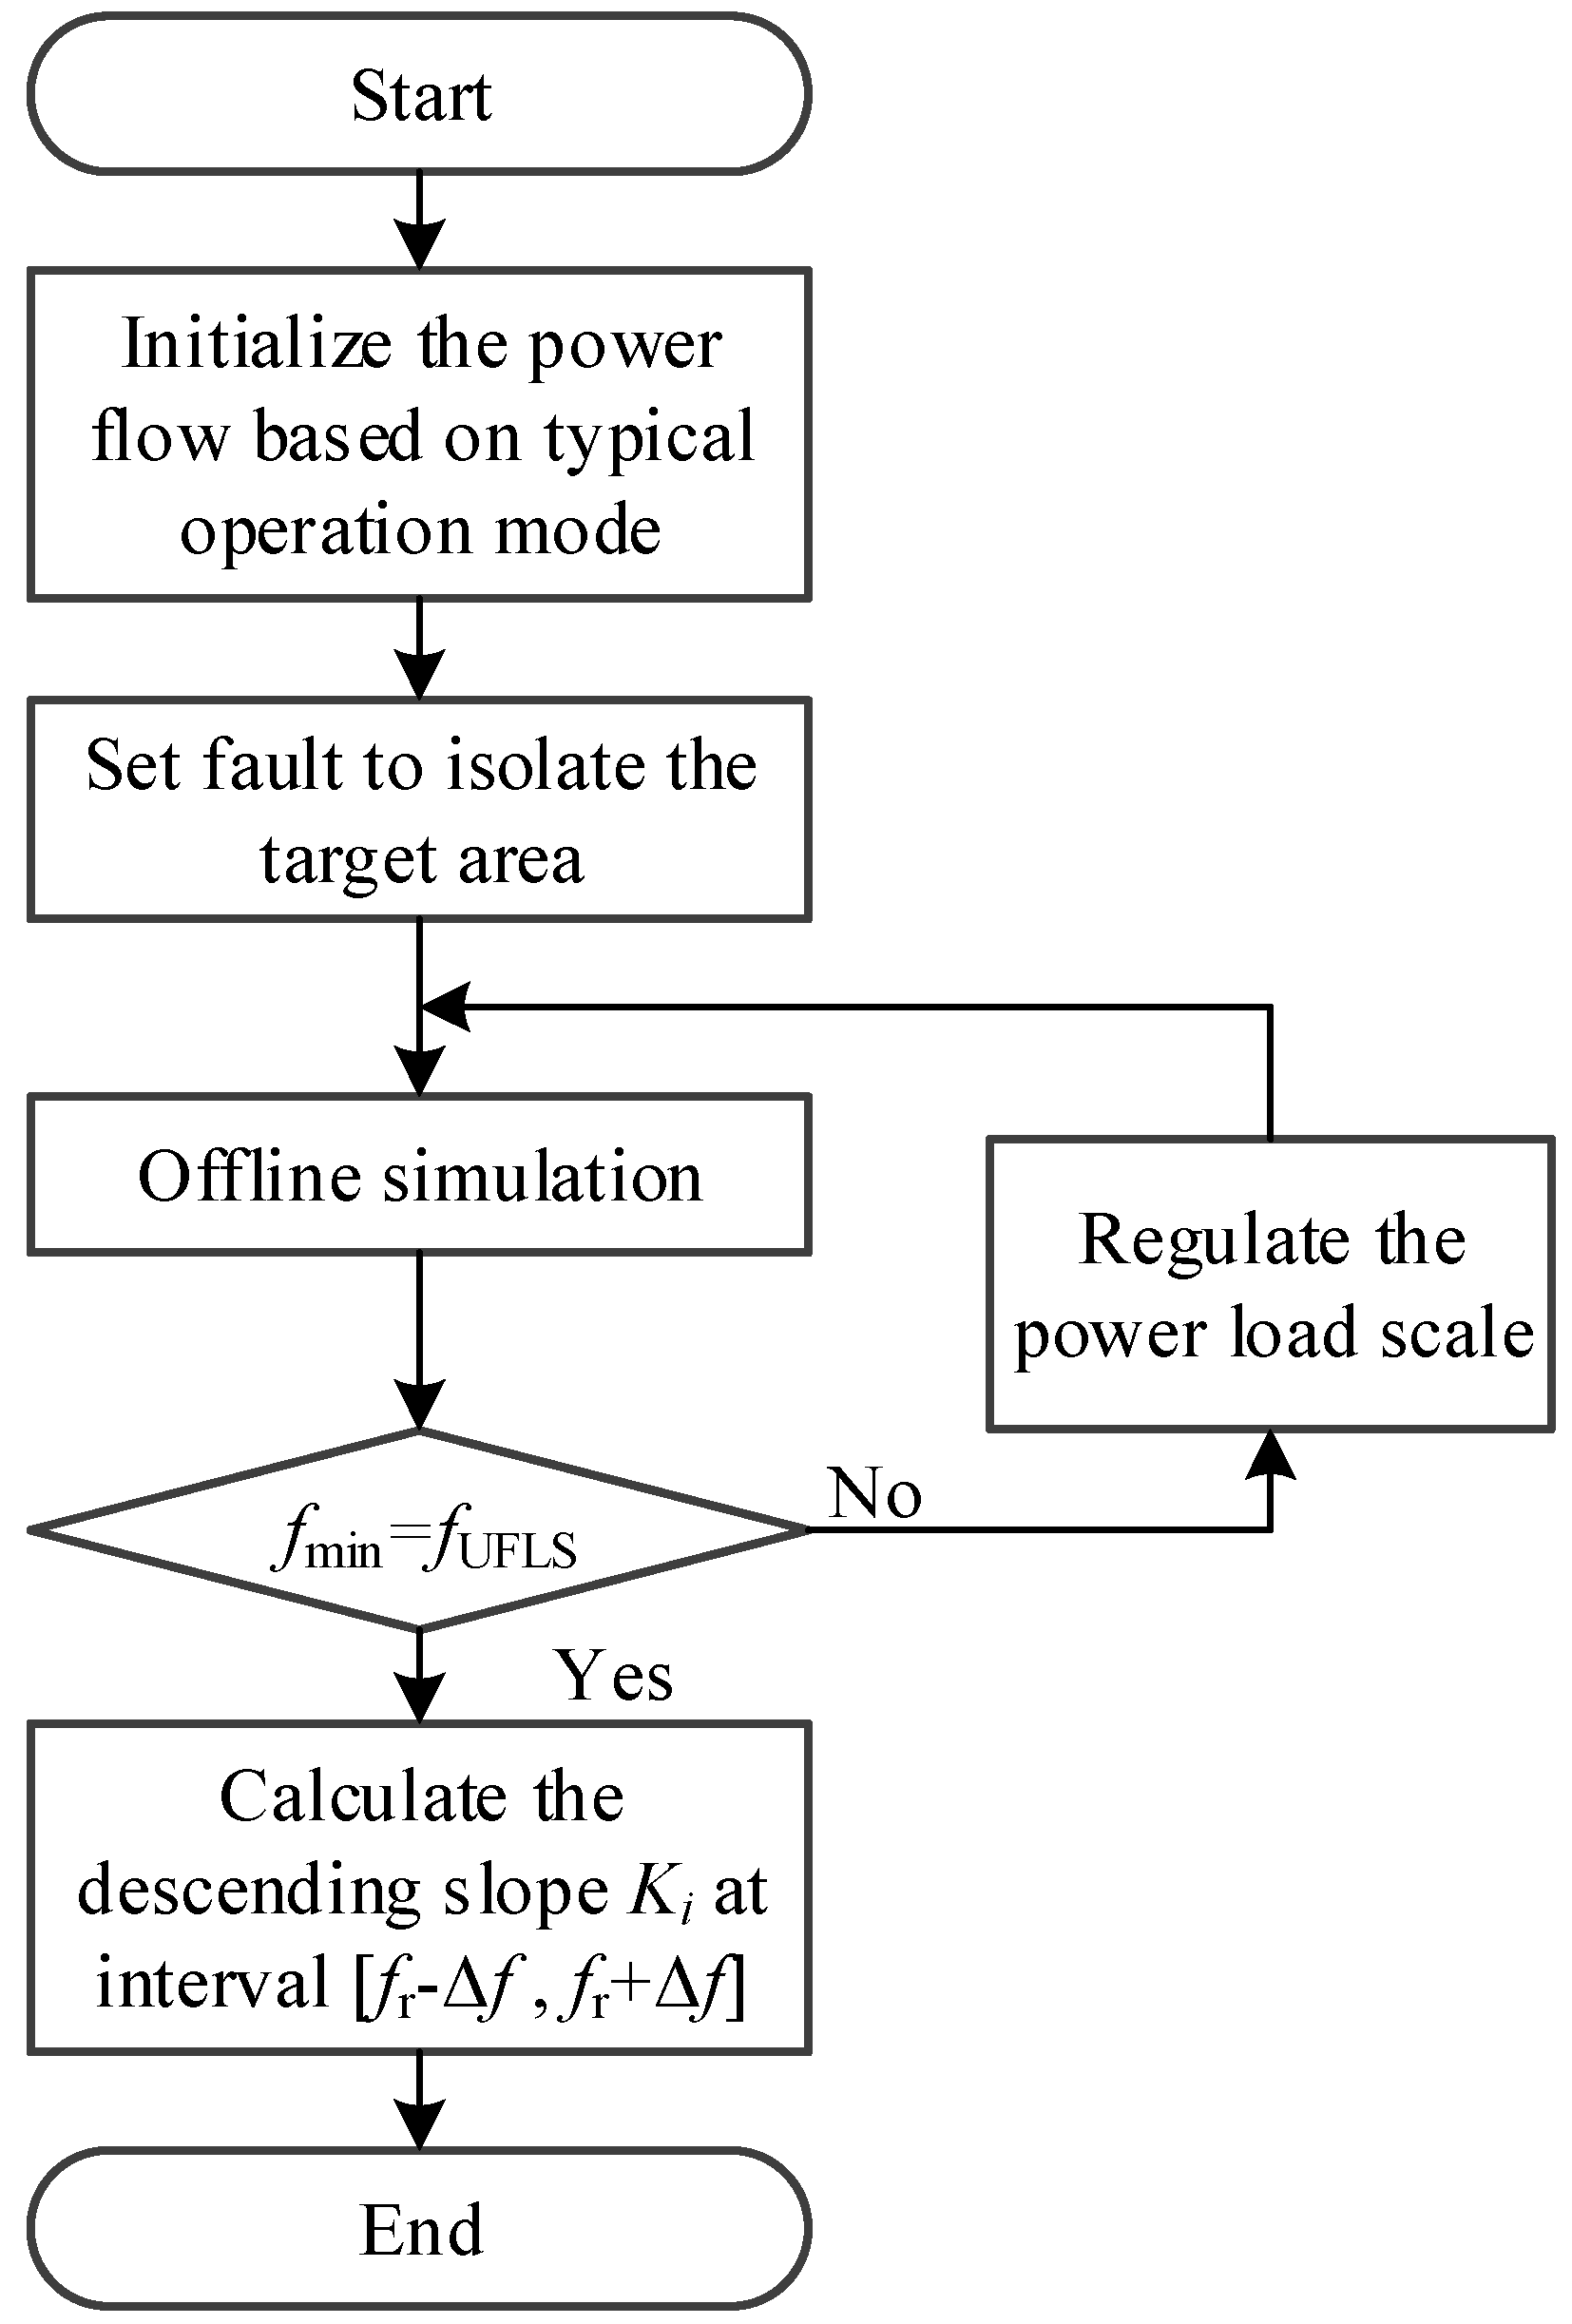
During the disturbance, the control center instantly estimates the power shortage and controls all types of intelligent home appliances to respond according to the scale of the disturbance and the information of the load capacity of the intelligent home appliances in the system at that moment. The response control of intelligent home appliances is accomplished by setting a response index K, which is saved in smart meters, together with a predefined logical determining program. Because of the different electrical distances between the locations of disturbances and all the buses, as well as the differences of factors (including generating unit parameters and load characteristics in each section), the frequency changes in different sections of the system are not the same but rather exhibit temporal and spatial variation. Therefore, the intelligent home appliance response index K set for each section by the control center is determined by the actual operational condition and the local frequency trajectory. An offline simulation is used to calculate the value of K, as shown in Figure 4. The whole calculation process is as follows: (1) Set the initial state based on typical operation modes; (2) Set the fault based on contingency screening results to isolate the target area; (3) Regulate the power load scale and conduct transient simulations until the minimum value of frequency is exactly the threshold value of the first round UFLS scheme; (4) Based on the frequency curve, calculate the descending slope at an adjacent interval [fr − Δf, fr + Δf] as K; here, fr is a set reaction value of the interruptible load.

Figure 4.
The process to calculate the response index K of intelligent home appliances.
For each section, when the frequency drops to the preset intelligent home appliance response threshold fSM, the smart meter compares the absolute value of the real-time frequency changing rate |df/dt| to the intelligent home appliance’s response index Ki, controls the response of the intelligent appliances according to a predefined control logic, and then uploads the relevant information, such as the response capacity of the intelligent home appliance load, to the control center for allocation following the coordinated UFLS amount. If the response capacity of intelligent home appliances cannot address the power shortage and the frequency continues to drop to the first round action threshold fLS of the UFLS, then the UFLS device reacts to prevent system collapse. The value of fLS for a domestic isolated power grid in China is commonly 49.0 Hz.
3.2. Estimation of Disturbance Scale
A preliminary analysis of the frequency stability in the dynamic response process is performed according to the scale and type of disturbance estimated using the low-order power system model.
3.2.1. Determine the Power Shortage after Disturbance
The power shortage is in proportion to the variation rate of frequency df/dt; thus, it can be calculated as follows:
where Hi is the inertia constant of the i-th generator, fi is the frequency of the i-th generator, f0 is the rated frequency, ∆pi is the power shortage of the i-th generator, N is the number of generating units, and fc is the frequency of the equivalent inertia center.
3.2.2. Estimation of the Disturbance Type
The general approach in estimating the severity of the disturbance is to determine a critical power shortage ∆PL using an offline system stability analysis and to compare the system power shortage ∆P after disturbance with the critical value ∆PL. ∆PL can be obtained using the same offline simulation process as in Figure 4. In the system considered in this paper, the rated frequency is 50 Hz, and the critical point is the first round action threshold fLS of the traditional UFLS scheme.
Through comparison between ∆PL and ∆P, the disturbances can be sorted into two types:
- Type 1:
- The disturbance is regarded as a large disturbance when ∆P ≥ ∆PL. In this situation, the frequency is very likely to fall under the first round action threshold; thus, all intelligent home appliance loads should respond in conjunction with the traditional UFLS measures to prevent a severe frequency drop. The emergency control is aimed at restoring the frequency to the rated value as soon as possible.
- Type 2:
- The disturbance is regarded as a large disturbance when ∆P < ∆PL. In this situation, the frequency is unlikely to fall under the first round action threshold. The control center determines the response proportion of the intelligent home appliances according to the operational condition. The restoration and regulation are aimed at minimizing the control cost.
3.3. Traditional UFLS Scheme and Its Shortage
The traditional UFLS scheme is the most important defense measure for ensuring balance between the power supply side and the load side and for preventing the expansion of the fault. When the post-fault frequency declines to a set action value, UFLS devices will act to disconnect some loads after a certain delay.
To prevent the frequency from dropping to an unacceptable value, several stages are set to launch at different frequency values. The load capacity to be cut off in each stage should consider the operation of the main power network or the isolated network. In principle, relatively unimportant loads should be cut off first. The frequency recovery value should not be excessively high.
The load being cut in the i-th stage, i.e., ∆PLi, is determined by Equation (4):
where PL is the total load capacity, KL is the frequency regulation coefficient of the load, and fr and fi are the frequency value to be recovered and the threshold value of the i-th stage, respectively.
There exist several deficiencies in the traditional UFLS scheme. The load capacity to be cut in each stage is set according to the experience or the maximum power shortage value, which may lead to the elimination of unnecessary load and the overshoot of frequency regulation.
4. Coordinating Scheme of Intelligent Appliances with UFLS
4.1. Classifications of Intelligent Home Appliances
There are various loads in a power system, including industrial loads, commercial loads, and residential loads. All of these loads can play a role in the control management of the system operation through demand response technology. In this paper, intelligent appliances of residential loads are considered as the main research object. The research report from the Pacific Northwest National Laboratory illustrates that these loads can be used to respond to the control requirement from a system control center through a brief interruption with little or no effect on user comfort.
Those intelligent appliances that can respond to the operational condition of the system should satisfy two requirements: they should (1) be able to be interrupted for a short period of time with little or no effect on customer comfort; and (2) have a relatively stable service time. In practice, home appliances such as refrigerators, freezers, air-conditioners, water heaters, dry cleaners, and dishwashers can meet these needs.
According to the statistics, on a typical peak load day in the U.S., residential power consumption accounts for 34% of the total load [20], with the number regarding intelligent appliances being 18% of the total. In China, residential power constitutes 12% of the total.
4.2. Control of Intelligent Home Appliances
The intelligent appliances discussed in this paper are divided into two categories from the perspective of customer comfort and the energy storage ability of home appliances. One category is non-critical loads, including appliances that can be interrupted for a relatively long period of time (several minutes) and have little effect on customer comfort, such as refrigerators, water heaters, and air-conditioners; the other category is critical loads, including dry cleaners, ovens, electrical heaters, and loads that can be interrupted for only a few 10 s of seconds to avoid affecting customer comfort.
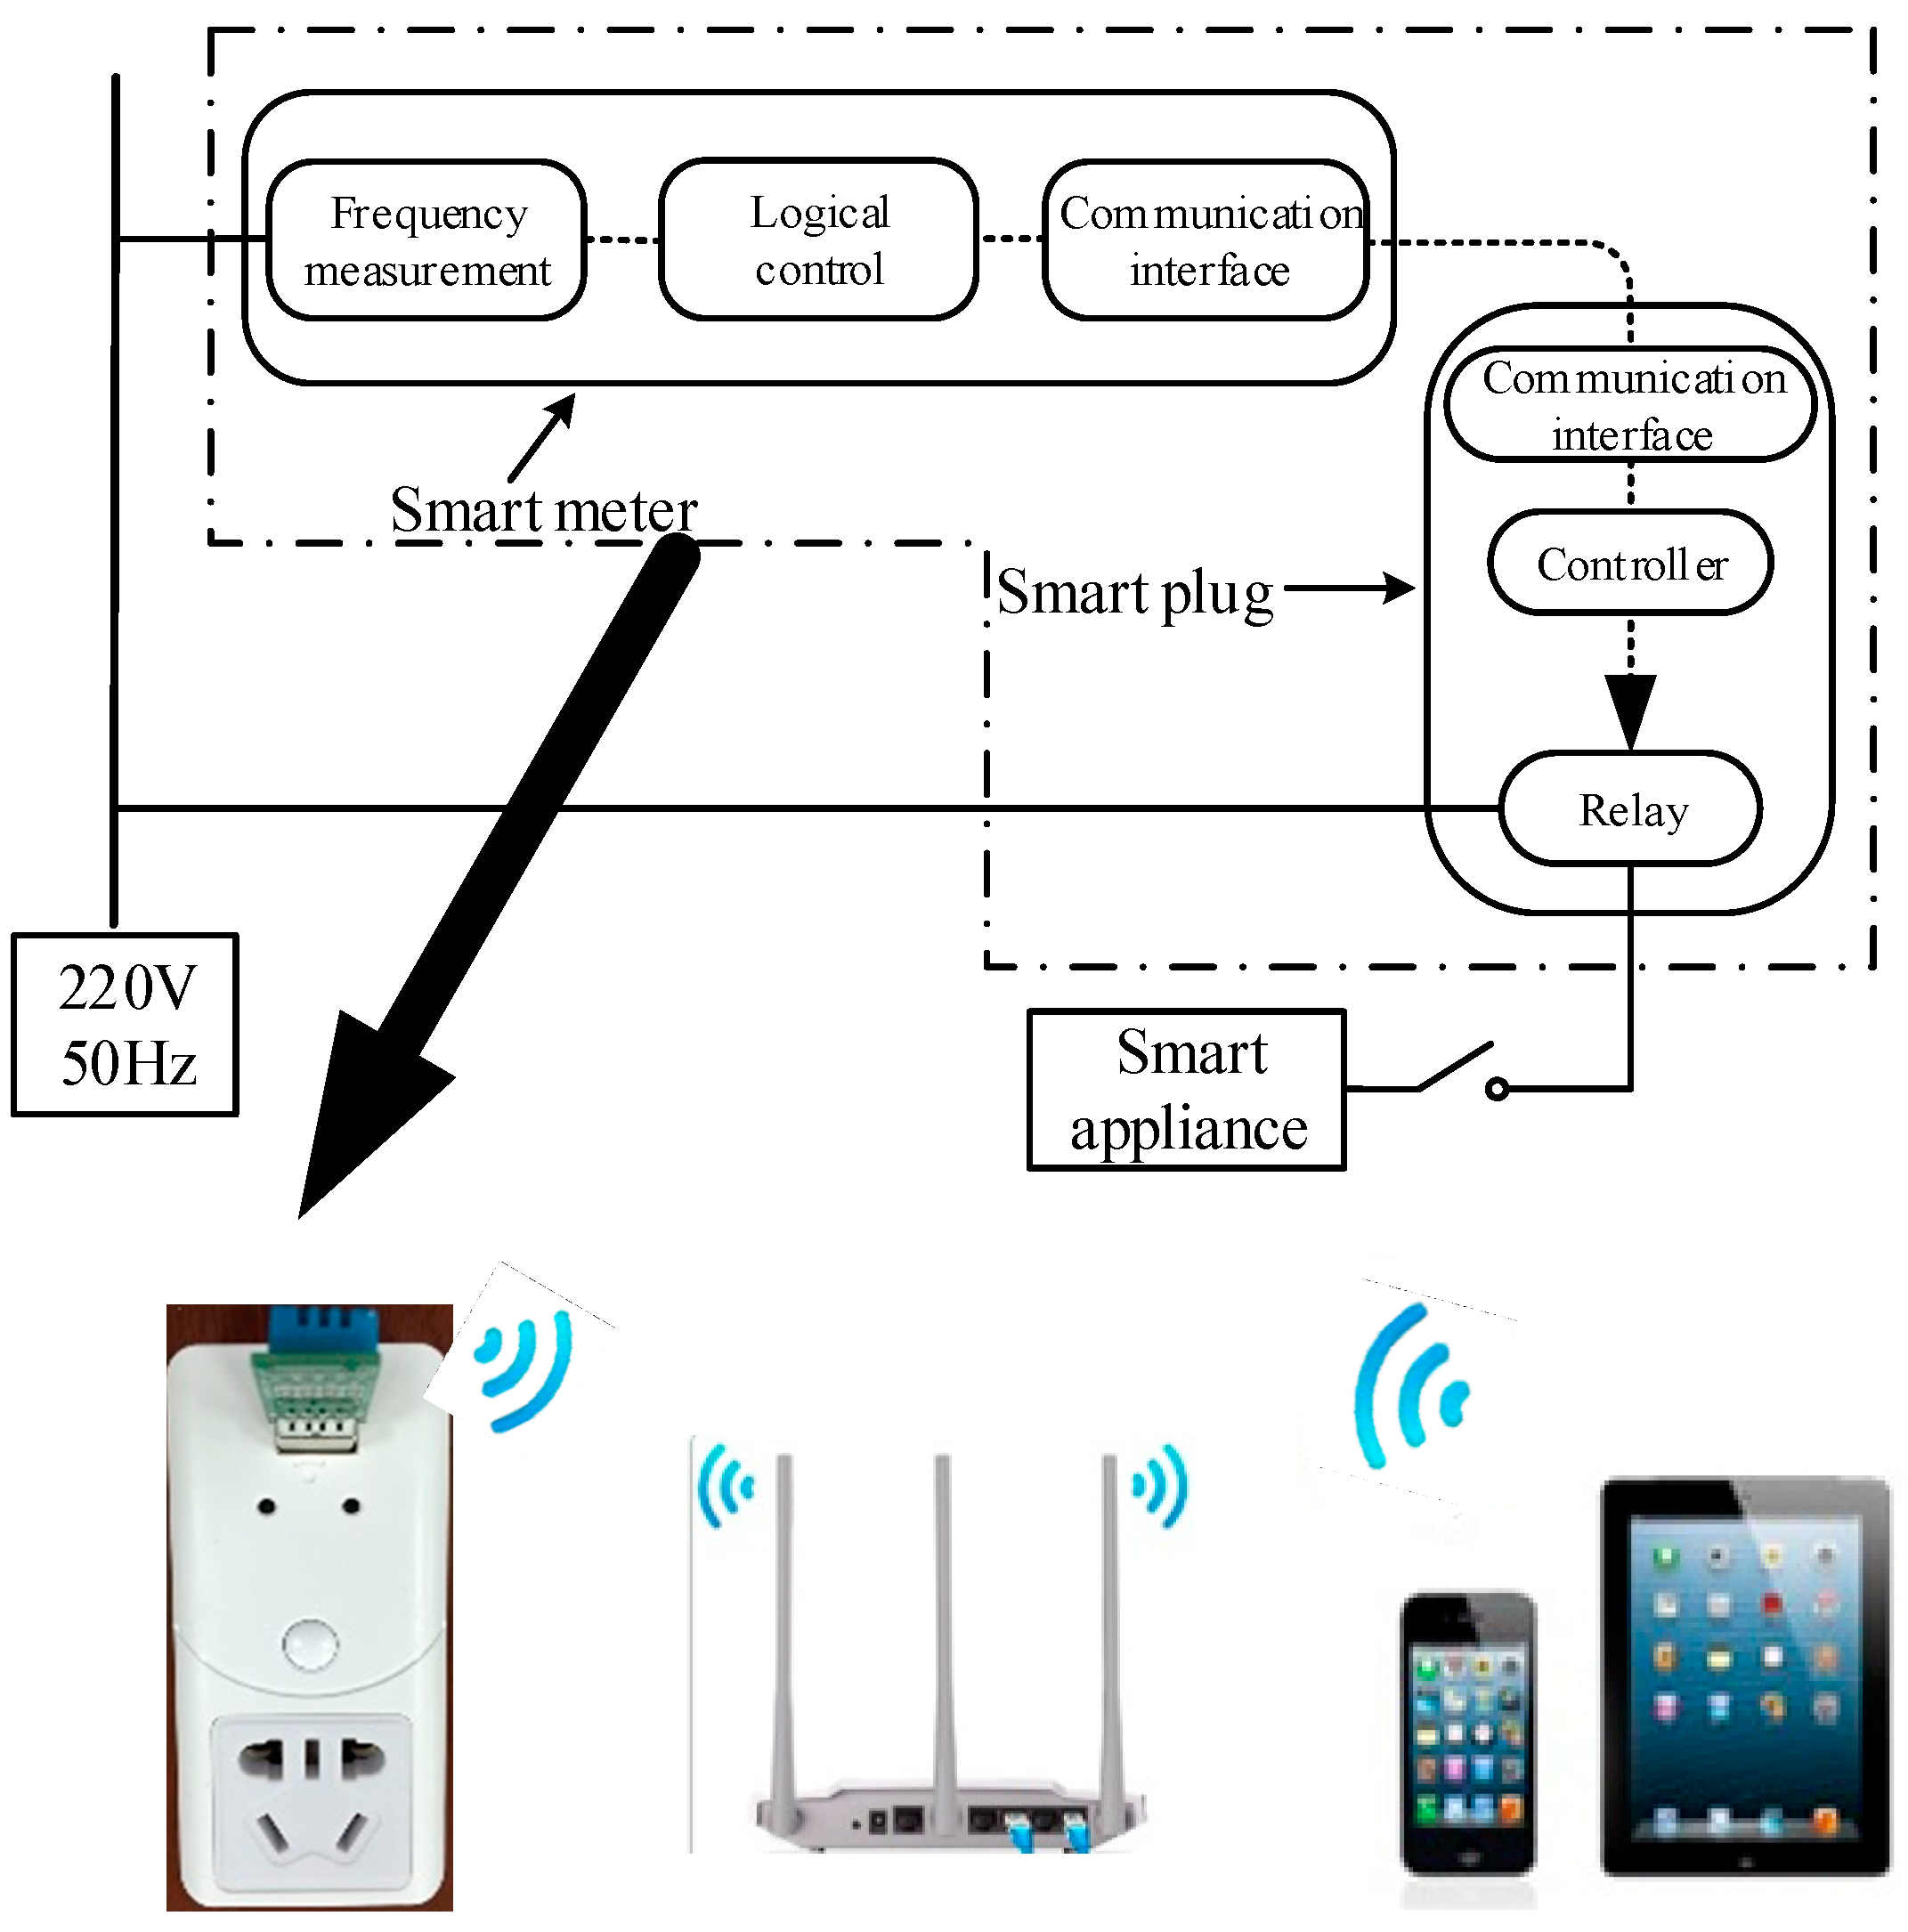
With the development of demand response technology, the power supply for home appliances can be provided by smart plugs [21]. Smart meters can be used to control the operational states of home appliances by monitoring the loading conditions of each smart plug and then sending turn on/off commands to the corresponding smart plugs to accomplish the switching operations of home appliances [22]. The whole control process contains several units, as shown in Figure 5: (1) measurement units that monitor the system frequency f and the absolute value of frequency variation |df/dt| in real time; (2) logical control units that determine whether to disconnect or re-engage intelligent appliances; (3) communication interface units that send out or receive commands; (4) relay units that execute the operation of disconnecting or re-engaging intelligent appliances. A real model of a smart plug integrated with smart meters that has been developed by our research group is also shown in Figure 5. The monitor screen of the smart meter is replaced by an application for mobile devices or tablet PCs connected via Wi-Fi.

Figure 5.
Control unit of an intelligent appliance.
4.3. Coordinating Scheme of Intelligent Appliances with UFLS
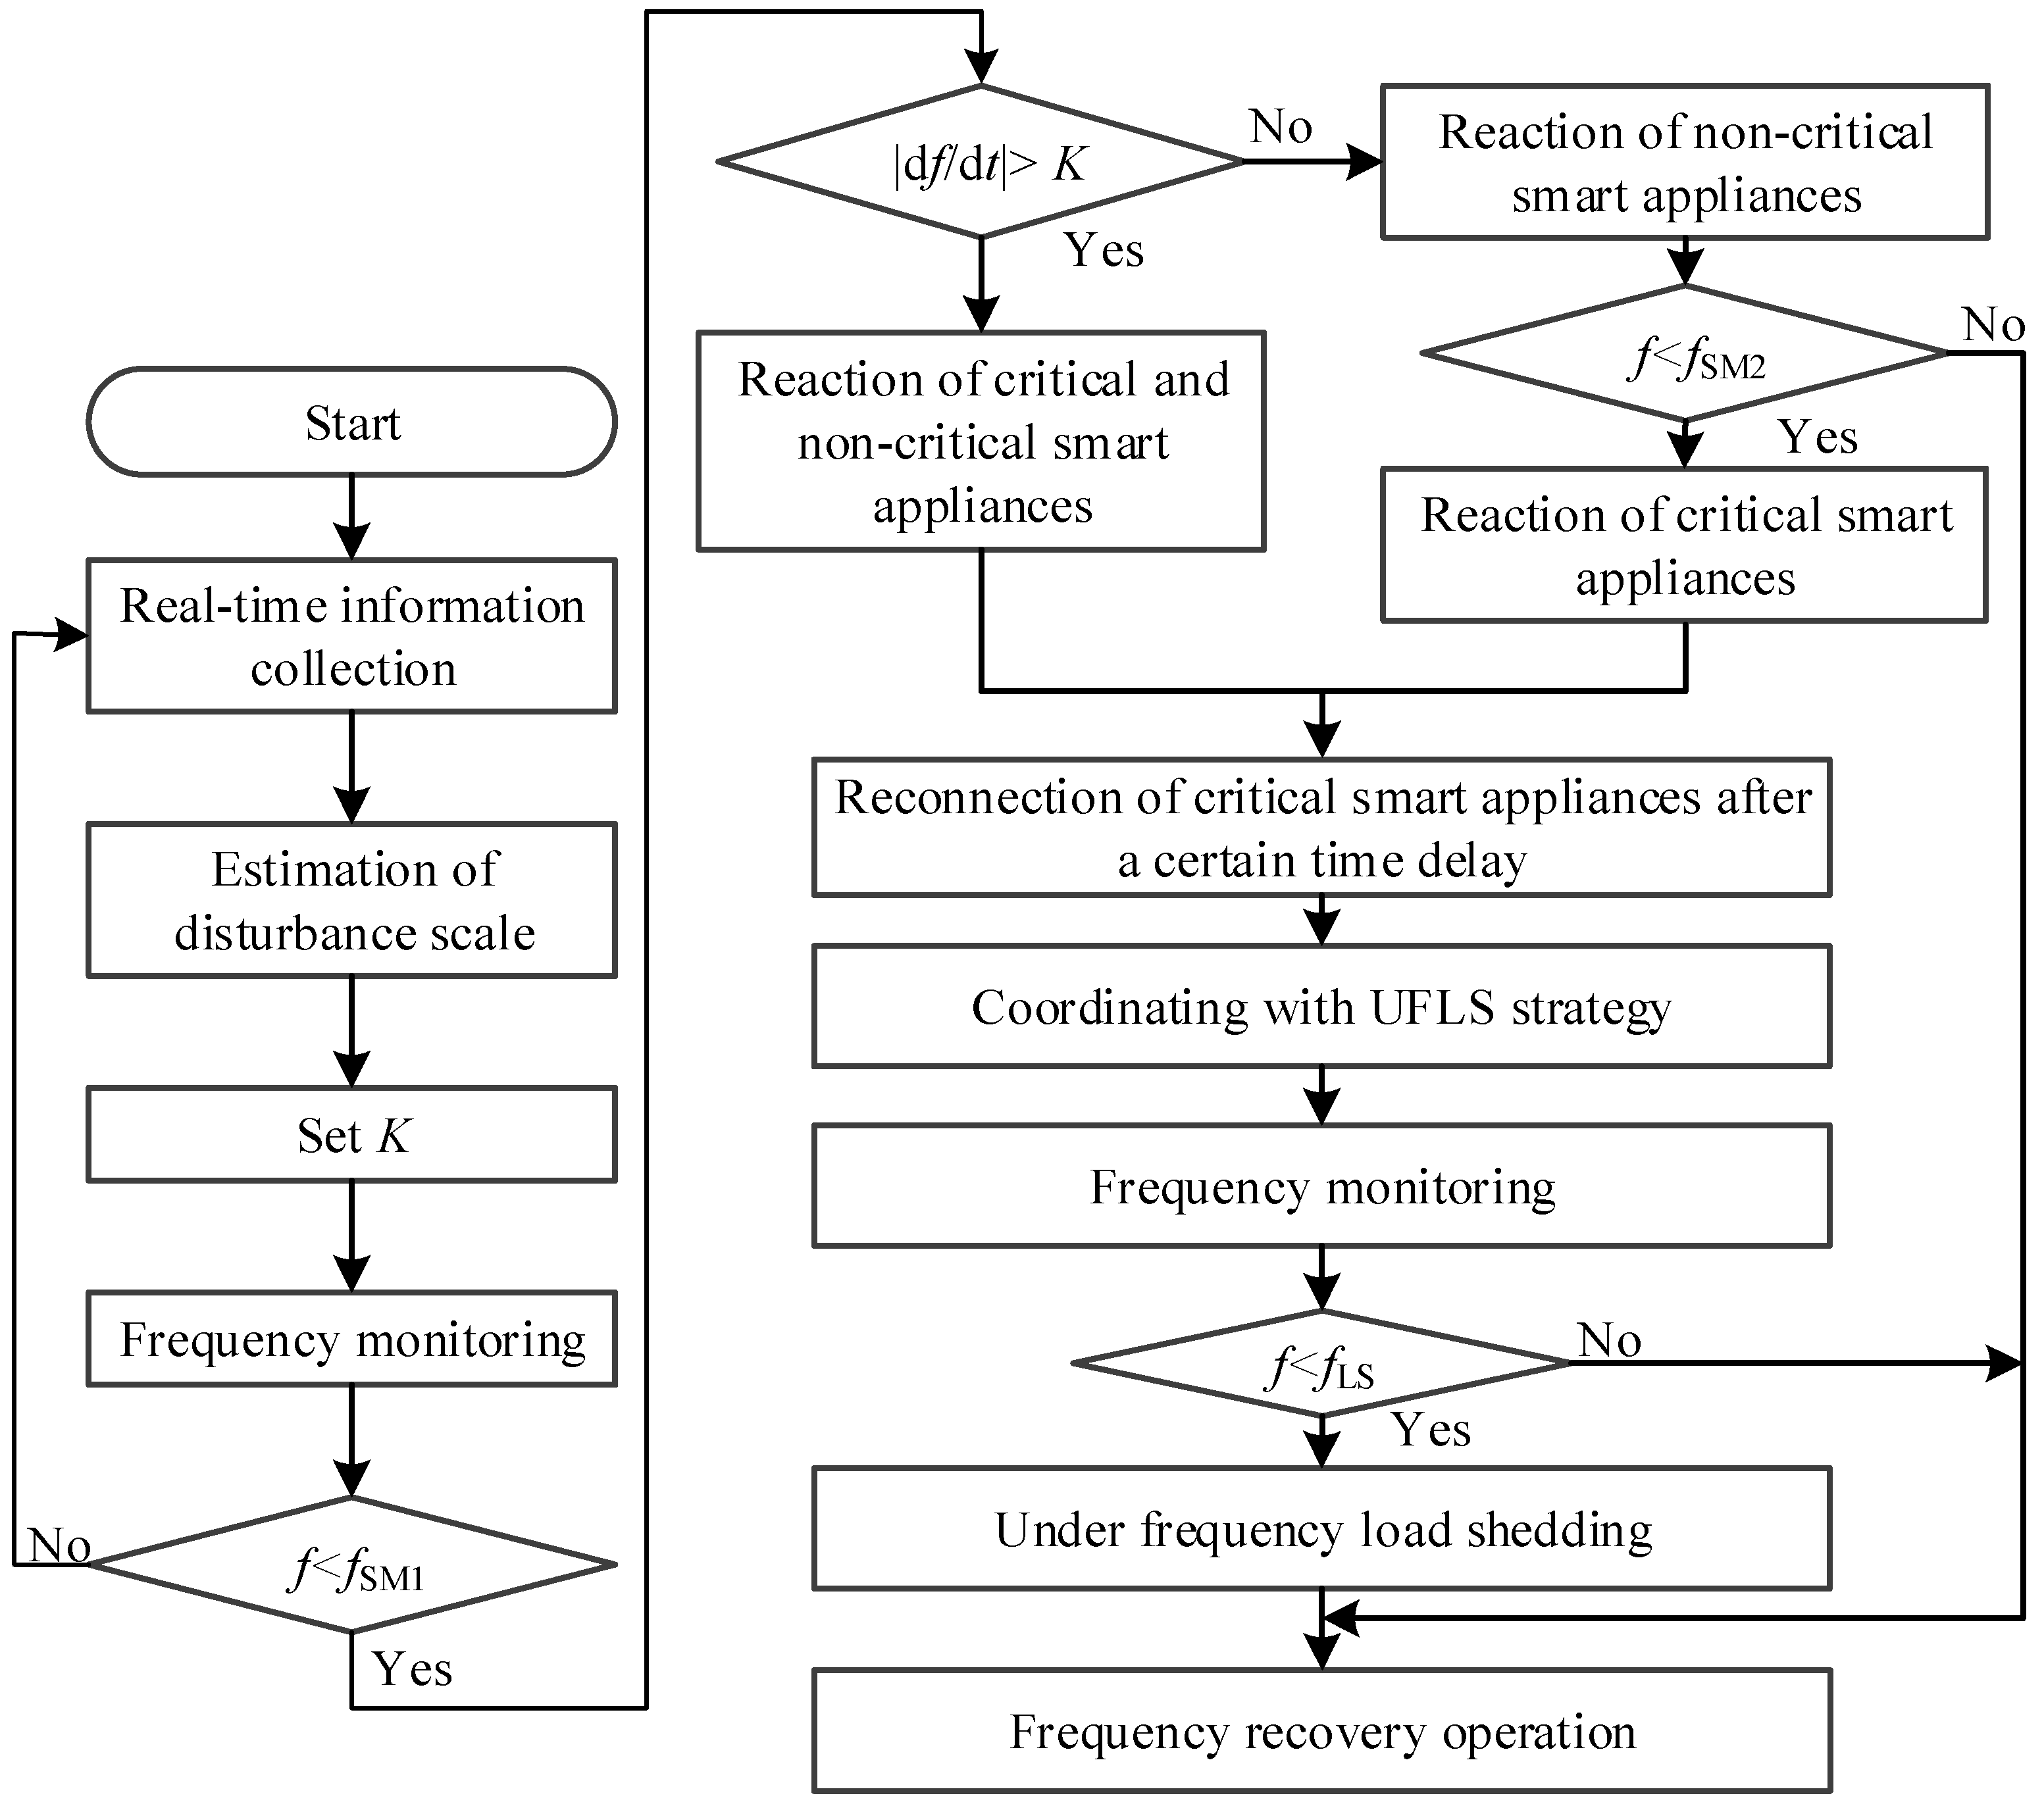
The main purpose of proposing a new type of UFLS scheme is to maximize the utilization of the available demand response resources (intelligent appliances in this paper) and to coordinate with the conventional UFLS scheme. Therefore, loads that are cut off passively can be replaced by those active demand response resources; moreover, a sharp drop in frequency can still be prevented, and the frequency is able to recover to the rated value as soon as possible. This new type of UFLS scheme improves the flexibility and reliability of system operation. Based on the above analysis, the procedures of the new type of UFLS scheme are described below and illustrated in Figure 6.
- (1)
- The operational condition information of intelligent appliances is transmitted to the control center or slave station for statistics of the load capacity ready for response. The frequency and other status information are collected simultaneously.
- (2)
- When a disturbance occurs, the response index K of each intelligent appliance is renewed by the control center based on the response capacity of the load and the estimated power shortage and is sent to smart meters.
- (3)
- The real-time frequency f and its rate of change df/dt are measured by smart meters. When f < fSM1, the non-critical loads are cut off until the frequency has recovered and stabilized; furthermore, if |df/dt| > K, then the critical loads also respond and will be connected to the grid after a certain time interval t; if |df/dt| < K, then the critical loads do not change status until the frequency keeps dropping and reaches f < fSM2. Note that to prevent the shock caused by suddenly switching on a load, which may lead to a second drop of frequency, the reconnection of all disconnected loads is under centralized control.
- (4)
- The control center collects information on the responding intelligent appliance and the real-time frequency, based on which the coordinating scheme adjusts the threshold value of each UFLS stage.
- (5)
- When f < fLS, the UFLS devices are triggered on.

Figure 6.
Control strategy of the UFLS scheme in the context of intelligent appliances.
4.4. Discussion of the Time Delay in the New Scheme
In the new type of UFLS scheme in Section 4.3, the measurement signal information (f, df/dt) under the disturbance and system load capacity should be sent to the control center quickly and accurately and the updating of K should be accomplished as soon as possible, which imposes a comparatively high request for the calculation and communication ability of the system.
The parameter K can be obtained through the comparison between the power vacancy ∆P and activation power ∆PL, combined with the collected capacity information of intelligent appliances. Regarding the calculation of ∆P, recent literature [23] regards it as an action condition designed for a low-frequency load shedding algorithm that can ensure the efficiency of the algorithm. The activation power ∆PL can be obtained from an offline stability analysis. Considering that status information, such as the operation mode of the power system and load capacity, cannot change dramatically in a short time, ∆PL is calculated only every five minutes. The adopted communication architecture is shown in Figure 2. When there is no fault in the fiber channels, the entire computation time, with the addition of communication delay, can be completely controlled within the action delay of smart meters, which is set to 0.3 s in this paper. Thus, the communication architecture can guarantee the matching of the action speed of intelligent appliances and the frequency dynamics of the system; moreover, the time span of the entire process can be limited to 0.65 seconds, which is required by the power utility in China.
5. Case Study
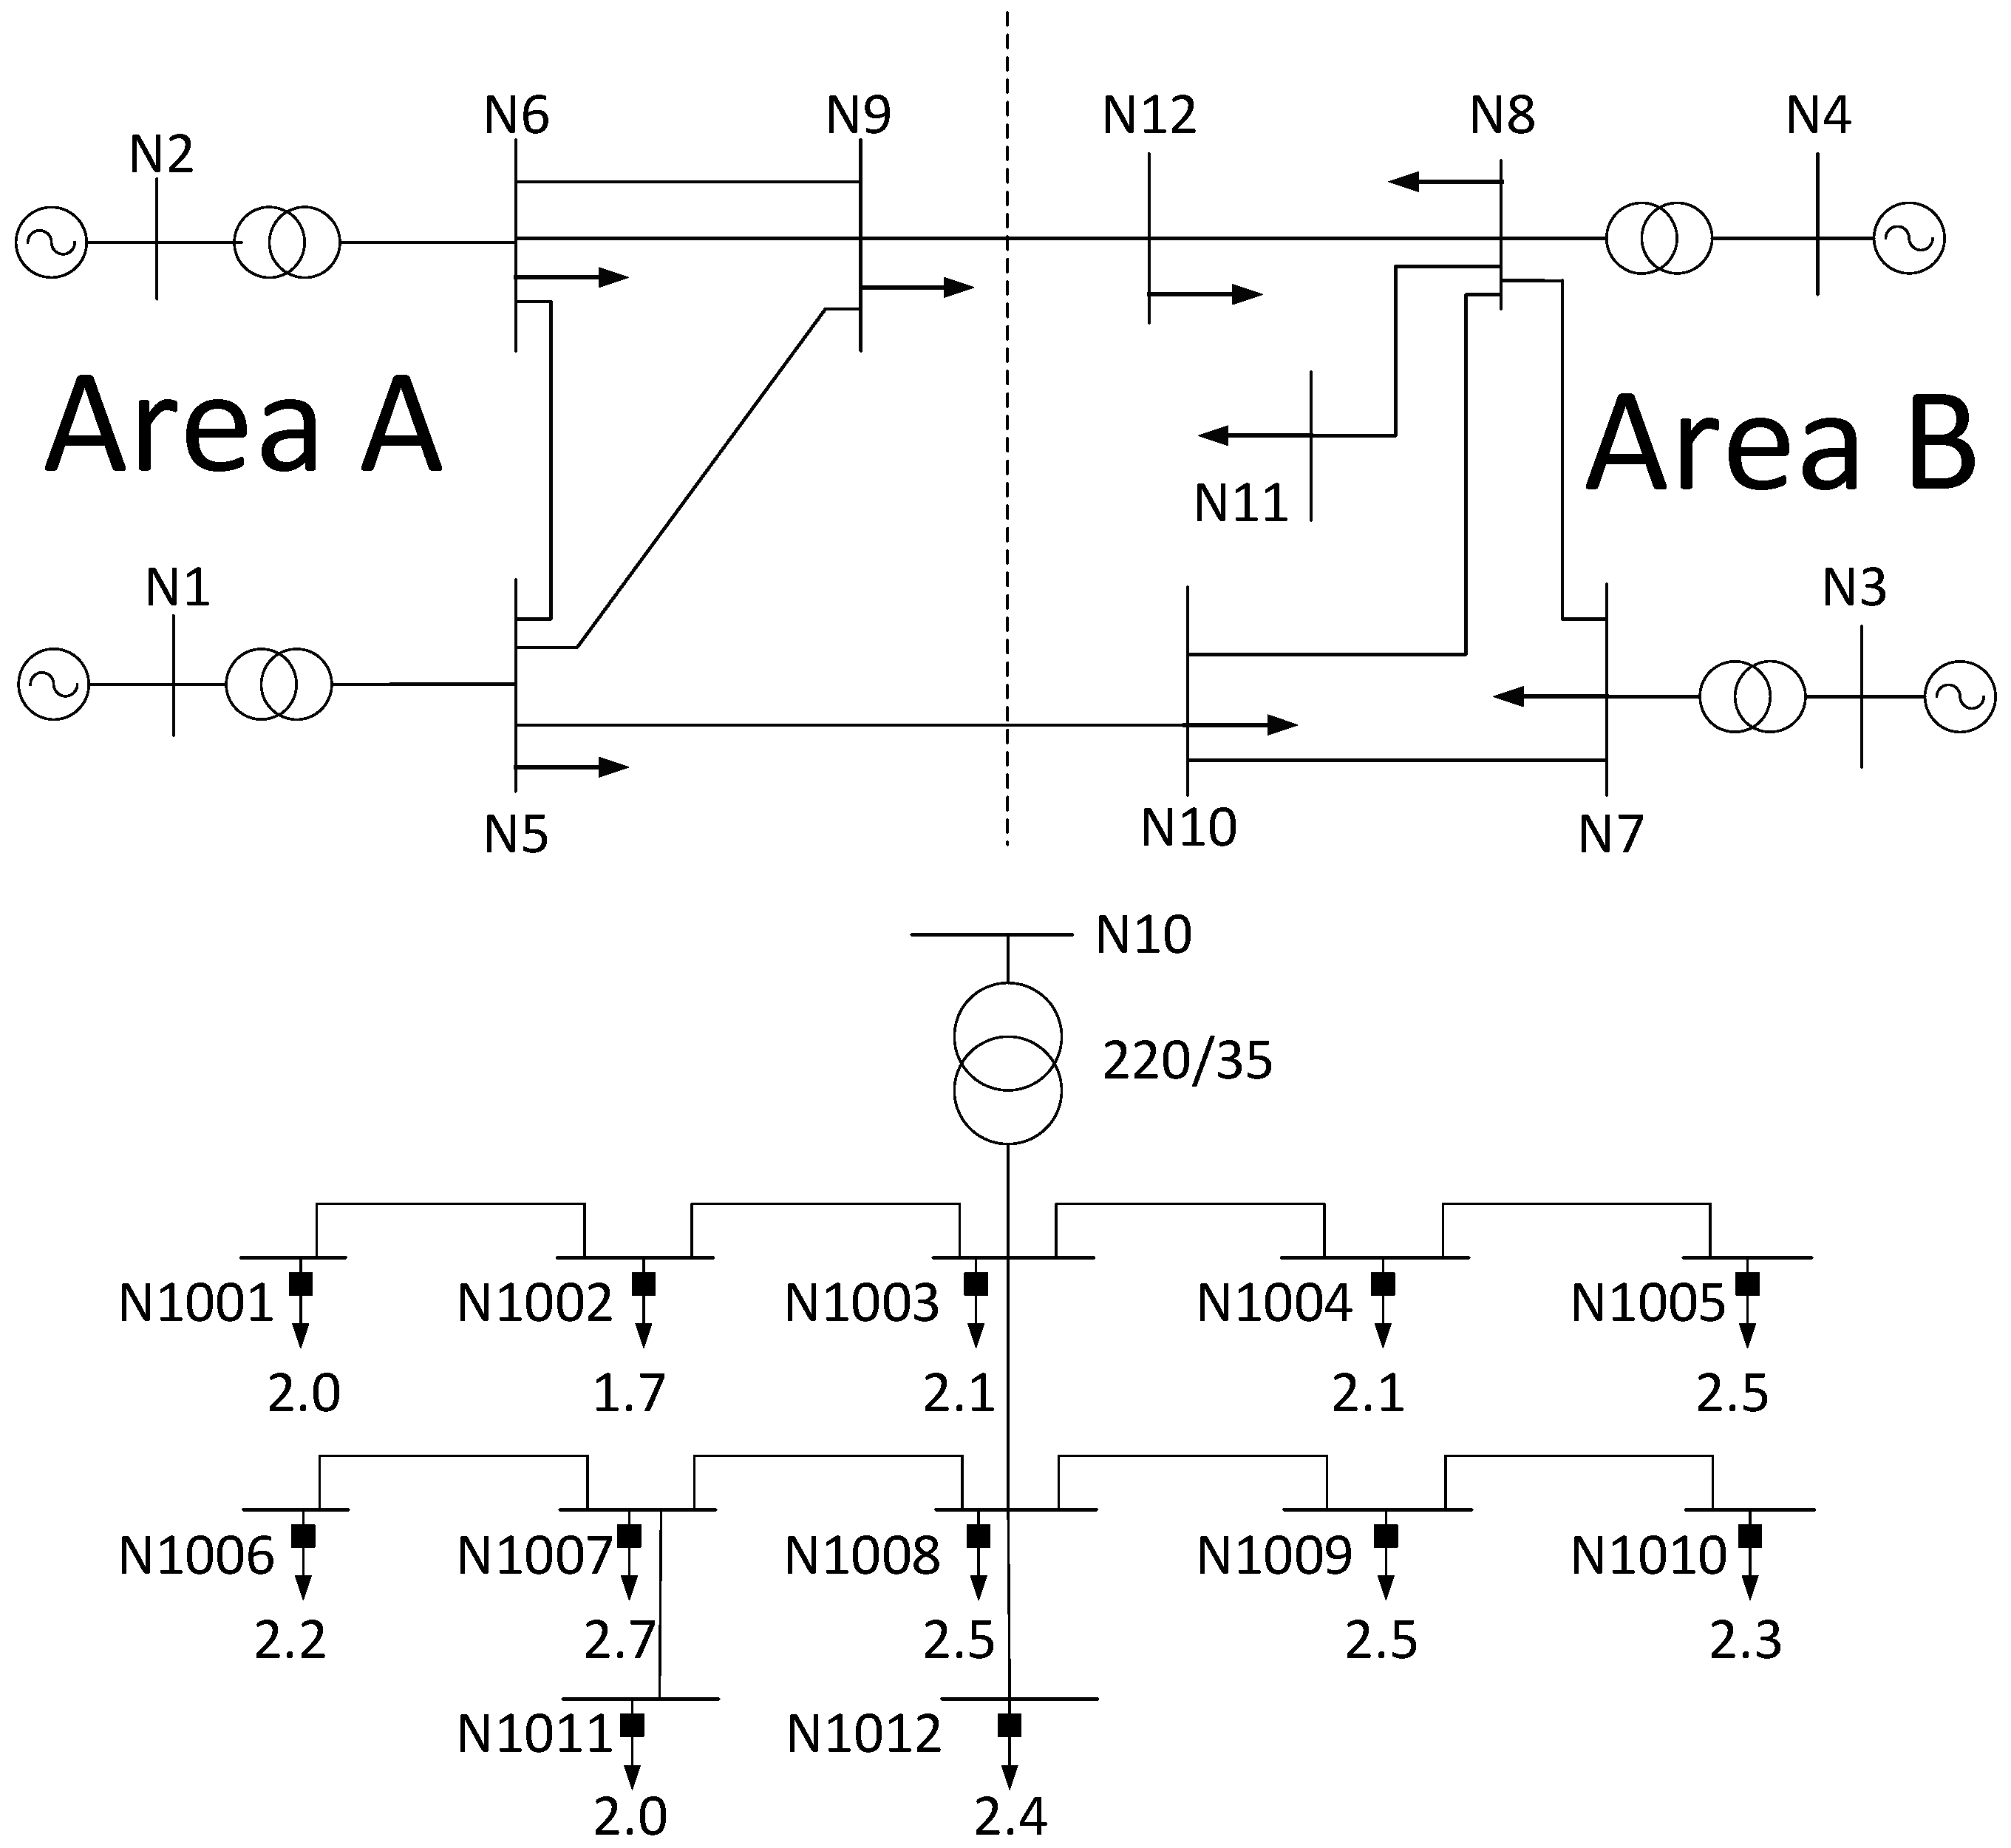
The test system used in this paper consists of two layers: the transmission level, which contains 4 generators, 12 buses, and a distribution network, with 12 load buses connected at bus N10 through a 220/35 (kV) transformer. Note that the scheme of this paper is implemented in the distribution network; the transmission level is used only to generate large disturbances of different degrees. The structure is shown in Figure 7.
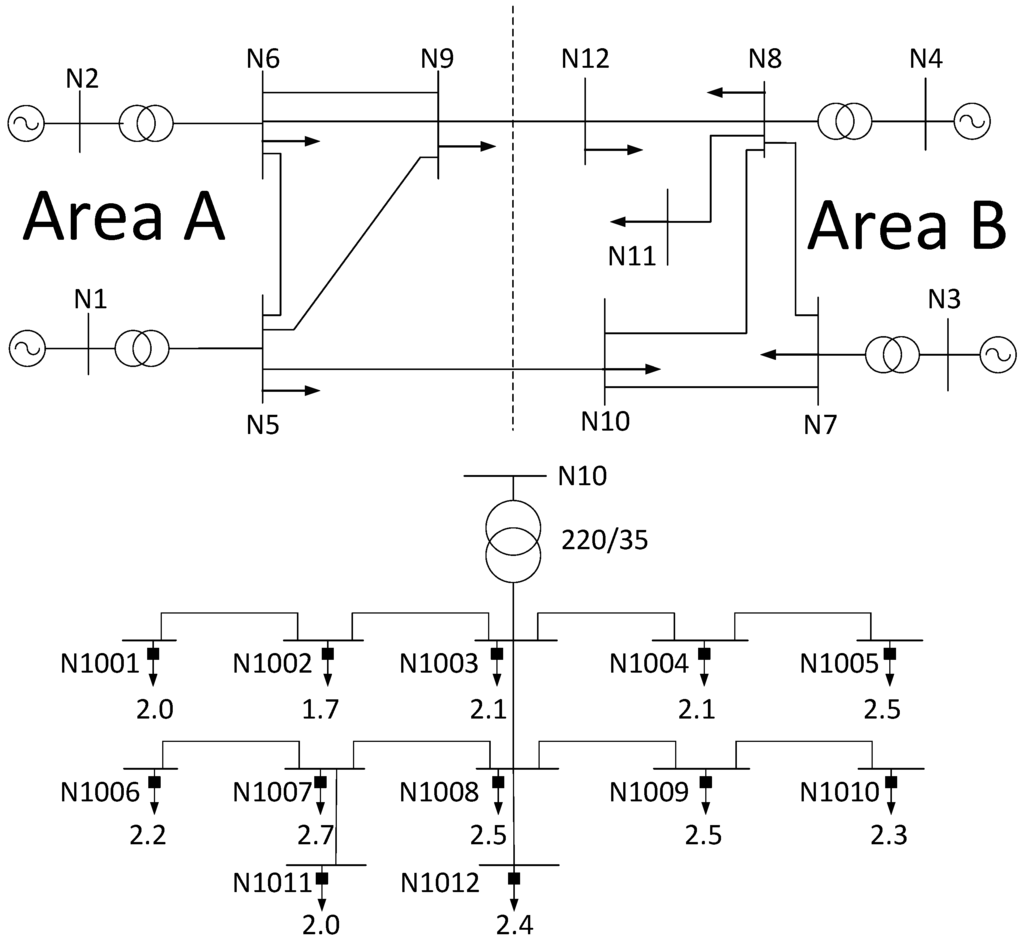
Figure 7.
Structure of the test power system.
The transmission network can be divided into two areas connected with two main transmission lines; the total active power capacity is 165 MW. To verify the effectiveness of the newly proposed UFLS scheme, three typical operational conditions with interruption faults are constructed. Power loads at bus N10 are used as the only UFLS resource in the entire power system. In the distribution network, all aggregated power loads are connected to the 12 main buses through breakers; thus, they can be cut off quickly when an emergency frequency event occurs. The total load capacity of the distribution network is 27 MW; the load magnitude of each bus is shown in Figure 7. Additionally, 50% of these loads are non-critical intelligent appliances and 30% are critical intelligent appliances.
The test system is modeled using PSD-BPA, which is analysis software for power system transient characteristics launched by the China Electric Power Research Institute (CEPRI) and Bonneville Power Administration (BPA).
A traditional UFLS scheme is designed according to the frequency response of the power system under the condition of power vacancy, as shown in Table 1. The first three rows in Table 1 list the common action parameter settings of a traditional UFLS scheme. When the frequency falls below the 49.0 Hz limit, the traditional UFLS scheme trips relevant load buses at every frequency threshold. Because the power loads in the distribution network are 19% of the entire capacity in area B, a three-stage load shedding plan is adopted.

Table 1.
Traditional Scheme of the UFLS.
The method in [16] is also modeled for comparison purposes. The process of the method is as follows: (1) calculate the load shedding amount based on the center of inertia frequency; (2) calculate all possible load combinations, and select the one with minimum absolute error.
In the scheme of this paper, fLS, fSM1, and fSM2 are set to 49.0 Hz, 49.5 Hz, and 49.3 Hz, respectively. When the frequency drops below 49.0 Hz, the traditional UFLS scheme is still carried out.
Three scenarios with different faults are considered.
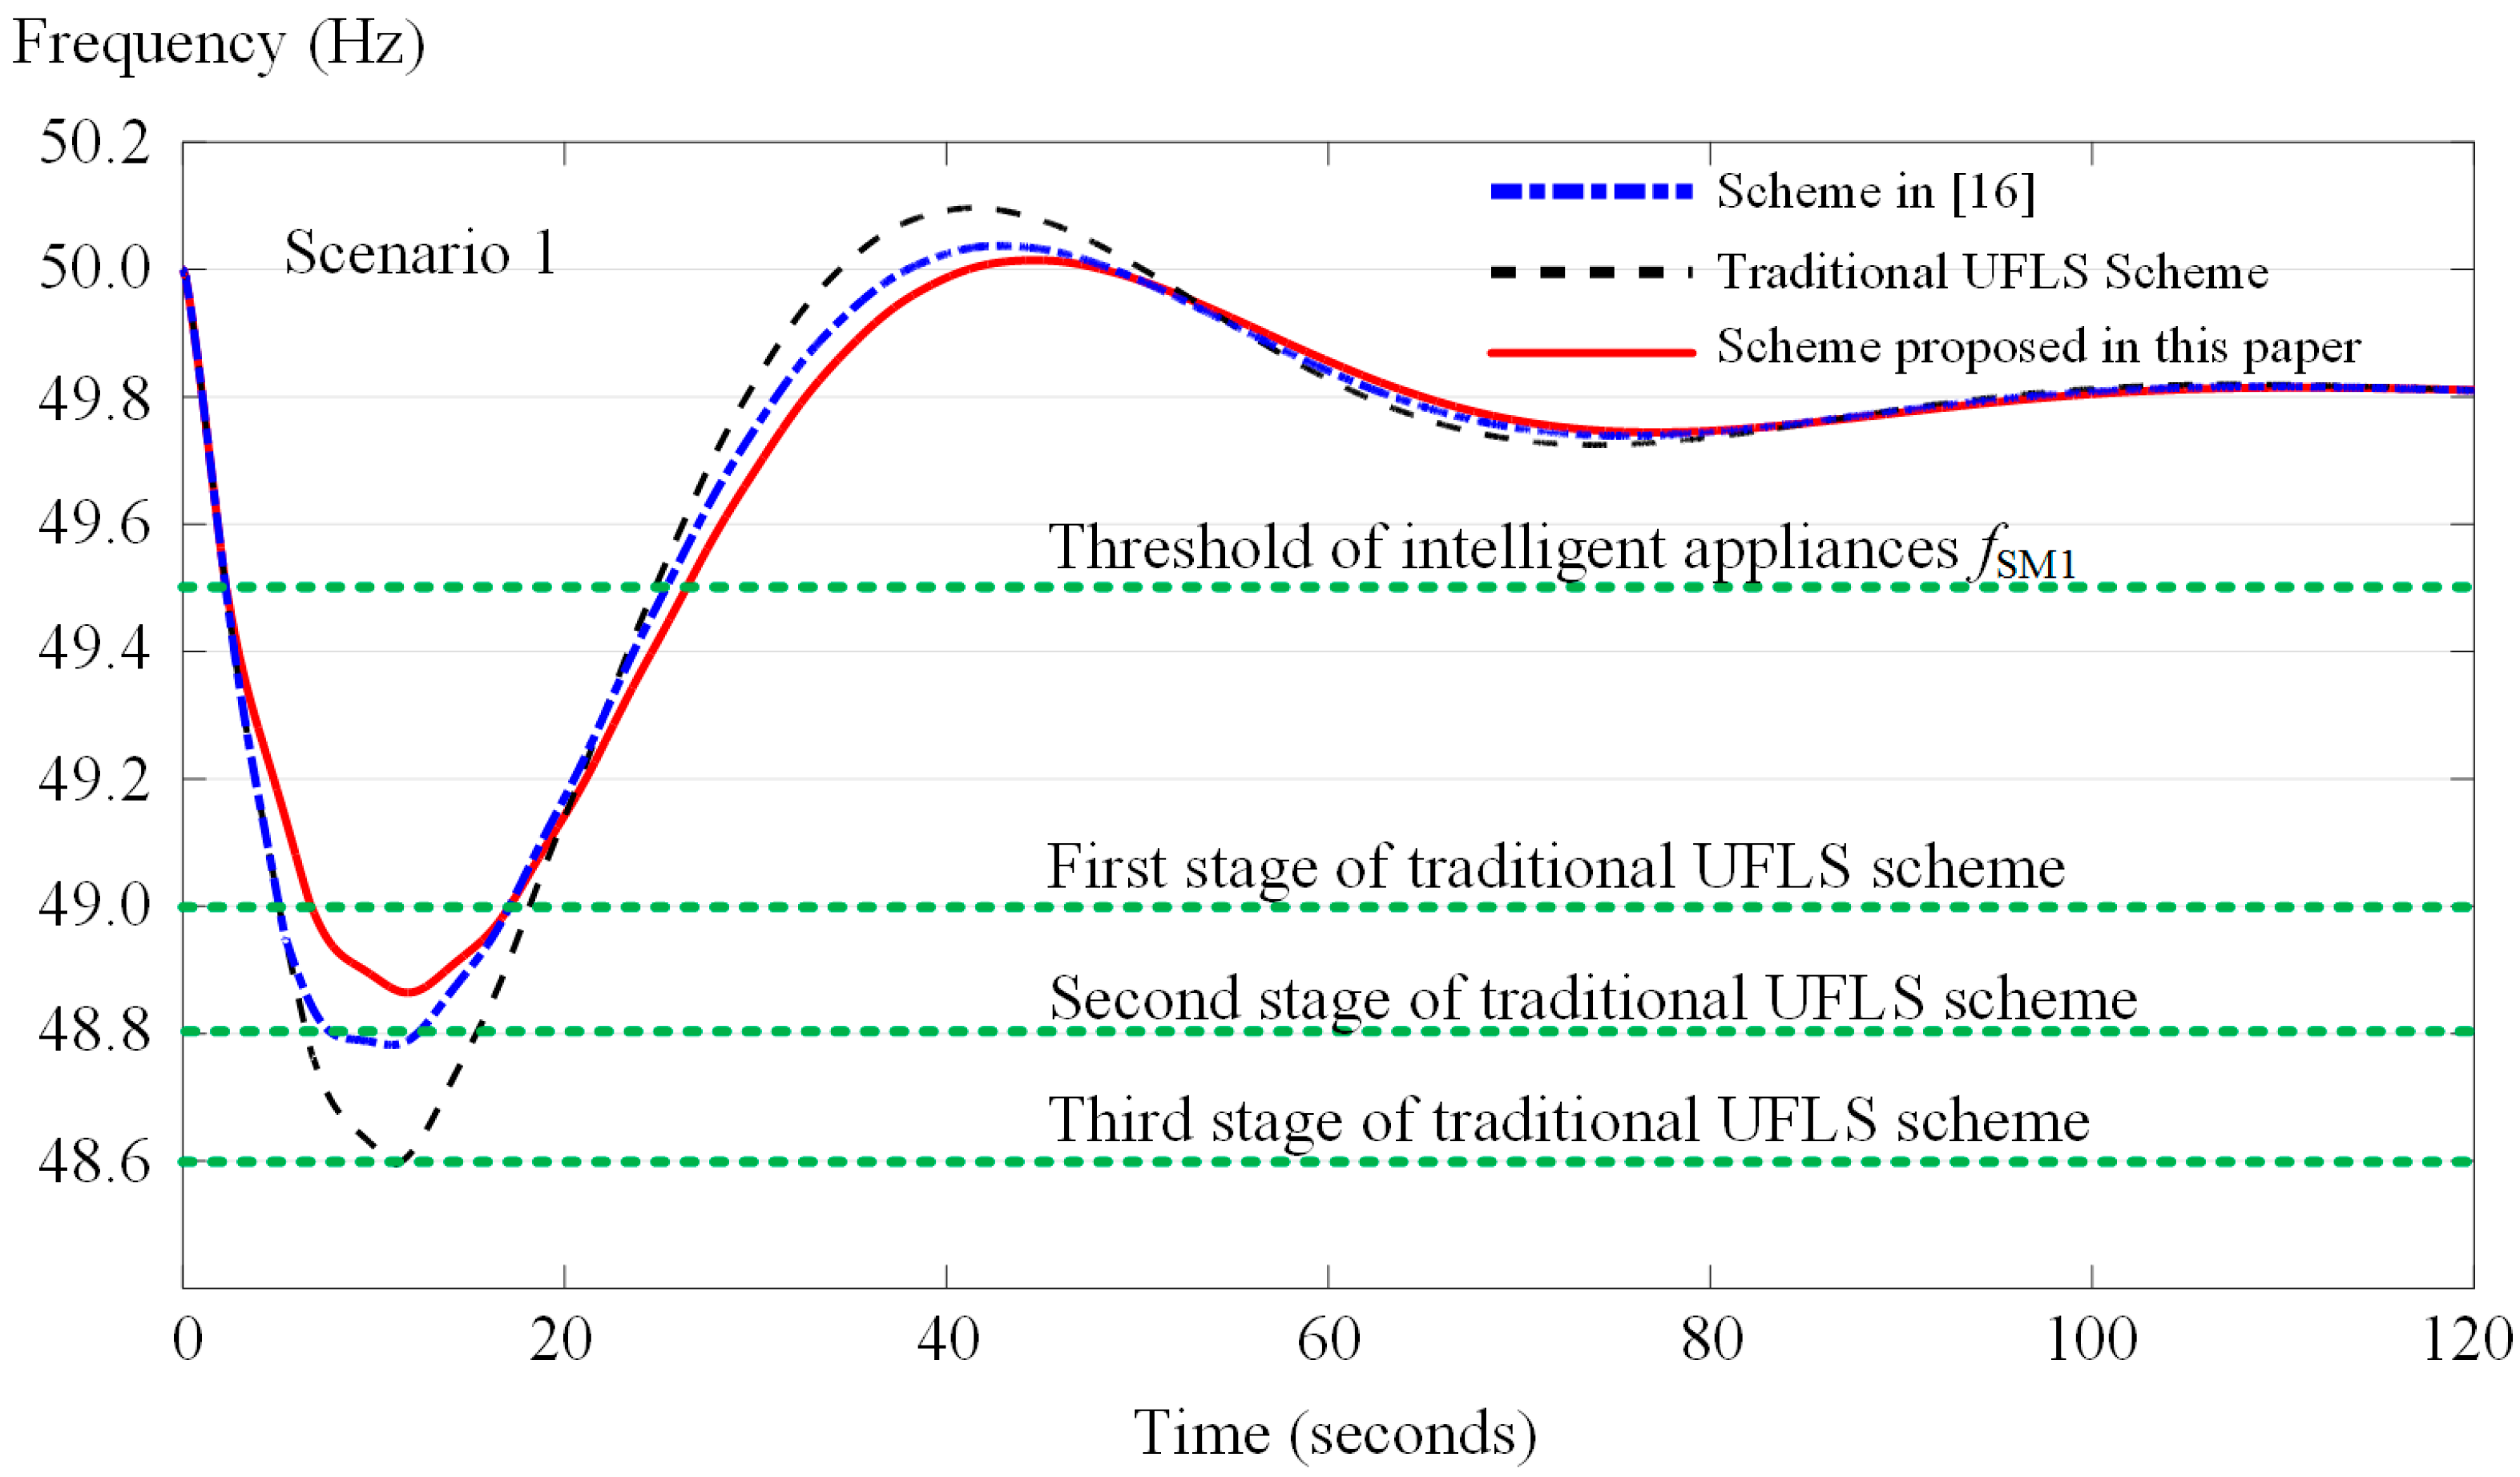
Scenario 1: Transmission lines N9–N12 and N5–N10 are disconnected because of the incorrect actions of the relay protection caused by a three-phase short-circuit fault between N9 and N12. Area A and area B are in isolated operation, and the receiving system is confronted with a high power vacancy after the disturbance. The frequency curves of the three aforementioned schemes are shown in Figure 8.
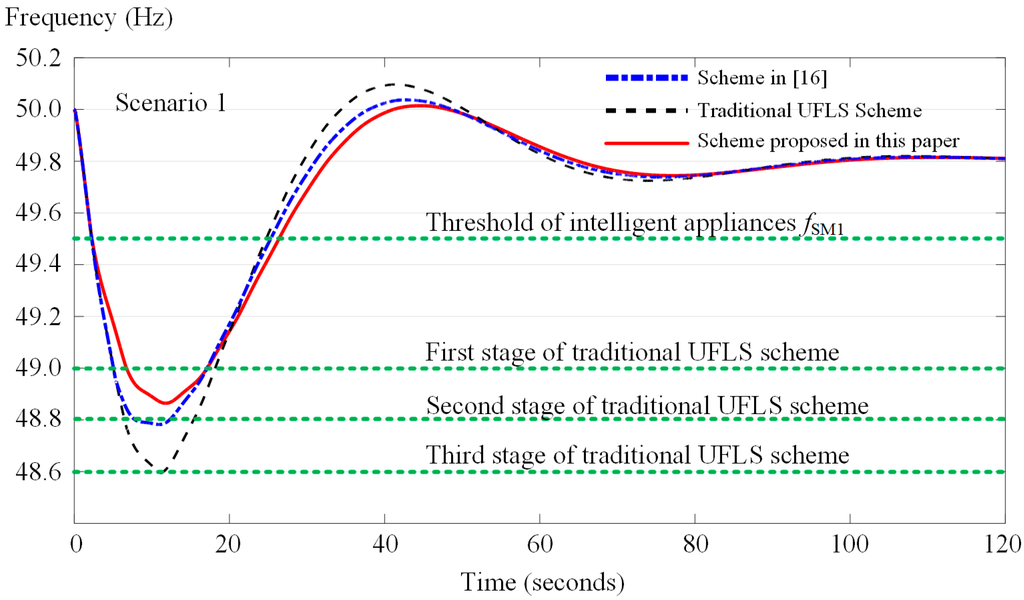
Figure 8.
Curves of frequency in Scenario 1 under the three comparison schemes.
In Scenario 1, when adopting the newly proposed method, the response index of the intelligent appliances is K = 0.156. When f < 49.5 Hz, the variation ratio of frequency |df/dt| = 0.238 > K; thus, the critical and non-critical intelligent appliances act simultaneously. When the frequency drops below 49.0 Hz, the first stage of the traditional UFLS scheme is initiated to trip some breakers of load buses.
When adopting the method of [16], the estimated power shortage exceeds the entire capacity of the distribution system; thus, the breakers of all 12 load buses are tripped as the frequency drops below 49.0 Hz.
When adopting the traditional UFLS scheme, all of the power loads in the system are tripped with the three-stage actions.
With the large power disturbance in Scenario 1, all power loads in the distribution network are tripped in the three schemes, whereas the scheme of this paper considers the minimum frequency drop amplitude. The early response of intelligent appliances can prevent serious frequency declines to a certain degree. Note that in this scenario, the disconnecting intelligent appliances cannot be reconnected to the network until the breakers at the load buses are closed again.
Scenario 2: Transmission lines N5–N10 and N8–N12 are disconnected because of the incorrect actions of the relay protection caused by a three-phase short-circuit fault between N5 and N10. The power vacancy of the receiving system is small. The frequency curves are shown in Figure 9.
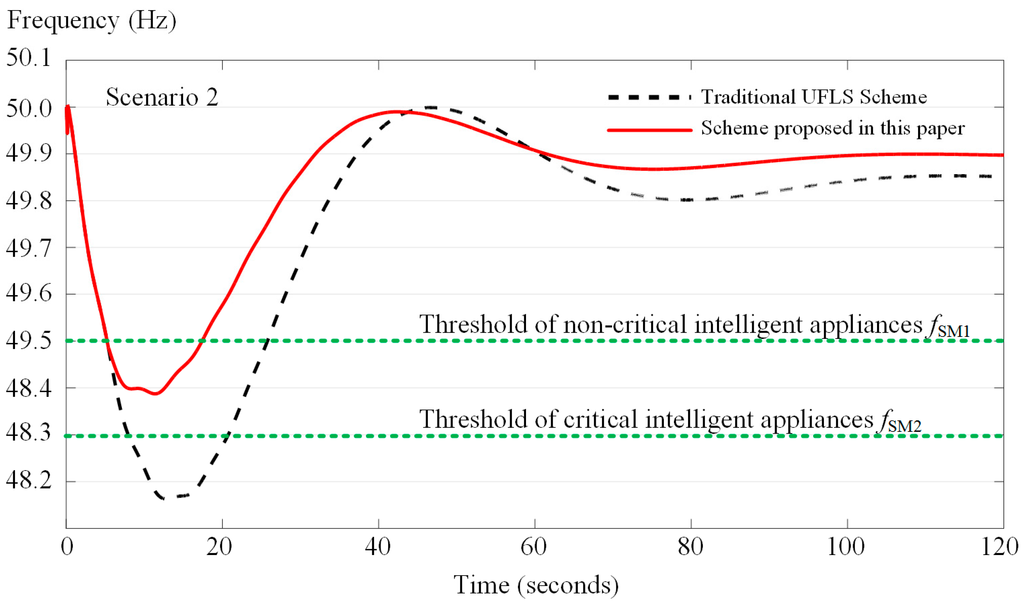
Figure 9.
Curves of frequency in Scenario 2 under the three comparison schemes.
In Scenario 2, when adopting the new method, the response index of the intelligent appliances is K = 0.098. When f < 49.5 Hz, the variation ratio of frequency |df/dt| = 0.082 < K; thus, only the non-critical intelligent appliances respond. The load shedding amount is 13.5 MW. Because the frequency does not decline below 49.3 Hz, the critical intelligent appliances do not change their state. Without this method, the minimum frequency value in this scenario is higher than 49.0 Hz, meaning that neither the traditional UFLS scheme nor the method in [16] is triggered, accounting for the fact that there are only two curves in the figure. After the frequency recovers, these appliances are reconnected.
In this scenario, although the frequency can recover without any actions, the proposed scheme still cuts off some intelligent appliances when the frequency drops below 49.5 Hz to prevent the frequency from dropping to a critical value. In fact, without any actions, the frequency will drop to 48.16 Hz, which is close to the threshold value of UFLS. If the system operators want to avoid this outcome, the scheme can be changed by adjusting K.
Scenario 3: The operation mode of the test system is changed by decreasing the 10 MW active power load of Area B. Transmission lines N9–N12 and N5–N10 are disconnected because of the incorrect actions of the relay protection caused by a three-phase short-circuit fault between N9–N12. The power vacancy of the receiving system is at a medium level. The frequency curves of three schemes are shown in Figure 10.
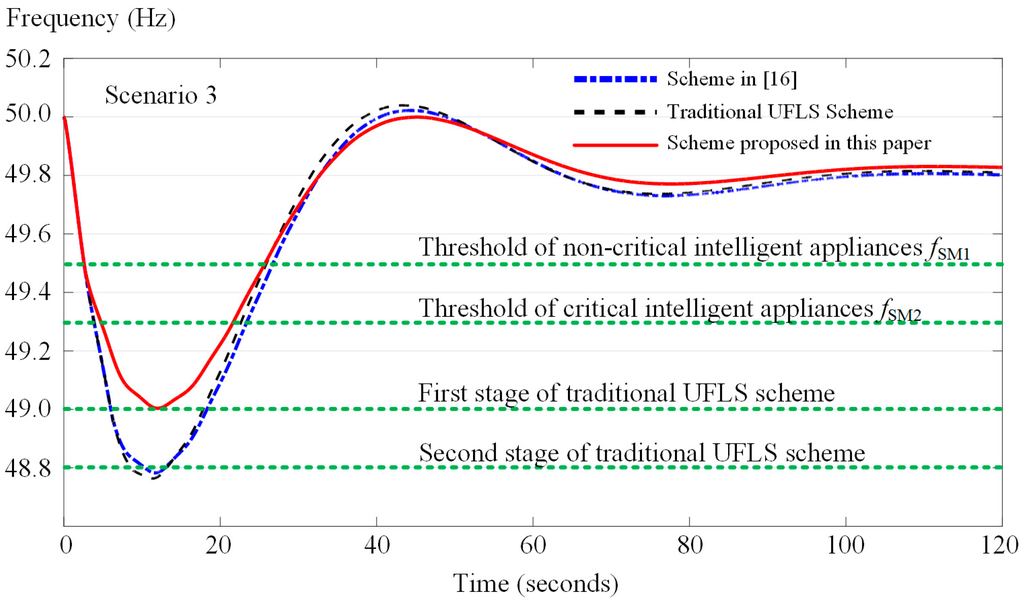
Figure 10.
Frequency curves in Scenario 1 under the three comparison schemes.
In Scenario 3, when adopting the new method, the response index of the intelligent appliances is K = 0.128. When f < 49.5 Hz, the variation ratio of frequency |df/dt| = 0.125 < K; thus, only the non-critical intelligent appliances respond. When the frequency drops below 49.3 Hz, the critical intelligent appliances also respond. Because the minimum frequency value is above 49.0 Hz, no further load shedding actions are executed. After the frequency recovers, the critical intelligent appliances are reconnected to the network because the breakers at the load buses have not been tripped.
When adopting the method in [16], the estimated power to achieve balance is 15.1 MW; thus, the load combination with seven load buses (N1001, N1002, N1006, N1009, N1010, N1011, and N1012) is selected, and the relevant breakers are tripped as the frequency drops below 49.0 Hz.
When adopting the traditional UFLS scheme, the first two stages’ actions are taken.
It is shown in Figure 10 that the scheme of this paper produces the best outcome and does not transcend the emergency threshold value of the frequency. Although the method in [16] employs a lower load shedding amount, the low frequency will cause load shedding at other buses in the transmission network. Moreover, the tripping of the breakers at the load buses impedes power recovery.
Compared to the other two UFLS schemes, the response rules of intelligent appliances have higher frequency thresholds in the new scheme, thereby preventing more serious frequency declines. Moreover, the critical intelligent appliances are turned on after several seconds of interruption, which has a positive effect on inhibiting frequency overshoot.
6. Conclusions
Under the environment of a cyber physical power system, we propose a new UFLS scheme that takes intelligent home appliances into consideration. The coordination of a traditional UFLS scheme and quick response resources on the customer side (e.g., intelligent home appliances) can maintain the frequency stability of a smart grid. The following conclusions can be drawn:
- (1)
- In the proposed method, the power shortage is calculated quickly using the frequency variation ratio. Combined with the different home appliance action strategies obtained by the real-time operation status, the load shedding scale can be significantly limited.
- (2)
- The early response of the intelligent home appliances can be used to replace part of the passive load shedding resources in the traditional scheme, thereby eliminating the effects of the fault in the power system and decreasing the cost of control.
- (3)
- Through the positive interaction of power flow and information flow, the coordination of demand-side resources with traditional power system controllable assets can enrich the means of control strategies and increase the flexibility and reliability of the power system.
Acknowledgments
This work is supported by the National Natural Science Foundation of China (Grant No. 51577030), the Projects of International Cooperation and Exchanges NSFC (Grant No. 51561145011), the National High-tech R&D Program of China (Grant No. 2015AA050202), a project of the State Grid Corporation (Modeling and Assessment of Cyber-Physical Coupling System for the Appliances of Power System Control Center), and the Fundamental Research Funds for the Central Universities (Grant No. KYLX15_0137).
Author Contributions
Qi Wang and Yi Tang conceived and designed the experiments; Qi Wang and Feng Li performed the experiments; Qi Wang analyzed the data and wrote the paper; Mengya Li helped analyze the data and edited the figures and tables. Yang Li and Ming Ni reviewed and refined the paper. All the authors read and approved the final manuscript.
Conflicts of Interest
The authors declare no conflict of interest. The funding sponsors had no role in the design of the study, in the collection, analysis, or interpretation of the data, in the writing of the manuscript, or in the decision to publish the results.
References
- Facchinetti, T.; Della Vedova, M.L. Real-time modeling for direct load control in cyber-physical power systems. IEEE Trans. Industr. Inform. 2011, 7, 689–698. [Google Scholar] [CrossRef]
- Liu, X.; Liu, X.; Li, Z. Cyber risk assessment of transmission lines in smart grids. Energies 2015, 8, 13796–13810. [Google Scholar] [CrossRef]
- Livieratos, S.; Vogiatzaki, V.; Cottis, P. A generic framework for the evaluation of the benefits expected from the smart grid. Energies 2013, 6, 988–1008. [Google Scholar] [CrossRef]
- Kundur, P. Power System Stability and Control; McGraw-Hill: New York, NY, USA, 1994. [Google Scholar]
- Estebsari, A.; Pons, E.; Huang, T.; Bompard, E. Techno-economic impacts of automatic undervoltage load shedding under emergency. Electr. Power Syst. Res. 2016, 131, 168–177. [Google Scholar] [CrossRef]
- Infield, D.G.; Short, J.; Home, C.; Freris, L.L. Potential for Domestic Dynamic Demand-side Management in the UK. In Proceedings of the IEEE Power Engineering Society General Meeting, Tampa, FL, USA, 24–28 June 2007.
- Govender, P.; Ramballee, A.; Moodley, S.A. A Load Shedding Controller for Management of Residential Loads During Peak Demand Periods. In Proceedings of the 7th IEEE AFRICON Conference in Africa, Windhoek, Namibia, 15–17 September 2007.
- Short, J.A.; Infield, D.G.; Freris, L.L. Stabilization of grid frequency through dynamic demand control. IEEE Trans. Power Syst. 2007, 22, 1284–1293. [Google Scholar] [CrossRef]
- Mathieu, J.L.; Koch, S.; Callaway, D.S. State estimation and control of electric loads to manage real-time energy imbalance. IEEE Trans. Power Syst. 2013, 28, 430–440. [Google Scholar] [CrossRef]
- Trudnowski, D.; Donnelly, M.; Lightner, E. Power-system rrequency and stability control using decentralized intelligent loads. In Proceedings of the IEEE/PES Transmission and Distribution Conference and Exhibition, Dallas, TX, USA, 21–24 May 2006.
- Samarakoon, K.; Ekanayake, J.; Jenkins, N. Investigation of domestic load control to provide primary frequency response using smart meters. IEEE Trans. Smart Grid 2012, 3, 282–292. [Google Scholar] [CrossRef]
- Chang-Chien, L.; An, L.N.; Lin, T.; Lee, W. Incorporating demand response with spinning reserve to realize an adaptive frequency restoration plan for system contingencies. IEEE Trans. Smart Grid 2012, 3, 1145–1153. [Google Scholar] [CrossRef]
- Ahsan, M.Q.; Chowdhury, A.H.; Ahmed, S.S.; Bhuyan, I.H.; Haque, M.A.; Rahman, H. Technique to develop auto load shedding and islanding scheme to prevent power system blackout. IEEE Trans. Power Syst. 2012, 27, 198–205. [Google Scholar] [CrossRef]
- De Boeck, S.; van Hertem, D. Integration of distributed PV in existing and future UFLS schemes. IEEE Trans. Smart Grid 2016. [Google Scholar] [CrossRef]
- Gu, W.; Liu, W.; Zhu, J.; Zhao, B.; Wu, Z.; Luo, Z.; Yu, J. Adaptive decentralized under-frequency load shedding for islanded smart distribution networks. IEEE Trans. Sustain. Energy 2014, 5, 886–895. [Google Scholar] [CrossRef]
- Laghari, J.A.; Mokhlis, H.; Karimi, M.; Abu Bakar, A.H.; Mohamad, H. A new under-frequency load shedding technique based on combination of fixed and random priority of loads for smart grid applications. IEEE Trans. Power Syst. 2015, 30, 2507–2515. [Google Scholar] [CrossRef]
- Sanaye-Pasand, M. Scrutiny of the Iranian national grid. IEEE Power Energy Mag. 2007, 5, 31–39. [Google Scholar] [CrossRef]
- Cai, Y.; Cao, Y.; Li, Y.; Huang, T. Cascading failure analysis considering interaction between power grids and communication networks. IEEE Trans. Smart Grid 2016, 7, 530–538. [Google Scholar] [CrossRef]
- Ettore, B.; Abouzar, E.; Tao, H.; Gianluca, F. A framework for analyzing cascading failure in large interconnected power systems: A post-contingency evolution simulator. Electr. Power Energy Syst. 2016, 81, 12–21. [Google Scholar]
- U.S. Energy Information Administration. Electric Power Annual 2014. Available online: http://www.eia.gov/electricity/annual/ (accessed on 7 July 2016).
- Vijayananda, W.M.T.; Samarakoon, K.; Ekanayake, J. Development of a demonstration rig for providing primary frequency response through smart meters. In Proceedings of the 45th International Universities Power Engineering Conference, Cardiff, Wales, UK, 31 August–3 September 2010.
- Xu, Z.; Ostergaard, J.; Togeby, M.; Marcus-Moller, C. Design and modelling of thermostatically controlled loads as frequency controlled reserve. In Proceedings of the IEEE Power Engineering Society General Meeting, Tampa, FL, USA, 24–28 June 2007.
- Sanaye-Pasand, M.; Seyedi, H. New centralised adaptive load- shedding algorithms to mitigate power system blackouts. IET Gener. Transm. Distrib. 2009, 3, 99–114. [Google Scholar]


© 2016 by the authors; licensee MDPI, Basel, Switzerland. This article is an open access article distributed under the terms and conditions of the Creative Commons Attribution (CC-BY) license (http://creativecommons.org/licenses/by/4.0/).