Article

A Selection Method for Power Generation Plants Used for Enhanced Geothermal Systems (EGS)

1
Tianjin Geothermal Research and Training Center, Tianjin University, Tianjin 300072, China
2
Key Laboratory of Efficient Utilization of Low and Medium Grade energy, Ministry of Education of the People’s Republic of China, Tianjin University, Tianjin 300072, China
*
Author to whom correspondence should be addressed.
Energies 2016, 9(8), 597; https://doi.org/10.3390/en9080597
Submission received: 11 June 2016 / Revised: 11 July 2016 / Accepted: 15 July 2016 / Published: 28 July 2016

Abstract

:
As a promising and advanced technology, enhanced geothermal systems (EGS) can be used to generate electricity using deep geothermal energy. In order to better utilize the EGS to produce electricity, power cycles’ selection maps are generated for people to choose the best system based on the geofluids’ temperature and dryness conditions. Optimizations on double-flash system (DF), flash-organic Rankine cycle system (FORC), and double-flash-organic Rankine cycle system (DFORC) are carried out, and the single-flash (SF) system is set as a reference system. The results indicate that each upgraded system (DF, FORC, and DFORC) can produce more net power output compared with the SF system and can reach a maximum net power output under a given geofluid condition. For an organic Rankine cycle (ORC) using R245fa as working fluid, the generated selection maps indicate that using the FORC system can produce more power than using other power cycles when the heat source temperature is below 170 °C. Either DF or DFORC systems could be an option if the heat source temperature is above 170 °C, but the DF system is more attractive under a relatively lower geofluid’s dryness and a higher temperature condition.

1. Introduction

Air pollution, greenhouse effects, and energy crises are considered to be the major challenges for sustainable human development, especially for people in developing countries. At present, renewable energy is gaining more and more attention not only because it can be naturally replenished on a human timescale [1], but also because of its environmentally friendly characteristics [2]. Enhanced geothermal systems (EGS) exploit geothermal resources from hot dry rocks through hydraulic simulation and uses the geothermal energy to generate electricity. EGS has enormous potential to produce base load electricity, particularly in view of the ubiquity of possible locations [3] compared to other renewable energies [4,5].
The EGS project was first conceived by the Los Alamos National Laboratory, in Los Alamos, New Mexico, United States, and an experiment was carried out at Fenton Hill, New Mexico. This project demonstrated the technical feasibility of mining hot dry rock geothermal energy [6,7,8]. Based on the experience from the Fenton Hill project, the United Kindom, Japan, France, Sweden, and the Federal Republic of Germany started to carry out EGS experiments, respectively, in order to further investigate the concept of creating a reservoir in crystalline rock in other geological settings [9,10,11,12]. Desert peak field drilled its first commercial production well to 1265 m, with geofluid temperature in excess of 204 °C. To date, several production wells have been drilled with wellhead temperatures between 146 °C and 157 °C and total flow rate between 113 t/h and 227 t/h [13]. The Australia company Geodynamics, located in Milton Queensland, developed EGS projects in Cooper Basin, Australia. A 1 MWe pilot plant was completed and the plant operated for 160 days with a wellhead flow rate of 68.4 t/h and wellhead temperature of 215 °C. Five wells have been drilled to date, and the depth of each well is 4421 m, 4358 m, 4221 m, 2640 m, and 4852 m, respectively [14,15]. A geothermal pilot plant using hot dry rock resources was also set up at Soultz-sous-Forets (France). This plant is made of three boreholes, with a depth of 5000 m, where the rock temperature exceeds 200 °C. [16].
EGS has been confirmed to be technically feasible by now. However, producing more electricity really depends on what power generation technology or system is used. Literature surveys show that, so far, very few studies have been found to present a method using maps to select the best power generation system for a corresponding EGS project, although studies on different kinds of power generation systems have been carried out by researchers. An 11.4 MW single-flash geothermal power plant in Denizli, Turkey was evaluated by using exergy analysis based on actual plant operation data [17]. It indicated that the plant is operating at a low efficiency for relatively large exergy destructions throughout several processes. Sarr and Mathieu [18] proposed six different modifications for double-flash power plants. Their study showed that the new designs could increase the specific output of the plant by about 5%. Wang et al [19] utilized a Kalina cycle to recover the heat of geothermal water from a flash geothermal power plant. Their analysis showed that there existed optimum flash pressure, ammonia-water turbine inlet pressure and temperature, corresponding to the maximum system exergy efficiency. Li and Lior [20] analyzed six different power plant systems including single-flash, double-flash, triple-expansion, double-expansion, single-expansion and triple-expansion cycles for EGS. It showed that the expansion type plants have an energy efficiency ranging from 30% to 37%, and the value of flash type plants ranges from 13% to 23%. Based on exergy analysis, Yari [21] carried out a comparative study between seven different geothermal power plants in order to find the best cycle configuration. It was shown that the regenerative organic Rankine cycle (ORC) with R123 as the working fluid has the maximum first-law efficiency (15.35%). Jalilinasrabady et al. [22] evaluated a single flash cycle and a double flash cycle at the Sabalan geothermal field in northwest Iran. Their analysis showed that the maximum net power output of the single flash system reached 31 MW; the maximum net power output of the double flash system could reach 9.7 MW.
From the studies mentioned above, some pilot plants using EGS in different regions confirmed that it was technically feasible to utilize EGS technology to exploit geothermal resources and convert them into electricity around the world. Moreover, it should be pointed out that, although many researchers have conducted research on different power generation systems [20,21,22], few studies have been carried out on power generation system selection for EGS based on the geothermal fluid conditions.
In this paper, power generation system selection maps are generated to make it easy to choose the best power cycle under a certain geofluid condition. The geofluid temperature range investigated is from 120 °C to 280 °C, and the dryness range is from 0.1 to 0.55. In order to obtain useful maps, optimizations on double-flash geothermal power systems (DF), flash-organic Rankine cycle systems (FORC), and double-flash-organic Rankine cycle systems (DFORC) are carried out, and single-flash (SF) systems are set as a reference system. The power increase ratio is used in comparison among different power generation systems.

2. Description of Power Generation Systems

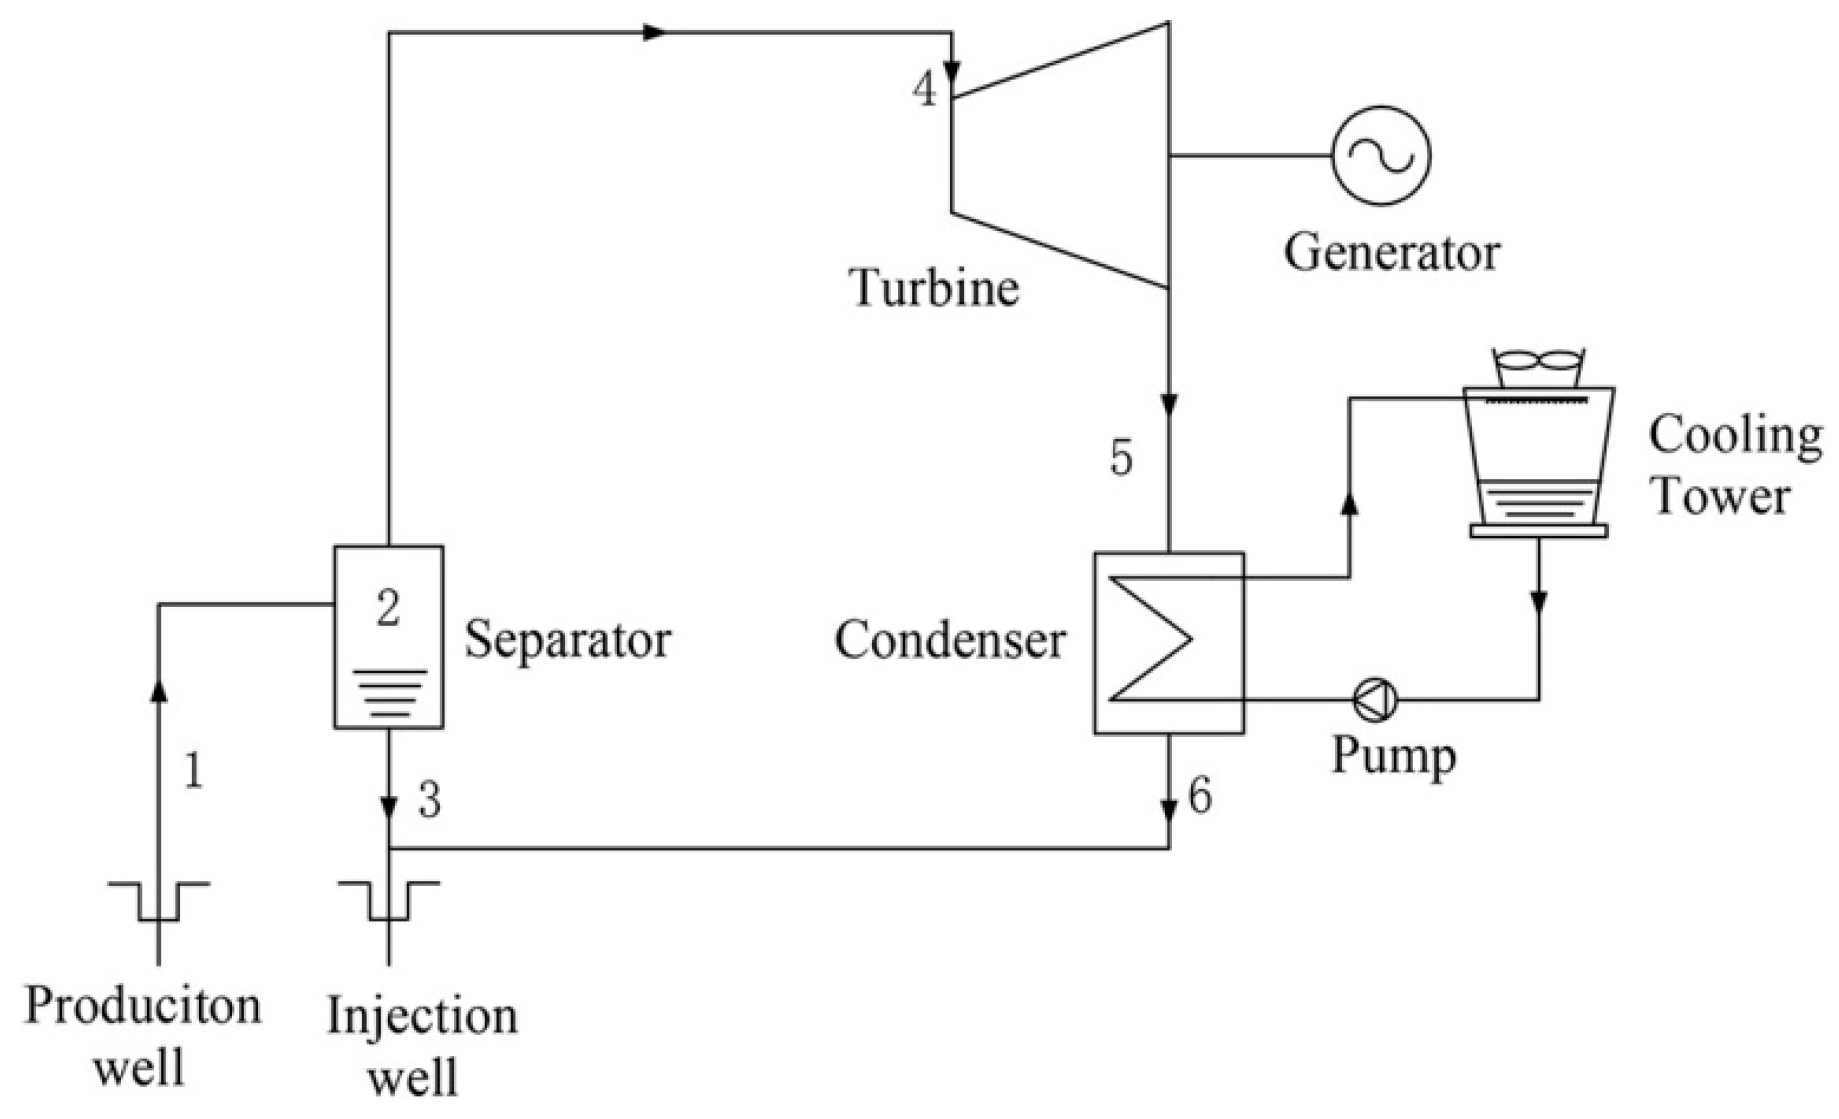
2.1. Single-Flash Geothermal Power Generation System

The schematic diagram of single-flash (SF) geothermal power generation system is shown in Figure 1. The geofluid from a geothermal reservoir is sprayed into a separator, which is at a pressure lower than that of the geofluid, causing some of the geofluid to rapidly vaporize (flash). The vapor then flows into a turbine to generate shaft work that drives a generator for electricity. The liquid that remains in the tank of the separator is reinjected into the reservoir. The exhaust steam from the turbine is directed to a vacuum condenser where it is condensed into water and is then reinjected into the reservoir.

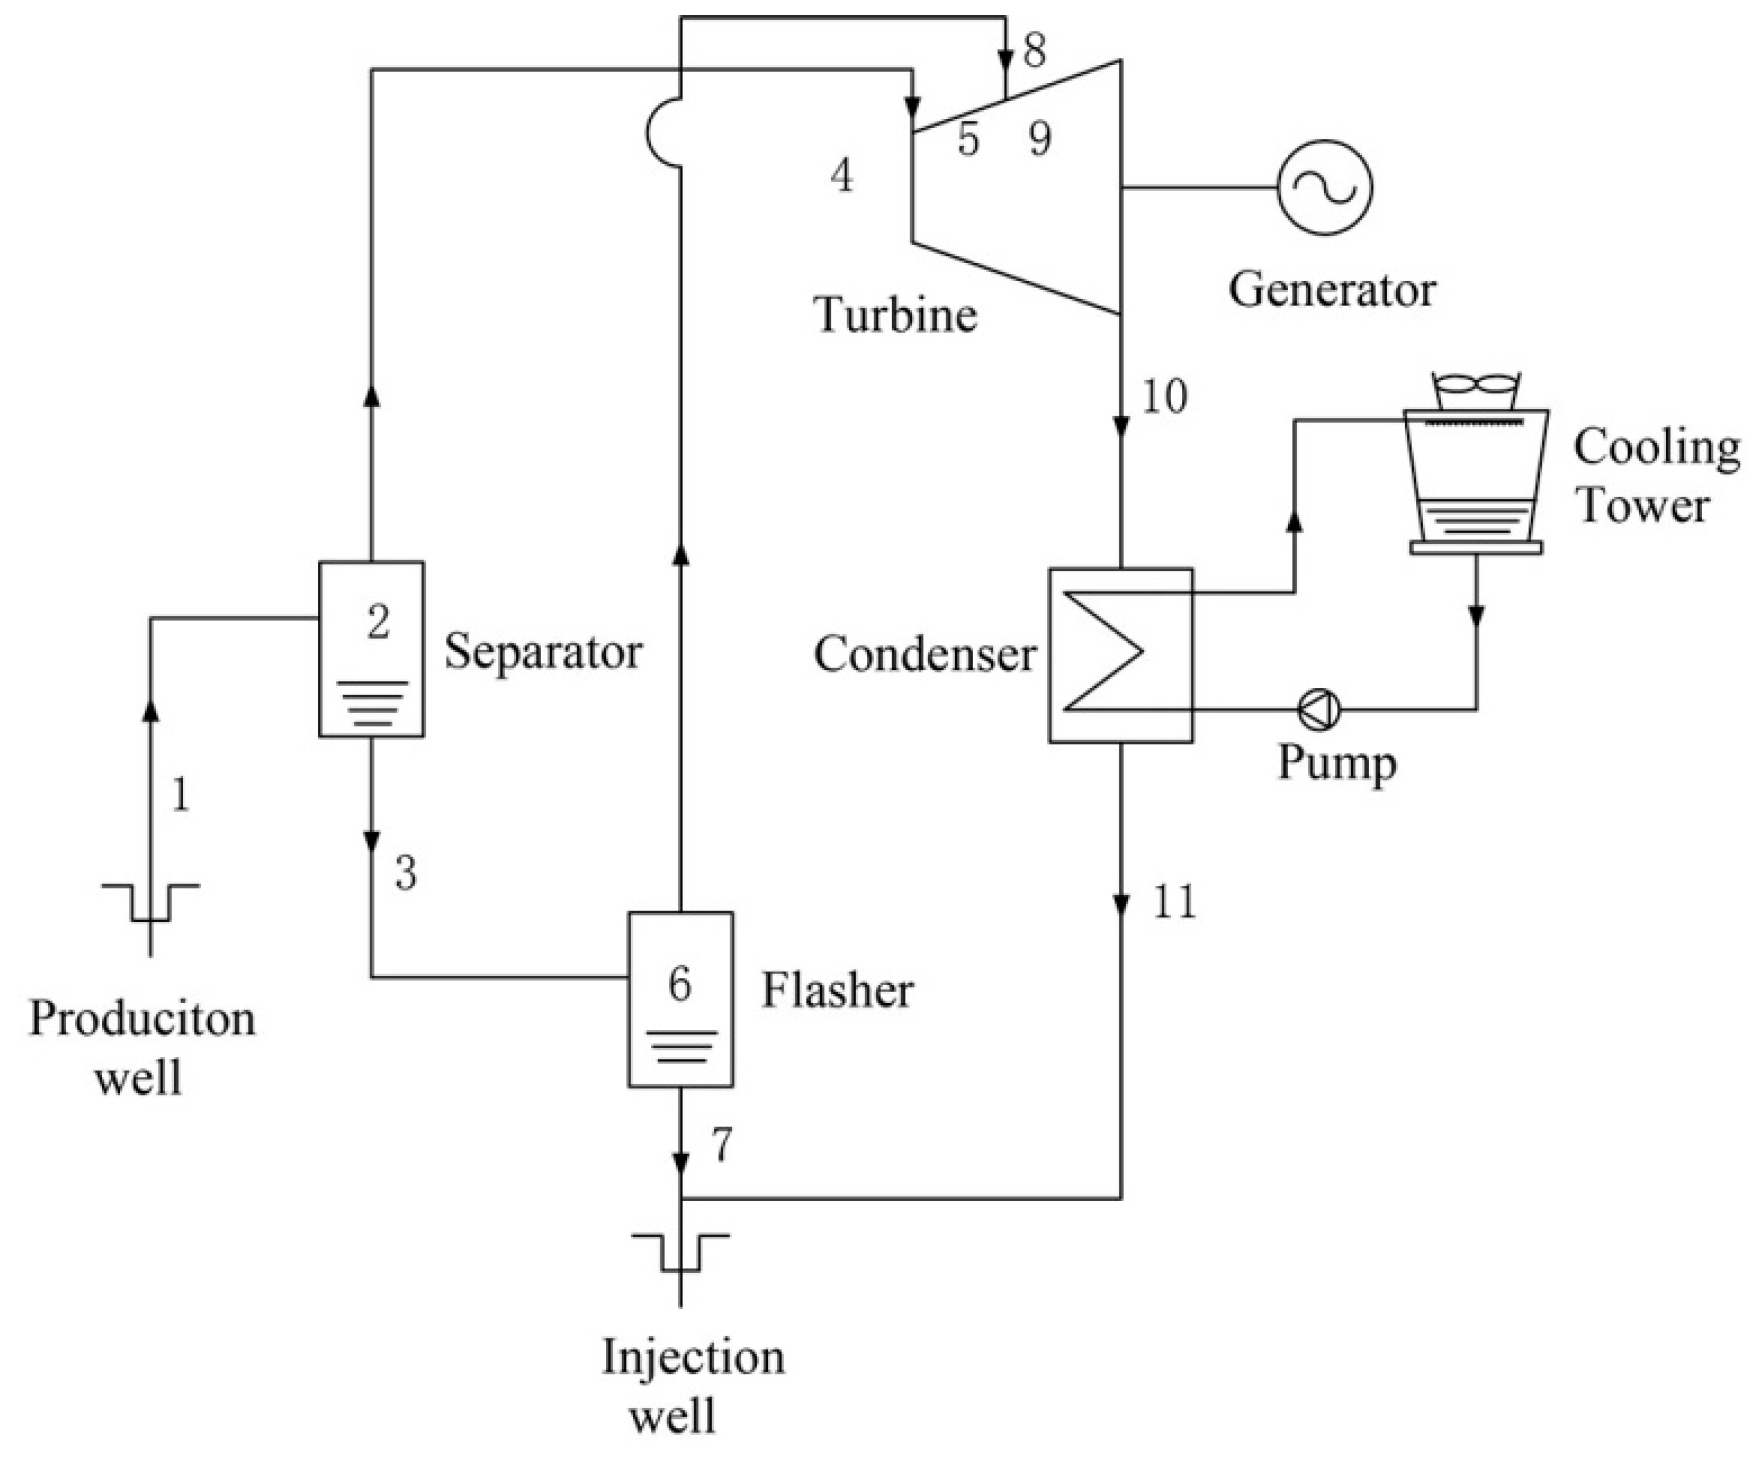
2.2. Double-Flash Geothermal Power Generation System

Figure 2 shows the schematic diagram of double-flash (DF) geothermal power generation system. The difference between the DF and SF is that a second-stage separator (flasher) is added for producing more steam using the brine coming from the first-stage separator. The steam from the first-stage separator is sent to the inlet of the turbine’s high pressure section, while the steam from the flasher is sent to the inlet of the turbine’s low pressure section.

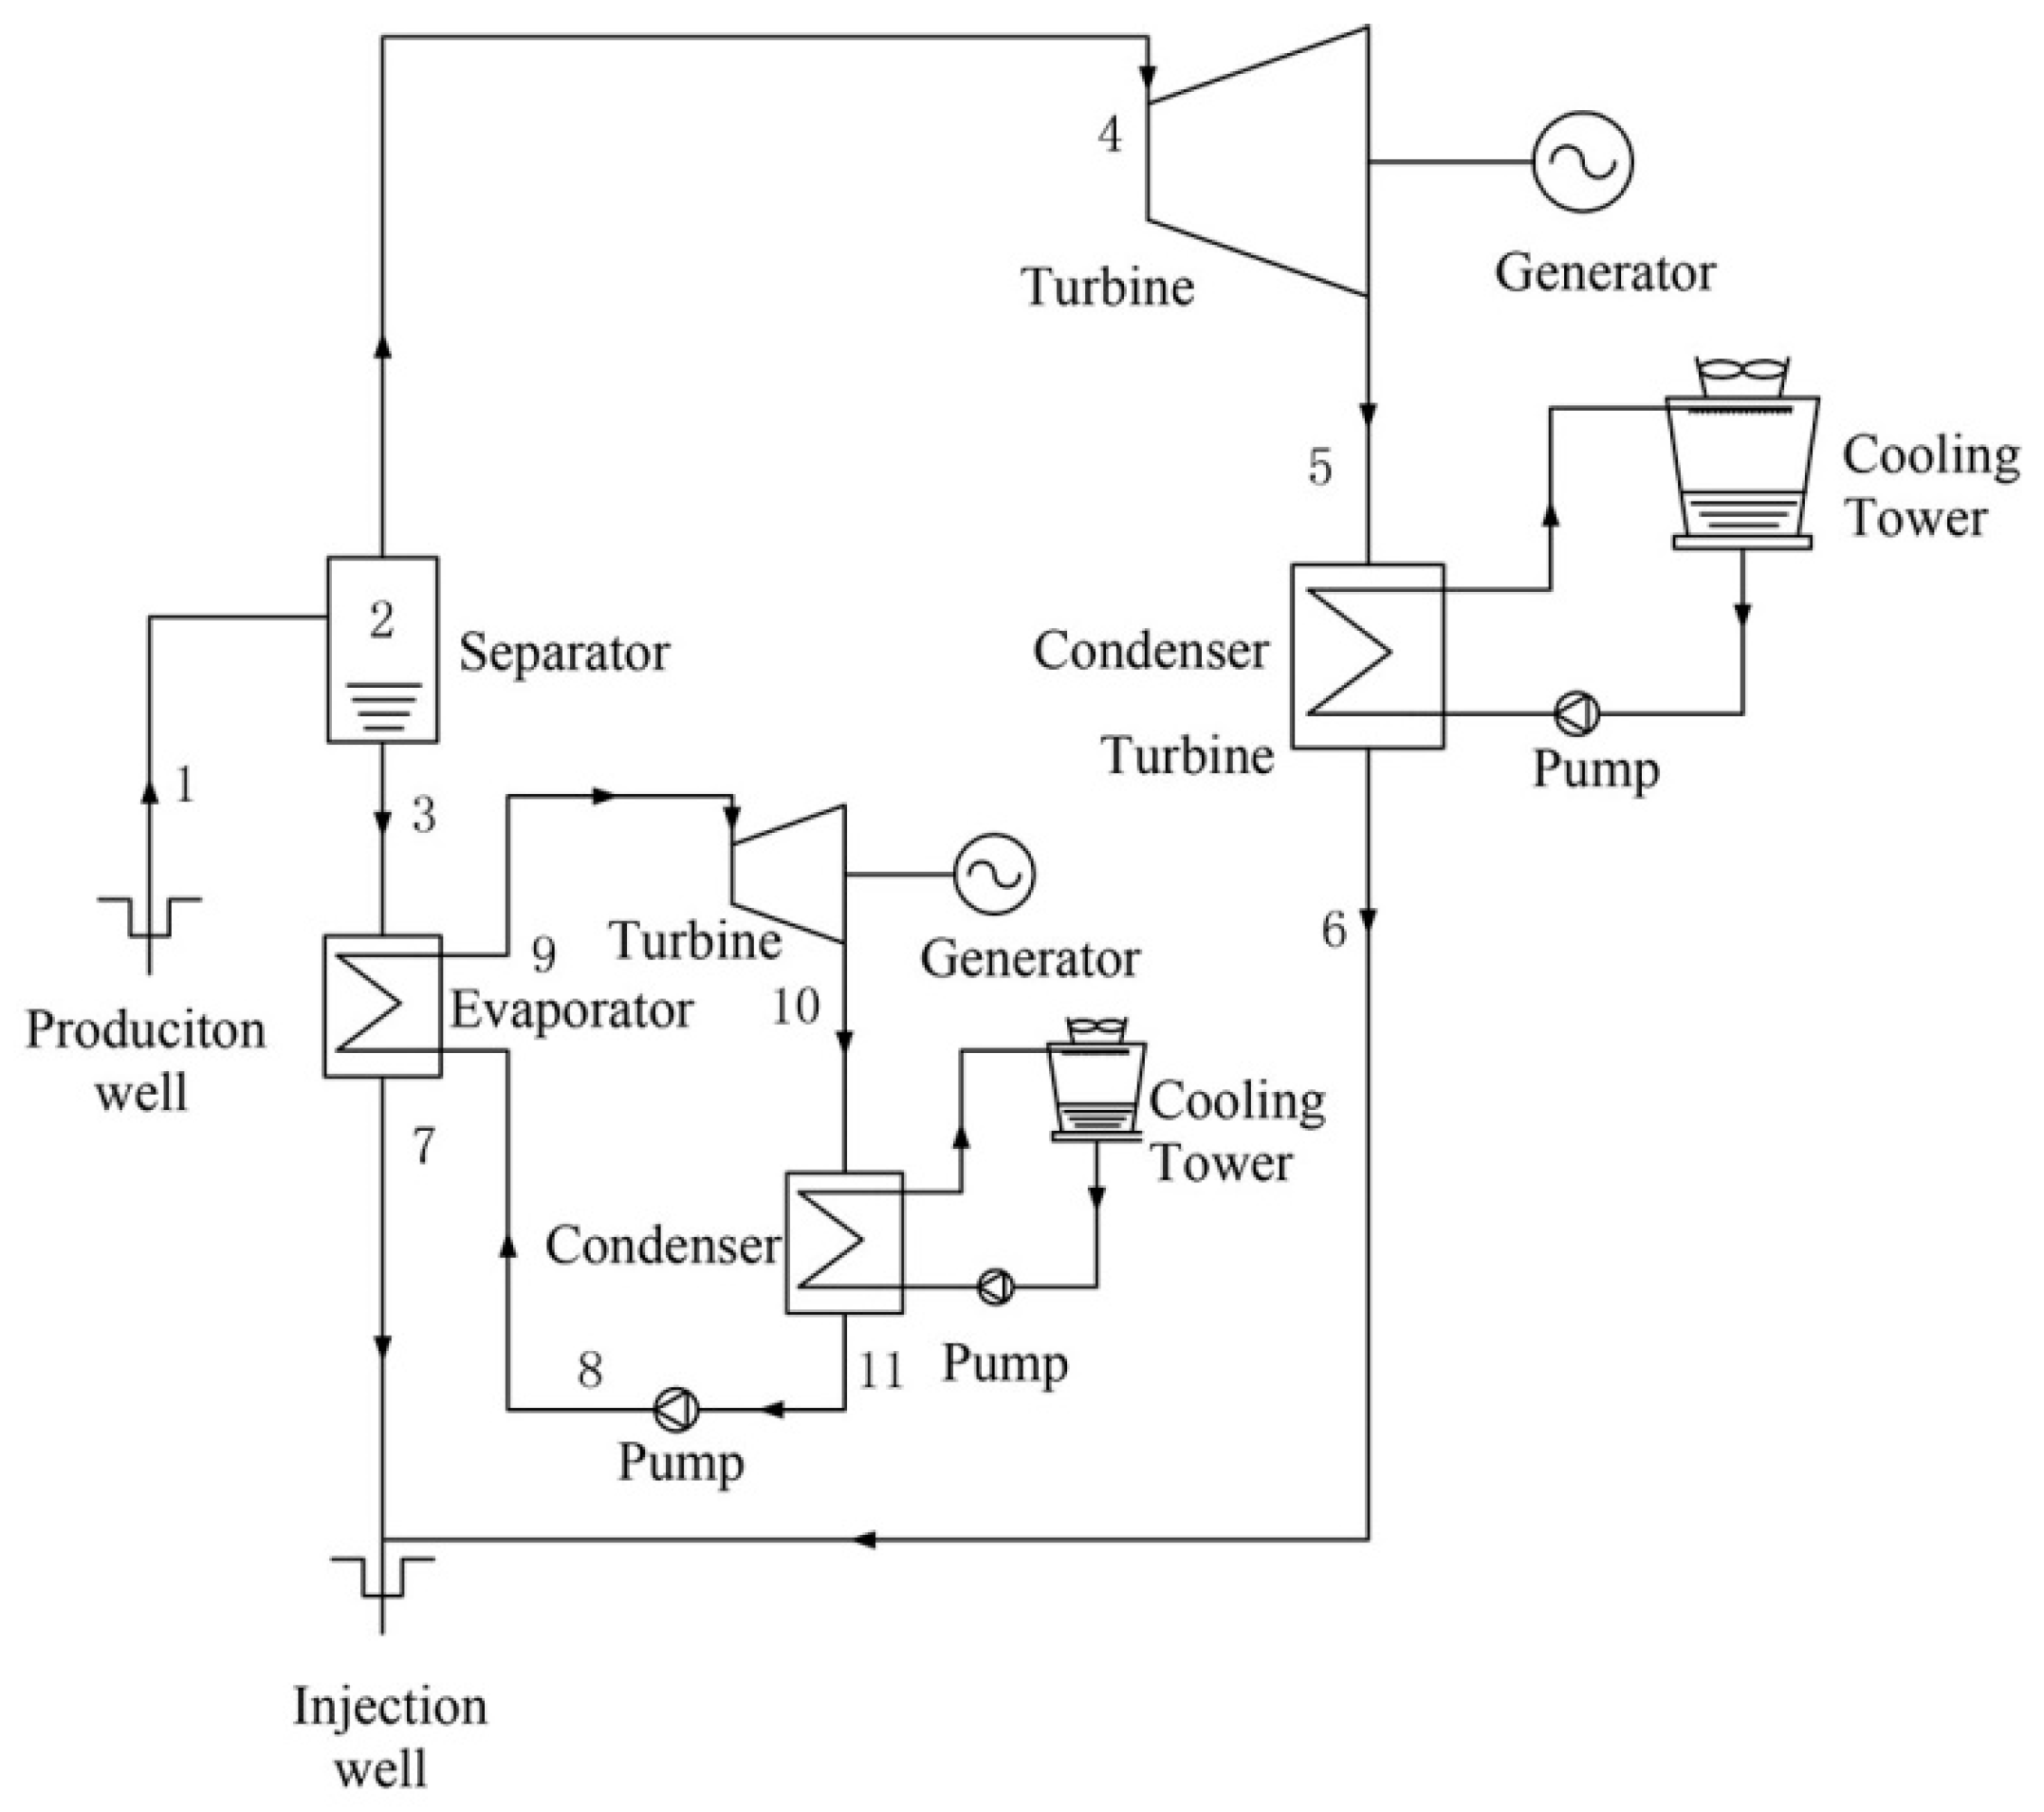
2.3. Flash-ORC Geothermal Power Generation System

The schematic diagram of the flash-ORC (FORC) geothermal power generation system is shown in Figure 3. The FORC system is a combination of the SF and ORC. The geofluid (brine) from the separator is sent to an evaporator to release its heat to the working fluid of the ORC, causing the working fluid to boil. The vapor of the working fluid is then sent to a turbine to drive a generator for electricity. The exhaust vapor from the turbine is condensed in a condenser, and is then pumped to the evaporator, forming an ORC power cycle.

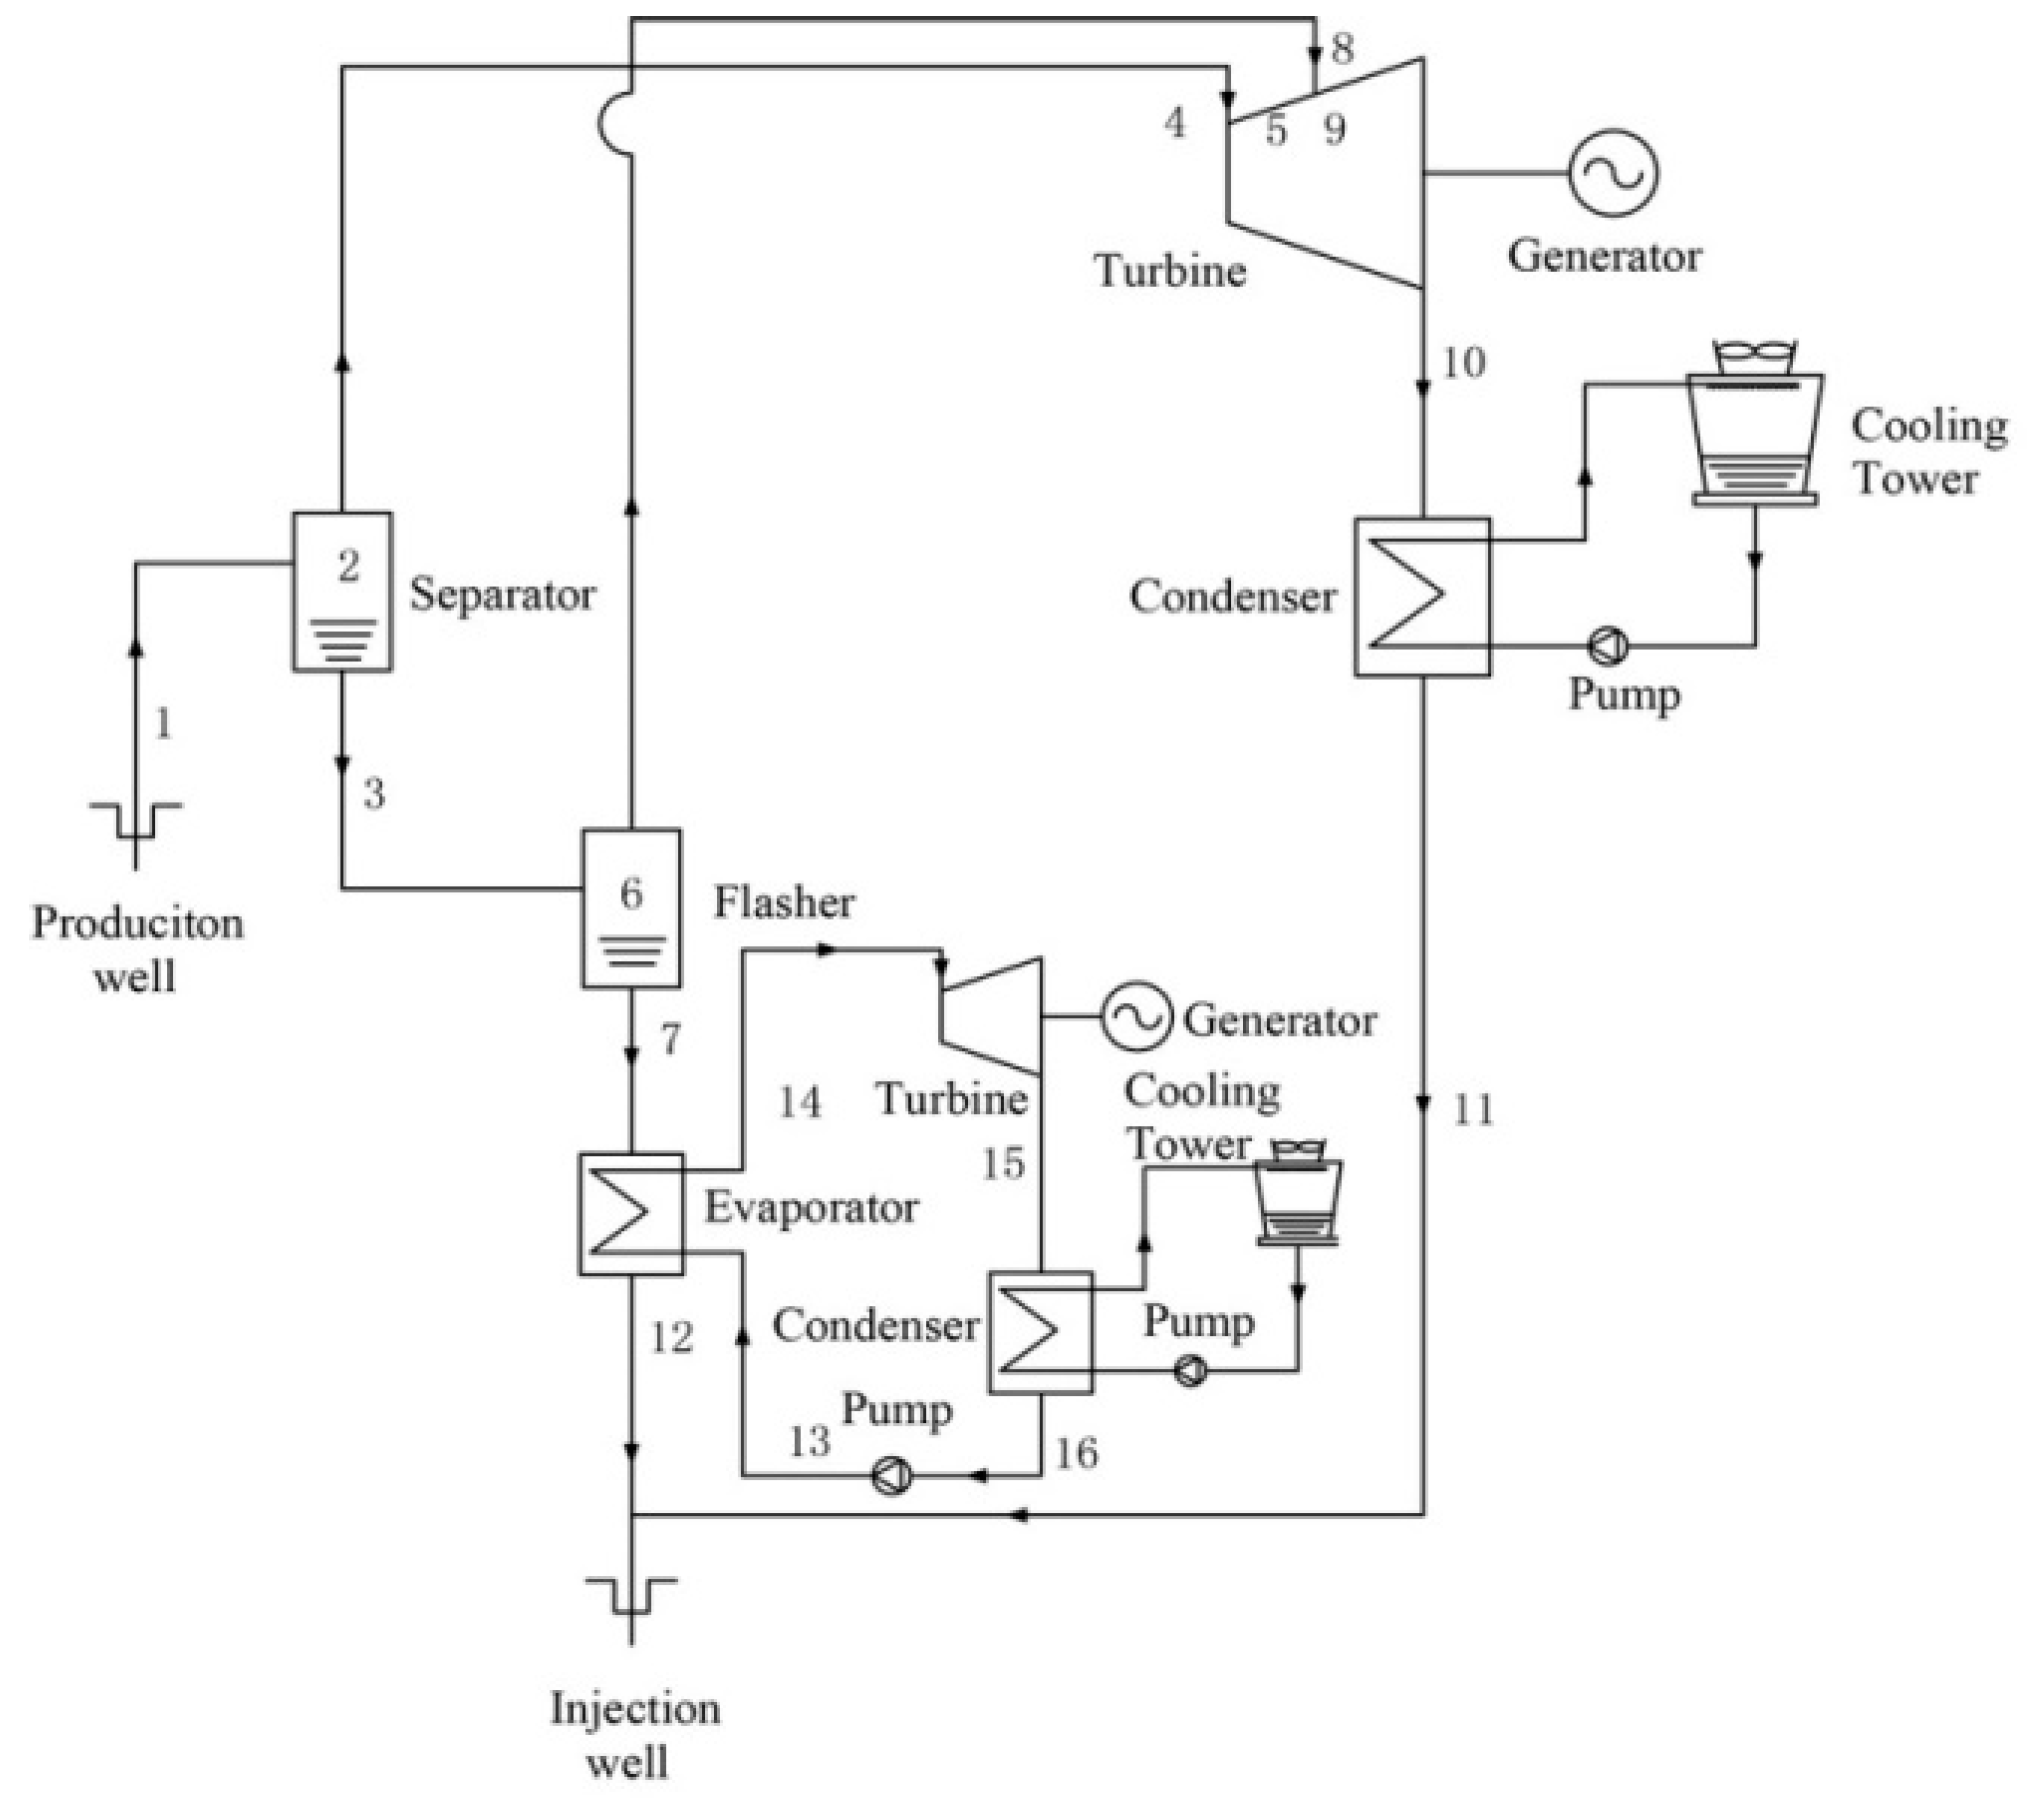
2.4. Double-Flash-ORC Geothermal Power Generation System

Figure 4 shows the schematic diagram of double-flash-ORC (DFORC) geothermal power generation system, which is a combination of DF and ORC. In this system, the geofluid (brine) coming from the flasher gives its heat to the working fluid of the ORC system.

3. Modeling and Methodology

3.1. Modeling

The models are constructed under the following assumptions and simplifications [21,23]:
(a)
Each geothermal power generation system operates under a steady state condition.
(b)
The flash process in the separator is modeled as an isenthalpic process.
(c)
Pure water properties (instead of geofluids’ properties) have been used in this study.
The models of thermodynamic processes of each component in flash power plant are presented as follows.
Separator or flasher:
h i n l e t = h i n
x i n = h i n h s a t _ l h s a t _ g h s a t _ l
m s a t _ l = ( 1 x i n ) m i n l e t
m s a t _ g = x i n m i n l e t
where h i n l e t represents the specific enthalpy at the inlet of separator or flasher; h i n is the specific enthalpy in the flasher and separator; x i n denotes the steam dryness in the flasher or separator; h s a t _ l is the specific enthalpy at saturated liquid curve; h s a t _ g is the specific enthalpy at saturated gas curve; m s a t _ l is the mass flow rate at saturated liquid curve; m s a t _ g is the mass flow rate at saturated gas curve; and m i n l e t represents the mass flow rate at the inlet separator or flasher.
Turbine:
η t = h t _ i n l e t h t _ o u t l e t h t _ i n l e t h t _ s
W t = m t _ i n l e t ( h t _ i n l e t h t _ o u t l e t )
W n e t = η g W t
where η t is the isentropic efficiency of the turbine; W t is the technical work of the turbine; h t _ i n l e t and h t _ o u t l e t represent the specific enthalpy at inlet and outlet of the turbine, respectively. η g is the generator efficiency.
Power consumption of pump:
W p = m f p η p ρ f
where W p is the power consumption of pump; m f is the fluid mass flow rate; p is the pressure of the pump; and η p is the pump’s efficiency; ρ f is the fluid density.
Total net power output of the power generation system:
W n e t _ f l a s h = η m η g W t W p
where η m is the mechanical efficiency; and W n e t _ f l a s h is the net power output of the flash plant.
The modeling equations for the ORC system are as follows:
Heat transfer process in the evaporator:
Q e v a = m g w ( h g w _ i n l e t h g w _ o u t l e t ) = m w f ( h e v a _ o u t l e t h e v a _ i n l e t )
where Q e v a denotes the heat load; m g w is the geothermal water mass flow rate; h g w _ i n l e t and h g w _ _ o u t l e t represent the specific enthalpy of geothermal water at inlet and outlet of the evaporator, respectively; h e v a _ _ o u t l e t and h e v a _ _ i n l e t are the specific enthalpy of working fluid at outlet and inlet of the evaporator, respectively.
Turbine isentropic efficiency and power output:
η t _ o r c = h e v a _ o u t l e t h t _ o u t l e t h e v a _ o u t l e t h t _ o u t l e t _ s
W t _ o r c = m w f ( h e v a _ o u t l e t h t _ o u t l e t _ s ) η t _ o r c = m w f ( h e v a _ o u t l e t h t _ o u t l e t )
where η t _ o r c is the isentropic efficiency of the turbine in ORC system; W t _ o r c is the technical work of the ORC system; and h t _ _ o u t l e t and h t _ _ o u t l e t _ s are the specific enthalpy of working fluid at outlet of the turbine and the corresponding specific enthalpy under isentropic conditions.
Heat transfer process in the condenser:
Q c o n = m w f ( h t _ o u t l e t h c o n _ o u t l e t ) = m c w ( h c w _ o u t h c w _ i n )
where Q c o n is the heat load in condenser; h c o n _ o u t l e t is the specific enthalpy of working fluid at outlet of the condenser; h c w _ _ o u t l e t and h c w _ _ i n l e t are the specific enthalpy of cooling water at outlet and inlet of the condenser, respectively; m c w is the cooling water flow rate.
Power consumption of working fluid pump:
W p _ w f = m w f ( p w f _ o u t l e t p w f _ i n l e t ) η p , w f ρ w f
Power consumption of cooling water pump:
W p _ c w = m c w ( p c w _ o u t l e t p c w _ i n l e t ) η p , c w ρ c w
where W p _ w f and W p _ c w are the power consumption of working fluid and cooling water pumps, respectively; p w f _ o u t l e t and p w f _ i n l e t are the pressure at outlet and inlet of the working fluid pump; p c w _ i n l e t and p c w _ o u t l e t are the pressure at inlet and outlet of the cooling water pump; ρ w f and ρ c w are the density of the working fluid and cooling water, respectively; η p _ w f and η p _ c w are the isentropic efficiency of the working fluid pump and cooling water pump, respectively.
Net power output of the ORC system:
W n e t _ o r c = η m η g W t _ o r c W p _ w f W p _ c w
where W n e t _ o r c is the net power output of the ORC system; and
W n e t _ s y s = W n e t _ f l a s h + W n e t _ o r c
where W n e t _ s y s is the total net power output of the combined system.
In order to obtain a useful selection map, we define the net power increase ratio as the criterion to evaluate the DF, FORC, and DFORC systems. The power increase ratio is defined as:
η i n c = W n e t _ s y s W n e t _ s f W n e t _ s f
where W n e t _ s f is the net power output of the SF system.

3.2. Methodology

The optimization analysis in this paper is carried out using software EES (Academic Professional V9.901), manufactured by F-Chart Software company in Madison, Wisconsin, United States [24]. The SF system is set as a reference system. DF, FORC, and DFORC systems are proposed to replace the SF system. The net power output increase ratio is the criteria to determine which system is the best choice to get more power output, compared with the SF system. Relevant parameters in the calculation are presented in Table 1 and Table 2, respectively.
Firstly, DF, FORC, and DFORC systems are optimized under a condition with constant temperature and steam dryness in order to get the optimal running condition for each system. Secondly, the three systems are optimized under conditions with different temperature and steam dryness. Finally, comparing the results of the three systems, we classified them based on the net power increase ratio.

4. Optimization of Parameters

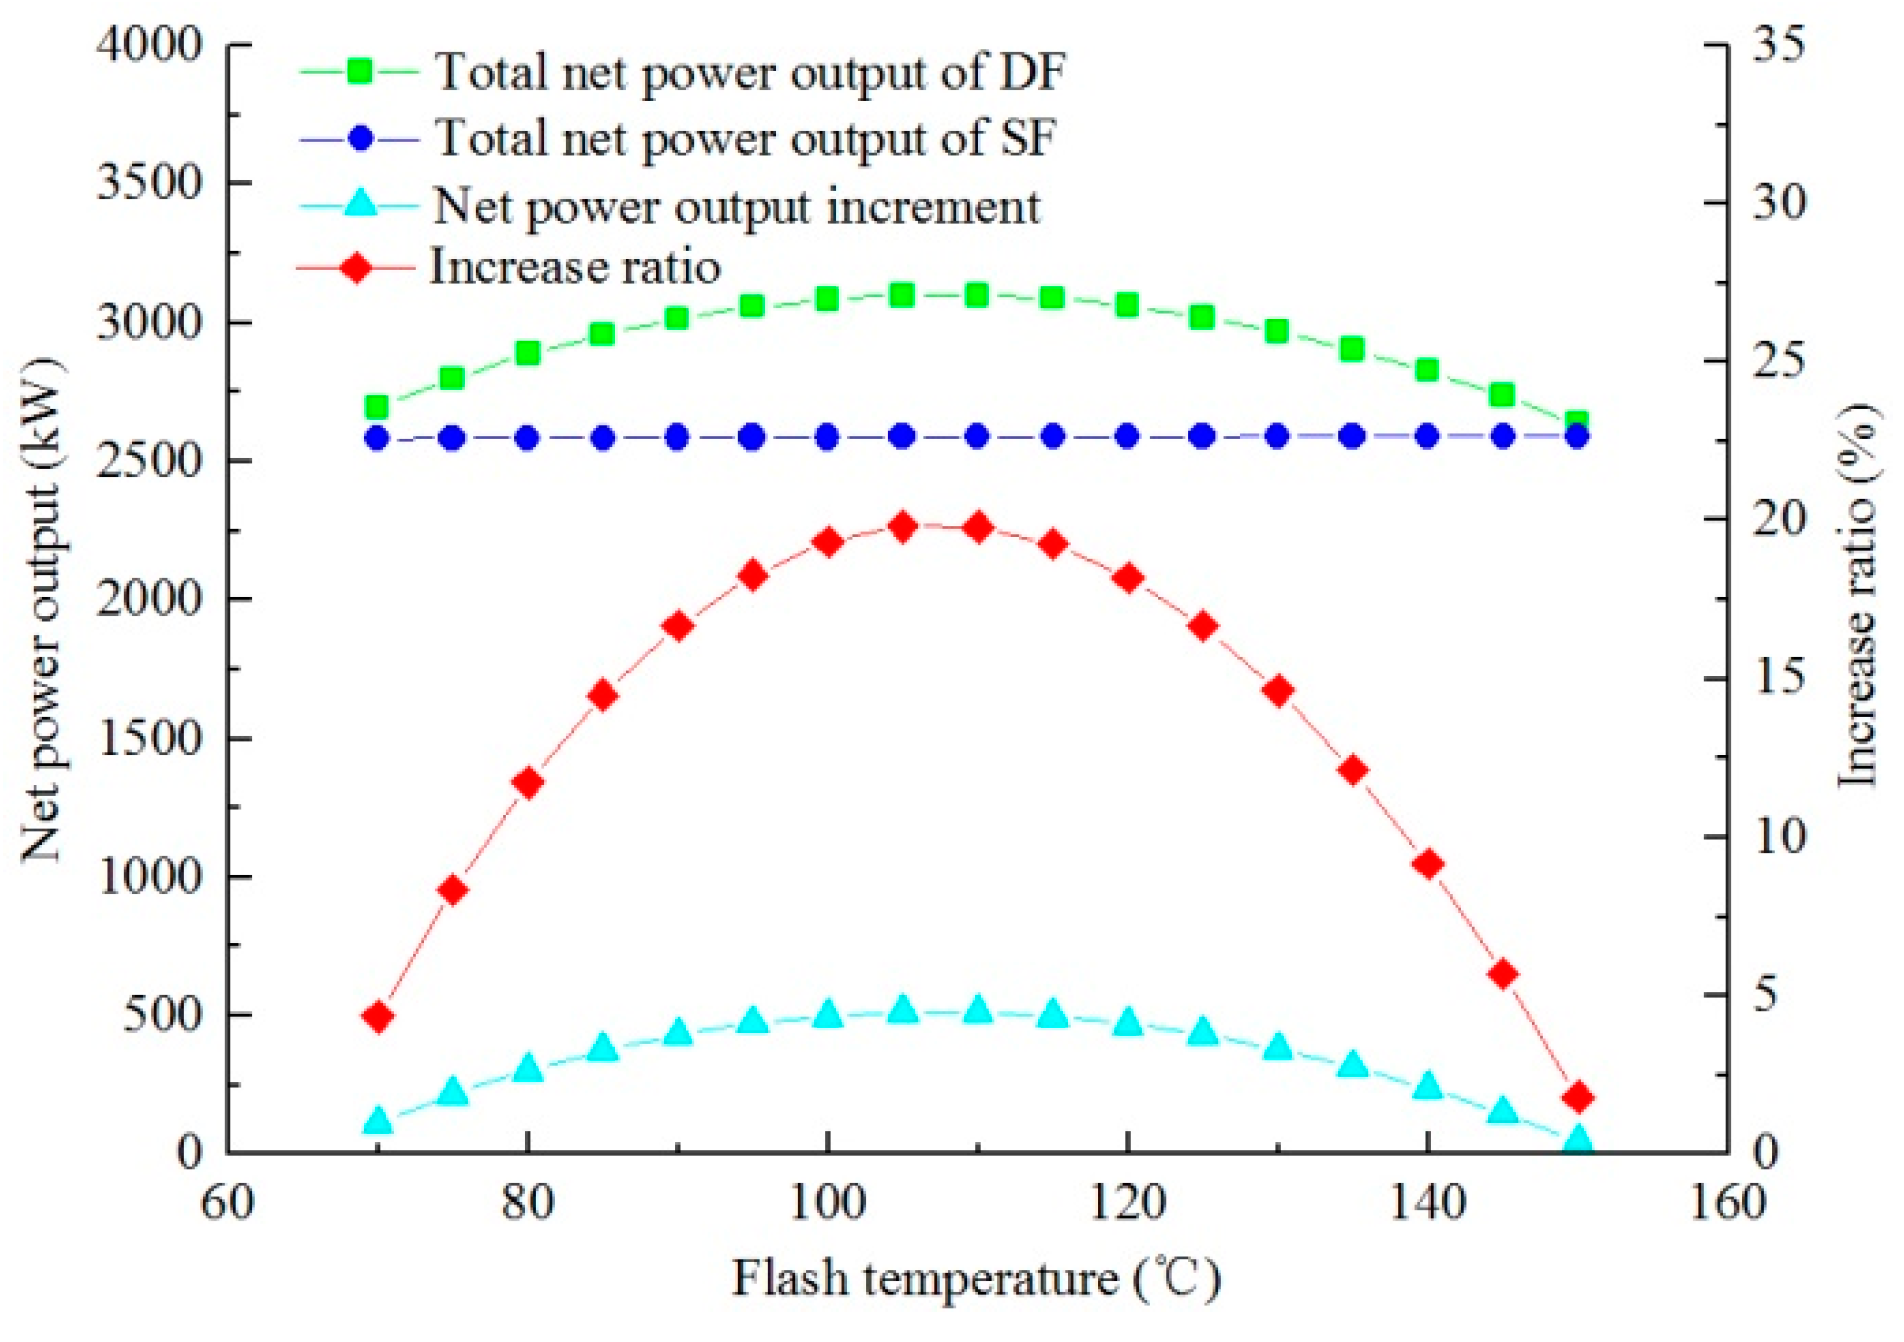
4.1. Optimization of Flash Temperature in the DF System

Figure 5 shows the variations of net power output of DF with flash temperature at geofluid temperature 160 °C, steam dryness 0.2, and geofluid rate 150 t/h. By comparing DF with SF, it is clear that DF system can produce more electricity. Obviously, the net power output increment rises at first and then decreases, and it has an optimum value at flash temperature of 110 °C. Two factors are responsible for the phenomenon above: one is the steam that is generated from the flasher and supplied to the turbine, the other is the steam’s specific available energy, which is a function of temperature and pressure. Higher flash temperature (higher flash pressure) results in higher specific available energy but with less steam; lower flash temperature (lower flash pressure) leads to lower specific available energy but with more steam. Therefore, an optimum flash temperature exists for DF system at the given condition, at which temperature it can produce the maximum electricity.

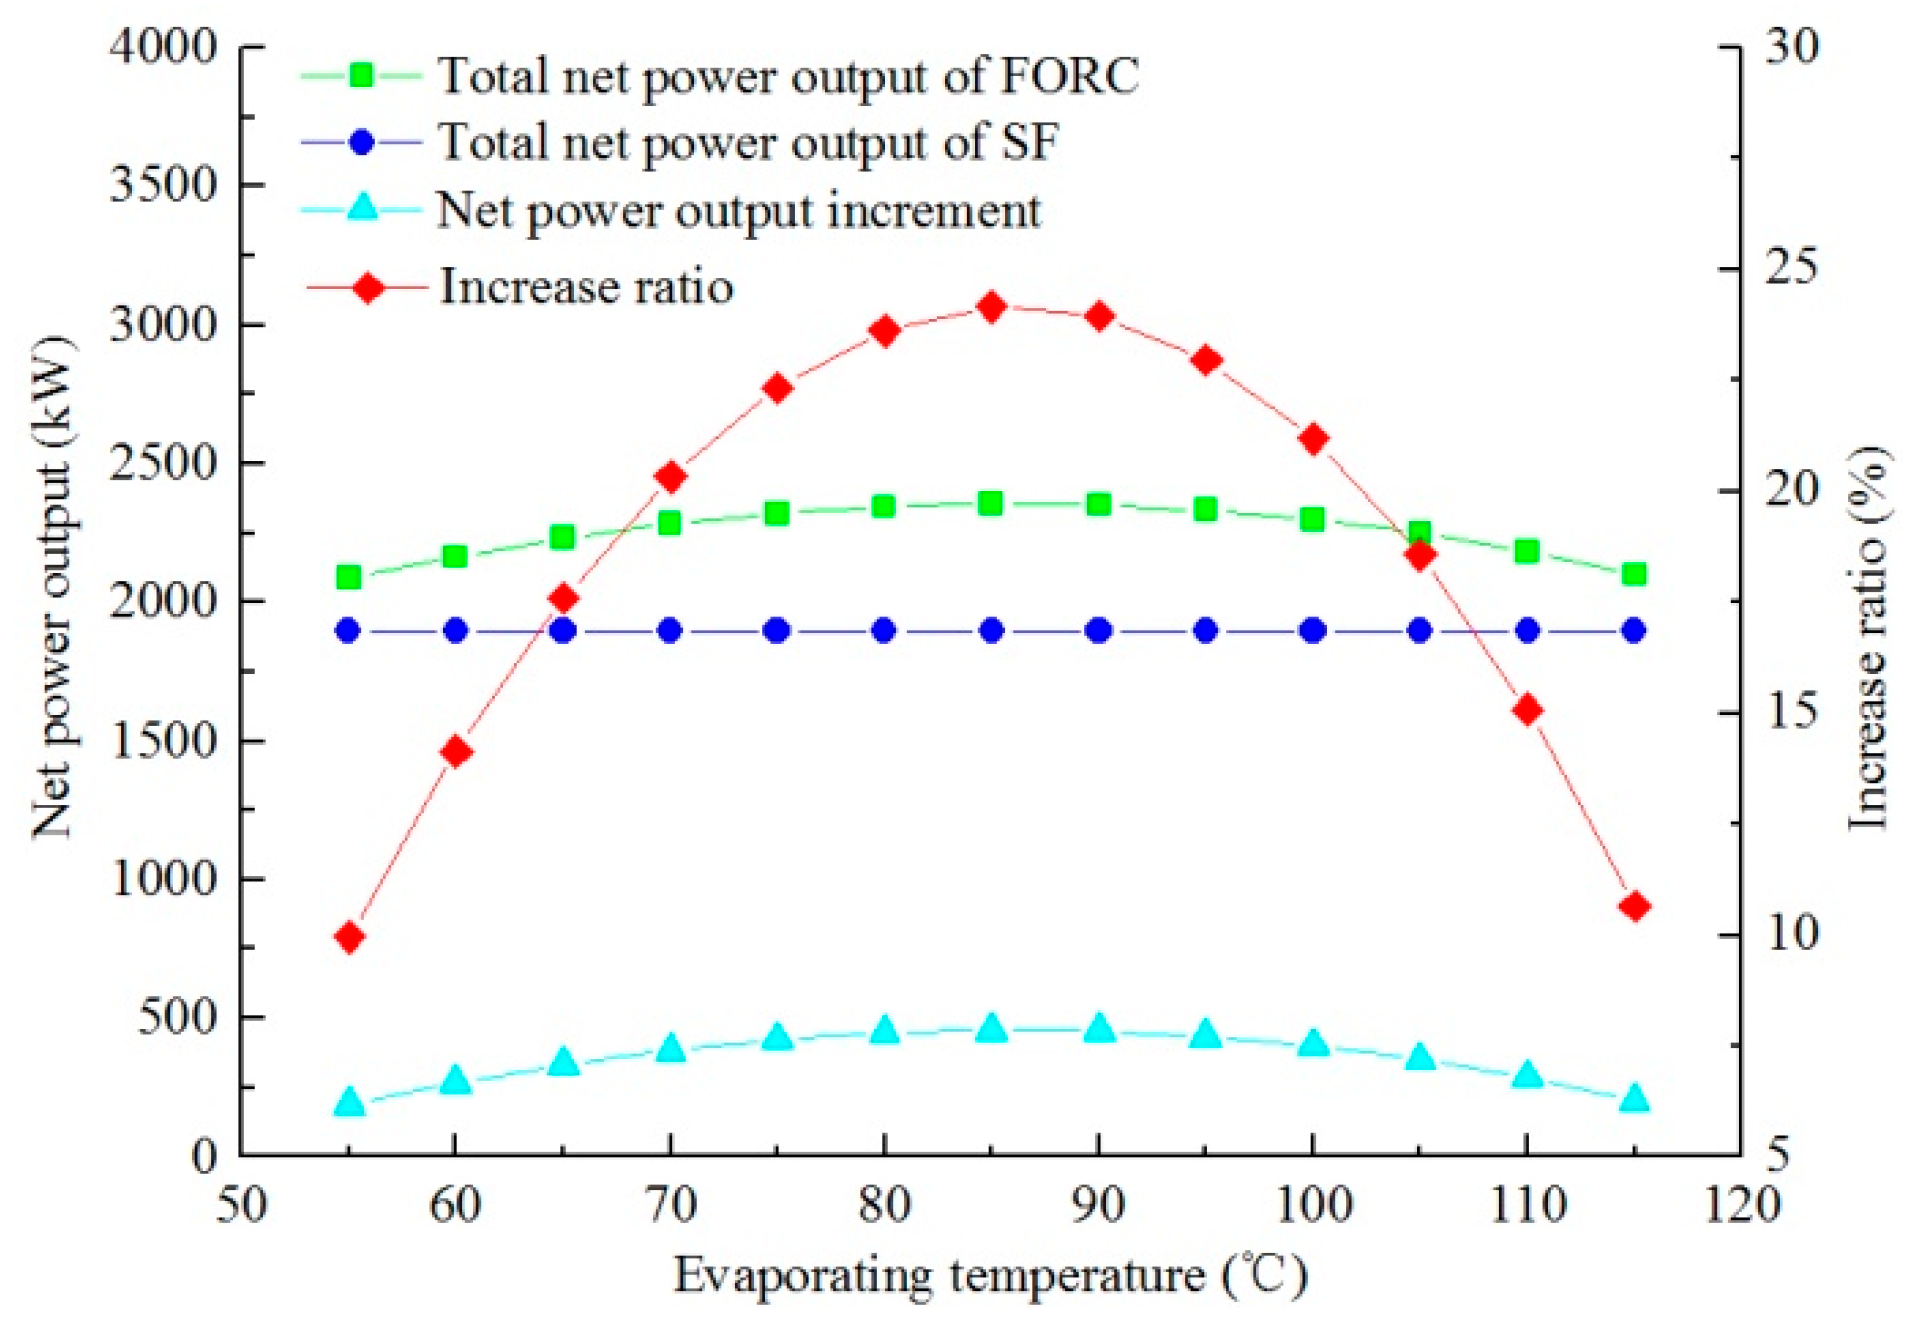
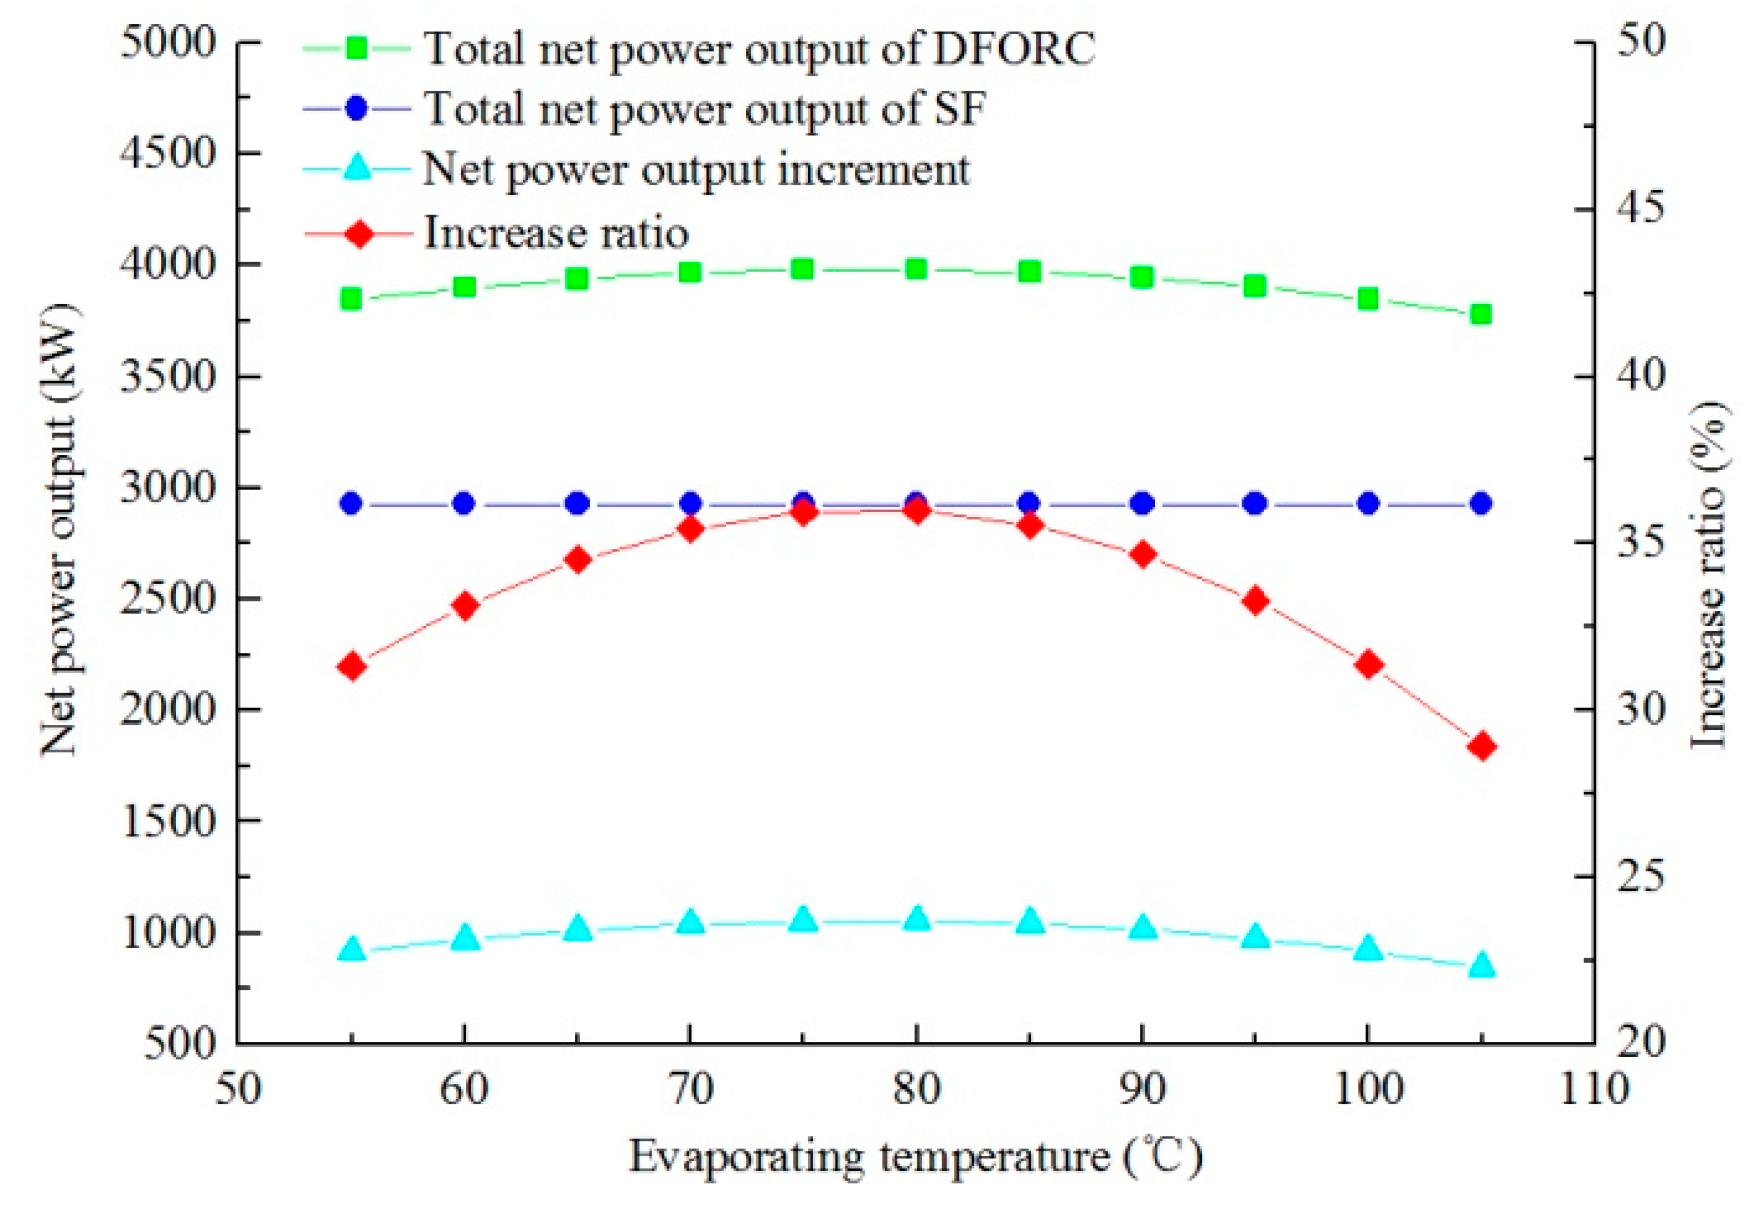
4.2. Optimization of Evaporation Temperature in the FORC and DFORC

Figure 6 presents the variations of net power output of FORC with different evaporating temperatures under the following condition: geofluid temperature is 130 °C; steam dryness is 0.2; geofluid flow rate is 150 t/h. The trend of changes are similar to those in Figure 5. The power output of ORC subsystem in FORC and DFORC is dependent on the specific available energy and working fluid flow rate. The specific available energy increases with an increasing evaporating temperature, however, the working fluid flow rate decreases as the evaporating temperature increases. As a result, there is an optimal evaporation temperature at which the FORC system obtains the maximum net power output.
Figure 7 shows the variations of net power output of DFORC with different evaporating temperatures under the following conditions: geofluid temperature is 180 °C; steam dryness is 0.2; geofluid flow rate is 150 t/h. It can be observed that the trend of the net power output change of DFORC is similar to that of the FORC system. The working fluid flow rate and the specific available energy are the dominant factors. From Figure 7, the optimum evaporation temperature of the DFORC system is 80 °C.

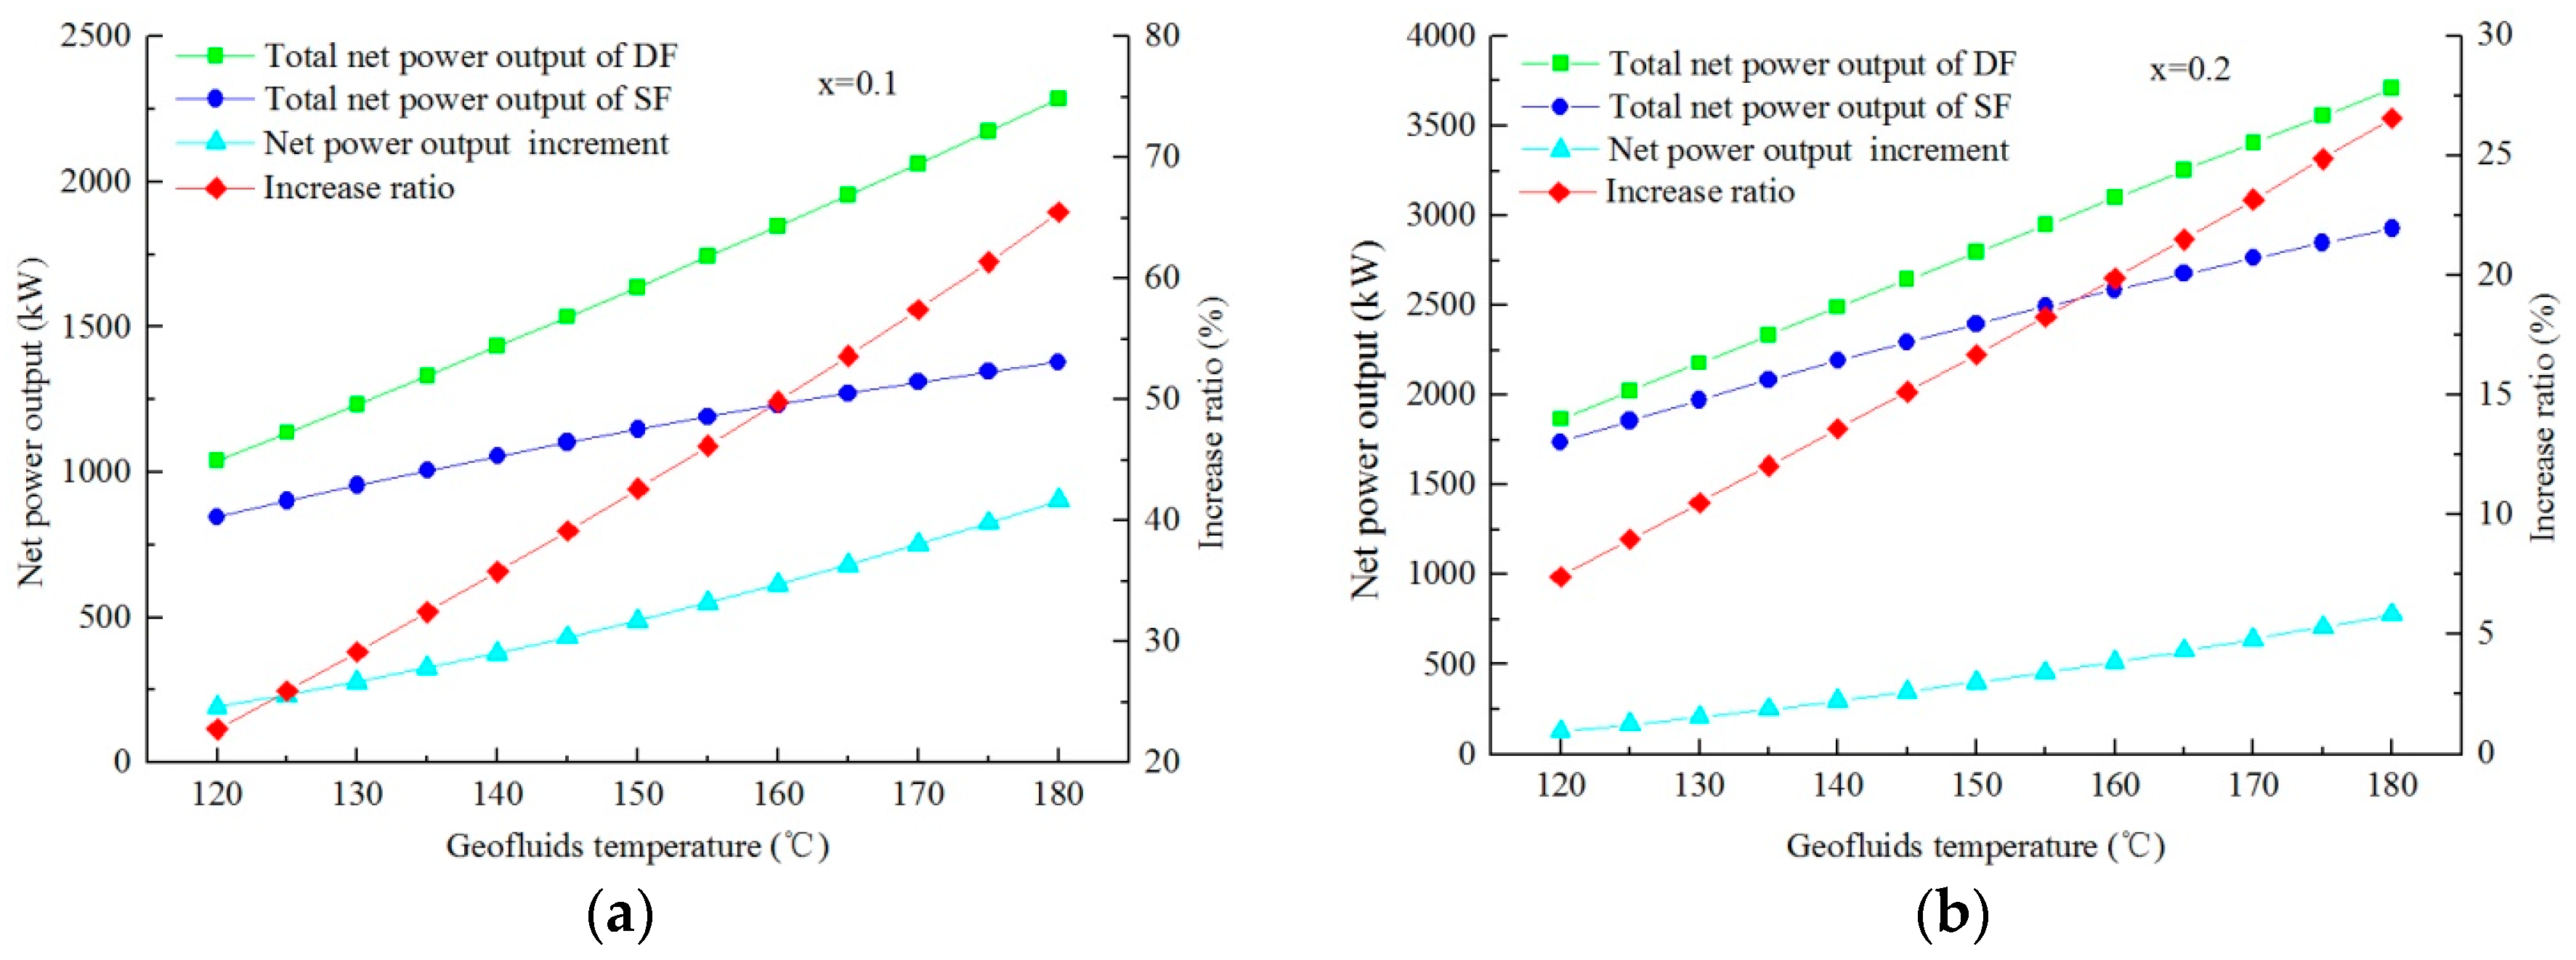
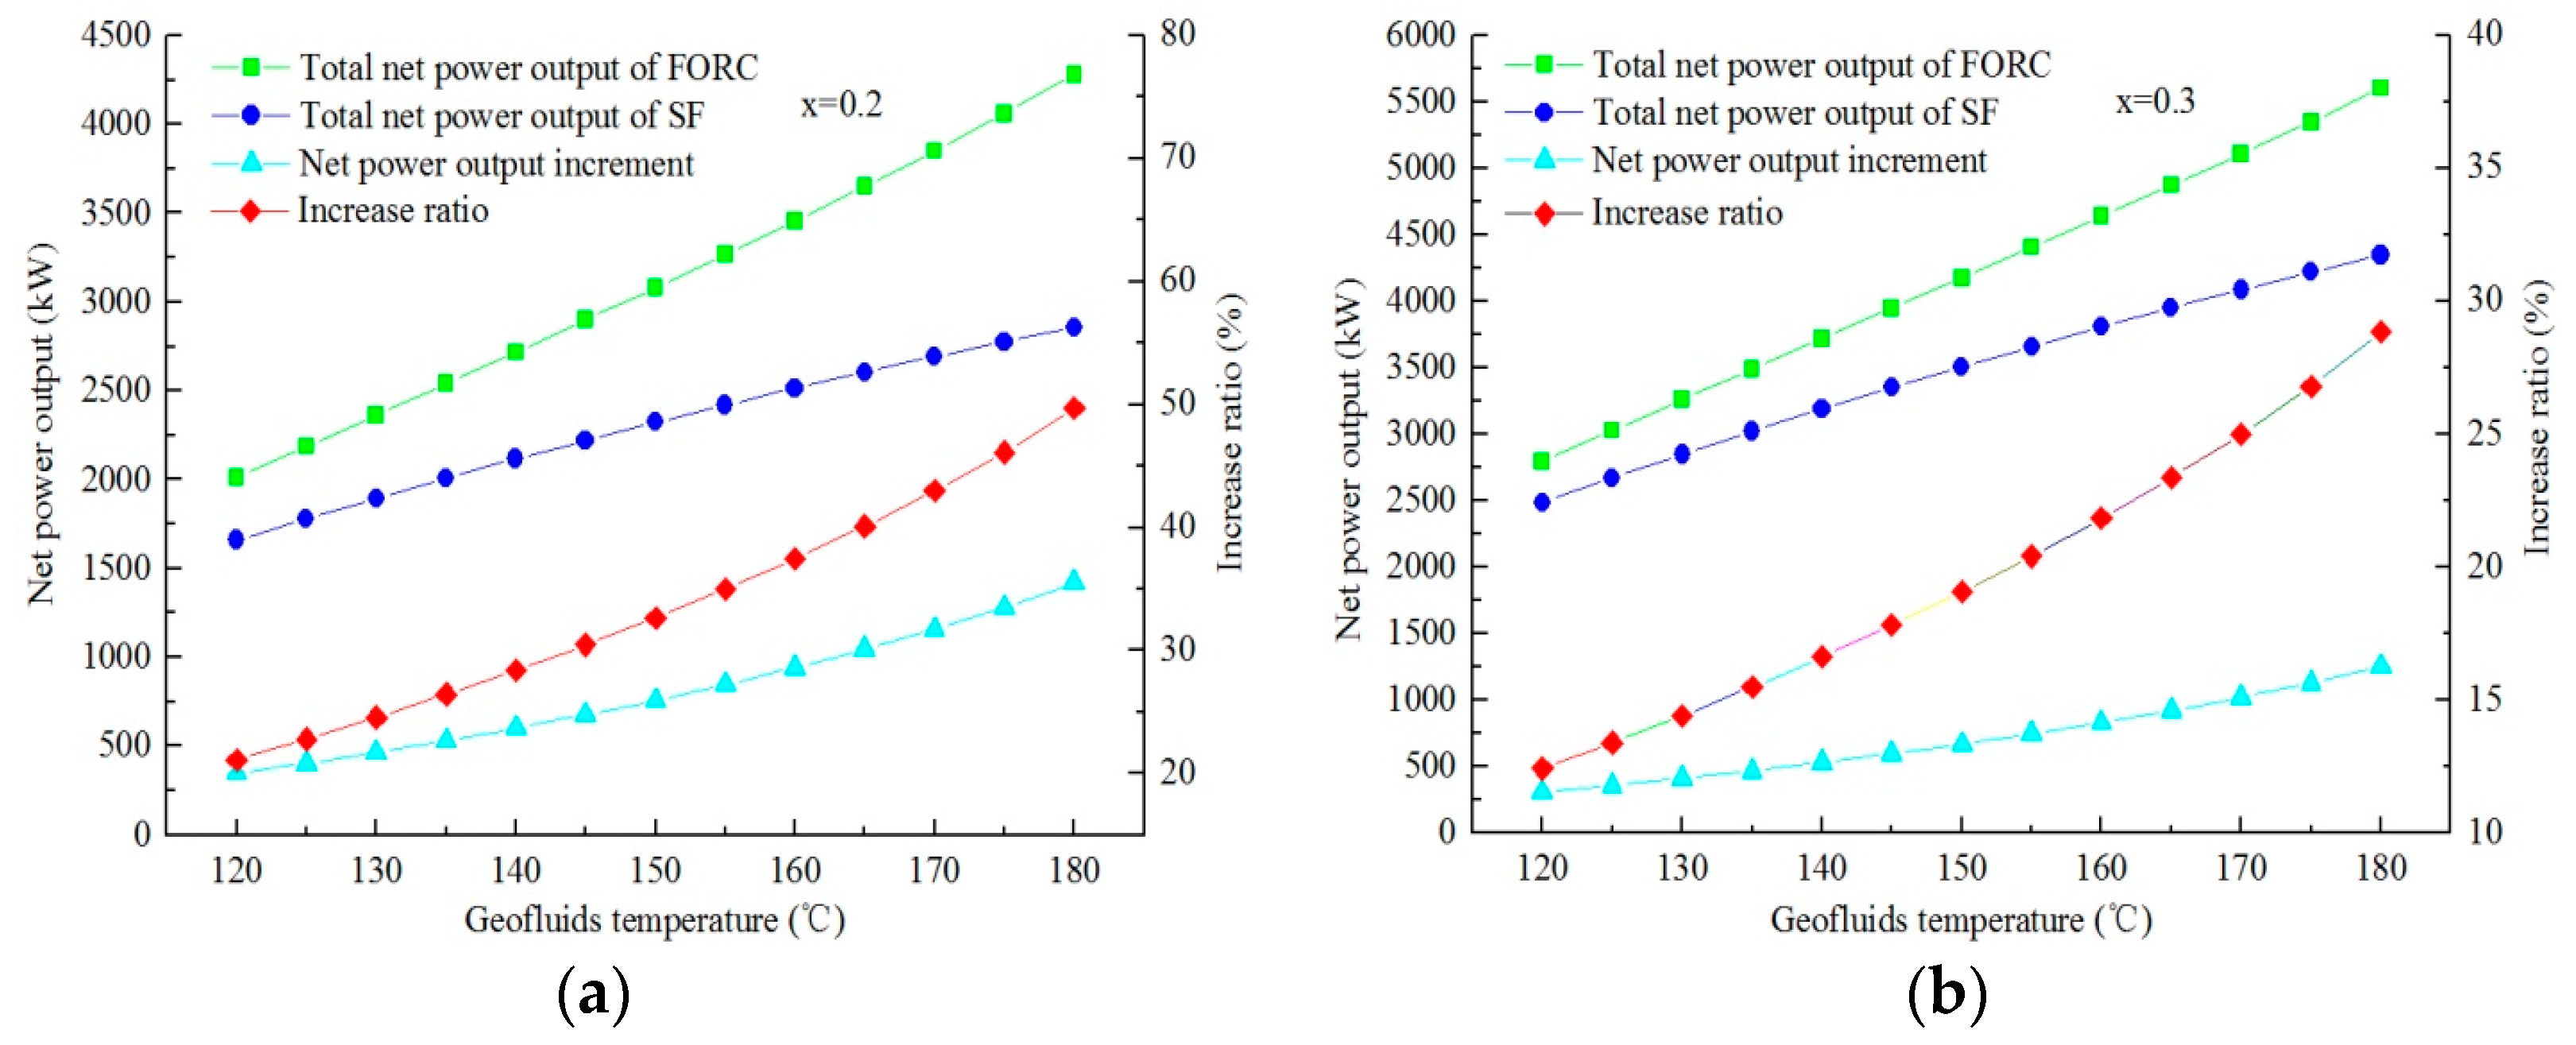
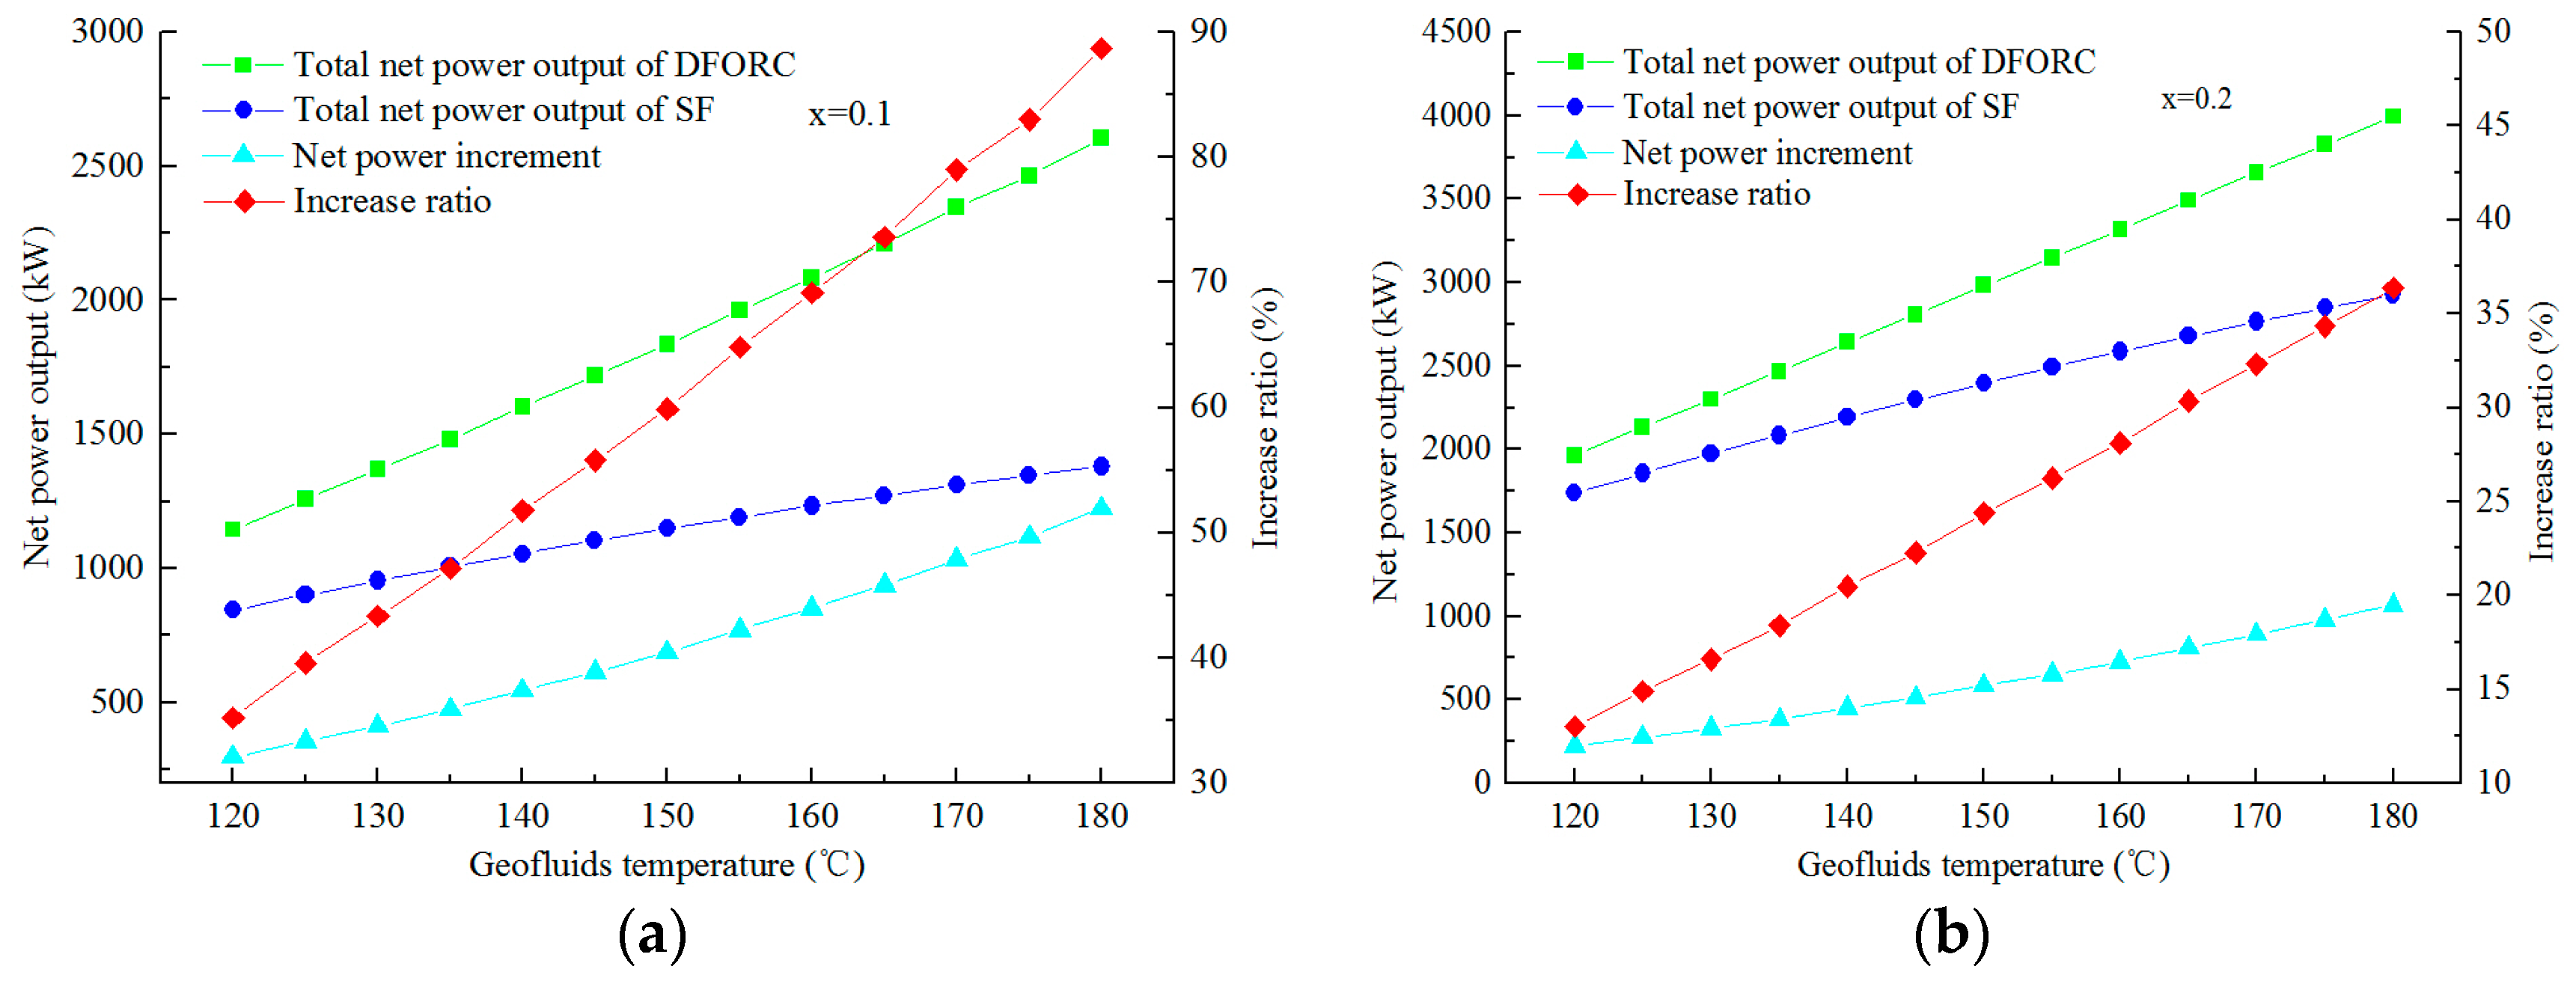
4.3. Effects of Temperature and Dryness of Geofluids on DF, FORC, and DFORC

It is noted that the optimization process for each system (DF, FOR, or DFORC) is carried out under specific geofluid conditions (temperature and steam dryness). In order to further study the effects of the geofluid’s temperature and steam dryness on the selected system, the performance of each system under different geofluid temperature and steam dryness is computed, and the results are shown in Figure 8, Figure 9 and Figure 10, respectively. It is worth noting that every point in Figure 8, Figure 9 and Figure 10 are the optimization result obtained in Section 4.1 and Section 4.2.
Figure 8 presents the variations of net power output of DF system with different geofluids temperatures for steam dryness of 0.1 and 0.2 respectively. It can be seen that a higher geofluid temperature leads to a higher net power output and a higher increase ratio for the DF system. By comparing Figure 8a with Figure 8b, it can be observed that the steam dryness has an important effect on the net power increase ratio and net power output. For instance, when the geofluid temperature is 175 °C, the increase ratio reaches 62% with the dryness of 0.1, whereas it can only reach 25% with the dryness of 0.2. Therefore, the contribution of the second-stage flash is more obvious to the power generation ratio at a lower steam dryness.
Figure 9 shows the variations of the net power output of the FORC system with different geofluid temperatures for steam dryness of 0.2 and 0.3. It is obvious that the geofluid temperature has a positive relationship on the net power output of FORC system. In conditions of geofluid temperature of 175 °C, the increase ratio of the FORC system reaches 46% for steam dryness of 0.2; however, it reaches 32% for steam dryness of 0.3. By comparing Figure 9a with Figure 8b, it can be seen that the increase ratio reaches 46% for FORC system, while it is 25% for the DF system under the condition that the geofluid temperature is 175 °C and the steam dryness is 0.2. Obviously, the FORC system can produce more electricity than the DF system under the same geofluid conditions. In addition, the comparison between Figure 9a and Figure 9b indicates that an ORC subsystem has more contribution to power generation at a lower steam dryness condition.
Figure 10 shows the variations of net power output of DFORC with geofluid temperature for steam dryness of 0.1 and 0.2. It is obvious that the relationship presented in Figure 10 is similar to that in Figure 8 and Figure 9. A higher geofluid temperature leads to a higher net power output and a higher net power output increase ratio. In addition, the effect of the DFORC system on improving the net power output is more obvious at a lower steam dryness condition. Comparing Figure 10a with Figure 8a, it can be observed that adding the ORC subsystem to the DF system has more contribution to the net power increase ratio for its advantage on utilizing medium and low temperature geothermal energy. Therefore, DFORC is more suitable for power generation using geofluids with relatively higher temperature and dryness.

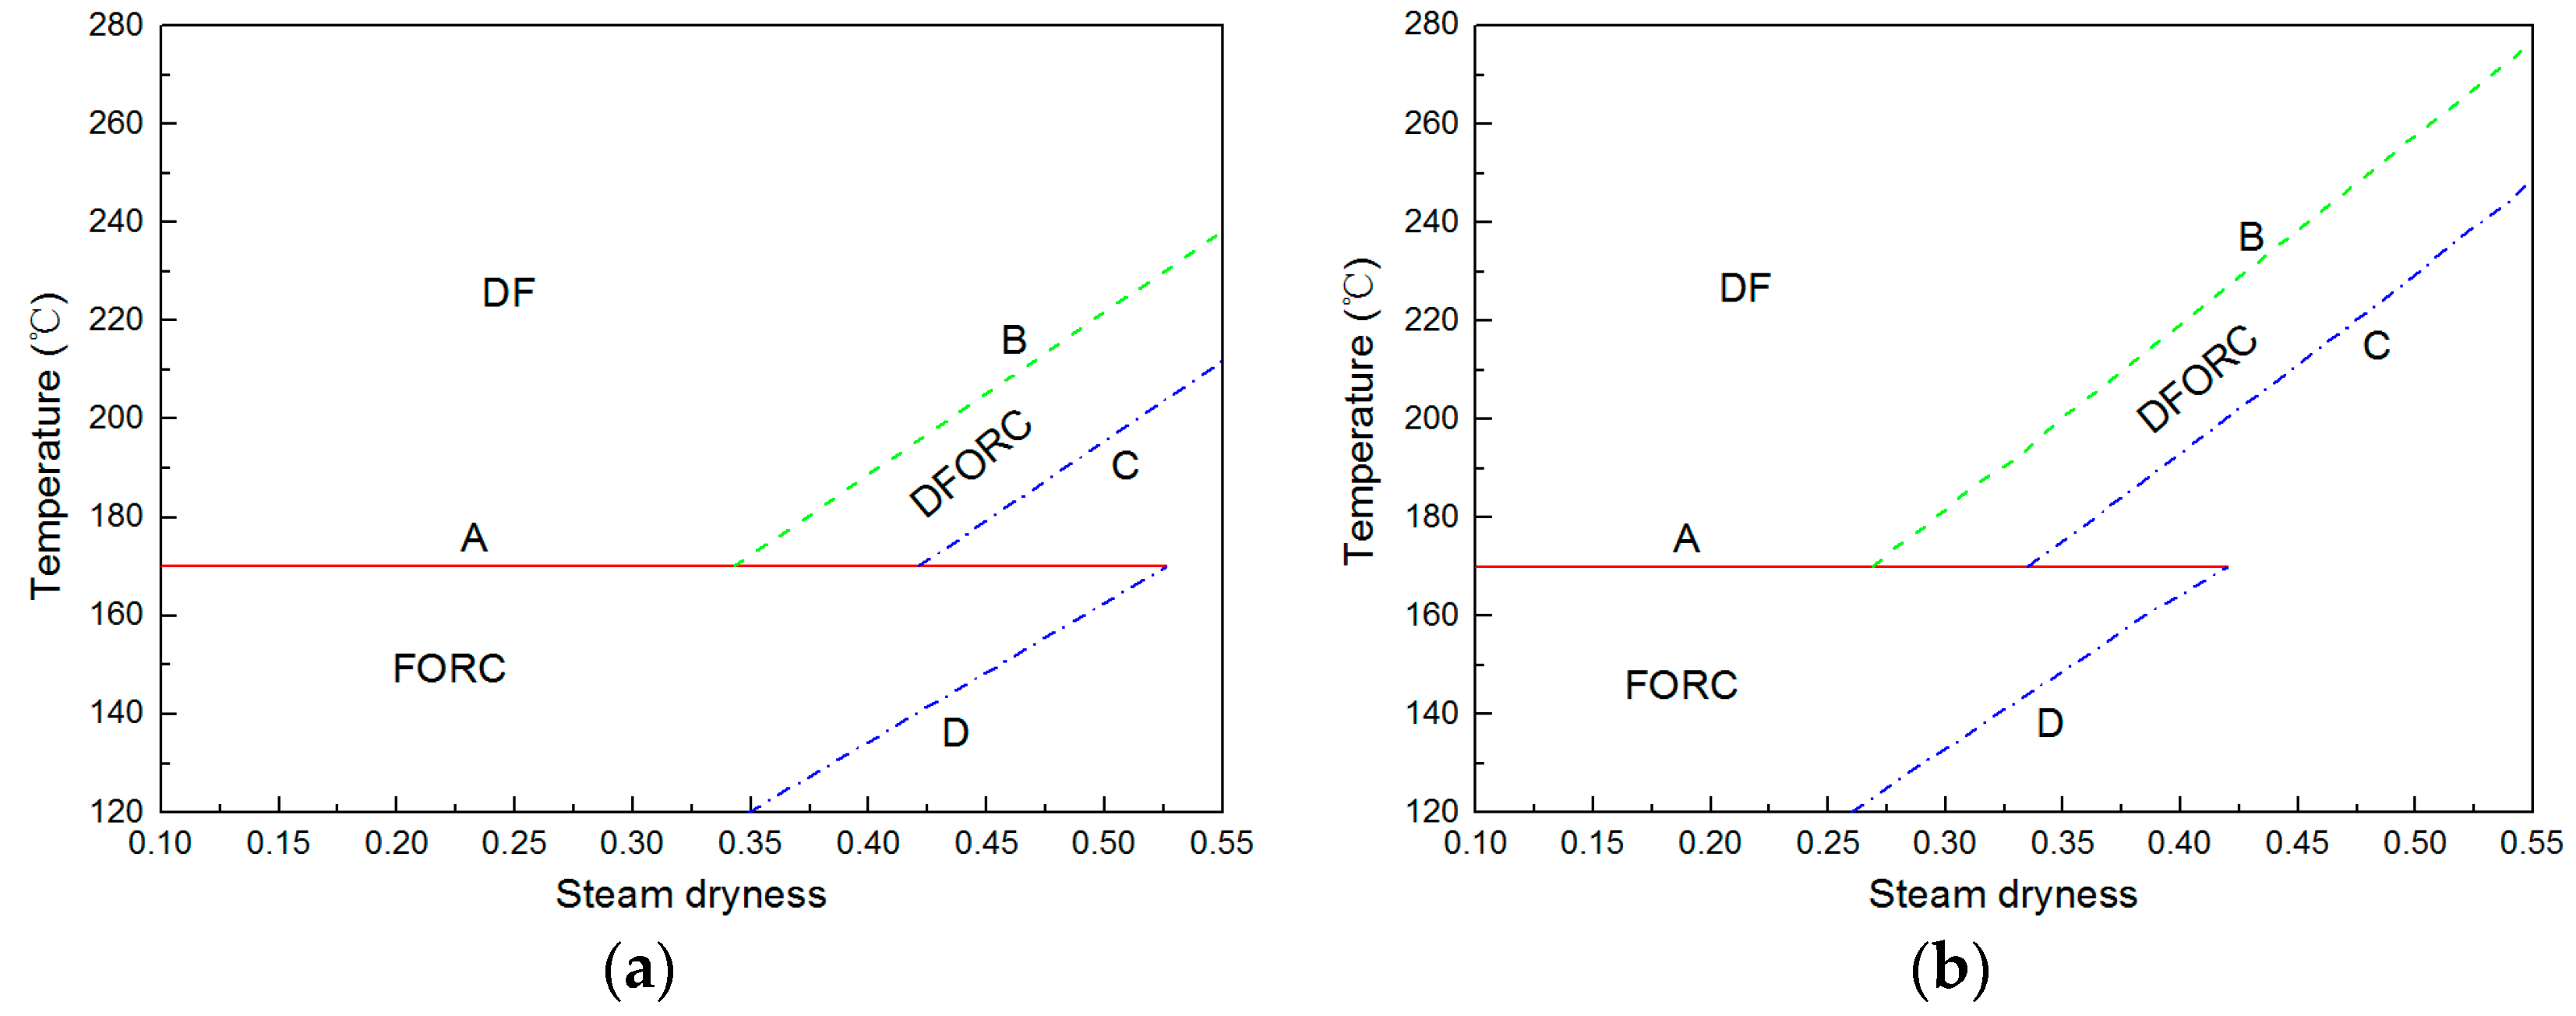
5. Power Generation System Selection Maps

Based on the results above, the selection maps showing the application scopes of the DF, FORC, and DFORC systems under different geofluid temperature and dryness conditions are obtained. Figure 11a,b show the selection maps for DF, FORC, and DFORC systems with net power increase ratio of 10% and 15%, respectively.
In Figure 11a, the regions under the two blue lines, C and D, indicate that none of the three systems (DF, FORC, and DFORC) can increase the net power increase ratio by 10% under any conditions. The horizontal red line A is a constant temperature line, which is dependent on the type of working fluid in the ORC subsystem. The working fluid used here is R245fa with a critical temperature of 154 °C. To ensure that the ORC subsystem is running under subcritical condition with a relatively high thermal efficiency, the upper limit of heat source temperature for the ORC subsystem is found to be 170 °C based on the optimization. In the region under the red line A, the FORC system can produce more electricity, whereas the DF system can generate more electricity in the region above the red line A. Compared with the SF system, both systems (DF and FORC) can produce power output of more than 10%. Based on the method given in Section 3, the top green line B indicates that, under the conditions above this line, the DF system can generate 10% more power output than the SF system. Under the conditions below this line, the DFORC system can produce more electricity.
Figure 11b shows a selection map for the net power increase ratio of 15%. The main difference between Figure 11a,b is the boundary joints. The difference can be explained by the effect of the steam dryness. Since a lower steam dryness can increase the net power increase ratio of DF, FORC, and DFORC systems under the same geofluid temperature, in order to obtain a higher net power increase ratio, the boundary lines (lines B, C, and D) have to be located in the lower steam dryness region. For instance, the boundary line (line B) between the DF and DFORC system in Figure 11a starts at a steam dryness of 0.35, whereas it starts at steam dryness of 0.26 in Figure 11b.
From Figure 11, people can easily find the best power generation system for EGS using different temperature and steam dryness geofluids. In this paper, only the selection maps based on a net power increase ratio of 10% and 15% are presented. However, with the optimization approach provided in this paper, other maps for different net power increase ratios can be obtained.

6. Conclusions

Four power generation systems, SF, DF, FORC, and DFORC, are investigated, respectively. SF is set as a reference system, and the other three systems are evaluated by comparing their net power increase ratios with that of the SF system. The objective of this paper is to obtain useful maps for selecting the best power generation system for the EGS project. Based on the study, the following conclusions can be drawn:
(1)
Compared with the reference system, SF, each upgraded system (DF, FORC, and DFORC) can produce more power output. It is observed that each upgraded system has a maximum net power output under a given geofluid condition.
(2)
Both the temperature and steam dryness of geofluids have strong influences on the performance of each kind of power generation system. In addition, there exists an upper limit of heat source temperature using a FORC system. For the investigated FORC with R245fa as working fluid, the upper limit of heat source temperature was found to be 170 °C.
(3)
Two useful maps for selecting a suitable power generation system used for EGS are produced based on the net power increase ratio of 10% and 15%, respectively. FORC is the most suitable system in the region with geofluid temperature below 170 °C. In the region with geofluid temperature above 170 °C, either the DF or DFORC system could be an option; the DF system is found to be more attractive under a higher geofluid temperature and a relatively lower dryness condition.

Acknowledgments

The authors gratefully acknowledge the support provided by the National Natural Science Foundation of China (Grant No. 41272263).

Author Contributions

All authors contributed to this work by collaboration. Kaiyong Hu and Xinli Lu conceived the main parts of the research work, including mathematical modeling, analyses of the obtained results, and writing of the article. Jialing Zhu and Wei Zhang verified the work and actively contributed to finalizing the manuscript.

Conflicts of Interest

The authors declare no conflict of interest.

References

  1. Shi, W. Renewable energy: Finding solutions for a greener tomorrow. Rev. Environ. Sci. Biotechnol. 2010, 9, 35–37. [Google Scholar] [CrossRef]
  2. Ellabban, O.; Abu-Rub, H.; Blaabjerg, F. Renewable energy resources: Current status, future prospects and their enabling technology. Renew. Sustain. Energy Rev. 2014, 39, 748–764. [Google Scholar] [CrossRef]
  3. Sanyal, S.K. Future of geothermal energy. In Proceedings of the Thirty-Fifth Workshop on Geothermal Reservoir Engineering, Stanford, CA, USA, 1–3 February 2010.
  4. Tester, J.W. The future of geothermal energy: Impact of enhanced geothermal systems (EGS) on the United States in the 21st century; Massachusetts Institute of Technology: Cambridge, MA, USA, 2006. [Google Scholar]
  5. Blackwell, D.D.; Negraru, P.T.; Richards, M.C. Assessment of the enhanced geothermal system resource base of the United States. Nat. Resour. Res. 2007, 15, 283–308. [Google Scholar] [CrossRef]
  6. Fehler, M.C. Stress control of seismicity patterns observed during hydraulic fracturing experiments at the Fenton Hill hot dry rock geothermal energy site, New Mexico. Int. J. Rock Mech. Min. Sci. Geomechan. 1989, 26, 211–219. [Google Scholar] [CrossRef]
  7. Duchane, D.; Brown, D. Hot dry rock (HDR) geothermal energy research and development at Fenton Hill, New Mexico. Geotherm. Heat Cent. Bull. 2002, 23, 13–19. [Google Scholar]
  8. Aki, K.; Fehler, M.; Aamodt, R.L.; Albright, J.N.; Potter, R.M.; Pearson, C.M.; Tester, J.W. Interpretation of seismic data from hydraulic fracturing experiments at the Fenton Hill, New Mexico, Hot Dry Rock geothermal site. J. Geophys. Res. Solid Earth 1982, 87, 936–944. [Google Scholar] [CrossRef]
  9. Min, K.B.; Xie, L.; Kim, H.; Lee, J. EGS field case studies-UK Rosemanowes and Australian Cooper Basin projects. J. Korean Soc. Rock Mechan. 2014, 24, 21–31. [Google Scholar] [CrossRef]
  10. Kuriyagawa, M.; Tenma, N. Development of hot dry rock technology at the Hijiori test site. Geothermics 1999, 28, 627–636. [Google Scholar] [CrossRef]
  11. Wallroth, T.; Eliasson, T.; Sundquist, U. Hot dry rock research experiments at Fjällbacka, Sweden. Geothermics 1999, 28, 617–625. [Google Scholar] [CrossRef]
  12. Kappelmeyer, O.; Gérard, A.; Schloemer, W.; Ferrandes, R.; Rummel, F.; Benderitter, Y. European HDR project at Soultz-sous-Forêts: General presentation. Geotherm. Sci. Technol. 1991, 2, 263–289. [Google Scholar]
  13. Robertson, A.; Morris, C.; Schochet, D. The Desert Peak East EGS Project: A Progress Report. In Proceedings of the World Geothermal Congress, Antalya, Turkey, 24–29 April 2005.
  14. Chen, D. Concepts of a Basic EGS Model for the Cooper Basin, Australia. In Proceedings of the 2010 World Geothermal Congress, Bali, Indonesia, 25–30 April 2010.
  15. Chen, D.; Wyborn, D. Habanero field tests in the Cooper Basin, Australia: A proof-of-concept for EGS. Geotherm. Resour. Counc. Trans. 2009, 33, 159–164. [Google Scholar]
  16. Hettkamp, T.; Baumgartner, J.; Baria, R.; Gérard, A.; Gandy, T.; Michelet, S.; Teza, D. Electricity Production from Hot Rocks. In Proceedings of the 29th Workshop on Geothermal Reservoir Engineering, Standford, CA, USA, 26–28 January 2004.
  17. Cerci, Y. Performance evaluation of a single-flash geothermal power plant in Denizli, Turkey. Energy 2003, 28, 27–35. [Google Scholar] [CrossRef]
  18. Sarr, J.R.; Mathieu-Potvin, F. Improvement of Double-Flash geothermal power plant design: A comparison of six interstage heating processes. Geothermics 2015, 54, 82–95. [Google Scholar] [CrossRef]
  19. Wang, J.; Wang, J.; Dai, Y.; Zhao, P. Thermodynamic analysis and optimization of a flash-binary geothermal power generation system. Geothermics 2015, 55, 69–77. [Google Scholar] [CrossRef]
  20. Li, M.; Lior, N. Comparative analysis of power plant options for enhanced geothermal systems (EGS). Energies 2014, 7, 8427–8445. [Google Scholar] [CrossRef]
  21. Yari, M. Exergetic analysis of various types of geothermal power plants. Renew. Energy 2010, 35, 112–121. [Google Scholar] [CrossRef]
  22. Jalilinasrabady, S.; Itoi, R.; Valdimarsson, P.; Saevarsdottir, G.; Fujii, H. Flash cycle optimization of Sabalan geothermal power plant employing exergy concept. Geothermics 2012, 43, 75–82. [Google Scholar] [CrossRef]
  23. Li, T.; Zhu, J.; Hu, K.; Kang, Z.; Zhang, W. Implementation of PDORC (parallel double-evaporator organic Rankine cycle) to enhance power output in oilfield. Energy 2014, 68, 680–687. [Google Scholar] [CrossRef]
  24. Klein, S.A.; Alvarado, F.L. EES: Engineering Equation Solver for the Microsoft Windows Operating System, 2nd ed.; F-Chart software: Madison, WI, USA, 1992. [Google Scholar]
Figure 1. Single-flash (SF) system.
Energies 09 00597 g001
Figure 2. Double-flash (DF) system.
Energies 09 00597 g002
Figure 3. Flash-organic Rankine cycle (FORC) system.
Energies 09 00597 g003
Figure 4. Double-flash-organic Rankine cycle (DFORC) system.
Energies 09 00597 g004
Figure 5. Variations of net power output of DF with flash temperature (geofluid temperature = 160 °C, steam dryness = 0.2, geofluid flow rate = 150 t/h).
Energies 09 00597 g005
Figure 6. Variations of net power output of FORC with evaporating temperature (geofluid temperature = 130 °C; steam dryness = 0.2; geofluid flow rate = 150 t/h).
Energies 09 00597 g006
Figure 7. Variations of net power output of DFORC with evaporating temperature (geofluid temperature = 180 °C, steam dryness = 0.2, geofluid flow rate = 150 t/h).
Energies 09 00597 g007
Figure 8. Variations of net power output of DF with geofluid temperature: (a) x = 0.1; (b) x = 0.2.
Energies 09 00597 g008
Figure 9. Variations of net power output of FORC with geofluid temperature: (a) x = 0.2; (b) x = 0.3.
Energies 09 00597 g009
Figure 10. Variations of net power output of DFORC with geofluid temperature: (a) x = 0.1; (b) x = 0.2.
Energies 09 00597 g010
Figure 11. Selection maps for power generation systems (DF, FORC, and DFORC) used for enhanced geothermal systems (EGS), generated based on the net power increase ratio of (a) 10% and (b) 15%, respectively.
Energies 09 00597 g011
Table 1. System parameters used in the simulation of flash power generation systems.
ItemsParameters
Heat loss in evaporator (%)30
Cooling water pump isentropic efficiency (%)65
Turbine isentropic efficiency (%)75
Turbine mechanical efficiency (%)96
Generator efficiency (%)93
Table 2. System parameters used in the simulation of organic Rankine cycle (ORC) system.
ItemsParameters
Working fluidR245fa
Trubine isentropic efficiency (%)75
Feeding pump isentropic efficiency (%)50
Temperature difference at the pinch point (°C)6
Turbine mechanical efficiency (%)96
Generator efficiency (%)93
Cooling water pump isentropic efficiency (%)65

