Abstract
In order to solve the influence of uncertain photovoltaic power (PV) on the stable operation of microgrid (MG), demand response (DR) and battery energy storage system (BESS) need to be introduced simultaneously into the operation optimal scheduling of PV-based microgrid (PV-MG). Therefore, it is of great significance for commercial investment decisions of PV-MG to consider the influence of DR on BESS optimal sizing. Under the peak-valley time-of-use (TOU) price, this paper builds cross-time DR models based on price elasticity matrix. Furthermore, through the introduction of DR and BESS into PV-MG scheduling optimization, the MG investment and benefit model is proposed. Considering the constraint condition such as co-ordination of supply and demand, electricity price elasticity and energy loss of storage system, the improved non-dominated sorting genetic algorithm II (NSGA-II) is utilized to solve the multi-objective optimal allocation model of the BESS with the target of maximum PV consumptive rate and annual net profits. The optimization method was applied to a PV-MG in Guangdong. Through the regulation and control effect of demand response and BESS on load distribution, the uncertainties PV power can be suppressed so as to improve the PV system consumptive level, which is of great guiding significance for BESS optimal sizing under this situation.
1. Introduction
In recent years, the energy crisis and deteriorating living environment have promoted the development of new energy resources. Compared with hydro, nuclear and wind power generation, photovoltaic power (PV) generation is less restricted by geography, resources, manufacturing materials and long-distance transmission. Thus, the PV industry has achieved rapid development. International Energy Agency (IEA) and the European Joint Research Centre (JRC) predicted that the global PV generation capacity would account for 2% of the total electricity power generation by 2020. This proportion will be even more than 10% by 2030.
The output power of PV generation is intermittent and random, which causes the difficulties and complexities of PV-based microgrid (PV-MG) [1]. As for the island PV-MG, particularly with high penetration of PV, there is the problem of power supply reliability. For grid-connected PV-MG, is the bulk power system fault will lead to off-network operation. Therefore, battery energy storage system (BESS) is necessary to smooth and stabilize its output, meet the load demand, and improve the power quality. BESS has dual property of load and power resource. By virtue of flexible charge and discharge characteristics, BESS has prospects in smoothing and stabilizing the output of PV system, peak load shifting, operating reserve, improving power quality and scheduling flexibility of PV-MG. Therefore, optimal sizing of BESS with reasonable volume can significantly improve the efficiency of PV system and promote the local PV consumptive rate [2].
Currently, due to the high price of BESS devices, the optimal sizing of BESS capacity should not be too large, which could significantly increase investment cost. However, excessively small energy optimal sizing cannot guarantee the stable operation of PV-MG and promote PV power consumption. Therefore, the reasonable optimal sizing of BESS system in PV-MG has become one of the focus researches of many scholars. At present, research of BESS capacity optimization is mainly focused on: (1) BESS optimal sizing method under two scenarios of single and hybrid BESS systems [3,4]; (2) BESS optimal sizing principle under the off-grid and gird-connected operation of MG [5,6]; (3) BESS optimization analysis methods, such as the difference supplement method, fluctuation smoothing analysis method [7,8]; (4) for particular types of PV-MG, such as industrial and commercial MG, quantitative analysis is carried out on the economic benefits of BESS system optimal sizing [9,10]. [10] focused on the optimization of the capacities of components in the PV-based BSS (battery switch stations) with consideration of battery swapping requirement and maximally utilizing PV energy.
DR refers to the electricity consumers’ response on power price signal or incentive mechanism to change the market participation behavior of normal power consumption mode, which is an important means in optimal operation of PV-MG. Research of Pacific Northwest National Laboratory indicated that, under the condition of the fluctuant electricity price, users would be willing to change their consumption behaviors and adjust the power consumption of controllable equipment. Demand response technology can be used to optimize the operation of MG [11,12], frequency and connection line power [13,14], as well as support emergency fault [15,16]. DR can significantly improve the economy, reliability and flexibility of MG system [17]. With the improvement of the electric power market and the widespread application of the communication, the load optimization of the demand response has become the important factor that can not be ignored in the MG’s planning and operation. Therefore, it is needed to consider the influence of the demand response when the energy storage optimal sizing is carried out.
In the BESS optimal configuration, in order to clarify the benefits and advantages of the proposed model, the features are compared to several related papers [18,19,20,21,22], in terms of optimization objectives, constraints, solving algorithm, connected or disconnected to grid, whether the demand response factors are considered. The comparison result is shown in Table 1 below. With respect to the optimization objectives, most contrastive papers focus on one specific function of BESS, such as compensate for power fluctuations, while this paper proposes multi-objectives optimal model of maximum PV consumptive rate and annual net profits. As the basic data and scenarios in these papers are different, their simulation constraints and solving algorithms are not comparable. In addition, the proposed model introduces DR and BESS simultaneously into the operation optimal scheduling of grid-connected PV-MG, and has a relatively superior guiding significance for the commercial investment of BESS in PV-MG.

Table 1.
Comparison with several related papers.
There are mainly two kinds of methods to analyze DR of users: one is fitting DR curve through historical data [23,24]; the other is by obtaining elastic matrix to analyze the response of users to the price change [25,26,27]. Since the latter is more suitable for quantitative analysis, it is widely used in the analysis of DR. [25] described how the consumers behavior can be modeled using a matrix of self and cross elasticity, and how elasticity can be taken into consideration when scheduling generation and setting the price of electricity in a pool based electricity market. [26] introduced the impact of price elasticity matrix of demand side on power purchase decision-making under time-of-use (TOU) price into the optimization of power supply company power purchase from weekly market. However, the elasticity coefficients in these papers are artificially given without calculation through reasonable method or model. [27] established multiple regression model of electricity consumption and price based on the electricity market statistics, and analyzes the price elasticity of electricity demand by the difference between SD and control group LADWP. However, it only considers self-elasticity, not cross-elasticity. Given the BESS configuration is made at the planning stage of PV-MG, so it demands less on real-time performance and TOU is the most principle DR project implemented. Thus, this paper explores the DR’s influence on BESS configuration under TOU price scenario.
Based on the above analysis, this paper establishes multi-period DR model based on price elasticity matrix under TOU price and introduces DR and BESS system operation into PV-MG scheduling optimization to analyze the impact of DR on BESS optimal sizing, which is of significant effect on commercial investment decisions of PV-MG. The contribution mainly includes following aspects.
- (1)
- The multi-period DR model based on price elasticity matrix under TOU price is established, which can reflect the impact of TOU price on users’ electricity consumption.
- (2)
- The DR and BESS system operation are included into PV-MG scheduling optimization to build the MG investment profit model, and the PV consumptive rate and annual net profits are taken as greatest objectives.
- (3)
- Considering the constraint conditions such as power supply and demand balance, side electricity price elasticity, loss of BESS systems, NSGA-II algorithm is utilized to solve the DR-based BESS capacity optimize optimal sizing model in PV-MG.
2. System Architecture of PV-Based Microgrid (PV-MG)
The System Architecture of PV-MG is shown as Figure 1. The demand side response resources in PV-MG mainly include four categories of PV resources, BESS resources, load resources and electricity price resources [28,29]. The PV-MG is connected to bulk power system at the point of common coupling (PCC), the electricity power generated in PV-MG is preferentially supplied to meet the local loads, and exchange electricity with the bulk power system if in need.
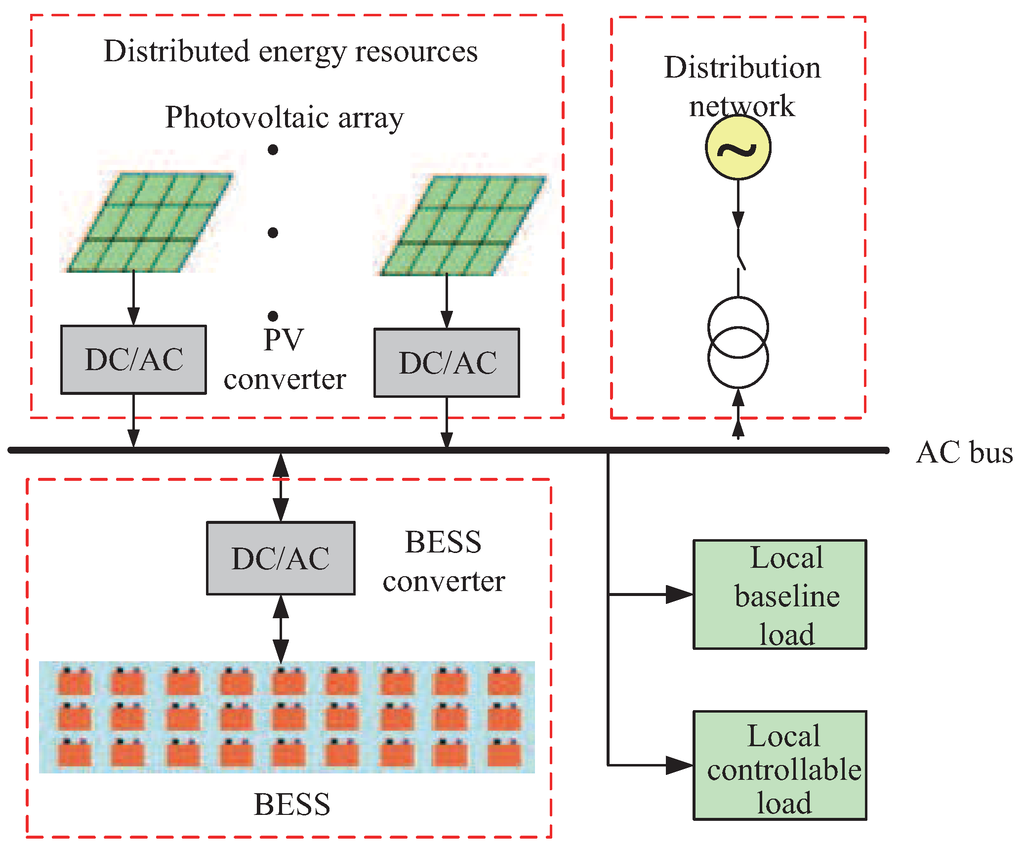
Figure 1.
Typical structure of PV-based microgrid (PV-MG).
- (1)
- PV resource: PV power generation is considered as the renewable energy generation resources most suitable to popularized and applied in the user side [30]. PV system is composed of PV array and PV DC/AC inverters. According to the sunshine situation, PV system adopts maximum power point tracking (MPPT) to improve the solar efficiency as much as possible [31].
- (2)
- BESS resource: BESS in MG generally is mostly composed of lithium ion battery or lead acid battery system equipped with appropriate bidirectional DC/AC inverters. Its functions in PV-MG can be divided into two categories: one is power quality (PQ) mode, which cites out power adjustment in short time scale to meet the power quality requirements; the other is power shaving (PS) mode, which could meet the power output requirements in hour time scale [32]. The economic benefits considered in this paper mainly include PS mode of BESS, and the power adjustment of power adjustment in hour time scale.
- (3)
- Load resource: Load species is characterized by diversity. It is mainly divided into residential, commercial and industrial loads. Residential loads mainly include heating, ventilation and air conditioning (HVAC), refrigerator, water heater as well as other household appliances [33]. Commercial loads mainly include lighting, HVAC, office computers and other types of commercial appliances [34]. Industrial loads are dominated by long-term continuous loads concerning production process, such as machinery, electrolysis, and electric heating.
- (4)
- Electricity price resource: Electricity price generally includes TOU price, real time price, critical peak price, etc. This paper studies the impact of DR on BESS optimal sizing under TOU price [35].
During the operation of PV-MG, the four categories of demand side resources combine closely with each other. Therefore, the BESS capacity optimal sizing should not only consider the BESS and PV-MG operation strategy, the impact of electricity price and loads DR cannot be ignored, which can improve the actual operation adaptability of BESS optimal sizing.
3. Demand Response Model
DR projects include electricity price mechanism and compensation incentive mechanism, and both means change electricity consumption by price change or economic compensation. As a special commodity, the price change of electricity will affect consumption behaviour. When users participate in market electricity price response, the demand curve will be left oblique and bending, as shown in Figure 2.
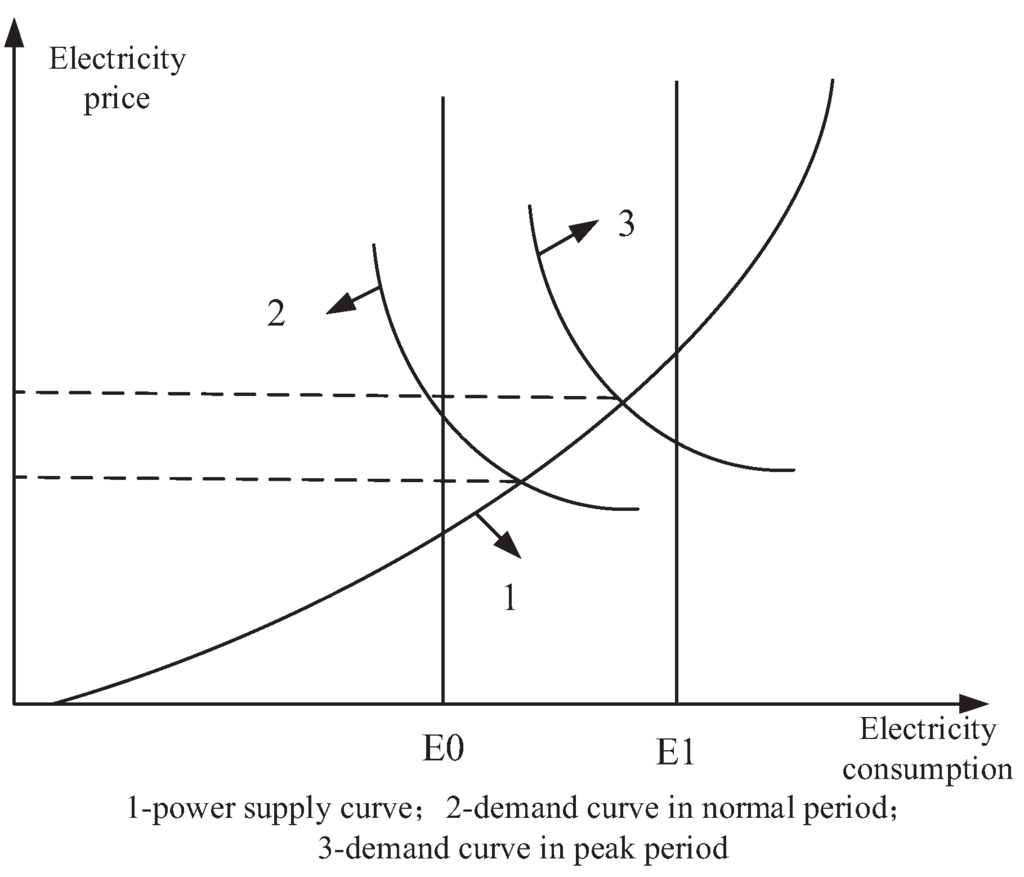
Figure 2.
Impact of demand response (DR) to market price.
[36] pointed out that, based on the balance of commodity supply and demand elasticity, commodity price and deal quantity (correspond to electricity price and electricity consumption separately in this paper) present linear relation near the electric power market equilibrium point. Its expression is
Based on the equilibrium relationship between commodity supply and elastic demand as well as the price elasticity matrix of electricity price in multi time period, the users’ DR behaviors can be more accurately and comprehensively described under TOU price. Electricity price elasticity refers to the function relationship between electricity consumption change rate and electricity price change rate. The actual function expression of the typical demand curve usually needs to be considered in different factors for regression analysis. In order to simplify this complex process, it is treated as a linear function.
In practical, users will not only consider the electricity prices at current and other moments. Self-elasticity coefficient is utilized to express the impact of current moment electricity price change rate on current moment electricity consumption, while cross-elasticity coefficient means the impact that on the other moment electricity consumption. The formula for the relationship between the change rates the electricity quantity and electricity prices expressed in elasticity coefficient is as follows:
For time periods , the elastic matrix can be constructed as:
This paper takes the assumption in [37] that the elastic matrix is symmetrical to the y diagonal, which means electricity price has the same effect on electricity consumption between two time periods with the same distance.
Theoretically, the price tariff can be divided into single pricing, TOU pricing, real time pricing, critical peak pricing and so on, which can be implemented in the PV-MG and have influence on the BESS optimal sizing considering the demand response. Real time pricing is ideal instantaneous dynamic prices in space, which requires almost instantaneous match of price and cost in power grid, and users can’t timely and effectively arrange their loads in the short term [38]. Thus, quasi real time pricing is generally implemented, and can effectively mobilize the users’ DR to real time pricing. Quasi real time pricing means that, the time interval division and price scheme of 24 h in D day is set based on data mastered in days, put on execution at 0:00 in D, thus users can arrange their consumptions more effectively. Then, the prices corresponding to loads in each time point is:
where is the price at time t with time intervals of 15 min, and is the load at time t with time intervals of 15 min and one hour respectively, is the single price, is the daily average load in day, is the floating rate of quasi real time pricing at time t.
One day is divided into 24 time intervals, and then the elastic matrix can be constructed as:
where and is the electricity consumption before and after DR of quasi real time pricing.
Substitute Equation (8) into Equation (7), then:
Based on the definition of quasi real time pricing, there is:
Substitute Equation (10) into Equation (9), then:
The elastic coefficient in the elastic matrix can be obtained by using the relevant historical electricity consumption and the historical electricity price coefficient of the power supply department, or the data obtained from the user survey. Then, we can obtain the load curve before and after DR with the implement of quasi real time pricing, and the influence of quasi real time on the BESS optimal configuration can be analyzed through the multi-objectives model proposed in this paper.
Given the BESS configuration is made at the planning stage of PV-MG, so it demands less on real-time performance and TOU is the most principle DR project implemented. Thus, this paper explores the DR’s influence on BESS configuration under TOU price scenario. Then, the following formula can be constructed:
Set the flat price as reference value, and simplify the parameters in Equation (6). represents the difference between peak and flat price instead of , represents the difference between valley and flat price instead of , and set for simplification. Then, it can be constructed as:
In order to simplify the problem, this paper assumes that electricity consumption only shits before and after TOU power price, and the total electric quantity will stay constant. The reduced electricity consumption in peak price period can be transferred to flat and valley price period:
Equation (13) can be expressed as:
where , , is the electricity consumption transferred from peak to flat period, is the electricity consumption transferred from peak to valley period.
Simultaneously, the electricity consumption increased in flat price period increased is from the peak period, and part of the load is transferred to the valley price period.
where .
According to consumer psychology, the users have minimum and maximum value of electricity price, namely the lower and upper limit of threshold. When the price is lower than the minimum threshold, users won’t respond to price, and when price is higher than the maximum threshold, they will also not further respond to the upper price. Based on this, the transfer rate can be modified as follow:
where , , , is taken as the reference value 1.
Thus the loads in peak, valley and flat price period after the application of TOU power price strategy are:
4. Joint Operation of PV-MG
4.1. Operation Strategy of PV-MG
DR and BESS system can alter the load distribution, and further affect the optimal operation of PV-MG’s scheduling. The operation of PV-MG is shown in Figure 3. The BESS capacity which is configured for meeting expected stable running time of island PV-MG is called rigid capacity , and when the remaining BESS capacity equals to the rigid capacity the state of charge (SOC) of storage is set at M, and the upper and lower limits of SOC are and separately. The BESS capacity which is configured for promoting PV consumptive rate of PV-MG is called flexible capacity . Then, the total BESS capacity is:
- (1)
- When PV output is greater than the load, Case 1: during the peak period of electricity price, PV preferentially supply electricity for local loads, and the redundant PV is supplied for BESS battery charging; Case 2: during the peak period of electricity price and BESS has been fully charged, the redundant PV will be fed in distribution power network. Case 3: during the valley period of electricity price and the SOC of BESS hasn’t reached the rated value, the redundant PV and major network jointly supply power to charge BESS; Case 4: during the valley period of electricity price and BESS has been fully charged, the redundant PV is feed in distribution power network. Case 5: during the flat period of electricity price, the BESS doesn’t charge or discharge, and redundant PV is feed in distribution power network.
- (2)
- When PV output is less than local loads Case 6: during the peak period of electricity price, SOC of BESS is greater than value M, and PV, BESS as well as the major grid supply electricity for local loads together; Case 7: in case 6, when SOC of BESS is less than the value M, PV and the major grid jointly supply electricity for local loads. Case 8: during the valley period of electricity price, SOC of BESS hasn’t reached the rated value, PV as well as the distribution network supply power for local loads, and the major network supplies power to charge BESS; Case 9: during the valley period of electricity price, when BESS has been fully charged, PV and the major network supply power for local loads; Case 10: during the flat period of electricity price, the BESS doesn’t charge or discharge, and PV as well as the major network supply power for local loads.
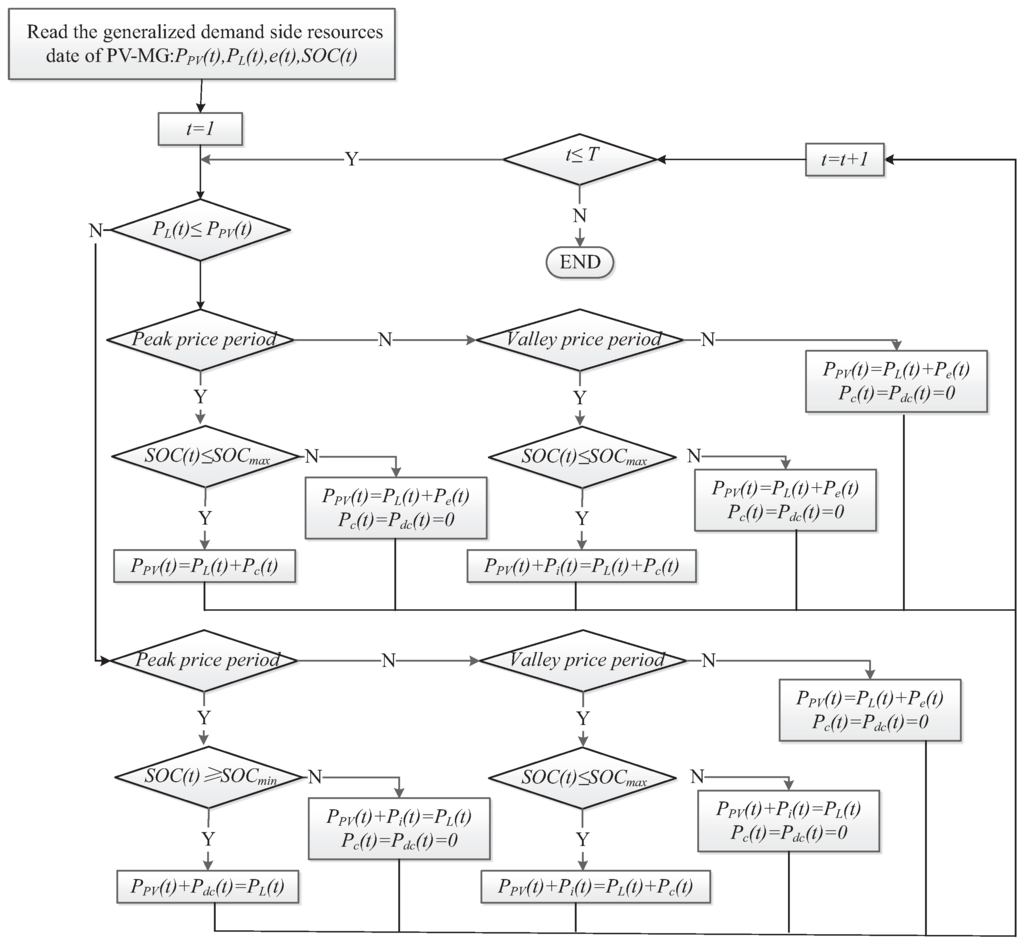
Figure 3.
The flow chart of energy exchange strategy in island micro-grid.
4.2. Analysis of System Power Balance
Complex control strategies and discrete operation state of BESS make it more complex for the implementation of optimization strategy in PV-MG. Thus, this paper adopts simple charge and discharge strategy of BESS to promote the implement and expansion of optimization strategy. Through comprehensive analysis on the characteristics of PV output, load and BESS as well as TOU price, the power balance situation of PV-MG during each moment can be described as:
- (1)
- If , and the distribution network supply electricity power to charge the BESS, that is,If , the bulk power system only supplies electricity power to loads, that is
- (2)
- During the peak price period in the morning, the total power of PV generation is less than the demand of load power. If BESS is featured with , the electricity power gaps is met by bulk power system, namelyWhen BESS is featured with , the electricity power gap is met by BESS. In view of the energy storage discharge efficiency, discharge power of energy storage is:Besides, the limit of depth of discharge (DOD) should be considered, and generally is set as 20% of the battery capacity, then:When DOD exceeds the limit, the discharge power should be corrected asThen, the discharge power of BESS after correction is:The existing power gaps exist will be met by power grid, and this electricity power is equal to the discharge power correction value, namely:
- (3)
- When the PV output is greater than local loads,BESS is featured with , and the excess part of PV generation is supplied for bulk power system, that isOn the contrary, if , the redundant PV generation is supplied to charge BESS, that is:In this occasion, the charging power should be subjected to SOC of BESS, so whether the power between the time period of t to will excess the SOC limit should be calculated, and the charging limit of SOC is generally 0.9. Based on the battery capacity value at time, it can be obtained that the battery capacity at time should meet:If the requirement of Equation (29) is met, the charging power is:If not, the charging power should be corrected asThen, the discharge power of BESS after correction is:The redundant PV power can only flow into power grid, and it’s the charging power correction value of BESS, namely:
According to the analysis above, the battery storage system charge and discharge twice in one typical day under TOU price. Due to the progress of charging and discharging cycle, the available battery storage capacity gradually reduces. The battery storage capacity retention ratio is actually the ratio of practical capacity to rated capacity. In addition, the demarcation point of availability of BESS is usually taken as 70%∼80%. If the BESS is lithium battery, then its serve life is 3000 times. Based on 260 typical similar days in one year, the service life of PV-MG is 15 years. Thus the BESS system needs once replacement within operation period.
5. Investment and Benefit Model of PV-MG
5.1. Annual Investment of PV-MG
The annual investment of PV-MG includes the PV system, BESS, BESS bidirectional converter module and operation maintenance cost. The PV system cost is the total cost of PV panel and its PV inverter. The maintenance contains the reasonable expenditure of maintenance, management, labor and related upgrading and transformation [39].
where , , and are the operation and maintenance cost of PV system, BESS module, and BESS inverter module separately, which are calculated as the proportion of 0.3% of construction costs; is discount rate of 0.04 in this paper.
5.2. Annual Income of PV-MG
The income of PV-MG includes three parts. The first one is earnings for power selling, which comes from the electricity supplied to local loads. The second one is network power price, which comes from selling extra electricity of MG to distribution network, and the last is subsidy income, which is supplied by nation or local government to PV system to promote its development. Then the daily income of PV-based income is:
This paper assumes that the price of user price is equal to electricity price of MG purchased from distribution network, namely .
5.3. Net Profits and PV Consumptive Rate
Annual net profits of PV-MG is
where R is the number of similar days. Considering the weather effect, the net profits of 260 similar days can equal to that of one year in this paper.
Photovoltaic consumptive rate is expressed as:
6. Multi-Objective Optimization Optimal Sizing Model and Solution
6.1. Objective Function
In the demand response based multi-objective capacity optimal sizing model of battery storage in PV-MG, the annual net profits and photovoltaic consumptive rate are selected as the dual optimization objectives-, shown as:
where Y is the objective function vector, x is decision variable, is the equality and inequality constraints separately. u is the decision variable dimension with its upper and lower limit of and separately. In this paper, the decision variable is the capacity of BESS.
6.2. Constraint Conditions
- (1)
- Reliability constraints of PV-MGIn order to ensure the stable operation time in off-grid operation of PV-MG:
- (2)
- BESS performance constraintsBESS performance constraints mainly include charge and discharge power constraint, charge and discharge status constraint, BESS capacity constraint and so on. Combining with [40], the charge and discharge model expression of BESS can be described as:where and are binary numbers which means the BESS charge or discharge, and one of and must be 1. Number 1 of means the charge status of BESS. is the depth of discharge of BESS. is the battery capacity value difference between the current time and the previous time.This paper makes assumption that BESS system completes a charge and discharge cycle in one typical day T, which means the SOC of BESS at the end of the day should be the same as the beginning.
- (3)
- Users’ purchasing electricity cost constraintUsers’ purchasing electricity cost constraint means that, the purchasing electricity cost after multi-period demand response, otherwise, users won’t respond to TOU price.where is the purchasing electricity cost under peak-valley TOU price; are single price, peak period price, flat period price and valley period price separately; are peak period, flat period and valley period respectively.
6.3. Model Solution
Comprehensively considering factors, such as PV output, BESS charge and discharge characteristic, loads and TOU price, the upper and lower limit of decision variables can be decided. Besides, based on the multi-joint scheduling operation strategy of PV-MG, this paper plans to adopt the NSGA-II algorithm to solve the demand response based multi-objective capacity optimal sizing model of BESS. NSGA-II algorithm is proposed by Deb et al. based on the improvement of NSGA algorithm [41,42]. It is one of the multi-objective evolutionary algorithms with high accreditation degree.
The process of the BESS optimal sizing by NSGA-II is shown in Figure 4. The left side is the NSGA-II algorithm process, and the right side is the double objectives of net profits and PV consumptive rate, whose results iterate in the NSGA-II algorithm process.
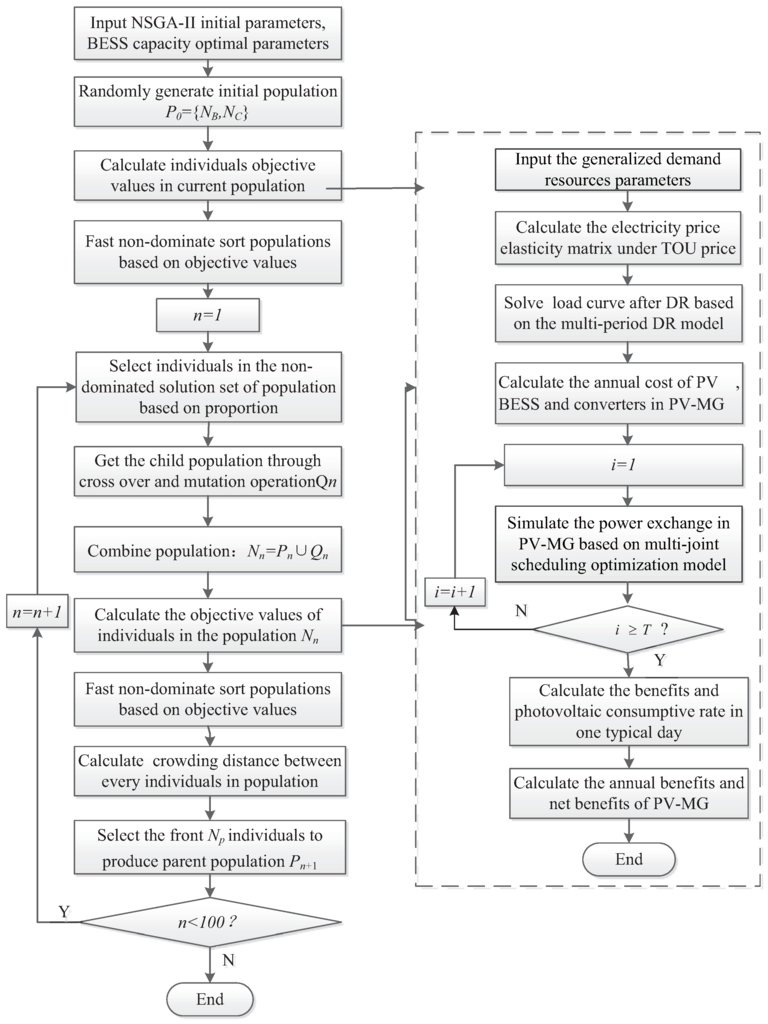
Figure 4.
The process of battery energy storage system (BESS) optimal sizing by non-dominated sorting genetic algorithm II (NSGA-II).
The flow chart in Figure 4 can be described as:
- (1)
- Code: Determine the map from phenotype to genotype.
- (2)
- Generate the initial population: Evolutionary counter is set to zero, and individuals are randomly generated. Each string structure represents one individual, and all the individuals make for one population.
- (3)
- Determine quantitative method for the individual fitness: The conversion rule from the value of objective function to the degree of fitness, which indicates the advantages and disadvantages of the individual.
- (4)
- Stratification: Non-dominant hierarchical approach is used to make sure that, the superior individuals have greater chance of inheritance to the next generation, and the fitness sharing strategy to maintain population diversity. The specific features are:
- (i)
- As for the rapid non-dominated sorting method based on classification, the computational complexity is O(mN (Where m is the number of objective functions, and N is the number of individuals in population )
- (ii)
- The concept of crowding distance is proposed to indicate fitness value of different elements after fast non-dominated sorting, so that the individuals in current Pareto front can be extended throughout the Pareto frontier as evenly as possible, and the time complexity of crowding distance is O(m(2N)log(2N));
- (iii)
- Elitist mechanism is introduced.Offspring individuals compete with their parent individuals to generate the next generation population, which can improve the overall level of population evolution.
- (5)
- Selection, crossover, variation: Retain individuals with high degree of adaptability according to their fitness. Crossover operator is applied to the group, and individuals are selected by crossover and mutation probability to generate new individuals.
- (6)
- Calculate objective functions, and the best individuals are selected to carry on the next step.
The multi-objective optimization results of NSGA-II algorithm are one set of solutions, which is called non-dominated solution or Pareto optimal solution. Introduction of the non-dominated sorting strategy, elitist keep technology, sun-crowding comparison operators and other technologies makes the scope and efficiency of the NSGA-II algorithm expanded and improved, and the distribution of non-dominated solutions more uniform and diverse.
7. Case Study
7.1. Basic Data
This paper chooses a PV-MG in Guangdong province of China as the object of study, and its basic electrical topology is shown in Figure 5. The electricity price, PV output and loads in the model are all taken from actual users. Therefore, their distribution within the optimization target time domain is determined. Capacity and load of PV system for each power user are shown in Table 2. The component parameters in PV-MG are shown in Table 3. In addition, the PV output, original loads and net loads of different users are shown in Figure 6, Figure 7 and Figure 8 respectively.
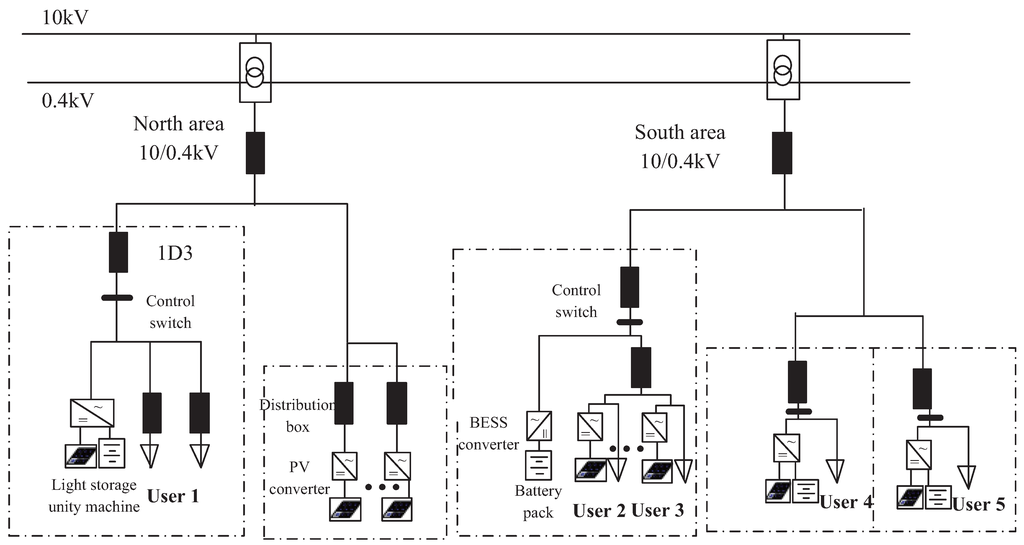
Figure 5.
Basic electrical topology of PV-MG.
Table 2.
The profiles of users in the microgrid (MG).
Table 3.
Parameters of the components in the MG.
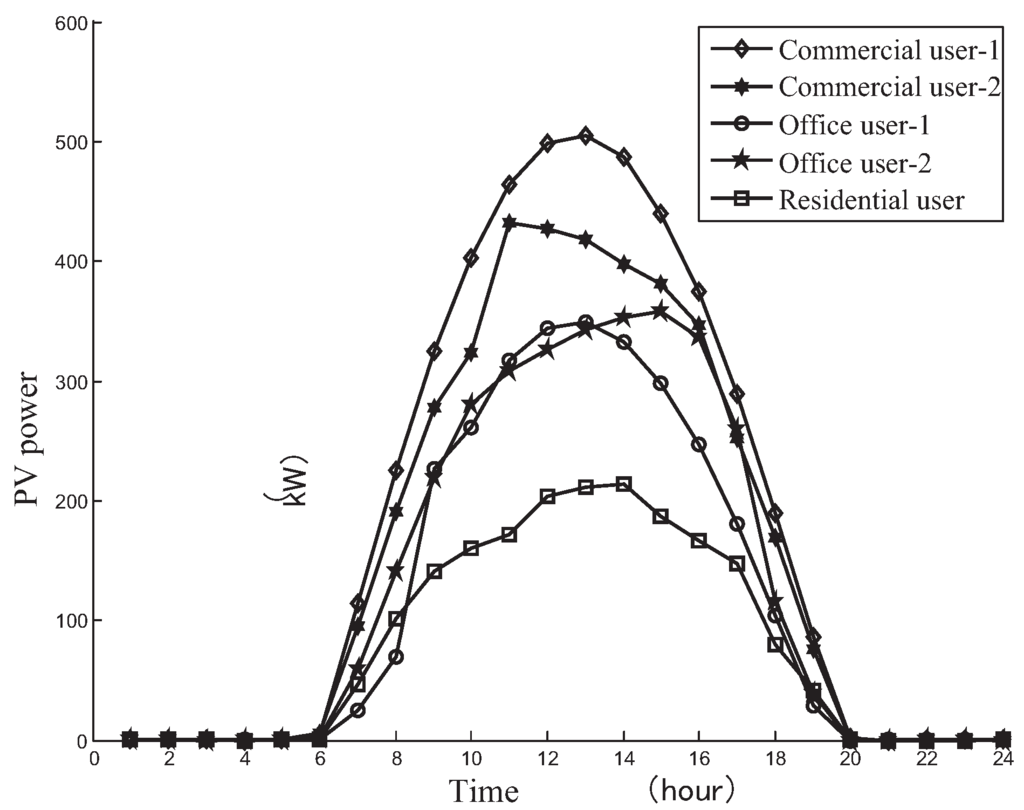
Figure 6.
Distributed users’ photovoltaic power (PV) power curves in a typical day.
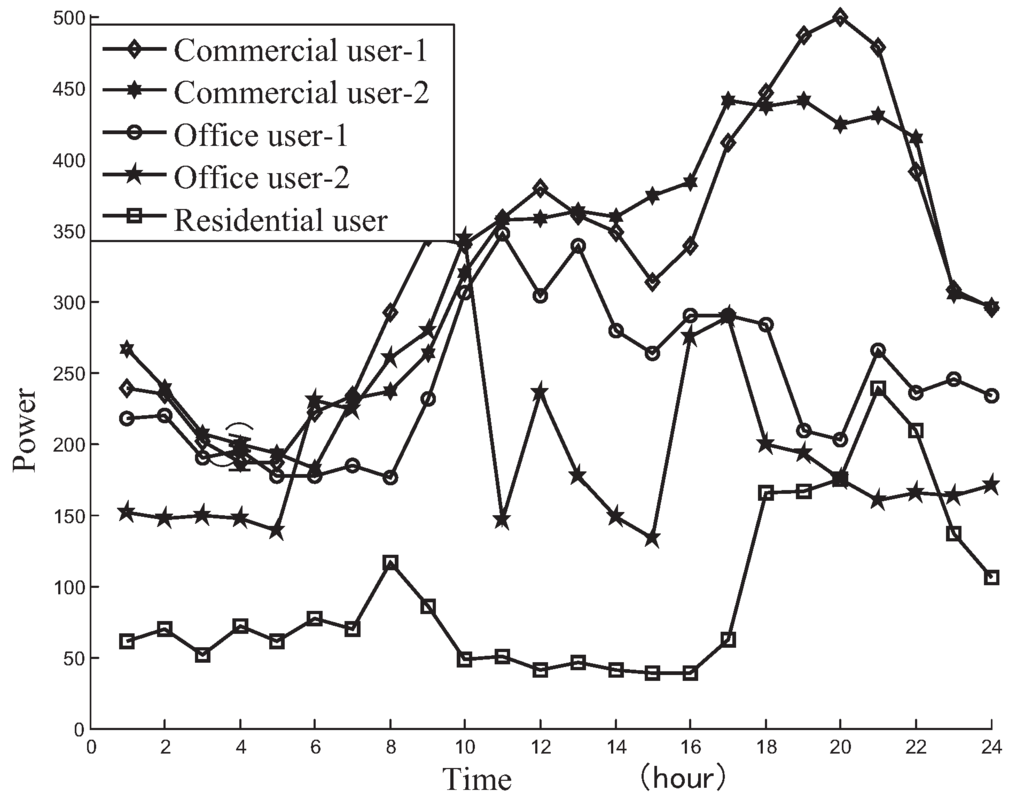
Figure 7.
Distributed users’ original power curves.
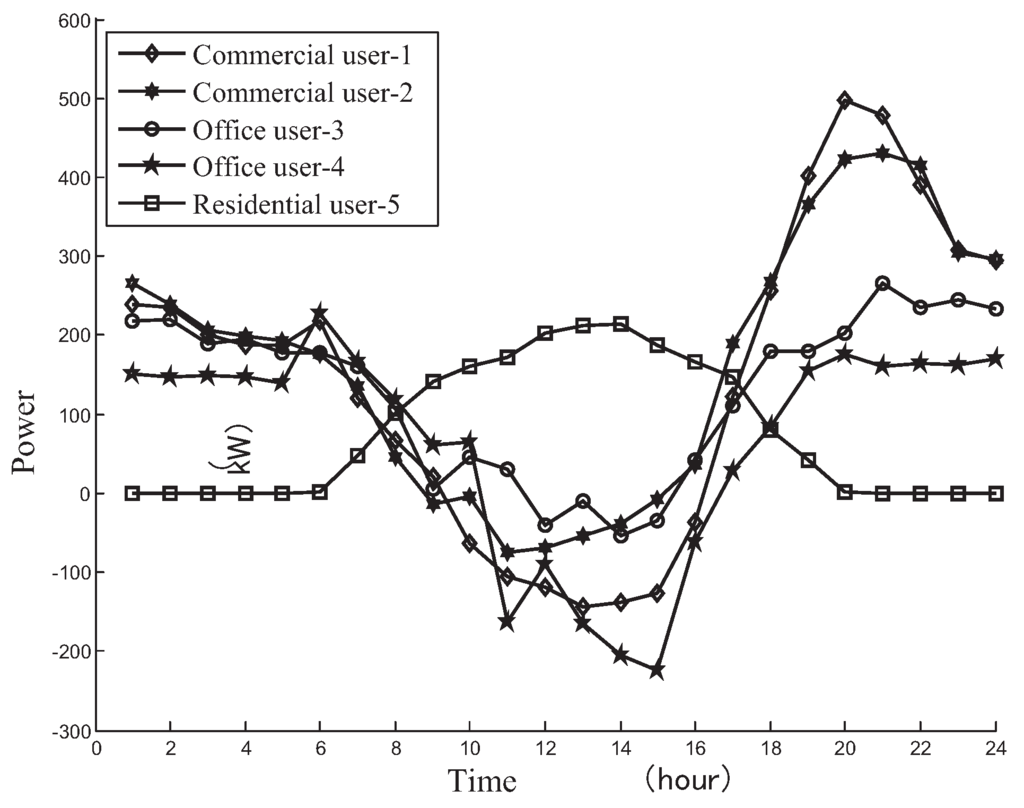
Figure 8.
Users’ power curves of net load.
Total loads, PV output and net power curves are shown in Figure 9. As can be seen, this PV-MG is a typical commercial/office MG, the loads of which presents the characteristics of peak in day and valley at night. The peak value of both total loads and net loads is 1573 kW at 21:00. Load rate of total loads is 0.75, while that of net loads is 0.33, indicating that the PV system makes load rate less desirable. The reason is that the maximum PV output usually occurs at noon, rather than the time of peak loads. Thus, the maximum loads change slightly with PV, while the average loads are reduced due to the cancellation of PV, and the load rate becomes smaller.
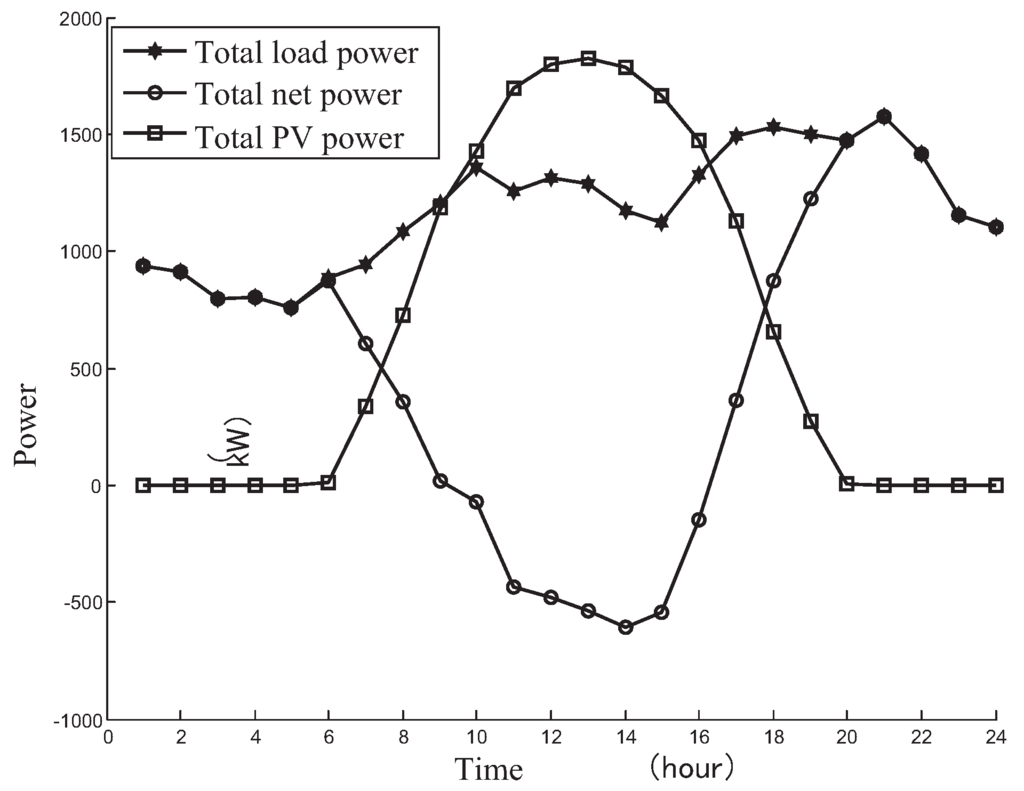
Figure 9.
Users’ total power curves and PV output.
7.2. DR Results Analysis
In this paper, the distributed PV feed-in purchase price is 0.057 $/kWh, and PV subsidy price is 0.063 $/kWh. The prices of electricity bought from power grid and sold to users are measured under the same TOU price, as shown in Table 4. The single electricity price before the implementation of TOU price is 0.075 $/kWh.
Table 4.
time-of-use (TOU) power price.
In real market, the supply curve must be obtained through detailed market research and statistical analysis. Based on the demand elasticity coefficient in [43], the electricity price elasticity curve parameters are shown in Table 5.
Table 5.
Parameters of electricity price relation curve.
Then, the electricity price elasticity matrix is:
As shown in Figure 10, peak-valley difference of loads after DR has been reduced, and the load curve has become smoother. As shown in Table 6, the peak-valley difference reduces from 815.4 kW to 649.3 kW after DR, which achieves the effect of peak load shifting. PV consumptive rate reduces from 46.39% to 45.25% after DR. It can be explained that the maximum PV output occurs at noon. However, the loads at daily peak period have been reduced after DR, and the instant PV electricity consumption is decreased.
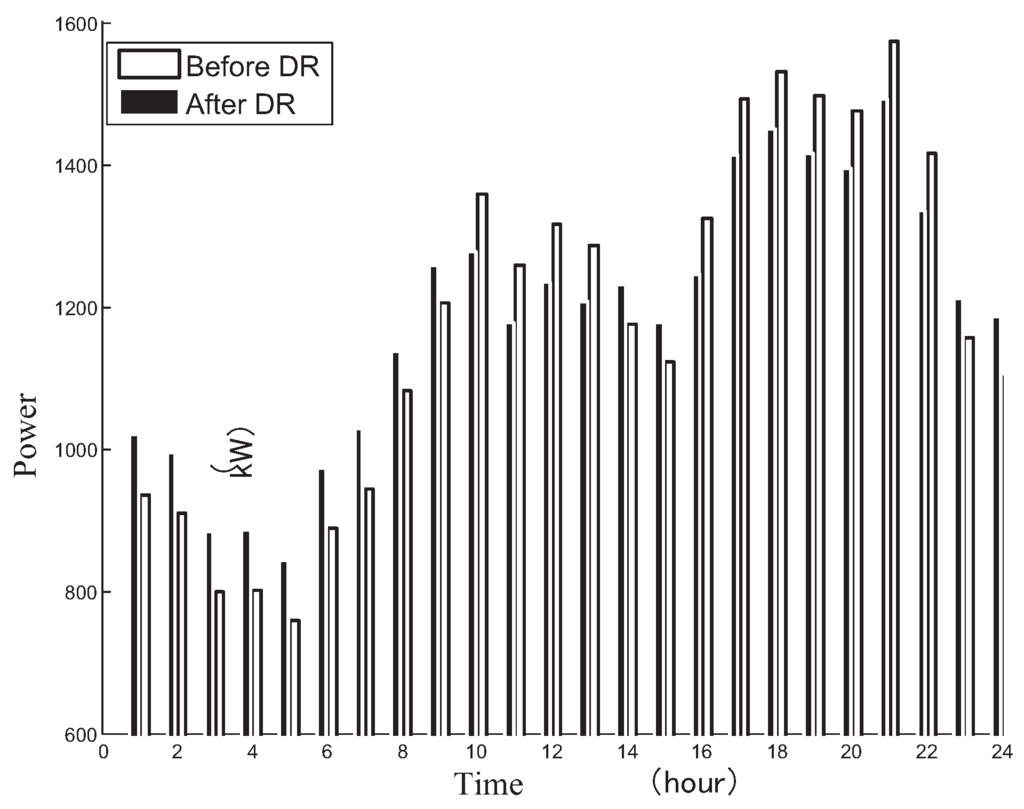
Figure 10.
Daily load curve of before and after DR.
Table 6.
Load characters of before and after demand response (DR).
7.3. BESS Optimal Sizing Result Analysis
7.3.1. Rigid BESS Capacity Optimal Sizing
- (1)
- Rigid battery storage capacity optimal sizingThis paper considers the extreme operation situation of PV-MG for the rigid battery storage capacity optimal sizing, which means that, the rigid battery storage should guarantee the important loads operating for 0.5 h without PV output and distribution network electricity support. The important loads in this study case account for 20% of total loads, so the peak values of important loads are 314.6 kW and 298.4 kW respectively before and after DR. Thus, the rigid battery storage capacity should be at least 157.3 kWh and 149.2 kWh respectively. The energy conversion efficiency of BESS is 0.92, and DOD of BESS should be more than 0.8. Thus the actual rigid battery storage capacity should be separately at least 213.7 kWh and 202.7 kWh before and after DR.
- (2)
- Storage converter optimal sizingIn order to meet the requirements of shock loads in PV-MG, which is 389 kW in this case, the short-term overload coefficient of bidirectional inverter is 1.2, and the rated power of selected storage bidirectional converter should be at least 324 kW.
7.3.2. Flexible BESS Capacity Optimal Sizing
NSGA-II algorithm is utilized to solve the optimization model. In this paper, population quantity is set as 50, the maximum iterations as 100 times, crossing-over rate as 0.9 and aberration rate as 0.1. In the DR based multi-objective BESS capacity optimal sizing model, the multi-objectives are annual net profits and PV consumptive rate of PV-MG, and the decision variable is flexible BESS capacity. Based on the load curves before and after DR, the Pareto frontier is shown in Figure 11.
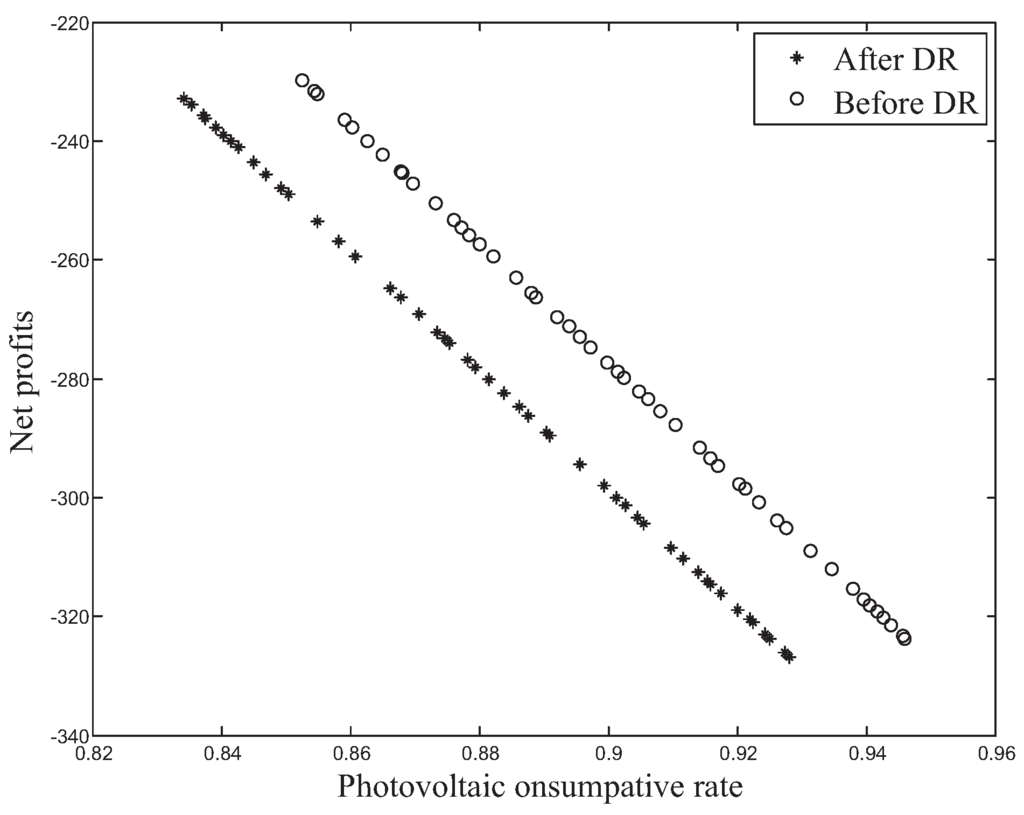
Figure 11.
The result of Pareto front by NSGA-II.
The Pareto frontier obtained from NSGA-II algorithm can provide significant messages for the two compromise selected opposite objectives of improving net benefit and PV consumptive rate. As the actual net profits of PV-MG is negative, reduction of system losses can be interpreted as improvement of net profits. The flexible BESS capacity optimal sizing results and their corresponding net profits under different PV consumptive rate goals before and after DR are shown in Table 7.
Table 7.
Energy capacity optimization of before and after DR.
As shown in Table 7:
- (1)
- After the implementation of peak-valley TOU price, peak-valley difference has reduced. Thus, the rigid BESS capacity, which is configured to guarantee the important loads operating for 0.5 h, can be reduced after DR.
- (2)
- BESS cost is still relatively expensive at present, and the rigid BESS utilized to ensure the reliability of the system is relatively large., Thus the net profits of PV-MG will be negative when only Figure d with rigid BESS, which will be further reduced with the increase of flexible BESS capacity.
- (3)
- Since the PV consumptive rate is decreased after DR, more capacity of flexible BESS should be configured to achieve the same PV consumptive rate goal.
7.3.3. Sensitivity Analysis of BESS Subsidies
On the whole, after the optimal sizing of the BESS, the PV-MG does not generate direct economic benefits. However, system power supply reliability benefits and environmental benefits brought through BESS optimal sizing are significant. Therefore,, BESS optimal sizing in PV-MG is necessary. Besides, the cost of lithium batteries and storage converter modules have been showing downward trend.
In addition, BESS possesses potential subsidies to make reasonable compensation for PV-MG investment costs, such as the subsidies for the investment capacity, the charge and discharge capacity, and certain fiscal and tax preferential policies. This paper assumes that the BESS (including the energy storage battery and the energy storage converter) is subsidized as the investment capacity, and the subsidy investment accounts for 20%–40% of its fixed investment cost. This paper analyzes the influence of the increase of BESS subsidy proportion on the net benefit of PV-MG before and after DR, the results of which are shown in Table 8.
Table 8.
The summary of sensitivity analysis.
As shown in Table 8, under the situation that electricity price, PV module cost, PV consumptive rate and other conditions are invariable, net profits of PV-MG will grow in linear relationship with BESS subsidy, and can be positive within a certain range. This indicates that of the economical efficiency of PV-MG after BESS optimal sizing has been improved.
8. Conclusions
Research on the impact of DR on BESS optimal sizing has a significant effect on commercial investment decisions of PV-MG. This paper established multi-period DR model based on price elasticity matrix under TOU price. Besides, the DR and BESS system operation are included into PV-MG scheduling optimization to build the MG investment profit model. Considering the constraint conditions such as power supply and demand balance, side electricity price elasticity, loss of BESS systems, the PV consumptive rate and annual net profits are taken as greatest objectives to utilize NSGA-II algorithm to solve the DR-based BESS capacity optimize optimal sizing model in PV-MG.
Simulation results show that, in the electricity market environment, the needed rigid BESS capacity and PV consumptive rate decrease after DR. Thus, more capacity of flexible BESS should be configure d to contribute the midday PV consumption and achieve the same PV consumptive rate goal. This paper applies an optimization method to a practical MG in Guangdong to verify the reasonability of the proposed model and algorithm, which can be a significant reference on commercial investment decisions of PV-MG.
In order to solve the influence of uncertain PV on the stable operation of PV-MG, DR and BESS are introduced simultaneously into the operation optimal scheduling of PV-MG, and the uncertainties PV can be suppressed so as to improve the PV consumptive level, which is of great guiding significance for BESS optimal sizing under this situation. The net profits of PV-MG is poor with relatively expensive BESS module cost at present stage. With the decrease of BESS cost or further drive of the energy storage subsidy policy, business investment potential of PV-MG with BESS will be further enhanced.
Acknowledgments
This work was supported by the National High Technology Research and Development of China 863 Program (2014AA052001).
Author Contributions
Nan Zhou and Nian Liu proposed the multi-objective optimal sizing model for battery storage of PV-based microgrid with demand response. Jianhua Zhang and Jinyong Lei provided theoretical knowledge in the energy domain, also reviewed and refined the paper.
Conflicts of Interest
The authors declare no conflict of interest.
Nomenclature
| P | Electricity price |
| Single electricity price before the implement of TOU price | |
| Variable quantity of electricity price at time period j | |
| Q | Electricity consumption |
| Variable quantity of electricity consumption at time period i | |
| Power price curve parameters | |
| Self-elasticity coefficient | |
| Cross-elasticity coefficient | |
| Flat, peak, valley price periods | |
| Load transfer rates from peak to flat period, peak to valley period and flat to valley period separately | |
| Loads in peak price period before DR | |
| Loads in flat price period before DR | |
| Loads in valley price period before DR | |
| Loads in peak price period after DR | |
| Loads in flat price period after DR | |
| Loads in valley price period after DR | |
| Average loads of peak price period before DR | |
| Average loads of flat price period before DR | |
| Average loads of valley price period before DR | |
| Durations of peak price period | |
| Durations of flat a price period | |
| Durations of valley price period | |
| Total BESS capacity | |
| Rigid BESS capacity | |
| Flexible BESS capacity | |
| Rated PV capacity | |
| Minimum value of BESS rigid capacity. | |
| Load at time t | |
| PV generation power at time t | |
| Electricity power supplied by distribution network at time t | |
| Charging power of BESS at time t | |
| Discharge power of BESS at time t | |
| Power correction value of BESS | |
| Discharge power of BESS after correction | |
| Electricity exported to distribution network. | |
| Electricity imported from distribution network | |
| Total power of BESS bidirectional inverter | |
| Battery capacity at time t | |
| Rated battery capacity | |
| Total photovoltaic electricity power consumed by local loads in one day | |
| Total photovoltaic electricity power consumed by flexible BESS | |
| PV inverter efficiency | |
| Charging power efficiency of BESS | |
| Discharge power efficiency of BESS | |
| Annual investment of PV-MG | |
| Daily income of PV-MG | |
| Annual investment of PV system | |
| Annual investment of battery storage | |
| Annual investment of BESS bidirectional converter module | |
| Annual net profits of PV-MG. | |
| Unit price of PV system | |
| Unit price of battery storage | |
| Unit price of BESS inverter module | |
| Operation and maintenance cost of PV system, BESS module, and BESS inverter module separately | |
| User price | |
| PV feed-in-tariff | |
| Electricity price of MG purchased from power grid | |
| PV subsidy price | |
| Photovoltaic consumptive rate | |
| Time duration from t to | |
| T | Length of one typical day |
| Discount rate | |
| R | Number of similar days in one year |
| Replacing times of BESS |
References
- Sujil, A.; Agarwal, S.K.; Kumar, R. Centralized multi-Agent implementation for securing critical loads in PV based microgrid. J. Mod. Power Syst. Clean Energy 2014, 2, 77–86. [Google Scholar] [CrossRef]
- Gabbar, H.A.; Abdelsalam, A. Microgrid energy management in grid-connected and islanding modes based on SVC. Energy Convers. Manag. 2014, 86, 964–972. [Google Scholar] [CrossRef]
- Masih-Tehrani, M.; Ha’iri-Yazdi, M.R.; Esfahanian, V. Optimum sizing and optimum energy management of a hybrid energy storage system for lithium energy life improvement. J. Power Sources 2013, 244, 2–10. [Google Scholar] [CrossRef]
- Liu, W.; Niu, S.; Xu, H. Optimal planning of battery energy storage considering reliability benefit and operation strategy in active distribution system. J. Mod. Power Syst. Clean Energy 2016, 1–10. [Google Scholar] [CrossRef]
- Aghamohammadi, M.R.; Abdolahinia, H. A new approach for optimal sizing of battery energy storage system for primary frequency control of islanded Microgrid. Int. J. Electr. Power Energy Syst. 2014, 54, 325–333. [Google Scholar] [CrossRef]
- An, L.N.; Quoc-Tuan, T.; Seddik, B.; Van-Linh, N. Optimal sizing of a grid-connected microgrid. In Proceedings of the IEEE International Conference on Industrial Technology, Seville, Spain, 17–19 March 2015.
- Ma, X.; Chen, M.; Zhou, X. Study on the probabilistic optimal capacity of energy storage in microgrid. Electric Power 2015, 48, 131–136. [Google Scholar]
- Li, B.; Chen, S.; Liang, S. A capacity optimization of energy storage system for output smoothing of photovoltaic station. Power Syst. Protect. Control 2014, 22, 45–50. [Google Scholar]
- Nguyen, T.; Crow, M.L.; Elmore, A.C. Optimal sizing of a vanadium redox battery system for microgrid systems. IEEE Trans. Sustain. Energy 2015, 99, 1–9. [Google Scholar] [CrossRef]
- Liu, N.; Chen, Z.; Liu, J.; Tang, X.; Xiao, X.; Zhang, J. Multi-objective optimization for component capacity of the PV-based energy switch stations: Towards benefit of economy and environment. Energy 2014, 64, 779–792. [Google Scholar] [CrossRef]
- Ma, L.; Liu, N.; Wang, L.; Zhang, J.; Lei, J. Multi-party energy management for smart building cluster with PV systems using automatic demand response. Energy Build. 2016, 121, 11–21. [Google Scholar] [CrossRef]
- Mazidi, M.; Zakariaziadeh, A.; Jadidi, S.; Siano, P. Integrated scheduling of renewable generation and demand response programs in a microgrid. Energy Convers. Manag. 2014, 86, 1118–1127. [Google Scholar] [CrossRef]
- Rivarolo, M.; Greco, A.; Massardo, A.F. Thermo-economic optimization of the impact of renewable generators on poly-generation smart-grids including hot thermal storage. Energy Convers. Manag. 2013, 65, 75–83. [Google Scholar] [CrossRef]
- Costabeber, A.; Tenti, P.; Mattavelli, P. Distributed cooperative control of low-voltage residential microgrids. In Proceedings of the 2012 3rd IEEE International Symposium on Power Electronics for Distributed Generation Systems (PEDG), Aalborg, Denmark, 25–28 June 2012; pp. 457–463.
- Gouveia, C.; Moreira, J.; Moreira, C.L.; Lopes, J. Coordinating storage and demand response for microgrid emergency operation. IEEE Trans. Smart Grid 2013, 4, 1898–1908. [Google Scholar] [CrossRef]
- Bui, V.H.; Kim, H.M.; Song, N.O. Applying demand response based on TOU and EDRP to optimal microgrid operation. Int. J. Smart Home 2015, 9, 41–50. [Google Scholar] [CrossRef]
- Nisar, A.; Thomas, M.S. Comprehensive control for microgrid autonomous operation with demand response. IEEE Trans. Smart Grid 2016, 1–9. [Google Scholar] [CrossRef]
- Koohi-Kamali, S.; Rahim, N.A.; Mokhlis, H. New algorithms to size and protect battery energy storage plant in smart microgrid considering intermittency in load and generation. In Proceedings of the IET International Conference on Clean Energy and Technology, Kuching, Malaysia, 24–26 November 2014; pp. 1–7.
- Kerdphol, T.; Qudaih, Y.; Mitani, Y. Optimal battery energy storage size using particle swarm optimization for microgrid system. Int. Rev. Electr. Eng. 2015, 10, 2. [Google Scholar] [CrossRef]
- Zhao, B.; Bao, K.; Xu, Z.; Zhang, Y. Optimal sizing for grid-connected PV-and-storage microgrid considering demand response. Proc. CSEE 2015, 35, 5465–5474. [Google Scholar]
- Sharma, S.; Bhattacharjee, S.; Bhattacharya, A.A. Grey wolf optimisation for optimal sizing of battery energy storage device to minimise operation cost of microgrid. IET Gener. Trans. Distrib. 2016, 10, 625–637. [Google Scholar] [CrossRef]
- Kerdphol, T.; Tripathi, R.N.; Hanamoto, T.; Khairudin. ANN based optimized battery energy storage system size and loss analysis for distributed energy storage location in PV-microgrid. In Proceedings of the 2015 IEEE Innovative Smart Grid Technologies—Asia (ISGT ASIA), Bangkok, Thailand, 3–6 November 2015.
- Sahebi, M.M.; Duki, E.A.; Kia, M.; Soroudi, A. Simultanous emergency demand response programming and unit commitment programming in comparison with interruptible load contracts. IET Gener. Trans. Distrib. 2012, 6, 605–611. [Google Scholar] [CrossRef]
- Ruan, W.; Wang, B.; Li, Y. Customer response behavior in time-of-use price. Power Syst. Technol. 2012, 36, 86–93. [Google Scholar]
- Daniel, S.K.; Goran, S. Factoring the elasticity of demand in electricity prices. IEEE Trans. Power Syst. 2000, 15, 612–617. [Google Scholar]
- Liu, Y.; Liu, J.; Tang, J. An optimal decision-making model for power supply company power purchase in weekly market considering price elasticity matrix of demand side and risk. Power Syst. Technol. 2008, 18, 18–24. [Google Scholar]
- Bushnell, J.B.; Mansur, E. The Impact of Retail Rate Deregulation on Electricity Consumption in San Diego; University of California Energy Institute: Berkeley, CA, USA, 2001. [Google Scholar]
- Liu, N.; Zou, F.; Wang, L.; Wang, C.; Chen, Z. Online energy management of PV-assisted charging station under time-of-use pricing. Electr. Power Syst. Res. 2016, 137, 76–85. [Google Scholar] [CrossRef]
- Ding, Y.; Decker, C.; Vassileva, I.; Wallin, F. A smart energy system: distributed resource management, control and optimization. In Proceedings of the IEEE PES International Conference and Exhibition on Innovative Smart Grid Technologies, Manchester, UK, 5–7 December 2011; pp. 1–8.
- Liu, N.; Tang, Q.; Zhang, J.; Fan, W.; Liu, J. A hybrid forecasting model with parameter optimization for short-term load forecasting of micro-grids. Appl. Energy 2014, 129, 336–345. [Google Scholar] [CrossRef]
- Lu, C.; Raghunathan, V.; Roy, K. Maximum power point considerations in micro-scale solar energy harvesting systems. In Proceedings of the 2010 IEEE International Symposium on Circuits and Systems (ISCAS), Paris, France, 30 May–2 June 2010; pp. 273–276.
- Kim, K.; Yoon, T.; Byeon, G.; Jung, H.; Kim, H. Power demand and power quality analysis of EV charging station using BESS in microgrid. In Proceedings of the Vehicle Power and Propulsion Conference, Seoul, Korea, 9–12 October 2012; pp. 996–1001.
- Gudi, N.; Wang, L.; Devabhaktuni, V. A demand side management based simulation platform incorporating heuristic optimization for management of household appliances. Int. J. Electr. Power Energy Syst. 2012, 43, 185–193. [Google Scholar] [CrossRef]
- Cobeo, I.; Boyra, M.; Castellanos, A. Commercial building load modeling for demand response applications. In Proceedings of the 20th International Conference and Exhibition on Electricity Distribution, Prague, Czech, 8–11 June 2009; IET: London, UK; pp. 1–4.
- Ferruzzi, G.; Graditi, G.; Rossi, F.; Russo, A. Optimal operation of a residential microgrid: The role of demand side management. Intell. Ind. Syst. 2015, 1, 61–82. [Google Scholar] [CrossRef]
- Walawalkar, R.; Blumsack, S.; Apt, J.; Fernands, S. An economic welfare analysis of demand response in the PJM electricity market. Energy Policy 2008, 36, 3692–3702. [Google Scholar] [CrossRef]
- Sauer, D.U.; Wenzl, H. Comparison of different approaches for lifetime prediction of electrochemical systems-using lead-acid batteries as example. J. Power Sources 2008, 176, 534–546. [Google Scholar] [CrossRef]
- Huang, H.; Deng, L.; Wen, F.; Wang, F. Customer response behavior based on real-time pricing. Electric Power Constr. 2016, 37, 63–68. [Google Scholar]
- Dusonchet, L.; Ippolito, M.G.; Telaretti, E.; Graditi, G. Economic impact of medium-scale battery storage systems in presence of flexible electricity tariffs for end-user application. In Proceedings of the 9th International Conference on European Energy Market, Florence, Italy, 10–12 May 2012; pp. 1–5.
- Vergara, P.; Torquato, R.; Silva, L. Towards a real-time Energy Management System for a Microgrid using a multi-objective genetic algorithm. In Proceedings of the IEEE Power and Energy Society General Meeting, Denver, CO, USA, 26–30 July 2015.
- Kuznetsova, E.; Ruiz, C.; Li, Y.; Zio, E. Analysis of robust optimization for decentralized microgrid energy management under uncertainty. Int. J. Electr. Power Energy Syst. 2015, 64, 815–832. [Google Scholar] [CrossRef]
- Farina, M.; Amato, P. A fuzzy definition of optimality for many-criteria optimization problems. IEEE Trans. Syst. Man Cybern. 2004, 34, 315–326. [Google Scholar] [CrossRef]
- Qin, Z.; Yue, S.; Yu, Y. Price elasticity matrix of demand in current retail power market. Automat. Electric Power Syst. 2004, 28, 16–19. [Google Scholar]
© 2016 by the authors; licensee MDPI, Basel, Switzerland. This article is an open access article distributed under the terms and conditions of the Creative Commons Attribution (CC-BY) license (http://creativecommons.org/licenses/by/4.0/).